Gonzales Maryland Poll - RealClearPolitics · Gonzales Maryland Poll, Part 2 – EMBARGO: 12:01...
33
GONZALES MARYLAND POLL January 2018 Part 2 – General Election
Transcript of Gonzales Maryland Poll - RealClearPolitics · Gonzales Maryland Poll, Part 2 – EMBARGO: 12:01...

GONZALES MARYLAND POLL
January 2018 Part 2 – General Election

Gonzales Maryland Poll, Part 2 – EMBARGO: 12:01 a.m. Thursday, January 11th
Page 1
Gonzales Maryland Poll P A R T 2 – G E N E R A L E L E C T I O N
BACKGROUND AND METHODOLOGY
Patrick E. Gonzales graduated magna cum laude from the University of Baltimore
with a degree in political science.
His career began in the mid 1980s as an analyst with Mason-Dixon Opinion Research.
Mr. Gonzales helped develop, craft and implement election surveys and exit polls for
Baltimore’s WMAR-TV Channel 2.
Patrick Gonzales has polled and analyzed well over a thousand elections in Maryland
and across the country since that time. His polling in the 2014 Maryland
gubernatorial election foreshadowed Larry Hogan’s victory on Election Day.
During an interview at WBAL 1090 AM radio in Baltimore, Maryland on October 27,
2016, Mr. Gonzales was one of the very few pollsters in the nation to state publicly
that Donald Trump would win the 2016 presidential election.
This poll was conducted by Gonzales Research & Media Services from December
27th, 2017 through January 5th, 2018. A total of 823 registered voters in Maryland,
who indicated that they are likely to vote in the November 2018 general election,
were queried by live telephone interviews, utilizing both landlines and cell phones. A
cross-section of interviews was conducted throughout the state, reflecting general
election voting patterns.
The margin of error (MOE), per accepted statistical standards, is a range of plus or
minus 3.5 percentage points. If the entire population was surveyed, there is a 95%
probability that the true numbers would fall within this range.
Gonzales Maryland Poll, Part 2 – EMBARGO: 12:01 a.m. Thursday, January 11th
Page 2
Executive Summary
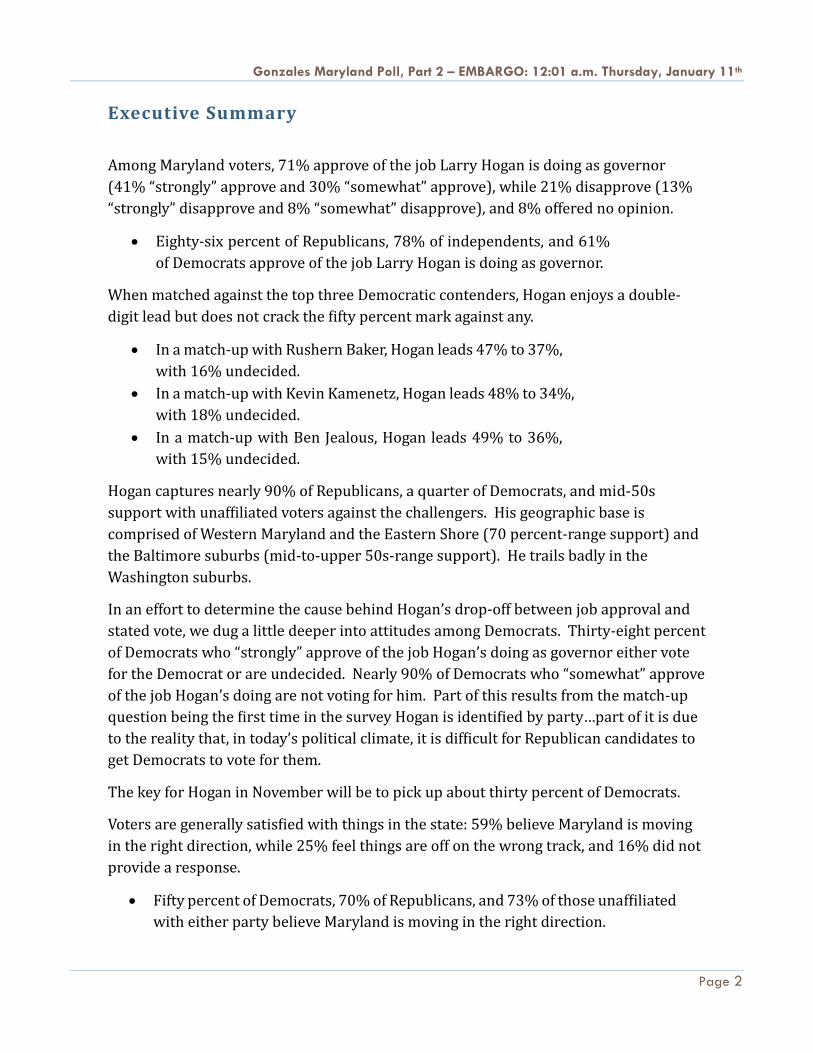
Among Maryland voters, 71% approve of the job Larry Hogan is doing as governor
(41% “strongly” approve and 30% “somewhat” approve), while 21% disapprove (13%
“strongly” disapprove and 8% “somewhat” disapprove), and 8% offered no opinion.
• Eighty-six percent of Republicans, 78% of independents, and 61%
of Democrats approve of the job Larry Hogan is doing as governor.
When matched against the top three Democratic contenders, Hogan enjoys a double-
digit lead but does not crack the fifty percent mark against any.
• In a match-up with Rushern Baker, Hogan leads 47% to 37%,
with 16% undecided.
• In a match-up with Kevin Kamenetz, Hogan leads 48% to 34%,
with 18% undecided.
• In a match-up with Ben Jealous, Hogan leads 49% to 36%,
with 15% undecided.
Hogan captures nearly 90% of Republicans, a quarter of Democrats, and mid-50s
support with unaffiliated voters against the challengers. His geographic base is
comprised of Western Maryland and the Eastern Shore (70 percent-range support) and
the Baltimore suburbs (mid-to-upper 50s-range support). He trails badly in the
Washington suburbs.
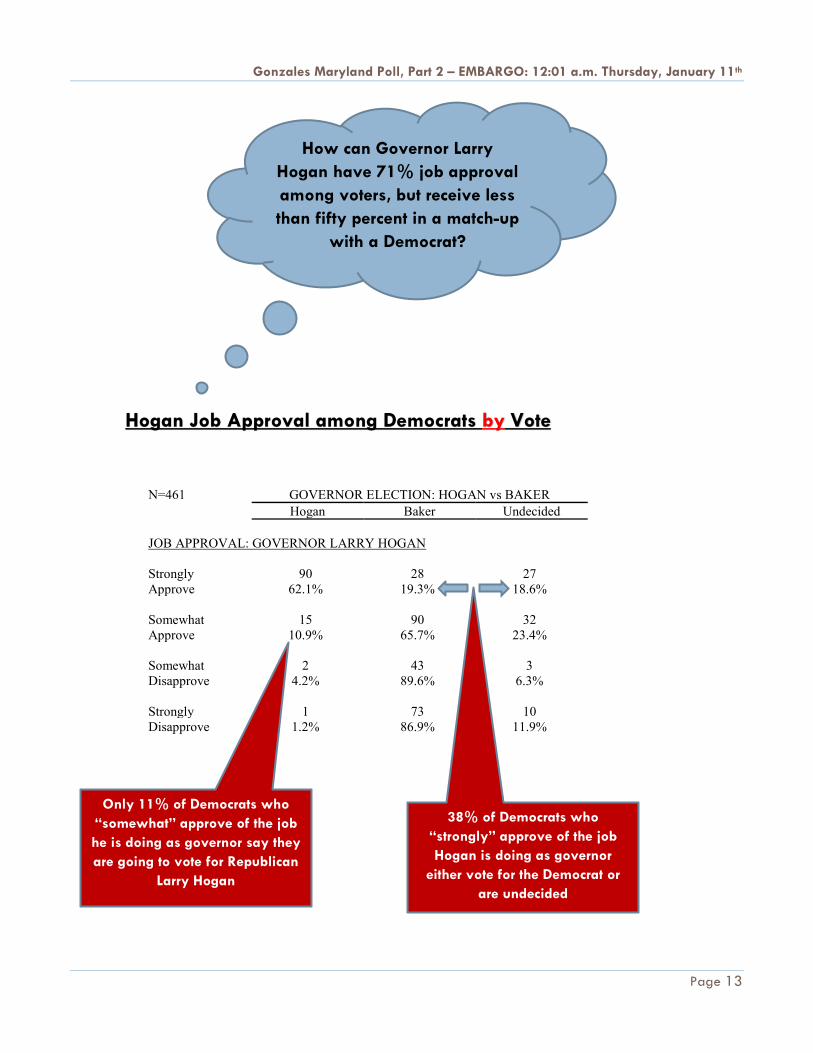
In an effort to determine the cause behind Hogan’s drop-off between job approval and
stated vote, we dug a little deeper into attitudes among Democrats. Thirty-eight percent
of Democrats who “strongly” approve of the job Hogan’s doing as governor either vote
for the Democrat or are undecided. Nearly 90% of Democrats who “somewhat” approve
of the job Hogan’s doing are not voting for him. Part of this results from the match-up
question being the first time in the survey Hogan is identified by party…part of it is due
to the reality that, in today’s political climate, it is difficult for Republican candidates to
get Democrats to vote for them.
The key for Hogan in November will be to pick up about thirty percent of Democrats.
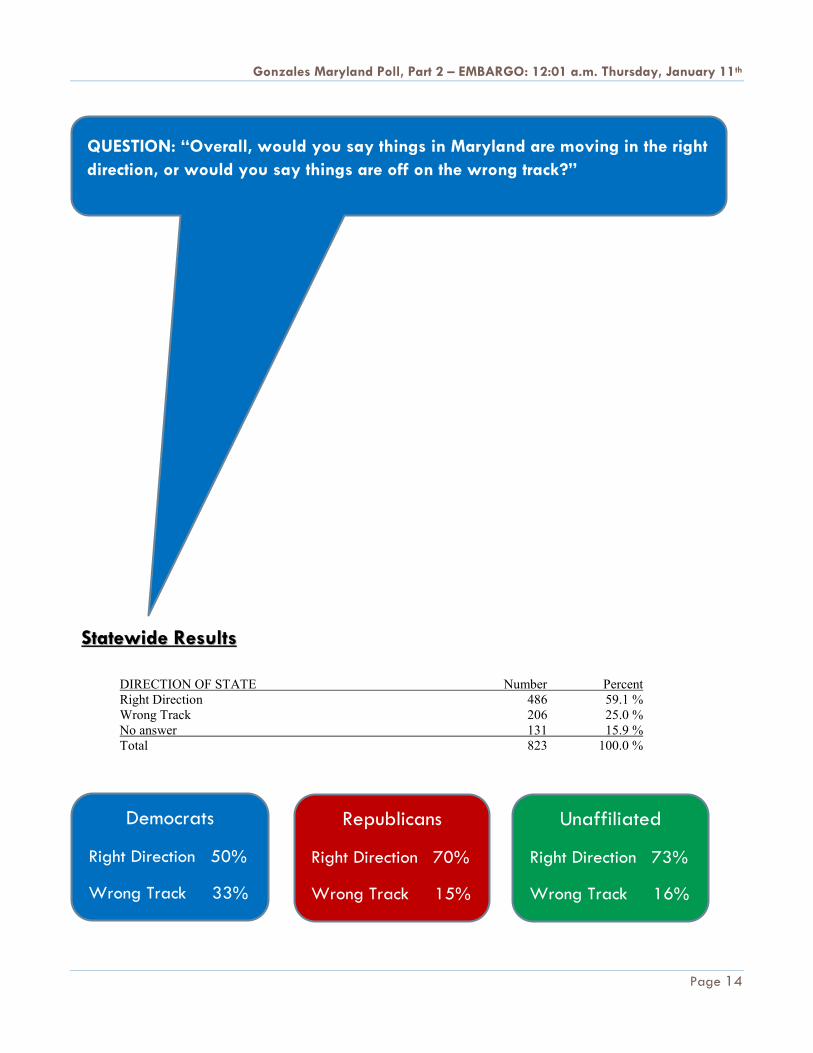
Voters are generally satisfied with things in the state: 59% believe Maryland is moving
in the right direction, while 25% feel things are off on the wrong track, and 16% did not
provide a response.
• Fifty percent of Democrats, 70% of Republicans, and 73% of those unaffiliated
with either party believe Maryland is moving in the right direction.

Gonzales Maryland Poll, Part 2 – EMBARGO: 12:01 a.m. Thursday, January 11th
Page 3
President Donald Trump looms large over Maryland’s political landscape. Among Free
State voters, 36% approve of the job Trump is doing as president (27% “strongly”
approve and 9% “somewhat” approve), while a full 60% of voters disapprove of the job
Trump is doing (50% “strongly” disapprove and 10% “somewhat” disapprove), with 4%
giving no answer.
Within the Republican bloc, 73% approve and 25% disapprove…among Democrats,
19% approve and 78% disapprove, while among unaffiliated voters, 30% approve and
62% disapprove.
• Sixty-eight percent of millennials disapprove of the job Donald Trump
is doing as president (58% “strongly” disapprove and 10%
“somewhat” disapprove).
The recently enacted Tax Cut Bill is also not being well received by Maryland voters at
this point. Statewide, 33% favor the Tax Cut Bill (24% “strongly” favor and 9%
“somewhat” favor), while 55% oppose it (44% “strongly” oppose and 11% “somewhat”
oppose), with 12% giving no answer.
Seventy-two percent of GOP voters favor the Tax Bill, while 57% of independents and
75% of Democrats oppose it.
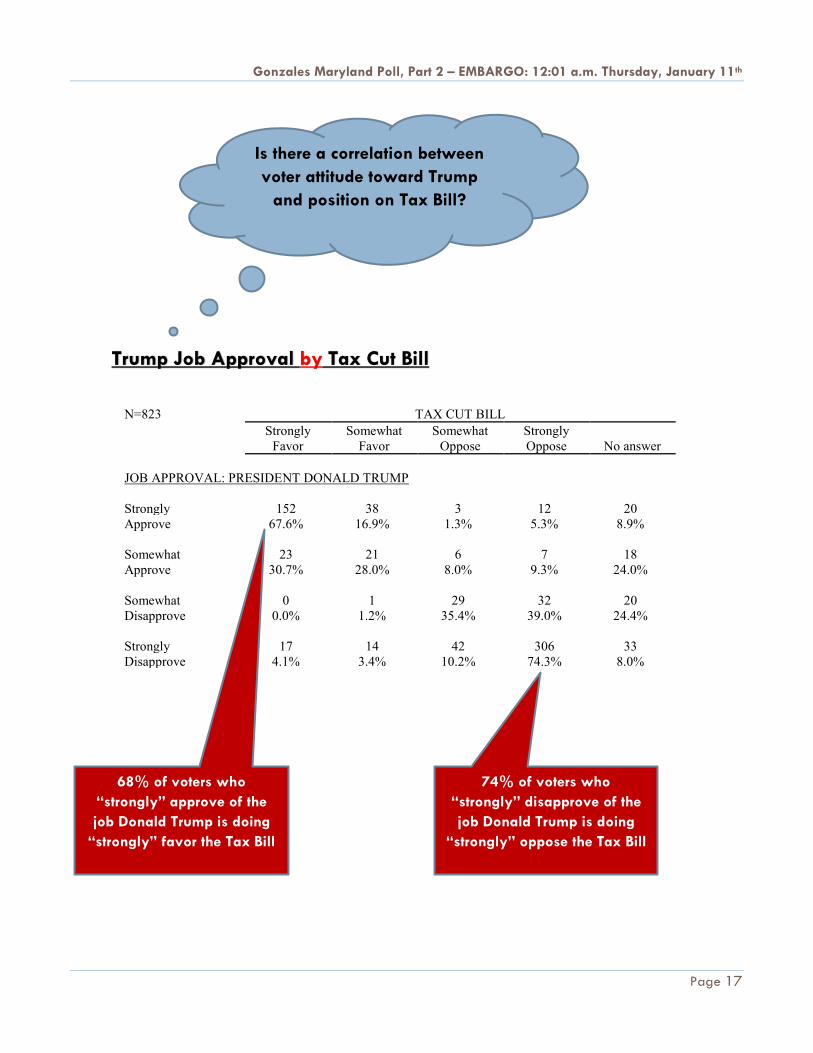
There is a bright-line connection between voters’ mindset toward Trump and their
opinion of the Tax Bill. Sixty-eight percent of those who “strongly” approve of the job
he’s doing “strongly” favor the Tax Cut Bill, while 74% of those who “strongly”
disapprove of the job Trump is doing “strongly” oppose the Tax Bill.
Gonzales Maryland Poll, Part 2 – EMBARGO: 12:01 a.m. Thursday, January 11th
Page 4
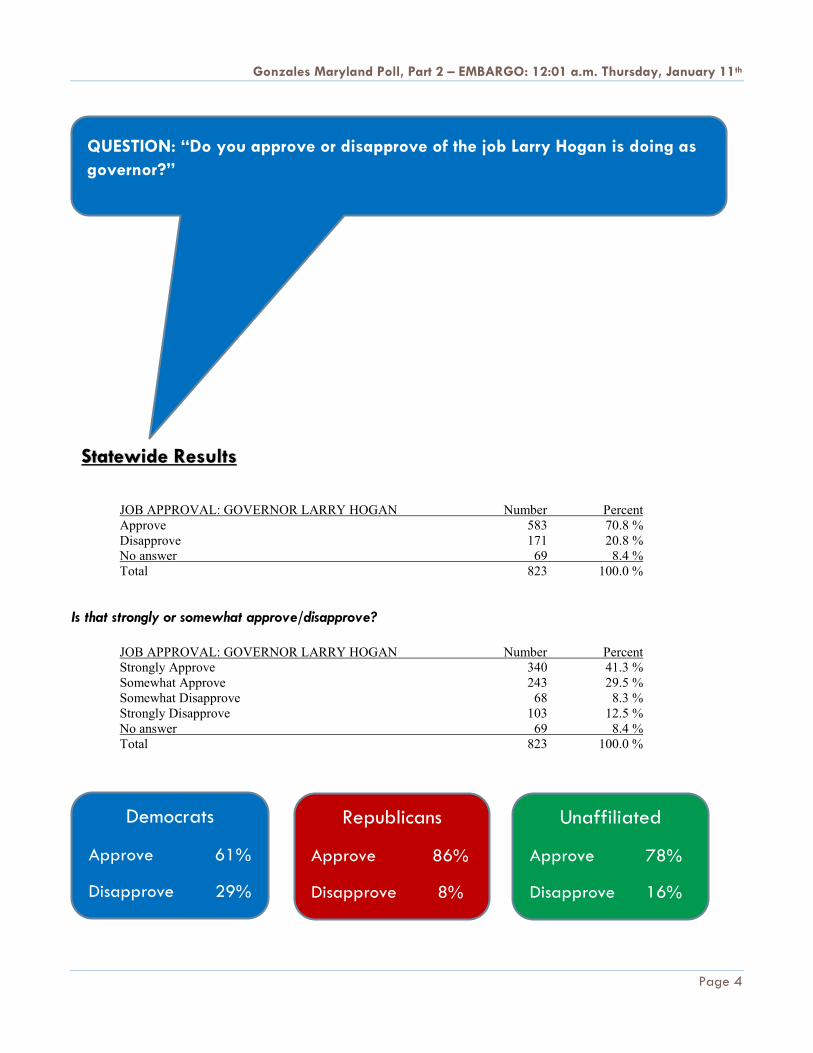
JOB APPROVAL: GOVERNOR LARRY HOGAN Number Percent
Approve 583 70.8 %
Disapprove 171 20.8 %
No answer 69 8.4 %
Total 823 100.0 %
Is that strongly or somewhat approve/disapprove?
JOB APPROVAL: GOVERNOR LARRY HOGAN Number Percent
Strongly Approve 340 41.3 %
Somewhat Approve 243 29.5 %
Somewhat Disapprove 68 8.3 %
Strongly Disapprove 103 12.5 %
No answer 69 8.4 %
Total 823 100.0 %
QUESTION: “Do you approve or disapprove of the job Larry Hogan is doing as
governor?”
Statewide Results
Democrats
Approve 61%
Disapprove 29%
Republicans
Approve 86%
Disapprove 8%
6
Unaffiliated
Approve 78%
Disapprove 16%
Gonzales Maryland Poll, Part 2 – EMBARGO: 12:01 a.m. Thursday, January 11th
Page 5
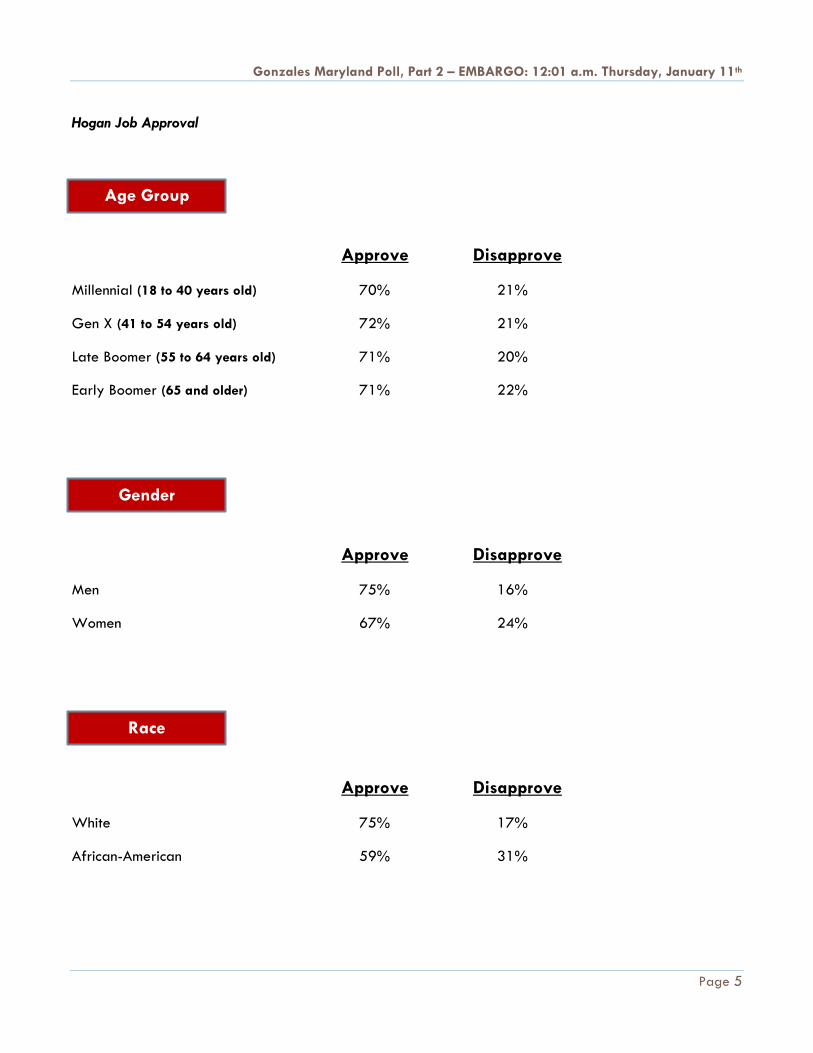
Hogan Job Approval
Approve Disapprove
Millennial (18 to 40 years old) 70% 21%
Gen X (41 to 54 years old) 72% 21%
Late Boomer (55 to 64 years old) 71% 20%
Early Boomer (65 and older) 71% 22%
Approve Disapprove
Men 75% 16%
Women 67% 24%
Approve Disapprove
White 75% 17%
African-American 59% 31%
Age Group
Gender
Race
Gonzales Maryland Poll, Part 2 – EMBARGO: 12:01 a.m. Thursday, January 11th
Page 6
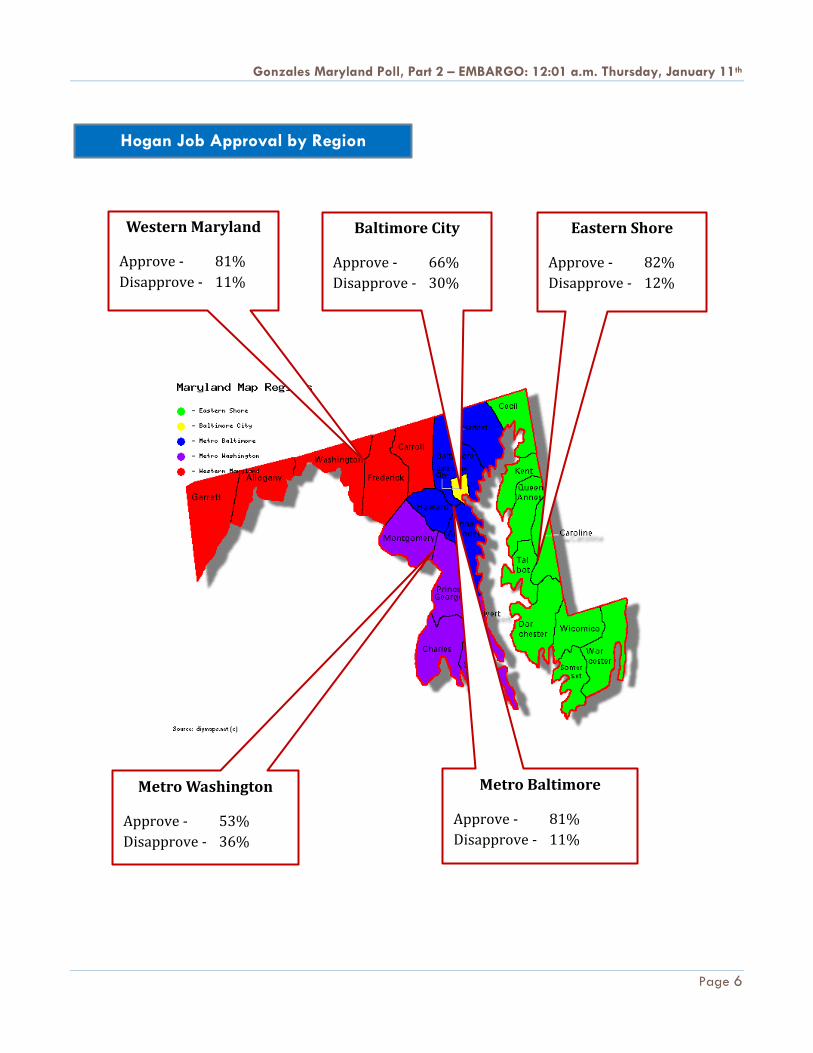
Hogan Job Approval by Region
Western Maryland
Approve - 81%
Disapprove - 11%
Eastern Shore
Approve - 82%
Disapprove - 12%
Metro Washington
Approve - 53%
Disapprove - 36%
Metro Baltimore
Approve - 81%
Disapprove - 11%
Baltimore City
Approve - 66%
Disapprove - 30%
Gonzales Maryland Poll, Part 2 – EMBARGO: 12:01 a.m. Thursday, January 11th
Page 7
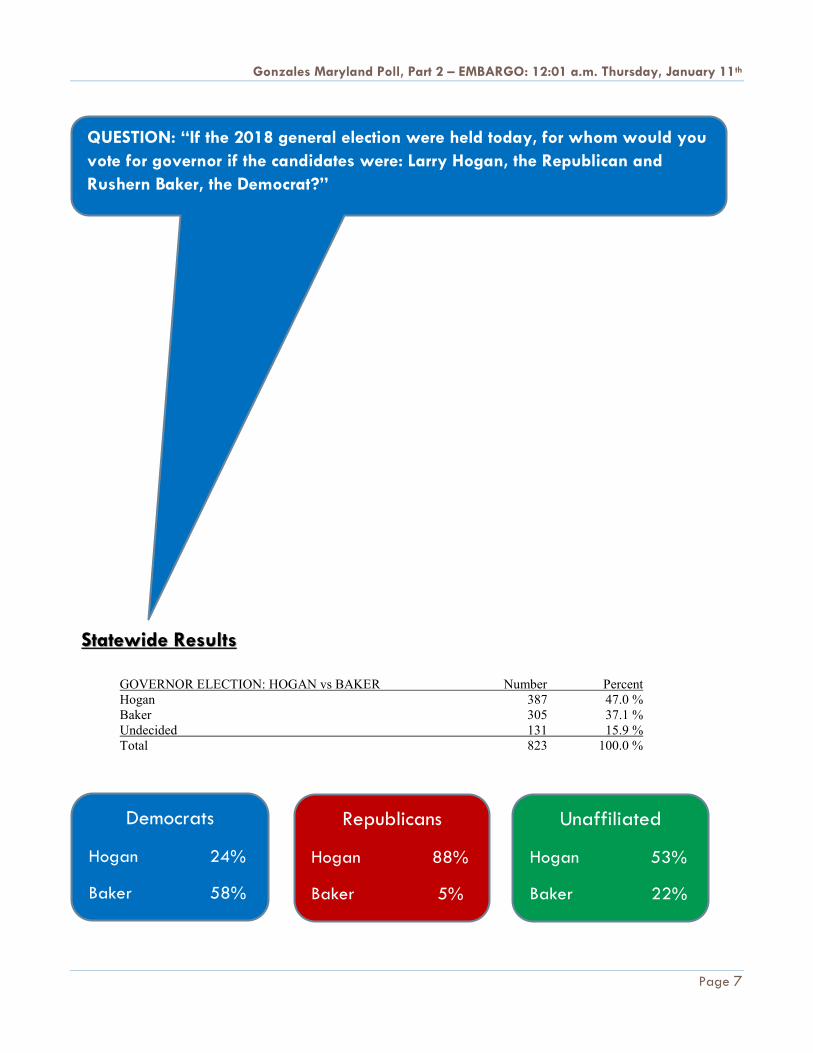
GOVERNOR ELECTION: HOGAN vs BAKER Number Percent
Hogan 387 47.0 %
Baker 305 37.1 %
Undecided 131 15.9 %
Total 823 100.0 %
QUESTION: “If the 2018 general election were held today, for whom would you
vote for governor if the candidates were: Larry Hogan, the Republican and
Rushern Baker, the Democrat?”
Statewide Results
Democrats
Hogan 24%
Baker 58%
Republicans
Hogan 88%
Baker 5%
6
Unaffiliated
Hogan 53%
Baker 22%

Gonzales Maryland Poll, Part 2 – EMBARGO: 12:01 a.m. Thursday, January 11th
Page 8
Hogan vs. Baker by Region
Western Maryland
Hogan - 71%
Baker - 12%
Eastern Shore
Hogan - 70%
Baker - 12%
Metro Washington
Hogan - 21%
Baker - 68%
Metro Baltimore
Hogan - 60%
Baker - 22%
Baltimore City
Hogan - 24%
Baker - 56%
Gonzales Maryland Poll, Part 2 – EMBARGO: 12:01 a.m. Thursday, January 11th
Page 9
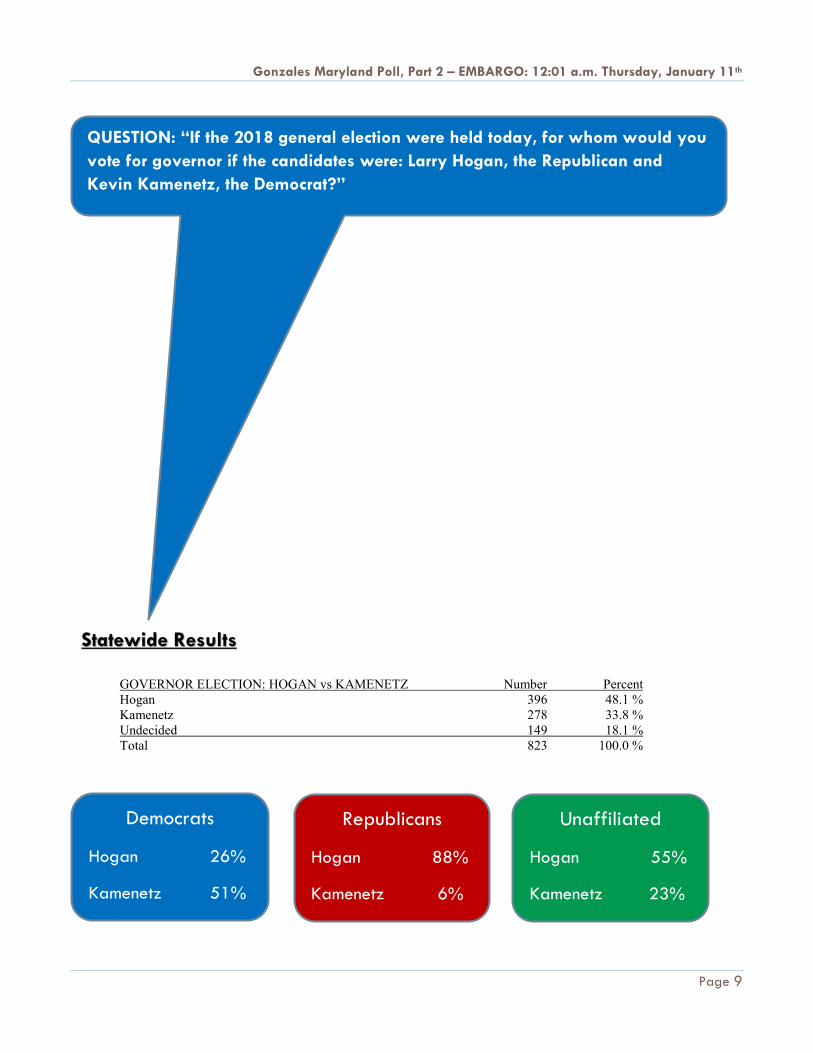
GOVERNOR ELECTION: HOGAN vs KAMENETZ Number Percent
Hogan 396 48.1 %
Kamenetz 278 33.8 %
Undecided 149 18.1 %
Total 823 100.0 %
QUESTION: “If the 2018 general election were held today, for whom would you
vote for governor if the candidates were: Larry Hogan, the Republican and
Kevin Kamenetz, the Democrat?”
Statewide Results
Democrats
Hogan 26%
Kamenetz 51%
Republicans
Hogan 88%
Kamenetz 6%
6
Unaffiliated
Hogan 55%
Kamenetz 23%

Gonzales Maryland Poll, Part 2 – EMBARGO: 12:01 a.m. Thursday, January 11th
Page 10
Hogan vs. Kamenetz by Region
Western Maryland
Hogan - 70%
Kamenetz - 13%
Eastern Shore
Hogan - 68%
Kamenetz - 13%
Metro Washington
Hogan - 30%
Kamenetz - 47%
Metro Baltimore
Hogan - 56%
Kamenetz - 30%
Baltimore City
Hogan - 23%
Kamenetz - 59%

Gonzales Maryland Poll, Part 2 – EMBARGO: 12:01 a.m. Thursday, January 11th
Page 11
GOVERNOR ELECTION: HOGAN vs JEALOUS Number Percent
Hogan 403 49.0 %
Jealous 295 35.8 %
Undecided 125 15.2 %
Total 823 100.0 %
QUESTION: “If the 2018 general election were held today, for whom would you
vote for governor if the candidates were: Larry Hogan, the Republican and Ben
Jealous, the Democrat?”
Statewide Results
Democrats
Hogan 25%
Jealous 56%
Republicans
Hogan 90%
Jealous 5%
6
Unaffiliated
Hogan 58%
Jealous 22%
Gonzales Maryland Poll, Part 2 – EMBARGO: 12:01 a.m. Thursday, January 11th
Page 12
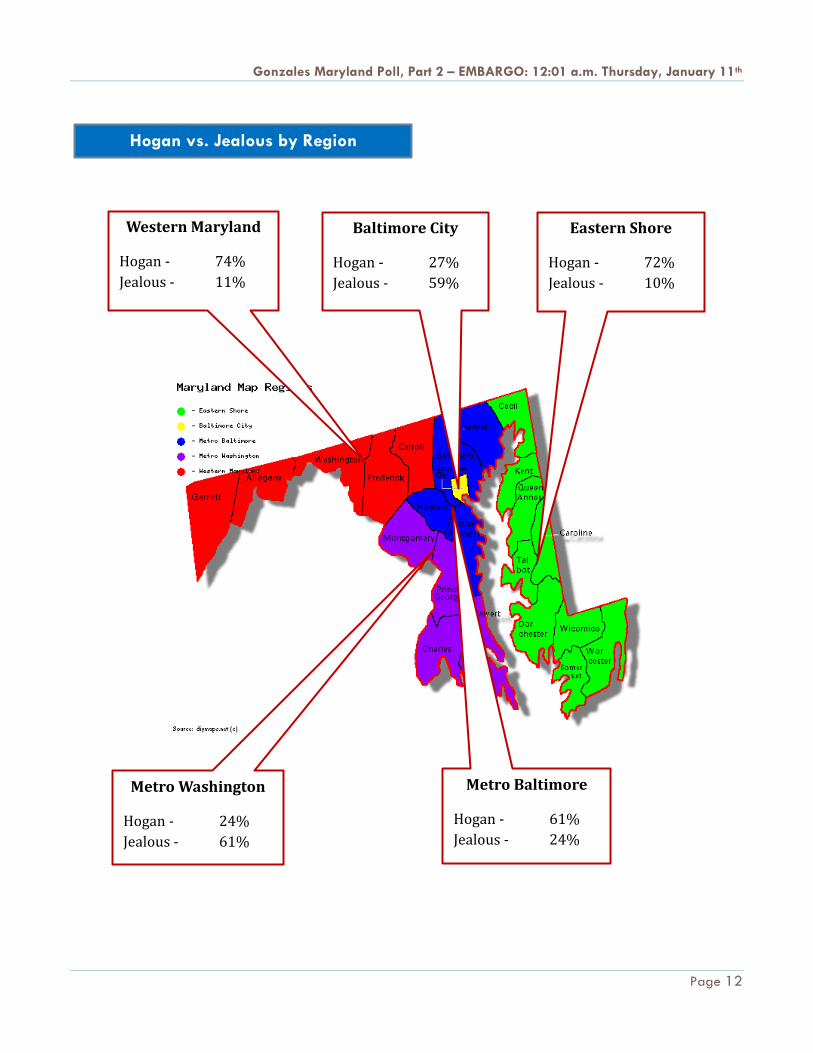
Hogan vs. Jealous by Region
Western Maryland
Hogan - 74%
Jealous - 11%
Eastern Shore
Hogan - 72%
Jealous - 10%
Metro Washington
Hogan - 24%
Jealous - 61%
Metro Baltimore
Hogan - 61%
Jealous - 24%
Baltimore City
Hogan - 27%
Jealous - 59%
Gonzales Maryland Poll, Part 2 – EMBARGO: 12:01 a.m. Thursday, January 11th
Page 13
N=461 GOVERNOR ELECTION: HOGAN vs BAKER
Hogan Baker Undecided
JOB APPROVAL: GOVERNOR LARRY HOGAN
Strongly 90 28 27
Approve 62.1% 19.3% 18.6%
Somewhat 15 90 32
Approve 10.9% 65.7% 23.4%
Somewhat 2 43 3
Disapprove 4.2% 89.6% 6.3%
Strongly 1 73 10
Disapprove 1.2% 86.9% 11.9%
How can Governor Larry
Hogan have 71% job approval
among voters, but receive less
than fifty percent in a match-up
with a Democrat?
Hogan Job Approval among Democrats by Vote
Only 11% of Democrats who
“somewhat” approve of the job
he is doing as governor say they
are going to vote for Republican
Larry Hogan
38% of Democrats who
“strongly” approve of the job
Hogan is doing as governor
either vote for the Democrat or
are undecided
Gonzales Maryland Poll, Part 2 – EMBARGO: 12:01 a.m. Thursday, January 11th
Page 14
DIRECTION OF STATE Number Percent
Right Direction 486 59.1 %
Wrong Track 206 25.0 %
No answer 131 15.9 %
Total 823 100.0 %
QUESTION: “Overall, would you say things in Maryland are moving in the right
direction, or would you say things are off on the wrong track?”
Statewide Results
Democrats
Right Direction 50%
Wrong Track 33%
Republicans
Right Direction 70%
Wrong Track 15%
6
Unaffiliated
Right Direction 73%
Wrong Track 16%

Gonzales Maryland Poll, Part 2 – EMBARGO: 12:01 a.m. Thursday, January 11th
Page 15
JOB APPROVAL: PRESIDENT DONALD TRUMP Number Percent
Approve 300 36.4 %
Strongly Disapprove 494 60.1 %
No answer 29 3.5 %
Total 823 100.0 %
Is that strongly or somewhat approve/disapprove?
JOB APPROVAL: PRESIDENT DONALD TRUMP Number Percent
Strongly Approve 225 27.3 %
Somewhat Approve 75 9.1 %
Somewhat Disapprove 82 10.0 %
Strongly Disapprove 412 50.1 %
No answer 29 3.5 %
Total 823 100.0 %
QUESTION: “Do you approve or disapprove of the job Donald Trump is doing
as president?”
Statewide Results
Democrats
Approve 19%
Disapprove 78%
Republicans
Approve 73%
Disapprove 25%
6
Unaffiliated
Approve 30%
Disapprove 62%

Gonzales Maryland Poll, Part 2 – EMBARGO: 12:01 a.m. Thursday, January 11th
Page 16
TAX CUT BILL Number Percent
Favor 275 33.4 %
Oppose 450 54.7 %
No answer 98 11.9 %
Total 823 100.0 %
Is that strongly or somewhat favor/oppose?
TAX CUT BILL Number Percent
Strongly Favor 199 24.2 %
Somewhat Favor 76 9.2 %
Somewhat Oppose 87 10.6 %
Strongly Oppose 363 44.1 %
No answer 98 11.9 %
Total 823 100.0 %
QUESTION: “Do you favor or oppose the Tax Cut Bill recently passed by
Congress in Washington?”
Statewide Results
Democrats
Favor 16%
Oppose 75%
Republicans
Favor 72%
Oppose 15%
6
Unaffiliated
Favor 23%
Oppose 57%
Gonzales Maryland Poll, Part 2 – EMBARGO: 12:01 a.m. Thursday, January 11th
Page 17
N=823 TAX CUT BILL
Strongly
Favor
Somewhat
Favor
Somewhat
Oppose
Strongly
Oppose
No answer
JOB APPROVAL: PRESIDENT DONALD TRUMP
Strongly 152 38 3 12 20
Approve 67.6% 16.9% 1.3% 5.3% 8.9%
Somewhat 23 21 6 7 18
Approve 30.7% 28.0% 8.0% 9.3% 24.0%
Somewhat 0 1 29 32 20
Disapprove 0.0% 1.2% 35.4% 39.0% 24.4%
Strongly 17 14 42 306 33
Disapprove 4.1% 3.4% 10.2% 74.3% 8.0%
Trump Job Approval by Tax Cut Bill
Is there a correlation between
voter attitude toward Trump
and position on Tax Bill?
68% of voters who
“strongly” approve of the
job Donald Trump is doing
“strongly” favor the Tax Bill
74% of voters who
“strongly” disapprove of the
job Donald Trump is doing
“strongly” oppose the Tax Bill

Gonzales Maryland Poll, Part 2 – EMBARGO: 12:01 a.m. Thursday, January 11th
Page 18
Data Tables QUESTION: Do you approve or disapprove of the job Donald Trump is doing as president?
JOB APPROVAL: PRESIDENT DONALD TRUMP Number Percent
Approve 300 36.4 %
Strongly Disapprove 494 60.1 %
No answer 29 3.5 %
Total 823 100.0 %
Is that strongly or somewhat approve/disapprove?
JOB APPROVAL: PRESIDENT DONALD TRUMP Number Percent
Strongly Approve 225 27.3 %
Somewhat Approve 75 9.1 %
Somewhat Disapprove 82 10.0 %
Strongly Disapprove 412 50.1 %
No answer 29 3.5 %
Total 823 100.0 %
N=823 JOB APPROVAL: PRESIDENT DONALD TRUMP
Strongly
Approve
Somewhat
Approve
Somewhat
Disapprove
Strongly
Disapprove
No answer
PARTY REGISTRATION
Democrat 56 33 50 309 13
12.1% 7.2% 10.8% 67.0% 2.8%
Republican 147 27 16 44 6
61.3% 11.3% 6.7% 18.3% 2.5%
Unaffiliated 22 15 16 59 10
18.0% 12.3% 13.1% 48.4% 8.2%
N=823 JOB APPROVAL: PRESIDENT DONALD TRUMP
Strongly
Approve
Somewhat
Approve
Somewhat
Disapprove
Strongly
Disapprove
No answer
RACE
White 195 60 54 253 19
33.6% 10.3% 9.3% 43.5% 3.3%
African- 19 10 21 143 7
American 9.5% 5.0% 10.5% 71.5% 3.5%
Other/Refused 11 5 7 16 3
26.2% 11.9% 16.7% 38.1% 7.1%

Gonzales Maryland Poll, Part 2 – EMBARGO: 12:01 a.m. Thursday, January 11th
Page 19
N=823 JOB APPROVAL: PRESIDENT DONALD TRUMP
Strongly
Approve
Somewhat
Approve
Somewhat
Disapprove
Strongly
Disapprove
No answer
AGE GROUP
Millennial (18 to 51 15 22 132 7
40 years old) 22.5% 6.6% 9.7% 58.1% 3.1%
Gen X (41 to 54 74 16 22 110 7
years old) 32.3% 7.0% 9.6% 48.0% 3.1%
Late Boomer (55 46 17 24 83 10
to 64 years old) 25.6% 9.4% 13.3% 46.1% 5.6%
Early Boomer 54 27 14 86 5
(65 and older) 29.0% 14.5% 7.5% 46.2% 2.7%
Refused 0 0 0 1 0
0.0% 0.0% 0.0% 100.0% 0.0%
N=823 JOB APPROVAL: PRESIDENT DONALD TRUMP
Strongly
Approve
Somewhat
Approve
Somewhat
Disapprove
Strongly
Disapprove
No answer
GENDER
Male 124 33 40 172 22
31.7% 8.4% 10.2% 44.0% 5.6%
Female 101 42 42 240 7
23.4% 9.7% 9.7% 55.6% 1.6%
N=823 JOB APPROVAL: PRESIDENT DONALD TRUMP
Strongly
Approve
Somewhat
Approve
Somewhat
Disapprove
Strongly
Disapprove
No answer
REGION
Eastern Shore 47 6 11 26 5
49.5% 6.3% 11.6% 27.4% 5.3%
Baltimore City 11 8 5 44 2
15.7% 11.4% 7.1% 62.9% 2.9%
Metro Baltimore 94 29 21 145 10
31.4% 9.7% 7.0% 48.5% 3.3%
Metro 33 16 35 169 9
Washington 12.6% 6.1% 13.4% 64.5% 3.4%
Western MD 40 16 10 28 3
41.2% 16.5% 10.3% 28.9% 3.1%
Gonzales Maryland Poll, Part 2 – EMBARGO: 12:01 a.m. Thursday, January 11th
Page 20
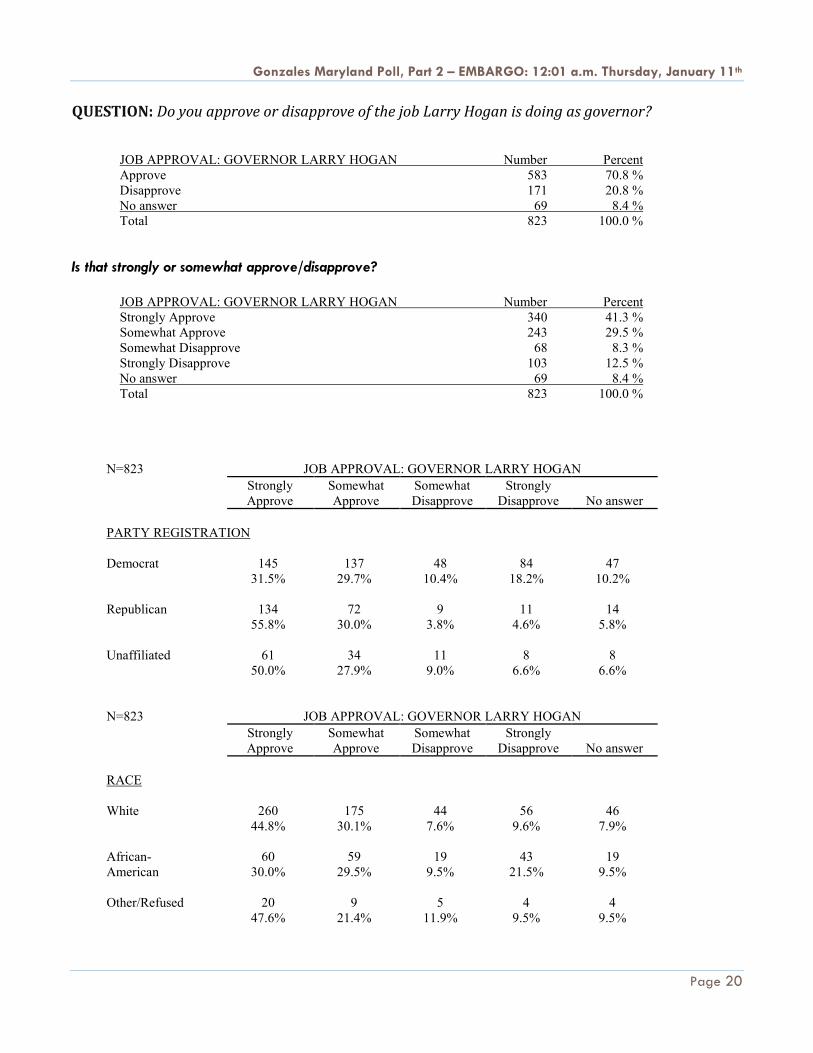
QUESTION: Do you approve or disapprove of the job Larry Hogan is doing as governor?
JOB APPROVAL: GOVERNOR LARRY HOGAN Number Percent
Approve 583 70.8 %
Disapprove 171 20.8 %
No answer 69 8.4 %
Total 823 100.0 %
Is that strongly or somewhat approve/disapprove?
JOB APPROVAL: GOVERNOR LARRY HOGAN Number Percent
Strongly Approve 340 41.3 %
Somewhat Approve 243 29.5 %
Somewhat Disapprove 68 8.3 %
Strongly Disapprove 103 12.5 %
No answer 69 8.4 %
Total 823 100.0 %
N=823 JOB APPROVAL: GOVERNOR LARRY HOGAN
Strongly
Approve
Somewhat
Approve
Somewhat
Disapprove
Strongly
Disapprove
No answer
PARTY REGISTRATION
Democrat 145 137 48 84 47
31.5% 29.7% 10.4% 18.2% 10.2%
Republican 134 72 9 11 14
55.8% 30.0% 3.8% 4.6% 5.8%
Unaffiliated 61 34 11 8 8
50.0% 27.9% 9.0% 6.6% 6.6%
N=823 JOB APPROVAL: GOVERNOR LARRY HOGAN
Strongly
Approve
Somewhat
Approve
Somewhat
Disapprove
Strongly
Disapprove
No answer
RACE
White 260 175 44 56 46
44.8% 30.1% 7.6% 9.6% 7.9%
African- 60 59 19 43 19
American 30.0% 29.5% 9.5% 21.5% 9.5%
Other/Refused 20 9 5 4 4
47.6% 21.4% 11.9% 9.5% 9.5%

Gonzales Maryland Poll, Part 2 – EMBARGO: 12:01 a.m. Thursday, January 11th
Page 21
N=823 JOB APPROVAL: GOVERNOR LARRY HOGAN
Strongly
Approve
Somewhat
Approve
Somewhat
Disapprove
Strongly
Disapprove
No answer
AGE GROUP
Millennial (18 to 91 68 16 31 21
40 years old) 40.1% 30.0% 7.0% 13.7% 9.3%
Gen X (41 to 54 98 66 18 30 17
years old) 42.8% 28.8% 7.9% 13.1% 7.4%
Late Boomer (55 69 59 14 21 17
to 64 years old) 38.3% 32.8% 7.8% 11.7% 9.4%
Early Boomer 82 50 19 21 14
(65 and older) 44.1% 26.9% 10.2% 11.3% 7.5%
Refused 0 0 1 0 0
0.0% 0.0% 100.0% 0.0% 0.0%
N=823 JOB APPROVAL: GOVERNOR LARRY HOGAN
Strongly
Approve
Somewhat
Approve
Somewhat
Disapprove
Strongly
Disapprove
No answer
GENDER
Male 175 117 33 33 33
44.8% 29.9% 8.4% 8.4% 8.4%
Female 165 126 35 70 36
38.2% 29.2% 8.1% 16.2% 8.3%
N=823 JOB APPROVAL: GOVERNOR LARRY HOGAN
Strongly
Approve
Somewhat
Approve
Somewhat
Disapprove
Strongly
Disapprove
No answer
REGION
Eastern Shore 47 31 8 3 6
49.5% 32.6% 8.4% 3.2% 6.3%
Baltimore City 25 21 7 14 3
35.7% 30.0% 10.0% 20.0% 4.3%
Metro Baltimore 160 83 13 20 23
53.5% 27.8% 4.3% 6.7% 7.7%
Metro 61 77 34 61 29
Washington 23.3% 29.4% 13.0% 23.3% 11.1%
Western MD 47 31 6 5 8
48.5% 32.0% 6.2% 5.2% 8.2%

Gonzales Maryland Poll, Part 2 – EMBARGO: 12:01 a.m. Thursday, January 11th
Page 22
QUESTION: If the 2018 general election were held today, for whom would you vote for governor if
the candidates were: Larry Hogan, the Republican and Rushern Baker, the Democrat?
GOVERNOR ELECTION: HOGAN vs BAKER Number Percent
Hogan 387 47.0 %
Baker 305 37.1 %
Undecided 131 15.9 %
Total 823 100.0 %
N=823 GOVERNOR ELECTION: HOGAN vs BAKER
Hogan Baker Undecided
PARTY REGISTRATION
Democrat 111 265 85
24.1% 57.5% 18.4%
Republican 211 13 16
87.9% 5.4% 6.7%
Unaffiliated 65 27 30
53.3% 22.1% 24.6%
N=823 GOVERNOR ELECTION: HOGAN vs BAKER
Hogan Baker Undecided
RACE
White 336 156 89
57.8% 26.9% 15.3%
African- 30 132 38
American 15.0% 66.0% 19.0%
Other/ 21 17 4
Refused 50.0% 40.5% 9.5%
Gonzales Maryland Poll, Part 2 – EMBARGO: 12:01 a.m. Thursday, January 11th
Page 23
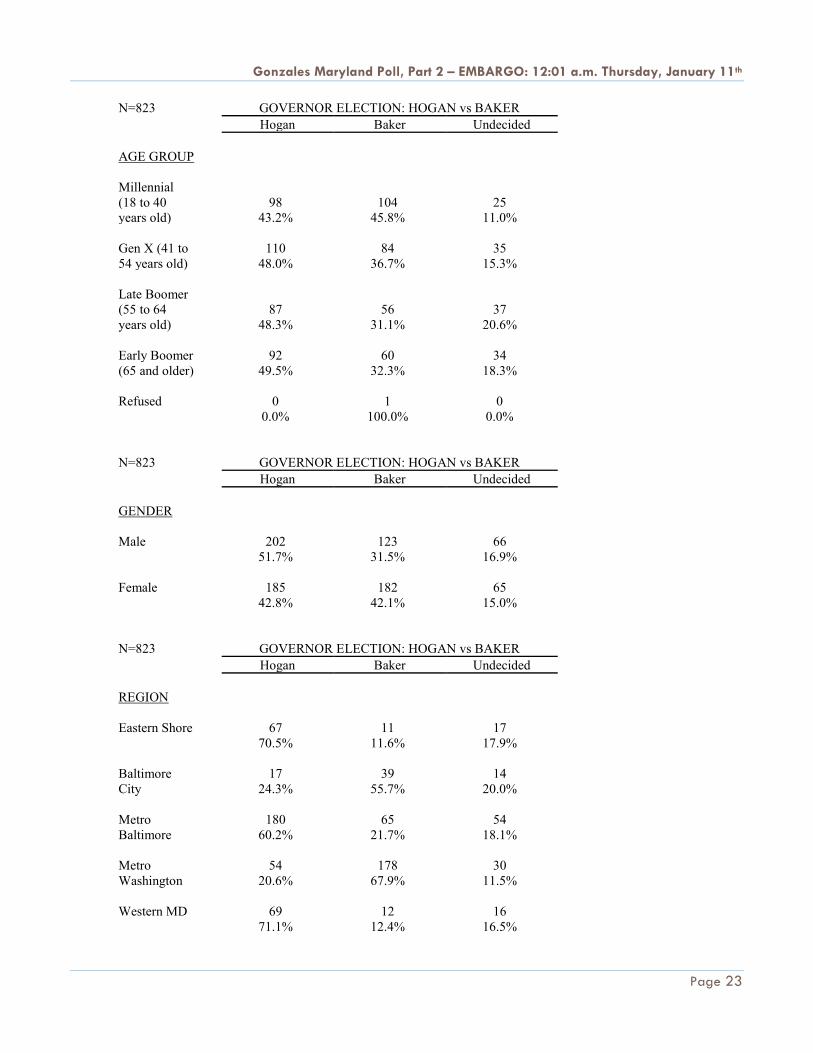
N=823 GOVERNOR ELECTION: HOGAN vs BAKER
Hogan Baker Undecided
AGE GROUP
Millennial
(18 to 40
98
104
25
years old) 43.2% 45.8% 11.0%
Gen X (41 to 110 84 35
54 years old) 48.0% 36.7% 15.3%
Late Boomer
(55 to 64
87
56
37
years old) 48.3% 31.1% 20.6%
Early Boomer 92 60 34
(65 and older) 49.5% 32.3% 18.3%
Refused 0 1 0
0.0% 100.0% 0.0%
N=823 GOVERNOR ELECTION: HOGAN vs BAKER
Hogan Baker Undecided
GENDER
Male 202 123 66
51.7% 31.5% 16.9%
Female 185 182 65
42.8% 42.1% 15.0%
N=823 GOVERNOR ELECTION: HOGAN vs BAKER
Hogan Baker Undecided
REGION
Eastern Shore 67 11 17
70.5% 11.6% 17.9%
Baltimore 17 39 14
City 24.3% 55.7% 20.0%
Metro 180 65 54
Baltimore 60.2% 21.7% 18.1%
Metro 54 178 30
Washington 20.6% 67.9% 11.5%
Western MD 69 12 16
71.1% 12.4% 16.5%

Gonzales Maryland Poll, Part 2 – EMBARGO: 12:01 a.m. Thursday, January 11th
Page 24
QUESTION: If the 2018 general election were held today, for whom would you vote for governor if
the candidates were: Larry Hogan, the Republican and Kevin Kamenetz, the Democrat?
GOVERNOR ELECTION: HOGAN vs KAMENETZ Number Percent
Hogan 396 48.1 %
Kamenetz 278 33.8 %
Undecided 149 18.1 %
Total 823 100.0 %
N=823 GOVERNOR ELECTION: HOGAN vs KAMENETZ
Hogan Kamenetz Undecided
PARTY REGISTRATION
Democrat 119 236 106
25.8% 51.2% 23.0%
Republican 210 14 16
87.5% 5.8% 6.7%
Unaffiliated 67 28 27
54.9% 23.0% 22.1%
N=823 GOVERNOR ELECTION: HOGAN vs KAMENETZ
Hogan Kamenetz Undecided
RACE
White 330 168 83
56.8% 28.9% 14.3%
African- 44 95 61
American 22.0% 47.5% 30.5%
Other/ 22 15 5
Refused 52.4% 35.7% 11.9%

Gonzales Maryland Poll, Part 2 – EMBARGO: 12:01 a.m. Thursday, January 11th
Page 25
N=823 GOVERNOR ELECTION: HOGAN vs KAMENETZ
Hogan Kamenetz Undecided
AGE GROUP
Millennial
(18 to 40
99
97
31
years old) 43.6% 42.7% 13.7%
Gen X (41 to 114 77 38
54 years old) 49.8% 33.6% 16.6%
Late Boomer
(55 to 64
89
56
35
years old) 49.4% 31.1% 19.4%
Early Boomer 94 48 44
(65 and older) 50.5% 25.8% 23.7%
Refused 0 0 1
0.0% 0.0% 100.0%
N=823 GOVERNOR ELECTION: HOGAN vs KAMENETZ
Hogan Kamenetz Undecided
GENDER
Male 198 120 73
50.6% 30.7% 18.7%
Female 198 158 76
45.8% 36.6% 17.6%
N=823 GOVERNOR ELECTION: HOGAN vs KAMENETZ
Hogan Kamenetz Undecided
REGION
Eastern Shore 65 12 18
68.4% 12.6% 18.9%
Baltimore 16 41 13
City 22.9% 58.6% 18.6%
Metro 167 89 43
Baltimore 55.9% 29.8% 14.4%
Metro 80 123 59
Washington 30.5% 46.9% 22.5%
Western MD 68 13 16
70.1% 13.4% 16.5%

Gonzales Maryland Poll, Part 2 – EMBARGO: 12:01 a.m. Thursday, January 11th
Page 26
QUESTION: If the 2018 general election were held today, for whom would you vote for governor if
the candidates were: Larry Hogan, the Republican and Ben Jealous, the Democrat?
GOVERNOR ELECTION: HOGAN vs JEALOUS Number Percent
Hogan 403 49.0 %
Jealous 295 35.8 %
Undecided 125 15.2 %
Total 823 100.0 %
N=823 GOVERNOR ELECTION: HOGAN vs JEALOUS
Hogan Jealous Undecided
PARTY REGISTRATION
Democrat 116 257 88
25.2% 55.7% 19.1%
Republican 216 11 13
90.0% 4.6% 5.4%
Unaffiliated 71 27 24
58.2% 22.1% 19.7%
N=823 GOVERNOR ELECTION: HOGAN vs JEALOUS
Hogan Jealous Undecided
RACE
White 348 149 84
59.9% 25.6% 14.5%
African- 35 128 37
American 17.5% 64.0% 18.5%
Other/ 20 18 4
Refused 47.6% 42.9% 9.5%
Gonzales Maryland Poll, Part 2 – EMBARGO: 12:01 a.m. Thursday, January 11th
Page 27
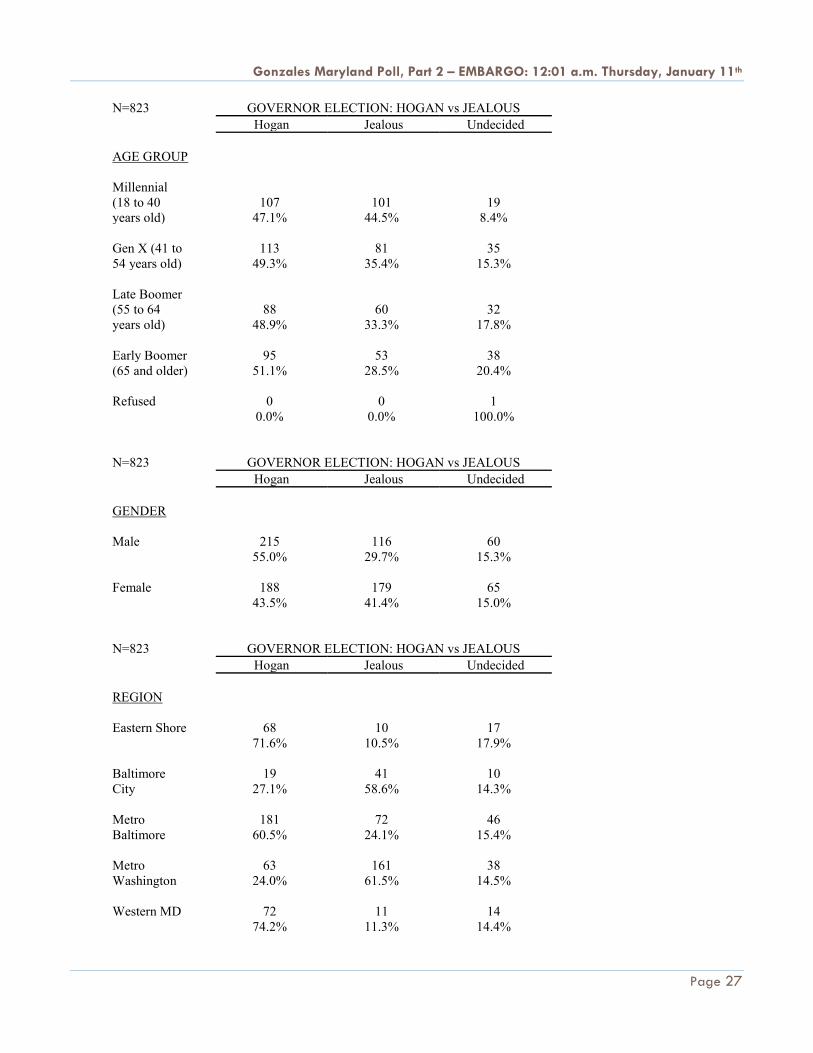
N=823 GOVERNOR ELECTION: HOGAN vs JEALOUS
Hogan Jealous Undecided
AGE GROUP
Millennial
(18 to 40
107
101
19
years old) 47.1% 44.5% 8.4%
Gen X (41 to 113 81 35
54 years old) 49.3% 35.4% 15.3%
Late Boomer
(55 to 64
88
60
32
years old) 48.9% 33.3% 17.8%
Early Boomer 95 53 38
(65 and older) 51.1% 28.5% 20.4%
Refused 0 0 1
0.0% 0.0% 100.0%
N=823 GOVERNOR ELECTION: HOGAN vs JEALOUS
Hogan Jealous Undecided
GENDER
Male 215 116 60
55.0% 29.7% 15.3%
Female 188 179 65
43.5% 41.4% 15.0%
N=823 GOVERNOR ELECTION: HOGAN vs JEALOUS
Hogan Jealous Undecided
REGION
Eastern Shore 68 10 17
71.6% 10.5% 17.9%
Baltimore 19 41 10
City 27.1% 58.6% 14.3%
Metro 181 72 46
Baltimore 60.5% 24.1% 15.4%
Metro 63 161 38
Washington 24.0% 61.5% 14.5%
Western MD 72 11 14
74.2% 11.3% 14.4%
Gonzales Maryland Poll, Part 2 – EMBARGO: 12:01 a.m. Thursday, January 11th
Page 28
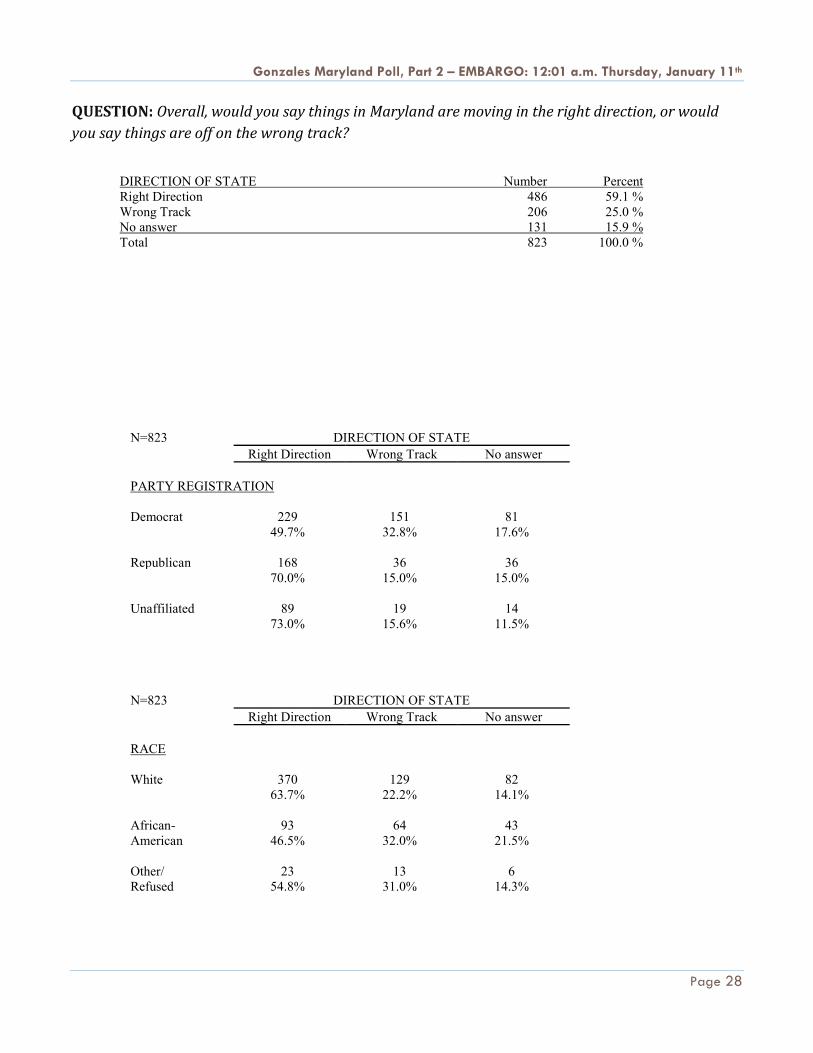
QUESTION: Overall, would you say things in Maryland are moving in the right direction, or would
you say things are off on the wrong track?
DIRECTION OF STATE Number Percent
Right Direction 486 59.1 %
Wrong Track 206 25.0 %
No answer 131 15.9 %
Total 823 100.0 %
N=823 DIRECTION OF STATE
Right Direction Wrong Track No answer
PARTY REGISTRATION
Democrat 229 151 81
49.7% 32.8% 17.6%
Republican 168 36 36
70.0% 15.0% 15.0%
Unaffiliated 89 19 14
73.0% 15.6% 11.5%
N=823 DIRECTION OF STATE
Right Direction Wrong Track No answer
RACE
White 370 129 82
63.7% 22.2% 14.1%
African- 93 64 43
American 46.5% 32.0% 21.5%
Other/ 23 13 6
Refused 54.8% 31.0% 14.3%

Gonzales Maryland Poll, Part 2 – EMBARGO: 12:01 a.m. Thursday, January 11th
Page 29
N=823 DIRECTION OF STATE
Right Direction Wrong Track No answer
AGE GROUP
Millennial
(18 to 40
135
58
34
years old) 59.5% 25.6% 15.0%
Gen X (41 to 133 60 36
54 years old) 58.1% 26.2% 15.7%
Late Boomer
(55 to 64
105
43
32
years old) 58.3% 23.9% 17.8%
Early Boomer 113 44 29
(65 and older) 60.8% 23.7% 15.6%
Refused 0 1 0
0.0% 100.0% 0.0%
N=823 DIRECTION OF STATE
Right Direction Wrong Track No answer
GENDER
Male 237 97 57
60.6% 24.8% 14.6%
Female 249 109 74
57.6% 25.2% 17.1%
N=823 DIRECTION OF STATE
Right Direction Wrong Track No answer
REGION
Eastern Shore 64 23 8
67.4% 24.2% 8.4%
Baltimore 37 23 10
City 52.9% 32.9% 14.3%
Metro 201 51 47
Baltimore 67.2% 17.1% 15.7%
Metro 117 93 52
Washington 44.7% 35.5% 19.8%
Western MD 67 16 14
69.1% 16.5% 14.4%

Gonzales Maryland Poll, Part 2 – EMBARGO: 12:01 a.m. Thursday, January 11th
Page 30
QUESTION: Do you favor or oppose the Tax Cut Bill recently passed by Congress in Washington?
TAX CUT BILL Number Percent
Favor 275 33.4 %
Oppose 450 54.7 %
No answer 98 11.9 %
Total 823 100.0 %
Is that strongly or somewhat favor/oppose?
TAX CUT BILL Number Percent
Strongly Favor 199 24.2 %
Somewhat Favor 76 9.2 %
Somewhat Oppose 87 10.6 %
Strongly Oppose 363 44.1 %
No answer 98 11.9 %
Total 823 100.0 %
N=823 TAX CUT BILL
Strongly
Favor
Somewhat
Favor
Somewhat
Oppose
Strongly
Oppose
No answer
PARTY REGISTRATION
Democrat 41 32 58 287 43
8.9% 6.9% 12.6% 62.3% 9.3%
Republican 141 33 11 24 31
58.8% 13.8% 4.6% 10.0% 12.9%
Unaffiliated 17 11 18 52 24
13.9% 9.0% 14.8% 42.6% 19.7%
N=823 TAX CUT BILL
Strongly
Favor
Somewhat
Favor
Somewhat
Oppose
Strongly
Oppose
No answer
RACE
White 168 65 58 216 74
28.9% 11.2% 10.0% 37.2% 12.7%
African- 19 10 24 132 15
American 9.5% 5.0% 12.0% 66.0% 7.5%
Other/Refused 12 1 5 15 9
28.6% 2.4% 11.9% 35.7% 21.4%
Gonzales Maryland Poll, Part 2 – EMBARGO: 12:01 a.m. Thursday, January 11th
Page 31
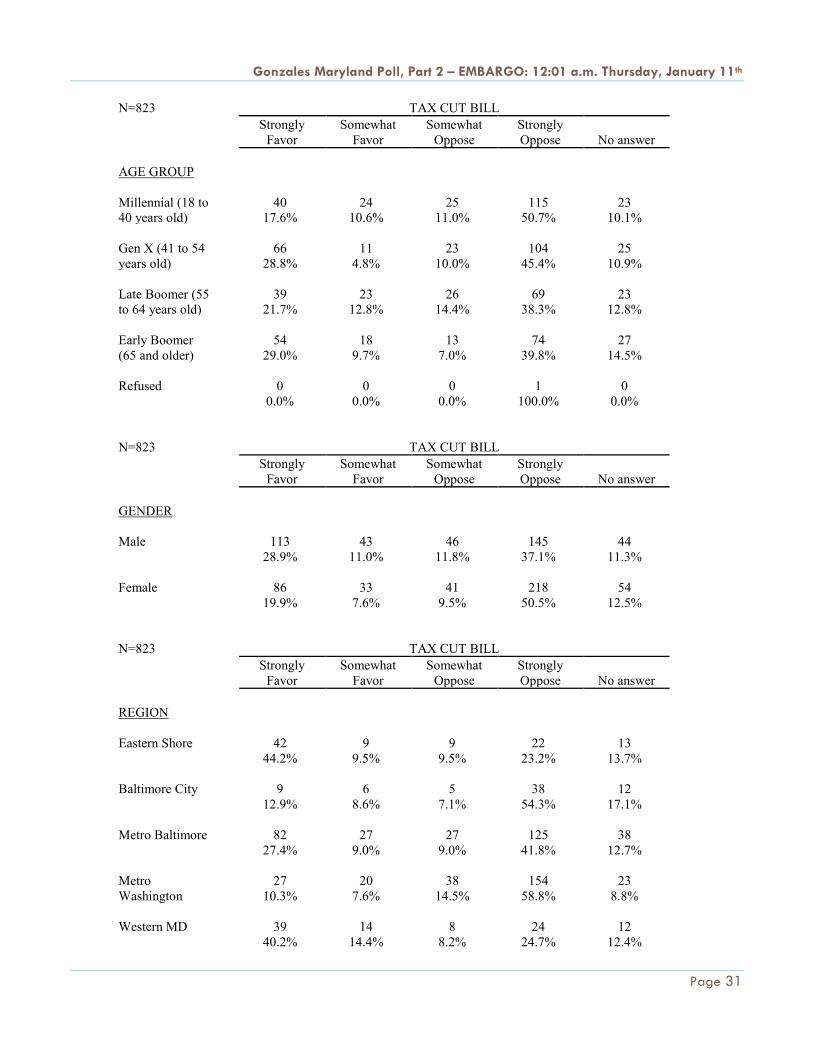
N=823 TAX CUT BILL
Strongly
Favor
Somewhat
Favor
Somewhat
Oppose
Strongly
Oppose
No answer
AGE GROUP
Millennial (18 to 40 24 25 115 23
40 years old) 17.6% 10.6% 11.0% 50.7% 10.1%
Gen X (41 to 54 66 11 23 104 25
years old) 28.8% 4.8% 10.0% 45.4% 10.9%
Late Boomer (55 39 23 26 69 23
to 64 years old) 21.7% 12.8% 14.4% 38.3% 12.8%
Early Boomer 54 18 13 74 27
(65 and older) 29.0% 9.7% 7.0% 39.8% 14.5%
Refused 0 0 0 1 0
0.0% 0.0% 0.0% 100.0% 0.0%
N=823 TAX CUT BILL
Strongly
Favor
Somewhat
Favor
Somewhat
Oppose
Strongly
Oppose
No answer
GENDER
Male 113 43 46 145 44
28.9% 11.0% 11.8% 37.1% 11.3%
Female 86 33 41 218 54
19.9% 7.6% 9.5% 50.5% 12.5%
N=823 TAX CUT BILL
Strongly
Favor
Somewhat
Favor
Somewhat
Oppose
Strongly
Oppose
No answer
REGION
Eastern Shore 42 9 9 22 13
44.2% 9.5% 9.5% 23.2% 13.7%
Baltimore City 9 6 5 38 12
12.9% 8.6% 7.1% 54.3% 17.1%
Metro Baltimore 82 27 27 125 38
27.4% 9.0% 9.0% 41.8% 12.7%
Metro 27 20 38 154 23
Washington 10.3% 7.6% 14.5% 58.8% 8.8%
Western MD 39 14 8 24 12
40.2% 14.4% 8.2% 24.7% 12.4%

Gonzales Maryland Poll, Part 2 – EMBARGO: 12:01 a.m. Thursday, January 11th
Page 32
Maryland Democratic Primary Poll Demographics
PARTY REGISTRATION Number Percent
Democrat 461 56.0 %
Republican 240 29.2 %
Unaffiliated 122 14.8 %
Total 823 100.0 %
AGE GROUP Number Percent
Millennial (18 to 40 years old) 227 27.6 %
Gen X (41 to 54 years old) 229 27.8 %
Late Boomer (55 to 64 years old) 180 21.9 %
Early Boomer (65 and older) 186 22.6 %
Refused 1 0.1 %
Total 823 100.0 %
RACE Number Percent
White 581 70.6 %
African-American 200 24.3 %
Other/Refused 42 5.1 %
Total 823 100.0 %
GENDER Number Percent
Male 391 47.5 %
Female 432 52.5 %
Total 823 100.0 %
REGION Number Percent
Eastern Shore 95 11.5 %
Baltimore City 70 8.5 %
Metro Baltimore 299 36.3 %
Metro Washington 262 31.8 %
Western MD 97 11.8 %
Total 823 100.0 %
METRO BALTIMORE Number Percent
Anne Arundel County 83 10.1 %
Baltimore County 123 14.9 %
Harford County 43 5.2 %
Howard County 50 6.1 %
Total 299 36.3 %
METRO WASHINGTON Number Percent
Montgomery County 133 16.2 %
Prince George's County 106 12.9 %
Charles County 23 2.7 %
Total 262 31.8 %