Goldman Sachs European Financials Conference …...Frankfurt, June 5th 2009 Goldman Sachs European...
36
Frankfurt, June 5 th 2009 Goldman Sachs European Financials Conference BBVA, recurrent and sustainable earnings Panel 7. Back to basics: how can retail banking offer superior returns?
Transcript of Goldman Sachs European Financials Conference …...Frankfurt, June 5th 2009 Goldman Sachs European...

Frankfurt, June 5th 2009
Goldman Sachs European Financials Conference
BBVA, recurrent and sustainable earnings
Panel 7. Back to basics: how can retail banking offer superior returns?
2
DisclaimerThis document is only provided for information purposes and does not constitute, nor must it be interpreted as, an offer to sell or exchange or acquire, or an invitation for offers to buy securities issued by any of the aforementioned companies. Any decision to buy or invest in securities in relation to a specific issue must be made solely and exclusively on the basis of the information set out in the pertinent prospectus filed by the company in relation to such specific issue. Nobody who becomes aware of the information contained in this report must regard it as definitive, because it is subject to changes and modifications.
This document contains or may contain forward looking statements (in the usual meaning and within the meaning of the US Private Securities Litigation Act of 1995) regarding intentions, expectations or projections of BBVA or of its management on the date thereof, that refer to miscellaneous aspects, including projections about the future earnings of the business. The statements contained herein are based on our current projections, although the said earnings may be substantially modified in the future by certain risks, uncertainty and others factors relevant that may cause the results or final decisions to differ from such intentions, projections or estimates. These factors include, without limitation, (1) the market situation, macroeconomic factors, regulatory, political or government guidelines, (2) domestic and international stock market movements, exchange rates and interest rates, (3) competitive pressures, (4) technological changes, (5) alterations in the financial situation, creditworthiness or solvency of our customers, debtors or counterparts. These factors could condition and result in actual events differing from the information and intentions stated, projected or forecast in this document and other past or future documents. BBVA does not undertake to publicly revise the contents of this or any other document, either if the events are not exactly as described herein, or if such events lead to changes in the stated strategies and intentions.
The contents of this statement must be taken into account by any persons or entities that may have to make decisions or prepare or disseminate opinions about securities issued by BBVA and, in particular, by the analysts who handle this document. This document may contain summarised information or information that has not been audited, and its recipients are invited to consult the documentation and public information filed by BBVA with stock market supervisory bodies, in particular, the prospectuses and periodical information filed with the Spanish Securities Exchange Commission (CNMV) and the Annual Report on form 20-F and information on form 6-K that are disclosed to the US Securities and Exchange Commission.
Distribution of this document in other jurisdictions may be prohibited, and recipients into whose possession this document comes shall be solely responsible for informing themselves about, and observing any such restrictions. By accepting this document you agree to be bound by the foregoing Restrictions.
3
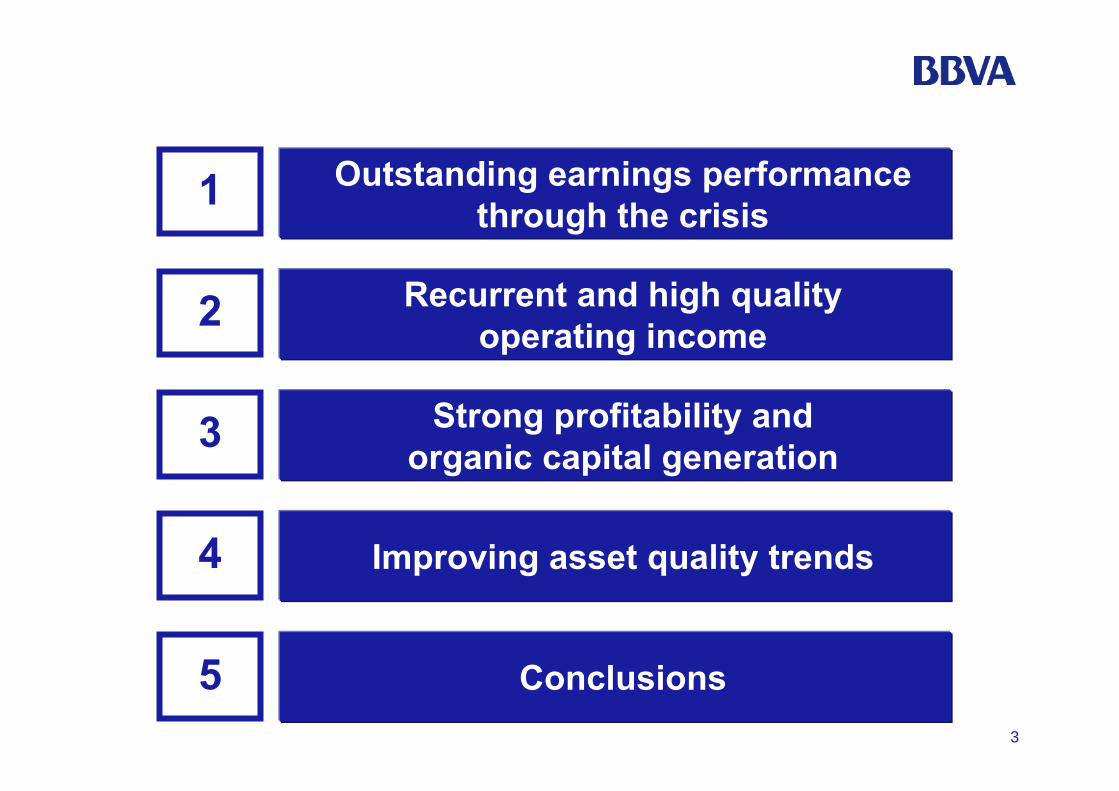
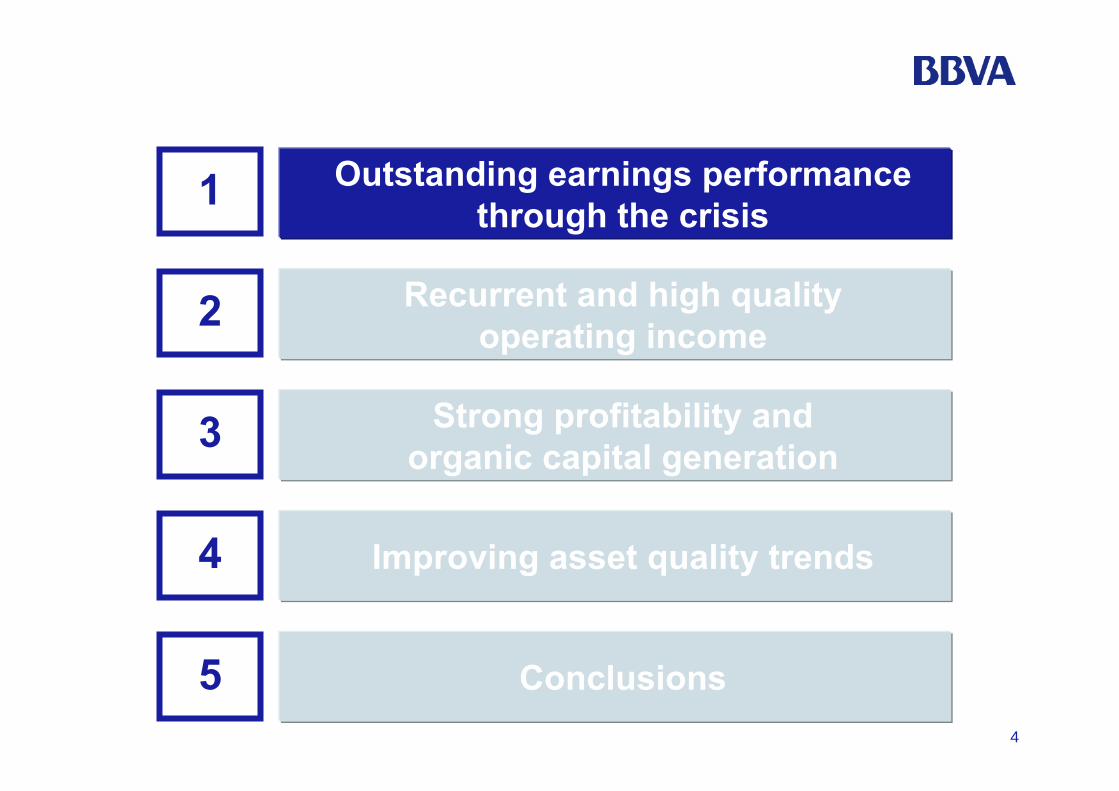
Recurrent and high quality operating income
1
Improving asset quality trends
3 Strong profitability and organic capital generation
2
4
Outstanding earnings performance through the crisis
5 Conclusions
4
Recurrent and high quality operating income
1
Improving asset quality trends
3 Strong profitability and organic capital generation
2
4
Outstanding earnings performance through the crisis
5 Conclusions
5* Peer Group
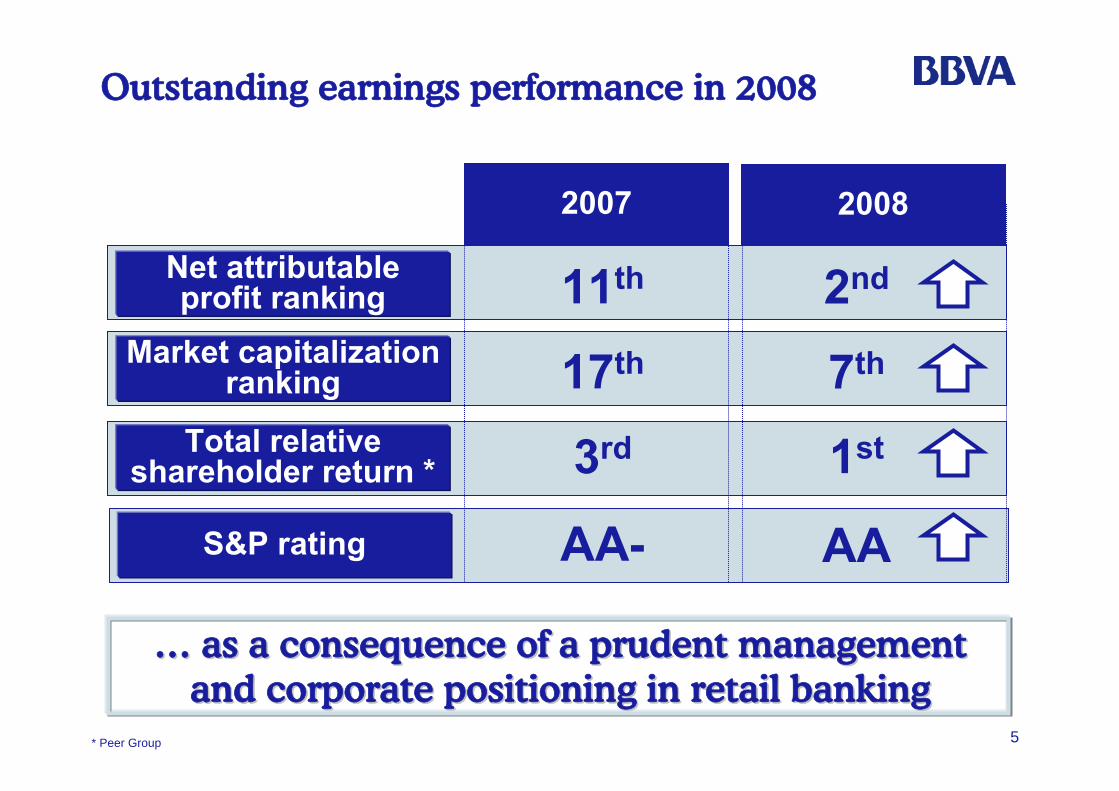
Outstanding earnings performance in 2008
…… as a consequence of a prudent management as a consequence of a prudent management and corporate positioning in retail bankingand corporate positioning in retail banking
S&P rating AA-
2007 2008
Net attributable profit ranking
Market capitalization ranking
11th 2nd
17th 7th
Total relative shareholder return * 3rd 1st
AA
6
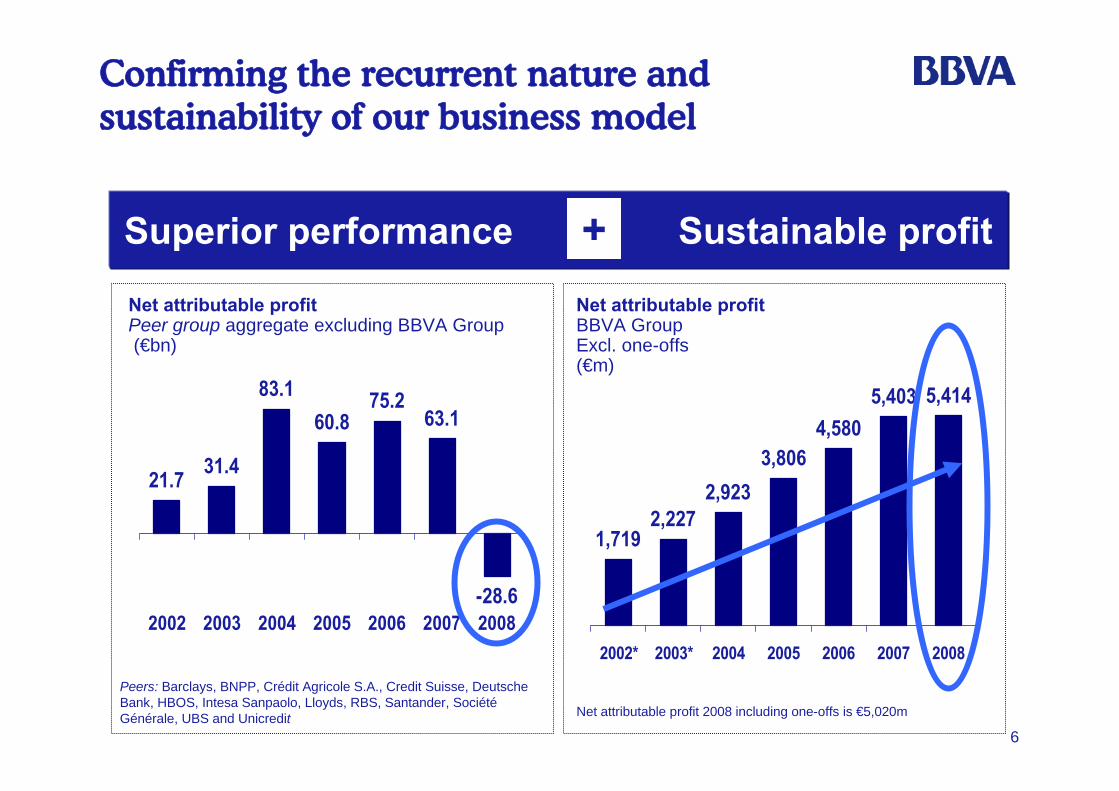
Confirming the recurrent nature and sustainability of our business model
Superior performance Sustainable profit
21.7 31.4
83.160.8
75.263.1
-28.62002 2003 2004 2005 2006 2007 2008
Net attributable profitBBVA Group Excl. one-offs(€m)
1,7192,227
2,9233,806
4,5805,403 5,414
2002* 2003* 2004 2005 2006 2007 2008
Net attributable profitPeer group aggregate excluding BBVA Group(€bn)
Peers: Barclays, BNPP, Crédit Agricole S.A., Credit Suisse, Deutsche Bank, HBOS, Intesa Sanpaolo, Lloyds, RBS, Santander, SociétéGénérale, UBS and Unicredit Net attributable profit 2008 including one-offs is €5,020m
+
7
10,034
9,112
4,092
-4,080-15
2,220
-16,104-9,439
4,1896,330
7,564
9,193
11,27917,728
Peer 6Peer 10
Peer 2Peer 1
Peer 11Peer 13
Peer 5Peer 7
Peer 12Peer 3Peer 4Peer 9BBVAPeer 82,508
2,202
2,076
1,3511,130
1,050
544455
785720
636
1,046
1,653
2,144
Peer 13BBVA
Peer 12Peer 11Peer 10Peer 9Peer 8Peer 7Peer 6Peer 5Peer 4Peer 3Peer 2Peer 1
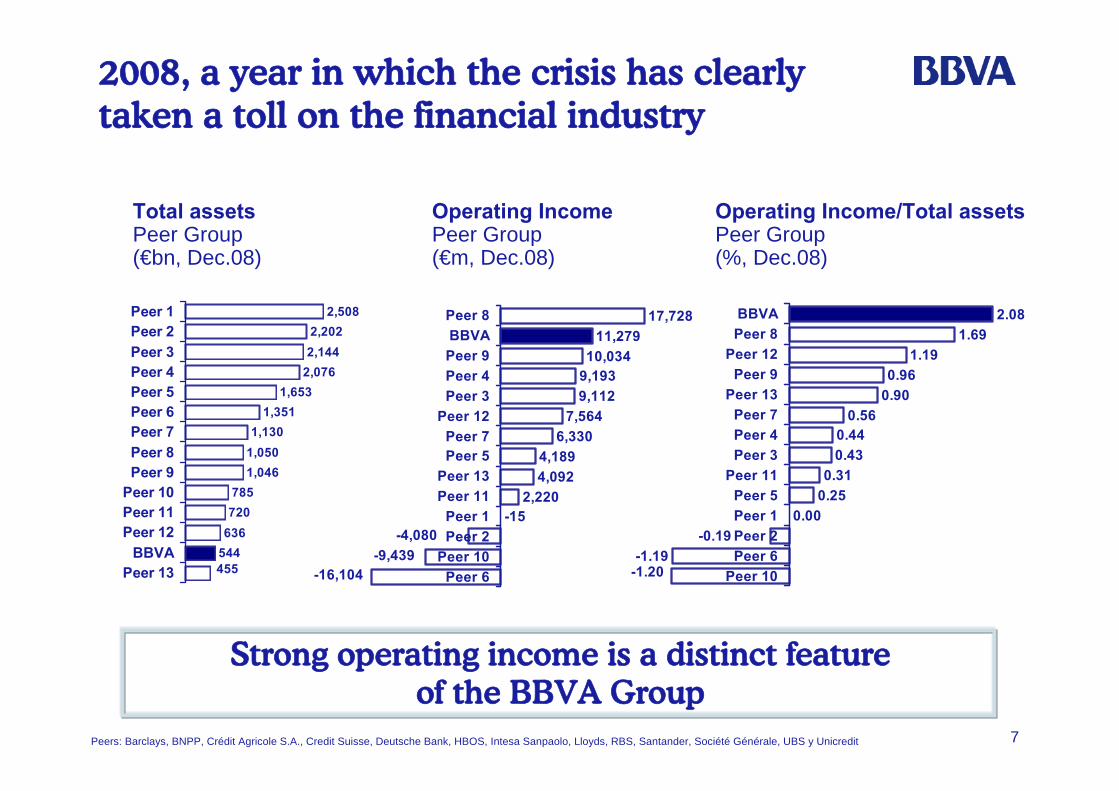
Total assetsPeer Group(€bn, Dec.08)
Operating IncomePeer Group(€m, Dec.08)
1.19
0.90
0.31
-0.190.00
0.25
-1.20-1.19
0.430.44
0.56
0.96
1.692.08
Peer 10Peer 6Peer 2Peer 1Peer 5
Peer 11Peer 3Peer 4Peer 7
Peer 13Peer 9
Peer 12Peer 8BBVA
Operating Income/Total assetsPeer Group(%, Dec.08)
Strong operating income is a distinct feature of the BBVA Group
Peers: Barclays, BNPP, Crédit Agricole S.A., Credit Suisse, Deutsche Bank, HBOS, Intesa Sanpaolo, Lloyds, RBS, Santander, Société Générale, UBS y Unicredit
2008, a year in which the crisis has clearly taken a toll on the financial industry
8
5.5 5.9 3.012.7
36.0
4.713.1 10.7
1.1
12.0
7.0
7.2
5.4
20.9
8.9
5.5
1.07.4
26.6
4.02
4
103
5.1
16.4
3.4
BB
VA SAN
DB
CM
Z
BN
PP SG
CA
SA ING
ISP
UC
I
HSB
C
RB
S
BA
RC
L
LLO
YDS
HB
OS
UB
S
CS
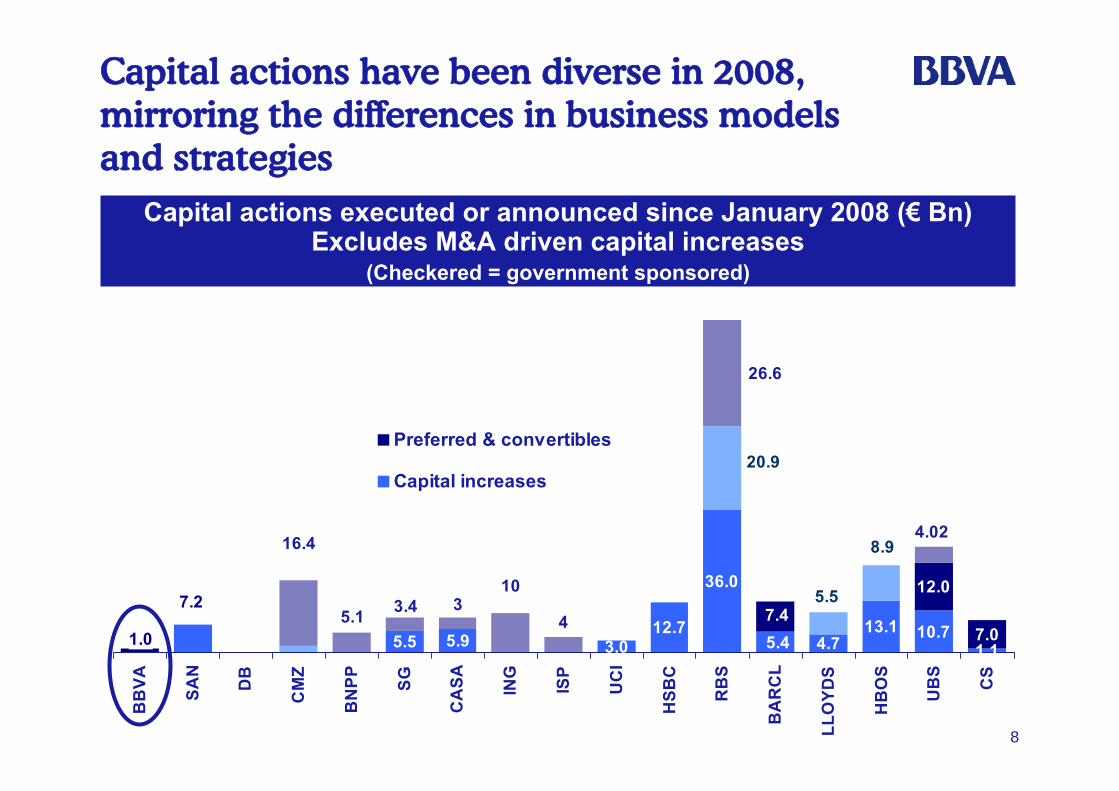
Preferred & convertibles
Capital increases
Capital actions executed or announced since January 2008 (€ Bn) Excludes M&A driven capital increases
(Checkered = government sponsored)
Capital actions have been diverse in 2008, mirroring the differences in business models and strategies
9
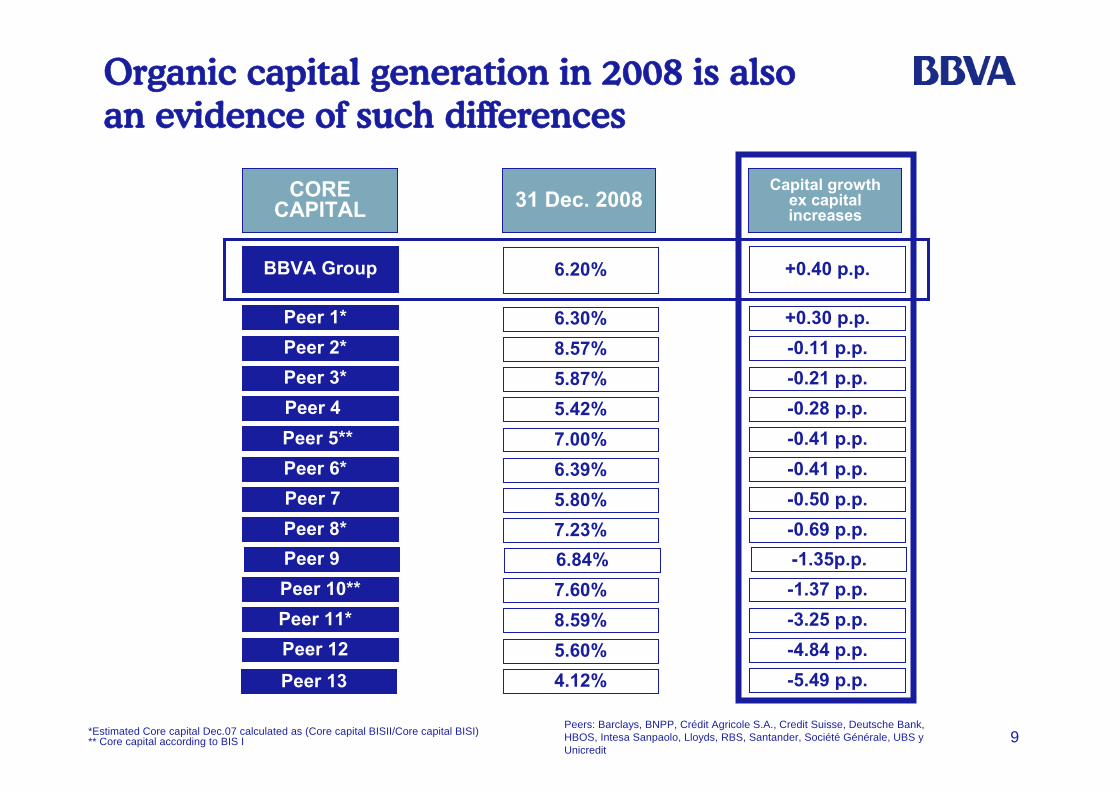
Organic capital generation in 2008 is also an evidence of such differences
*Estimated Core capital Dec.07 calculated as (Core capital BISII/Core capital BISI)** Core capital according to BIS I
31 Dec. 2008Capital growth
ex capital increases
CORE CAPITAL
BBVA Group
Peer 1* Peer 2* Peer 3* Peer 4 Peer 5** Peer 6* Peer 7 Peer 8*
Peer 10**Peer 11* Peer 12 Peer 13
6.20%
6.30%8.57%5.87%5.42%7.00%6.39%5.80%7.23%
7.60%8.59%5.60%4.12%
+0.40 p.p.
+0.30 p.p.-0.11 p.p.-0.21 p.p.-0.28 p.p.-0.41 p.p.-0.41 p.p.-0.50 p.p.-0.69 p.p.
-1.37 p.p.-3.25 p.p.-4.84 p.p.-5.49 p.p.
Peer 9 6.84% -1.35p.p.
Peers: Barclays, BNPP, Crédit Agricole S.A., Credit Suisse, Deutsche Bank, HBOS, Intesa Sanpaolo, Lloyds, RBS, Santander, Société Générale, UBS y Unicredit
10
Recurrent and high quality operating income
1
Improving asset quality trends
3 Strong profitability and organic capital generation
2
4
Outstanding earnings performance through the crisis
5 Conclusions
11
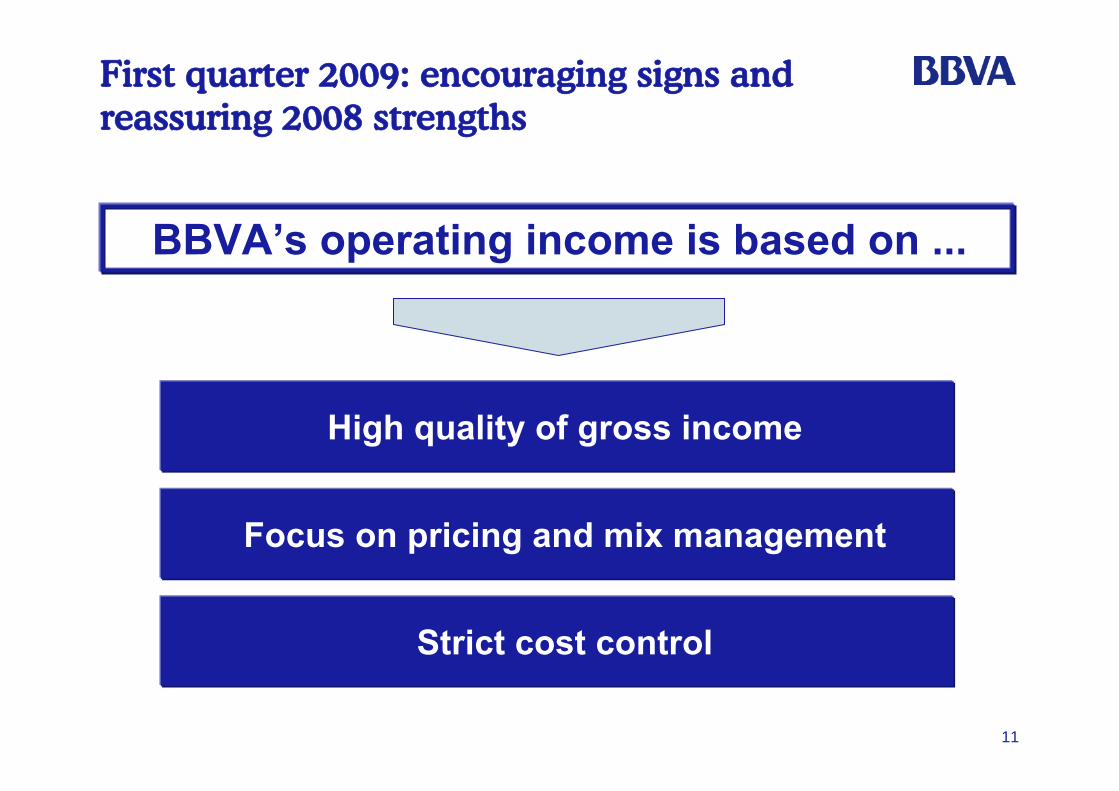
BBVA’s operating income is based on ...
High quality of gross income
Strict cost control
Focus on pricing and mix management
First quarter 2009: encouraging signs and reassuring 2008 strengths
12
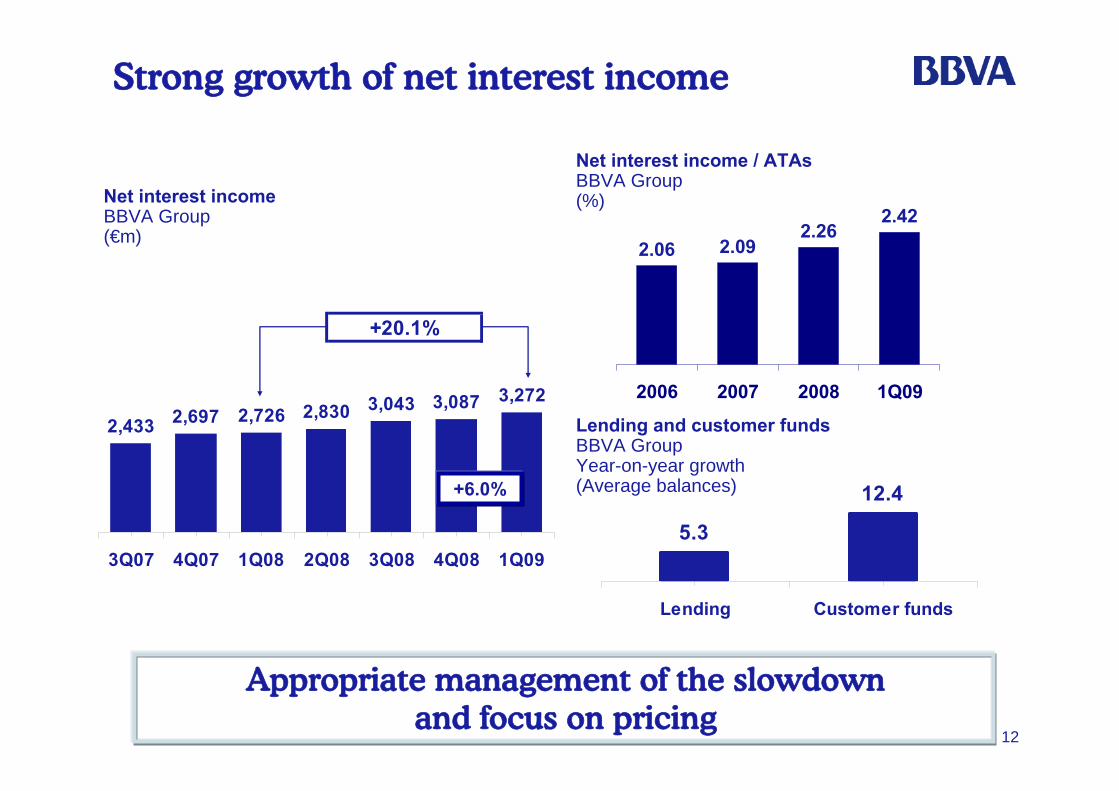
5.3
12.4
Lending Customer funds
+20.1%
2,433 2,697 2,726 2,830 3,043 3,087 3,272
3Q07 4Q07 1Q08 2Q08 3Q08 4Q08 1Q09
2.06 2.092.26
2.42
2006 2007 2008 1Q09
Net interest income / ATAsBBVA Group(%)
Lending and customer fundsBBVA GroupYear-on-year growth(Average balances)
Appropriate management of the slowdown and focus on pricing
Net interest incomeBBVA Group(€m)
+6.0%
Strong growth of net interest income
13
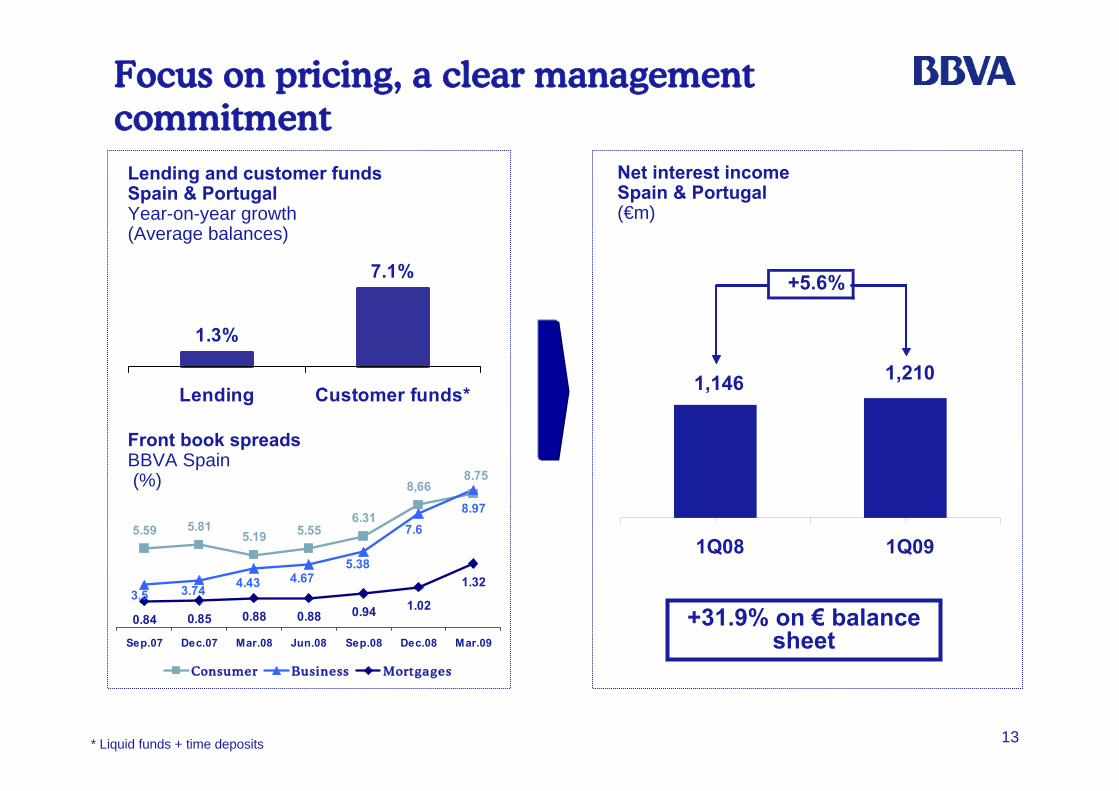
8.97
8.75
5.59 5.815.19 5.55
6.31
8,66
3.5 3.74 4.43 4.675.38
7.6
1.32
0.84 0.85 0.88 0.88 0.94 1.02
Sep.07 Dec.07 Mar.08 Jun.08 Sep.08 Dec.08 Mar.09
Consumer Business Mortgages
Lending and customer fundsSpain & PortugalYear-on-year growth(Average balances)
Net interest incomeSpain & Portugal(€m)
Front book spreadsBBVA Spain(%)
1.3%
7.1%
Lending Customer funds*
+31.9% on € balance sheet
* Liquid funds + time deposits
Focus on pricing, a clear management commitment
+5.6%
1,146 1,210
1Q08 1Q09
14
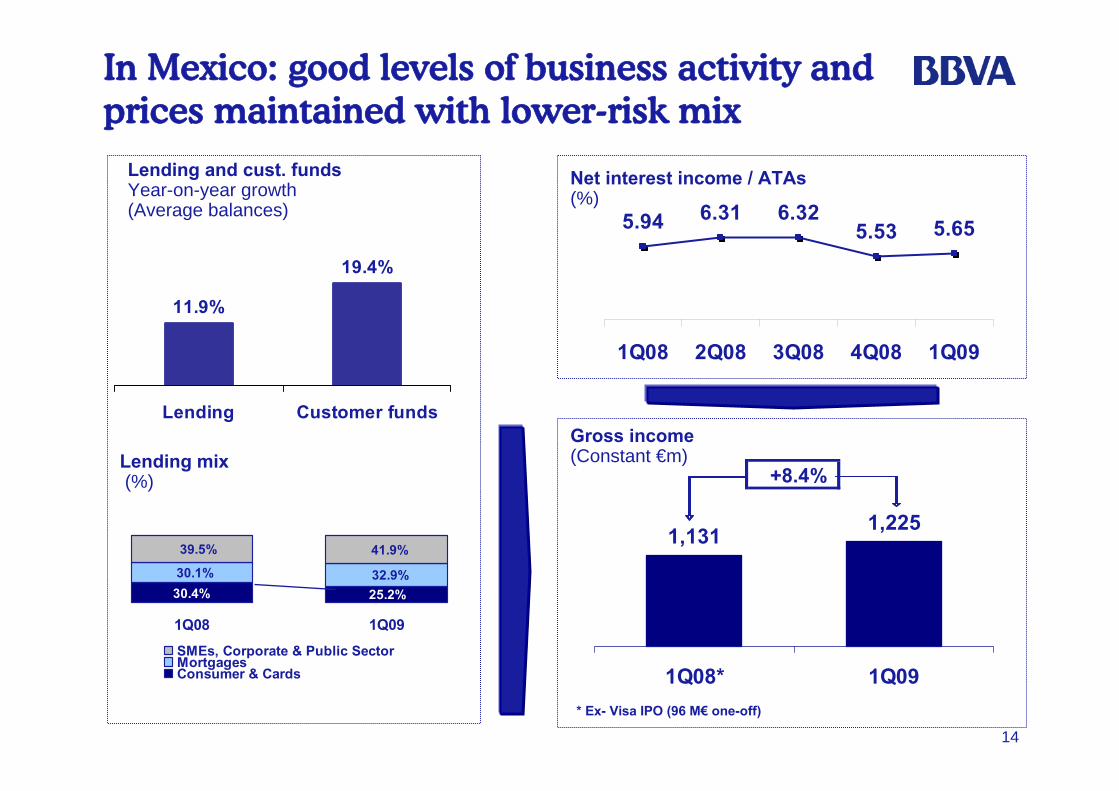
5.94 6.31 6.325.53 5.65
1Q08 2Q08 3Q08 4Q08 1Q09
In Mexico: good levels of business activity and prices maintained with lower-risk mix
Lending and cust. fundsYear-on-year growth(Average balances)
Gross income(Constant €m)
Net interest income / ATAs(%)
Lending mix(%)
25.2%30.4%30.1% 32.9%
39.5% 41.9%
1Q08 1Q09SMEs, Corporate & Public SectorMortgagesConsumer & Cards
11.9%
19.4%
Lending Customer funds
1,131 1,225
1Q08* 1Q09* Ex- Visa IPO (96 M€ one-off)
+8.4%
15
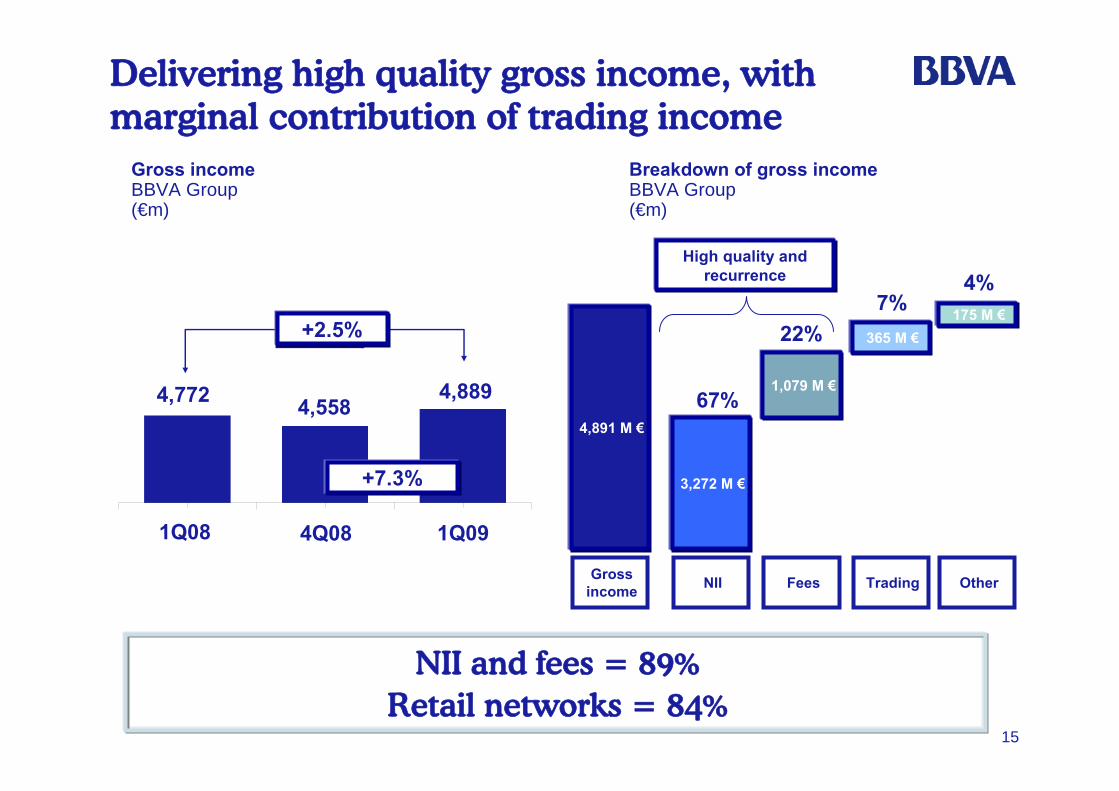
Delivering high quality gross income, with marginal contribution of trading income
NII and fees = 89%Retail networks = 84%
+2,5%
4.772 4.5584.889
1T08 4T08 1T09
+7.3%
4,891 M €
Gross income
3,272 M €
1,079 M €
365 M €175 M €
NII Fees Trading Other
67%
22%7%
4%High quality and
recurrence
Gross incomeBBVA Group(€m)
Breakdown of gross incomeBBVA Group(€m)
4,8894,5584,772
+2.5%
1Q094Q081Q08
16
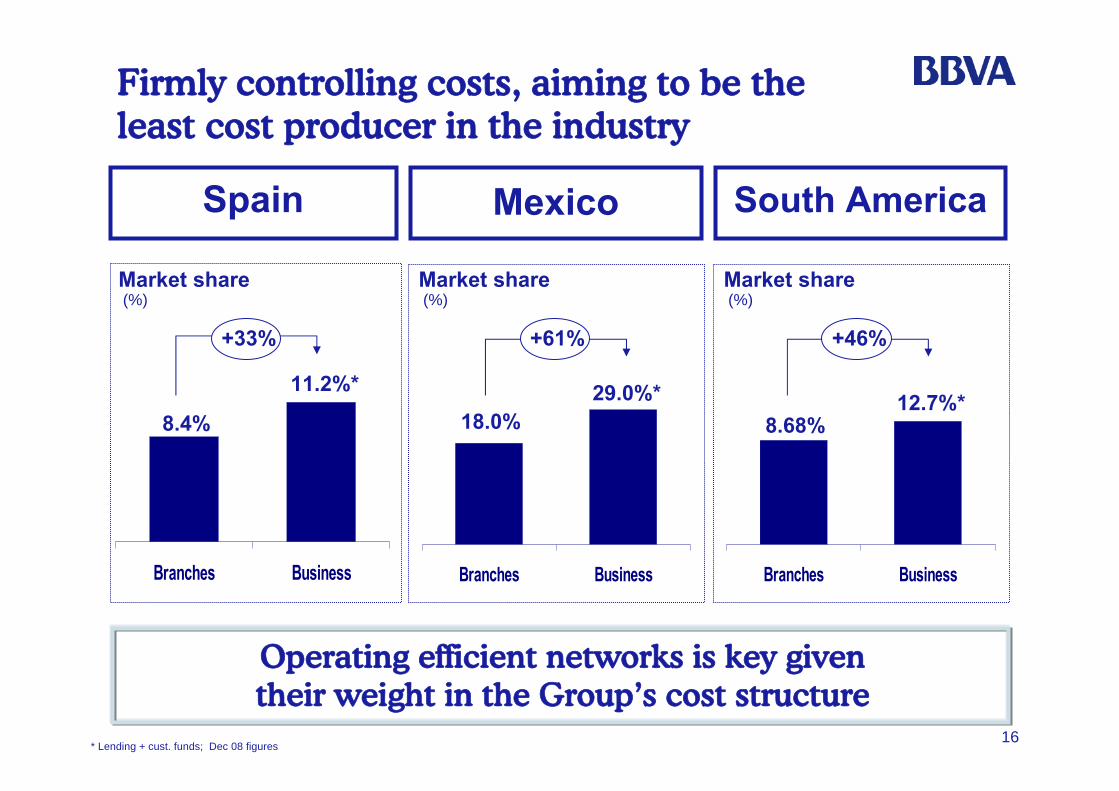
Firmly controlling costs, aiming to be the least cost producer in the industry
Branches Business
Spain Mexico South America
8.4%
11.2%*
Market share (%)
Branches Business
18.0%29.0%*
Branches Business
8.68%12.7%*
* Lending + cust. funds; Dec 08 figures
+33% +61% +46%
Market share (%)
Market share (%)
Operating efficient networks is key given their weight in the Group’s cost structure
17
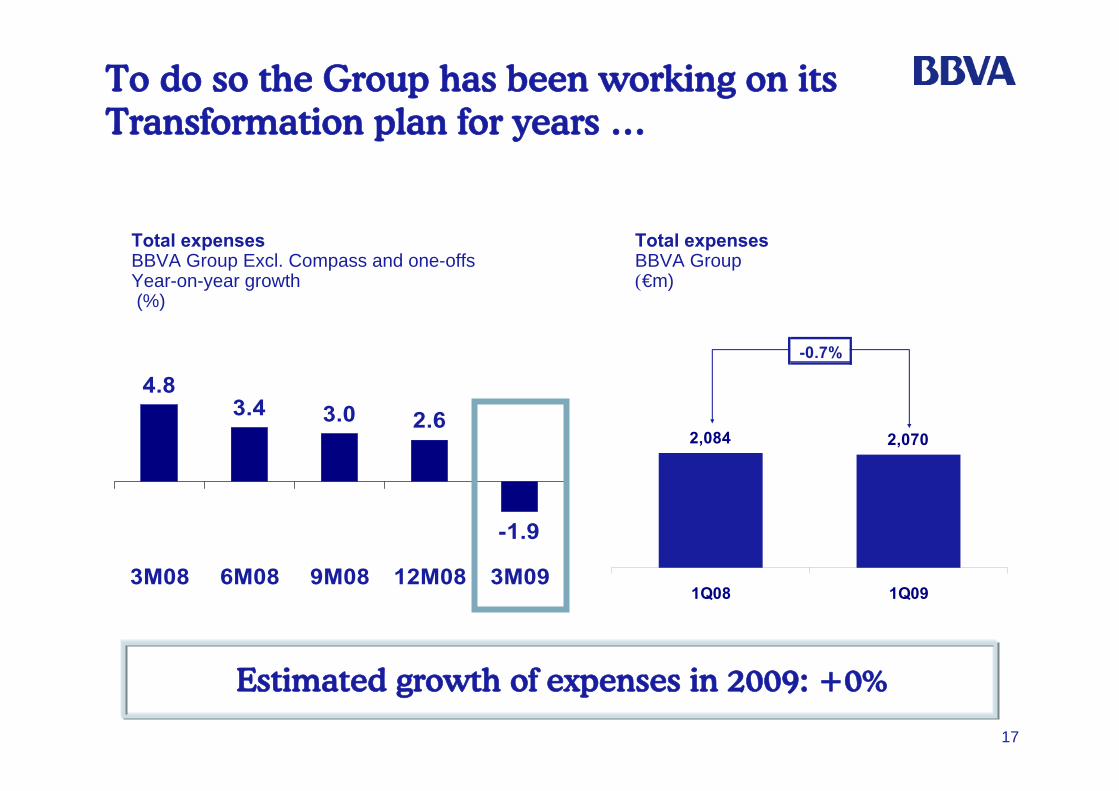
Estimated growth of expenses in 2009: +0%
Total expensesBBVA Group Excl. Compass and one-offsYear-on-year growth(%)
4.83.4 3.0 2.6
-1.9
3M08 6M08 9M08 12M08 3M09
To do so the Group has been working on its Transformation plan for years …
Total expensesBBVA Group(€m)
-0.7%
2,084 2,070
1Q08 1Q09
18
363 384 377 379 339
1Q08 2Q08 3Q08 4Q08 1Q09
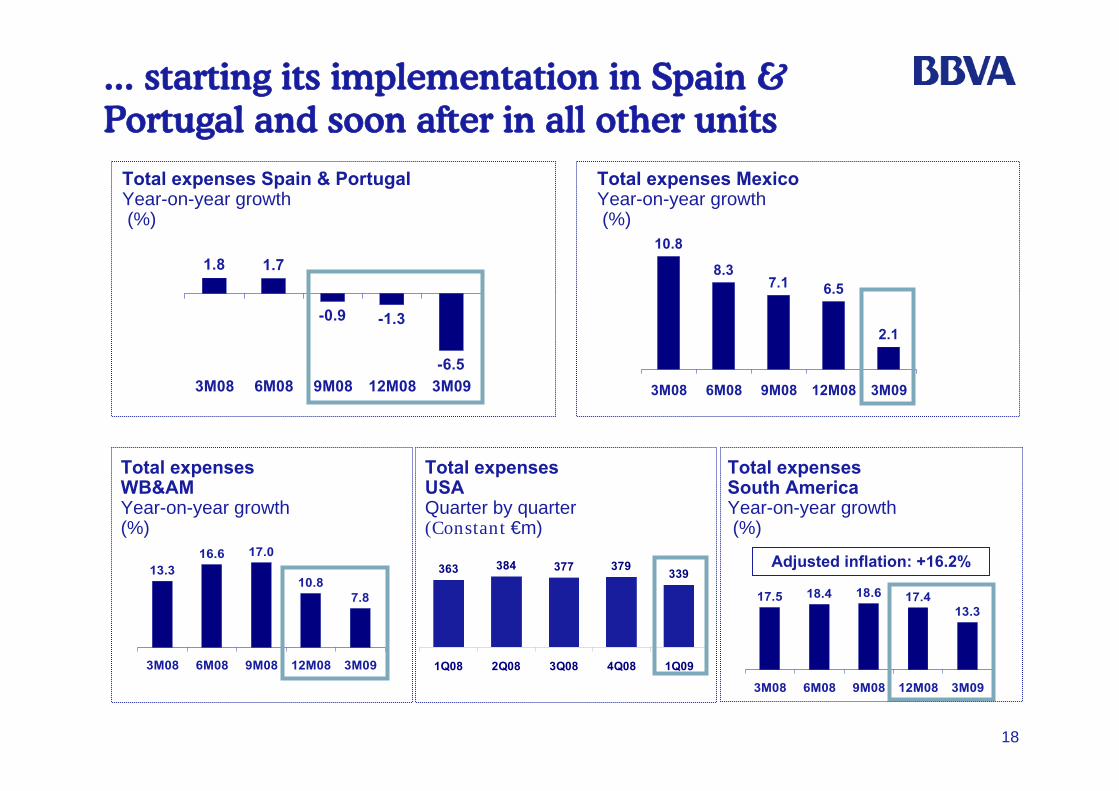
... starting its implementation in Spain & Portugal and soon after in all other units
10.8
8.37.1 6.5
2.1
3M08 6M08 9M08 12M08 3M09
1.8 1.7
-0.9 -1.3
-6.53M08 6M08 9M08 12M08 3M09
17.5 18.4 18.6 17.413.3
3M08 6M08 9M08 12M08 3M09
13.316.6 17.0
10.87.8
3M08 6M08 9M08 12M08 3M09
Total expenses Spain & PortugalYear-on-year growth(%)
Total expensesSouth AmericaYear-on-year growth(%)
Total expenses USAQuarter by quarter(Constant €m)
Total expensesWB&AMYear-on-year growth(%)
Total expenses MexicoYear-on-year growth(%)
Adjusted inflation: +16.2%
19
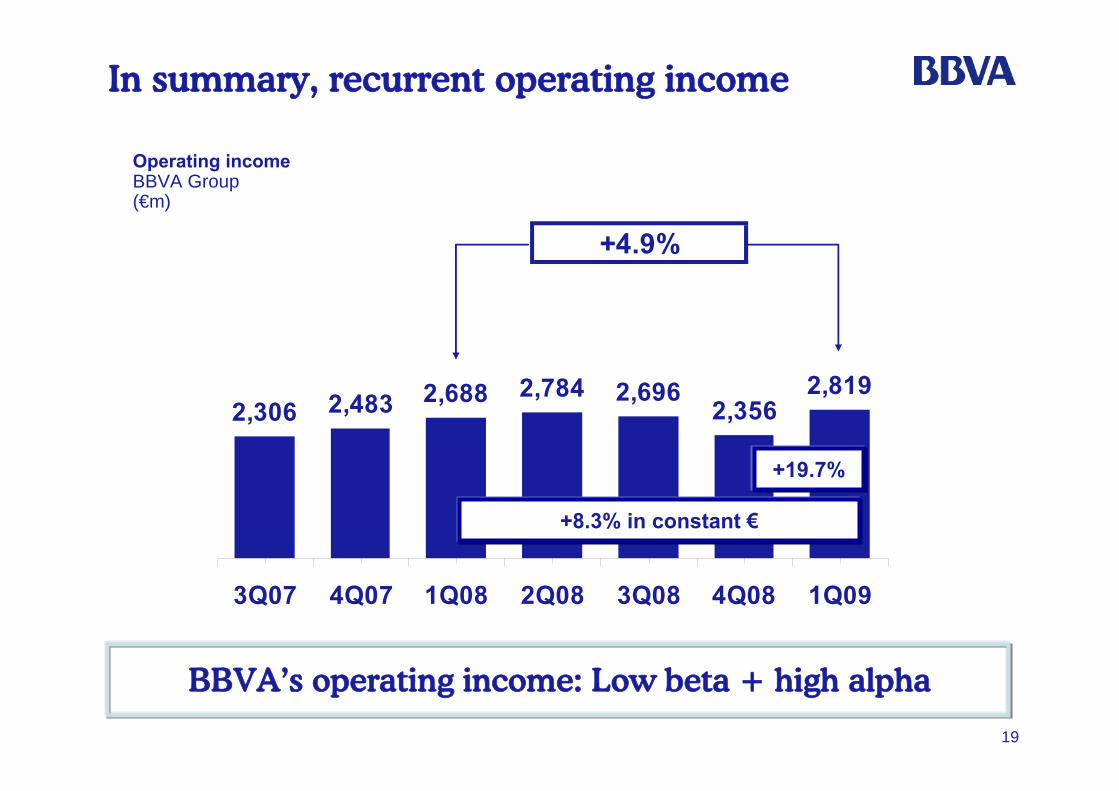
+4.9%
2,306 2,483 2,784 2,6962,356
2,8192,688
3Q07 4Q07 1Q08 2Q08 3Q08 4Q08 1Q09
In summary, recurrent operating income
Operating incomeBBVA Group(€m)
BBVA’s operating income: Low beta + high alpha
+8.3% in constant €
+19.7%
20
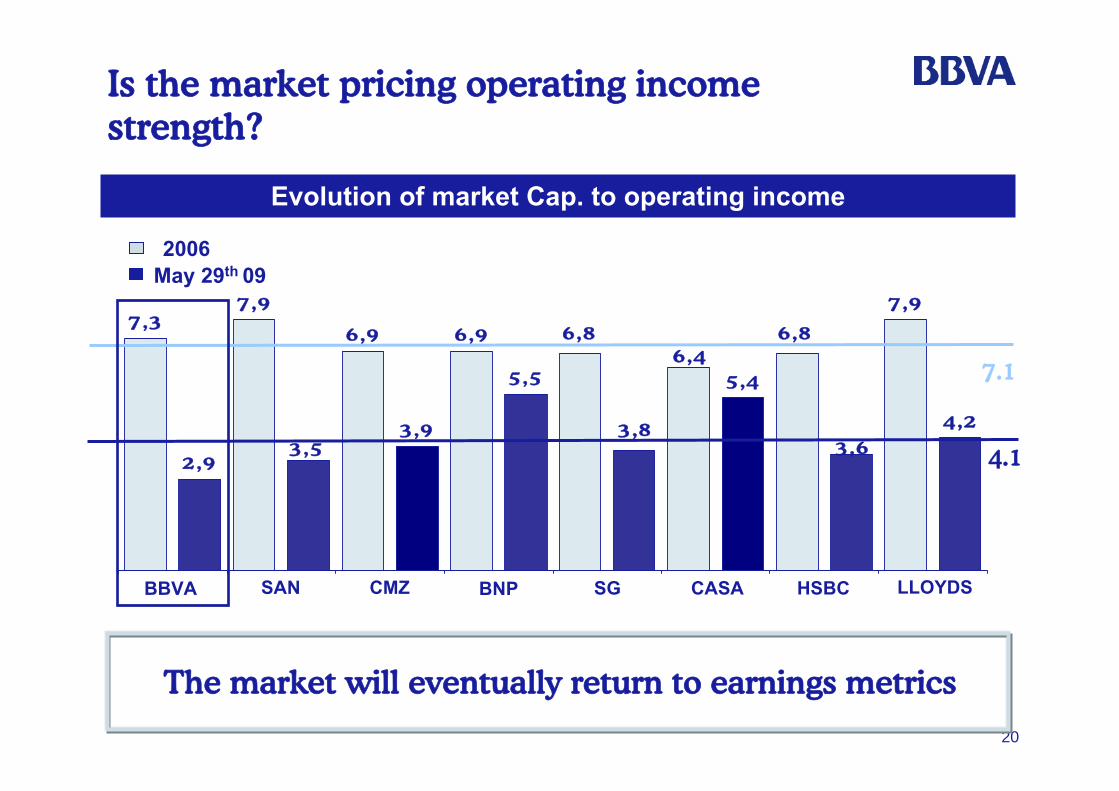
Is the market pricing operating income strength?
7,3
2,9
7,9
6,9
3,9
6,9
5,5 5,4
7,9
4,2
6,8 6,86,4
3,83,63,5
BBVA CMZ BNP SG CASA HSBC LLOYDSSAN
2006May 29th 09
4.1
7.1
Evolution of market Cap. to operating income
The market will eventually return to earnings metrics
21
Recurrent and high quality operating income
1
Improving asset quality trends
3 Strong profitability and organic capital generation
2
4
Outstanding earnings performance through the crisis
5 Conclusions
22
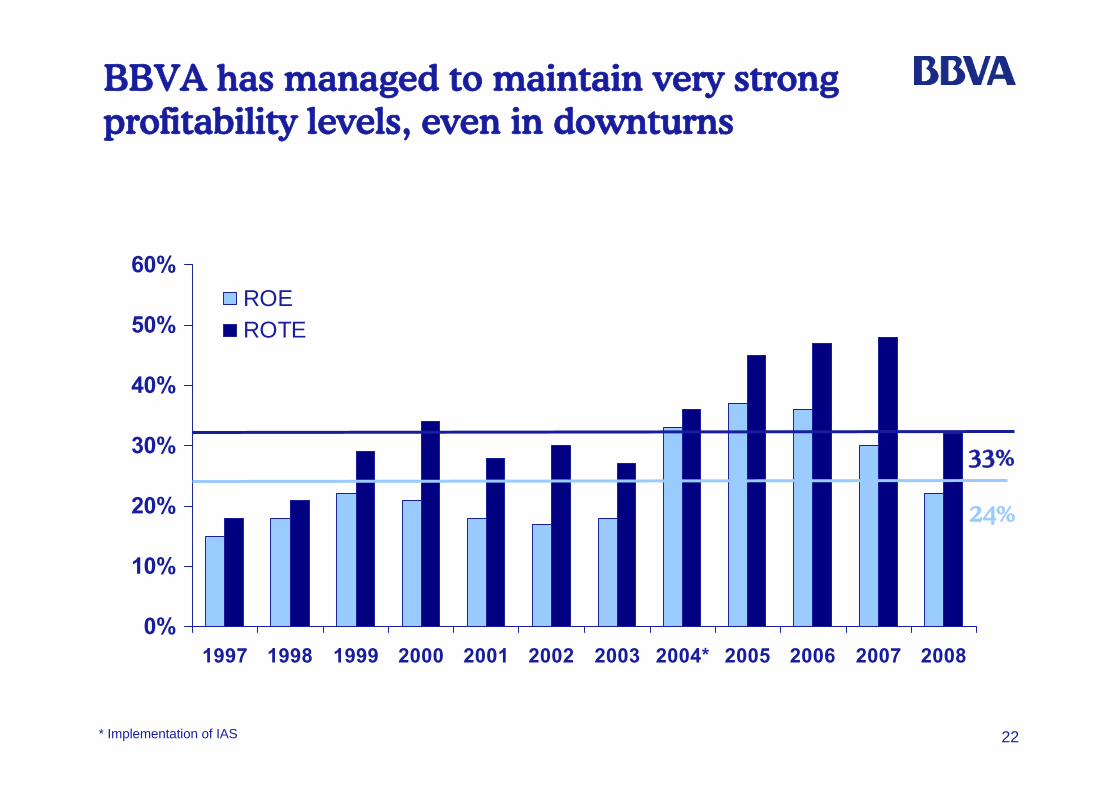
0%
10%
20%
30%
40%
50%
60%
1997 1998 1999 2000 2001 2002 2003 2004* 2005 2006 2007 2008
ROEROTE
BBVA has managed to maintain very strong profitability levels, even in downturns
* Implementation of IAS
33%
24%
23
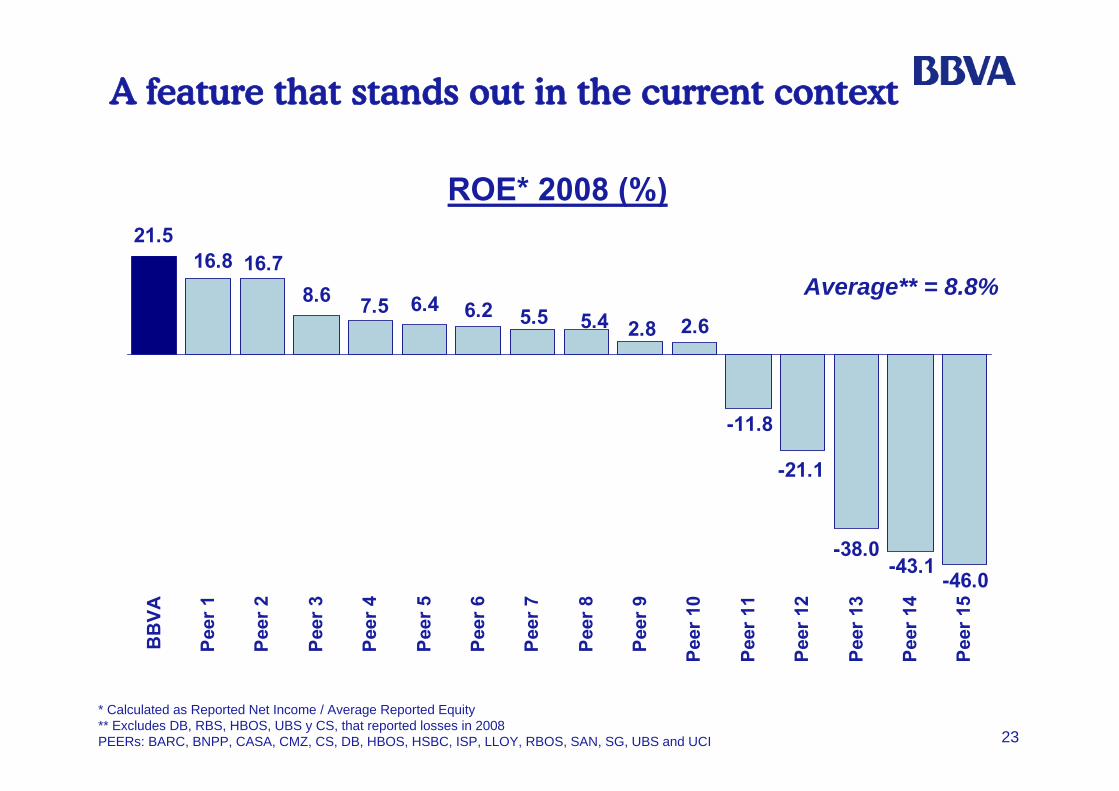
8.6 6.4
-11.8
21.516.8
7.5 6.2 5.45.5
-21.1
-38.0
16.7
2.62.8
-46.0-43.1
BB
VA
Peer
1
Peer
2
Peer
3
Peer
4
Peer
5
Peer
6
Peer
7
Peer
8
Peer
9
Peer
10
Peer
11
Peer
12
Peer
13
Peer
14
Peer
15
ROE* 2008 (%)
Average** = 8.8%
* Calculated as Reported Net Income / Average Reported Equity** Excludes DB, RBS, HBOS, UBS y CS, that reported losses in 2008PEERs: BARC, BNPP, CASA, CMZ, CS, DB, HBOS, HSBC, ISP, LLOY, RBOS, SAN, SG, UBS and UCI
A feature that stands out in the current context
24
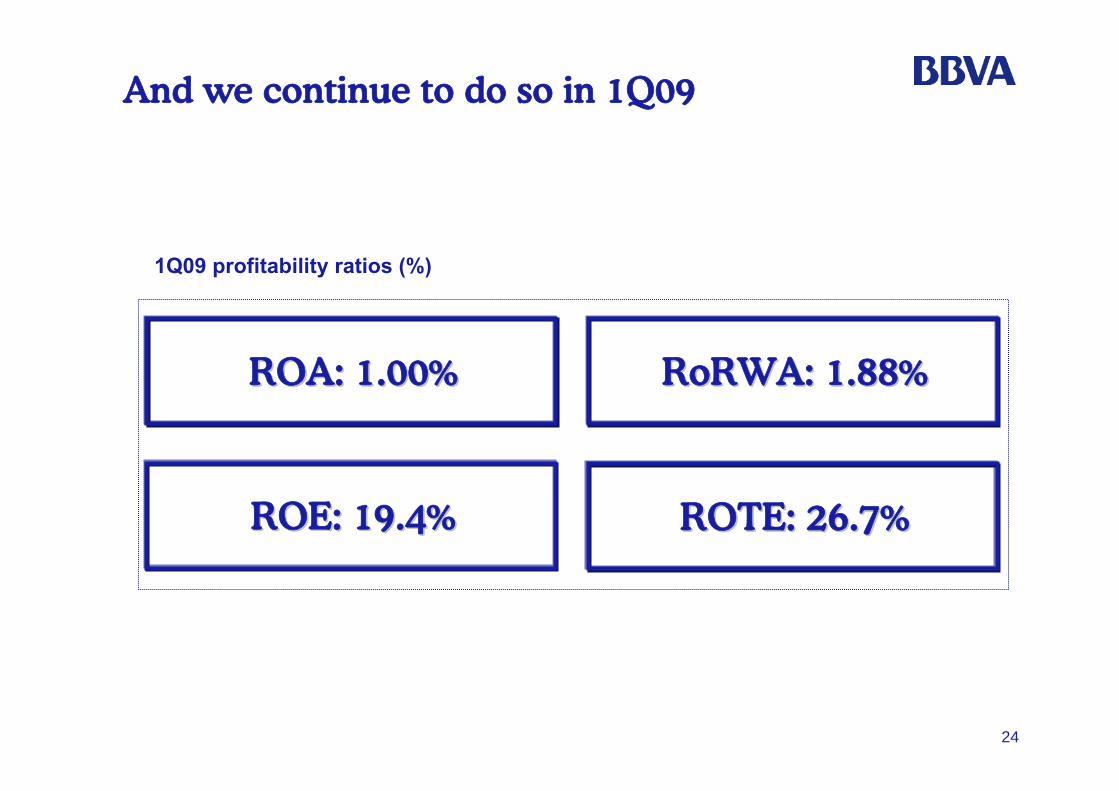
And we continue to do so in 1Q09
1Q09 profitability ratios (%)
RoRWARoRWA: 1.88%: 1.88%
ROE: 19.4%ROE: 19.4%
ROA: 1.00%ROA: 1.00%
ROTE: 26.7%ROTE: 26.7%
25
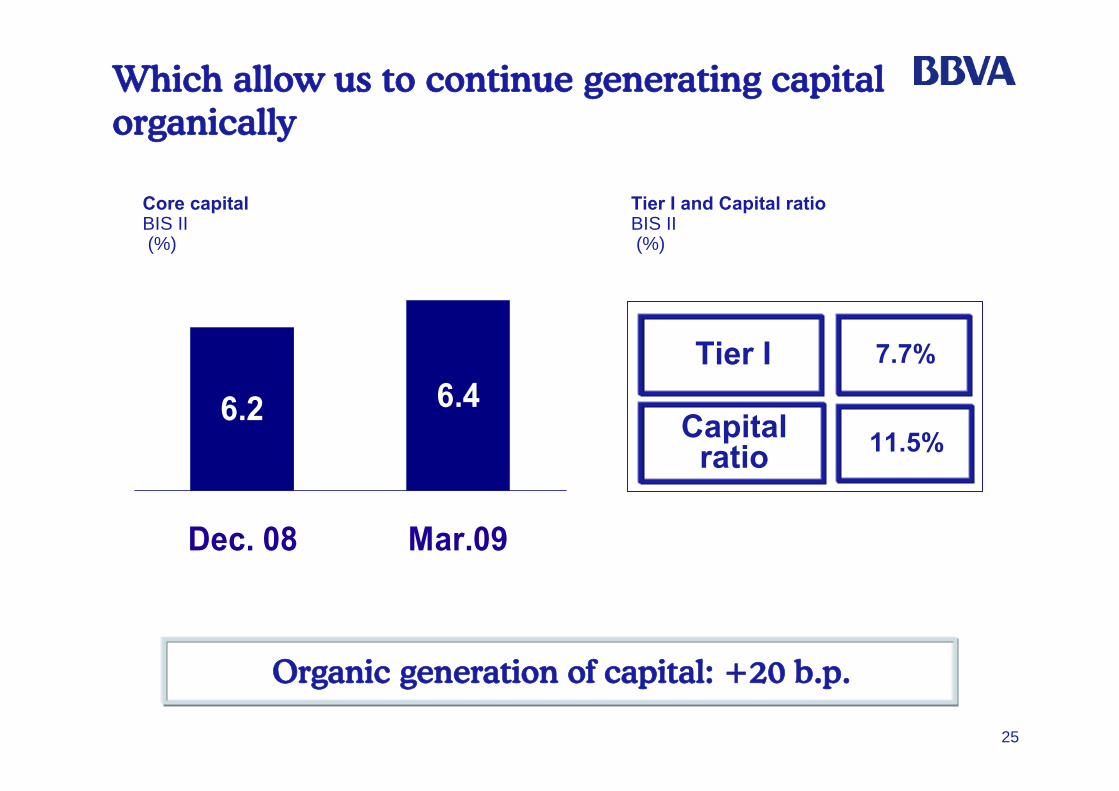
Which allow us to continue generating capital organically
Core capitalBIS II (%)
6.2 6.4
Dec. 08 Mar.09
Tier I and Capital ratioBIS II(%)
Tier I
Capital ratio
7.7%
11.5%
Organic generation of capital: +20 b.p.
26
Recurrent and high quality operating income
1
Improving asset quality trends
3 Strong profitability and organic capital generation
2
4
Outstanding earnings performance through the crisis
5 Conclusions
27
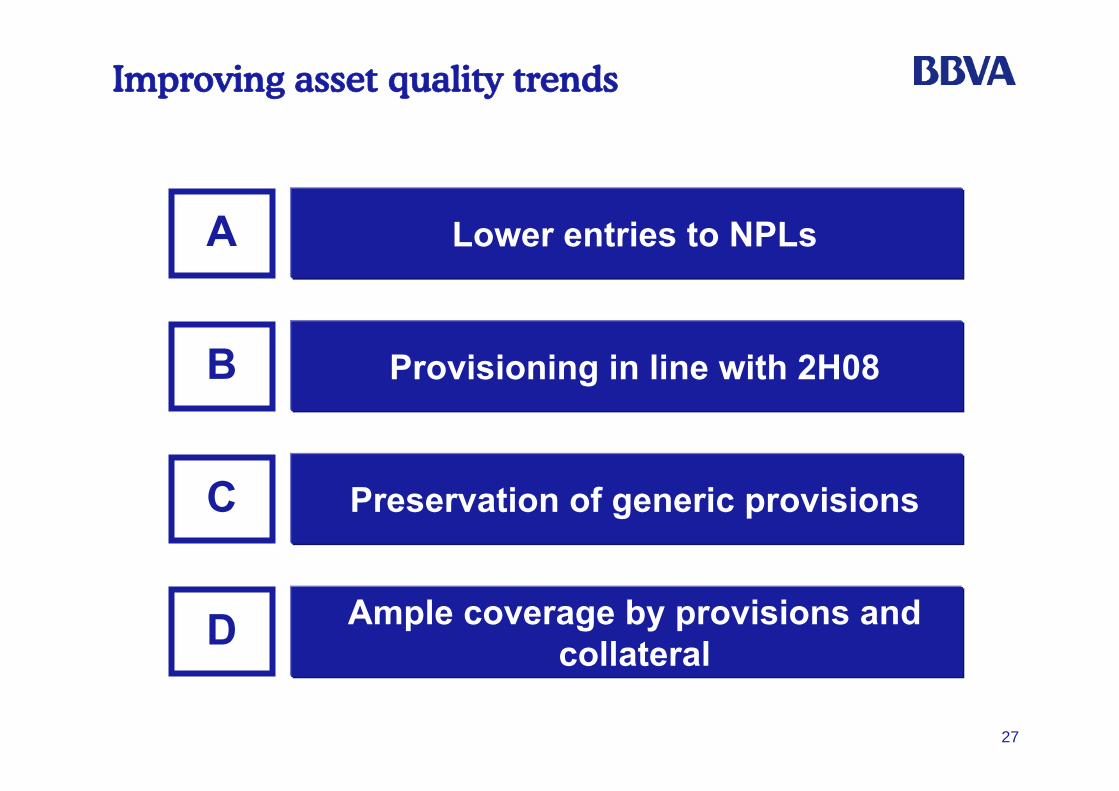
Lower entries to NPLsA
Ample coverage by provisions and collateralD
Preservation of generic provisionsC
Provisioning in line with 2H08B
Improving asset quality trends
28
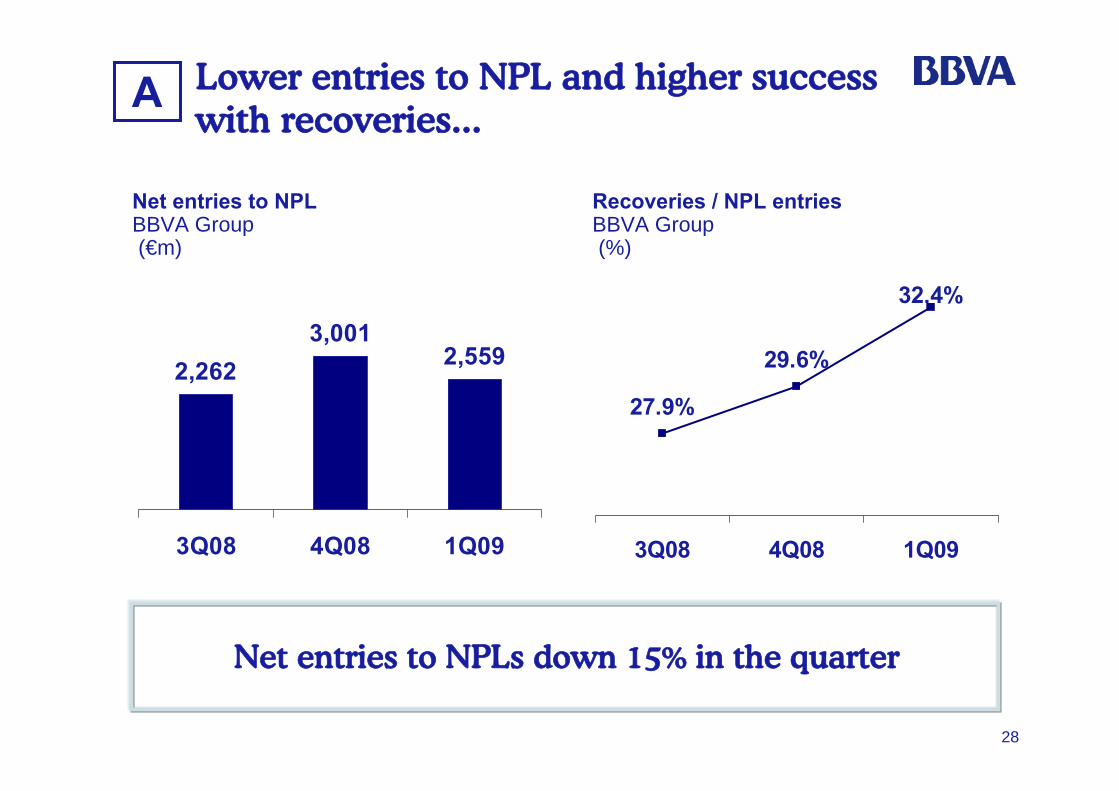
Lower entries to NPL and higher success with recoveries...
2,2623,001
2,559
3Q08 4Q08 1Q09
Net entries to NPL BBVA Group(€m)
Net entries to NPLs down 15% in the quarter
Recoveries / NPL entries BBVA Group(%)
27.9%
29.6%
32.4%
3Q08 4Q08 1Q09
A
29
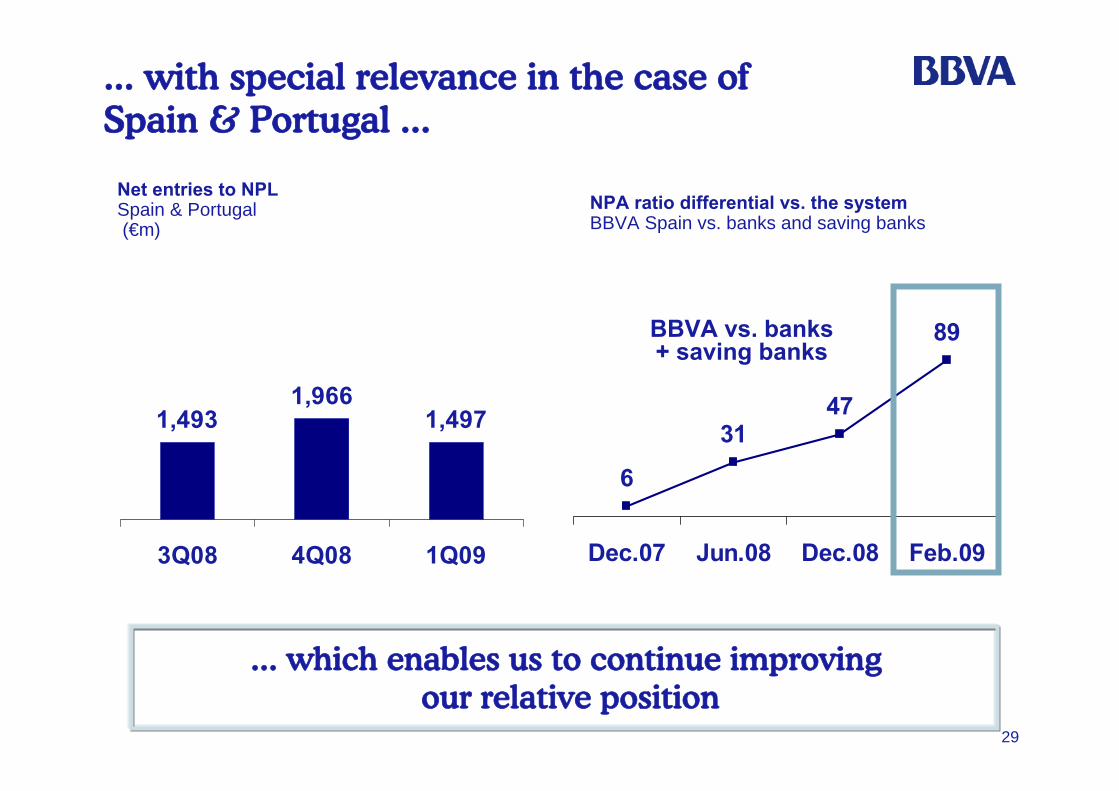
89
4731
6
Dec.07 Jun.08 Dec.08 Feb.09
... with special relevance in the case of Spain & Portugal ...
Net entries to NPLSpain & Portugal(€m)
... which enables us to continue improvingour relative position
NPA ratio differential vs. the system BBVA Spain vs. banks and saving banks
BBVA vs. banks + saving banks
1,4931,966
1,497
3Q08 4Q08 1Q09
30
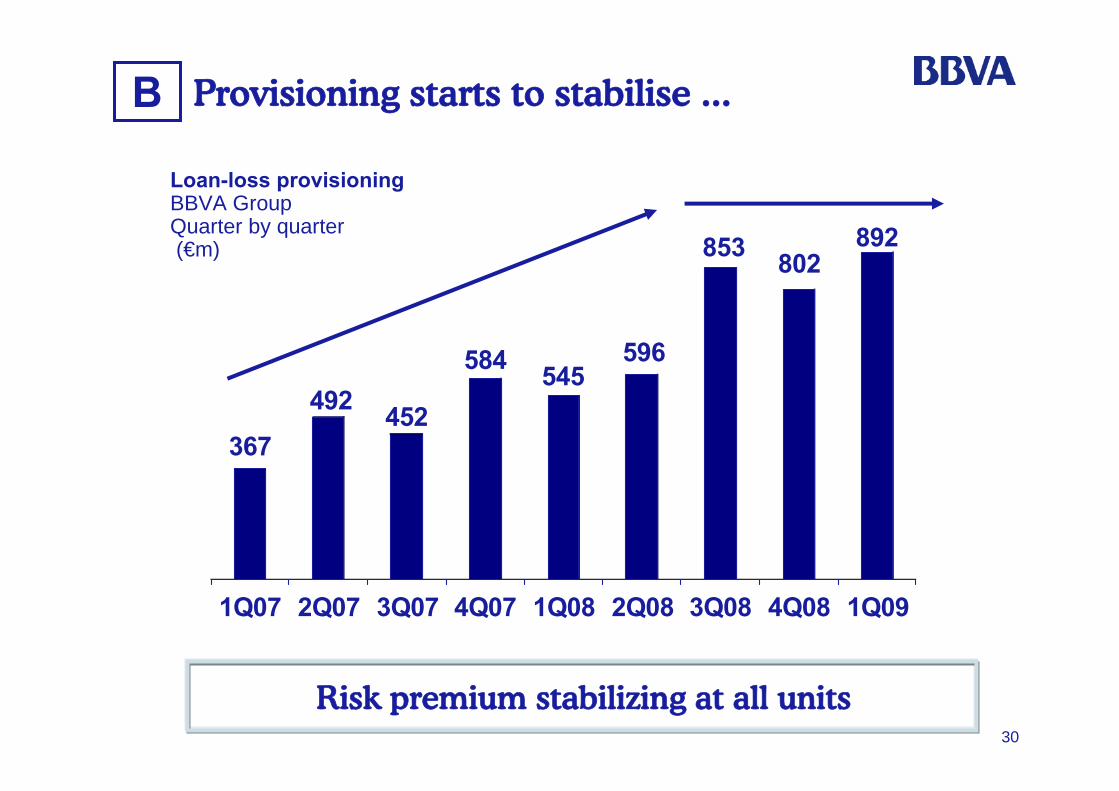
367
492 452
584 545596
853 802892
1Q07 2Q07 3Q07 4Q07 1Q08 2Q08 3Q08 4Q08 1Q09
Provisioning starts to stabilise ...B
Loan-loss provisioningBBVA GroupQuarter by quarter(€m)
Risk premium stabilizing at all units
31
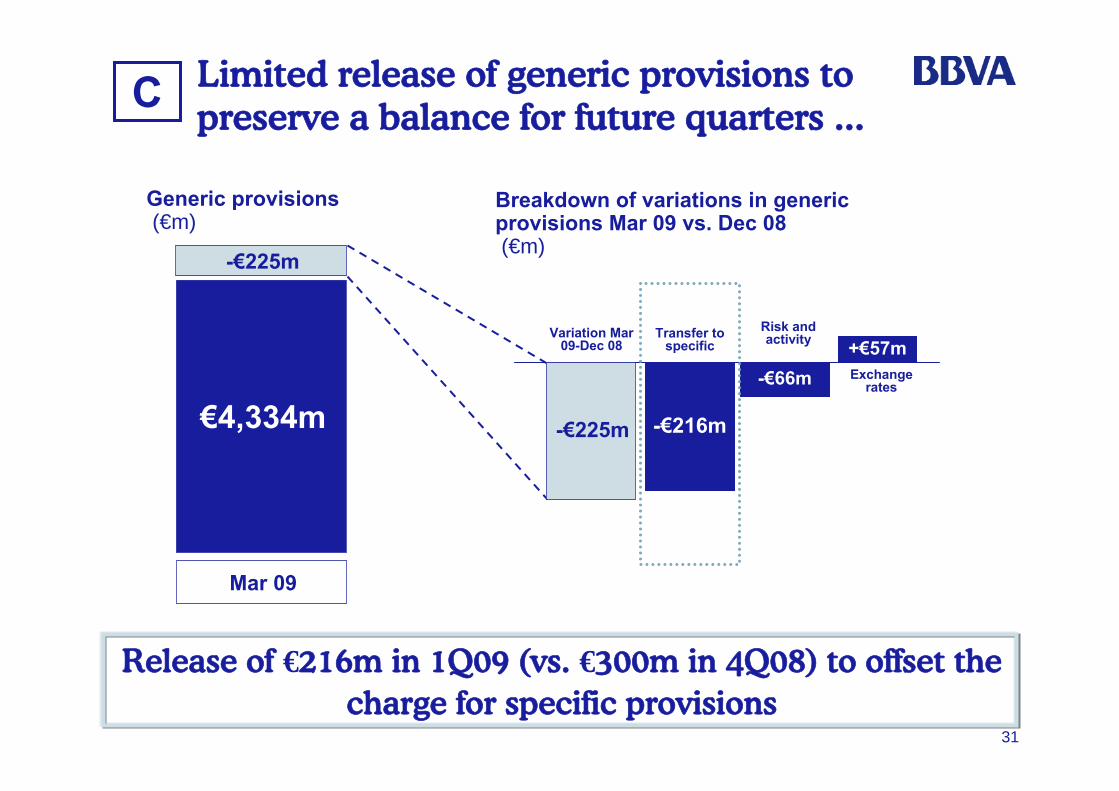
Limited release of generic provisions to preserve a balance for future quarters ...
Release of €216m in 1Q09 (vs. €300m in 4Q08) to offset the charge for specific provisions
Generic provisions(€m)
€4,334m
Mar 09
-€225m
-€225m -€216m
-€66m+€57m
Transfer to specific
Risk and activity
Exchange rates
Variation Mar 09-Dec 08
Breakdown of variations in generic provisions Mar 09 vs. Dec 08(€m)
C
32
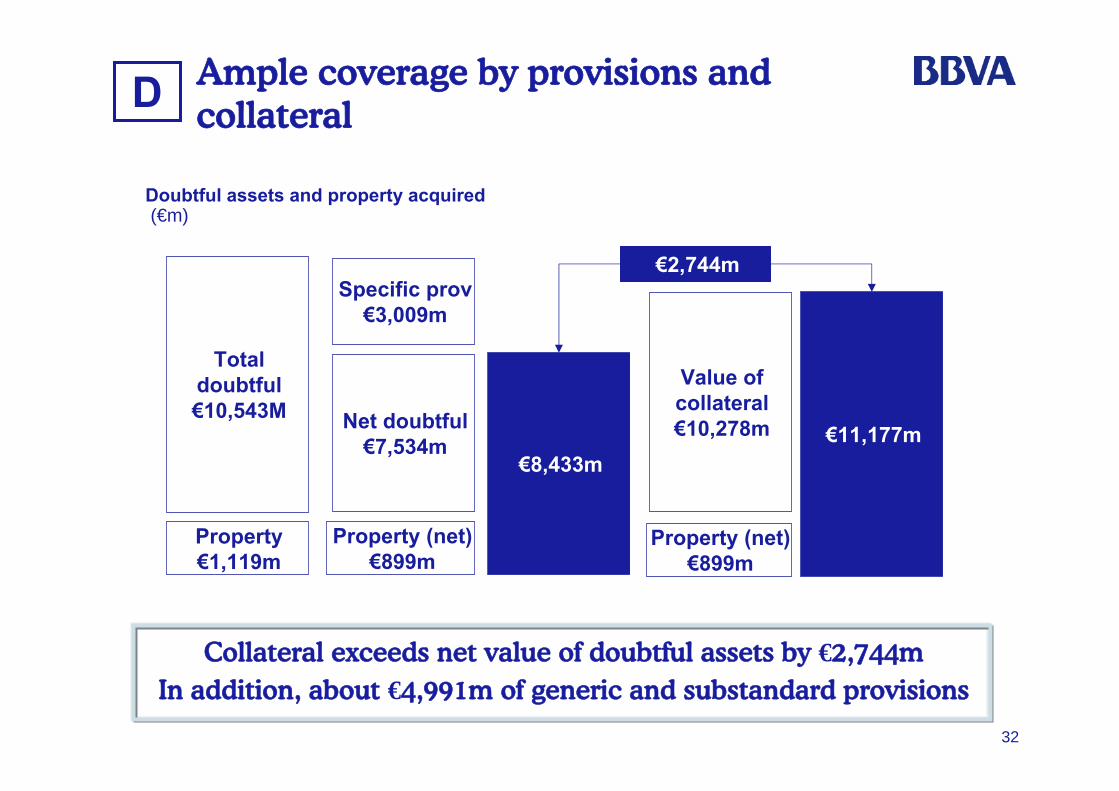
Ample coverage by provisions and collateral
Collateral exceeds net value of doubtful assets by €2,744mIn addition, about €4,991m of generic and substandard provisions
Net doubtful€7,534m
Specific prov€3,009m
Property (net)€899m
Value of collateral€10,278m
Property (net)€899m
€8,433m€11,177m
€2,744m
Doubtful assets and property acquired(€m)
Total doubtful€10,543M
Property€1,119m
D
33
Recurrent and high quality operating income
1
Improving asset quality trends
3 Strong profitability and organic capital generation
2
4
Outstanding earnings performance through the crisis
5 Conclusions
34
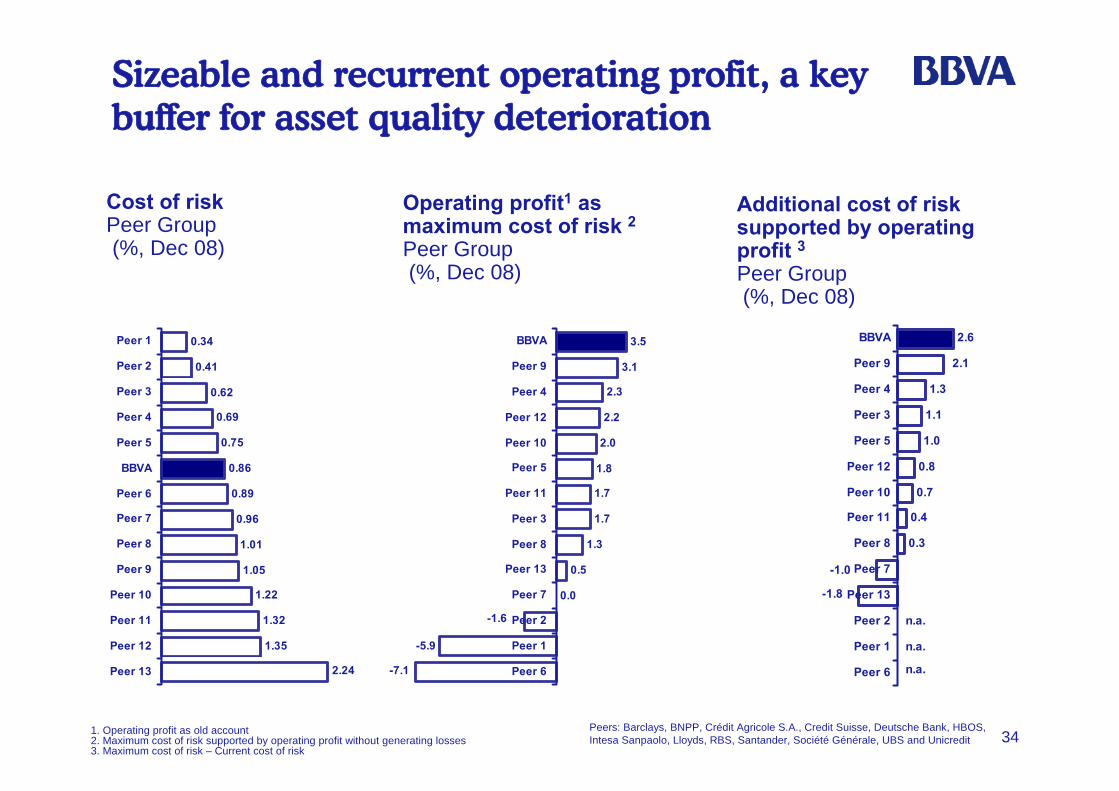
1.3
1.0
0.3
n.a.
-1.8
-1.0
n.a.
n.a.
0.4
0.7
0.8
1.1
2.1
2.6
Peer 6
Peer 1
Peer 2
Peer 13
Peer 7
Peer 8
Peer 11
Peer 10
Peer 12
Peer 5
Peer 3
Peer 4
Peer 9
BBVA
Additional cost of risk supported by operating profit 3Peer Group(%, Dec 08)
Cost of riskPeer Group(%, Dec 08)
3.5
3.1
2.2
1.8
1.7
1.7
-5.9
-7.1
0.5
0.0
-1.6
1.3
2.0
2.3
Peer 6
Peer 1
Peer 2
Peer 7
Peer 13
Peer 8
Peer 3
Peer 11
Peer 5
Peer 10
Peer 12
Peer 4
Peer 9
BBVA
Operating profit1 as maximum cost of risk 2Peer Group(%, Dec 08)
Sizeable and recurrent operating profit, a key buffer for asset quality deterioration
0.34
0.41
0.69
0.86
0.89
0.96
1.35
2.24
1.05
1.22
1.32
1.01
0.75
0.62
Peer 13
Peer 12
Peer 11
Peer 10
Peer 9
Peer 8
Peer 7
Peer 6
BBVA
Peer 5
Peer 4
Peer 3
Peer 2
Peer 1
1. Operating profit as old account2. Maximum cost of risk supported by operating profit without generating losses3. Maximum cost of risk – Current cost of risk
Peers: Barclays, BNPP, Crédit Agricole S.A., Credit Suisse, Deutsche Bank, HBOS, Intesa Sanpaolo, Lloyds, RBS, Santander, Société Générale, UBS and Unicredit
35
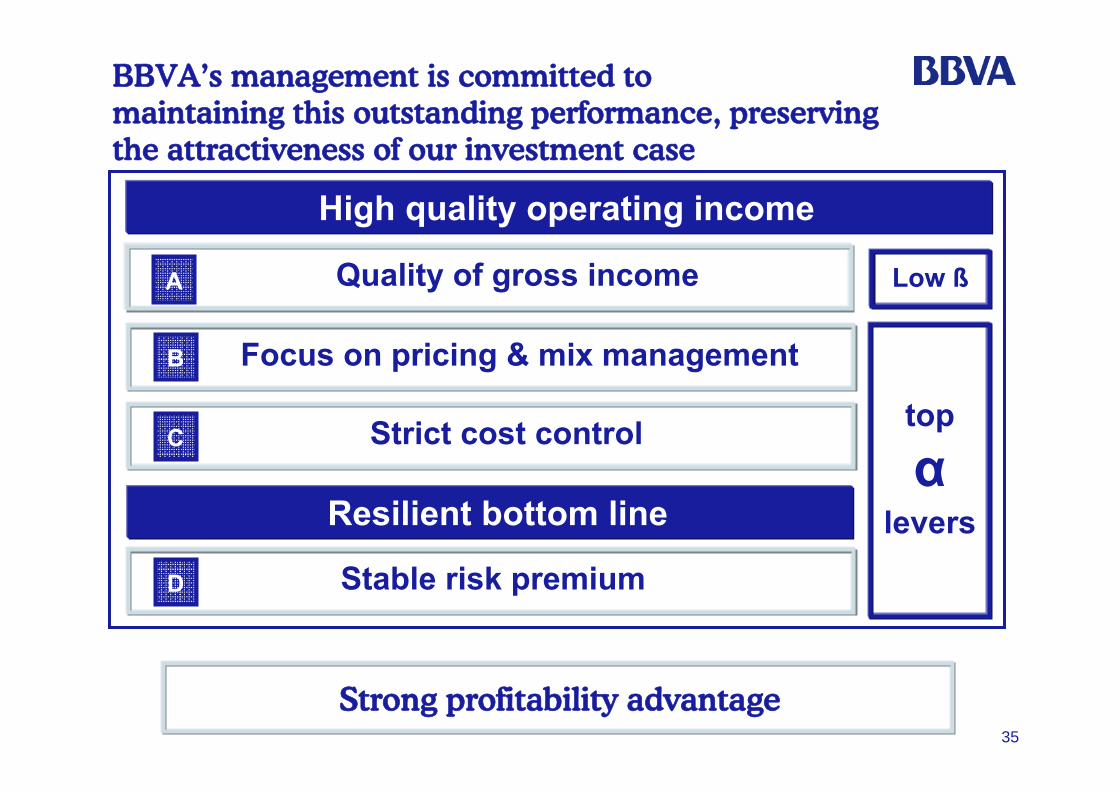
High quality operating income
Focus on pricing & mix managementB
Strict cost controlC
Stable risk premiumD
Quality of gross incomeA
top
αlevers
Low ß
Resilient bottom line
BBVA’s management is committed to maintaining this outstanding performance, preserving the attractiveness of our investment case
Strong profitability advantage

Frankfurt, June 5th 2009
Goldman Sachs European Financials Conference
BBVA, recurrent and sustainable earnings
Panel 7. Back to basics: how can retail banking offer superior returns?