Goldman Sachs European Financials Conference 2007 · Goldman Sachs European Financials Conference...
21
Goldman Sachs – European Financials Conference 2007 Lisbon June 14, 2007 Renato Fassbind Chief Financial Officer
Transcript of Goldman Sachs European Financials Conference 2007 · Goldman Sachs European Financials Conference...
Goldman Sachs –European FinancialsConference 2007
LisbonJune 14, 2007
Renato FassbindChief Financial Officer
Goldman Sachs European Financials Conference 2007Slide 2
Cautionary statement
Cautionary statement regarding forward-looking and non-GAAP information
This presentation contains forward-looking statements within the meaning of the Private Securities Litigation Reform Act of 1995.
Forward-looking statements involve inherent risks and uncertainties, and we might not be able to achieve the predictions, forecasts, projections and other outcomes we describe or imply in forward-looking statements.
A number of important factors could cause results to differ materially from the plans, objectives, expectations, estimates and intentions we express in these forward-looking statements, including those we identify in "Risk Factors" in our Annual Report on Form 20-F for the fiscal year ended December 31, 2006 filed with the US Securities and Exchange Commission, and in other public filings and press releases.
We do not intend to update these forward-looking statements except as may be required by applicable laws.
This presentation contains non-GAAP financial information. Information needed to reconcile such non-GAAP financial information to the most directly comparable measures under GAAP can be found in Credit Suisse Group's first quarter report 2007.
Goldman Sachs European Financials Conference 2007Slide 3
Agenda
Improving Operating Performance
Platform for Growth
Managing Risk and Capital
Goldman Sachs European Financials Conference 2007Slide 4
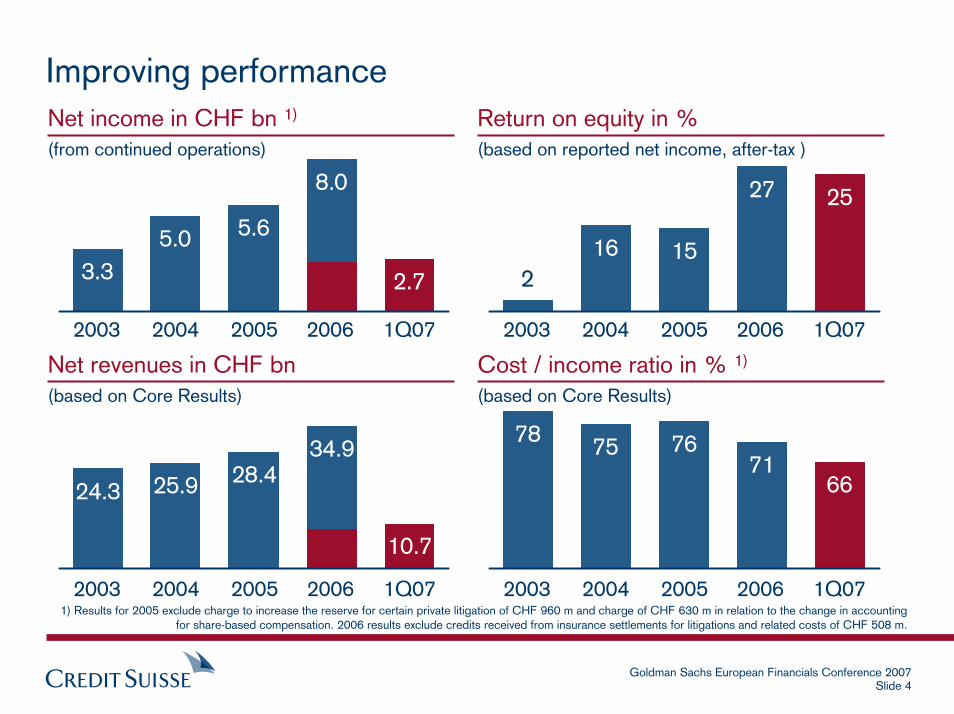
2.73.35.0
8.0
5.6
10.7
24.3 25.9
34.928.4
Improving performance
2003 2004 2005 2006
78 75 7671
66
Cost / income ratio in % 1)
(based on Core Results)
Net revenues in CHF bn(based on Core Results)
1) Results for 2005 exclude charge to increase the reserve for certain private litigation of CHF 960 m and charge of CHF 630 m in relation to the change in accounting for share-based compensation. 2006 results exclude credits received from insurance settlements for litigations and related costs of CHF 508 m.
16 15
27 25
2
Return on equity in %(based on reported net income, after-tax )
Net income in CHF bn 1)
(from continued operations)
1Q07 2003 2004 2005 2006 1Q07
2003 2004 2005 2006 1Q07 2003 2004 2005 2006 1Q07
Goldman Sachs European Financials Conference 2007Slide 5
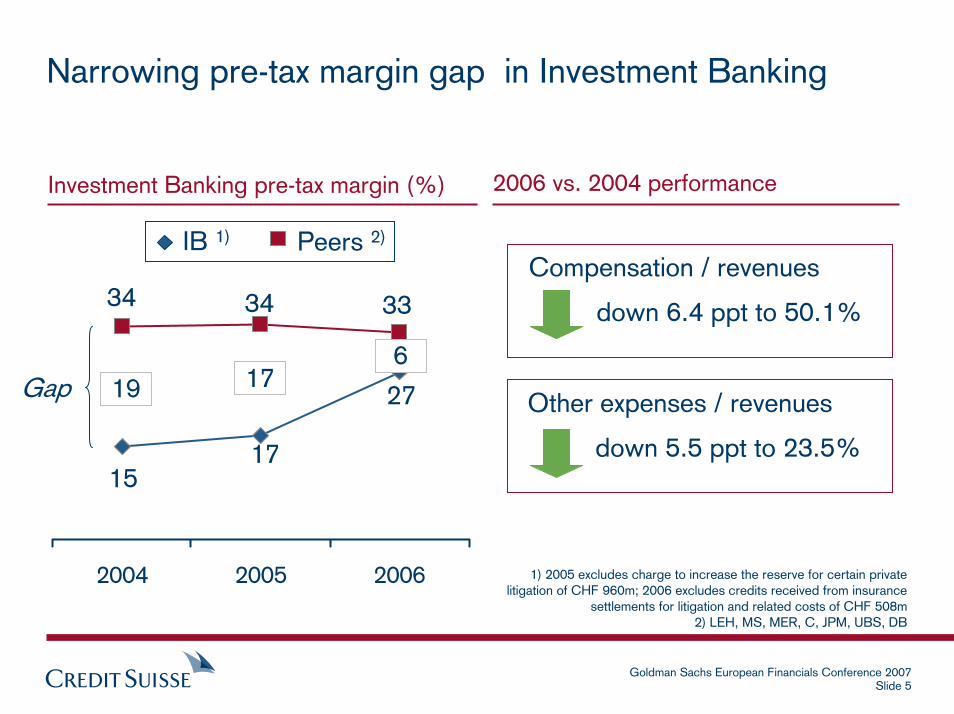
1) 2005 excludes charge to increase the reserve for certain private litigation of CHF 960m; 2006 excludes credits received from insurance
settlements for litigation and related costs of CHF 508m2) LEH, MS, MER, C, JPM, UBS, DB
Narrowing pre-tax margin gap in Investment Banking
Compensation / revenues
down 6.4 ppt to 50.1%
Other expenses / revenues
down 5.5 ppt to 23.5%
Investment Banking pre-tax margin (%) 2006 vs. 2004 performance
2004 2005 2006
1517
27
333434
17Gap 19
IB 1) Peers 2)
6
Goldman Sachs European Financials Conference 2007Slide 6
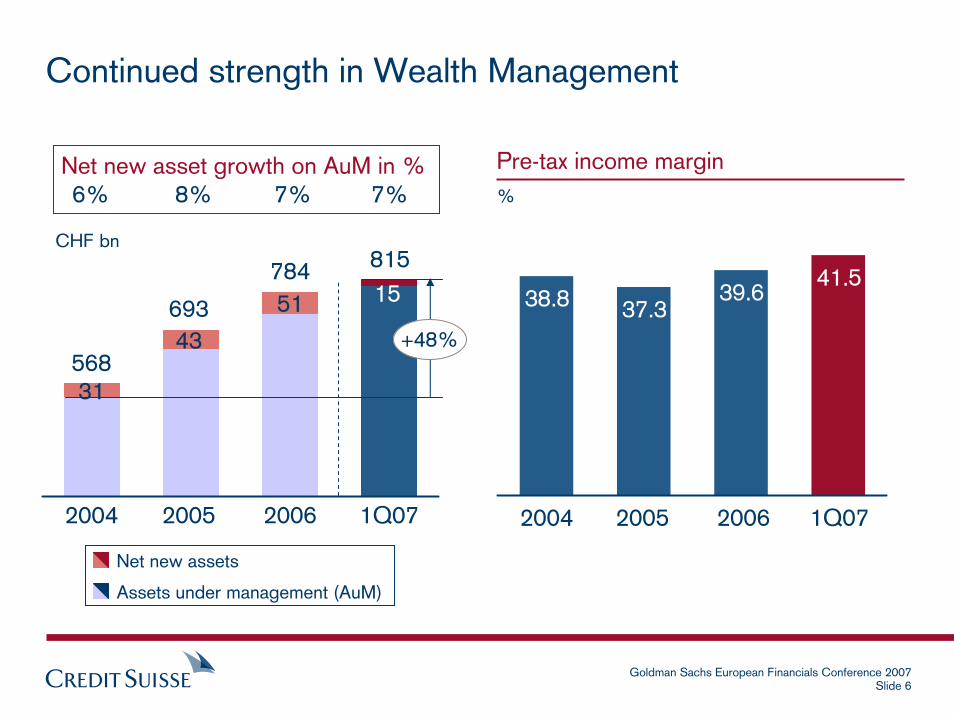
Continued strength in Wealth Management
38.8 37.339.6
41.5
2004 2005 2006 1Q072004 2005 2006 1Q07
31
15
CHF bn
Net new assets
Assets under management (AuM)
Net new asset growth on AuM in %6% 8% 7% 7%
815
568
693
784
43
51
Pre-tax income margin%
+48%
Goldman Sachs European Financials Conference 2007Slide 7
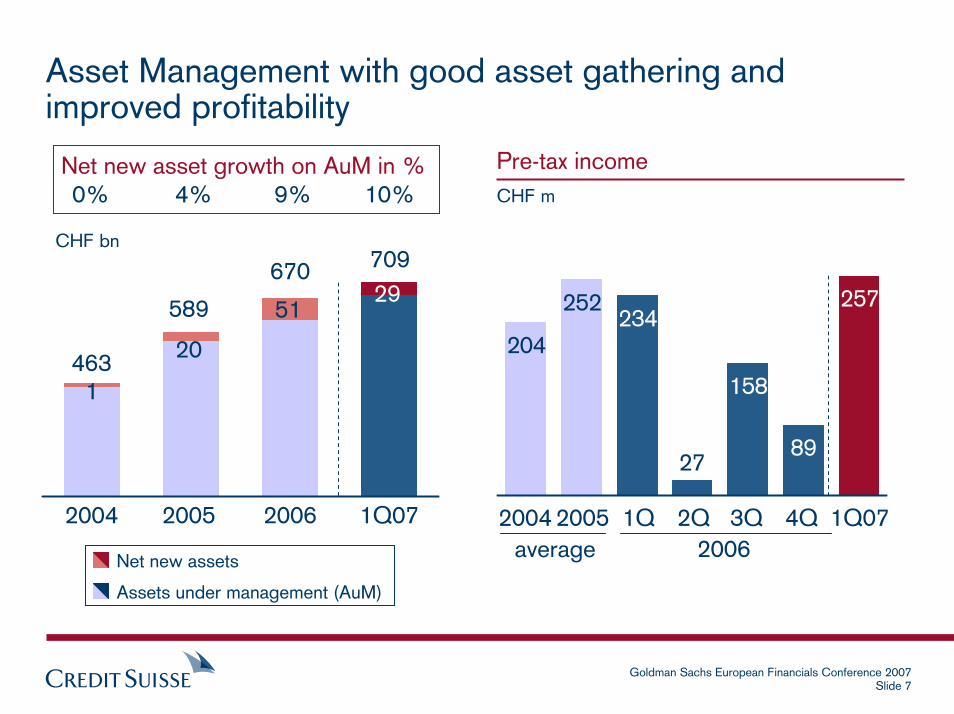
Asset Management with good asset gathering and improved profitability
234
158
89
257
204
252
27
2004 1Q2004 2005 2006 1Q07
1
29
CHF bn
Net new assets
Assets under management (AuM)
Net new asset growth on AuM in %0% 4% 9% 10%
709
463
589
670
20
51
Pre-tax incomeCHF m
2005 2Q 3Q 4Q 1Q072006average
Goldman Sachs European Financials Conference 2007Slide 8
Agenda
Improving Operating Performance
Platform for Growth
Managing Risk and Capital
Goldman Sachs European Financials Conference 2007Slide 9
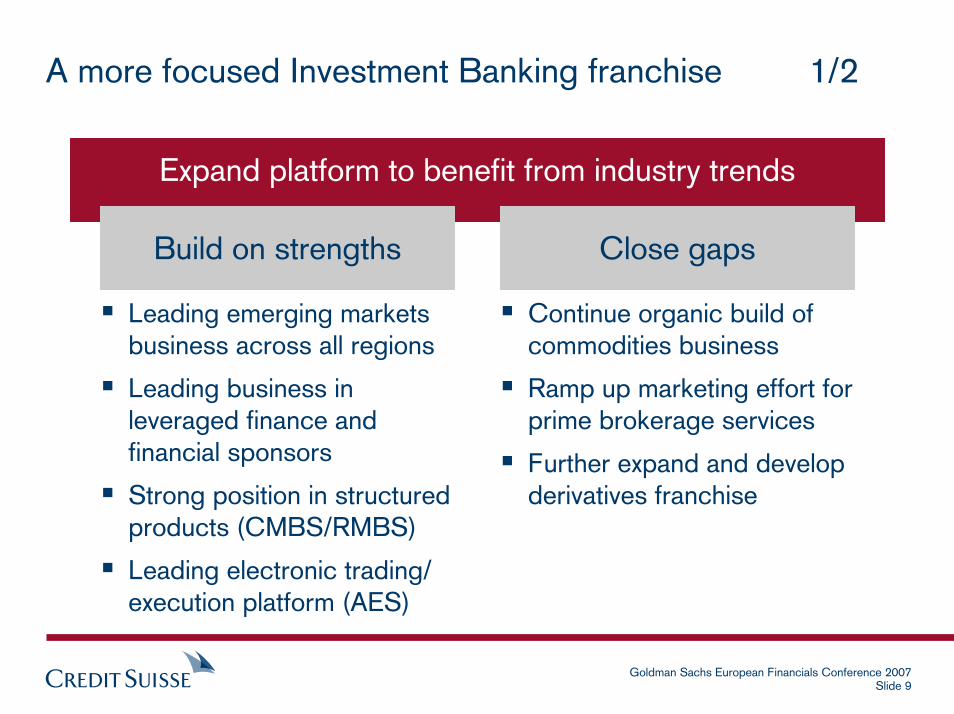
A more focused Investment Banking franchise 1/2
Expand platform to benefit from industry trends
Build on strengths
Leading emerging markets business across all regions
Leading business in leveraged finance and financial sponsors
Strong position in structured products (CMBS/RMBS)
Leading electronic trading/ execution platform (AES)
Close gaps
Continue organic build of commodities business
Ramp up marketing effort for prime brokerage services
Further expand and develop derivatives franchise
Goldman Sachs European Financials Conference 2007Slide 10
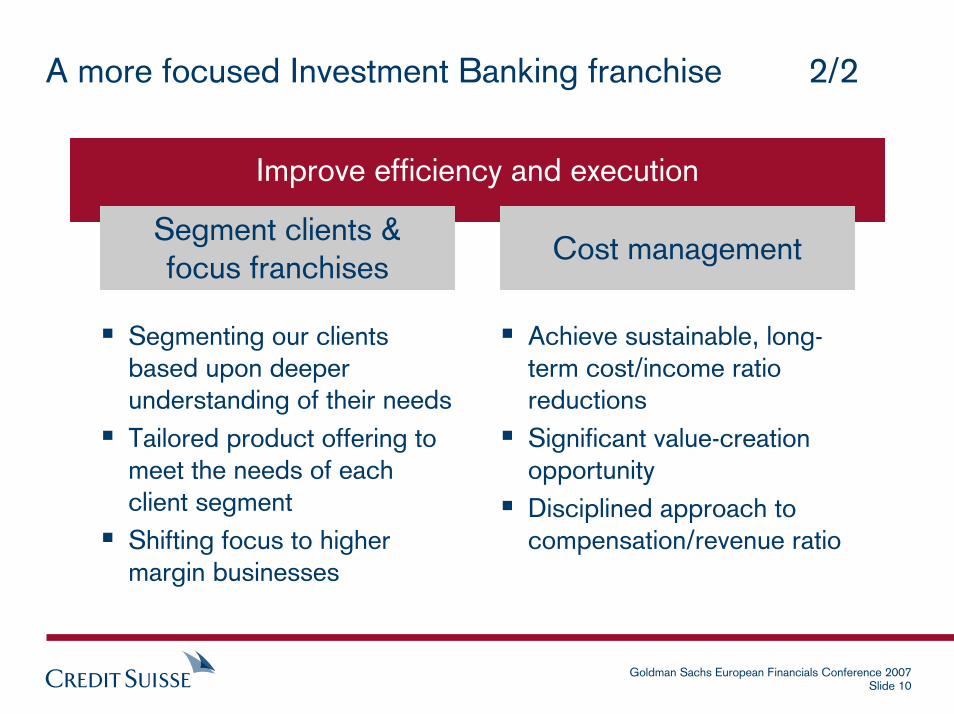
A more focused Investment Banking franchise 2/2
Improve efficiency and execution
Segment clients &focus franchises
Segmenting our clients based upon deeper understanding of their needsTailored product offering to meet the needs of each client segmentShifting focus to higher margin businesses
Cost management
Achieve sustainable, long-term cost/income ratio reductionsSignificant value-creation opportunityDisciplined approach to compensation/revenue ratio
Goldman Sachs European Financials Conference 2007Slide 11
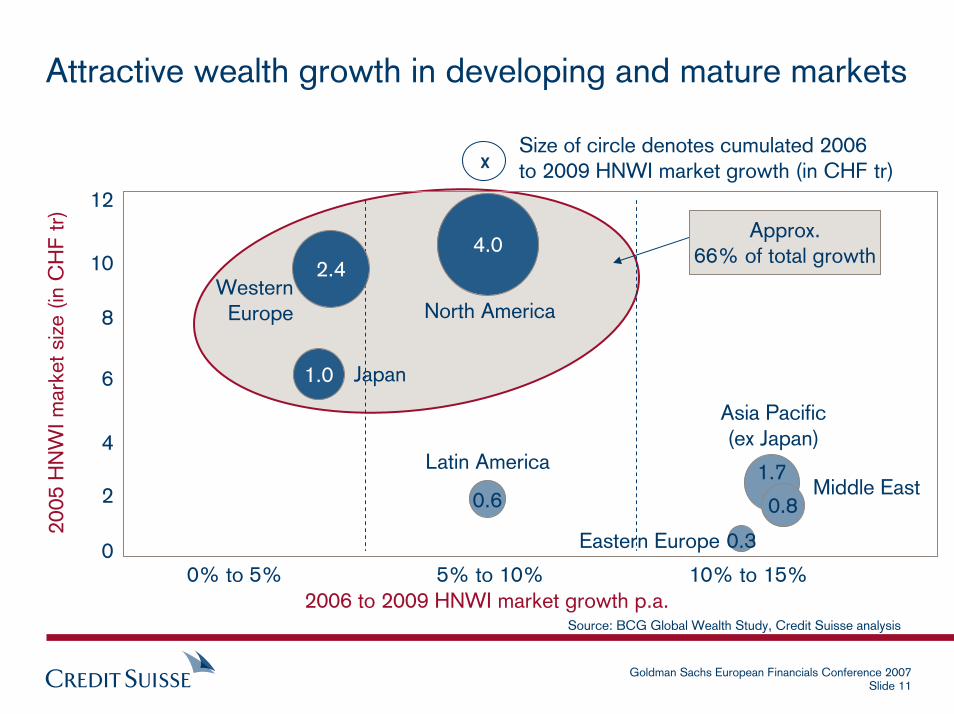
Attractive wealth growth in developing and mature markets
2
4
6
8
10
12
0% to 5% 5% to 10%
Source: BCG Global Wealth Study, Credit Suisse analysis
10% to 15%0
Asia Pacific(ex Japan)
Middle East
Eastern Europe 0.3
Japan1.0
Latin America
0.6
Western Europe
2.4
North America
4.0
2006 to 2009 HNWI market growth p.a.
2005
HN
WI m
arke
t siz
e (in
CH
F tr
)
xSize of circle denotes cumulated 2006to 2009 HNWI market growth (in CHF tr)
1.7
0.8
Approx.66% of total growth
Goldman Sachs European Financials Conference 2007Slide 12
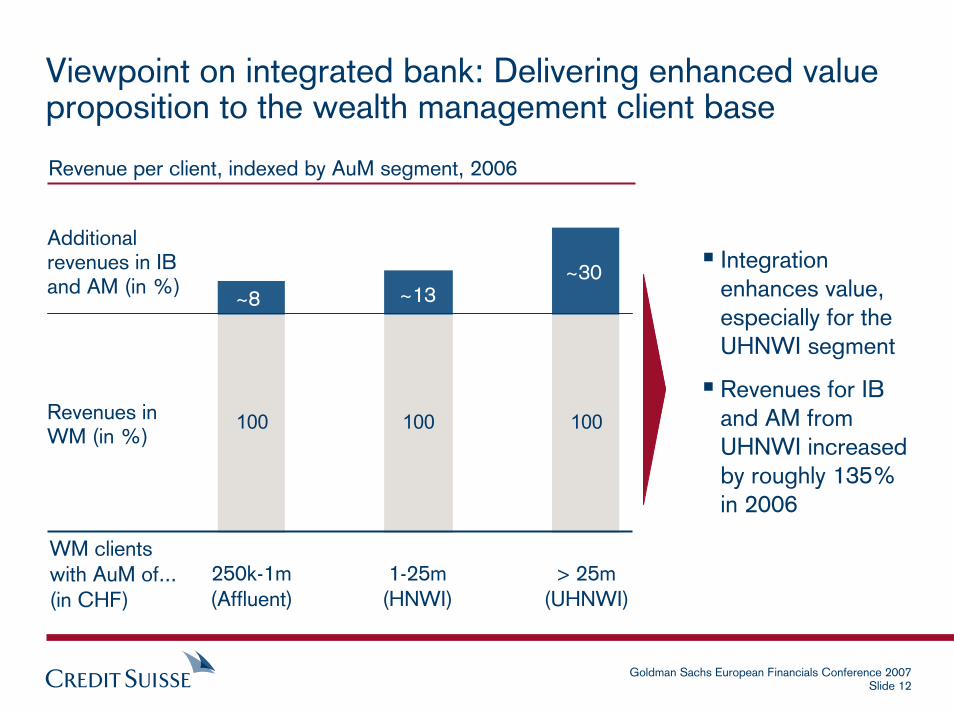
100 100 100
Viewpoint on integrated bank: Delivering enhanced value proposition to the wealth management client base
Revenue per client, indexed by AuM segment, 2006
250k-1m(Affluent)
1-25m(HNWI)
> 25m(UHNWI)
Revenues in WM (in %)
Additional revenues in IB and AM (in %)
WM clientswith AuM of...(in CHF)
~13~30
~8
Integration enhances value, especially for the UHNWI segment
Revenues for IB and AM from UHNWI increased by roughly 135% in 2006
Goldman Sachs European Financials Conference 2007Slide 13
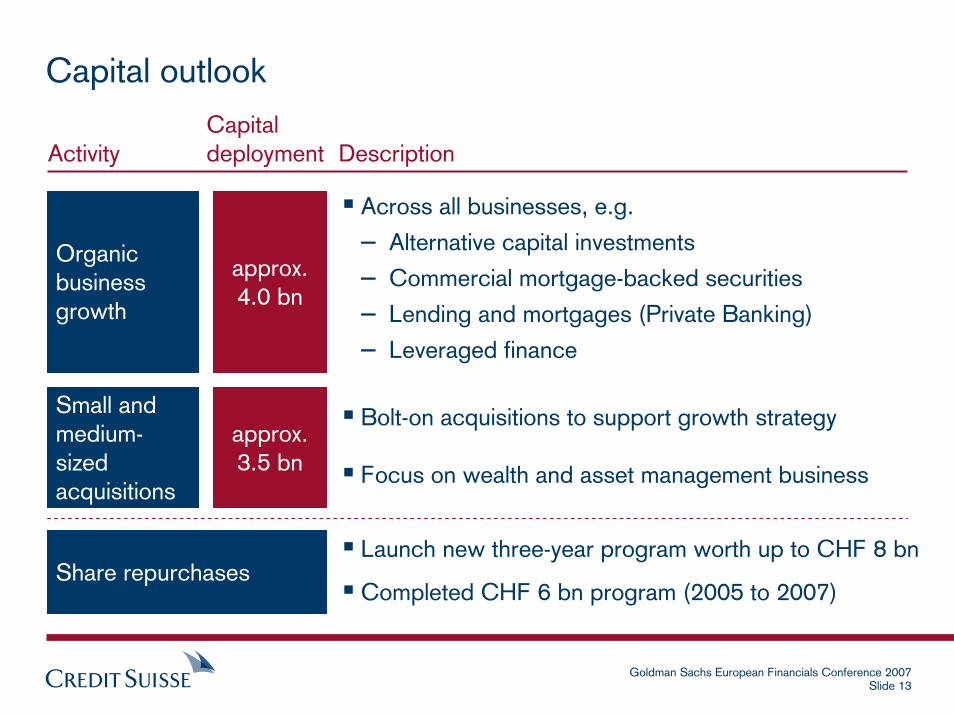
Capital outlook
Organic business growth
Small and medium-sized acquisitions
approx. 4.0 bn
approx. 3.5 bn
Across all businesses, e.g.
– Alternative capital investments
– Commercial mortgage-backed securities
– Lending and mortgages (Private Banking)
– Leveraged finance
CapitalActivity deployment Description
Bolt-on acquisitions to support growth strategy
Focus on wealth and asset management business
Launch new three-year program worth up to CHF 8 bn
Completed CHF 6 bn program (2005 to 2007)Share repurchases
Goldman Sachs European Financials Conference 2007Slide 14
Agenda
Improving Operating Performance
Platform for Growth
Managing Risk and Capital
Goldman Sachs European Financials Conference 2007Slide 15
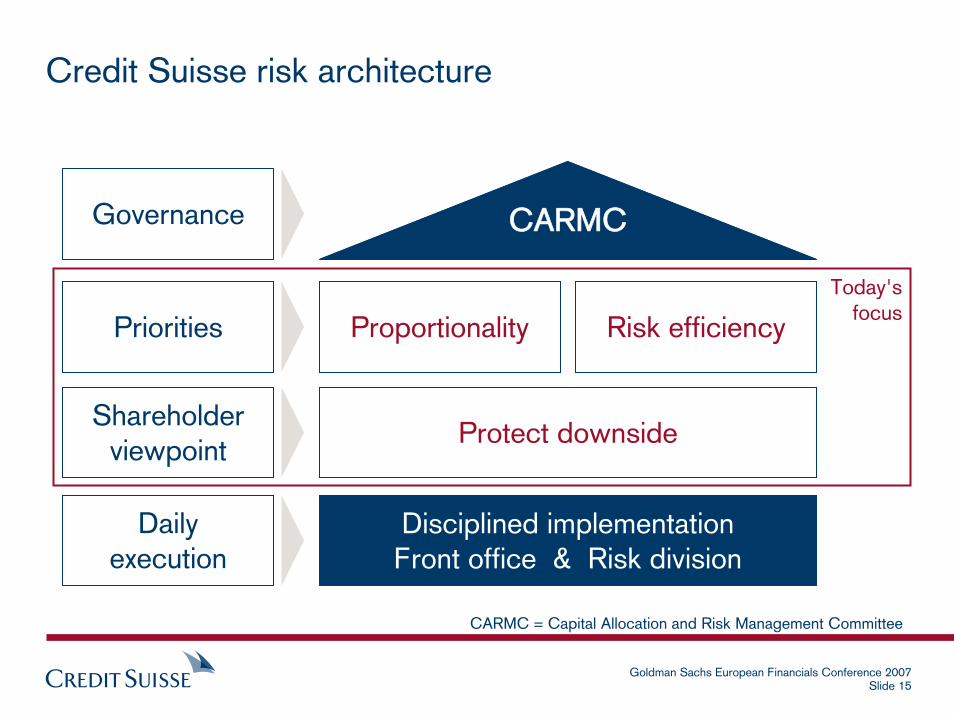
Credit Suisse risk architecture
CARMC
Disciplined implementationFront office & Risk division
Proportionality
Protect downside
Risk efficiency
Governance
Shareholderviewpoint
Priorities
Dailyexecution
CARMC = Capital Allocation and Risk Management Committee
Today'sfocus
Goldman Sachs European Financials Conference 2007Slide 16
0
2
4
6
8
10
12
2003 2004 2005 2006
Real estate & structured products
Fixed income trading
Equity trading & investments
International lending & counterparty
Swiss lending
Emerging markets
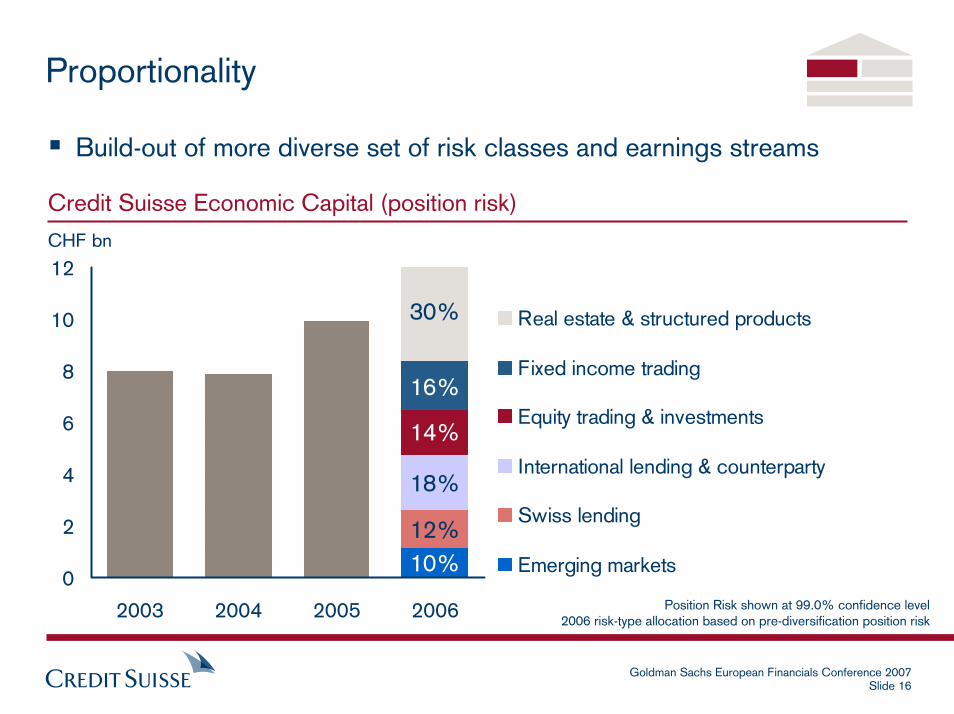
Proportionality
Build-out of more diverse set of risk classes and earnings streams
Credit Suisse Economic Capital (position risk)
CHF bn
10%12%
18%
14%
16%
30%
Position Risk shown at 99.0% confidence level2006 risk-type allocation based on pre-diversification position risk
Goldman Sachs European Financials Conference 2007Slide 17
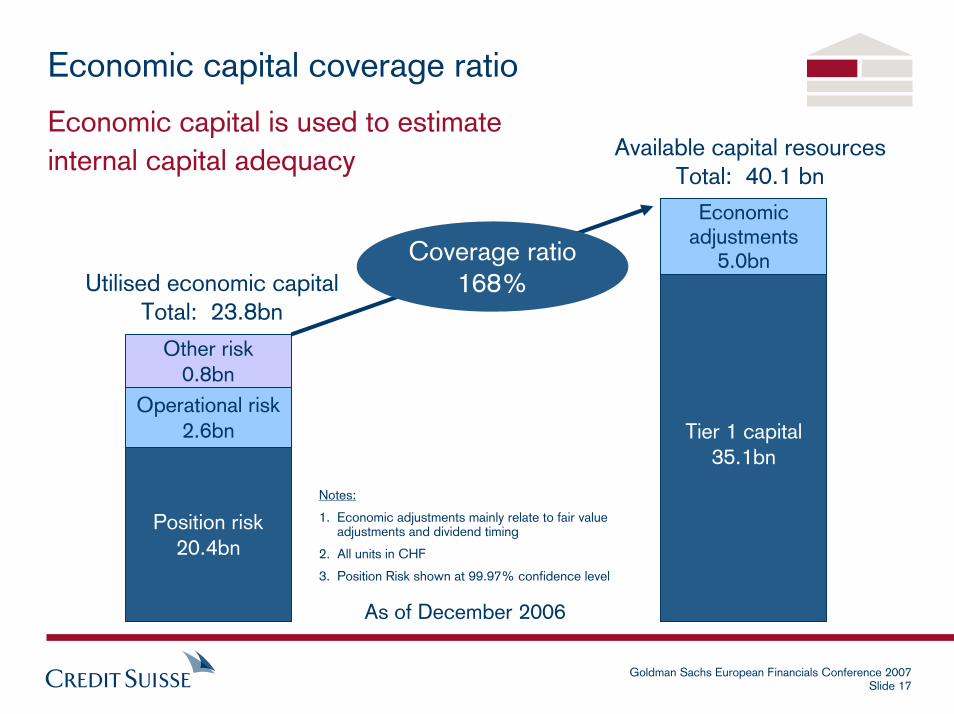
Notes:
1. Economic adjustments mainly relate to fair value adjustments and dividend timing
2. All units in CHF
3. Position Risk shown at 99.97% confidence level
Economic capital coverage ratio
Economic capital is used to estimate internal capital adequacy
Coverage ratio168%
Position risk20.4bn
Operational risk 2.6bn
Other risk 0.8bn
Tier 1 capital35.1bn
Economic adjustments
5.0bnUtilised economic capital
Total: 23.8bn
Available capital resourcesTotal: 40.1 bn
As of December 2006
Goldman Sachs European Financials Conference 2007Slide 18
Risk efficiency
Market can give early warning on changes
Closer touch with customers – sharper awareness
Makes capital 'work harder' for shareholders
Distribution as a structural objective
Hedging
Credit Suisse spent over CHF 500 m on hedging and mobility in 2006
– More consistent earnings by foregoing some upside in good times
– Better long term value through the cycle
Free-up capital and improve returns for less liquid areas
Goldman Sachs European Financials Conference 2007Slide 19
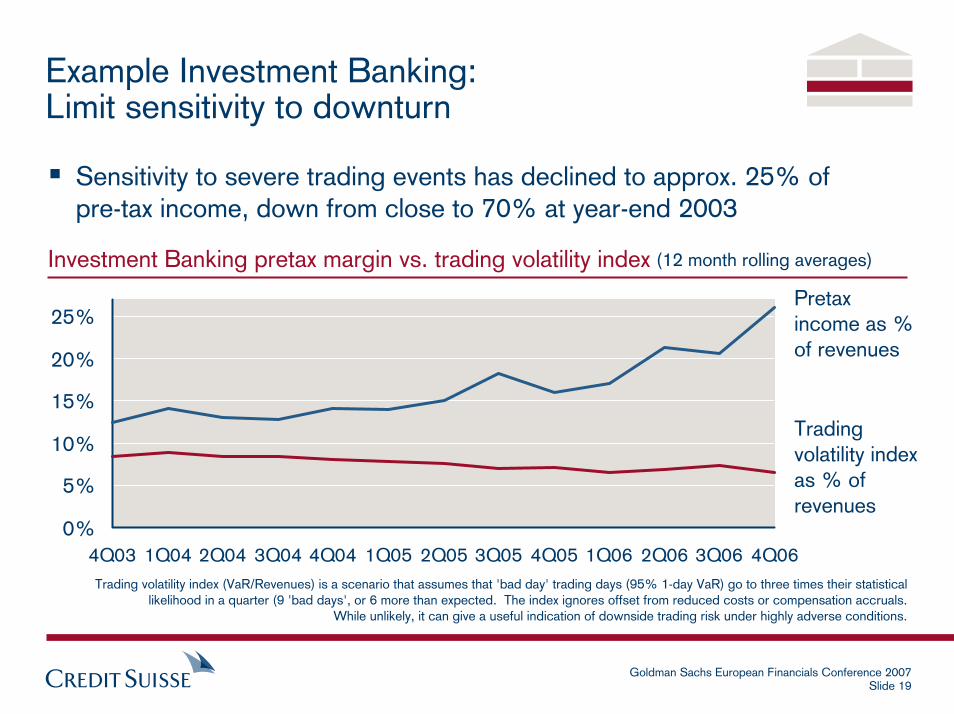
Example Investment Banking:Limit sensitivity to downturn
Trading volatility index (VaR/Revenues) is a scenario that assumes that 'bad day' trading days (95% 1-day VaR) go to three times their statistical likelihood in a quarter (9 'bad days', or 6 more than expected. The index ignores offset from reduced costs or compensation accruals.
While unlikely, it can give a useful indication of downside trading risk under highly adverse conditions.
Pretax income as % of revenues
Trading volatility indexas % of revenues
Sensitivity to severe trading events has declined to approx. 25% ofpre-tax income, down from close to 70% at year-end 2003
Investment Banking pretax margin vs. trading volatility index
0%
5%
10%
15%
20%
25%
4Q03 1Q04 2Q04 3Q04 4Q04 1Q05 2Q05 3Q05 4Q05 1Q06 2Q06 3Q06 4Q06
(12 month rolling averages)
Goldman Sachs European Financials Conference 2007Slide 20
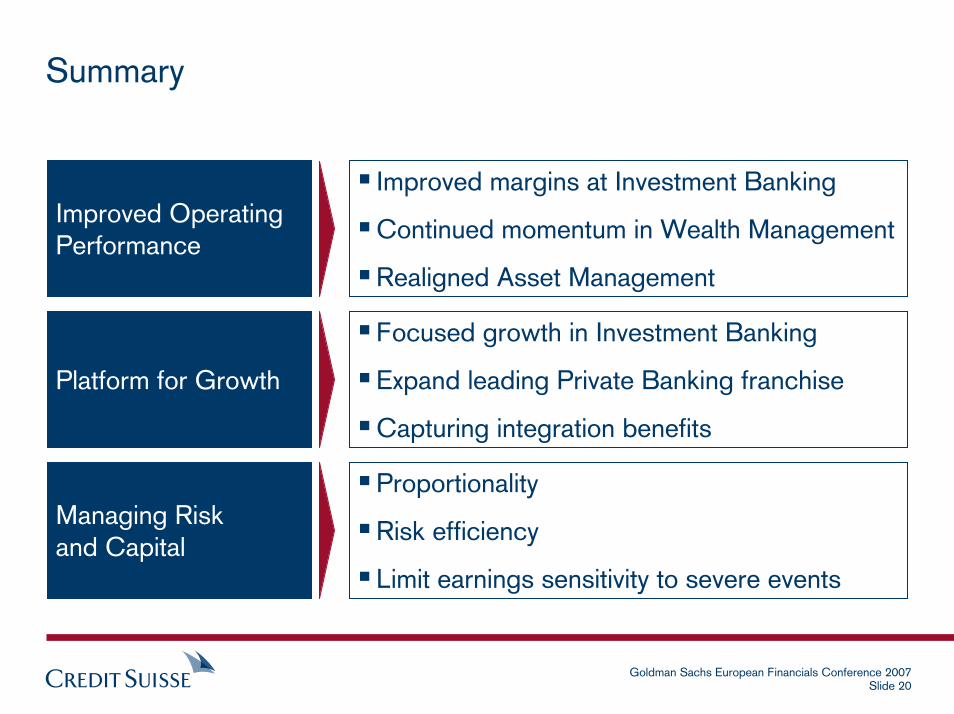
Summary
Improved Operating Performance
Platform for Growth
Managing Riskand Capital
Improved margins at Investment Banking
Continued momentum in Wealth Management
Realigned Asset Management
Focused growth in Investment Banking
Expand leading Private Banking franchise
Capturing integration benefits
Proportionality
Risk efficiency
Limit earnings sensitivity to severe events

Goldman Sachs European Financials Conference 2007Slide 21