Golden Visitors Summer 2017 Visitor Survey Results Report
71
Submitted to: Joanne Sweeting Executive Director, Tourism Golden Golden, BC 250-439-1111 [email protected] Submitted by: Krista Morten and Jaime Der Align Consulting Kamloops, BC 250-510-1490 [email protected] Golden Visitors Summer 2017 Visitor Survey Results – Report
Transcript of Golden Visitors Summer 2017 Visitor Survey Results Report

v
Submitted to: Joanne Sweeting
Executive Director, Tourism Golden
Golden, BC
250-439-1111
Submitted by: Krista Morten and Jaime Der
Align Consulting
Kamloops, BC
250-510-1490
Golden Visitors
Summer 2017 Visitor Survey Results – Report

2017 Golden Summer Visitor Survey
2
EXECUTIVE SUMMARY Tourism Golden (TG) has provided tourism marketing services to the town of
Golden and Kicking Horse Country since 2007. TG’s 2017 marketing research
strategy states, We will gather research data from TG stakeholders and visitors
on visitor demographic, lifestyle, travel habits and perceptions of Golden. This
report summarizes results from the 2017 summer visitor study conducted to
fulfill the above research strategy. Similar to 2016, a two-stage (on-site
interview combined with an online follow-up survey), multi-location survey
design was used to collect information about summer visitors.
• The new Visitor Information and Services Hub (VISAH) was added to on-site
site schedule. For the most part, the 2017 questionnaire matched the 2016
questionnaire, although for visitors intercepted at the VISAH, several
questions were added to assess incremental economic benefits.
• Between July 12 and September 3, 2017 researchers conducted 1,089 full
on-site interviews with visitors and 586 agreed to participate in the online
follow-up survey. Of those, a total 240 visitors completed the online follow-
up survey for a response rate of 43%.
Key Findings
• Most summer visitors were from Alberta, BC and other provinces in Canada.
In 2017, the percentage of Albertans (30%) declined from 38% in 2016. As a
result, the percentage of visitors from BC, US and Overseas was up.
• 2017 results revealed that overnight visitor length of stay (2.8 nights)
matched 2016 results. The proportion of visitors choosing Golden as a
primary destination also remained steady (2017 – 27%, 2016 – 28%).
Awareness levels of first-time visitors dipped from 54% in 2016 to 48% in
2017.
1 The Net Promoter Score uses visitor’s likelihood of recommending Golden as proxy measure of experience evaluation, see Section 2.2.1. for more information. Net Promoter, NPS and the NPS-related emoticons are registered service marks, and Net Promoter Score and Net Promoter System are service marks, of Bain & Company, Inc., Satmetrix Systems, Inc. and Fred Reichheld.
• On average, travel parties spent $596 while in Golden which was up 2% over
2016 results.
• The use of private home rental services (e.g. Airbnb, VRBO) continues to
grow as an important accommodation booking source with 15% of
responses compared to 8% in summer 2016.
• Most summer visitors were in Golden to take a break from driving, for
family vacation and to sightsee/see nature/wildlife. • Golden summer visitors rated their overall experience as good-excellent
(87%) and the majority were very likely to return (72%). o Golden’s Net Promoter Score (NPS) was 31.81, down from NPS = 35.0 in
2016. Smoky summer weather conditions, significant increases in
accommodation room rates, a slight shift in key markets2 and tourism
labour shortages impacting customer service are all possible factors that
contributed to the decline in NPS. o The proportion of Golden promoters (49% - those likely to recommend
Golden as vacation destination) matched 2016 results. Promoters were
more likely than passives/detractors to list Golden as their primary trip
destination, participate in more activities, go to more places, stay longer,
spend more money and return on another trip than other visitors.
• Golden’s proximity to nature, National/Provincial parks and the great
variety of outdoor recreation activities are the main drivers of travellers
decision to visit Golden. A warm welcome by Golden’s residents, it’s small
town charm complimented by the friendly, hospitable people and helpful
front-line staff also contribute to good visitor experiences in Golden.
2 In 2016 and 2017, BC visitors had a lower NPS than all other markets. In 2017, there was an increase in the percentage of BC visitors from declines in Alberta visitors, this had an impact on the overall NPS.

2017 Golden Summer Visitor Survey
3
GOLDEN - SUMMER 2017 SUMMARY
Top 5 Places Visited
1. Restaurant (74%) 2. Gas Station (62%) 3. Grocery Store (52%) 4. Kicking Horse Bridge (51%) 5. National Parks (48%)
83% visited
downtown nights
Top 5 Activities (in addition to reasons for visiting – see below) 1. Hiking in Golden area (23%) 2. Grizzly Bear at KHMR (22%) 3. Hiking at National Parks (18%) 4. Mountain Biking (15%) 5. White Water Rafting (10%)
47%
27%
27%
A Touring Trip (NoPrimary Destination)
Golden Is The PrimaryDestination
On Route To AnotherPrimary Destination
Type of Visitor
45%
55%
Repeat Visitor
First Trip
Top Provinces (outside BC & AB)
1. Ontario 2. Saskatchewan 3. Quebec
Top Overseas Regions 1. Europe – UK, Germany, Switzerland 2. Australia/New Zealand 3. Other Countries
Top 3 USA States
1. California
2. Texas
3. Oregon
19%
12%
24%15%
30%
Market Origin
BC
USA
Overseas
Other Canada
Alberta
$596 on
average, was spent in Golden by each visitor party Avg. Overnight Stay = 2.8 nights
Length of Stay
77%
23%
Overnight
Day
Top 5 Reasons for Visiting
1. Break from Driving/Convenient Place to Stop (23%)
2. Family Vacation (22%) 3. Mtn. Biking Events & General (12%) 4. Sightseeing/Nature/Wildlife (9%) 5. Visiting National Parks (8%)
48% of first time visitors were aware
of Golden before visiting
47% male
3.0 people in each visitor party 60% travelled with spouse 18% travelled with children (<16) 14% travelled with friends ) 60% had a
university or post graduate degree
54% had HH
income of
$100,000+
Visitors
53% female
Accommodations
65% Stayed at Paid Roofed Accommodation 76% Pre-Booked Accommodation
57%25%
15%
2%Booking Method
Accommodation Property
Online Travel Agent
Private Home Rental Service
Other
Experience Evaluation
87% Rated Their Overall Golden
Experience as Very Good/Excellent
Likelihood of Return: 72%
Likelihood to Recommend: 49%
Net Promoter Score (NPS): 31.8

2017 Golden Summer Visitor Survey
4
Summer Visitors 2017 2016 2017/2016 % Change Directional Change
Primary Market
BC 19% 16% 19%
AB 30% 38% -21%
Other Canada 15% 15% 0%
USA 12% 9% 33%
Overseas 24% 21% 14%
Gender
Female 53% 45% 18%
Male 47% 55% -15%
Length of Stay
Day Visitors 23% 24% -4%
Overnight Visitors 77% 76% 1%
Average Nights in Golden 2.8 2.8 0%
Aware of Golden Before First Visit1 48% 54% -11%
Type of Trip
Percent Choosing Golden as Primary Destination 27% 28% -4%
First Time Visitors 55% 52% 6%
Repeat Visitors 45% 48% -6%
Visitor Party Expenditures While in Golden $596 $586 2%
Accommodation
Stayed at Paid Roofed Accommodation 65% 61% 7%
Pre-Booked Accommodation 76% 88% -14%
Booked with Private Home Rental (e.g. Airbnb) 15% 8% 88%
Experience Evaluation
Overall Excellent/Very Good Experience Rating2 87% 94% -7%
High Likelihood of Return Trip to Golden2 72% 74% -3%
High Likelihood of Recommending Golden (Promoters) 49% 49% 0%
NPS 31.8 35.0 -3.2 points
1. Of First Time Visitors. 2. Top Box Responses.
2017 Golden Summer Visitor Survey
5
TABLE OF CONTENTS Executive Summary ............................................................................................................................................................................................ 2
Table of Contents ............................................................................................................................................................................................... 5
1.0. Introduction ................................................................................................................................................................................................ 6
2.0. Methodology............................................................................................................................................................................................... 7
2.1. Data Collection........................................................................................................................................................................................................ 7
2.2. Data Analysis ........................................................................................................................................................................................................... 9
2.3. Tips for Reading Results ........................................................................................................................................................................................11
3.0. Results ....................................................................................................................................................................................................... 12
3.1.Visitor Characteristics ............................................................................................................................................................................................13
3.2. Trip Characteristics ...............................................................................................................................................................................................15
3.3. Awareness, Decision Making and Perceptions .....................................................................................................................................................22
3.4. Trip Planning .........................................................................................................................................................................................................24
3.5. Visitor Information While in Golden .....................................................................................................................................................................28
3.6. Evaluation of Golden Tourism Experiences ..........................................................................................................................................................30
3.7. Market Summary ..................................................................................................................................................................................................37
3.8. NPS – Promoter Characteristics ............................................................................................................................................................................39
Appendices ....................................................................................................................................................................................................... 42
Appendix A. Data Weight and Sample Distribution Tables .........................................................................................................................................43
Appendix B. Other NPS Results ....................................................................................................................................................................................44
Appendix C. Questionnaires ........................................................................................................................................................................................46
Front Cover Photo Credit: Tourism Golden

2017 Golden Summer Visitor Survey
6
1.0. INTRODUCTION Tourism Golden (TG) has provided tourism marketing services to the town of Golden and Kicking Horse Country since 2007. The not-for-profit
organization’s vision is, To inspire target visitors to explore and experience Golden. To realize the vision, in 2017, TG has continued to focus on three key
strategic objectives:3
• Establish perceptions of Golden consistent with our brand positioning,
• Increase target market awareness of Golden as a great destination to visit, and
• Increase nightly visits and length of stay.
The 2017 TG marketing plan has a research strategy that states, We will gather research data from TG stakeholders and visitors on visitor demographic,
lifestyle, travel habits and perceptions of Golden. These will be used to identify and measure trends and motivations for future marketing planning and
strategies, and will provide metrics against which the Strategic Objectives will be measured. The research strategy goals are to:
• Produce visitor data research reports for use by Tourism Golden and community stakeholders,
• Provide analysis of annual and seasonal data,
• Provide a capacity with which to evaluate the effectiveness and to demonstrate the success of marketing activity,
• Identify and evaluate Net Promoter Score, and
• Measure the economic impact of tourism in Golden.
To fulfill the research strategy and goals, TG has conducted visitor surveys in 2013, 2014, 2015, 2016 and now 2017. In fall 2015, Align Consulting was
hired to reduce TG staff workloads and provide professional marketing research services throughout 2016 and 2017. 2017 marks the second
consecutive year with a similar visitor survey approach which allows for year-over-year comparisons. Two visitor surveys were conducted in 2017, one
for the winter season (under separate cover) and another for the peak summer season (this report).
3 Tourism Golden Marketing Plan 2017 FY.

2017 Golden Summer Visitor Survey
7
2.0. METHODOLOGY
2.1. Data Collection Similar to 2016 research, a two-stage, multi-location survey design was used to collect information about Golden visitors. The first stage was an on-site
interview, the second was on online follow-up survey. Questionnaires were jointly designed by Align Consulting and Tourism Golden and were for the
most part, consistent with 2016 research. One variation was the addition of questions about the new Visitor Information and Services Hub (VISAH)
which opened in early August 2017. See Appendix C for full on-site and follow-up questionnaires. A summary of the use and incremental economic
benefits of the VISAH are summarized under separate cover.
TG employed four paid researchers to conduct on-site interviews in the summer of 2017. The researchers worked for 47 days between July 12 and
September 3, 2017. They approached visitors at a variety of locations around Golden, including 3 hotels along Highway 1, downtown Golden, the VISAH
and at Kicking Horse Mountain Resort (KHMR). Researchers also attended key events that attract tourists including the weekly Farmers Market and the
Summer Kicks evening concerts in Spirit Square. The on-site interview was 5-7 minutes long and finished with the request to participate in an online
follow-up survey.
A total of 2,692 people were approached to participate in the on-site survey. Of those, 1,669 people (62%) agreed to participate, 580 were screened out
because they were locals, vacation home property owners, staying in Golden for longer than 30 days, under 19 or had already completed the survey,
equaling 1,089 visitors that completed the on-site survey. A total of 586 visitors agreed to complete the online, follow-up survey. The follow-up survey
was distributed via email within one week of completing the on-site interviews, also $200 VISA gift card was offered as an incentive to complete the
follow-up survey. Two email reminders were sent over several weeks to those people who had not started or completed the survey. A total of 240
visitors completed the online survey for a response rate of 43%.
By location, response to the follow-up survey was highest for visitors encountered at downtown Golden (48%), followed by the VISAH (44%), the hotels
on Highway 1 (41%) and at KHMR (32%). By market, visitors from most markets had good response rates (39% - 46%). Visitors from other Canada
(outside BC and Alberta) had a lower response rate (33%).
A combination of a reduction of budget allocated to researcher staffing combined with staffing challenges resulted in slightly fewer completed on-site
and follow-up surveys compared to 2016 (2017 – 1,089 on-site surveys and 240 follow-up surveys; 2016 – 1,690 on-site surveys and 425 follow-up
surveys). In summer 2017, on-site interviews were conducted at VISAH site (in August) instead of the closed BC Visitor Centre @ Golden (BCVC). In
addition, in 2017, there were fewer follow-up survey responses from visitors interviewed at KHMR compared to 2016. This has resulted in a larger
percentage of follow-up responses from visitors interviewed at the VISAH and in downtown Golden. By market, the on-site had a similar distribution of

2017 Golden Summer Visitor Survey
8
survey responses in 2017 compared to 2016. There was a higher percentage of follow-up responses from BC residents in 2017 compared to 2016. See
Appendix A for more details.
Number Of:
Location People
Approached
Agree to
Complete Survey
Not in
Population/Did
Not Complete1
Completed On-
Site Survey
Agree to
Follow-Up
Completed
Follow-Up
Response
Rate
KHMR 882 606 225 381 206 66 32%
VISAH 343 212 37 175 105 46 44%
Highway 1 Corridor 495 137 29 108 41 17 41%
Downtown Golden 972 714 289 425 233 111 48%
Total 2,692 1,669 580 1,089 5862 240 43%
1. ‘Not in population’ means the person approached was less than 19 years old, already surveyed, a local, property owner or seasonal visitor.
2. Only 558 people actually received the follow-up survey because 28 emails addresses bounced/were incorrect.
Number of:
Market
Completed On-
Site Survey1
Agree to
Follow-Up
Completed Follow-
Up (% of Total)
Response
Rate2
BC 202 116 52 (22%) 46%
Alberta 343 206 89 (37%) 43%
Other Canada 169 94 31 (13%) 33%
USA 126 65 26 (11%) 40%
Overseas 248 105 41 (17%) 39%
Total 1,088 586 2391 (100%) 41%
1. One completed on-site and follow-up survey did not have a market origin category. 2. 2016 response rates were: BC (46%), Alberta (48%), other Canada (50%), USA (48%), Overseas (41%) and Total
(47%).
2017 Golden Summer Visitor Survey
9
2.2. Data Analysis Once the visitor survey data was downloaded, checked and coded4, they were weighted or ‘balanced’ in four groups according to overnight
accommodation capacity including KHMR, the Highway 1 corridor, downtown Golden and the Frontcountry/Blaeberry Valley (see Appendix A for
weights).
Golden visitors were described using simple frequencies and averages from the interview and follow-up survey data. Other data analysis details include:
• Occasionally, top box analysis was used where the top two responses were summarized to understand meaningful differences between groups (e.g.
visitors that responded with ‘4s’ or ‘5s’ on a 5-point satisfaction scale).
• Visitor expenditures were collected in both the on-site and follow-up surveys. Both surveys collected expenditures for each travel party (and not
per visitor) but average party size was divided into total travel party expenditures to equal per person expenditures. Further, average length of stay
in Golden was used to calculate expenditures on a per-person, per-day basis.
• To avoid the influence of outliers in expenditures, travel party and length of stay calculations, the top and bottom 2.5% of responses were trimmed.
• Open-ended (textual) responses were grouped into categories and summarized with percentages.
• Postal codes were collected for visitors from North America. City level geography was identified using geocoder.ca.
• Sample size warnings were provided as footnotes when response categories had less than 30 responses.
• Comparisons to winter 2016 results are made throughout the report. Please be aware that fewer surveys were conducted in 2017 and no on-site
interviews were not conducted at Quartz Creek snowmobile trailhead in 2017 (they were in 2016).
In addition, data was summarized by:
1. Market - BC, Alberta, other Canadian provinces, the USA and Overseas (see Section 3.7).
2. NPS - Promoters and Passives/Detractors (see section 2.2.1.) - Highlights of those Golden visitors that are advocates of Golden (promoters) and are
highly likely to recommend Golden compared to those that are not likely to recommend Golden as a travel destination (see Section 3.8).
Differences were identified by statistical tests and/or pragmatic differences. Pragmatic differences were identified between analysis categories (e.g.
promoters vs. passives/detractor visitors) when result differed by 10% or more.
4 Coded means open-ended responses were categorized into meaningful groups.

2017 Golden Summer Visitor Survey
10
2.2.1. Net Promoter Score Growing customer service/experience expectations, changing tourism markets, and increasing worldwide competition have led to substantial shifts in
the tourism marketplace over the past decade. The delivery of outstanding visitor experiences is critical to achieve higher revenues via increased
spending, longer stays, repeat visits and visitors’ positive word of mouth recommendations.
One goal of Destination British Columbia’s (DBC) 2014 corporate strategy is for British Columbia to become the most highly recommended destination in
North America. The Net Promoter Score® (NPS®)5 measures the intention to recommend a travel destination and is also an indicator of overall
satisfaction with the travel experience. Starting in 2016, Golden visitor surveys will collect the NPS to monitor visitor experience satisfaction.
NPS is measured by asking one question (likelihood of recommending Golden as a travel destination) on the follow-up questionnaire. The question’s
results are used to categorize visitors into one of three groups – promoters (very/extremely likely to recommend), passives (may or may not
recommend) and detractors (not likely to recommend). Overall, the percent of detractors is subtracted from the percent of promoters to equal the NPS
(see below).
How likely are you to recommend Golden as a travel destination to a friend, family member or colleague?
Not at all Likely - 0 1 2 3 4 5 6 7 8 9 10 - Extremely Likely
Detractors Passives Promoters
5 Net Promoter, NPS and the NPS-related emoticons are registered service marks, and Net Promoter Score and Net Promoter System are service marks, of Bain & Company, Inc., Satmetrix Systems, Inc. and Fred Reichheld.
%
Promoters
%
Detractors NPS

2017 Golden Summer Visitor Survey
11
2.3. Tips for Reading Results
1. Other US States include: Ohio Wyoming, Utah, Michigan, Tennessee, Georgia, Montana, North Carolina, New Jersey, Virginia, Illinois, Kentucky, Pennsylvania, Wisconsin, Arkansas, Massachusetts, Nevada, Delaware, Mississippi, South Dakota, Louisiana, New Mexico, Indiana, Kentucky, Georgia, Nevada.
Footnotes about questions are noted here. Often they describe the ‘other’ categories, state the question, describe other note, or describe the number of responses (n).
39%
25%
20%
8%
6%
2%
Ontario
Saskatchewan
Quebec
Manitoba
Nova Scotia
Yukon
Origin of Canadian Visitors Percentage of Visitors Outside of
BC and AB
‘Origin of Canadian Visitors’ describes what the content of the graph.
The statement, ‘Percentage of Visitors from Outside BC and AB’ describes what the percentages mean. This graph represents percentages only of Canadian Visitors from outside of BC or Alberta (as opposed to all visitors). Also, in this graph, there isn’t a FU symbol, which means the data were collected during the on-site interview.
Interpretation: 39% of Canadian visitors from outside of BC and Alberta were from Ontario.
3%
4%
9%
24%
34%
27%
Some SecondarySchool
Secondary SchoolDiploma
Some Post SecondaryEducation
Trade Certificate orCollege diploma
UniversityUndergraduate Degree
UniversityPostGraduate Degree
Level of EducationPercentage of VisitorsFU
Interpretation: 34% of Golden visitors had acquired a university undergraduate degree.
FU – Means data were collected on the follow-up questionnaire. If there isn’t FU text, it means the data were collected during on-site interview.

2017 Golden Summer Visitor Survey
12
3.0. RESULTS
39%
25%
20%
8%
6%
2%
Ontario
Saskatchewan
Quebec
Manitoba
Nova Scotia
Yukon
Origin of Canadian Visitors Percentage of Visitors Outside of BC and AB
16%
10%
9%
8%
7%
6%
5%
4%
4%
3%
California
Texas
Oregon
Washington
Colorado
New York
Minnesota
Idaho
Florida
Arizona
Origin of Visitors from USA (Top 10)1
Percentage of American Visitors
1. Other US States include: Ohio Wyoming, Utah, Michigan, Tennessee, Georgia, Montana, North Carolina, New Jersey, Virginia, Illinois, Kentucky, Pennsylvania, Wisconsin, Arkansas, Massachusetts, Nevada, Delaware, Mississippi, South Dakota, Louisiana, New Mexico, Indiana, Kentucky, Georgia, Nevada.
7%
7%
5%
4%
4%
4%
4%
3%
3%
2%
Victoria
Vancouver
Kamloops
Surrey
Kelowna
Vernon
Cranbrook
Invermere
Abbotsford
Fernie
Origin of Visitors from BC (Top 10)
Percentage of BC Visitors
43%
13%
3%
2%
2%
2%
2%
2%
2%
2%
Calgary
Edmonton
Red Deer
Lethbridge
Cochrane
Leduc
Sherwood Park
Airdrie
St. Albert
Banff
Origin of Visitors from Alberta (Top 10)
Percentage of Albertan Visitors
19%
12%
24%15%
30%
Market OriginPercentage of Visitors
BC USA
Overseas Other Canada
Alberta

2017 Golden Summer Visitor Survey
13
3.1.Visitor Characteristics
1. Other International includes: Chile, China, India, Japan, Mexico, Singapore, South Korea, United Arab Emirates, Qatar. 2. Other Europe includes Spain, Czech Republic, Austria, Denmark, Sweden, Norway, Greece, Portugal, Poland and Belgium.
35%
24%
11%
10%
9%
12%
UK
Germany
Switzerland
Netherlands
France
Other Europe
Origin of European Visitors2
Percentage of European Visitors
75%17%
8%
Origin of Overseas Visitors1
Percentage of Overseas Visitors
Europe Australia/NZ Other International
47% 53%
GenderPercentage of Visitors
Male Female
4%
21%
17%
24%
23%
10%
19-24 Years
25-34 Years
35-44 Years
45-54 Years
55-64 Years
65-74 Years
AgePercentage of Visitors

2017 Golden Summer Visitor Survey
14
3%
4%
9%
24%
34%
27%
Some Secondary School
Secondary School Diploma
Some Post Secondary Education
Trade Certificate or College diploma
University Undergraduate Degree
University PostGraduate Degree
Level of EducationPercentage of VisitorsFU
3%
7%
9%
13%
15%
30%
24%
< $20,000
$20,000 to $39,999
$40,000 to $59,999
$60,000 to $79,999
$80,000 to $99,999
$100,000 to $149,999
$150,000+
Annual Household Income ($CDN)Percentage of VisitorsFU

2017 Golden Summer Visitor Survey
15
3.2. Trip Characteristics
Been To Golden?1 Repeat Visitors First-Time Visitors
Origin
BC 29% 11%
AB 47% 17%
Other Canada 14% 16%
USA 4% 18%
Overseas 7% 38%
Primary Reason (Top 5)
1. Family Vacation (21%) 2. Break from Driving/Convenient
Place to Stop (19%) 3. Mtn. Biking - General (13%)
4. Visiting Friends and Relatives (10%) 5. Sightseeing/Nature/Wildlife (6%)
1. Break from Driving/Convenient Place to Stop (26%)
2. Family Vacation (22%) 3. Visiting National Parks (13%)
4. Sightseeing/Nature/Wildlife (4%) 5. Attend or Be in a Wedding (3%)
Length of Stay
Day 22% 24%
Overnight 78% 76%
Average Nights 2.8 2.8
1. This table is read as origin, primary reason and length of stay of repeat or first-time visitors. For example, 29% of repeat visitors were from BC, whereas 11% of first-time visitors were from BC. 7% of repeat visitors were from overseas while 38% of first-time visitors were from overseas.
23%
15%
36%
14%
Winter
Spring
Summer
Fall
Season of Past VisitationPercentage of Past Visits
45%
55%
Been to Golden Before?Percentage of Visitors
Repeat Visitor First Trip

2017 Golden Summer Visitor Survey
16
23%
22%
9%
8%
8%
6%
4%
4%
4%
2%
2%
2%
2%
1%
1%
1%
<1%
<1%
<1%
<1%
<1%
<1%
<1%
<1%
<1%
Break from Driving/Convenient Place to Stop
Family Vacation
Sightseeing/Nature/Wildlife
Visiting National Parks
Mtn. Biking (General)
Visiting Friends and Relatives
Other Activity
Attend or Be in a Wedding
Mtn. Biking Event/Race
Grizzly Bear Refuge at KHMR
Whitewater Rafting
Business/Corporate Meeting or Event
Included in Touring Itinerary
General Relaxation
Hiking
Education/Medical/Work Reasons
Mountaineering
Golf
Other Festival or Concert in Golden
Watersports other than Whitewater Rafting eg…
Paragliding/Hangliding
Via Ferrata at KHMR
Sky Diving
Swiss Guides and other Heritage
Summer Kicks Concert
Primary Reason for VisitPercentage of Visitors
Mtn. Biking (General) + Mtn. Biking Event = Mtn. Biking Total = 12%

2017 Golden Summer Visitor Survey
17
23%
22%
18%
15%
10%
5%
2%
2%
1%
1%
1%
1%
1%
1%
Hiking around Golden/Kicking HorseMountain Resort
Kicking Horse Mountain Resort - GrizzlyBear Refuge
Hiking at Glacier or Yoho National Parks
Mountain Biking around Golden/KickingHorse Mountain Resort
Whitewater Rafting
Canoeing or Kayaking
Golf
Fishing
Mountaineering
Horseback Riding
Han gliding/Paragliding
Kicking Horse Mountain Resort - ViaFerrata
Sky Diving
ATV Tour
Additional Activity Participation (Not Primary)
Percentage of Visitors
74%
62%
52%
51%
48%
45%
44%
39%
37%
16%
10%
8%
6%
Restaurant
Gas Station
Grocery Store
Kicking Horse Bridge
National Parks
Kicking Horse Mountain Resort
Pub/Bar
Rotary Trails
Gifts
Northern Lights Wolf Centre
Art Gallery of Golden
Museum
Festival/Concert
Golden Places VisitedPercentage of Visitors

2017 Golden Summer Visitor Survey
18
Average Overnight Trip Length:
14.2 nights
Average Nights in Golden:
2.8 nights
Time in Golden/Total Trip Length:
20%
Percent of Visitors Travelling in a Group:
4%
Type of Group:
• Leisure Tour Group (73%)
• Sports Group (16%)
• Business Group (11%)
1. Golden visitors can be travelling with multiple travel party members so the sum totals more than 100%.
Yes, 83%
No, 17%
Visit Downtown Golden?Percentage of VisitorsFU
1%
6%
7%
6%
5%
3%
39%
43%
31%
27%
17%
9%
6%
3%
8%
0%
1 night
2 nights
3 nights
4 nights
5 nights
6 nights
7 - 13 nights
14+ nights
Nights on Trip and in GoldenPercentage of Visitors
Total Trip Length
In GoldenOvernight, 77%
Day, 23%
Length of Stay in GoldenPercentage of Visitors
60%
18%
14%
13%
11%
2%
2%
1%
1%
Spouse
Children < 16
Friends
Extended Family
Children >16
Parent
Sibling
Colleagues
Alone
Travel Party Composition1
Percentage of Visitors
Average Party Size:
3.0 visitors

2017 Golden Summer Visitor Survey
19
Other Primary Destinations
(276 responses)
• Thompson Okanagan (22%)
• Lower Mainland/Whistler (14%)
• Calgary (9%)
• Other Outside BC & AB (9%)
• BC Rockies (outside Revelstoke and Columbia Valley, 9%)
• Columbia Valley (8%)
• Vancouver Island (8%)
• Banff/Lake Louise/Canmore (8%)
• Revelstoke (5%)
• Other AB (5%)
• Edmonton (2%)
• Other BC (1%)
Paid Roofed Accommodations,
65%Friends/Family,
11%
Camping, 24%
Golden Overnight AccommodationPercentage of Visitors
25%
30%
31%
13%
Golden Adjacent toHighway 1
Downtown Golden
Front CountryBlaeberry Valley…
Kicking Horse MtnResort
Paid Accommodation LocationPercentage of Visitors - Weighted
47%
23%
17%
8%
4%
1%
1%
1%
Hotel/Motel
Vacation Home Rental
Cabin or Chalet or Lodge
Bed & Breakfast
Condo/Self Catering Hotel
Hostel
Backcountry Lodge
Dont Know
Accommodation TypePercentage of Visitors
47%
27%
27%
A Touring Trip (NoPrimary Destination)
Golden Is ThePrimary Destination
On Route ToAnother Primary
Destination
How Would You Describe Your Trip?
Percentage of Visitors

2017 Golden Summer Visitor Survey
20
Expenditures in Golden (Averages)1
Visitor Party Per Person
Trip Expenditures Daily Expenditure2 Trip Expenditures3 Daily Expenditure4
Day Visitors $111 $111 $38 $38
Overnight – VFR5 $491 $115 $179 $42
Overnight - Paid Roofed $845 $322 $268 $102
Overnight - Camping $415 $154 $142 $53
Overall $596 $212 $197 $70
1. The expenditures presented were collected on the on-site interview. 2. Visitor Party Daily Expenditures = Visitor Party Trip Expenditures/Nights in Golden. Day Visitor expenditures / hours spent in Golden = $57.42 average hourly expenditure. 3. Per Person Per Trip Expenditures = Visitor Party Trip Expenditures/People in Travel Party. 4. Per Person Daily Expenditures = Per Person - Trip Expenditures/People in Travel Party. 5. VFR = Visiting (staying with) Friends and Family
Visitor Party Expenditures in Golden – Averages in Each Category1
Paid
Accomm.
Food and
Beverage Transportation Shopping Attractions
Outdoor
Recreation
Other
Entertainment
Other
Expenditures
Day Visitors
% spent on 0% 47% 13% 15% 7% 7% 0% 11%
$ spent on $0 $52 $15 $16 $8 $7 $0 $12
Overnight - VFR
% spent on 2% 37% 20% 13% 12% 11% 0% 6%
$ spent on $8.34 $182 $98 $63 $56 $55 $0 $28
Overnight - Camping
% spent on 35% 29% 18% 4% 6% 6% 1% 3%
$ spent on $144.41 $118 $73 $18 $24 $23 $2 $11
Overnight - PAID
% spent on 54% 21% 9% 4% 5% 5% 0% 2%
$ spent on $452.71 $174.83 $78.55 $30.41 $43.92 $41.39 $0.84 $20.27
Overall
% spent on 33% 29% 13% 7% 7% 6% 1% 5%
$ spent on $197 $175 $77 $42 $39 $37 $3 $27
1. The percent of expenditures presented in each category are collected in the follow-up online survey. n = 239, A total of 43 people ‘didn’t know’ and 35 preferred not to answer. Sample sizes were small for Overnight – VFR (29) visitors please use caution when interpreting. The average visitor party overall expenditures from the on-site interview were multiplied by the average percentage in each expenditures category to equal the average dollars spent for each category.

2017 Golden Summer Visitor Survey
21
Trip Characteristics by Market
BC AB Other Canada USA Overseas TOTAL
Been to Golden?
First Time 32% 31% 59% 84% 88% 55%
Repeat Visitor 68% 70% 41% 16% 12% 45%
Travel Party Size (Average) 3 3 3 3 3 3
Type of Trip
Golden is Primary Destination 35% 40% 29% 19% 5% 27%
Touring Trip 30% 17% 50% 65% 87% 47%
Other Primary Destination 35% 43% 21% 16% 8% 27%
Primary Reasons for Visiting (Top 5)
1. Break from Driving,
Convenient Place to Stop (29%)
2. Family Vacation (18%) 3. Mtn. Biking
Event Race (10%) 4. VFRs (10%)
5. Other Activity (6%)
1. Break from Driving, Convenient Place to Stop (28%) 2. Family Vacation
(21%) 3. Mtn. Biking General (13%) 4. Sightseeing
Nature Wildlife (7%)
5. Attend or Be in a Wedding (6%)
1. Family Vacation (22%)
2. Break from Driving,
Convenient Place to Stop (19%) 3. Sightseeing
Nature Wildlife (10%)
4. VFR (9%) 5. Mtn. Biking General (5%)
1. Family Vacation (25%)
2. Visiting National Parks (19%)
3. Break from Driving, Convenient Place to Stop (16%)
4. Sightseeing Nature Wildlife (12%)
5. Other Activity (4%)
1. Family Vacation (24%)
2. Break from Driving, Convenient Place to Stop (19%) 3. Visiting National
Parks (18%) 4. Sightseeing Nature
Wildlife (12%) 5. Included in Touring
Itinerary (6%)
1. Break from Driving,
Convenient Place to Stop (23%)
2. Family Vacation (22%)
3. Sightseeing Nature Wildlife
(9%) 4. Visiting National
Parks (8%) 5. VFR (6%)
Length of Stay
Day 31% 26% 17% 21% 20% 24%
Overnight 69% 74% 83% 79% 80% 77%
Average Nights 2.4 2.4 3.4 3.4 2.8 2.8
Accommodation
Paid Roofed
Accommodation 55% 62% 61% 77% 73% 65%
Camping 28% 27% 23% 18% 20% 24%
VFR 17% 11% 16% 5% 7% 11%
Average Expenditures
(Per Trip/Per Party) $411 $567 $769 $808 $560 $596

2017 Golden Summer Visitor Survey
22
3.3. Awareness, Decision Making and Perceptions
3.3.1. Awareness
1. This was only asked of people that had not been to Golden on previous trips. 2. There were 161 responses to this question. Please note, consumer shows (Calgary Bike Show, Calgary Outdoor Wedding Show, Edmonton Bike Show, Edmonton Snowmobile
and Power Sports Show, Saskatoon Snowmobile Show and the Vancouver Outdoor Show were included in the question but there were no responses.
45%
18%
16%
8%
3%
3%
2%
2%
2%
1%
1%
1%
<1%
I Have Always Known About Golden
Internet Search
Word of Mouth Recommendation
I or My Family Used to Live in Golden
Highway Signage
Other
Sports Team Activity Group or Club…
Travel Guide (e.g. Longly Planet)
Magazine or Newspaper Article
None of the Above
Parks Canada Website
Tour Operator Brochure Itinerary
Golden Travel Planner or Other…
How Did You Originally Find Out About Golden?2
Percentage of VisitorsFU
Yes, 48%
No, 52%
Aware of Golden Before Visit?1
Percentage of First Time Visitors
2017 Golden Summer Visitor Survey
23
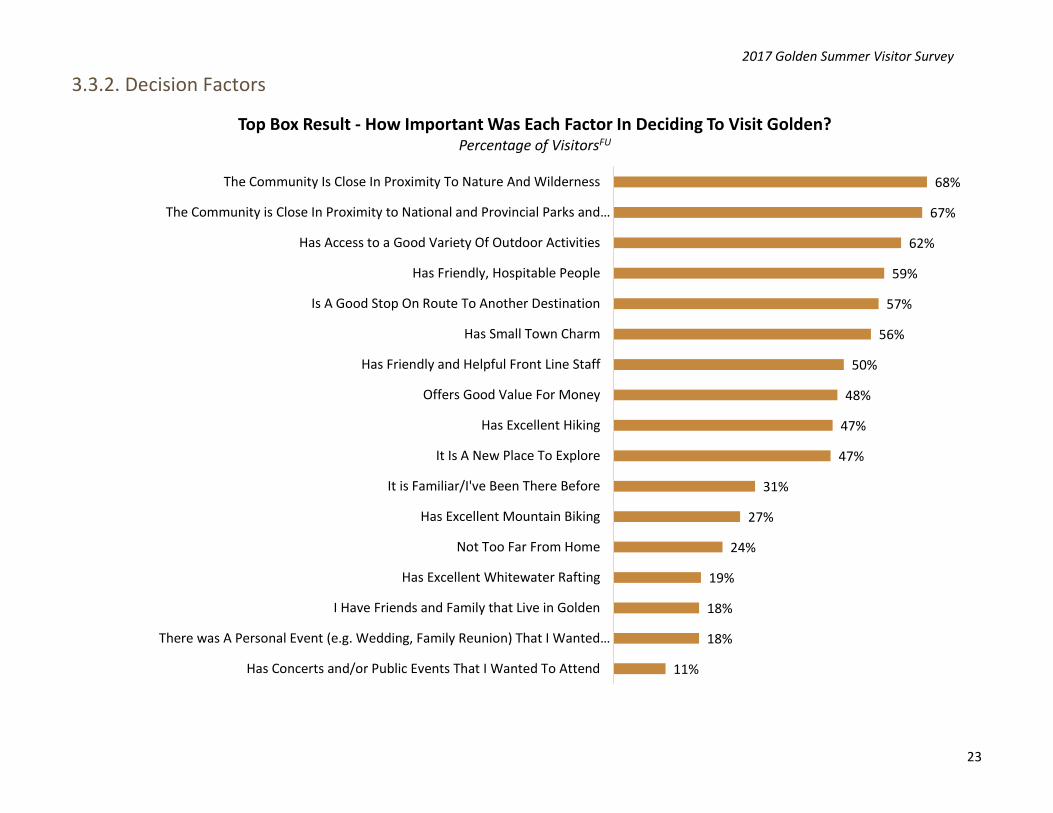
3.3.2. Decision Factors
11%
18%
18%
19%
24%
27%
31%
47%
47%
48%
50%
56%
57%
59%
62%
67%
68%
Has Concerts and/or Public Events That I Wanted To Attend
There was A Personal Event (e.g. Wedding, Family Reunion) That I Wanted…
I Have Friends and Family that Live in Golden
Has Excellent Whitewater Rafting
Not Too Far From Home
Has Excellent Mountain Biking
It is Familiar/I've Been There Before
It Is A New Place To Explore
Has Excellent Hiking
Offers Good Value For Money
Has Friendly and Helpful Front Line Staff
Has Small Town Charm
Is A Good Stop On Route To Another Destination
Has Friendly, Hospitable People
Has Access to a Good Variety Of Outdoor Activities
The Community is Close In Proximity to National and Provincial Parks and…
The Community Is Close In Proximity To Nature And Wilderness
Top Box Result - How Important Was Each Factor In Deciding To Visit Golden?Percentage of VisitorsFU

2017 Golden Summer Visitor Survey
24
3.4. Trip Planning
3.4.1. Sources of Trip Planning Information
36%
30%
16%
8%
7%
3%
DestinationRelated Terms (e.g.Golden)
Activity Related Terms (e.g.restaurants in Golden)
Terms Related to SpecificWants or Needs (e.g. coffeeshops in Golden dogfriendly
hotels in Golden)
Price Related Terms (e.g. cheaphotels)
Specific Brand or WebsiteNames (e.g. Holiday Inn Hotels)
Other
What Kinds of Search Terms Did You Use?2
Percentage of Visitors That Used A Search TermFU
1. Which online sources of visitor information did you use to help plan your trip to Golden? Did you use the information before or during your trip? Visitors that responded ‘none’ were excluded in the above graphs.
2. Visitors could respond with more than one response so the percentages sum to more than 100%. Other included 7 responses, responses included; ski/avalanche conditions
(5 responses), air miles (1), weather report (1).
33%
41%
23%
24%
11%
21%
18%
9%
6%
13%
4%
6%
17%
5%
31%
18%
16%
13%
12%
10%
8%
7%
5%
4%
4%
3%
3%
1%
Online Maps
Search Engine
Kicking Horse Mountain Resort Website
Travel Commentary/Review Websites
Social Media
Parks Canada Website
Tourism Golden Website
Specialist Activity Website or App
Other Online Source
Destination BC Website (Hellobc.com)
Kootenay Rockies Tourism Website or…
Online Travel Guide Websites
Online Travel Agency
Destination Canada Website
Online Sources of Visitor Information Used Before and During Trips to Golden1
Percentage of VisitorsFU
Before Your Trip During Your Trip
2017 Golden Summer Visitor Survey
25
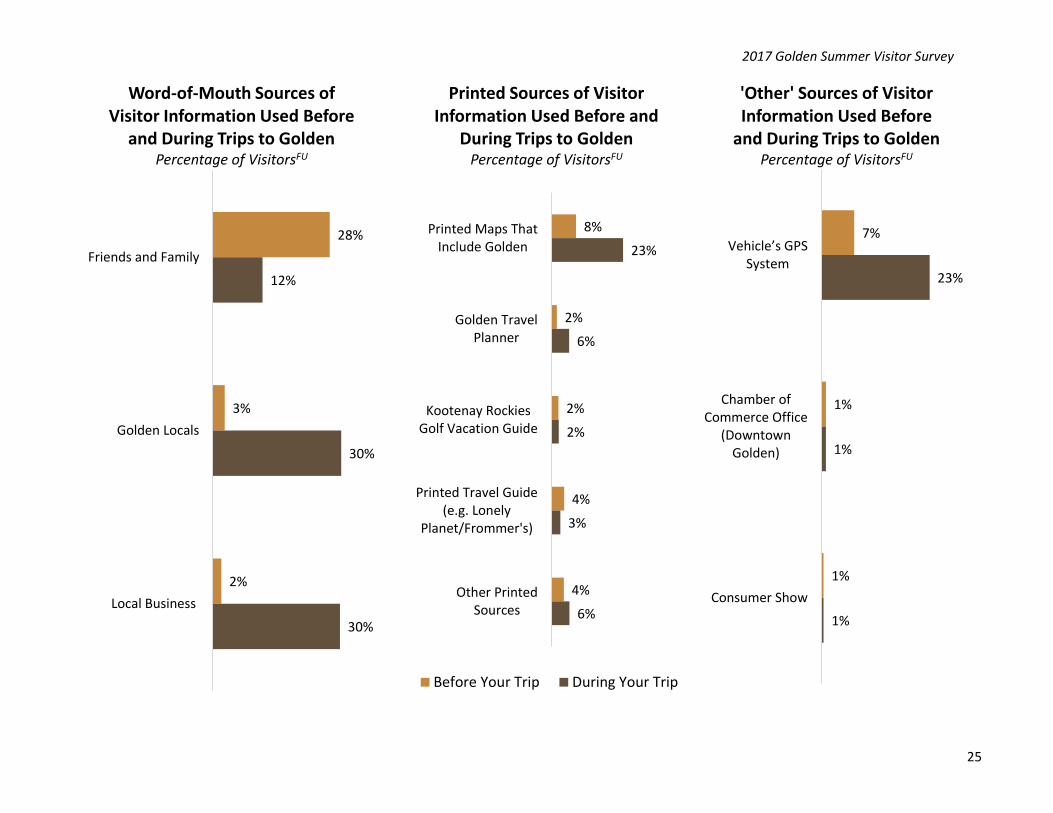
7%
1%
1%
23%
1%
1%
Vehicle’s GPS System
Chamber ofCommerce Office
(DowntownGolden)
Consumer Show
'Other' Sources of Visitor Information Used Before
and During Trips to Golden Percentage of VisitorsFU
8%
2%
2%
4%
4%
23%
6%
2%
3%
6%
Printed Maps ThatInclude Golden
Golden TravelPlanner
Kootenay RockiesGolf Vacation Guide
Printed Travel Guide(e.g. Lonely
Planet/Frommer's)
Other PrintedSources
Printed Sources of Visitor Information Used Before and
During Trips to Golden Percentage of VisitorsFU
Before Your Trip During Your Trip
28%
3%
2%
12%
30%
30%
Friends and Family
Golden Locals
Local Business
Word-of-Mouth Sources of Visitor Information Used Before
and During Trips to Golden Percentage of VisitorsFU

2017 Golden Summer Visitor Survey
26
3.4.2. Social Media Use
1%
7%
8%
11%
12%
14%
18%
20%
24%
46%
48%
Other
Snapchat
Yelp
Google+
YouTube
TripAdvisor
What Socia Media or Travel Commentary/Review Applications Have You
Regularly Used Over Past Year?Percentage of Visitors Regularly Use Social MediaFU
Yes, 70%
No, 30%
Over The Past Year, Have You Regularly Used Social Media Or Travel Commentary Applications?
Percentage of VisitorsFU

2017 Golden Summer Visitor Survey
27
3.4.3. Accommodation Booking
Yes, 76%
No, 24%
Did You Pre-Book/Reserve Paid Accommodations In Golden?
Percentage of VisitorsFU
1. Sample sizes are small (n = 19), please use extreme caution when interpreting.
Yes, 54%No, 46%
If This Kind Of Accommodation Was Not Available In Golden, Would You Have Still Stayed
Overnight In Golden?3
Percentage of Visitors That Used A Private Home RentalFU
75%
19%
7%
Airbnb
VRBO
Other
Which Private Home Rental Service Did You Use?1
Percentage of Visitors That Used A Private Home RentalFU
6%
3%
7%
30%
55%
1 - Not Important At All
2
3
4
5 - Extremely Important
How Important Was The Ability To Book Your Accommodations Through
A Private Home Rental Service In Your Decision To Visit Golden?1
Percentage of Visitors That Used A Private Home RentalFU
<1%
<1%
2%
15%
25%
57%
Travel Agent
Kicking Horse Central Reservations
RCR Central Reservations
Private Home Rental Service
Online Travel Agent
Directly with the Accommodation Property
How Did You Pre-Book/Reserve Accommodation in Golden?
Percentage of Visitors That Pre-Booked/ReservedFU

2017 Golden Summer Visitor Survey
28
3.5. Visitor Information While in Golden
38%
32%
24%
16%
15%
10%
2%
1%
Restaurants/Dining
Activities
Attractions
Accommodations
Events
Shopping
Transportation
Other
What Visitor Information Topics Did You Research And Obtain While You Were In
Golden?Percentage of VisitorsFU
Other Information Researched/Obtained: (2 responses)
• Library
• Dog Grooming
14%
38%
53%
58%
56%
59%
Staying Longer in Golden than IOriginally Anticipated
Spending Money That I Hadn’t Anticipated on Spending While in
Golden
Participating in Activities in Goldenthat I Did Not Originally Plan on Doing
Visiting Places That I Didn’t Already Know about in Golden
Increasing the Likelihood of Returningto Golden
Improving the Overall Quality of MyExperience in Golden
Top Box Results - The Visitor Information I Obtained In Golden Resulted Me Or My Travel
Party...Percentage of Visitors Responding 4 or 5 on Agreement
ScaleFU

2017 Golden Summer Visitor Survey
29
Where Visitors Couldn’t Access WiFi (20 responses) • Campground (4)
• Many places (4)
• Didn't need it (4)
• Accommodation (3)
• Tourism booth/Visitor Centre (2)
• Kicking Horse Mountain Resort
• Art Gallery Store
• I didn't know it was available at the visitor
center
Yes, 94%
No, 6%
Were You Able To Obtain All Of The Visitor Information About Golden That You Needed?
Percentage of VisitorsFU
Information Visitors Weren't Able to Find (4 responses)
• Wanted detailed maps of the whole Golden area
• Restaurants/shops/nightlife/events
• Public use building hours/season day operation
• Places to have a dinner or tourism landscape
Yes, 87%
No, 13%
While In Golden, Were You Able To Access The Internet via WiFi
Connection When You Needed It??Percentage of VisitorsFU
45%
21%
6%
5%
5%
Accommodation
Local BusinessWiFi
Community WiFiHot Spot
At the VISAH
Other
WiFi Access LocationPercentage of VisitorsFU

2017 Golden Summer Visitor Survey
30
3.6. Evaluation of Golden Tourism Experiences
3.6.1. Meeting Expectations
Exceeded Your Expectations, 55%
Met your Expectations, 43%
Fell Short of Your Expectations, 3%
How Did Golden Meet Your Expectations?Percentage of Visitors

2017 Golden Summer Visitor Survey
31
3.6.2. Likelihood of Return to Golden
4%
7%
17%
21%
51%
1 Not At All Likely
2
3
4
5 ExtremelyLikely
Given Your Experience In Golden, On A Scale of 1 To 5, How Likely Are You
To Return On An Overnight Trip To Golden?
Percentage of VisitorsFU
Likelihood of Return Segement1,2 Likely Somewhat/Not Likely
Origin
BC 21% 20%
AB 40% 26%
Other Canada 17% 8%
USA 8% 19%
Overseas 14% 27%
Primary Reason (Top 5)
1. Family Vacation (27%) 2. Break from Driving/Convenient
Place to Stop (15%) 3. Mtn. Biking General (11%)
4. Visiting Friends/Relatives (11%) 5. Visiting National Parks (8%)
1. Break from Driving/Convenient Place to Stop (34%)
2. Family Vacation (24%) 3. Attend or Be in a Wedding (12%)
4. Sightseeing/Nature/Wildlife (11%) 5. Visiting National Parks (9%)
Length of Stay
Day 26% 16%
Overnight 74% 84%
Average
Nights 2.8 3.6
1. Likely are visitors that scored Golden as a ‘4’ or ‘5’ on the likelihood to return scale. 2. This table is read as origin, primary reason and length of stay as a percent of visitors that were likely or not-
likely to return. For example, 14% of visitors likely to return were from overseas, whereas 27% of visitors not likely to return were from overseas.
Average Likelihood of Return:
4.1

2017 Golden Summer Visitor Survey
32
3.6.3. Components of Tourism Experience
87%
85%
79%
75%
74%
69%
Overall Experience in Golden
Recreation and AdventureOpportunities
Signage on Trans Canada Hwy 1
Accommodation
Dining
Local Directional Signage
Please Rate Your Experience of Each Component of Your Visit to GoldenFU
Top Box Responses - Percentage of Visitors Responding 4 or 5
Scale: 1 = Very Poor and 5 = Excellent
Component Average
Rating
Overall Experience 4.3
Recreation and Adventure Opportunities 4.4
Signage on Trans Canada Hwy 1 4.1
Accommodation 4.0
Dining 4.0
Local Directional Signage 3.8

2017 Golden Summer Visitor Survey
33
3.6.4. Net Promoter Score
2%
0%
1%
2%
2%
5%
6%
15%
19%
11%
38%
0
1
2
3
4
5
6
7
8
9
10
How Would You Rate Your Likelihood To Recommend Golden As A Travel
Destination To Friends/Family Or A Colleague?
Percentage of VisitorsFU, 1
1. Visitors were classified as promoters (‘9’ or ‘10’ on likelihood scale), passives (‘7’ or ‘8’ on likelihood scale) or detractors (‘0’ to ‘6’ on likelihood scale).
2. There were very low sample sizes from other Canada (n= 29) and the USA (n = 25). Use extreme caution when interpreting.
NPS Segement1
Promoters Passives and Detractors
Origin
BC 13% 28%
AB 40% 32%
Other Canada 21% 6%
USA 10% 12%
Overseas 15% 21%
Primary Reason (Top
5)
1.Family Vacation 2. Mtn. Biking
3. Break from Driving/ Convenient Place to Stop
4. Sightseeing/ Nature/Wildlife
5. Visiting Friends and Relatives
1. Family Vacation 2.Break from Driving/
Convenient Place to Stop 3.Visiting Friends and
Relatives 4. Visiting National Parks
5. Sightseeing/ Nature/Wildlife
Length of Stay
Day 11% 27%
Overnight 89% 73%
Average Nights 3.9 2.6
1. This table is read as origin, primary reason and length of stay as a percent of promoters or passives/ detractors visitors. For example, 13% of promoters were from BC, whereas 28% of passives/detractors were from BC.
49%
34%
17%
Golden's Overall Net Promoter ScorePercentage of VisitorsFU, 2
Promoters
Passives
Detractors
NPS = 31.8

2017 Golden Summer Visitor Survey
34
Net Promoter Score by Market
77%
19%
4%
Other CanadaPercentage of VisitorsFU
NPS = 73.1
41%
36%
23%
Overseas Percentage of VisitorsFU
NPS = 18.244%
29%
27%
USAPercentage of VisitorsFU
NPS = 17.7
54%34%
12%
AlbertaPercentage of VisitorsFU
Promoters Passives Detractors
NPS = 42.3
30%
46%
24%
BCPercentage of VisitorsFU
NPS = 6.3

2017 Golden Summer Visitor Survey
35
Reasons for NPS Rating – Percentage of Visitors
Comment Promoters Passives Detractors Total
Great Town/Atmosphere 27% 38% 6% 27%
Good Variety of Outdoor Activities 19% 32% 9% 22%
Scenery/Landscape 22% 19% 13% 19%
Location/Proximity to Home 16% 22% 9% 17%
Friendly People 22% 12% 6% 16%
Good Food/Restaurants 17% 5% 5% 11%
Good Services 10% 9% 9% 9%
Overall Good Time 14% 6% 4% 9%
Good Accommodation Facilities 11% 4% 0% 7%
Good Value 6% 1% 0% 3%
Friends/Family Live Here 4% 2% 0% 2%
Good Skiing/Snowboarding/Mountain 2% 1% 0% 2%
Less Busy/Touristy 1% 0% 0% 1%
Come Back to Do Other Summer Activities 0% 1% 0% 0%
Whitewater Rafting 4% 2% 10% 4%
Mtn. Biking 9% 7% 7% 8%
Good Tourist Attractions 0% 2% 0% 1%
Climbing/Hiking 3% 2% 10% 4%
Kicking Horse Mountain Resort 6% 5% 5% 6%
Golf 1% 0% 0% 0%
Limited Services/Experiences/Activities 1% 2% 25% 5%
Stop-Over Not a Destination 0% 1% 21% 4%
Too Industrial/Poor Aesthetics 0% 3% 3% 2%
Poor Signage 1% 1% 0% 1%
Poor Skiing/Mountain 2% 0% 0% 1%
Too Expensive 0% 0% 5% 1%
Too Far from Home 0% 0% 3% 1%
Quiet/Limited Entertainment 0% 0% 3% 1%
Rough/Unfriendly People 0% 2% 0% 1%
209 visitors had 386 comments about their likelihood or recommending Golden to the family/friends/colleagues. Visitors made more than one comment, so
column percentage will sum to more than 100%. Promoters n = 104, Passives n = 70 and Detractors n = 35.

2017 Golden Summer Visitor Survey
36
3.6.5. New Products, Services and Experiences
Yes, 42%No, 58%
Are There Any New Or Expanded Products, Services Or Experiences That Would Enhance Your Visit to Golden?
Percentage of VisitorsFU
17%
17%
13%
13%
11%
10%
10%
9%
9%
8%
5%
3%
2%
2%
More/Improved Camping
More Shopping/Services
Other
More Visitor Information Services
Less Expensive
More/Better Restaurants
More Attractions/Activities
Better Signage
Enhance Vibrancy of Downtown
KHMR/Downtown Shuttle
More Evening Entertainment
Better Transportation To/From Golden
More/Improved Mtn. Biking Trails
Public Pool/Hot Tub
Recommended New/Expanded Products, Services or Experiences1,2,3,4
Percentage of Visitors That Recommended Expanded ServicesFU
1. 44 visitors made 56 recommendations. Since visitors could make more than one suggestion percentages sum to more than 100%. 2. Other category suggestions are (1 each): 1. More bike racks to lock bikes on downtown. 2. Reduce the noise of the trains. 3. Better service at one restaurant 4. More hiking
information and 5. Better car rental. 3. More attractions/activities are (1 each): 1. More yoga please. 2. Tourist friendly & attractive: parks, quality/scenic campgrounds, information centers, historical sites, road bike
paved trails, scenic waterways with walking/cycling paths, museums. 3. More stuff for my daughter and I do to - other than downhill biking. 4. More festivals. 4. All recommendations for more visitor information were made in July, prior to the VISAH opening. 5. Outdoor activities 6. More festivals

2017 Golden Summer Visitor Survey
37
3.7. Market Summary Golden visitors were organized into groups based on their market origin including visitors from BC, Alberta, other Canada (from provinces outside BC and
Alberta), the United States and overseas. Key differences6 in on-site interview results for each market (when compared to other markets) are
highlighted in the table below. It was also noted if there was a similar result found in the summer 2016 or in winter 2017. Small sample sizes prevented
comparisons for follow-up survey responses.
Similar Result In:
Measure Market - Summary of Differences Summer 2016 Winter 2017
Age • Visitors from Alberta were younger (29% were under 34 years old) than BC, other Canada
and US visitors (<23% were under 34 years old). Visitors from the US were older (25% > 65+)
than other visitors (< 11%).
Yes Yes
Previous
Visitation
• Visitors from BC and Alberta (>60%) were more likely to have been to Golden on a previous
visit than visitors from other Canada (41%), the USA (16%) or overseas (12%). Yes Yes
Primary Reason • Visitors from BC were more likely to be on a corporate or work trip (5%) compared to other
visitors from outside of BC (<2%).
• Albertans were more likely to be in Golden to mountain bike (13%) compared to those from
other areas (<8%). Although BC residents were more likely be in Golden for mountain bike
event/race (10%) than other visitors (<5%).
• Visitors from outside of Alberta or other Canada (>6%) were more likely to be on a trip to
attend a wedding than other visitors (<2%). More visitors from outside of Canada were on a
trip to visit National Parks (>17%) compared to those from Canada (<5%).
Yes No
Length of Trip • On average, visitors from overseas (24.6 nights away from home), the US (15.6 nights) and
other Canada (15.4 nights) were on longer trips than those from BC (10.0 nights) or Alberta
(7.3nights).
Yes Yes
Golden Length
of Stay
• On average, overnight visitors the USA (3.4 nights) and from other Canada (3.4 nights)
stayed in Golden longer than those from overseas (2.8 nights), BC and Alberta (2.4 nights). Yes Yes
Trip Type • Visitors from Alberta (40%) and BC (35%) were much more likely to be on a trip where
Golden was the primary destination compared to other visitors (<29%). Visitors from
overseas (87%) and the USA (65%) were more likely to be on touring trips.
Yes Yes
6 Key differences were identified by statistical tests or those with pragmatic differences of more than 10% difference between groups.

2017 Golden Summer Visitor Survey
38
Similar Result In:
Measure Market - Summary of Differences Summer 2016 Winter 2017
Awareness • Visitors from Alberta (94%) and BC (88%) were much more likely to be aware of Golden
before their trip compared to overseas visitors (<51%). Yes Yes
Accommodation • Visitors from the US (61%) and overseas (58%) were more likely to stay in paid roofed
accommodation compared to those from BC (37%) and Alberta (46%) who were more likely
to stay with friends and family (BC – 31%, Alberta –26%).
• Visitors from Alberta were more likely to stay at KHMR (21%) compared to those from other
locations (<13%).
No No
Expenditures • On average, BC and Albertan visitors spent less per travel party while in Golden (<$411) than
all other visitors (>$560). Yes No

2017 Golden Summer Visitor Survey
39
3.8. NPS – Promoter Characteristics Past research in Golden and other destinations has found that characteristics of Golden promoters differ from those that are not as likely to recommend
Golden (passives/detractors). Visitors that were categorized as Golden promoters (9 or 10, on the 0-10 likelihood to recommend scale) were compared
to those that were passives (7 - 8, on the 0-10 likelihood to recommend scale) and detractors (0 - 6, on the 0-10 likelihood to recommend scale).
Passives and detractors were grouped to ensure sufficient sample sizes for analysis. Key differences7 are highlighted in the table below. It was also
noted if there was a similar result found in the summer 2016 or in winter 2017. NPS research findings for other destinations are summarized in
Appendix B.
Similar Result In:
Measure Promoters and Passives/Detractors - Summary of Key Differences Summer 2016 Winter 2017
Market Origin • Promoters were less likely to be from BC (13%) than passives/detractors (28%).
Conversely, promoters were more likely to be from other Canada (21%) compared to
passives/detractors (6%).
Yes Yes
Travel Party
Composition
• There was no difference in travel party composition between promoters and
passives/detractors. No No
Previous Visitation • There was no difference in travel previous visitation between promoters and
passives/detractors. Yes No
Primary Reason • Promoters were less likely to be in Golden for a break from driving/convenient place
to stop (promoters – 11%, passives/detractors – 28%). Yes No
Other Activities • Promoters were more likely to participate in hiking in the Golden/KHMR area
(promoters –36%, passives/detractors – 21%), to have visited the Grizzly Bear refuge
at KHMR (promoters – 34%, passives/detractors – 20%), and participate in mountain
biking in the Golden/KHMR area (promoters – 26%, passives/detractors – 14%) than
passives/detractors.
Yes No
Places Visited • Promoters were more likely to visit a Golden pub, gift shop, grocery store, gas
station, the Kicking Horse Bridge, Kicking Horse Mountain Resort, Rotary Trails, than
passives/detractors.
No No
Accommodation • Promoters (30%) were more likely to be camping than passives/detractors (16%).
Promoters were also less likely to stay in a hotel/motel (23%) than
passives/detractors (65%). Promoters were more likely to stay in other kinds of
No Yes
7 Key differences were identified by statistical tests or those pragmatic differences of more than 10% between promoters and passives/detractors.

2017 Golden Summer Visitor Survey
40
Similar Result In:
Measure Promoters and Passives/Detractors - Summary of Key Differences Summer 2016 Winter 2017
fixed-roof accommodation, including vacation home rentals (38%) compared to
passives/detractors (16%).
Golden Length of Stay • Promoters were more likely to be on an overnight trip to Golden than
passives/detractors (promoters – 90%, passives/detractors – 73%). Also, promoters
that stayed overnight in Golden, stayed longer on average than passives/detractors
(promoters – 3.9 nights passives/detractors – 2.6 nights).
Yes No
Trip Type • Promoters were more likely to be on a trip where Golden was their primary
destination compared to passives/detractors (promoters – 44%, passives/detractors
– 22%). Also, a greater proportion of passives/detractors were travelling through
Golden to another primary destination compared to promoters (promoters – 19%,
passives/detractors – 33%).
Yes No
Visit Downtown • There was no difference in Golden downtown visitations between promoters and
passives/detractors. No Yes
Expenditures • Promoters spent more on average ($748) than passives/detractors ($574). Yes No
Awareness • There was no difference in awareness of first time visitors between promoters and
passives/detractors. No Yes
Decision Factors • Promoters were more likely to rate most factors as important (4s or 5s on
importance scale) compared to passives/detractors. Yes Yes
Trip Planning Sources • There was no difference in trip planning resources used between promoters and
passives/detractors. No Yes
Visitor Information
Services
• There was no difference in visitor information obtained between promoters and
passives/detractors.
• Promoters were more likely to agree (4s or 5s on agreement scale) that visitor
information services caused them to: participate in more activities they hadn’t
planned on (promoters - 67%, passives/detractors - 39%), visiting more places they
hadn’t planned on (promoters – 70%, passives/detractors – 47%) spend more money
than anticipated in Golden (promoters - 46%, passives/detractors - 30%), improving
the overall experience in Golden (promoters – 71%, passives/detractors – 45%) and
increase their likelihood of return (promoters - 51%, passives/detractors - 13%).
No Yes

2017 Golden Summer Visitor Survey
41
Similar Result In:
Measure Promoters and Passives/Detractors - Summary of Key Differences Summer 2016 Winter 2017
Golden Experience
Evaluation
• Promoters were more likely to give top-box ratings (4 or 5, on 1 – poor to 5 –
excellent scale) for evaluation of trip components, which included: accommodation
(promoters - 89%, passives/detractors - 59%), dining (promoters – 86%,
passives/detractors - 61%), recreation and adventure (promoters - 98%,
passives/detractors - 71%), local directional signage (promoters - 81%,
passives/detractors - 57%), signage on Trans-Canada Highway 1 (promoters - 89%,
passives/detractors - 70%), and the overall experience in Golden (promoters - 100%,
passives/detractors - 76%).
• Detractors were more likely to respond that there were products or services that
would enhance their visit (promoters - 35%, passives/detractors - 48%).
• Promoters were much more likely to state they were likely to return to Golden than
passives/detractors (promoters - 100%, passives/detractors - 70%).
Yes Yes

2017 Golden Summer Visitor Survey
42
APPENDICES
Appendix A. Data Weight and Sample Distribution Tables
Appendix B. Other NPS Results
Appendix C. Questionnaires
Note: Data tables are available for review under separate cover.

2017 Golden Summer Visitor Survey
43
Appendix A. Data Weight and Sample Distribution Tables
Weights
Data weighting is used to ensure that survey responses are
representative of the visitor population. In this case,
responses of visitors that stayed overnight in paid overnight
accommodation were adjusted (or weighted) to represent
the accommodation capacity in four areas including, Kicking
Horse Mountain Resort, downtown Golden,
accommodations near Trans-Canada Highway 1 and the
Front Country/Blaeberry Valley. There were two sets of
weights – one for the on-site interview and another
for the follow-up survey responses. Overall, the
impact of data weighting was minimal given all
weights were values of less than ‘3’.
Sample Distribution Location In summer 2017, on-site interviews were conducted
at VISAH site (in August) instead of the closed BCVC.
In addition, in 2017, there were fewer follow-up
survey responses from visitors interviewed at KHMR
compared to 2016. This has resulted in a larger
percentage of follow-up responses from visitors
interviewed at the VISAH and in downtown Golden.
Market The on-site had a similar distribution of survey responses in 2017 comparted to 2016. There was a higher percentage of follow-up responses from BC residents in 2017 compared to 2016.
Data Weights On-Site
Interview Follow-Up
Survey KHMR 0.4104 0.5019
Downtown Golden 1.3816 1.1752
Near Highway 1 1.2040 1.2027
Front Country/Blaeberry Valley 1.6219 1.2263
Sample Distribution By Interview Location
Completed On-Site Completed Follow-Up
2017 2016 2017 2016 KHMR 381 (35%) 624 (37%) 66 (28%) 164 (39%)
VISAH (2017)/BCVC (2016) 175 (16%) 233 (14%) 46 (19%) 41 (10%)
Highway 1 Corridor 108 (10%) 236 (14%) 17 (7%) 52 (12%)
Downtown Golden 425 (39%) 597 (35%) 111 (46%) 168 (40%)
TOTAL 1,089 1,690 240 425
Sample Distribution By Market
Completed On-Site Completed Follow-Up 2017 2016 2017 2016
BC 202 (19%) 272 (16%) 52 (22%) 63 (15%)
Alberta 343 (32%) 656 (39%) 89 (37%) 191 (45%)
Other Canada 169 (16%) 250 (15%) 31 (13%) 69 (16%)
USA 126 (12%) 156 (9%) 26 (11%) 36 (8%)
Overseas 248 (23%) 342 (20%) 41 (17%) 66 (16%)
Total 1,0891 1,6761 2391 425
1. 1 follow-up response did not have a market origin category.
2017 Golden Summer Visitor Survey
44
Appendix B. Other NPS Results Other published NPSs for tourism destinations include:
• British Columbia’s NPS was 58.3 in 2016.8 Destination British Columbia tracks NPS annually and targets an improvement of 0.5 points per year and
saw slight declines from NPS = 62 (2015). DBC notes this may be due increasing room rates and rainy weather.
• Destination Canada’s Global Tourism Watch studies measures the NPS for Canada through surveys of long-haul travellers in key markets around the
world. In 2014/15, Canada’s NPS varies by market, including: Mexico (2015 NPS = 68), India (2015 NPS = 61), Brazil (2015 NPS = 53), Germany (2014
NPS = 51) China (2014 NPS = 47), the United Kingdom (2014 NPS = 41), Canada (domestic travellers, 2015 NPS = 40), Australia (2014 NPS = 37),
France (2015 NPS = 36), the United States (2015 NPS = 28), South Korea (2014 NPS = 11) and Japan (2015 NPS = --7).9
• New Zealand’s Visitor Experience Monitor tracks the NPS for international visitors. Overall New Zealand has a NPS of 76. In 2015, New Zealand’s
best promoters were the Unites States (NPS = 87), the UK (NPS = 82), Australia (NPS – 82) and Germany (NPS = 82).10
• Kelowna measured NPS in 2016 the total over three seasons was NPS = 65.11 Results varied by season (Spring NPS = 72, Summer NPS = 53 and Fall
NPS = 67).
• Steamboat Springs, Colorado12 has measured NPS since 2010 (2010 NPS = 75, 2014 NPS = 67).
• Bend, Oregon measured NPS over a five-year period.13 In winter 2016/17 NPS = 78, down from summer 2016 Bend NPS = 82, while winter 2015/16
NPS = 80. This was higher than past summer visitor research (NPS 2013 = 79, NPS 2012 = 75, NPS 2009 = 65 and NPS 2008 = 58).
• NPS was measured for Australian destinations in 2006 with scores ranging from -55 (Adelaide) to 80 (Broome).14
Past research has shown that NPS in the tourism industry can vary by15:
• Market of origin (this could be a result of actual experience differences or interpretation of response scales),
• Repeat vs. first time visitors,
• Household composition (households with children, households without children, empty nesters),
• Community length of stay (day vs. overnight visitors),
8 Measured short-haul markets only. https://www.destinationbc.ca/getattachment/About-Us/Corporate-Documents/DBC-2016-17-Annual-Service-Plan-Report-FINAL.pdf.aspx 9 Destination Canada (2014/15). Global Tourism Watch Reports. https://www.destinationcanada.com/en/intelligence?market=7#tourismincanada 10 Tourism New Zealand Insight Team (2015). Visitor Experience Monitor 2015 Infographic. http://www.tourismnewzealand.com/markets-stats/research/infographics/visitor-experience/ 11 https://www.tourismkelowna.com/about-us/tourism-research/ 12 Mount, I. (2014). A Whole Town in Colorado Pushes to Improve its Customer Service. New York Times. http://www.nytimes.com/2014/10/16/business/smallbusiness/a-whole-town-tries-to-improve-its-customer-service-how-could-we-be-a-70.html?_r=0 13 RRC Associates Inc. (2016). Bend Area Winter Visitor Survey—Final Results 2016/17. Prepared for https://www.visitbend.com/Bend-Winter-16-17-Visitor-Survey-FINAL.pdf 14 Ritson, Mark (2006). Net Promoter Scores Australia 2006. Melbourne Business School. 15 This list has been compiled from a variety of sources including results from the Bend, Oregon study, the CTC’s Global Tourism Watch studies, New Zealand’s Visitor Experience Monitor, Destination BC and other confidential sources.

2017 Golden Summer Visitor Survey
45
• Primary trip purpose (business vs. leisure trips),
• Destination characteristics (factors) that drive destination selection, and
• Seasonal visits, probably related to primary trip activity (e.g. ski/winter vs. summer).

2017 Golden Summer Visitor Survey
46
Appendix C. Questionnaires
C1. On-Site Interview S1. Date __________ S2. Location Choose one
1. KHMR - Plaza 2. KHMR - Glacier Lodge 3. KHMR - Other 4. Hotel - Ramada 5. Hotel - Holiday Inn 6. Hotel - Prestige 7. Municipal Campground 8. VISAH 9. DWTN - Spirit Square/KH Bridge 10. DWTN – Farmers Market 11. DWTN - Art Gallery 12. DWTN – Retail Store (e.g. Café/Bookstore) 13. DWTN - Street 14. DWTN - Other 15. Other location (not KHMR or DWTN) __________
S3. Researcher?
1. Researcher 1 2. Researcher 2 3. Researcher 3 4. Other, initials please __________
Q1. My name is ${S3} and I’m conducting a survey on behalf of Tourism Golden. Would you have approximately 5-8 minutes to answer some questions? 1. Yes go to q2. 2. No TERMINATE.

2017 Golden Summer Visitor Survey
47
Q2. Are you...? 1. A visitor staying in Golden for 0 to 29 days - go to q3. 2. A seasonal visitor staying for 30 days or more - thank you and TERMINATE. 3. A resident of Golden/Area A -thank you and TERMINATE. 4. A property owner in Golden or Kicking Horse, but not resident -thank you and TERMINATE. Q2a. Have you or anyone in your travel party already been approached to complete a survey by a Tourism Golden researcher on this trip? By travel party, we mean the people who are sharing expenses during the trip. 1. Yes -thank you and TERMINATE. 2. No - go to q2b Q2b. Are you over 19 years of age? 1. Yes - go to q3 2. No - thank you and TERMINATE. Q3. Where do you live? Defined as your usual place of residence....choose one 1. BC - go to q6a 2. Alberta - go to q6c 3. Other Canada - go to q4 4. USA - go to q5 5. Overseas - go to q7 Q4. Province? - go to q4a
1. Ontario 2. Quebec 3. Manitoba 4. Saskatchewan 5. Nova Scotia 6. New Brunswick 7. Newfoundland 8. PEI 9. Yukon 10. NWT 11. Nunavut
2017 Golden Summer Visitor Survey
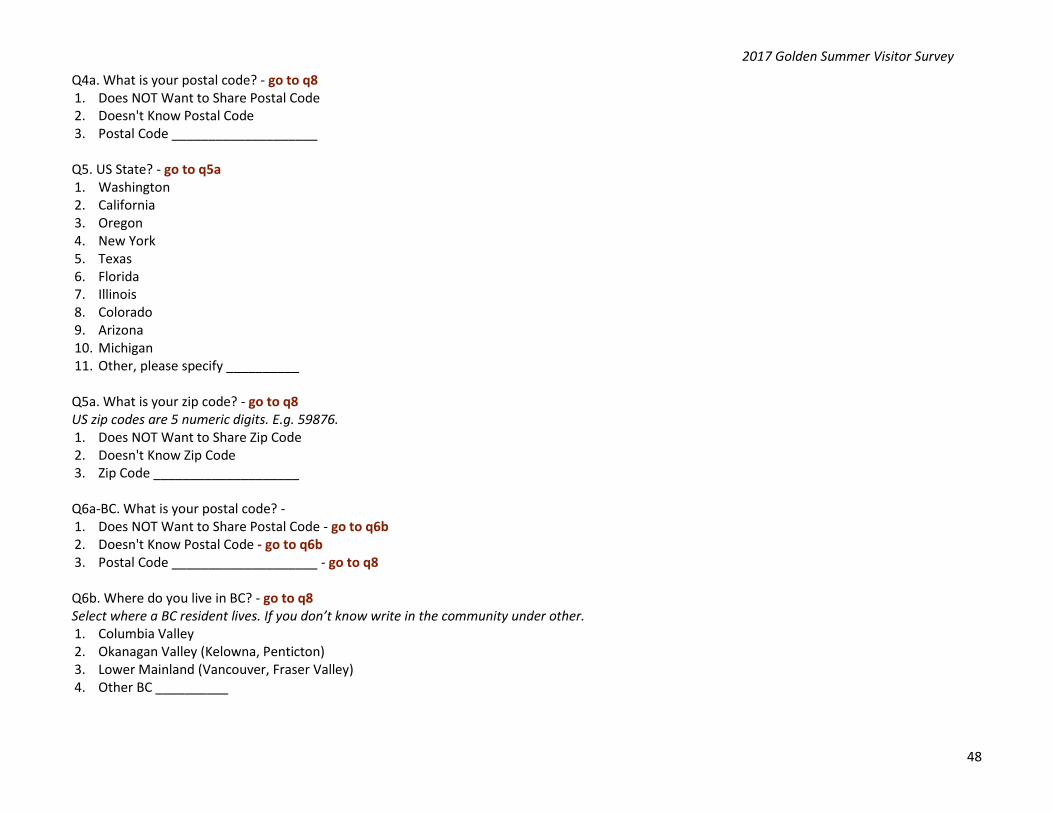
48
Q4a. What is your postal code? - go to q8 1. Does NOT Want to Share Postal Code 2. Doesn't Know Postal Code 3. Postal Code ____________________ Q5. US State? - go to q5a 1. Washington 2. California 3. Oregon 4. New York 5. Texas 6. Florida 7. Illinois 8. Colorado 9. Arizona 10. Michigan 11. Other, please specify __________ Q5a. What is your zip code? - go to q8 US zip codes are 5 numeric digits. E.g. 59876. 1. Does NOT Want to Share Zip Code 2. Doesn't Know Zip Code 3. Zip Code ____________________ Q6a-BC. What is your postal code? - 1. Does NOT Want to Share Postal Code - go to q6b 2. Doesn't Know Postal Code - go to q6b 3. Postal Code ____________________ - go to q8 Q6b. Where do you live in BC? - go to q8 Select where a BC resident lives. If you don’t know write in the community under other. 1. Columbia Valley 2. Okanagan Valley (Kelowna, Penticton) 3. Lower Mainland (Vancouver, Fraser Valley) 4. Other BC __________

2017 Golden Summer Visitor Survey
49
Q6c-AB. What is your postal code? 1. Does NOT Want to Share Postal Code - go to q6d 2. Doesn't Know Postal Code - go to q6d 3. Postal Code ____________________ - go to q8 Q6d. Where do you live in Alberta? - go to q8 Select where AB resident lives. If you don’t know write in the community under other. 1. Calgary 2. Edmonton 3. Red Deer 4. Bow Valley 5. Fort McMurray 6. Lethbridge 7. Other AB __________ Q7. Overseas Country - What country do you live in? - go to q8 Choose one of the following or fill in other for Europe, Asia or Other International. 1. NA - Mexico 2. Europe - United Kingdom 3. Europe - Germany 4. Europe - Netherlands 5. Europe -Switzerland 6. Oceania - Australia 7. Oceania - New Zealand 8. Asia - China 9. Asia - Japan 10. Asia - S. Korea 11. Asia - Taiwan 12. Other Country (type in name) ____________________ Q8. How many people are in your travel party during this trip? By travel party we mean the people who are sharing expenditures with on this trip. 1. Don't Know- go to q9 2. Alone - go to q10 3. Number ____________________ - go to q9

2017 Golden Summer Visitor Survey
50
Q9. Who is in your travel party? Who are you traveling with... - go to q10 Please select all that apply.
1. Alone/by Myself 2. Spouse/Partner 3. Child/Children Under the Age of 16 4. Child/Children Over 16 5. Parent(s) 6. Sibling(s) 7. Extended Family 8. Friend(s) 9. Colleague(s) 10. Prefer Not to Answer
Q10. Are you an independent traveller or are you travelling as part of a group where your accommodations and activities were booked for you? Group travellers are those that had their accommodation and/or activities booked for them by a third party (e.g. tour operator, travel agent). If it was a family member or friend that booked the accommodation or activity, the traveller is still considered to be independent. 1. Independent - go to q11 2. Group - go to q10a Q10a. What kind of group is it? A... - go to q11 1. Leisure Tour Group (e.g. bus tour) 2. Sports Group (e.g. mtn. biking group) 3. Arts Group (e.g. travelling choir) 4. Business/Group of Colleagues 5. Other type of group, please specify __________________________________________________ Q11. What is your total trip length? How many nights away you away from home on this trip? - go to q12 Fill in the number of nights, the answer should be a numeric value. The value should be less than 365. 1. Don't Know 2. Nights ____________________ Q12. How would you describe the trip that you are on? Is it a trip where... Where you will spend the most time. Select one. 1. Golden/Golden is the primary destination - go to q14 2. You are on route to another primary destination - go to q13 3. You are on a touring trip where you are travelling to multiple places without a primary destination - go to q13

2017 Golden Summer Visitor Survey
51
Q13. Where is your primary destination? - go to q14 The primary destination is where you will spend the most time 1. Don't Know 2. Primary Destination __________________________________________________ Q14. Today, are you on a day trip or overnight trip to Golden? - Choose one. 1. Overnight - go to q15 2. Day - go to q20 3. Don't Know/No Response - go to q20 Q15. How many nights will you spend in Golden? - Fill in in the number of nights, the response should be numeric and less than 30. go to q16 (if at accommodation property and staying overnight) go to q17 (if at non-accommodation site and staying overnight) 1. Don't Know 2. Nights ____________________ Q16. Are you staying in this hotel? 1. Yes - go to q21 2. No - go to q17 Q17. In Golden, are you staying in paid roofed accommodations, camping or with friends and family? Choose one response. Golden Eco Adventure Ranch is camping. Buffalo Ranch and Quantum Leaps are considered paid roofed accommodation. 1. Paid Roofed Accommodations - go to q18 2. Camping- go to q18 3. Friends/Family- go to q21 4. Other, please specify __________ - go to q21
Q18. What is the location of your accommodation or campsite? – if camping go to q21 otherwise go to q19 1. Kicking Horse Mtn. Resort 2. Downtown Golden 3. Golden Adjacent to Highway 1 4. Front Country (Blaeberry Valley/ Columbia Valley/ Golden West) 5. Don’t Know 6. Other __________

2017 Golden Summer Visitor Survey
52
Q19. What type of accommodation are you staying in? Would you describe it as a... - go to q21 1. Hotel/Motel - go to q21 2. Bed & Breakfast - go to q21 3. Cabin or Chalet - go to q21 4. Condo / Self Catering Hotel - go to q21 5. Hostel - go to q21 6. Private Home Rental (e.g. Airbnb, VRBO) - go to q19b 7. Backcountry Lodge - go to q21 8. Don't Know - go to q21 9. Other __________ - go to q21 Q19b. How would you describe your Private Home Rental? Is it a….. 1. An entire home/lodge/cabin 2. An entire condo/apartment 3. A private room or rooms in a home/lodge/cabin 4. A private room or rooms in a condo/apartment 5. Other
Q20. How many hours will you spend in Golden? Fill in the number of hours the answer must be numeric and less than 24 hours. - go to q21 1. Don't Know 2. Hours ____________________ Q21. Have you been to Golden on a past trip other than just stopping for a rest break (e.g. gas/food)? If yes, in what seasons? Select all responses that apply. 1. Yes – Winter - go to q23 2. Yes – Spring - go to q23 3. Yes – Summer - go to q23 4. Yes – Fall - go to q23 5. No - go to q22 Q22. Were you aware of Golden before planning this visit? - go to q23 1. Yes
2. No

2017 Golden Summer Visitor Survey
53
Q23. What is the main reason for your trips/stop in Golden? - go to q24 Choose one. Primary activity is what motivated your trip or what you will spend the most time doing while in Golden. 1. Attend or Be in a Wedding 2. Break from Driving/Convenient Place to Stop 3. Business/Corporate Meeting or Event 4. Family Vacation 5. Summer Kicks Concert 6. Other Festival or Concert in Golden 7. General Relaxation 8. Included in Touring Itinerary 9. Sightseeing/Nature/Wildlife 10. Swiss Guides and other Heritage 11. Visiting Friends and Relatives 12. Visiting National Parks 13. Golf 14. Hiking 15. Mtn. Biking (General) 16. Mtn. Biking (Event/Race) 17. Mountaineering 18. Grizzly Bear Refuge at KHMR 19. Via Ferrata at KHMR 20. Paragliding/Hangliding 21. Sky Diving 22. Road Biking 23. Summer Kicks Concert 24. Whitewater Rafting 25. Watersports other than Whitewater Rafting (e.g. kayaking, canoeing, stand up paddleboard) 26. Other Activity _________ will pop up if selected 27. Other Education, Medical or Other Reasons __________ will pop up if selected

2017 Golden Summer Visitor Survey
54
Q24. While in Golden, have you or do you plan to go to the following places? - go to q25 Read the following places and select all that apply.
1. Eat in a Local Restaurant 2. Visit a Pub or Bar 3. Shop for Gifts or Clothing 4. Shop for Groceries 5. Buy Gas 6. Visit the Kicking Horse Pedestrian Bridge 7. Visit Kicking Horse Mountain Resort (KHMR) 8. Visit the Art Gallery of Golden 9. Visit the Golden Museum 10. Visit National Parks 11. Walk/Cycle the Rotary Trails 12. Visit the Northern Lights Wolf Centre 13. Attend a Concert/Event 14. NONE of the above
Q25. Are there any other activities that you or your travel party have or plan to participate in? Do NOT read responses, select all that apply. - go to q26 (if not at VISAH) - go to q27 (if at VISAH)
1. ATV Tour 2. Canoeing or Kayaking 3. Fishing 4. Golf 5. Hangliding/Paragliding 6. Hiking around Golden/KHMR 7. Hiking at Glacier or Yoho National Parks 8. Horseback Riding 9. KHMR - Grizzly Bear Refuge 10. KHMR - Via Ferrata 11. Mountaineering 12. Mountain Biking around Golden/KHMR 13. Sky Diving 14. Whitewater Rafting 15. NONE of the above listed activities 16. Other, summer activity ______________________________

2017 Golden Summer Visitor Survey
55
Q26. On this trip, have you, or do you intend to stop at the Golden Visitor Information and Services Hub (VISAH) on Highway 1? - go to q32 (if overnight and staying at paid accommodation) - go to q33 (if overnight and staying at VFR or day or unknown length of stay)
1. Yes 2. No 3. Don't Know 4. VISAH not open yet
Now just a few questions about this visitor services and amenities hub location. Q27. Why did you stop here (at the VISAH) today? - go to q28 Don't read responses, check all that apply
1. To Obtain A Map 2. To Obtain Route Info 3. To Obtain Accommodation Info (Not Camping) 4. To Obtain Camping Info 5. To Obtain Adventure / Recreation Activity Info 6. To Obtain Attractions Info 7. To Obtain Event Info 8. To Obtain Dining Info 9. To Take A Break From Driving 10. To Use WiFi 11. To Use The Washroom 12. To Use the Sanitation/Pump Out Station 13. Other Kind of Information/Service __________
Q28. Did you or anyone in your travel party speak with a Visitor Information Counsellor here today? - go to q29
1. Yes 2. No 3. Don't Know
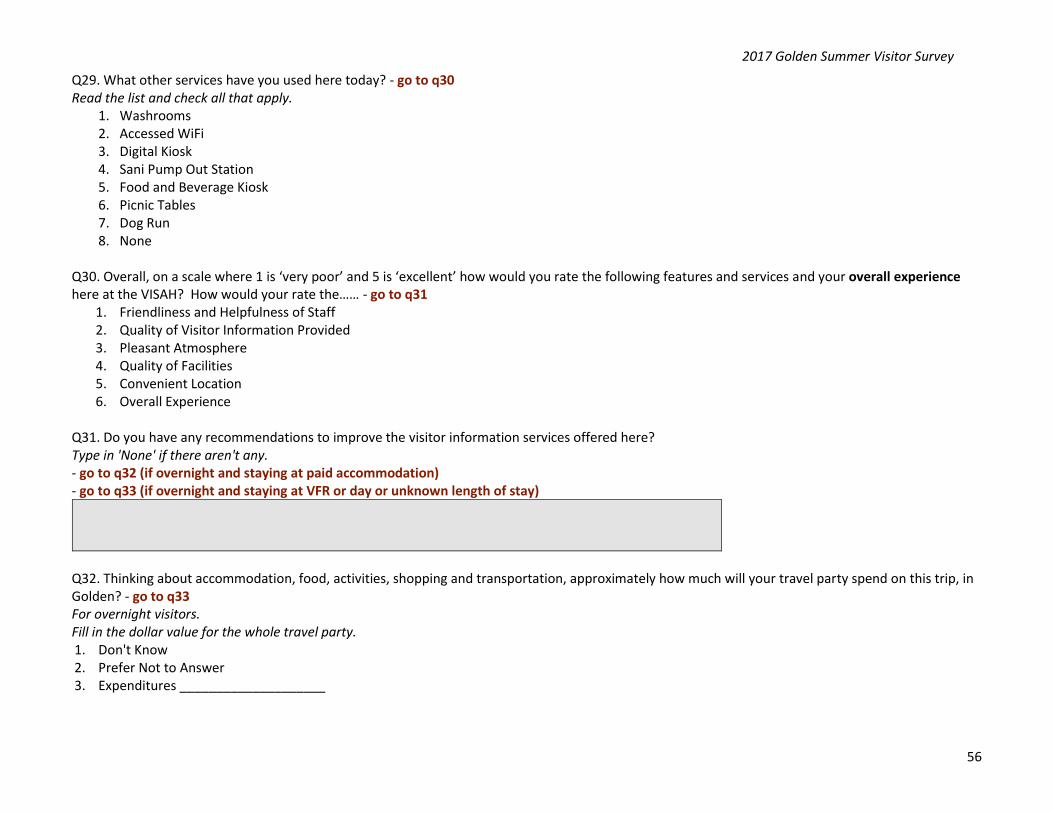
2017 Golden Summer Visitor Survey
56
Q29. What other services have you used here today? - go to q30 Read the list and check all that apply.
1. Washrooms 2. Accessed WiFi 3. Digital Kiosk 4. Sani Pump Out Station 5. Food and Beverage Kiosk 6. Picnic Tables 7. Dog Run 8. None
Q30. Overall, on a scale where 1 is ‘very poor’ and 5 is ‘excellent’ how would you rate the following features and services and your overall experience here at the VISAH? How would your rate the…… - go to q31
1. Friendliness and Helpfulness of Staff 2. Quality of Visitor Information Provided 3. Pleasant Atmosphere 4. Quality of Facilities 5. Convenient Location 6. Overall Experience
Q31. Do you have any recommendations to improve the visitor information services offered here? Type in 'None' if there aren't any. - go to q32 (if overnight and staying at paid accommodation) - go to q33 (if overnight and staying at VFR or day or unknown length of stay)
Q32. Thinking about accommodation, food, activities, shopping and transportation, approximately how much will your travel party spend on this trip, in Golden? - go to q33 For overnight visitors. Fill in the dollar value for the whole travel party. 1. Don't Know 2. Prefer Not to Answer 3. Expenditures ____________________
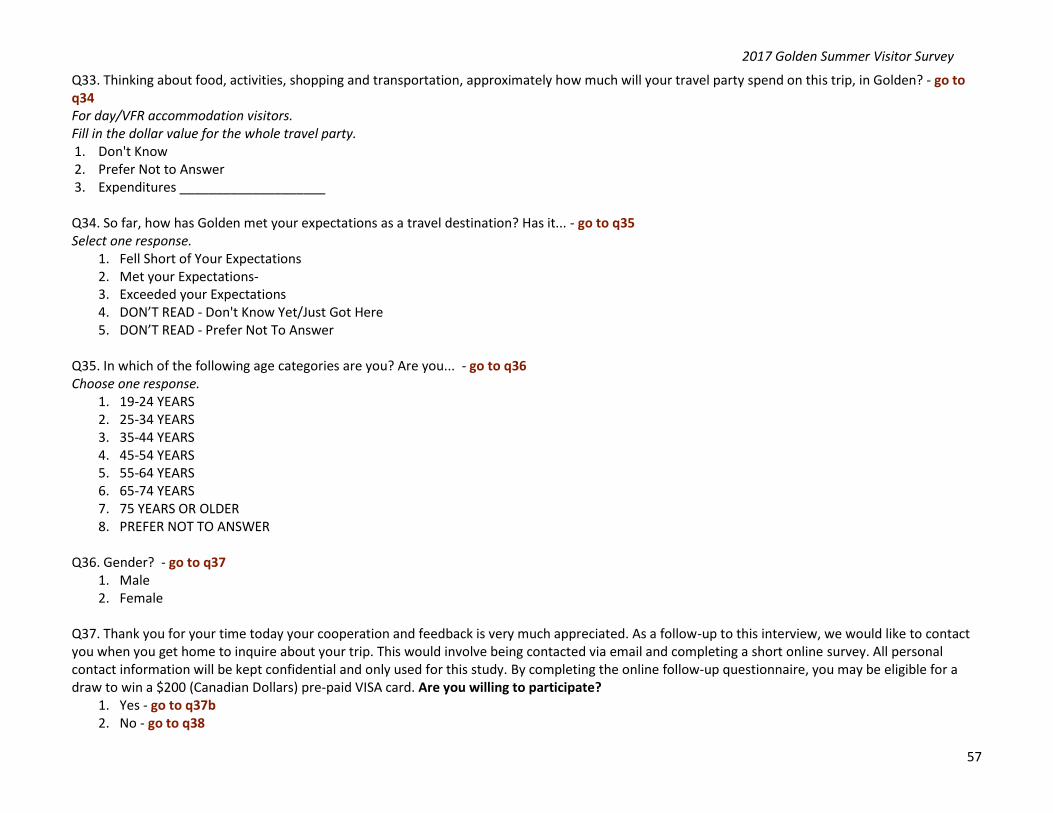
2017 Golden Summer Visitor Survey
57
Q33. Thinking about food, activities, shopping and transportation, approximately how much will your travel party spend on this trip, in Golden? - go to q34 For day/VFR accommodation visitors. Fill in the dollar value for the whole travel party. 1. Don't Know 2. Prefer Not to Answer 3. Expenditures ____________________ Q34. So far, how has Golden met your expectations as a travel destination? Has it... - go to q35 Select one response.
1. Fell Short of Your Expectations 2. Met your Expectations- 3. Exceeded your Expectations 4. DON’T READ - Don't Know Yet/Just Got Here 5. DON’T READ - Prefer Not To Answer
Q35. In which of the following age categories are you? Are you... - go to q36 Choose one response.
1. 19-24 YEARS 2. 25-34 YEARS 3. 35-44 YEARS 4. 45-54 YEARS 5. 55-64 YEARS 6. 65-74 YEARS 7. 75 YEARS OR OLDER 8. PREFER NOT TO ANSWER
Q36. Gender? - go to q37
1. Male 2. Female
Q37. Thank you for your time today your cooperation and feedback is very much appreciated. As a follow-up to this interview, we would like to contact you when you get home to inquire about your trip. This would involve being contacted via email and completing a short online survey. All personal contact information will be kept confidential and only used for this study. By completing the online follow-up questionnaire, you may be eligible for a draw to win a $200 (Canadian Dollars) pre-paid VISA card. Are you willing to participate?
1. Yes - go to q37b 2. No - go to q38

2017 Golden Summer Visitor Survey
58
Q37b. What email should we use for that purpose? - go to q39
1. Don't Know 2. This email: __________________________________________________
Q38. Would you like to receive a monthly e-newsletter from Tourism Golden with information about news and events in Golden? Your personal information is for use by Tourism Golden only and will not be shared with any other organizations. You are able to unsubscribe to the email e-newsletter at any point.
1. Yes - go to q38b 2. No -- conclusion
Q38b. What email should we use for that purpose?
1. The email already provided 2. This email: __________________________________________________
That concludes our interview. Thank you again for taking the time to speak with me today. Have a wonderful day and enjoy Golden. Q39. Researcher Comments/Suggestions:

2017 Golden Summer Visitor Survey
59
C2. Follow-Up Online Survey Section 1. This section is designed to better understand your tourism experiences in Golden. Q1. How did you originally find out about Golden?
o I Have Always Known about Golden
o Word of Mouth Recommendation
o I or My Family Used to Live in Golden
o Internet Search
o Magazine or Newspaper Article
o Golden Travel Planner or Other Tourism Literature
o Tour Operator Brochure/ Itinerary
o Travel Guide such as Lonely Planet/ Frommer’s
o Consumer Show - Calgary Bike Show
o Consumer Show - Calgary Outdoor Adventure Show
o Consumer Show - Vancouver Outdoor Adventure Show
o Sports Team, Activity Group or Club Event
o Highway Signage
o Highway Billboard Advertising
o Parks Canada Website
o Other, how? ______________________
o None of the Above Q2. On your trip to the Golden area, did you visit downtown Golden?
o Yes
o No
o Don’t Know

2017 Golden Summer Visitor Survey
60
Q3. How important were each of the following factors in deciding to visit Golden versus another location? Please select one response for every row.
1 - Not
Important At All
2 3 4 5 - Extremely Important
99 Don’t know/Prefer
not to answer 1 Is A Good Stop On Route To Another Destination
2 Not Too Far From Home
3 It is Familiar/I've Been There Before
4 Has Access to a Good Variety Of Outdoor Activities
5 Has Excellent Mountain Biking
6 Has Excellent Hiking
7 Has Excellent Whitewater Rafting
8 The Community Is Close In Proximity To Nature And
Wilderness
9 The Community is Close In Proximity to National and
Provincial Parks and Other Protected Areas
10 Has Friendly, Hospitable People
11 Has Small Town Charm
12 Has Friendly and Helpful Front Line Staff
13 Has Concerts and/or Public Events That I Wanted To
Attend
14 There Was A Personal Event (e.g. Wedding, Family
Reunion) That I Wanted To Attend
15 It Is A New Place To Explore
16 Offers Good Value For Money
17 I Have Friends and Family that Live in Golden
Q4. Did you pre-book/reserve your paid accommodations in Golden?
o Yes
o No go to q9
o Don’t Know go to q9
o I did not stay at paid accommodation while in Golden go to q9 Q5. How did you pre-book/reserve your accommodation? go to q9
o Directly with the Accommodation Property (online or by phone) go to q9

2017 Golden Summer Visitor Survey
61
o Online Travel Agent (e.g. Travelocity) go to q9
o Kicking Horse Central Reservations / SKI KICK go to q9
o Resort of the Canadian Rockies (RCR) Central Reservations go to q9
o Private Home Rental Service (e.g. Airbnb, VRBO) go to Q6
o Tour Operator, Which One? ______________________ go to q9
Q6. Which private home rental service did you use?
o Airbnb
o VRBO
o HomeAway
o Owner Direct
o Other, which one? ______________________ Q7. How important was the ability to book your accommodations through a private home rental service in your decision to visit Golden?
o 1 – Not At All Important
o 2
o 3
o 4
o 5 – Extremely Important
o Don’t Know Q8. If this kind of accommodation was not available in Golden, would you have still stayed overnight in Golden?
o Yes
o No
o Don’t Know

2017 Golden Summer Visitor Survey
62
Section 2. Trip Evaluation Q9. On a scale of 1 to 5, where 1 is ‘very poor’ and 5 is ‘excellent’, please rate your experience of each component of your visit to Golden.
1 – Very Poor 2 3 4 5 - Excellent 99 Don’t know/Prefer
not to answer 1 Accommodation 2 Dining 3 Recreation and Adventure Opportunities 4 Local Directional Signage 5 Signage on Trans Canada Hwy 1 6 Overall Experience in Golden
Q10. Given your experience in Golden, on a scale of 1 to 5, how likely are you to return on an overnight trip to Golden?
o 1 – Not At All Likely
o 2
o 3
o 4
o 5 – Extremely Likely
o Don’t Know/Prefer not to answer Q11. On a scale of 0 to 10 where 0 is ‘Not Likely at All’ and 10 is ‘Extremely Likely’, how would you rate your likelihood to recommend Golden as a travel
destination to friends/family or a colleague?
o 0 – Not At All Likely
o 1
o 2
o 3
o 4
o 5
o 6
o 7
o 8
o 9
o 10 – Extremely Likely
o Don’t Know/Prefer not to answer - go to q13 Q12. What about your trip to Golden led to your {{ Q13 }} out of 10 (Extremely Likely) response?

2017 Golden Summer Visitor Survey
63
Q13. Are there any new or expanded products, services or experiences that would enhance your visit to Golden?
o Yes, what are they? ______________________
o No
o Don’t Know Q14. Over the past year, have you regularly used social media (e.g. Facebook, Twitter, Instagram) or travel commentary/review (e.g. TripAdvisor)
applications?
o Yes
o No
o Don’t Know
Q15. Which social media or travel commentary/review applications have you used in the past year?
o Facebook
o Twitter
o Instagram
o YouTube
o TripAdvisor
o LinkedIn
o Yelp
o Pinterest
o Snapchat
o Google+
o Foursquare
o Tumblr
o Flickr
o Vine
o NONE

2017 Golden Summer Visitor Survey
64
Section 3. Next, we are interested in learning about the visitor information services that you used while in Golden. FOR visitors that we spoke with at NON-VISAH sites. In 2017, Tourism Golden invested in a Visitor Information Services and Amenities Hub (VISAH) which is a visitor information centre on the Trans Canada Highway.
Q16. Did you go to the VISAH?
o YES go to Q17
o NO go to Q23 FOR visitors that we spoke at the VISAH. While you were in Golden, we spoke with you at the Visitor Information Services and Amenities Hub (VISAH). We are interested in how the visitor information you obtained and how it impacted your trip and possibly future trips to Golden.

2017 Golden Summer Visitor Survey
65
Q17. First, what kinds of visitor information topics did you research and obtain at while in Golden? Did you obtain it at the VISAH or via another source (e.g. online or from someone or somewhere else in Golden)? Please select the kinds of information you obtained at the VISAH, through another source or if you did not research that topic. It's okay to select both the VISAH and another source of information for one topic.
At the VISAH Another Source in Golden Did Not Research This Topic
1 Accommodations
2 Events
3 Activities
4 Attractions
5 Restaurants/Dining
6 Shopping
7 Transportation
Q18. Did you extend your stay in Golden due to the information you collected at the VISAH?
o YES, I stayed a few extra hours (less than 1 night). How many extra hours? _______
o YES, I stayed for at least one extra night. How many extra nights? ______
o NO Q19. Did you participate in any new activities, go to new places or attend events in Golden that you didn’t previously know about?
o YES, What were they? _________ go to 20
o NO go to 21
Q20. Did this result in spending additional money that you hadn’t anticipated?
o YES, About how much additional money did you spend? ________
o NO
Q21. On a scale of 1 to 5, how likely are you to take a future overnight trip to Golden as a result of the information obtained at the VISAH? 1 – Not
at All Likely
2 3 4 5 – Very Likely
99 Don’t know/Prefer
not to answer 1 Future Overnight Trip

2017 Golden Summer Visitor Survey
66
Q22. Please state your level of agreement with this statement, The visitor information I obtained while I was at the VISAH in Golden resulted in me or
my travel party... go to 30 1 – Do
Not Agree At All
2 3 4 5 – Strongly
Agree
99 Don’t know/Prefer
not to answer
1 Improving the Overall Quality of My Experience in Golden
For visitors that did not go to the VISAH Q23. What kinds of visitor information topics did you research and obtain while you were in Golden?
Please select all that apply. 1. Accommodations 2. Events 3. Activities 4. Attractions 5. Restaurants/Dining 6. Shopping 7. Transportation 8. Other Topics, what other topics? ______________________ 9. None of the Above
Q24. Which of the following WORD of MOUTH sources of visitor information did you use to help plan your trip to Golden? Please click if you used the following information sources before your trip or during your trip? If you didn’t use any sources before or during your trip please click NONE. Select all that apply in each column.
BEFORE your Trip
DURING your Trip
1 Word of mouth information from friends and family 2 Word of mouth information from local business (e.g.
accommodation, gas station, grocery store)
3 Word of mouth information from Golden locals (not a business)

2017 Golden Summer Visitor Survey
67
Q25. Which of the following ONLINE sources of visitor information did you use to help plan your trip to Golden before or during your trip? BEFORE
your Trip DURING your Trip
1 Search Engine (Google, Bing, Yahoo etc.) 2 Online Travel Agency (e.g. Expedia, Booking.com, etc.)
3 Online Maps (e.g. Google Maps, MapQuest)
4 Social Media (e.g. Facebook, Twitter, Instagram)
5 Travel Commentary/Review Websites (e.g. TripAdvisor, Yelp, Zomato)
6 Online Travel Guide Websites (e.g. Lonely Planet/Frommer’s)
7 Tourism Golden Website (tourismgolden.com)
8 Kicking Horse Mountain Resort Website (kickinghorseresort.com)
9 Kootenay Rockies Tourism Website or App (kootenayrockies.com)
10 Specialist Activity Website or App (e.g. mountain biking/skiing)
11 Destination BC Website (Hellobc.com)
12 Destination Canada Website (keepexploring.com)
13 Parks Canada Website (pc.gc.ca)
14 Other Online Source
Q26. You responded you used a search engine to gather information about Golden. What kinds of search terms did you use? This is only asked if they
selected search engines on the previous question. Please select all that apply. 1. Destination-Related Terms (e.g. Golden) 2. Price-Related Terms (e.g. cheap hotels) 3. Specific-Brand or Website Names (e.g. Holiday Inn Hotels) 4. Activity-Related Terms (e.g. restaurants in Golden) 5. Terms Related to Specific Wants or Needs (e.g. coffee shops in Golden, dog-friendly hotels in Golden) 6. None of the Above 7. Other, please specify: __________________ 8. Don’t Know

2017 Golden Summer Visitor Survey
68
Q27. Which of the following PRINTED/PAPER sources of visitor information did you use to help plan your trip to Golden before or during your trip? BEFORE
your Trip DURING your Trip
1 Golden Travel Planner 2 Printed Maps that include Golden
3 Kootenay Rockies Golf Vacation Guide
4 Printed Travel Guide such as Lonely Planet/ Frommer’s
5 Other Printed Source
Q28. Which of the following OTHER sources of visitor information did you use to help plan your trip to Golden before or during your trip? BEFORE
your Trip DURING your Trip
1 Consumer Show 2 Chamber of Commerce Office (Downtown Golden)
3 Vehicle’s GPS system
Q29. How did that visitor information impact the rest of your time in Golden? Please rate your level of agreement with the following statements.
The visitor information I obtained while I was in Golden resulted in me or my travel party... go to 30 1 – Do
Not Agree At All
2 3 4 5 – Strongly
Agree
99 Don’t know/Prefer
not to answer
1 Staying Longer in Golden than I Originally Anticipated 2 Participating in Activities in Golden that I Did Not Originally Plan on
Doing
3 Visiting Places That I Didn’t Already Know about in Golden 4 Spending Money That I Hadn’t Anticipated on Spending While in
Golden
5 Improving the Overall Quality of My Experience in Golden 6 Increasing the Likelihood of Returning to Golden
FOR VISAH and NON-VISAH Visitors Q30. Were you able to obtain all of the visitor information about Golden that you needed?
o Yes
o No What weren't you able to find? ______________________
o Don't Know

2017 Golden Summer Visitor Survey
69
Q31. While in Golden, were you able to access the Internet via a WiFi connection when you needed it?
o Yes
o No, Where weren't you able to find WiFi? ______________________
o Don't Know Q32. Where did you gain access to WiFi? Please select all that apply.
1. Accommodation 2. Community WiFi hot spot 3. VISAH 4. Local Business WiFi 5. Other, where? ______________________ 6. Don't Know
FOR VISAH and NON-VISAH Visitors Section 4. Expenditures: It is very important to understand the economic impact travellers have on their destination. This short section asks about your travel party’s expenditures while in Golden. Q33. In Canadian dollars, what were your travel party’s total expenditures while in Golden?
Please include all purchases, taxes and tips except long-haul flights or car rentals outside of Golden. If you pre-paid any items prior to leaving on your trip (e.g. accommodation, tours, etc.), please include these in your estimate. An estimate is fine.
o Canadian Dollars: $________________
o Don't Know
o Prefer Not to Answer

2017 Golden Summer Visitor Survey
70
Q34. Approximately what percentage of your party’s total expenditures while in Golden were attributed to the following categories? Please enter the appropriate proportions below, excluding long-haul flights. Please insert '0' for those categories you did not spend any money in. The sum of your answers should equal 100%.
1 Accommodation (hotels, motels, lodge, camping/RV fees, etc.) ________%
2 Transportation (short-haul flights within British Columbia, vehicle rental, gas, repairs, ferry, taxi, bus, etc.)
________%
3 Food and Beverage (including taxes and tips) ________%
4 Shopping (clothing, gifts, books, etc.) ________%
5 Attractions (admission, shows, tours, etc.) ________%
6 Outdoor Recreation (park pass, nature guide, etc.) ________%
7 Other Entertainment (casino, spa, etc.) ________%
8 Other Expenditures ________%
FOR VISAH and NON-VISAH Visitors Section 5. Finally, we just have a few questions about you so we can better understand visitors to Golden. Q35. What is the highest level of education that you have completed?
o Some Secondary School
o Secondary School Diploma
o Some Postsecondary Education
o Trade Certificate or College diploma
o University Undergraduate Degree
o University Post-Graduate Degree
o Prefer Not to Answer Q36. What is your total annual household income (in Canadian dollars), before tax (i.e. the combined income of all members of your household)?
o Under C$20,000
o C$20,000 to C$39,999
o C$40,000 to C$59,999
o C$60,000 to C$79,999
o C$80,000 to C$99,999
o C$100,000 to C$149,999
o C$150,000 or over
o Prefer Not to Answer
o Don't Know

2017 Golden Summer Visitor Survey
71
Q37. Is there anything else you would like to tell us about your experience in Golden?
FOR VISAH and NON-VISAH Visitors Conclusion: Thank you for your time today – your cooperation and feedback is very much appreciated. FOR ELIGIBLE VISITORS Q38. You may be eligible for a draw to win a $200 (Canadian Dollars) pre-paid VISA card. In order to enter you, we will need your name and email
address. This information will be kept confidential and used only to administer the draw. Would you like to be entered into the draw to win? Click here for full contest rules and regulations 1. Yes 2. No
Q39. Did you read the contest rules and regulations? Yes, I certify that I have read the contest rules and regulations
Q40. Please provide your first name ______________________________
Q41. If you win how would you like us to contact you?
o The email address this survey was sent to
o A different email, type here q42. ________________
o Telephone, my 10-digit telephone number is q 43. _____________ Q42. My preferred email address is: ________________ Q43. My 10-digit telephone number is: ________________