Golden Decade for - Alok Industries Textile Trade -Golden Period... · Spain 8.3 11.3 13.3 13.4...
48
Dec, 2014 Golden Decade for India’s Textile and Apparel Industry Report on
Transcript of Golden Decade for - Alok Industries Textile Trade -Golden Period... · Spain 8.3 11.3 13.3 13.4...

Dec, 2014
Golden Decade for India’s Textile and Apparel Industry
Report on

2
Contents
1. Global Textile and Apparel industry overview and market trends…………………………………………. 4
– Global consumption and trade trends
– Major exporting and importing countries
– Slowdown of China’s growth
– India’s strengths in global market
2. Continued domestic market growth story……………………………………………………………………………. 28
– Domestic market growth drivers
– Future projections for domestic market
3. Factors affecting the overall growth of the Industry……………………………………………………………... 37
– Investment trends
– Government support including “Make in India”
4. Indian companies have started competing at the global stage……………………………………………… 44
– Performance of leading companies

Section 1: Global Textile & Apparel Industry Overview & Market Trends
• Global consumption and trade trends
• Major exporting and importing countries
• Slowdown of China’s growth
• India’s strengths in global market

4
Global Textile and Apparel Trade Continues to Grow
473
723 707 770
1180
0
200
400
600
800
1000
1200
1400
2005 2011 2012 2013 2020
US$ bn Global Textile & Apparel Trade
6.6% CAGR
Apparel 56% Fabric
17%
Yarn 7%
Fibre 6%
Made Ups 4% Others
10%
Category wise Share of Global Trade (2013)
Source: UN Comtrade, CII Knowledge report and Wisedge Analysis
5.9% CAGR
Global textile and apparel trade recovered in 2013 and is expected to grow @ 6.6% for next 7 years and reach a size of US$ 1.18 trillion by 2020
5
Major Categories Traded Globally
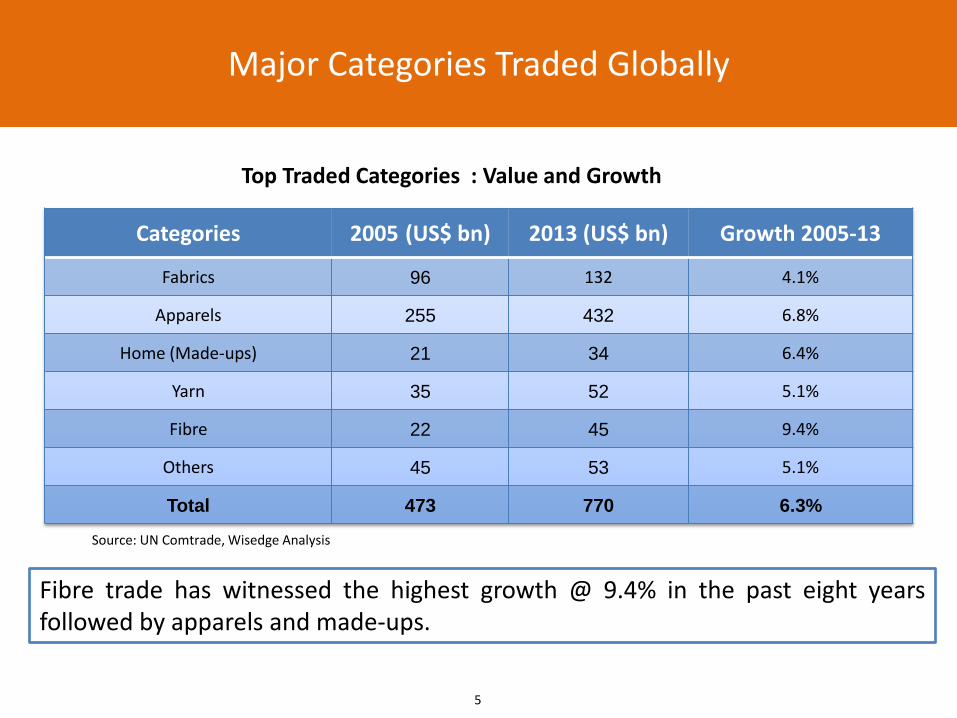
Top Traded Categories : Value and Growth
Source: UN Comtrade, Wisedge Analysis
Categories 2005 (US$ bn) 2013 (US$ bn) Growth 2005-13
Fabrics 96 132 4.1%
Apparels 255 432 6.8%
Home (Made-ups) 21 34 6.4%
Yarn 35 52 5.1%
Fibre 22 45 9.4%
Others 45 53 5.1%
Total 473 770 6.3%
Fibre trade has witnessed the highest growth @ 9.4% in the past eight years followed by apparels and made-ups.

6
Global Apparel Market Constituting 1.8% of the World GDP is Estimated to Cross US$ 2.1 Trillion by 2025
Source: FICCI, Knowledge paper on Driving growth through innovation
Global Apparel Market size projections (US$ Bn)
S No Region 2013 2025 CAGR
1 EU-27 355 440 2%
2 US 230 285 2%
3 China 165 540 10%
4 Japan 110 150 2%
5 Brazil 60 100 5%
6 India 46 200 12%
7 Russia 45 105 8%
8 Canada 30 50 4%
9 Australia 25 45 5%
10 Rest of the world 80 195 8%
Total 1,146 2,110 5%
EU27, US, China and Japan constitute almost 75% of the total market

7
Sweaters, Jerseys, Jeans & Trousers Are The Most Globally Traded Sub-categories
Top Traded Sub-categories
Source: UN Comtrade, Wisedge Analysis
Categories 2013 (US$ bn) Growth 2005-13
Sweaters 49 6%
Jeans & Others 47 5%
T-Shirts 40 6%
Trousers 39 9%
Made-ups 34 6%
Jackets 35 10%
Women’s dresses 25 23%
Special Woven Fabrics 22 4%
Cotton Fibre 23 14%
Blouses 17 3%
Shirting Fabric 17 4%
Cotton Yarn 15 7%
Woven Shirts 16 5%
Polyester Filament Yarn 9.5 11%
Polyester Staple Fibre 4.3 8%
Polyester SF Spun Yarn 0.08 10%

8
Top and High Growing Exporters: Asian Countries Dominate
Vietnam is the most
promising exporter in terms
of growth amongst
top exporters
Top exporting countries with their growth in Textile & Apparel Exports since 2005 Countries 2005 2010 2011 2012 2013 CAGR 2005-13
China 107.5 198.9 239.8 245.0 283.9 12.9%
India 17.0 27.1 33.4 32.7 40.2 11.3%
Bangladesh 7.7 17.9 23.8 23.8 25.5 16.2%
Vietnam 5.3 13.5 17.4 18.0 19.3 17.5%
Spain 8.3 11.3 13.3 13.4 15.5 8.2%
The Netherlands 7.6 10.2 13.6 12.3 13.1 7.1%
Australia 3.0 3.3 5.5 5.8 5.4 7.7%
Poland 3.6 5.2 5.9 5.4 6.0 6.4%
Cambodia 2.2 3.1 4.0 4.3 4.6 9.5%
Sri Lanka 2.9 3.6 4.3 4.1 4.4 5.3%
Pakistan 10.3 11.6 13.6 12.9 13.7 3.6%
Indonesia 0.0 0.0 13.3 12.5 12.7 -
Turkey 18.7 21.5 24.5 25.1 27.2 4.8%
South Korea 13.7 13.5 15.5 15.1 15.4 1.5%
Rest 265 258 295 277 283 0.8%
Total 473 598 723 707 770 6.3% Source: UN Comtrade, Wisedge Analysis

9
Top Textile & Apparel Importing Countries
Country 2005 2010 2011 2012 2013 CAGR (2005-13)
USA 97 100 108 108 131 4%
China & Hong Kong 55 57 65 67 69 3%
Germany 36 48 57 50 62 7%
Japan 27 33 41 42 54 9%
The United Kingdom 31 33 37 31 39 3%
France 25 28 31 28 31 3%
Italy 21 26 30 25 29 4%
Spain 14 18 20 17 20 5%
The Netherlands 9 12 15 14 16 8%
Russian Federation 2 9 11 13 12 25%
Rest 154 235 308 313 308 9%
Total 473 598 723 707 770 6%
* EU27 196 233 269 235 270 4%
Top textile & apparel importing countries since 2005 (US$ bn)
Source: UN Comtrade, Wisedge Analysis

10
Developed Countries Continue to be the Major Importers Although Several New Markets are Emerging
Categories 1 2 3 4 5 Combined
Share
Woven Shirts USA Germany Japan UK France 54%
Men's Trouser USA Japan UK Germany France 56%
Women's Trousers/skirts
USA Japan Germany UK France 58%
Women's Dresses USA UK Japan Germany France 53%
T-Shirts/Knits USA Germany UK Japan France 50%
Jeans & related garments
USA Germany UK France Japan 54%
Suits Japan USA Germany Italy France 55%
Sweaters & jerseys etc.
USA Japan Germany Hong Kong UK 61%
Outerwear (Jackets / overcoats)
USA Germany Japan UK France 49%
Men's innerwear USA Japan Germany UK France 58%
Lingerie USA Japan Germany France Hong Kong 52%
Countries 2012 Imports
(US$ bn) CAGR 2005-12
Russian Federation 8.2 43%
Brazil 2.2 44%
Turkey 2.3 23%
Poland 3.6 22%
Chile 2.5 21%
China 4 20%
Rep. of Korea 5.9 16%
Australia 5.6 15%
Countries with High Apparel Imports Growth
Top 5 Importing Countries for major apparel categories
Russia and Brazil also growing as an Import destination for apparel
Source: UN Comtrade

11
Fibre Trade has Grown Significantly
8 14
20 20 8
10
13 12
4
5
7 6
1
1
1 1
22
30
41 39
0
10
20
30
40
50
2005 2010 2011 2012
Cotton MMSF Wool Vegetable Fibre Silk Grand Total
US$ bn Fibre (staple fibre) Trade value
CAGR 2005-12 13% 6% 5% 5% 5% 9%
Fibre trade has grown at 9% CAGR since 2005 and strongly driven by growth in cotton trade largely due to China’s cotton policy in recent years
Source: UN Comtrade

12
Yarn Trade has also Grown, but at a Slower Pace
14 15 19 18
9 13
15 14 5
7
10 9
3
3
4 4
1
1
2 2
1
1
1 1
35
41
51 48
0
10
20
30
40
50
60
2005 2010 2011 2012
MMFY
Cotton
MMSF Spun Yarn
Wool
Other Yarn
Vegetable Fibre
Silk
Grand Total
High growth in trade of cotton and manmade spun yarn has driven the overall yarn trade. Overall growth in trade of yarn is less than fibre trade
US$ bn
3%
7%
8%
1%
4%
5%
-2%
5%
CAGR 2005-12
Source: UN Comtrade

13
Fabric Trade Growing Slowly Due to Consolidation of Textile Manufacturing Base
16%
8%
6% 4%
4% 62%
China & Hong Kong
Vietnam
USA
Indonesia
Germany
Others
26 26 32 29 18 24 28 28 17 18
23 23 16 20 24 22 10
11 14 13
9 8
9 8 96 107
129 123
0
50
100
150
2005 2010 2011 2012Cotton Knitted Fabric
MMFY Special Woven Fabrics
MMSF Fabric Others
Total
Global Fabric Trade by Type
Top Fabric Importers (% share)
US $bn
4%CAGR
Fabric trade has grown at a slower pace primarily due to consolidation of textile manufacturing base within Asia. Despite being a major fabric producer China also imports significant quantity of fabric contributing to the trade
Source: UN Comtrade
16%
8%
6%
4%
4%
62%

14
Apparel Trade has Grown Over the Years @ 7% CAGR
118 173 206 208
137
160 193 188 255
333
399 396
2005 2010 2011 2012
Knitted Woven Total
5.6 9.9 10.5 11
4.7
6.7 7.1 7 10.3
16.6 17.6 18
2005 2010 2011 2012
Knitted Woven Grand Total
US $bn Bn kg
Global Apparel Trade Trend (value)
Global Apparel Trade Trend (volume)
5 %
8 %
CAGR 2005-12
7 %
6 %
10 %
8 %
Knit apparel trade has grown at a faster rate than woven apparel
CAGR 2005-12
Key reasons for higher growth of knitted apparel trade : • Increasing fashion / design element in knitted garments for outdoor activities
especially for women and kids apparel • Improving comfort quality of knit garments over the years
Source: UN Comtrade

15
Made-ups has also Seen Steady Growth in Trade
2.3 3.3 3.9 4.4 5.1
6.8 7.6 7.6 7.6
10.4 12.0 11.2 4.5
6.3 7.4 7.2
1.0
1.2
1.4 1.4
20.6
28.0
32.1 31.8
0.0
5.0
10.0
15.0
20.0
25.0
30.0
35.0
2005 2010 2011 2012
Table Linen
Other Home Linen
Bed Linen
Furnishing
Blankets
Grand Total
US$ bn
5%
7%
6%
6% 10%
6%
Home textiles / made-ups trade has grown at a steady pace with bed linen having the highest trade share and higher growth in Blankets
Global Madeups Trade Trend
Source: UN Comtrade
CAGR (2005-12)
16
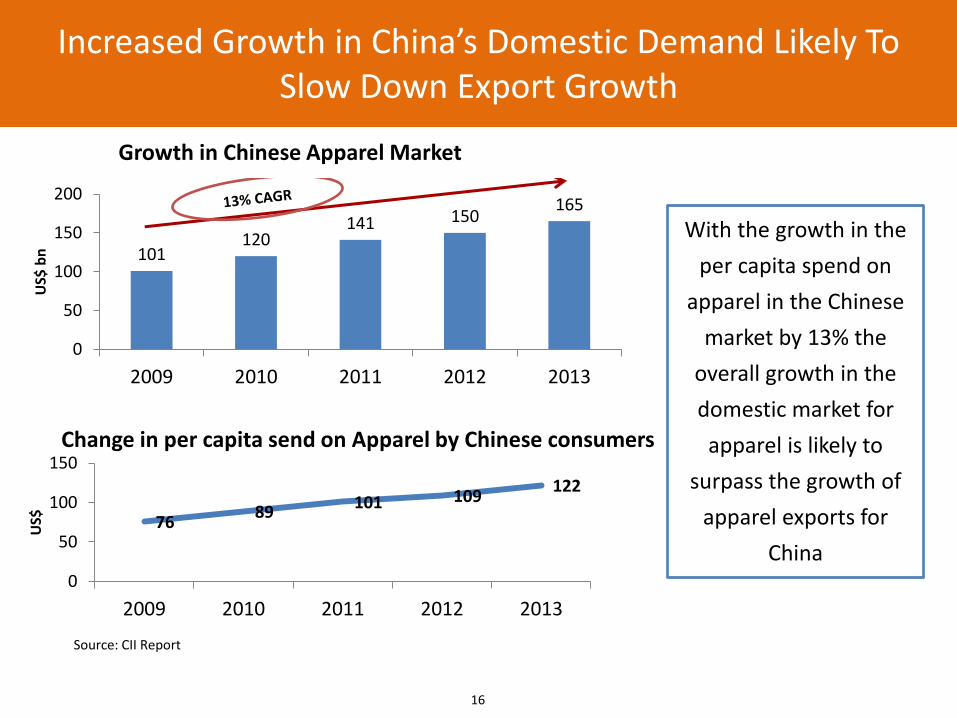
Increased Growth in China’s Domestic Demand Likely To Slow Down Export Growth
101 120
141 150 165
0
50
100
150
200
2009 2010 2011 2012 2013
US$
bn
Growth in Chinese Apparel Market
76 89
101 109 122
0
50
100
150
2009 2010 2011 2012 2013
US$
Change in per capita send on Apparel by Chinese consumers
Source: CII Report
With the growth in the
per capita spend on
apparel in the Chinese
market by 13% the
overall growth in the
domestic market for
apparel is likely to
surpass the growth of
apparel exports for
China

17
China’s Dominance Set to Come Down in Future Which in Turn Will Benefit Other Major Producers
• Increased focus on catering to the domestic demand leading to stagnation
in exports. And rising demands leading to an increase of textile import to
13.5%
• Increased concentration on the heavy engineering industries taking the
sheen off the textile sector
• Higher cost increment compared to other nations (on an average annual
cost increment basis)
• Appreciation of Chinese Yuan against the Dollar created an adverse effect
on the costs for Chinese exports
• Rising labour and wage costs in China
Source: IBEF

18
India Holds a Dominant Position in the World of Textiles
Importance of Textile Sector to India
T&A industry accounts for:
• 26% of the manufacturing sector,
• 14% of the total industrial production
• 18% of industrial employment
• Direct employment is 45 million
• 17% of the total export earnings
• 4% to the GDP.
India’s position in the World Textile Economy
• 2nd largest producer of raw cotton
• 2nd largest producer of cotton yarn
• 2nd largest producer of cellulosic fibre / yarn
• 2nd largest producer of silk
• 4th largest producer of synthetic fibre / yarn.
• Largest producer of jute

19
Overall India has Medium Competitiveness in Parameters Related to Factor Cost
Parameters India Bangladesh Indonesia Egypt China Pakistan Turkey
Labour wages (US$ / month)
135 87 226 226 328 127 839
Power rate (US cents / Kwh)
11.29 8.13 8.51 3.49 12.29 10.62 10.24
Raw Water Cost (US cents / m3)
39.57 29.26 49.19 10.48 53.26 25.67 30.73
Steam (US cents / kg) 1.44 1.3 1.16 1.75 1.64 1.24 2.1
Capital interest rates % 8 13 9 11.5 5 to 6 7 10 C
Most competitive
Source: Texprocil Benchmarking Report
Comparison with Competitors in 2012

20
Apparel 40%
Yarn 18%
Fabric 12%
Fibre 12%
Made-ups 12%
Others 6%
Break-up of India's Textile & Apparel exports 2013-14 (%)
Apparel and Yarn are the Largest Export Categories
Source: Office of Textile Commissioner
Apparel constitutes about 40% of India’s textile exports, followed by yarn at 18%

21
Apparel Constitutes Majority Portion of Synthetic Textile and Apparel Exports from India
2.86
2.14 2.13
0.64
0.08
0.49
Apparel Fabric Yarn Fibre Made Ups Others
India MMF textiles & apparel exports break up- 2013
15% 10% 16% 23% 9% 26% CAGR 2005-13
US$ bn
Source: UN Comtrade

22
Synthetic Staple Fibre and Filament Yarn Growing Much Faster than Spun Yarn Exports
92
285 300 379
145
370
627 692
147 194 223 228
2005 2010 2012 2013
MMSF MMFY MMSF Spun Yarn
India MMF Fibre & Yarn Export volume (mn kg)
119
462 520 636
303
736
1221
1407
356
637 697 720
2005 2010 2012 2013
MMSF MMFY MMSF Spun Yarn
India MMF Fibre & Yarn Export value (US$ mn)
9% 19% 23% 21% CAGR 2005-12 6% 22%
Source: UN Comtrade

23
Knit Garment Exports also Growing Faster than Woven Exports
3.1
7.0
15.8
2005 2013 2020
12% CAGR
Knit Garment Exports
US$ bn
Categories 2013 (US$ bn) CAGR – 2013-20
T-Shirts 2.6 14%
Knitted Shirts 0.7 12%
Babies Garments 0.7 16%
Trousers 0.3 10%
Nightdresses & Pyjamas 0.3 7%
Dresses 0.3 16%
Sweaters 0.3 6%
Blouses 0.3 4%
Underpants 0.3 13%
Briefs 0.2 10%
Others 1.2 10%
Total 7.0 12%
Top knit categories exported
Knit shirts & T-shirts, Dresses, kidswear and innerwear are the key categories driving knitwear export growth
Source : UN Comtrade, Wisedge Analysis

24
Made Ups Exports - Bed Linen is the Largest Category and Expected to Grow Significantly
0.2 1.0
2.0 0.1
0.2
0.3
1.0
1.0
1.4
0.3
1.4
3.0
1.6
3.5
6.8
2005 2013 2020
Bed Linen
Furnishing
Blankets
Others
Total
US$ bn
CAGR 2013-20
12%
6%
10%
10%
Made ups Exports from India
Source : UN Comtrade & Wisedge Analysis
Bed linen exports growing with increasing quality & design capabilities of Indian manufacturers
25
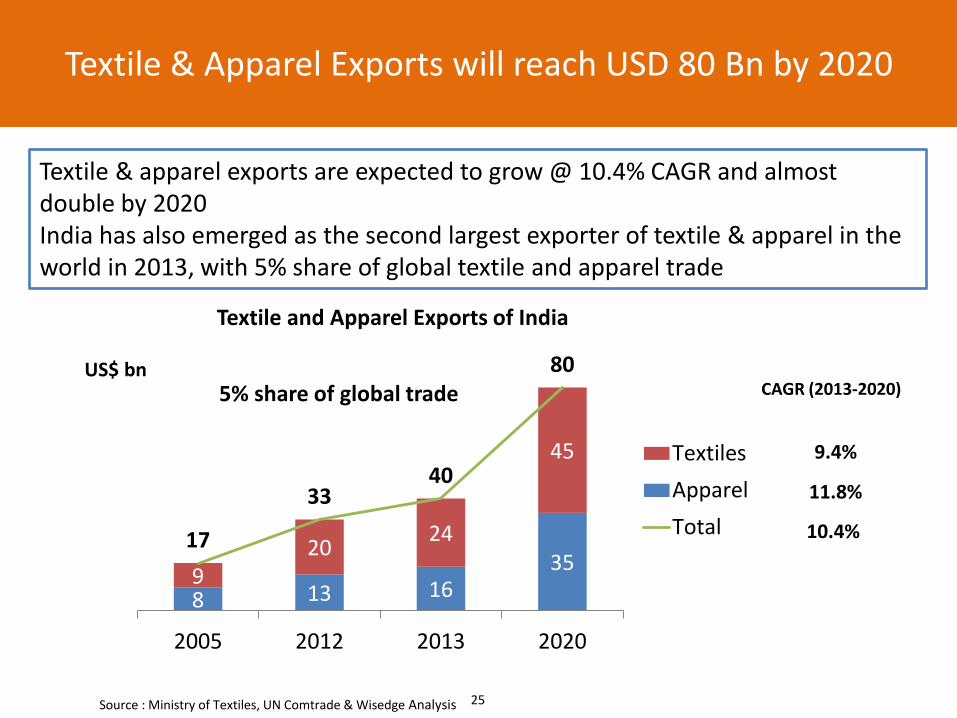
Textile & Apparel Exports will reach USD 80 Bn by 2020
US$ bn CAGR (2013-2020)
9.4%
11.8%
10.4%
Textile & apparel exports are expected to grow @ 10.4% CAGR and almost double by 2020 India has also emerged as the second largest exporter of textile & apparel in the world in 2013, with 5% share of global textile and apparel trade
8 13 16 35
9 20
24
45
17
33 40
80
2005 2012 2013 2020
Textiles
Apparel
Total
Textile and Apparel Exports of India
Source : Ministry of Textiles, UN Comtrade & Wisedge Analysis
5% share of global trade

26
Summarizing
• Global textile and apparel trade recovered in 2013 and is expected to grow @
6.6% for next 7 years
• Trade of fibre has been the highest growing category with growth over 9%
• Apparel trade has been growing at 7% and is expected to grow higher @ 10%
and 12% in the developing markets of China and India respectively
• Asian countries dominate the apparel and textile exports, China leading with
37% share and India is a distant second with export share of 5%
• However, with the increasing cost pressures and domestic demand in China,
its export growth is expected to come down
• This gives countries like India, Vietnam & Cambodia a good market
opportunity as buyers look to diversify their sourcing
• Textiles and Apparel Exports from India expected to reach USD 80 Bn by 2020

Section 2: Domestic market Growth story
• Future projections for domestic market
• Domestic market growth drivers

28
Indian Textile and Apparel Industry is expected to reach USD 200 Bn by 2020
India’s total textile and apparel industry size is estimated to be US$ 101 bn (~Rs 5,88,500 Crore) in 2013 and is expected to grow @ 10.25% CAGR in the next 7 years
28 61
120 17
40
80
45
101
200
0
50
100
150
200
250
2005 2013 2020
Exports
Domestic
Total
Indian Textile and Apparel Industry Size & Projections
CAGR (2013-2020)
10.4%
10.2%
10.3%
Source : Ministry of Textiles, secondary sources & Wisedge Analysis
US$ bn

29
Domestic Market expected to reach USD 120 Bn by 2020
The current domestic textile and apparel market is estimated to be US$61 bn (~Rs 3,54,650 crores). Apparel constitutes majority share of the market
21 45
89
2
4
7
5
12
24
28
61
120
2005 2013 2020
Technical Textiles Home Textiles Apparel Total
US$
bn
T&A Domestic Market
(10.2%)
Source : Ministry of Textiles, UN Comtrade & Wisedge Analysis
Note: Figures in brackets indicate CAGR from 2013 to 2020
(8.7%) (11%) (10.1%)
74%
20%

30
1.9
3.6
5.7
2005 2013 2020
Domestic Home Textiles Market is Growing
CAGR : 6.5% US$ bn
India’s home textiles market is estimated to be around US$3.6 bn (~ Rs 21,300 crores) and growing @ 6.5%. Key drivers of growth are the increased nuclear families, modernization of households, hospitals, offices, hotels, airports etc.
Indian Home Textile Market
Source : Ministry of textiles, secondary sources & Wisedge Analysis

31
Bed Linen, Curtains and Towels are the Most Attractive Categories in the Domestic Market
US$ bn
1.8
0.3
0.7
0.2 0.4
0.2 0.1
7%
5% 6%
5%
8%
6%
4.5%
0%1%2%3%4%5%6%7%8%9%
0.00.20.40.60.81.01.21.41.61.82.0
Bed Linen Blankets Towels KitchenLinen
Curtains Upholstery Rugs andCarpets
Market size %growth
Category wise market size (2013) & growth (CAGR 2013-20)
Source : Ministry of textiles, secondary sources & Wisedge Analysis
Bed linen & curtains, being the more fashion sensitive categories, are growing faster than others

32
12.4
23
2013 2020
Domestic Technical Textile Market
Domestic Technical Textiles Market Is Growing Significantly
US$ bn
Packtech, Sportech, Meditech, Oekotech, are the more attractive categories
Categories 2013 2020 CAGR
2013-20
Packtech 4.9 9.5 10.0%
Clothtech 1.8 2.9 7.0%
Hometech 1.6 3.1 10.0%
Mobiltech 1.0 1.8 9.0%
Sportech 0.8 1.7 11.5%
Indutech 0.8 1.5 9.0%
Buildtech 0.5 0.9 8.0%
Meditech 0.4 0.8 10.0%
Protech 0.4 0.7 9.0%
Agrotech 0.1 0.2 7.0%
Geotech 0.03 0.0 6.0%
Oekotech 0.03 0.1 13.0%
Total 12.4 23.2 9.4%
CAGR : 9.4%
US$ bn
Source : Ministry of textiles, secondary sources & Wisedge Analysis

33
Key growth drivers Woven Shirts
Men's Trouser
Wmen's Trousers/skirts
Wmen's Dresses Denim
Jackets / overcoats Sweaters Suits
Men's innerwear Lingerie
T-shirts/Knitted Shirts
Ethnic wear
Increasing population
Growing incomes
Increasing urbanization
Growing working women
Growing fashion consciousness
Increasing casualization
Increasing travel
Growing sporting / fitness culture
Key Growth Drivers for Indian Market
Source : Wisedge Analysis

34
India has the Least Per Capita Spend on Apparel but the Highest Potential to Grow at 11% yoy Till 2025
37 122
287 300
703 725 885 887
1,131
129
383 460
756 841 817
1,149 1,265
1,709
0
200
400
600
800
1,000
1,200
1,400
1,600
1,800
Ind
ia
Ch
ina
Bra
zil
Ru
ssia
EU-2
7
USA
Jap
an
Can
ada
Au
stra
lia
US$
Per capita spend on Apparel
2013
2025 F
Among the above countries the lowest per capita spend on apparel is of India (US$ 37) which is only 4% of the highest Australia (US$ 1,131)
Source: FICCI, Knowledge paper on Driving growth through innovation
35
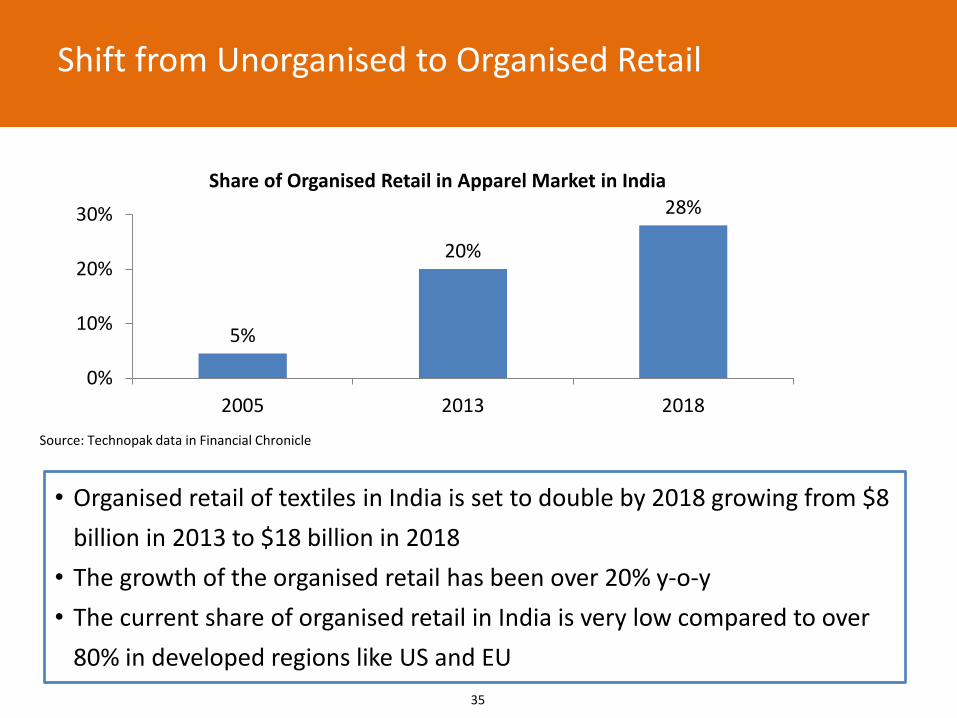
Shift from Unorganised to Organised Retail
5%
20%
28%
0%
10%
20%
30%
2005 2013 2018
Share of Organised Retail in Apparel Market in India
Source: Technopak data in Financial Chronicle
• Organised retail of textiles in India is set to double by 2018 growing from $8
billion in 2013 to $18 billion in 2018
• The growth of the organised retail has been over 20% y-o-y
• The current share of organised retail in India is very low compared to over
80% in developed regions like US and EU
Section 3: Factors Affecting the Growth of the Industry
• Investment trends
• Government support including “Make in India”

37
Overall New Investments Have Increased in the Last Few Years
Segments No of
Companies 2009‐10 2010‐11 2011‐12 CAGR - 2 yr
Spinning 19 137 228 274 42%
Apparel Fabric 15 140 310 779 136%
Home Tex 6 79 172 114 20%
Composite 2 396 277 280 -16%
RMG 1 2 4 1 -20%
Denim 3 3 7 13 122%
Embroidery 2 1 4 0 -100%
MMF 1 24 60 0 -100%
Tech Tex 3 75 33 34 -33%
Weaving 1 1 1 1 28%
Total 53 857 1,095 1,496 32%
US$ mn Investments by listed companies in the last few years
Spinning, fabric manufacturing and denim have attracted most investments from listed companies in the last few years
Source : Ministry of textiles

38
Potential Investments Required by 2020
Category Additional Production
Required by 2020 Additional Investment
required by 2020
Rs Crore US$ bn
Yarn manufacturing (spun + filament)
11900 mn kg 91000 16
Fabric manufacturing + processing
22500 mn sq mtr 180000 31
Garmenting +made ups 9300 mn pcs 53000 9
Technical textiles - 40000 7
Total 364000 63
Additional investments worth US$ 63 bn would be required in the Indian textile value chain to fulfil the market demand by 2020
*Estimations based on market projections
Source: Wisedge Analysis

39
Government has Provided Good Policy Support to the Textile Industry
• Technology Upgradation Fund Scheme (TUFS)
– Government gives interest and capital subsidy for new investments across the textile value chain
– Total investments around Rs 2,40,000 Cr have been attracted through the TUFS
• Scheme for Integrated Textiles Parks (SITP)
– Government’s Scheme for Integrated Textile Park has attracted investments worth Rs 18,425 Cr across 40 textile parks sanctioned
• Other schemes – Cluster development – Skill development – 100% FDI through automatic route – Power loom schemes etc.
40
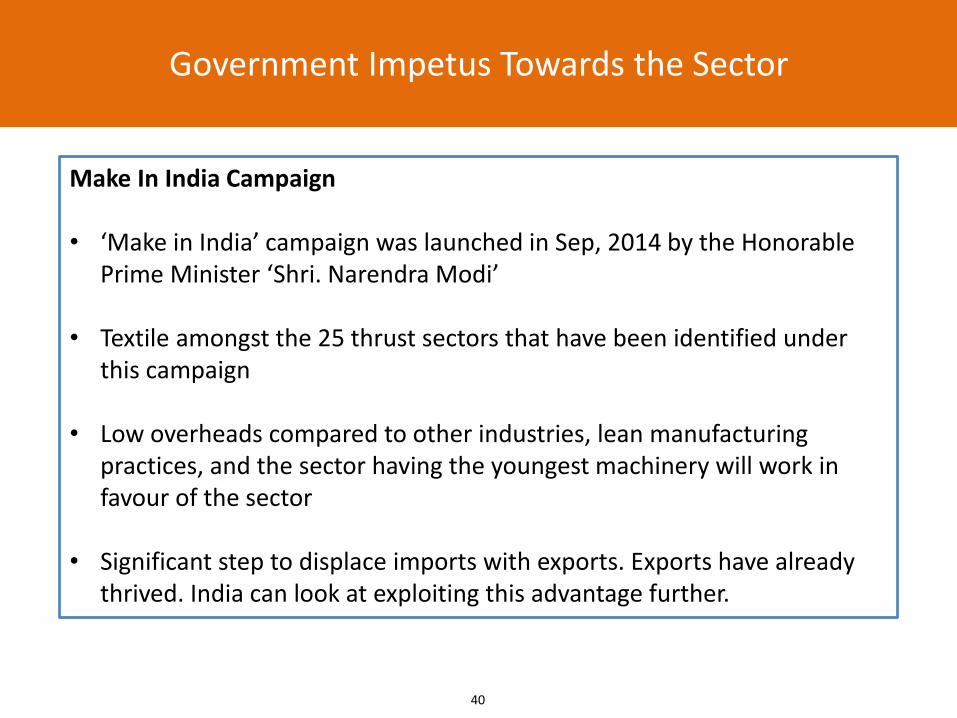
Government Impetus Towards the Sector
Make In India Campaign • ‘Make in India’ campaign was launched in Sep, 2014 by the Honorable
Prime Minister ‘Shri. Narendra Modi’
• Textile amongst the 25 thrust sectors that have been identified under this campaign
• Low overheads compared to other industries, lean manufacturing practices, and the sector having the youngest machinery will work in favour of the sector
• Significant step to displace imports with exports. Exports have already thrived. India can look at exploiting this advantage further.

41
Challenges faced by the Indian textile sector
• Technological backwardness especially in weaving, processing and
garmenting segments
• Lower productivity and cost competitiveness
• Low share in global exports despite being the largest producer
• India has scale disadvantages vis-a-vis competing countries
• Slow pace of development of infrastructure, availability of power etc.
• High interest cost and low availability of finance to SME sector
• Rigid and archaic labour laws
• High cost of meeting strict environmental standards
• Unfavourable exchange rate situation
• Preferential tariff regimes for close competitors in certain major markets
42
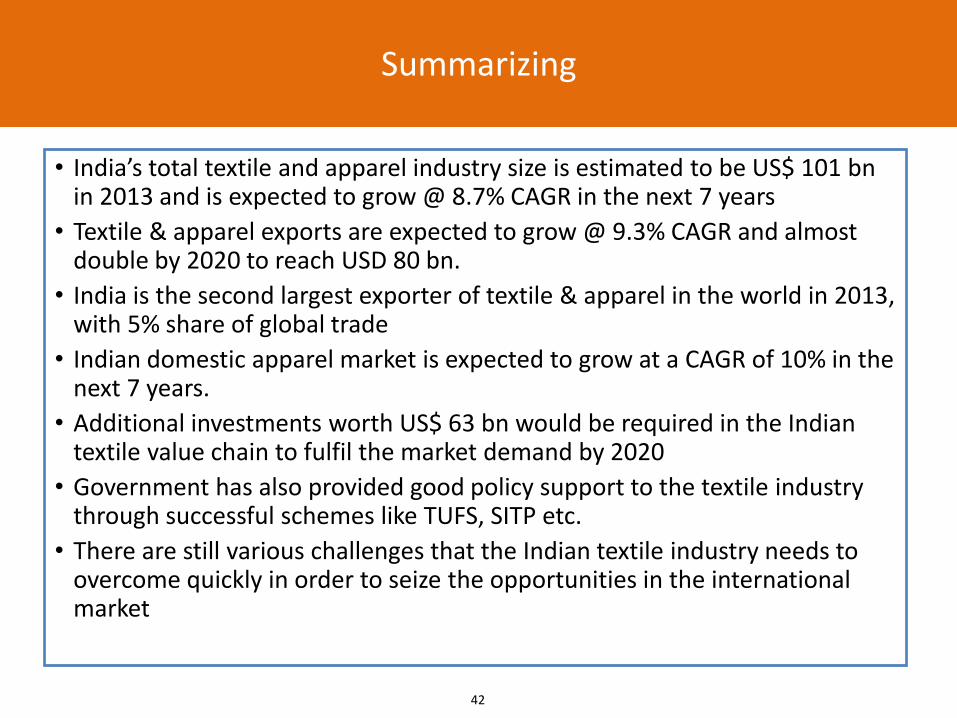
Summarizing
• India’s total textile and apparel industry size is estimated to be US$ 101 bn in 2013 and is expected to grow @ 8.7% CAGR in the next 7 years
• Textile & apparel exports are expected to grow @ 9.3% CAGR and almost double by 2020 to reach USD 80 bn.
• India is the second largest exporter of textile & apparel in the world in 2013, with 5% share of global trade
• Indian domestic apparel market is expected to grow at a CAGR of 10% in the next 7 years.
• Additional investments worth US$ 63 bn would be required in the Indian textile value chain to fulfil the market demand by 2020
• Government has also provided good policy support to the textile industry through successful schemes like TUFS, SITP etc.
• There are still various challenges that the Indian textile industry needs to overcome quickly in order to seize the opportunities in the international market
Section 4: Performance of Leading Indian Textile Companies
44
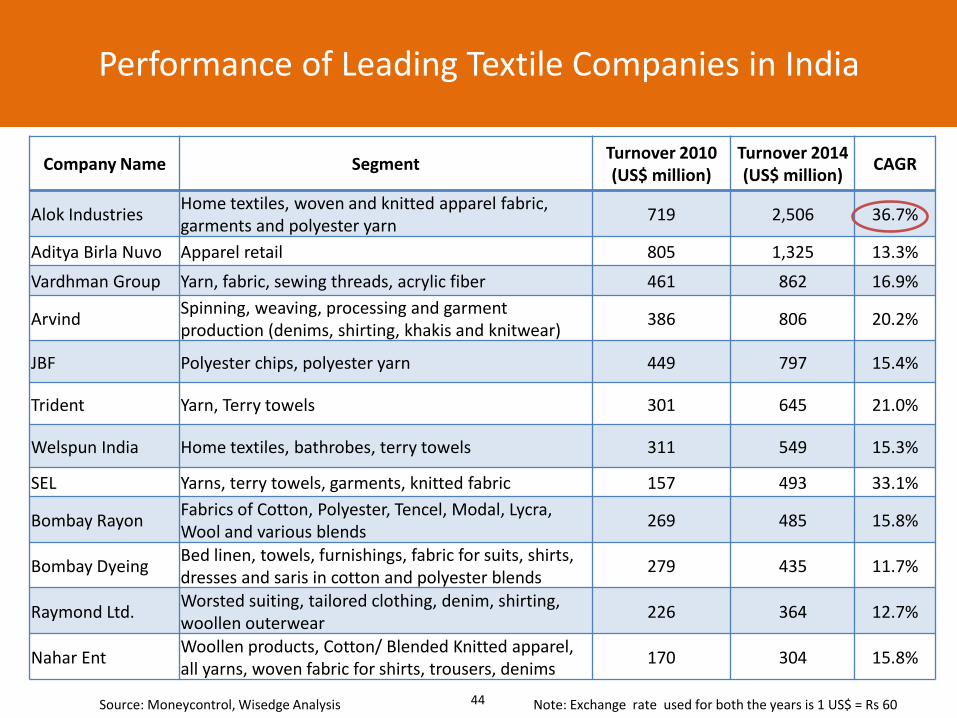
Performance of Leading Textile Companies in India
Company Name Segment Turnover 2010 (US$ million)
Turnover 2014 (US$ million)
CAGR
Alok Industries Home textiles, woven and knitted apparel fabric, garments and polyester yarn
719 2,506 36.7%
Aditya Birla Nuvo Apparel retail 805 1,325 13.3%
Vardhman Group Yarn, fabric, sewing threads, acrylic fiber 461 862 16.9%
Arvind Spinning, weaving, processing and garment production (denims, shirting, khakis and knitwear)
386 806 20.2%
JBF Polyester chips, polyester yarn 449 797 15.4%
Trident Yarn, Terry towels 301 645 21.0%
Welspun India Home textiles, bathrobes, terry towels 311 549 15.3%
SEL Yarns, terry towels, garments, knitted fabric 157 493 33.1%
Bombay Rayon Fabrics of Cotton, Polyester, Tencel, Modal, Lycra, Wool and various blends
269 485 15.8%
Bombay Dyeing Bed linen, towels, furnishings, fabric for suits, shirts, dresses and saris in cotton and polyester blends
279 435 11.7%
Raymond Ltd. Worsted suiting, tailored clothing, denim, shirting, woollen outerwear
226 364 12.7%
Nahar Ent Woollen products, Cotton/ Blended Knitted apparel, all yarns, woven fabric for shirts, trousers, denims
170 304 15.8%
Source: Moneycontrol, Wisedge Analysis Note: Exchange rate used for both the years is 1 US$ = Rs 60

45
Performance of Leading Chinese Textile Companies
Source: China Daily.com
Company Name Revenue 2013
Mn Yuan (US$ mn)
Jiangsu Hengli Group 135 billion yuan ($22.05 billion)
Shangtex Holding Co Ltd 43.5 billion yuan ($7.113 billion)
Lu Thai Textile Co Ltd 6.47 billion yuan ($1.058 billion)
Huafu Top Dyed Melange Yarn Co Ltd 6.24 billion yuan ($1.02 billion)
Weiqiao Textile Co Ltd 5.97 billion yuan ($976 million)
Shijiazhuang Changshan Textile Co Ltd 5.85 billion yuan ($956 million)
Jiangsu Sunshine Co Ltd 2.34 billion yuan ($382.7 million)
Huafang Textile Co Ltd 1.34 billion yuan ($219.1 million)
Shandong Demian Incorporated Company 870 million yuan ($142.3 million)
Shandong Jining Ruyi Woolen Textile Co Ltd 588 million yuan ($96 million)
Revenue of the top Textile company in China is ten times that of a leading company in India. Hence, Indian players can still grow to a larger scale

46
Conclusion: This will be India’s Decade in Textile and Apparel
India will become bigger destination for souring of Textile, Apparel, Home products
• Global textile trade will keep growing @ 6.6% to reach USD 1180 bn in 2020
• China’s share in global trade will keep reducing due to focus on their domestic market, focus on other manufacturing industries in China and rising costs
• India’s share in global exports is expected to increase from 5% currently to 8% in 2020
• India is expected to export USD 80 bn in 2020 as compared to USD 41 bn in 2013.
Domestic market will grow @ 10% CAGR to reach USD 120 bn in 2020
• Growing population, increase in per capita consumption due to growing Indian economy will drive the growth of Indian domestic market for apparel, home textiles.
• Further support from government is expected to fuel this growth with campaigns like “Make in India”.
• Indian textile and Apparel companies have been growing @ 10% or more and will grow at even faster rate in next 7 years with the overall increase in demand
Source: JM Financial, Key-Strategy – Make inIndia

47
Bibliography
• UN Comtrade
• Ministry of Textiles database
• Ministry of Commerce, Export –import database
• OTEXA (US Textile & Apparel Trade database)
• WTO
• Textile Intelligence
• Texprocil Benchmarking Report
• Moneycontrol.com
• FICCI, Knowledge paper on Driving growth through innovation
• JM Financial report, Key-Strategy – Make in India
• China Daily.com

48
Abbreviations
• CAGR : Compound Annual Growth Rate
• CAFTA-DR: Central American Free Trade Agreement – Dominican Republic
• FTA : Free Trade Agreement
• MMF: Man Made Fibre
• MMFY: Man Made Filament Yarn
• MMSF: Man Made Staple Fibre
• NAFTA: North American Free Trade Agreement
• US: United States
• UK: United Kingdom
• UN: United Nations
• TUFS: Technology Upgradation Fund Scheme
• SITP: Scheme for Integrated Textiles Parks