Going One Step Beyond in North Denver One Step Beyond in North Denver ... –AERMOD dispersion model...
35
Going One Step Beyond in North Denver Gregg W. Thomas Michael Ogletree Lisa Clay Denver Environmental Health January 19, 2016 A Neighborhood Scale Air Pollution Modeling Assessment Part II : Predicted Ambient Concentrations in 2035
Transcript of Going One Step Beyond in North Denver One Step Beyond in North Denver ... –AERMOD dispersion model...

Going One Step Beyond
in North Denver
Gregg W. ThomasMichael Ogletree
Lisa Clay
Denver Environmental HealthJanuary 19, 2016
A Neighborhood Scale Air Pollution Modeling Assessment
Part II : Predicted Ambient Concentrations in 2035

Purpose
• Estimate predicted concentrations using 2035 emissions
– AERMOD dispersion model (version 15181)
– Partial Cover Lowered (PCL)
• Address community concerns around near highway gradients and/or hot spots
– Estimate near highway gradients
– PM10, PM2.5, nitrogen dioxide (NO2), Benzene
• Includes projected 2035 traffic counts along I-70 between I-25 and Colorado Blvd
2January 19, 2016 Going One Step Beyond in Denver - Part II

Dispersion Modeling History
• Builds upon 15 years of work conducted by Denver
Environmental Health (DEH); – Focused on hazardous air pollutants (aka HAPs, mobile source air toxics)
– Unique for a local government
• Also builds upon work funded by CDOT & FHWA in
2004-2005– Focused geographic area including North Denver and Commerce City
– Onroad emissions confined to the major roadway footprints
• Model results were evaluated against air monitoring data– Good model to monitor performance in past years (within a factor of 2)
– Annual average concentrations a focus of past work
• Final Report: https://www.codot.gov/programs/research/pdfs/by-subject/by-
subject-d-k/environmental-assessments%20%20%20%20
3January 19, 2016 Going One Step Beyond in Denver - Part II

4January 19, 2016 Going One Step Beyond in Denver - Part II
Good Neighbor Part II Update
• Focus on same geographic area
• Looks ahead to 2035 (fully operational I-70)
• 1-hr and 24-hr average concentrations– Generates up to 500,000+ data points with hourly data!
• Use updated traffic projections along I-70
• Use high resolution weather data from a site closer to the project area
• Particulate matter below 10 and 2.5 microns (i.e. millionths of a meter; PM10, PM2.5), nitrogen dioxide (NO2), benzene
• Predicted concentrations at over 5,000 different points both near and far from major roadways

5January 19, 2016 Going One Step Beyond in Denver - Part II
Good Neighbor Part II Challenges
• Emissions projections for area, non-road mobile, and point sources don’t exist– Have to make assumptions; err to be protective of public health
• Existing datasets, while improved, still require a fair amount of manual analysis
• Datasets are complex and very large
• Did not have recent year point source emissions data in a model-ready format– Only able to include benzene point source emissions from 2006 inventory
– Background concentrations should make up for this for a few pollutants
• AERMOD has limitations in handling elevated or depressed roadways
• Additional detailed work will continue in 2016+

6January 19, 2016 Going One Step Beyond in Denver - Part II
Project Area of Primary Focus

7January 19, 2016 Going One Step Beyond in Denver - Part II
Methodology
• Start with 2011 county level emissions for all source categories– EPA National Emissions Inventory (NEI v2)
– CDPHE 2011 emission inventory
• Use DRCOG transportation analysis zones (TAZs) to apportion a fraction of the county level emissions to each TAZ– Surrogate data includes vehicle miles traveled (VMT), population and/or
population density, depending on the source category
• Use professional judgment to project forward to 2035 for area and non-road emissions sources– Nonroad emissions decline by 20%, railroad by 10%, area sources flat
• Use MOVES emission model data for specific road links in 2035– No double counting of onroad emissions in affected TAZs
• Use high resolution weather data from a site closer to the project area and from a more recent year (2004-2008 hourly data set)
• Predicted concentrations at over 5,000 different locations both on and off of the major roadways
• No future year monitored concentrations to compare with model
8January 19, 2016 Going One Step Beyond in Denver - Part II
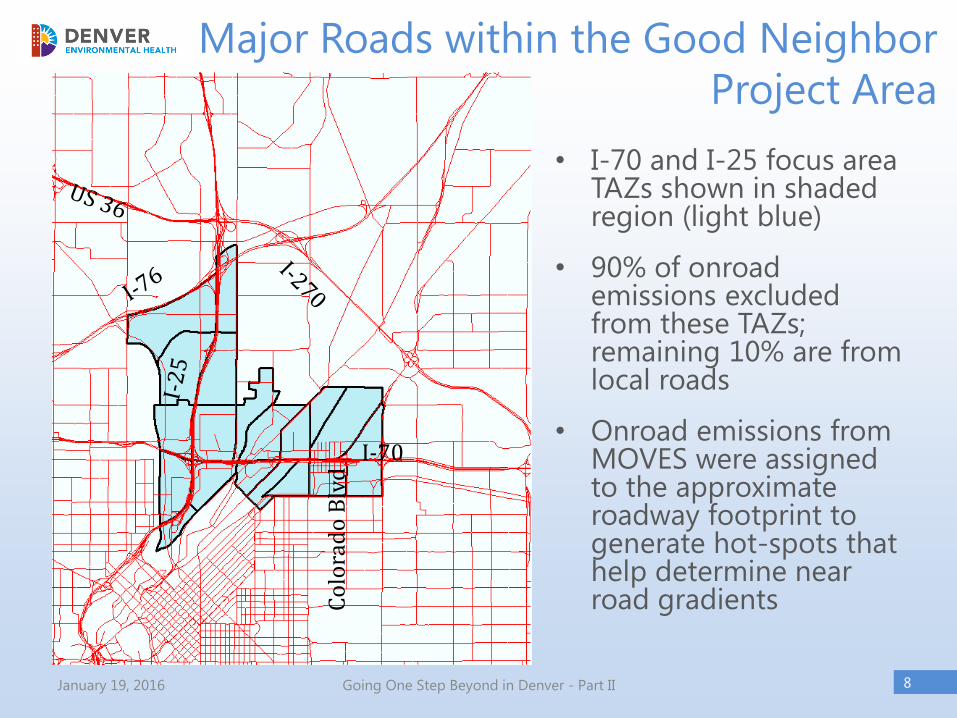
Major Roads within the Good Neighbor
Project Area
I-70
Co
lora
do
Blv
d
• I-70 and I-25 focus area TAZs shown in shaded region (light blue)
• 90% of onroademissions excluded from these TAZs; remaining 10% are from local roads
• Onroad emissions from MOVES were assigned to the approximate roadway footprint to generate hot-spots that help determine near road gradients

9January 19, 2016 Going One Step Beyond in Denver - Part II
Major Roadway Footprints
• Use centerline file from DRCOG model to generate rectangular polygons that can be defined in AERMOD
• This underestimates the actual dimensions of the roadways (not designed for this specific purpose)
• For most situations, it doesn’t affect results
• For the PCL though, DEH created roadway polygons using approximate footprint of PCL and known frontage roads
• This gives us better resolution at nearby homes and Swansea Elementary school.

10January 19, 2016 Going One Step Beyond in Denver - Part II
Partial Cover Lowered (PCL) Footprint
Purina
SwanseaElem
York
St
2035 PCL Footprint used in AERMOD (shaded area).

11January 19, 2016 Going One Step Beyond in Denver - Part II
AERMOD Receptor Locations
• 5,174 receptors
• Both on and off the highways
• Heavy focus around I-70 and I-25
• Onroad receptors are not used to determine compliance with ambient air quality standards (NAAQS) but do help with estimating gradients

AERMOD Info (1 of 3)
• AERMOD v15181 using BEEST Suite v 11.03
• Generates predictions each hour of the day
– 24-hr averages capture each hour
• Results are run for a typical day in January
– Atmospheric dispersion usually worst in the winter
– Emissions for pollutants modeled in this study are
the same or higher in January
• PM10 and PM2.5 emissions include exhaust,
road dust and brake and tire wear
12January 19, 2016 Going One Step Beyond in Denver - Part II

AERMOD Info (2 of 3)
• Modeled both constant and varying hourly emissions
• Compared at grade I-70 versus below grade (PCL)
• Results are run for a typical day in January
– Atmospheric dispersion usually worst in the winter
– Emissions for pollutants modeled in this study are the same or higher in January
• PM10 and PM2.5 emissions include exhaust, road dust and brake and tire wear (see Part I)
13January 19, 2016 Going One Step Beyond in Denver - Part II

AERMOD Info (3 of 3)
• The PCL was modeled at a depth of 30 feet
compared to its surroundings
• “The Cover” has not been modeled yet
• DEH is testing various options
• AERMOD is not ideal for such modeling,
but we can make estimates
• Plan to include updates to this presentation
when work is complete (likely by Mar 2016)
14January 19, 2016 Going One Step Beyond in Denver - Part II

15January 19, 2016 Going One Step Beyond in Denver - Part II
Concentrations in micrograms per cubic meter; 1-hour averaging period
Predicted Nitrogen Dioxide (2035)

Predicted Nitrogen Dioxide (NO2) Summary
• Only modeled NO2 from MOVES model on roadways
• EPA NEI all other sources emissions produced unrealistic results;
– Mostly nitric oxide (NO) and not NO2
– Still working on how to resolve this in AERMOD
• Max predicted hourly concentration < 30% of the current NAAQS (188 micrograms/m3 or 100 ppbv)
• About 33% lower than current day max value at near road monitoring sites
• Slightly higher concentrations west of the PCL
16January 19, 2016 Going One Step Beyond in Denver - Part II

NO2 Sensitivity Analysis: PCL vs at-grade
• One hypothesis is that the PCL will reduce concentrations in the neighborhood– Turbulence in the roadway channel from passing cars/trucks
and additional mixing due to winds and noise/safety walls
– Emissions can still be high near the road surface
• Method to test whether the above hypothesis is true is as follows:– Model an at-grade roadway first
– Drop roadway surface 30 feet, keeping receptor height as is
– Compare the two
• DEH did not model an elevated viaduct
• Result? Hypothesis confirmed
17January 19, 2016 Going One Step Beyond in Denver - Part II

18January 19, 2016 Going One Step Beyond in Denver - Part II
York
St
York
St
Concentrations decrease near the UPRR railroad tracks
Predicted NO2 At-Grade vs PCL (2035)
Concentrations in micrograms per cubic meter
At-Grade
PCL

19January 19, 2016 Going One Step Beyond in Denver - Part II
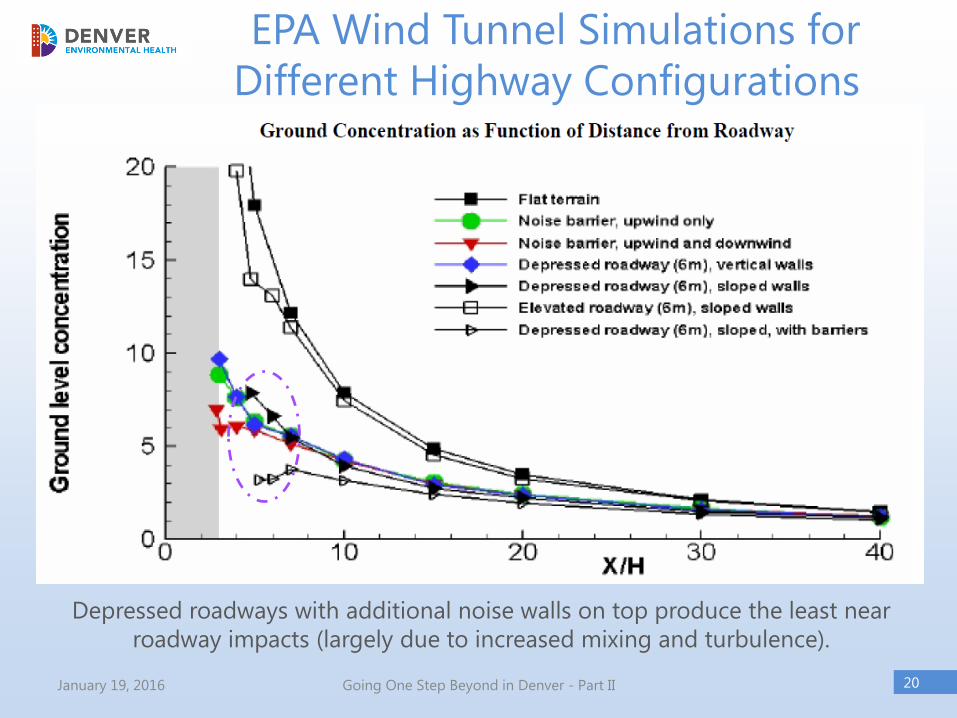
EPA Wind Tunnel Simulations for
Different Highway ConfigurationsFigures a) and d) closely
match what was modeled
on the previous slide; at-
grade vs PCL (east of UPRR)
20January 19, 2016 Going One Step Beyond in Denver - Part II
Depressed roadways with additional noise walls on top produce the least near
roadway impacts (largely due to increased mixing and turbulence).
EPA Wind Tunnel Simulations for
Different Highway Configurations

NO2 Additional Notes• Predicted 2035 concentrations for roadside NO2 are in
the approximate range expected when compared to today’s near road data and the predicted decrease in emissions.
• DEH will continue to investigate modeling area and non-road mobile sources of NO2/NOx. However, near road NO2/NO monitoring data today show dominant influence from on-road vehicles, as expected.
• DEH will also model/mimic the PCL as a cavity between two very long buildings. This will allow us to test downwash algorithms (i.e. pollutant trapping). This will be in the next update.
21January 19, 2016 Going One Step Beyond in Denver - Part II

22January 19, 2016 Going One Step Beyond in Denver - Part II
Predicted Benzene (2035)
Concentrations in micrograms per cubic meter; 24-hr averaging period

Predicted Benzene Summary• Higher concentrations near downtown
– Due to higher traffic density
– Generally matches air monitoring data spatial patterns
• Onroad receptors 2388 and 2396 show high concentrations as expected (see previous slide)
• Swansea Elem receptor 1188 is somewhat lower, but does not include any effects from the cover
• Large reductions from recent year concentrations, as per the inventory
– Cleaner fuels and vehicles
• Point sources (like gas stations) are noticeable
23January 19, 2016 Going One Step Beyond in Denver - Part II

24January 19, 2016 Going One Step Beyond in Denver - Part II
Predicted PM10 (2035)
Concentrations in micrograms per cubic meter; 24-hour averaging period

25January 19, 2016 Going One Step Beyond in Denver - Part II
Predicted PM10 (2035)
Concentrations in micrograms per cubic meter; 24-hour averaging period

Predicted Particulate Matter (PM10) Summary
• Road dust is the dominant contributor (~70%)
– See Part I for important road dust limitations
• For background, took max predicted conc. (24) for all nonroademissions sources and subtracted that from 89, which CDOT used as PM10 background in FEIS. Resulting DEH background is 65.
– Extremely conservative, but total concentrations still below NAAQS (150)
• Predicted hot-spots are in the expected locations
• PM versus gaseous (benzene) gradients between downtown and I-70 area are different
– Mainly due to road dust modeling for I-70
– Ambient monitoring data do not match the PM10 pattern (see next slide).
– Supports the statement that 2035 Total PM10 is conservative
26January 19, 2016 Going One Step Beyond in Denver - Part II

27January 19, 2016 Going One Step Beyond in Denver - Part II
0
10
20
30
40
50
1:0
0 A
M
2:0
0 A
M
3:0
0 A
M
4:0
0 A
M
5:0
0 A
M
6:0
0 A
M
7:0
0 A
M
8:0
0 A
M
9:0
0 A
M
10:0
0 A
M
11:0
0 A
M
12:0
0 P
M
1:0
0 P
M
2:0
0 P
M
3:0
0 P
M
4:0
0 P
M
5:0
0 P
M
6:0
0 P
M
7:0
0 P
M
8:0
0 P
M
9:0
0 P
M
10:0
0 P
M
11:0
0 P
M
12:0
0 A
M
Co
ncen
trati
on
(mic
rog
ram
s/m
3)
Hourly Avg PM10 Comparisons in Denver
(January 2014)
I-25 - 971 Yuma Dr
La Casa 4545 Navajo
Downtown - 21st Broadway
Welby - 78th Ave & Steele St
Measured PM10 Spatial Differences
24-hr avg. maximum concentrations in Jan
2014 are in the range of predicted total
concentrations, WITHOUT any background.
Inclusion of background concentration (65)
in modeled concentrations is conservative.
January 2014 24-hr Average 24-hr Avg Maximum
CAMP 23 78
La Casa 21 70
I-25 Near Road 26 75

Predicted PM2.5 (2035)
28January 19, 2016 Going One Step Beyond in Denver - Part II
*Concentrations in micrograms per cubic meter; 24-hour averaging period

29January 19, 2016 Going One Step Beyond in Denver - Part II
Predicted PM2.5 (2035)
*Concentrations in micrograms per cubic meter; 24-hour averaging period
York
St

30January 19, 2016 Going One Step Beyond in Denver - Part II
Predicted Particulate Matter (PM2.5) Summary
• As with PM10, road dust is the dominant contributor for PM2.5 in 2035 (~75%)
– See Part I for important road dust limitations
• For background value, analyzed daily average concentrations from previous January monitoring data (see next slide)
– Background value (3.0), for emissions outside of the project boundary, were set at < ½ the January daily average value.
• Predicted hot-spots are in the expected locations
• Off roadway receptors do not exceed the 24-hr NAAQS (35 micrograms per cubic meter)

31January 19, 2016 Going One Step Beyond in Denver - Part II
0.0
2.0
4.0
6.0
8.0
10.0
12.0
14.0
Co
nce
ntr
ati
on
(m
icro
gra
ms/
m3
)
PM2.5 Comparisons in Denver (Jan 2014)
I-25 - 971 Yuma Dr
La Casa 4545 Navajo
Downtown - 21st Broadway
January 2014 24-hr Average 24-hr Avg Maximum
CAMP 8.3 30.9
La Casa not enough data not enough data
I-25 Near Road 9.3 32.8
Measured PM2.5 Spatial Differences
24-hr avg. maximum concentrations in Jan
2014 are in the range of 2035 predicted
total concentrations. Jan 2014
measurements not likely driven by road
dust though, whereas 2035 predictions are.

Summary
• DEH modeled 1-hr and 24-hr average concentrations for pollutants of interest
– NO2, benzene, PM10, and PM2.5
• Captured onroad emissions in detail, blended with area and nonroad source emissions in the project area
• Able to approximate PCL (depressed) roadway configuration
• High spatial resolution allowed us to determine hot-spots and near-road gradients
32January 19, 2016 Going One Step Beyond in Denver - Part II

Conclusions
• Predicted pollutant levels do not exceed health-based standards (NAAQS)– Even with conservative road dust estimates for
PM10 and PM2.5
• Gradients are fairly sharp within 100-200m of the highway– Highway contributions show 75% reduction within
200m (~1 city block) of the road
– Less of a reduction when all emissions included
• PCL is predicted to result in lower air pollution in the neighborhood due to added mixing and turbulence
33January 19, 2016 Going One Step Beyond in Denver - Part II

Next Steps• DEH will model additional configurations for the PCL
and cover at Swansea Elem– DEH will post updates as they become available
• DEH will expand the link based emission modeling to the entire Good Neighbor project area
• Will also model 2011 baseline emissions year for additional model-to-monitor validation and to better understand road dust contributions
• DEH, CDOT, and CDPHE will collaborate on the operation of a long-term air monitor to collect data at Swansea Elementary starting in summer 2016 until project is complete
• That data will be used in part to evaluate and refine the near-road modeling completed for this project
34January 19, 2016 Going One Step Beyond in Denver - Part II

Disclaimer: This work was performed by Denver Environmental Health (DEH) independently
from the Colorado Dept of Transportation (CDOT). CDOT did answer a few
technical questions along the way regarding some of the assumptions were
made. Similar modeling tools were used by both agencies (MOVES, AERMOD).
This project builds upon work that DEH completed in 2005 and was funded by
Federal Highway Administration (FHWA) and CDOT in 2004. FHWA/CDOT did not
provide funding for this phase of work. DEH did this work in response to citizen
and other interested stakeholders concerns regarding near highway gradients
and hot-spots. CDOT did review this presentation but otherwise has not formally
reviewed the technical work products. The materials produced are wholly owned
by the City and County of Denver Dept. of Environmental Health.
For more information Contact Michael Ogletree, Gregg Thomas, or Lisa Clay with the Denver
Department of Environmental Health at [email protected]
35January 19, 2016 Going One Step Beyond in Denver - Part II