God, Money & Generosity Practical Steps John Preston National Stewardship & Resources Officer.
40
God, Money & Generosity Practical Steps John Preston National Stewardship & Resources Officer
-
Upload
lucy-welch -
Category
Documents
-
view
219 -
download
0
Transcript of God, Money & Generosity Practical Steps John Preston National Stewardship & Resources Officer.

God, Money & Generosity
Practical Steps
John PrestonNational Stewardship& Resources Officer
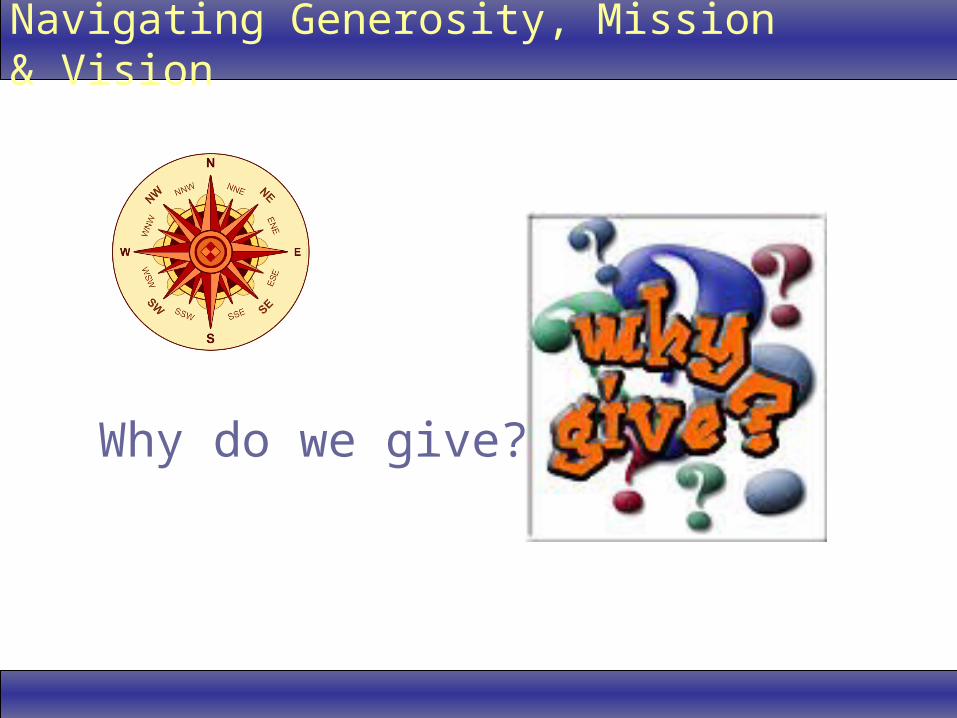
Navigating Generosity, Mission & Vision
Why do we give?

Motivations for giving…..
LOVE

Motivations for giving…..
THANKSGIVING

Motivations for giving…..
FOR A PURPOSE

Church Giving
What are the motivations?


Methodology
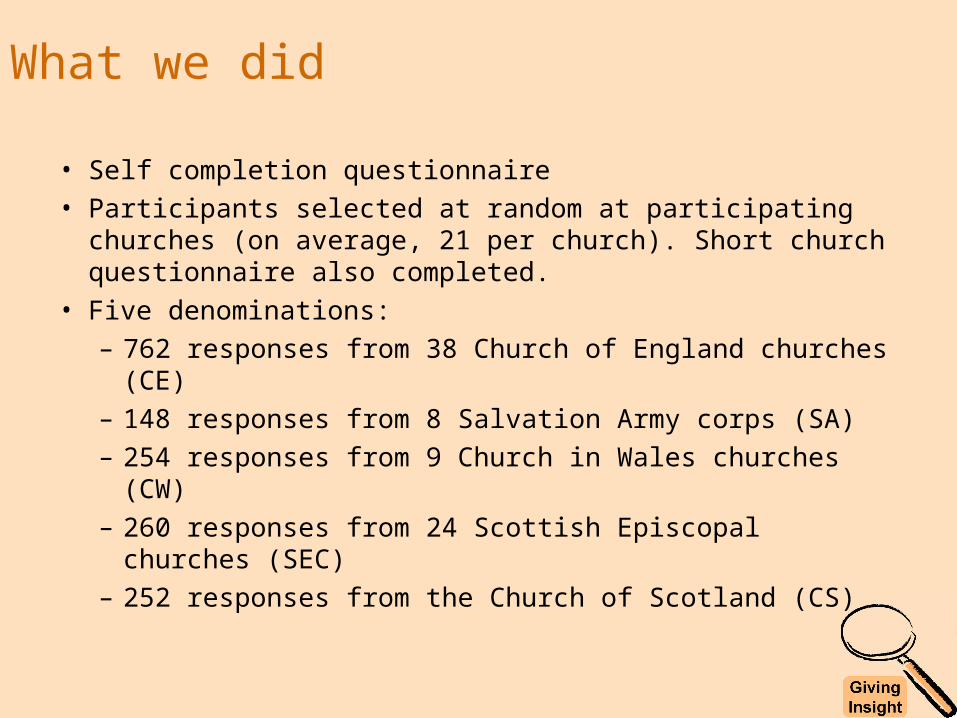
What we did
• Self completion questionnaire• Participants selected at random at participating churches (on
average, 21 per church). Short church questionnaire also completed.
• Five denominations:– 762 responses from 38 Church of England churches (CE)– 148 responses from 8 Salvation Army corps (SA)– 254 responses from 9 Church in Wales churches (CW)– 260 responses from 24 Scottish Episcopal churches (SEC)– 252 responses from the Church of Scotland (CS)

What we didn’t do!
• Telephone interviews (no data, privacy issues)• Internet Questionnaire (concern of biased sample)• Face to Face interviews (no money – survey done at
very little cost, £1k invested in report and conference)
• Note: Self-completion surveys can be post-stratified to adjust for bias, if the underlying population is known. Responses were felt to be sufficiently close not to need this.

Who responded?Section C, Page 5
?

Age of respondent
• Good fit for C of E in relation to 2007 Diversity Monitoring Survey
• Slight under representation of 26-45, although DMS was 4 years ago, and C of E will have aged a bit since then.
• Other denominations judged to be also OK.
-1% -5% +2% +2% +2%

Context
• Note: CS methodology means no church level data• Reasonable fit (note % of respondents needs comparing with
% of church members worshipping in that context, not number of churches)
• Church in Wales low on rural representation.
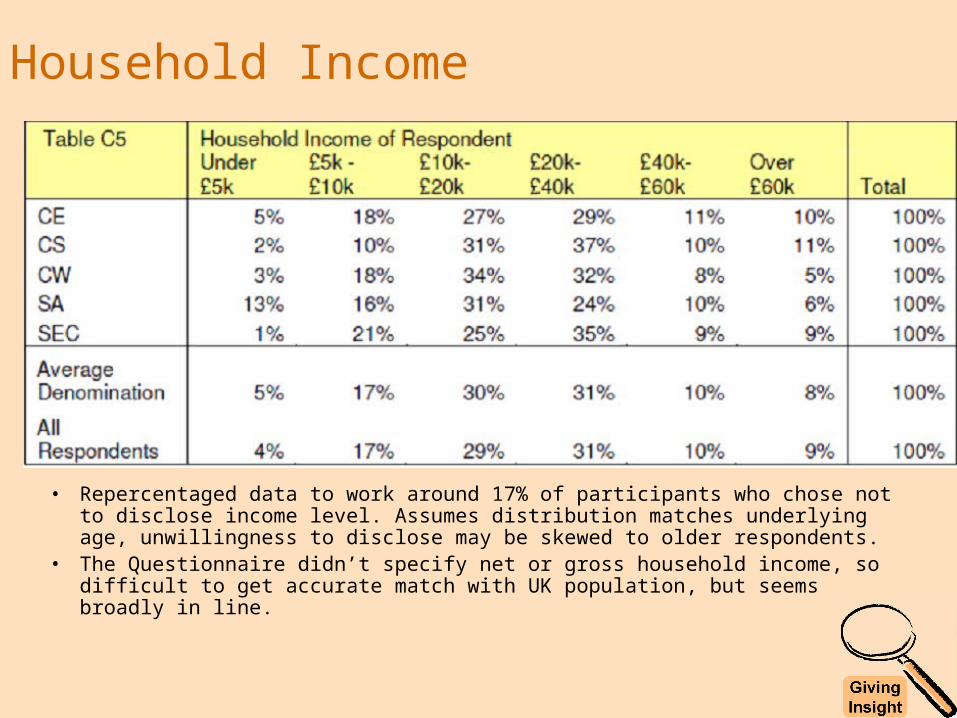
Household Income
• Repercentaged data to work around 17% of participants who chose not to disclose income level. Assumes distribution matches underlying age, unwillingness to disclose may be skewed to older respondents.
• The Questionnaire didn’t specify net or gross household income, so difficult to get accurate match with UK population, but seems broadly in line.

Size of Church
• Note: methodology with CS means no church level data• Fit for C of E is OK (slight under-representation of largest
churches, but over-representation of second group).• Again we seek a match on distribution of members across
churches, not distribution of churches.

Length of Church Association
• Over 2/3s of members attended current church for 10 years+.• 12% respondents attended current church for <3 years.• Judged to be representative.
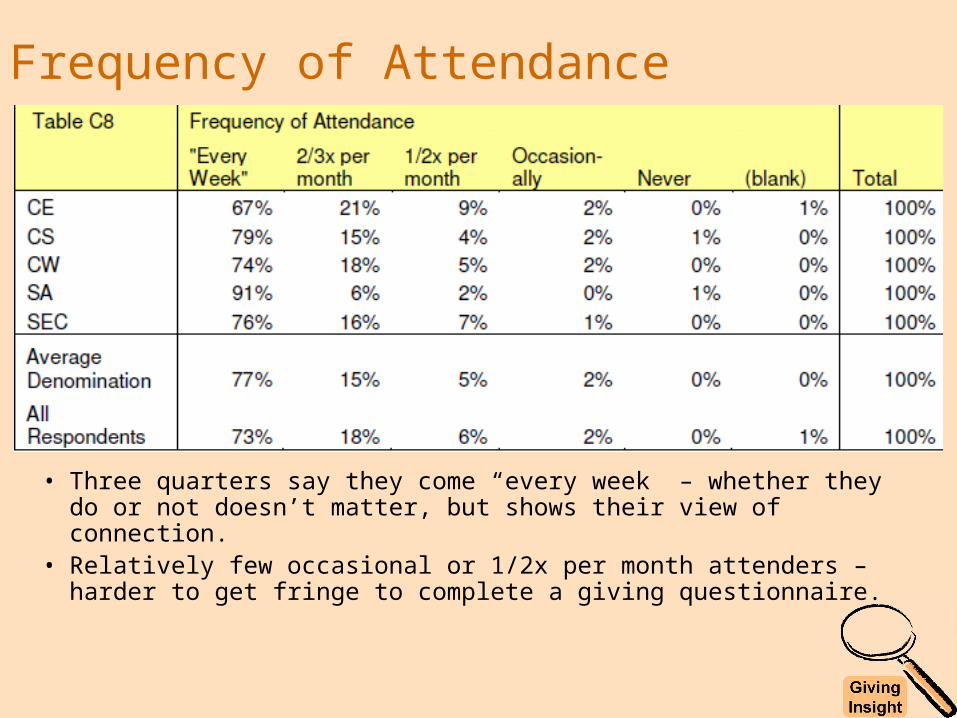
Frequency of Attendance
• Three quarters say they come “every week” – whether they do or not doesn’t matter, but shows their view of connection.
• Relatively few occasional or 1/2x per month attenders – harder to get fringe to complete a giving questionnaire.

Level of Giving
• Salvation Army highest level (and lowest average income levels).
• Church of England figures higher than average giving of £10.06/giver/week from Parish Finance Returns
• Suggests respondents are skewed to more generous givers.

In Summary
• There is a reasonable spread of responses – by age, by income group, by size of church and by context.
• Respondents are skewed to those who attend more frequently, and to higher givers.
• Not a surprise for a questionnaire on giving – in viewing the results, remember that this is skewed to those who are slightly more committed, slightly more generous than the population at large.

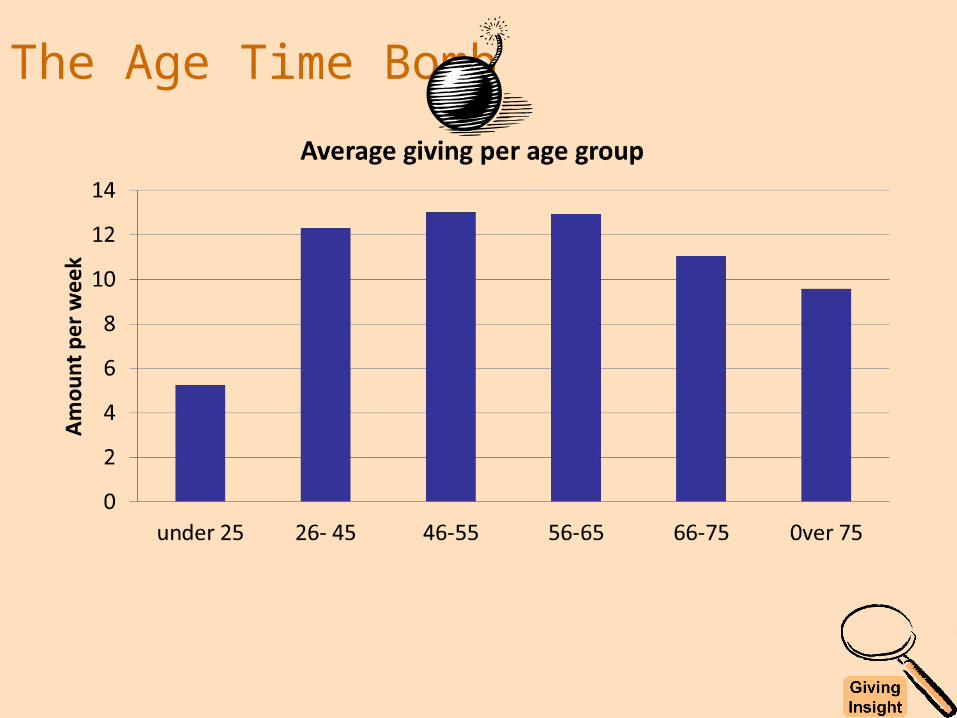
The Age Timebomb

The Age Time Bomb
• The responses indicate that 47% of the average denomination are over 65, compared to only 15% being under 45 years of age.
• Giving peaks in the age range of 46 to 65 as one would imagine with the likelihood of households being mortgage free and having more disposal income.
• Giving begins to taper off after retirement age as incomes become more static and subject to RPI rather than REI
• A break down per denomination is shown on the next slide.
The Age Time Bomb

The Age Time Bomb
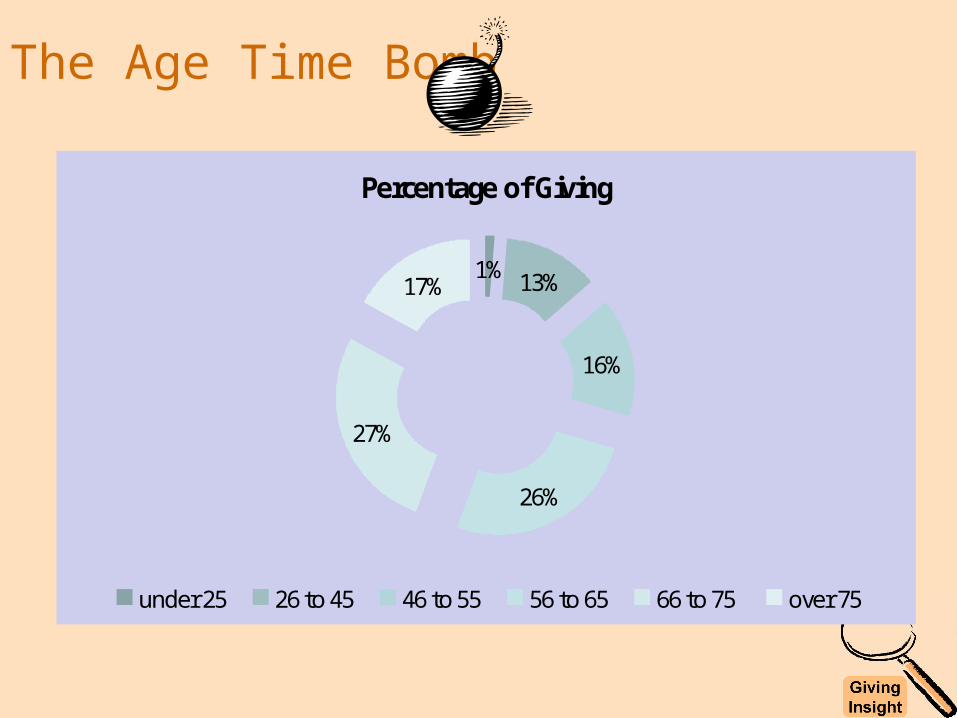
Percentage of Giving
1% 13%
16%
26%
27%
17%
under 25 26 to 45 46 to 55 56 to 65 66 to 75 over 75
70% of the giving comes from those who are 46 or older
The Age Time Bomb

How and How Much?Section E, F & G Page 10
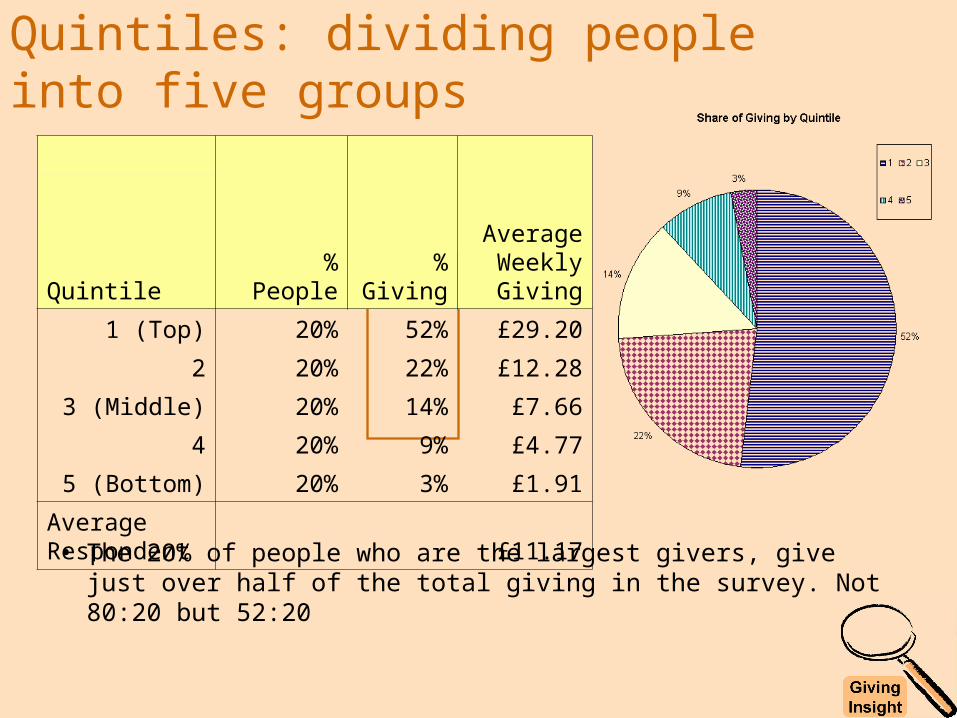
Quintiles: dividing people into five groups
% People%
Giving
Average Weekly Giving
Quintile
1 (Top) 20% 52% £29.20
2 20% 22% £12.28
3 (Middle) 20% 14% £7.66
4 20% 9% £4.77
5 (Bottom) 20% 3% £1.91
Average Respondent £11.17• The 20% of people who are the largest givers, give just over
half of the total giving in the survey. Not 80:20 but 52:20
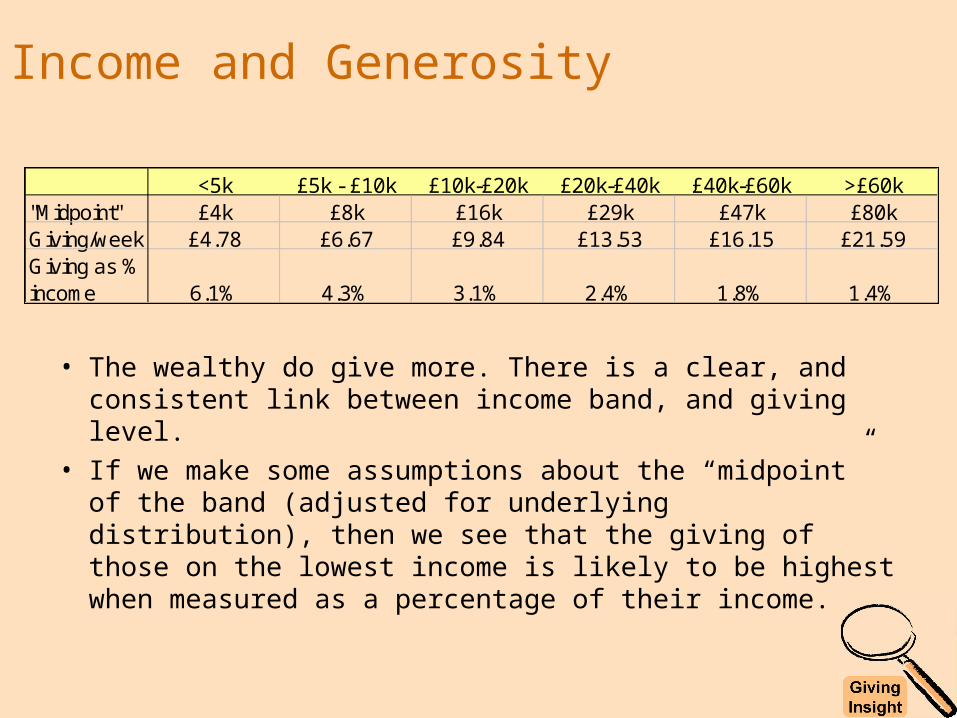
Income and Generosity
• The wealthy do give more. There is a clear, and consistent link between income band, and giving level.
• If we make some assumptions about the “midpoint” of the band (adjusted for underlying distribution), then we see that the giving of those on the lowest income is likely to be highest when measured as a percentage of their income.
<5k £5k - £10k £10k-£20k £20k-£40k £40k-£60k >£60k"Midpoint" £4k £8k £16k £29k £47k £80kGiving/week £4.78 £6.67 £9.84 £13.53 £16.15 £21.59Giving as % income 6.1% 4.3% 3.1% 2.4% 1.8% 1.4%

Largest givers most likely to use Standing Order, Smallest givers most likely to use the plate.
Method of giving
Standing Order
Regular Envelope
Quintile Plate
1 (Top) 75% 25% 11%
2 35% 62% 15%
3 (Middle) 60% 31% 13%
4 18% 57% 25%
5 (Bottom) 11% 36% 44%
Average Respondent 40% 43% 21%

Amount given by different methods…..
• Standing Orders have highest levels of giving. • Data on CAF vouchers has small base size, so inconclusive• Regular envelope has higher level of giving than plate. • Only 8% of givers giving more than £20/week give by envelope
(compared with 43% of total panel)
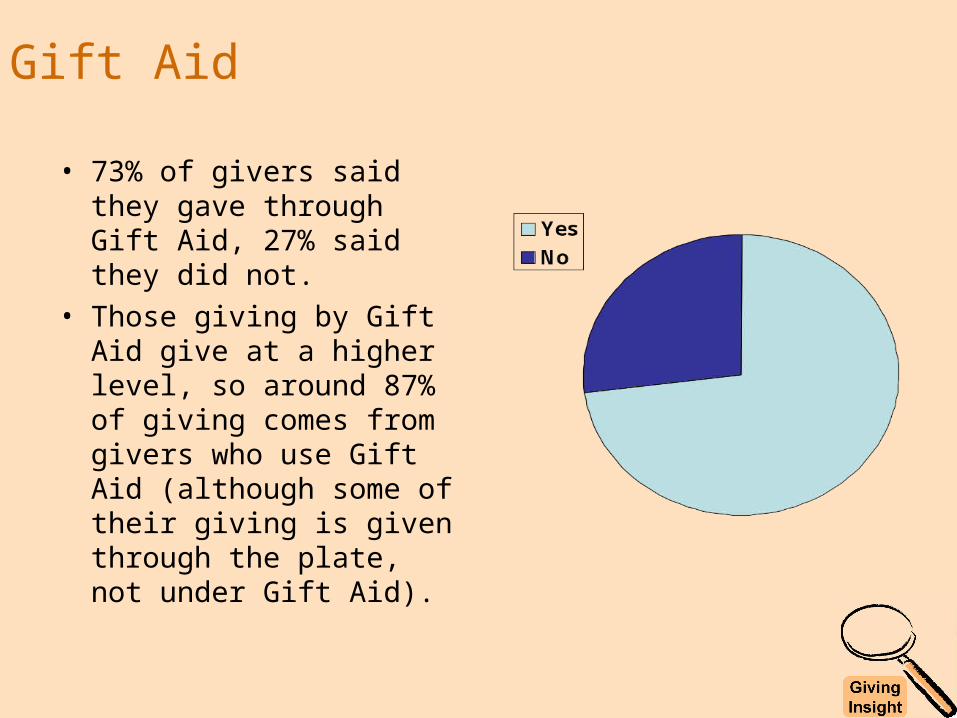
Gift Aid
• 73% of givers said they gave through Gift Aid, 27% said they did not.
• Those giving by Gift Aid give at a higher level, so around 87% of giving comes from givers who use Gift Aid (although some of their giving is given through the plate, not under Gift Aid).
Proportionate Giving: what proportion?
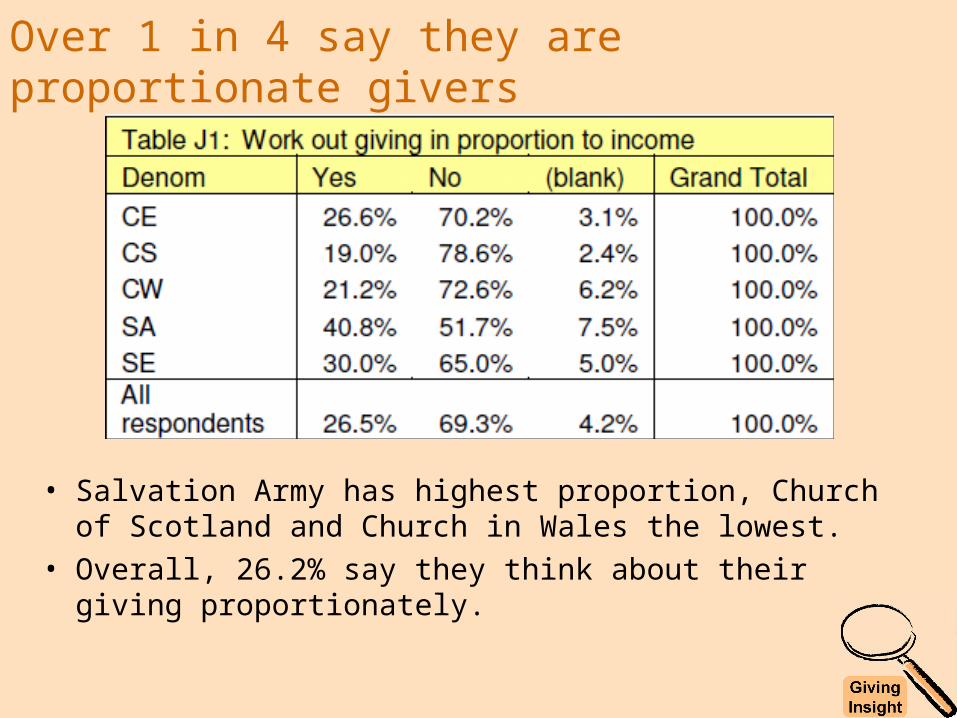
Over 1 in 4 say they are proportionate givers
• Salvation Army has highest proportion, Church of Scotland and Church in Wales the lowest.
• Overall, 26.2% say they think about their giving proportionately.
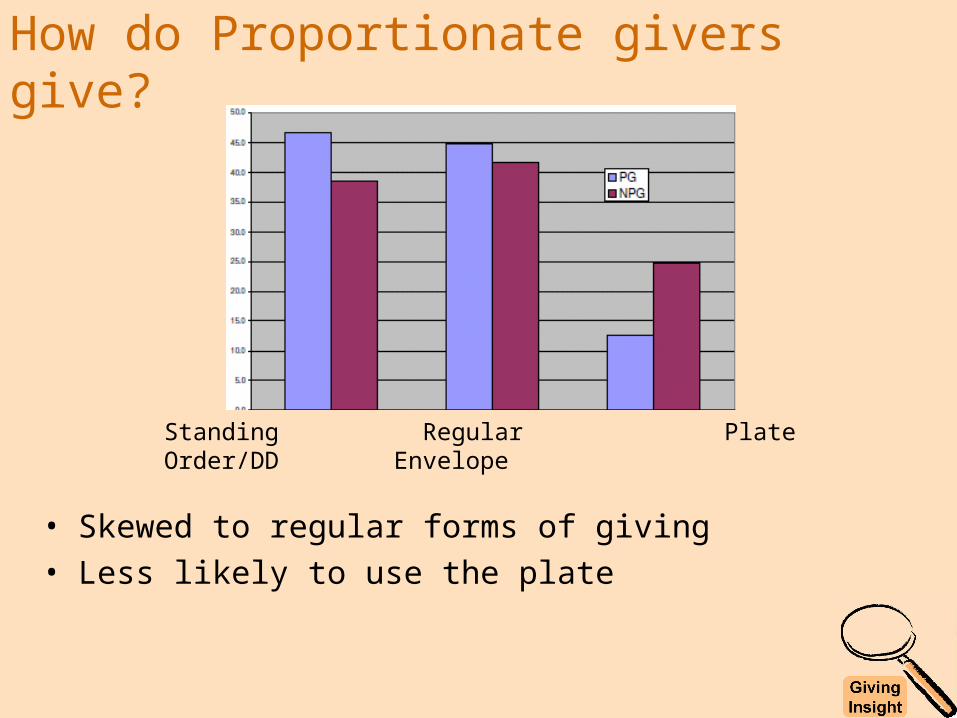
How do Proportionate givers give?
• Skewed to regular forms of giving• Less likely to use the plate
Standing Regular PlateOrder/DD Envelope

What proportion?
• Of the 26% who say they give proportionately.......– A third (32%) are tithers– Three in 10 say they give up to 10%– A quarter (23%) left the question blank– 17% give more than 10%, but only £8.08 on average a week
• The logic doesn’t work for many – either they are giving proportionately from a smaller pot; or they don’t understand percentages.

Proportionate givers think…..
more
more
more
more
less
less but
less

Is 5% a reasonable challenge?
• A third say “yes”, a third say “no”, and a third say “not sure”
• Proportionate givers much more likely to say yes, but only three in five do.

Is 5% a reasonable challenge?
Opportunity for free comments…..• Proportionate giving is regressive (22 comments)• Freedom of choice (20 comments)• A tithe would be better / is more biblical (13 comments)• Outrageous (12 comments)• Unrealistic for Pensioners (6 comments)• We’ve been doing this for years (1 comment)Most comments from those who disagreed!

Teaching: Who doesn’t want it?

Only 18% of respondents agree!
Table L1 I would like to receive more teaching on giving & money
Strongly Agree Agree Neither Disagree
Strongly Disagree Blank Total
CE 3% 14% 30% 34% 12% 6% 100%
CS 4% 14% 34% 31% 12% 6% 100%
CW 4% 18% 37% 21% 8% 12% 100%
SA 4% 21% 29% 26% 7% 13% 100%
SEC 2% 13% 30% 32% 15% 8% 100%
Average Denomination 3% 16% 32% 29% 11% 9% 100%
All Respondents 3% 15% 32% 31% 12% 8% 100%

Most don’t really seem to know
0
5
10
15
20
25
30
35
% o
f R
esp
on
den
ts
Strongly Agree Agree Neither Disagree Strongly Disagree
• High level of “neither agree nor disagree” perhaps suggests that it depends on the quality of the teaching.