
Goal Directed Perfusion: theory, clinical results, and key ... 1... · Goal Directed Perfusion:...
88
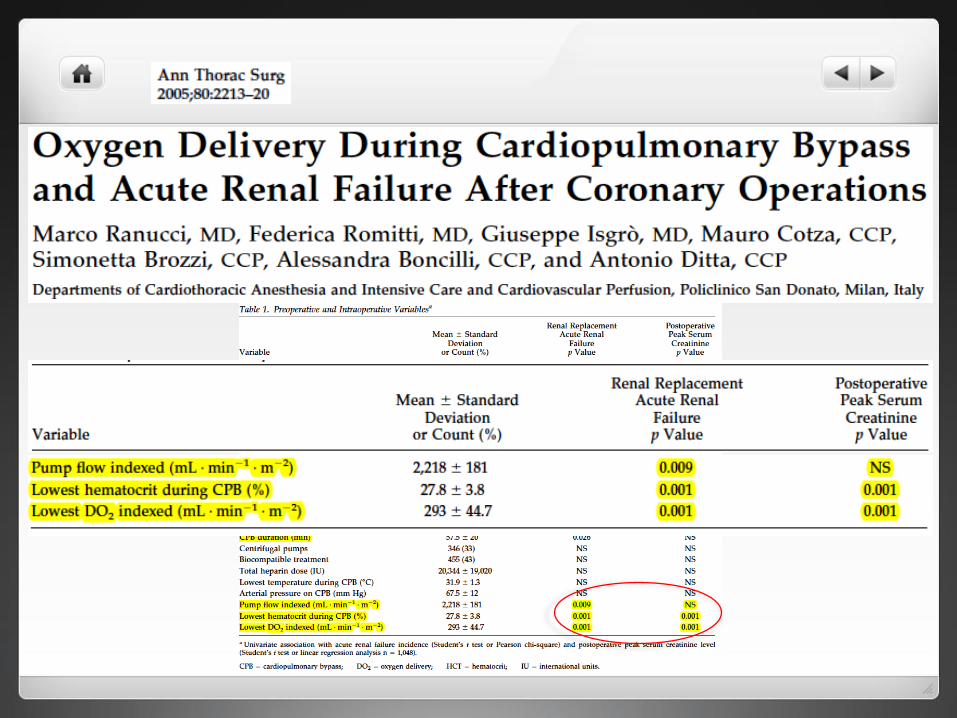
Ranuuci, M et al. 2005 M. Ranucci Director of Clinical Research Dept of Cardiothoracic and Vascular Anesthesia and Intensive Care IRCCS Policlinico S.Donato Goal Directed Perfusion: theory, clinical results, and key rules
Transcript of Goal Directed Perfusion: theory, clinical results, and key ... 1... · Goal Directed Perfusion:...

Ranuuci, M et al. 2005
M. RanucciDirector of Clinical Research
Dept of Cardiothoracic and Vascular
Anesthesia and Intensive Care
IRCCS Policlinico S.Donato
Goal Directed Perfusion: theory, clinical results, and key rules

Outline
• Theory: postoperative organ dysfunction
and oxygen dependency
• Clinical results: the hypothesis generated
by retrospective data
• Key rules: the GDP laws

Outline
• Theory: postoperative organ dysfunction
and oxygen dependency
• Clinical results: the hypothesis generated
by retrospective data
• Key rules: the GDP laws


If this debt is ‘paid back’ within 8 hours, the incidence of postoperative complications decreases, and if it is never paid then cell dysfunction and
death occur.
Performing perioperative optimization of the high-risk surgical patients.
BJA 2006;97:4-11

Lactate

Hemodynamic optimization
Cardiac Index > 4,5 L/min/m2O2 delivery > 600 ml/min /m2O2 consumption > 170 ml/min/m2
Control PAC control PAC hemodynamicoptimization
70
60
50
40
30
20
10
0

FROM NON-CARDIAC SURGERY
TO CPB-CARDIAC OPERATIONS
THE ASSOCIATION BETWEEN ORGANFAILURE AND LOW OXYGEN CONTENT/
DELIVERY
Low HCT levels on CPB have been associated with:
• AKI
• Stroke
• Low cardiac output

THE ASSOCIATION BETWEEN ORGANFAILURE AND LOW OXYGEN CONTENT/
DELIVERY
Low HCT levels on CPB have been associated with:
• KIDNEY
• BRAIN
• HEART

Chang MC. New Horizons 1999;7:35-45
Preload
Cardiac Output

THE ASSOCIATION BETWEEN ORGANFAILURE AND LOW OXYGEN CONTENT/
DELIVERY
Low HCT levels on CPB have been associated with:
• KIDNEY
• BRAIN
•HEART

Crude risk of Low Output Failure (LOF) by Nadir Hematocrit during CPB. Surgenor SD, et al. Circulation
2006;114(Suppl):43–8i.

THE ASSOCIATION BETWEEN ORGANFAILURE AND LOW OXYGEN CONTENT/
DELIVERY
Low HCT levels on CPB have been associated with:
•KIDNEY• BRAIN
• HEART

Possible perfusion-related risk factors
• CPB itself
• Perfusion pressure
• Perfusion flow
• Loss of pulsatility
• Severe hemodilution
• Poor oxygen delivery
• Hemolysis

PRESSURE


FLOW

OXYGEN CONTENT
OXYGEN DELIVERY


STRUCTURE OF THE KIDNEY(after A.Despopoulos & S.Silbernagl , Color Atlas of
Physiology, 2003)


Kidney and oxygen supply
• Renal medulla is chronically hypoxemic
• A low oxygen content (hemodilution) further
worsen kidney hypoxia
• Low blood flow is a major determinant
of reduced oxygen supply


12%

16,000 consecutive patients at the IRCCS PSD
Nadir HCT (%) on CPB
Ris
ko
f A
KI sta
ge 2
10 15 20 25 30 35 400.0
0.1
0.2
0.3
8%


HCTDO2
VCO2
DO2/VCO2
AKI (creatinine change withinfirst 48h)

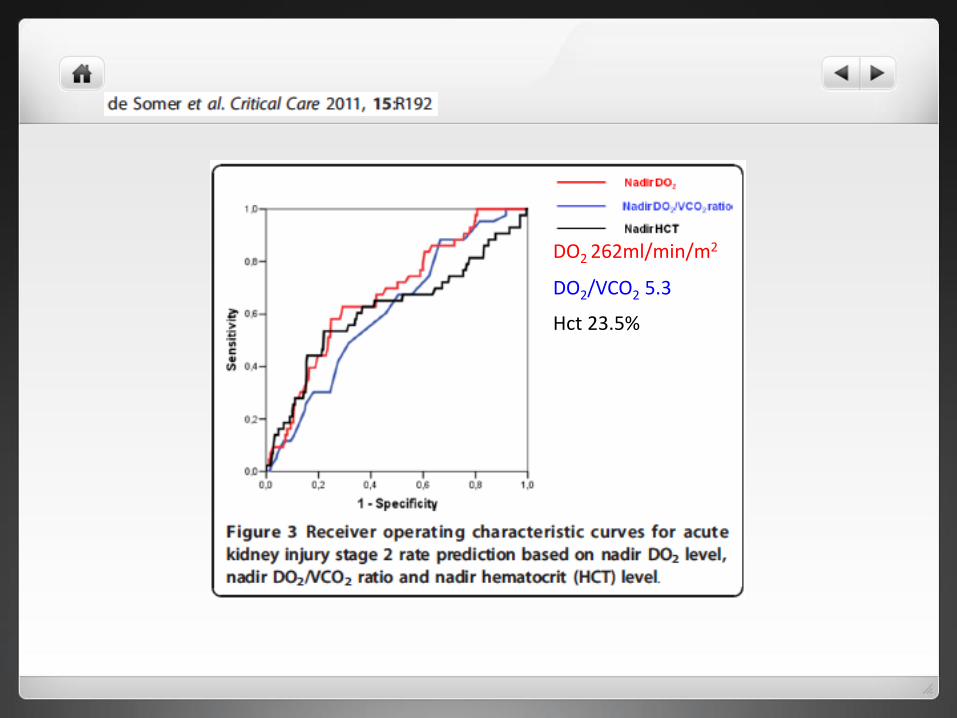
DO2 262ml/min/m2
DO2/VCO2 5.3
Hct 23.5%


Measurements and calculations
• PA-catheter: Systemic haemodynamics
• Renal vein catheter:– Renal blood flow (RBF)
– Renal oxygen extraction (SaO2-SrvO2) / SaO2
– Filtration fraction (FF), the renal extraction of Cr51-EDTA
• Calculations:• Glomerular Filtration Rate (GFR) = FF x RBF x (1-Hct)
• Renal Oxygen Consumption (RVO2) = RBF x (CaO2 - CvO2)
• Renal Oxygen Delivery (RDO2) = RBF x CaO2
• Urinary excretion of NAG (every 30 minutes)
Lukas lannemyr, M D, Dpt of Cardiothoracic anaesthesia and intensive care,
Sahlgrenska University Hospital, Gothenburg, Sweden

Results –Systemic variables
0
0,5
1
1,5
2
2,5
3
Pre CPB 30' CPB 60' Post CPB
L/m
in/m
2
Cardiac Index
0
10
20
30
40
50
60
70
80
90
100
Pre CPB 30' CPB 60' Post CPB
mm
Hg
Mean Arterial Pressure
0
20
40
60
80
100
120
140
Pre CPB 30' CPB 60' Post CPB
g/L
Haemoglobin
*** *** **
*** *** ***
*
* p < 0.05, ** p < 0.01, ** p < 0.001

Results –Renal variables
0
100
200
300
400
500
600
700
Pre CPB 30' CPB 60' Post CPB
ml/
min
Renal blood flow
0
20
40
60
80
Pre CPB 30' CPB 60' Post CPB
ml/
min
Glomerular filtration rate
0
5
10
15
Pre CPB 30' CPB 60' Post CPB
ml/
min
Renal oxygen consumption
*** p < 0.001
***
0
0,05
0,1
0,15
0,2
Pre CPB 30' CPB 60' Post CPB
mm
Hg/
ml/
min
Renal vascular resistance

Systemic and renal oxygen delivery
0
20
40
60
80
100
120
140
0
50
100
150
200
250
300
350
400
Pre CPB CPB 30' CPB 60' Post CPB
RD
O2
ml/
min
DO
2I m
l/m
in/m
2
DO2I
RDO2
* ** *
* *
* p < 0.05, ** p < 0.01 vs Pre

Renal oxygen extraction- oxygen supply demand
relationship
0
0,05
0,1
0,15
0,2
Pre CPB 30' CPB 60' Post CPB
* ****
* p < 0.05, *** p < 0.001 vs Pre

NAG – excretion
0
2
4
6
8
10
12
14
Pre CPB CPB 30' CPB 60' CPB 120' Post CPB30' Post CPB60' 24 hPostCPB
mL/
min
NAG/U-creatinine
*
*
*** ***
* p < 0.05, *** p < 0.001 vs Pre

DO2 600 mL/min
DO2 85 mL/min (14%)
O2ER 10%
BEFORE CPB

DO2 680 mL/min
DO2 68 mL/min (10%)
O2ER 15%
ON CPB

DO2 610 mL/min
DO2 76 mL/min (12%)
O2ER 17%
AFTER CPB


Outline
• Theory: postoperative organ dysfunction
and oxygen dependency
• Clinical results: the hypothesis generated
by retrospective data
• Key rules: the GDP laws


SvO2 not sensitive

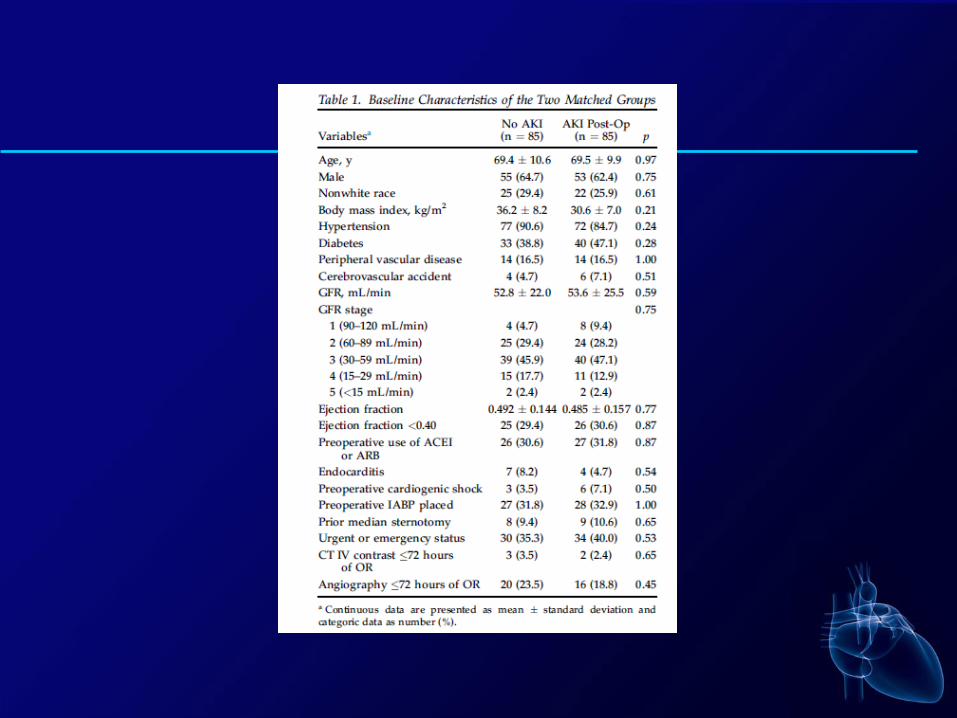
• Single center retrospective cohort study• 16.790 non congenital adult patients undergone cardiac surgery on pump from 2000 to
december 2013• 793 (4,7%) AKI stage 2/3 in postop (increasing serum creatinine more than 200%)

Nadir Hct value during CPB was confirmed as an indipendentdeterminant of AKI (increase of 7% per 1% point of nadir Hct value

• Some factors (eGFR and EF) have been improving in the last period• Others (diabetes, redo and nonelective operations, non isolated CABG, peoperative
use of IABP and duration CPB) show a significantly higher severity.

• AKI rate significantly increased until 2005, despite no significant change in RRS• Starting 2006 AKI rate decline, despite the increase in the RRS

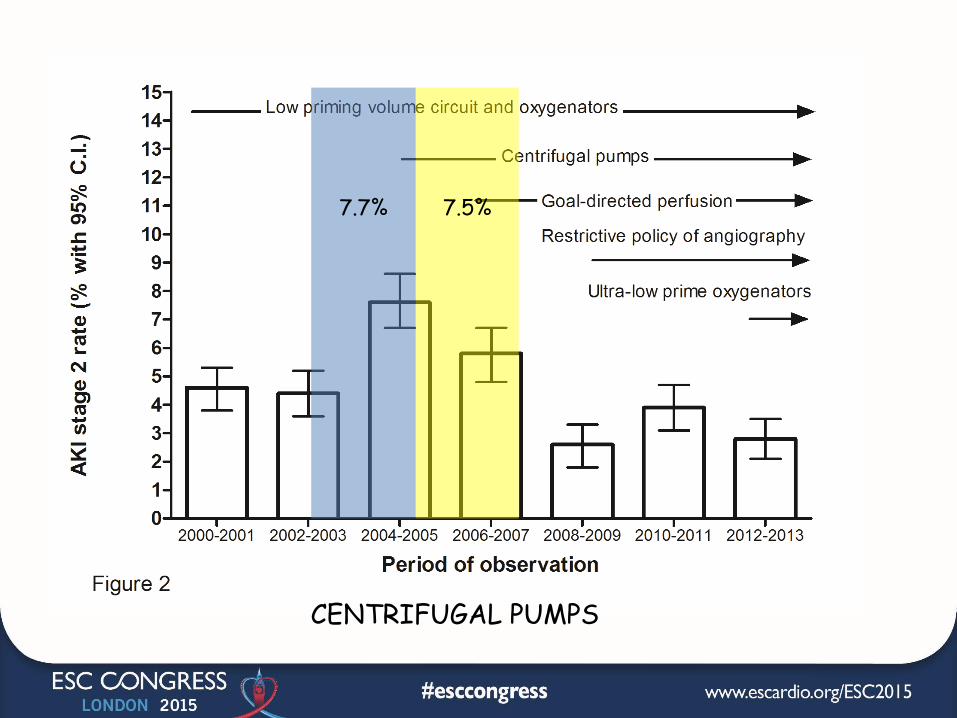
7.7% 7.5%
CENTRIFUGAL PUMPS

4.8%
3.7%
NO ANGIOGRAPHY ON THE DAY OF SURGERY – P=0.028
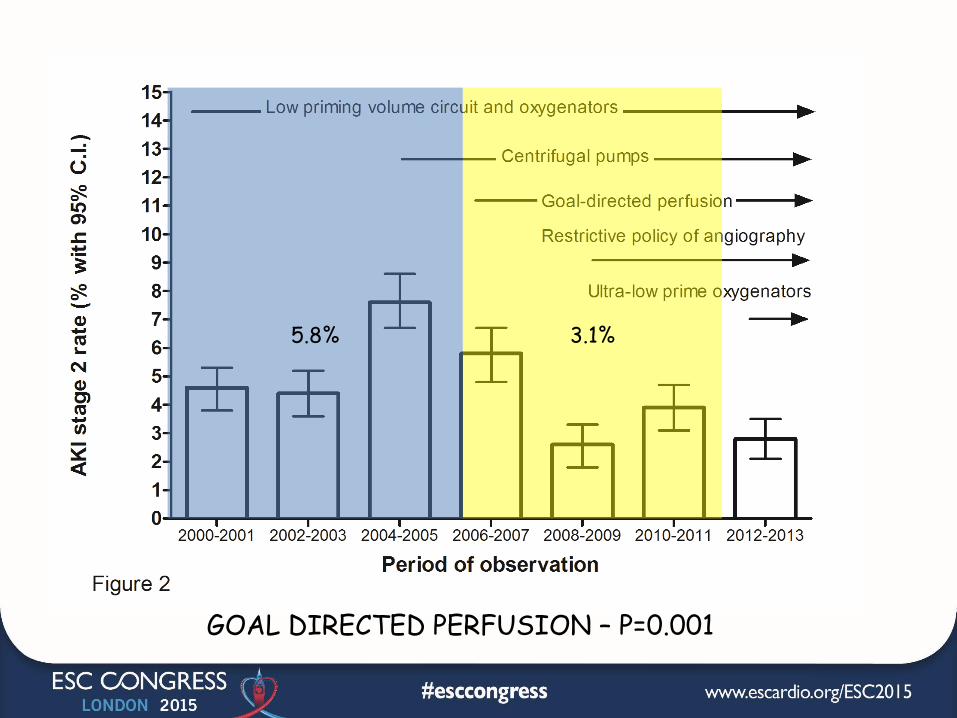
5.8% 3.1%
GOAL DIRECTED PERFUSION – P=0.001

Effect of Goal Directed Perfusion


Outline
• Theory: postoperative organ dysfunction
and oxygen dependency
• Clinical results: the hypothesis generated
by retrospective data
• Key rules: the GDP laws

Gas flowtemperature GDP monitor
Same oldperfusionistas in the 90’s
Pump flowmeasured
Low primeoxygenators

THE FIVE GDP LAWS
1. Limit hemodilution on CPB
Nadir HCT on CPB (%)
AK
I ra
te (
% w
ith
95%
CI)
16 18 20 22 24 26 28 30 32 34 36 380.00
0.05
0.10
0.15
0.20
0.25


THE FIVE GDP LAWS
2. Always stay at a DO2 > 270mL/min/m2


THE FIVE GDP LAWS
3. Increase the DO2 by actingon pump flow, PaO2


Perfusion. 2015 Jul 23. pii: 0267659115595281. [Epub ahead of print]
The effects of hyperoxaemia on tissue oxygenation in patients with a nadir
haematocrit lower than 20% during cardiopulmonary bypass.
Sevuk U(1), Altindag R(2), Baysal E(2), Yaylak B(2), Adiyaman MS(2), Akkaya S(2),
Ay N(3), Alp V(3).
Excessive haemodilution and the resulting anaemia during CPB is accompanied by a
decrease in the total arterial oxygen content, which may impair tissue oxygen
delivery. Hyperoxic ventilation has been proven to improve tissue oxygenation in
different pathophysiological states of anaemic tissue hypoxia. The aim of this
study was to examine the influence of arterial hyperoxaemia on tissue oxygenation
during CPB. Records of patients undergoing isolated CABG with CPB were
retrospectively reviewed. Patients with nadir haematocrit levels below 20% during
CPB were included in the study. Tissue hypoxia was defined as hyperlactataemia
(lactate >2.2 mmol/L) coupled with low ScVO2 (ScVO2 <70%) during CPB. One hundred
patients with normoxaemia and 100 patients with hyperoxaemia were included in the
study. Patients with hyperoxaemia had lower tissue hypoxia incidence than
patients with normoxaemia (p<0.001). Compared with patients without tissue
hypoxia, patients with tissue hypoxia had significantly lower PaO2 values
(p<0.001) and nadir haematocrit levels (p<0.001). Nadir haematocrit levels <18%
(OR: 5.3; 95% CI: 2.67-10.6; p<0.001) and hyperoxaemia (OR: 0.28; 95% CI:
0.14-0.56; p<0.001) were independently associated with tissue
hypoxia.CONCLUSIONS: Hyperoxaemia during CPB may be protective against tissue
hypoxia in patients with nadir haematocrit levels <20%.

THE FIVE GDP LAWS
4. Transfuse RBC based on SvO2and O2ER rather than HCT


THE FIVE GDP LAWS
5. Avoid the anaerobic zone bychecking lactates and VCO2

DO2 , VO2 , SvO2 , and Lactates...and VCO2
0 100 200 300 400 500 600 700 800 900 1,000
DO2 (mL/min)
VO2
(mL/min)300
250
200
150
100
50
0
SvO2
(%) 90
80
70
60
50
40
30
25
Lac
(mMol/L)
12
10
8
6
4
2
0
Critical
DO2
OXYGEN DEBT
VCO2
(mL/min)


THE GDP CONCEPT:
0 100 200 300 400 500 600 700 800 900 1,000
DO2 (mL/min)
VO2
(mL/min)300
250
200
150
100
50
0
SvO2
(%) 90
80
70
60
50
40
30
25
Lac
(mMol/L)
12
10
8
6
4
2
0
Critical
DO2
OXYGEN DEBT
VCO2
(mL/min)
WE WANTTHE PATIENT
IN THISZONE

Lowest HCT on CPB
AK
I 2 r
ate
(%
)
0 2 4 6 8 10 12 14 16 18 20 22 24 26 28 30 32 34 36 38 400
5
10
15
20
25
30
35
40
45
50
55
60
65
70
75
801994
2014
KEEP THEPATIENT
HERE
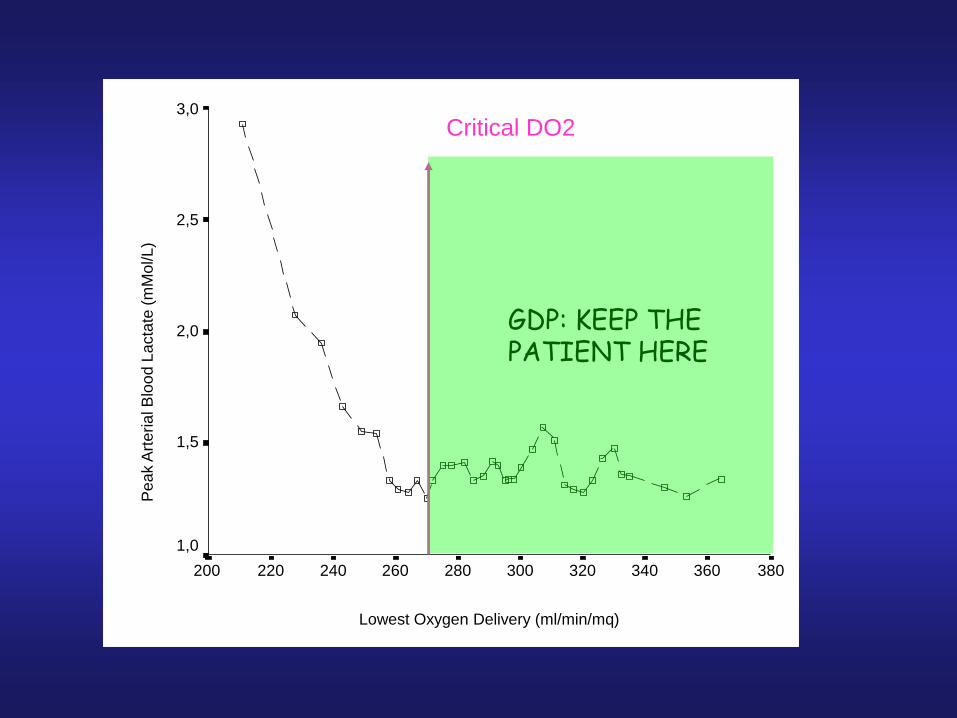
Lowest Oxygen Delivery (ml/min/mq)
380360340320300280260240220200
Pe
ak A
rte
ria
l B
loo
d L
acta
te (
mM
ol/L
)
3,0
2,5
2,0
1,5
1,0
Critical DO2
GDP: KEEP THEPATIENT HERE

KEEP THEPATIENT
HERE
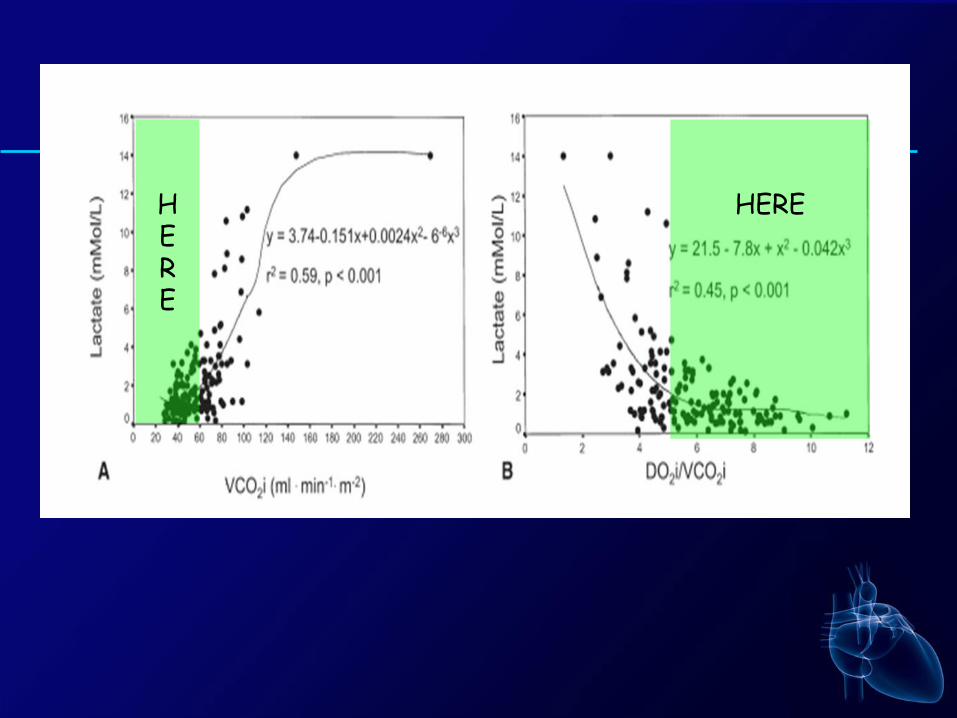
HERE
HERE

Lowest HCT on CPB
AK
I 2 r
ate
(%
)
0 2 4 6 8 10 12 14 16 18 20 22 24 26 28 30 32 34 36 38 400
5
10
15
20
25
30
35
40
45
50
55
60
65
70
75
801994
2014
20 years of CPBtechnologiesimprovements
• Centrifugal vs roller pumps• Biocompatible circuits• Flow monitoring• Less transfusions
Same HCTHigher Pump FlowGDP in 2014


