Goal #3 LIMIT INFLATION Country and Time- Zimbabwe, 2008 Annual Inflation Rate- 79,600,000,000% Time...
34
Goal #3 LIMIT INFLATION Country and Time- Zimbabwe, 2008 Annual Inflation Rate- 79,600,000,000% Time for Prices to Double- 24.7 hours
-
Upload
austin-king -
Category
Documents
-
view
215 -
download
1
Transcript of Goal #3 LIMIT INFLATION Country and Time- Zimbabwe, 2008 Annual Inflation Rate- 79,600,000,000% Time...

Goal #3LIMIT INFLATION
Country and Time- Zimbabwe, 2008
Annual Inflation Rate-79,600,000,000%
Time for Prices to Double-24.7 hours

What is Inflation?Inflation is rising general level
of pricesInflation reduces the
“purchasing power” of money
Examples: • It takes $2 to buy what $1 bought in 1982
• It takes $6 to buy what $1 bought in 1961
•When inflation occurs, each dollar of income will buy fewer goods than before.
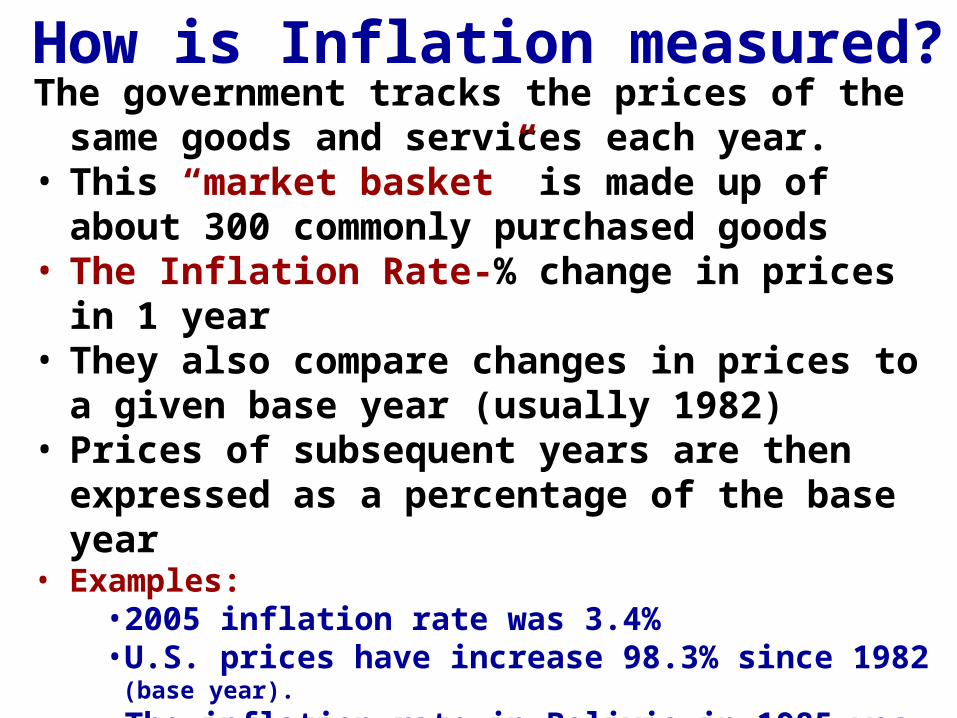
How is Inflation measured?The government tracks the prices of the same goods and
services each year. • This “market basket” is made up of about 300
commonly purchased goods• The Inflation Rate-% change in prices in 1 year• They also compare changes in prices to a given base
year (usually 1982)• Prices of subsequent years are then expressed as a
percentage of the base year• Examples:
• 2005 inflation rate was 3.4%• U.S. prices have increase 98.3% since 1982 (base year).
• The inflation rate in Bolivia in 1985 was 50,000%•This is called Hyperinflation•A $25 meal today would cost $12,525 a year later

World Inflation Rates

Historic Inflation Rates


Is Inflation Good or Bad?

Identify which people are helped and which are hurt by unanticipated
inflation?
1. A man who lent out $500 to his friend in 1960 and is still waiting to be paid back.
2. A tenant who is charged $850 rent each year. 3. An elderly couple living off fixed retirement
payments of $2000 a month4. A man that borrowed $1,000 in 1995 and paid it
back in 20065. A women who saved a paycheck from 1950 by
putting it under her mattress

Make a T-Chart
• Borrowers-People who borrow money
• A business where the price of the product increases faster than the price of resources
• Lenders-People who lend money (at fixed interest rates)
• People with fixed incomes
• Savers
Hurt by Inflation Helped by Inflation
Cost-of-Living-Adjustment (COLA)Some works have salaries that mirror inflation.
They negotiated wages that rise with inflation

Consumer Price Index (CPI)
Measuring Inflation

=Price of market
basket in base year
x 100CPI Price of market basket
Consumer Price Index (CPI)The most commonly used measurement inflation for
consumers is the Consumer Price IndexHere is how it works:• The base year is given an index of 100• To compare, each year is given an index # as well
1997 Market Basket: Movie is $6 & Pizza is $14 Total = $20 (Index of Base Year = 100)
2009 Market Basket: Movie is $8 & Pizza is $17Total = $25 (Index of )125
•This means inflation increased 25% b/w ’97 & ‘09•Items that cost $100 in ’97 cost $125 in ‘09


Problems with the CPI1. Substitution Bias- As prices increase for the fixed
market basket, consumers buy less of these products and more substitutes that may not be part of the market basket. (Result: CPI may be higher than what consumers are really paying)
2. New Products- The CPI market basket may not include the newest consumer products. (Result: CPI measures prices but not the increase in choices)
3. Product Quality- The CPI ignores both improvements and decline in product quality. (Result: CPI may suggest that prices stay the same though the economic well being has improved significantly)

Calculating Nominal GDP, Real GDP, and Inflation

Calculating CPI
12345
1010152025
$ 45684
Units ofOutput
Year
Nominal,GDP
Real,GDP
Make year one the base year
= Price of the same marketbasket in base year
x 100CPIPrice of market basket in
the particular year
PricePer Unit
CPI/ GDP Deflator
(Year 1 as Base Year)
Inflation Rate
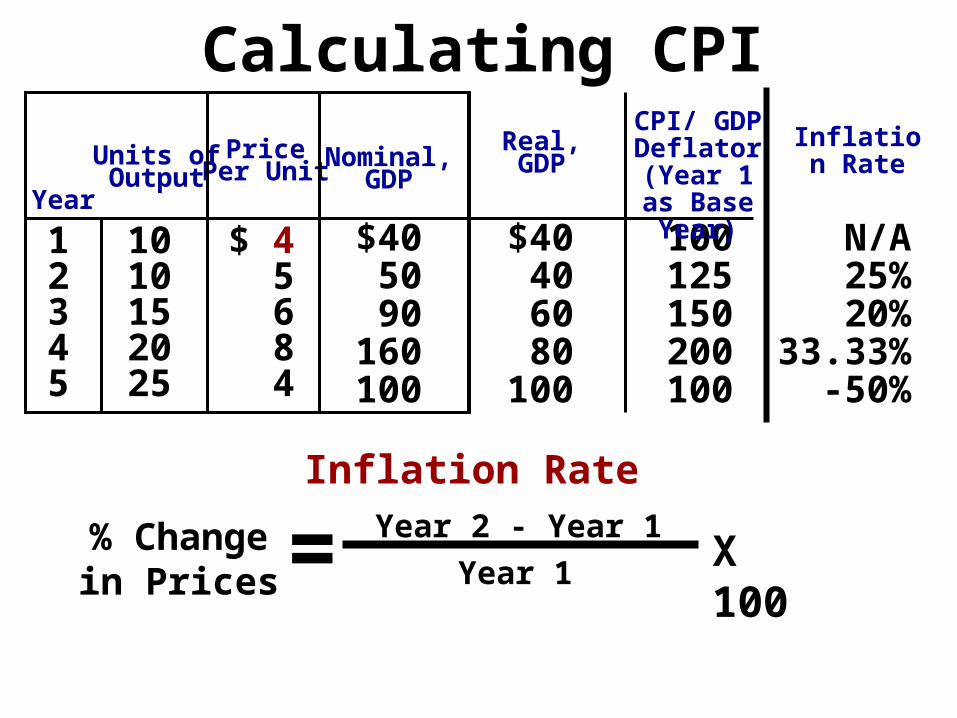
12345
1010152025
$ 45684
$40406080
100
PricePer Unit
Units ofOutput
Year
$405090
160100
100125150200100
Nominal,GDP
Real,GDP
% Change in Prices = Year 2 - Year 1
Year 1X 100
Inflation Rate
Inflation Rate
N/A25%20%
33.33%-50%
CPI/ GDP Deflator
(Year 1 as Base Year)
Calculating CPI

Practice
12345
510204050
$ 68
101214
Units ofOutput
Year
Nominal,GDP
Real,GDP
Make year three the base year
= Price of the same marketbasket in base year
x 100CPIPrice of market basket in
the particular year
PricePer Unit
Consumer Price Index(Year 3 as Base Year)
$50100200400500
$3080
200480700
6080
100120140

=Real GDP
x 100GDPDeflator
Nominal GDP
CPI vs. GDP DeflatorThe GDP deflator measures the prices of all goods
produced, whereas the CPI measures prices of only the goods and services bought by consumers.
An increase in the price of goods bought by firms or the government will show up in the GDP deflator but not in the CPI.
The GDP deflator includes only those goods and services produced domestically. Imported goods are not a part of GDP and therefore don’t show up in the GDP deflator.
If the nominal GDP in ’09 was 25 and the real GDP (compared to a base year) was 20 how much is the
GDP Deflator?

Calculating GDP Deflator
=100
NominalGDP
(Deflator) x (Real GDP)
=Real GDP
x 100GDPDeflator
Nominal GDP

Calculations1. In an economy, Real GDP (base year = 1996) is $100
billion and the Nominal GDP is $150 billion. Calculate the GDP deflator.
2. In an economy, Real GDP (base year = 1996) is $125 billion and the Nominal GDP is $150 billion. Calculate the GDP deflator.
3. In an economy, Real GDP for year 2002 (base year = 1996) is $200 billion and the GDP deflator 2002 (base year = 1996) is 120. Calculate the Nominal GDP for 2002.
4. In an economy, Nominal GDP for year 2005 (base year = 1996) is $60 billion and the GDP deflator 2005 (base year = 1996) is 120. Calculate the Real GDP for 2005.

Three Causes of Inflation
1. If everyone suddenly had a million dollars, what would happen?
2. What two things cause prices to increase? Use Supply and Demand
1. The Government Prints TOO MUCH Money (The Quantity Theory)
3 Causes of Inflation
• Governments that keep printing money to pay debts end up with hyperinflation.
• There are more “rich” people but the same amount of products.
• Result: Banks refuse to lend and GDP falls
Examples:• Bolivia, Peru, Brazil• Germany after WWI

Quantity Theory of Money If the real GDP in a year is $400 billion but the amount of money in the economy is only $100
billion, how are we paying for things? The velocity of money is the average times a
dollar is spent and re-spent in a year.How much is the velocity of money in the above
example?
Quanity Theory of Money Equation: M x V = P x Y
M = money supply P = price level V = velocity Y = quantity of output
Notice that P x Y is GDP24

M x V = P x Y Why does printing money lead to inflation?
•Assume the velocity is relatively constant because people's spending habits are not quick to change. •Also assume that output (Y) is not affected by the amount of money because it is based on production, not the value of the stuff produced. If the govenment increases the amount of money
(M) what will happen to prices (P)? Ex: Assume money supply is $5 and it is being used to buy 10 products with a price of $2 each.1. How much is the velocity of money?2. If the velocity and output stay the same, what will happen if the amount of money is increase to $10?
Notice, doubling the money supply doubles prices 25

What would happen if the government printed money to pay off the national debt all at once?
2. DEMAND-PULL INFLATION“Too many dollars chasing too few goods”
DEMAND PULLS UP PRICES!!!• Demand increases but supply stays the
same. What is the result?• A Shortage driving prices up• An overheated economy with excessive
spending but same amount of goods.
3 Causes of Inflation

3. COST-PUSH INFLATION
Higher production costs increase pricesA negative supply shock increases the costs of
production and forces producers to increase prices.
Examples: •Hurricane Katrina destroyed oil refineries and causes gas prices to go up. Companies that use gas increase their prices.
3 Causes of Inflation

Cost-Push Inflation

A Perpetual Process:1.Workers demand raises2.Owners increase prices to pay for raises3. High prices cause workers to demand higher raises 4. Owners increase prices to pay for higher raises5. High prices cause workers to demand higher raises 6. Owners increase prices to pay for higher raises
The Wage-Price Spiral

Interest Rates
31

Interest Rates and Inflation What are interest rates? Why do lenders charge them?
Who is willing to lend me $100 if I will pay a total interest rate of 100%?
(I plan to pay you back in 2050)
If the nominal interest rate is 10% and the inflation rate is 15%, how much is the REAL interest rate?
Real Interest Rates-The percentage increase in purchasing power that a
borrower pays. (adjusted for inflation)Real = nominal interest rate - expected inflation
Nominal Interest Rates- the percentage increase in money that the borrower
pays not adjusting for inflation.Nominal = Real interest rate + expected inflation

Nominal vs. Real Interest RatesExample #1:You lend out $100 with 20% interest. Inflation is 15%.A year later you get paid back $120.
What is the nominal and what is the real interest rate?Nominal interest rate is 20%. Real interest rate was 5%In reality, you get paid back an amount with less
purchasing power. Example #2:You lend out $100 with 10% interest. Prices are expected
to increased 20%. In a year you get paid back $110. What is the nominal and what is the real interest rate?
Nominal interest rate is 10%. Real rate was –10%
In reality, you get paid back an amount with less purchasing power.
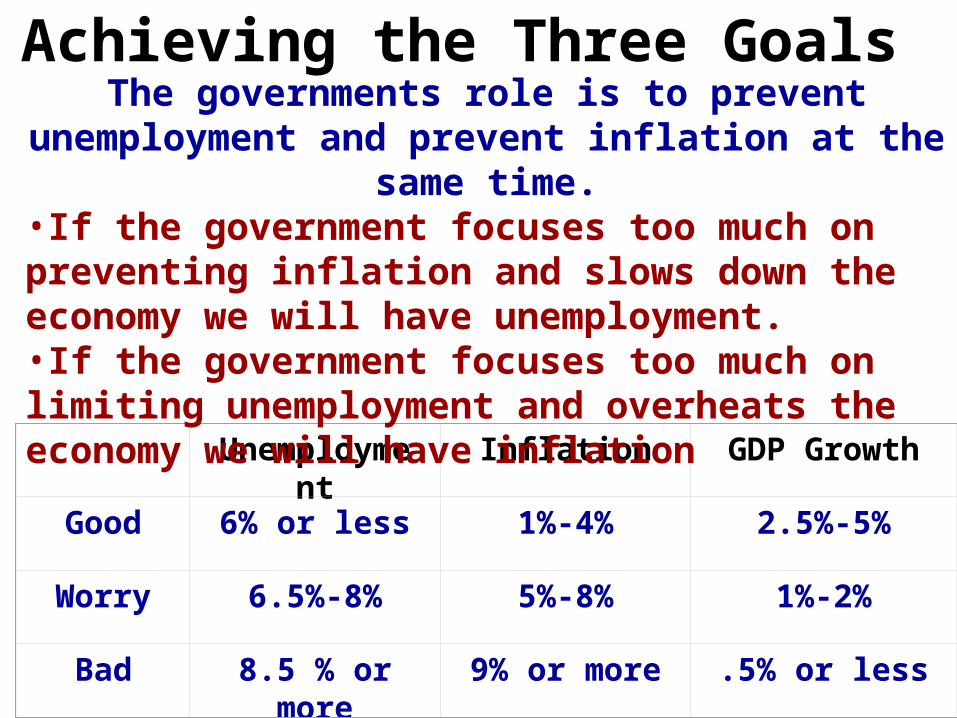
Achieving the Three Goals
Unemployment Inflation GDP Growth
Good 6% or less 1%-4% 2.5%-5%
Worry 6.5%-8% 5%-8% 1%-2%
Bad 8.5 % or more 9% or more .5% or less
The governments role is to prevent unemployment and prevent inflation at the same time.
•If the government focuses too much on preventing inflation and slows down the economy we will have unemployment. •If the government focuses too much on limiting unemployment and overheats the economy we will have inflation

![Thermo Scientific LH-4000...Maximum RCF-Value at nmax 5346 5346 Radius max. / min. [ cm ] 24.7 / 8.8 24.7 / 8.8 Acceleration / Braking Time [ s ] 85 / 85 85 / 85 Sample Heating at](https://static.fdocuments.in/doc/165x107/5fc56d04280123077b037702/thermo-scientific-lh-4000-maximum-rcf-value-at-nmax-5346-5346-radius-max-.jpg)