go.roguecc.edu · Web view5.1 The Shape of a Logarithmic Equation I’ve got rhythm Although we...
11
5.1 The Shape of a Logarithmic Equation Although we used logarithms in chapter 4 to solve the exponential equation for “x”, we really didn’t look at logarithmic functions. Linear: Quadratic: Power: I’ve got rhythm
Transcript of go.roguecc.edu · Web view5.1 The Shape of a Logarithmic Equation I’ve got rhythm Although we...
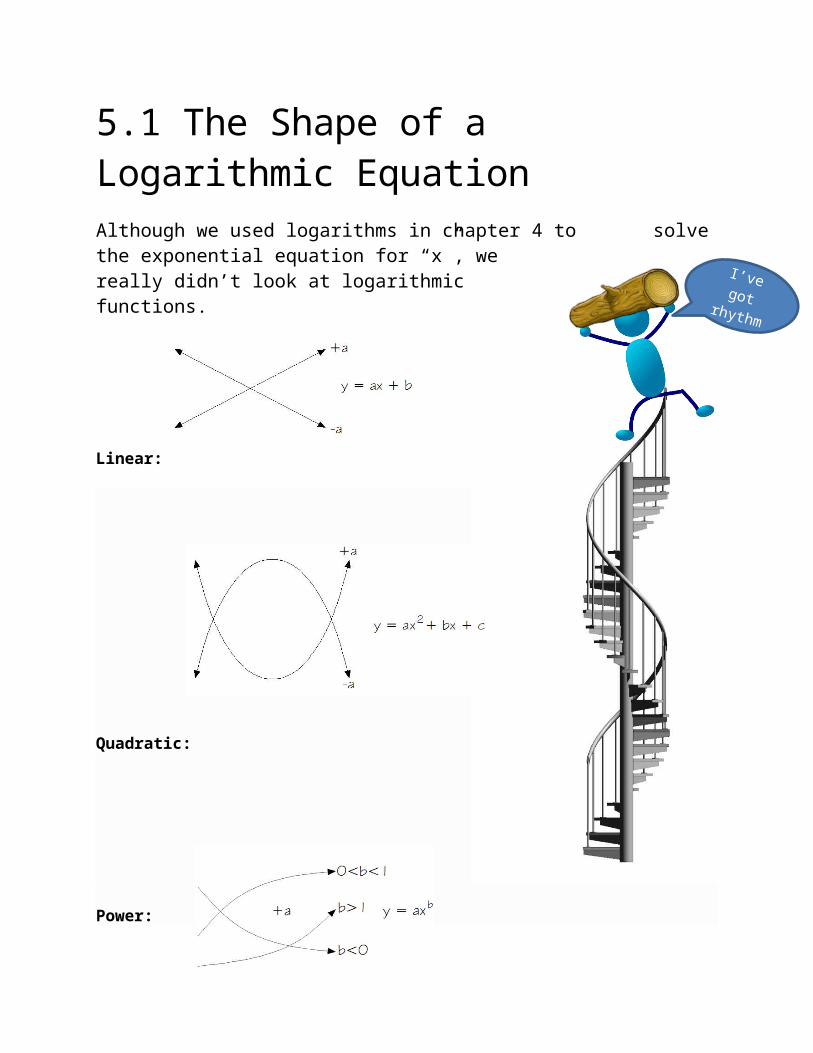
5.1 The Shape of a Logarithmic EquationAlthough we used logarithms in chapter 4 to solve the exponential equation for “x”, we really didn’t look at logarithmic functions.
Linear:
Quadratic:
Power:
Exponential:
I’ve got rhythm

Any time you see “log” used, it is understood to be of base 10 (but the 10 is never written). If you intend the base to be something other than 10, you must show it.
This symbol means “is equivalent to”
We did not need to know this before, but logarithms are generically base 10. If
you enter into your calculator it returns approximately 1.954. This is
because of the hidden base 10. is understood to be .
Remember:
answers the question “10 to what power is 90 (10x = 90).”
Since 102 = 100, it makes sense the calculator gives a result just below 2.
From your Text: a generic logarithmic equation and its graph:
Example 5.1.1: Graphing a Logarithmic EquationFind some ordered pairs for the equation y = 4 + 2logx, then graph the ordered pairs and include a trendline.
Solution: You are free to pick any positive value for “x” in the logarithmic equation; negative numbers do not work since there is no power you can raise 10 to that will result in a negative number. A partial list of ordered pairs is shown in the table.
y = 4 + 2logx
Note: Notice that logarithmic graphs increase quickly at first then level off over time while the exponential graphs of chapter 4 increased slowly
at first then dramatically over time. Logarithmic equations do a better job
x y1 4.02 4.64 5.26 5.6
10 6.014 6.3

of modeling things that level off in their growth like alligators, trees or populations with limited resources (i.e. fish in a pond).
Example 5.1.2: Graphing Logarithmic DataGraph the data and make a prediction for the divorce rate in 2030 for white females over the age of 15.
Solution: The graph shows a trend that levels off over time just like the shape of the graph we saw in example 5.1.1.
A good estimate for the divorce rate would be just under 13%, based on the trend.
Note: Notice the rate of change (slope) can be seen to be declining even before graphing.

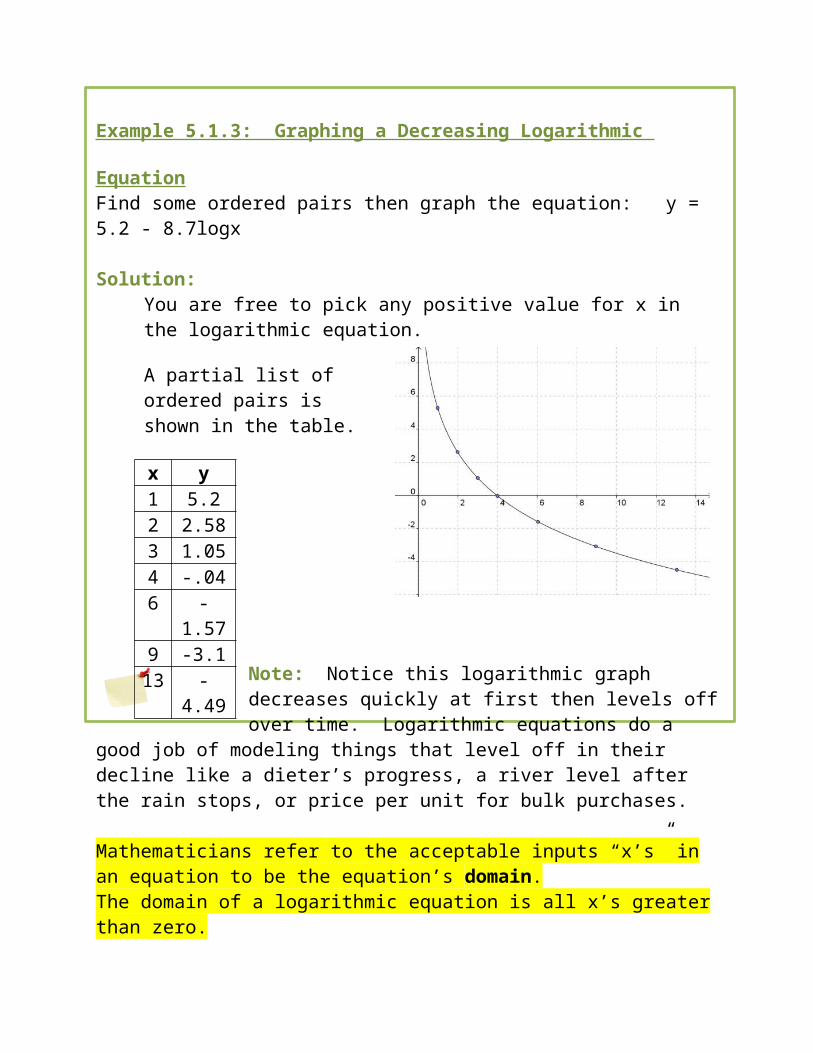
Example 5.1.3: Graphing a Decreasing Logarithmic EquationFind some ordered pairs then graph the equation: y = 5.2 - 8.7logx
Solution: You are free to pick any positive value for x in the logarithmic equation. A partial list of ordered pairs is shown in the table.
Note: Notice this logarithmic graph decreases quickly at first then levels off over time. Logarithmic equations do a good job of modeling things
that level off in their decline like a dieter’s progress, a river level after the rain stops, or price per unit for bulk purchases.
Mathematicians refer to the acceptable inputs “x’s” in an equation to be the equation’s domain.The domain of a logarithmic equation is all x’s greater than zero.
Homework: 2, 3, 5 You must use excel for your graphs. Be careful with the trend lines. The rest of the work can be done by hand. Try to make viewing your work easier for me by putting the hand work on the same sheet of paper as the graph.
x y1 5.22 2.583 1.054 -.046 -1.579 -3.1
13 -4.49

Sample Problem 5.1.1
Stores commonly offer a cheaper unit price for large quantity purchases.
a) Make a graph of the data large enough to include a quantity of 30 (use graph paper, label completely, and choose the correct axis for the independent(x) and dependent(y) variables).
b) Find the slope between quantities 1 and 2. Explain the meaning of the slope in context.
c) Find the slope between quantities 5 and 10. Explain the meaning of the slope in context.d) Add a trend line to the graph.e) Estimate the unit price for a quantity of 30.f) Estimate the quantity for a unit price of $44.
Solutions:
a,d) b)
c)
e) Answers will vary. $31
f) Answers will vary.16
Sample Problem 5.1.4
The Illinois River flow in cubic feet/second (CFS) is shown in the month of May as the rainy season ends and the level starts dropping.
a) Make a graph of the data large enough to include 1000 CFS and May 22nd (use graph paper, label completely, and choose the correct axis for the independent(x) and dependent(y) variables).
b) Find the slope between May 8th and 12th. Explain the meaning of the slope in context.
c) Find the slope between May 14th and 16th. Explain the meaning of the slope in context.
d) Add a trend line to the graph.e) Estimate the flow on May 22nd.f) Estimate the date the flow was 1000 CFS.
Solutions:
a,d) b)
c) d) Answers will vary.120 CFS
e) Answers will vary.4.75, meaning late in the day on May 4