GO HyperScale: Mind-blowing Performance Starting at $128/Desktop
35
GO HyperScale: Mind Blowing Performance Starting at $128/Desktop June 2015
-
Upload
patrick-brennan -
Category
Software
-
view
29 -
download
0
Transcript of GO HyperScale: Mind-blowing Performance Starting at $128/Desktop

GO HyperScale:Mind Blowing Performance Starting at $128/Desktop
June 2015

2
Patrick Brennan, Atlantis ComputingSr. Product Marketing Manager – Applications & Platforms
Dane Young, Entisys SolutionsCitrix Technology Professional (CTP), VMware vExpert, and Virtualization Practice Manager
Dennis Geerlings, Login VSISupport Engineer Manager

Agenda
• Solving VDI Challenges with HyperScale• HyperScale VDI Architecture Overview• LoginVSI • Reference Architecture Findings• Wrap-up and Q&A
4
Solving VDI Challenges with
HyperScale

© Atlantis Computing Confidential & Proprietary
PC vs. VDI: Price and Performance
CAPEX $600-$1000 USD CAPEX $1600 USD*
80-150 IOPS/user < 80 IOPS/user IOPS/user
(* Gartner Estimate)
Traditional PC
CPU ~$200
RAM ~$80
Storage~$60
CPU ~$23
RAM ~$26-80
SAN Storage ~$1000
© Atlantis Computing Confidential & Proprietary

© Atlantis Computing Confidential & Proprietary
Traditional Storage: Too Costly for VDI
Storage 495 59%
Microsoft VDA 100 12%
Broker/Hyper-visor 150 18%
Server/Network 100 12%
Source: Atlantis Computing Cost Calculator
COST PER VDI COMPONENT (Persistent)
$845 / Desktop!
© Atlantis Computing Confidential & Proprietary
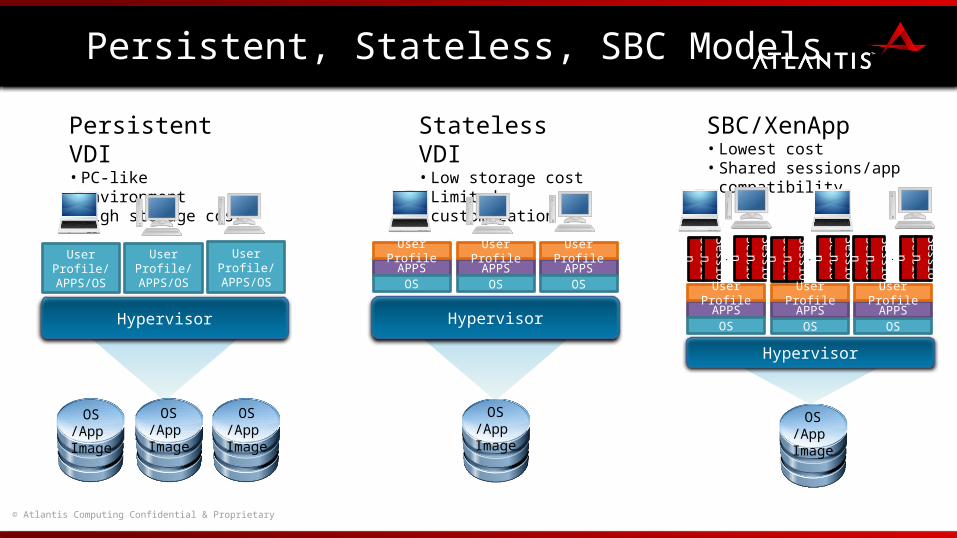
Persistent, Stateless, SBC Models
Hypervisor
Stateless VDI• Low storage cost• Limited customization
Persistent VDI• PC-like environment• High storage cost
SBC/XenApp• Lowest cost• Shared sessions/app compatibility
SessionSession
. . .
SessionSession
SessionSession
. . .
SessionSession
SessionSession
. . .
SessionSession
Hypervisor
User Profile/
APPS/OS
Hypervisor
OS /App Image
OS /App Image
OS /App Image
OS /App Image
OS /App Image
APPSOS
User ProfileUser Profile/
APPS/OS
User Profile/
APPS/OSAPPS
OS
User ProfileAPPS
OS
User Profile
APPSOS
User ProfileAPPS
OS
User ProfileAPPS
OS
User Profile

8
Go HyperScale: Simplify
Simplify Your Datacenter
Atlantis HyperScale

9
Atlantis HyperScale
All-Flash Performance
Databases: More transactions Virtualization: Faster VMs VDI: Better user experience
50-70% Lower Cost
52% lower cost than hybrid hyper-converged
74% lower cost than traditional storage + compute
Modular Scalability
Scale-out linearly Scale-out performance and
capacity with every appliance
Extreme Simplicity
Usable storage in less than 60 minutes
One number to call for all support
10
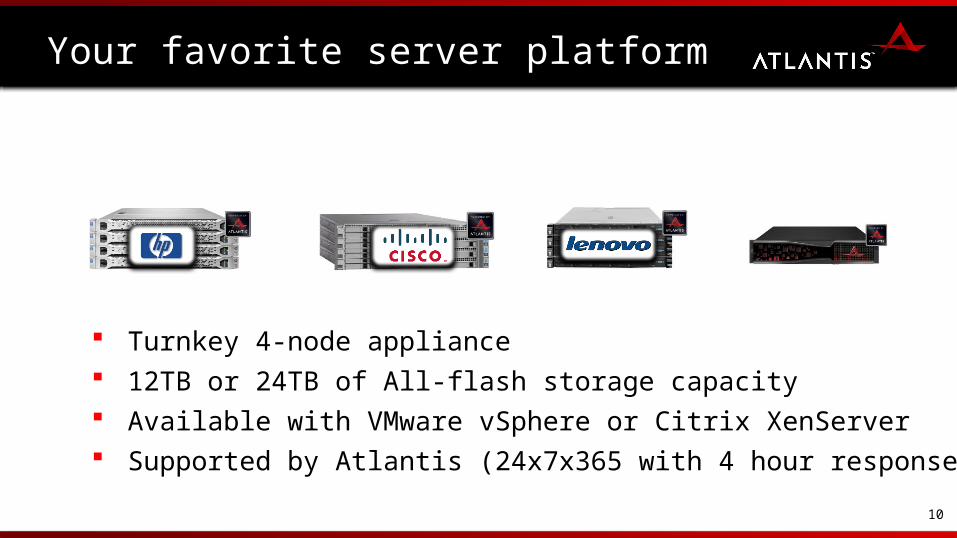
Your favorite server platform
Turnkey 4-node appliance 12TB or 24TB of All-flash storage capacity Available with VMware vSphere or Citrix XenServer Supported by Atlantis (24x7x365 with 4 hour response)
11
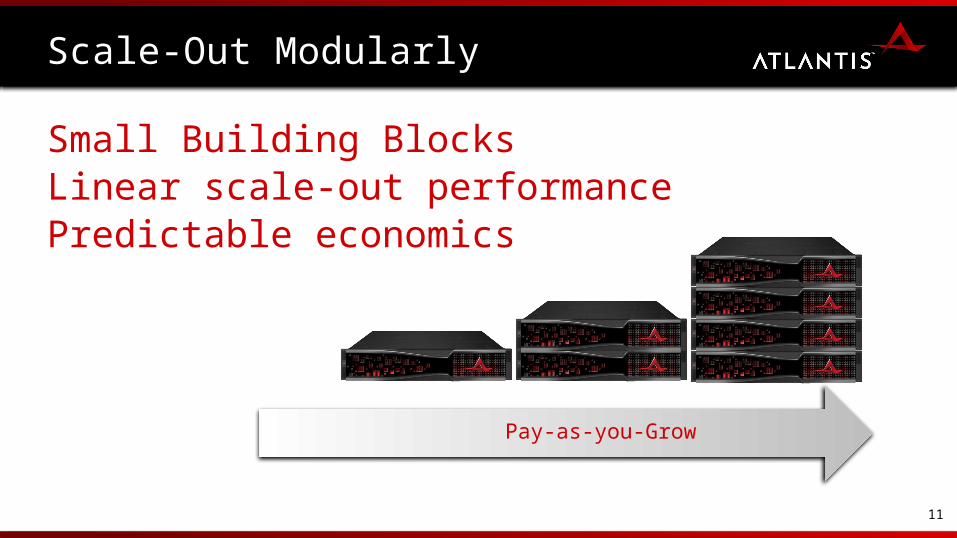
Scale-Out Modularly
Small Building BlocksLinear scale-out performancePredictable economics
Pay-as-you-Grow

12
Simple Management

© Atlantis Computing Confidential & Proprietary
Lowest Cost for VDI
SAN + Servers Atlantis HyperScale
Cost Per Stateless Desktop $525 $128 (up to 75% less)
Cost Per Persistent Desktop $595 $225 (up to 63% less)
• Costs include compute, storage and Atlantis licensing where applicable. • Density based on a Knowledge Worker profile as defined by LoginVSI
14
HyperScale VDI Architecture Overview
15
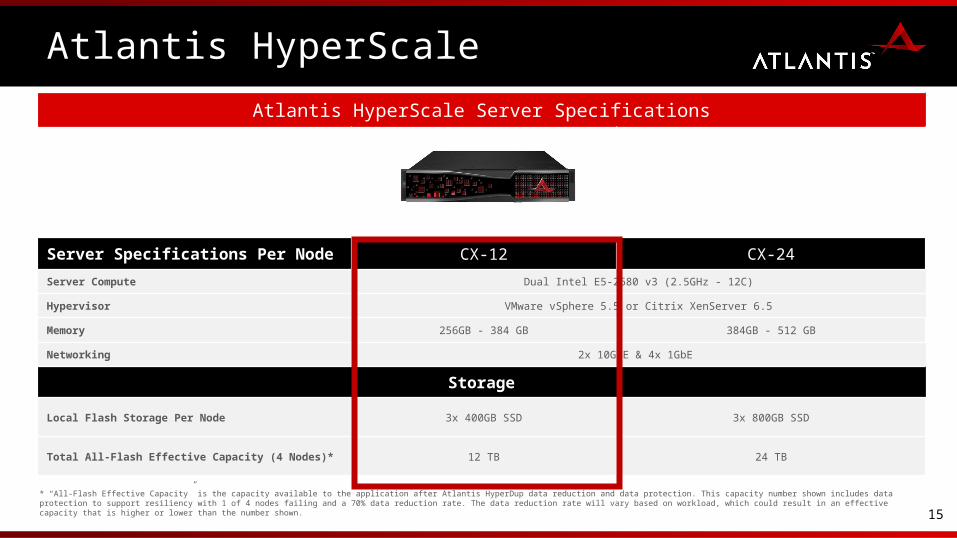
Atlantis HyperScale
Area for Image
Atlantis HyperScale Server Specifications
Server Specifications Per Node CX-12 CX-24
Server Compute Dual Intel E5-2680 v3 (2.5GHz - 12C)
Hypervisor VMware vSphere 5.5 or Citrix XenServer 6.5
Memory 256GB - 384 GB 384GB - 512 GB
Networking 2x 10GbE & 4x 1GbE
Storage
Local Flash Storage Per Node 3x 400GB SSD 3x 800GB SSD
Total All-Flash Effective Capacity (4 Nodes)* 12 TB 24 TB
* “All-Flash Effective Capacity” is the capacity available to the application after Atlantis HyperDup data reduction and data protection. This capacity number shown includes data protection to support resiliency with 1 of 4 nodes failing and a 70% data reduction rate. The data reduction rate will vary based on workload, which could result in an effective capacity that is higher or lower than the number shown.
16
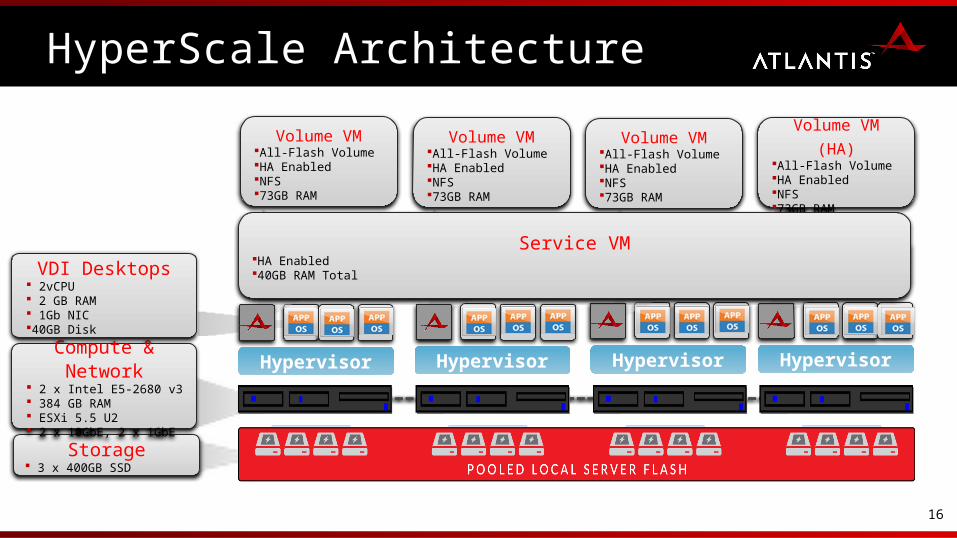
HyperScale Architecture
HypervisorHypervisorHypervisor
Storage 3 x 400GB SSD
Compute & Network
2 x Intel E5-2680 v3 384 GB RAM ESXi 5.5 U2 2 x 10GbE, 2 x 1GbE
Hypervisor
Volume VMAll-Flash VolumeHA EnabledNFS 73GB RAM
Volume VMAll-Flash VolumeHA EnabledNFS 73GB RAM
Volume VM (HA)All-Flash VolumeHA EnabledNFS 73GB RAM
Volume VMAll-Flash VolumeHA EnabledNFS 73GB RAM
Service VMHA Enabled40GB RAM TotalVDI Desktops
2vCPU 2 GB RAM 1Gb NIC40GB Disk

Environment Details
Soft ware Components
C o m p o n e n t D e s c r i p ti o n
VDI Broker and Client Citrix XenDesktop 7.6 & StoreFront 2.6
Hypervisor & vCenter VMware ESXi 5.5 U2
Atlantis HyperScale Atlantis USX 2.2
Benchmarking/Load Gen. Login VSI 4.1.3
VDI VM Confi gurati on
C o m p o n e n t Q u a n ti t y D e s c r i p ti o n
Operating System X Windows 7 SP1 – 64-bit
vCPU 2 2 virtual sockets, 1 core per socket
Networking 1 1GB – Management Network
RAM 2GB
Disk 40GB VM disk stored on the Atlantis HyperScale Volumes
NO OPTIMIZATIONS PERFORMED!

Testing Methodology
• Scalability Test• Determine overall HyperScale VDI “real world” scalability
• HA Test• Observe behavior in the event of a node failover and evaluate
performance
• Iometer• Evaluate IOPS
• PassMark• Compare against other SSDs, etc.
19
LoginVSI

LoginVSI
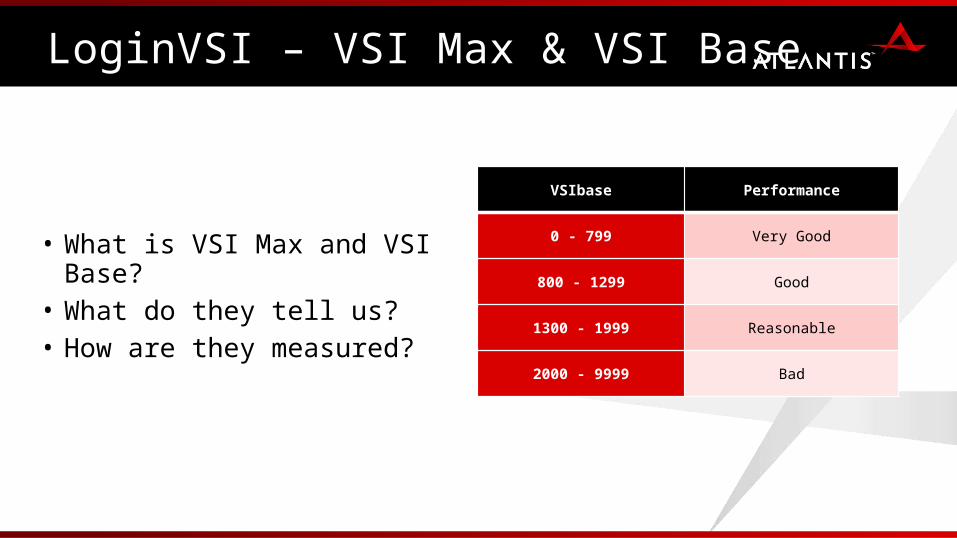
LoginVSI – VSI Max & VSI Base
• What is VSI Max and VSI Base?
• What do they tell us?• How are they measured?
VSIbase Performance
0 - 799 Very Good
800 - 1299 Good
1300 - 1999 Reasonable
2000 - 9999 Bad
22
Reference Architecture Findings
23
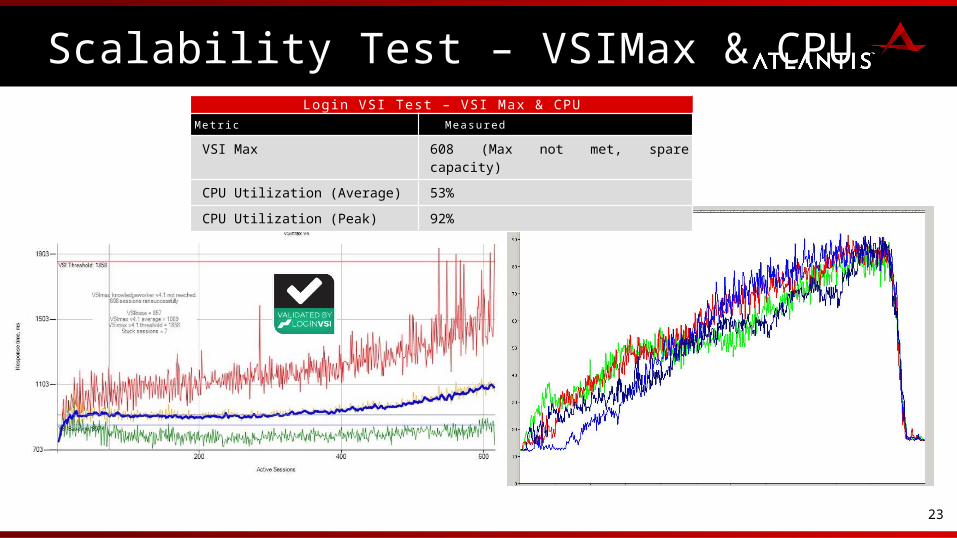
Scalability Test – VSIMax & CPULogin VSI Test – VSI Max & CPU
M e t r i c M e a s u re d
VSI Max 608 (Max not met, spare capacity)
CPU Utilization (Average) 53%
CPU Utilization (Peak) 92%
24
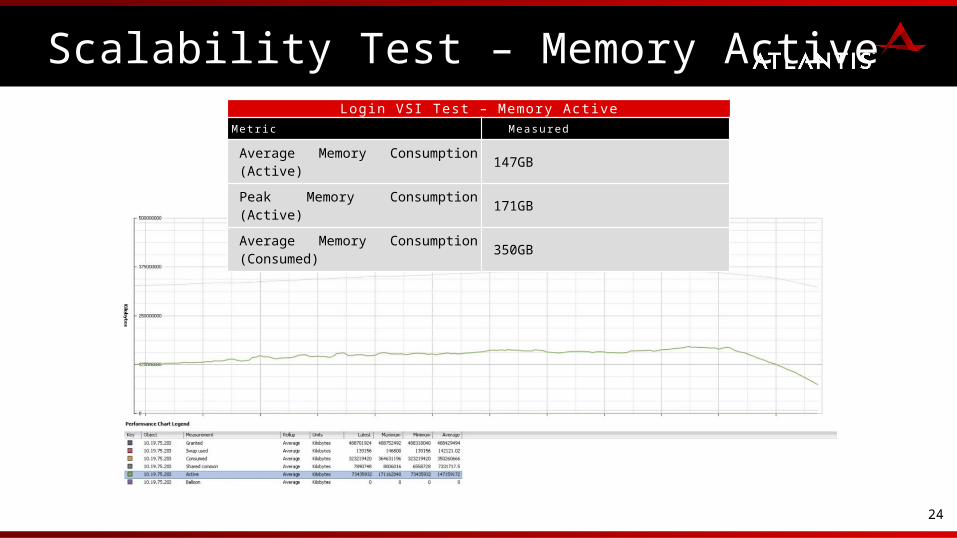
Scalability Test – Memory ActiveLogin VSI Test – Memory Acti ve
M e t r i c M e a s u re d
Average Memory Consumption (Active) 147GB
Peak Memory Consumption (Active) 171GB
Average Memory Consumption (Consumed) 350GB
25
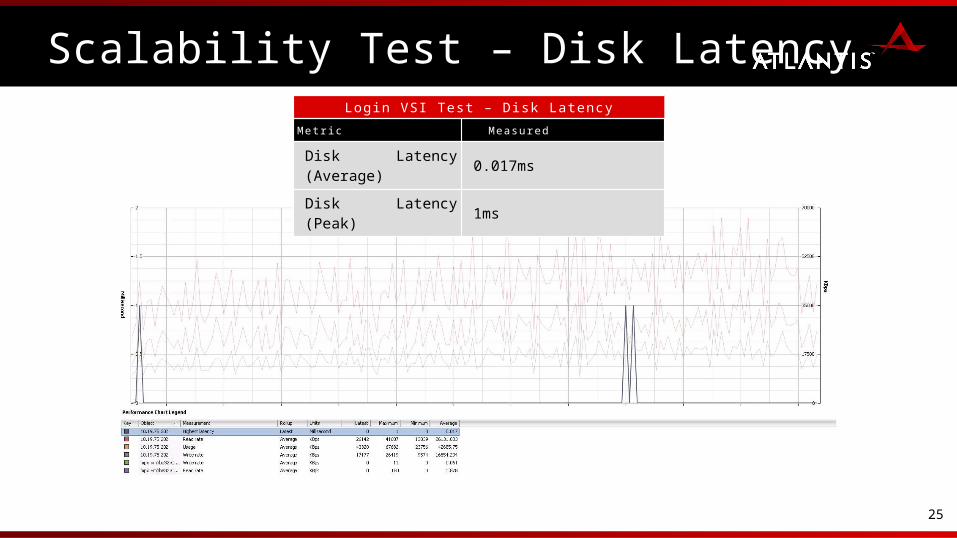
Scalability Test – Disk LatencyLogin VSI Test – Disk Latency
M e t r i c M e a s u re d
Disk Latency (Average) 0.017ms
Disk Latency (Peak) 1ms

26© Atlantis Computing Confidential & Proprietary
HA Test – VSIMax & CPULogin VSI HA Test –CPU
M e t r i c M e a s u re d
Login VSI Max 490 (Max not met, spare capacity)
CPU Utilization (Average) 52%
CPU Utilization (Peak) 98%

27© Atlantis Computing Confidential & Proprietary
HA Test - MemoryLogin VSI HA Test - Memory
M e t r i c M e a s u re d
Max Memory Consumption (Active) 187GB
Average Memory Consumption (Active) 108GB

28© Atlantis Computing Confidential & Proprietary
HA Test – Disk LatencyLogin VSI HA Test – Disk Latency
M e t r i c M e a s u re d
Average Disk Latency 0.218ms
Peak Disk Latency 9ms

29
IometerIometer
M e t r i c M e a s u re d
Volume IOPS (80% Write, 80% Random) 57,238.52
Total IOPS (80% Write, 80% Random) 171,715.56

30
PassMark BenchmarkPassMark Benchmark Test
M e t r i c M e a s u re d
PassMark Disk Score 5227

31
Results Summary
Phase 2 Test Results
Te st Re s u l t s
Iometer 171,715Passmark Disk Score 5,227Deduplication Rate 99% Physical Storage Consumed for 600 VMs 238GB
Phase 1 Test Results (Per Node Average)
Te st V S I M axC P U
U ti l i zati o n
A c ti v e
M e m o r yD i s k L at e n c y
Login VSI - Login Test 600* 53% 147GB 0.017msLogin VSI - HA Test 500* 52% 108GB 0.218ms
*Additional capacity available for a higher VSI Max score
GO HyperScale!
• Why HyperScale? Cost: Starting at $128 desktop Simplicity: Easy to deploy Performance: Blazing IOPS, faster than SSD! Scalable: Modular, simple, and easy to
manage!• For more info & RA visit: http://
www.atlantiscomputing.com/hyperscale
• Contact our strategic partners like Entisys for more details!

33
Poll

34
Q&A