GLYDER: Global Cyclone Detection and Tracking Using ... · GLYDER: Global Cyclone Detection and...
106
GLYDER: Global Cyclone Detection and Tracking Using Multiple Remote Satellite Data Ashit Talukder (JPL) – [email protected] Timothy Liu, Andrew Bingham, Shen-Shyang Ho, Wendy Tang, Eric Rigor, Anand Panangadan NASA ESTC-2008 Sponsor: NASA AISR Program
Transcript of GLYDER: Global Cyclone Detection and Tracking Using ... · GLYDER: Global Cyclone Detection and...

GLYDER: Global Cyclone Detection
and Tracking Using Multiple Remote
Satellite Data
Ashit Talukder (JPL) – [email protected]
Timothy Liu, Andrew Bingham, Shen-Shyang Ho, Wendy
Tang, Eric Rigor, Anand Panangadan
NASA ESTC-2008
Sponsor: NASA AISR Program

2
GLYDER Primary Science Motivation
• Earth’s climate system exhibits intrinsicvariability
• Tropical & extra-tropical cyclones importantcomponents of Earth climate system
– Key manifestations of oceanic air-sea interaction
– Contribute to regional heat exchanges, whichaffects ocean & atmosphere dynamics
– Complex pattern in the variability in number &intensity of global cyclone events.
• Some regions (sub tropical northeast Pacific)experiencing increase in cyclonic frequency over last several decades
• Moderate-strong tropical cyclones have decreased in number & intensity since the 1980s(attributed to more frequent occurrences of El Niño)
• Intergovernmental Panel on Climate Change (IPCC) has clearly identifiedthe need to quantify the variability in global cyclones and in particularcharacterize changes in cyclone tracks
• GLYDER will provide better understanding for reasons behind and effectsof global climatic variations via autonomous cyclone detection and tracking

3
GLYDER Primary Science Objectives
• Products to better characterize global cyclone variability
• Tools that empower JPL/NASA climate scientists tostudy & quantify the spatiotemporal variability ofcyclones & their tracks
– High resolution detection and tracking of cyclones
– Enable studies and modeling of cyclogenesis– Long-term evolution of cyclones on a truly global basis
• Integrate observations from multiple remote sensorsrobustly, automatically for numerous earth scienceneeds
– Extend to other maritime and terrestrial eventdetection/tracking
• NASA’s data providers to tag metadata withinformation pertaining to cyclones and enablecontent-based searching
– Automatically feed information to current NASA projects ,including GHRSST (GODAE High Resolution Sea SurfaceTemperature), Earth Science Datacasting and PO-DAAC

4
GLYDER Customers and End Users
• Ocean/Climate Researchers – needGLYDER to mine the vast data setsand extract cyclone information
• Ocean & weather data providerswill use the technology toautomatically generate dataproducts and enable content-basedsearching
• Ocean/Climate Researchers andOcean/weather data providers willuse GLYDER for visualization ofglobal cyclone tracks
• Application/operational scientistscould potentially use the technologyfor real-time detection and tracking
– Longer term end-user after proven off-line operation
GLYDER
Data Mining
Products
Visualization
Products
Near Real-time
Products
Ocean/climate
Researchers
Climate Models
Metadata content
Ocean/climate Res.
Weather data provider
Global Cyclone tracks
Operational Scientists
Mission operations /
Support
QuikSCAT TRMM MODIS/SST…..

5
Current State of Art
• Estimates of cyclone variability currently derivedfrom analyses of surface level pressure (SLP)fields
– Model output fields from NCEP/NCAR ReanalysisProject based on in-situ inputs
– Analyses assimilate observational and in-situ data intoa physical model to produce atmospheric fields
– Data span more than 50 years
– Measured every 6 hours on a 2.5˚ 2.5˚ (~275 km)global grid
– Accuracy of analyses is severely limited over theoceans,
– Lack of assimilated pressure and radiosondeobservations
– Mean cyclone size varies from 120 – 440 km [Liu99]
• Resolve up to a maximum of only 50% of theglobal cyclones.
– Satellite remote sensing provides globalcoverage and greater spatial resolution,potentially allowing detection of most/all globalcyclones
Map of daily pressure observations
used by ECMWF Reanalysis forecast
(6-29-02). Under sampling in the
worlds oceans especially in the
Southern Hemisphere is evident, as
shown in circles. Boxes indicate regions
of interest for GLYDER

6
Remote Sensors for Cyclone Detection
• Individually remote sensing datasets
have limited detection ability
– Poor temporal or spatial resolution
– Loss of data due to environmental effects.
• GOES – visible cloud formation
• AVHRR – cloud-free surface
temperature or top of the atmosphere
temperature
• QuikSCAT – surface
wind speed & direction
• AMSR-E surface
temperature
• MODIS-36 spectral
bands
Figure 1: GOES visible (top) and QuikScat wind speed (lower) sequences collected over the
North Pacific on 4-6 Jan, 2003. The visible images show the location and extent of two
cyclones and the wind image provides intensity information.
Sensor Parameter Spatial
Resolution
Temporal freq. Availability
GOES Reflectance (visible).
Brightness temp. (IR)
6 km ? hr 1979 - present
AVHRR Reflectance (visible).
Brightness Temp. (IR)
4 km 6 hr (2 satellites) 1985 - present
QuikScat Wind speed and direction 25 km 12 hrs 1999 - present
SSMI Brightness Temp, wind
speed
25 km 12 hrs 1987 - present
AMSR-E Brightness Temp, wind
speed
25 km 12 hrs 1987 - present
GLYDER
(GOAL)
FUSED (multimodal) 10 km 3 hrs 1987 - present
Table 1: Satellite sensor system, the parameters they measure and resolution, and GLYDER
goals for multisensor co-registration and fusion
6 - 12.5 Km 3 – 6 Hrs

7
GLYDER Primary Challenges
• Data extraction for training and validation is non-trivial
– Multiple datasets generated by different data providers
– Different data formats and file naming conventions
– Large data volumes
– Initial efforts to extract relevant data from multiple sensors for training andperformance verification manually intensive and laborious
• Fusion of multiple sensors non-trivial
– Knowledge and Transfer Learning between sensors
– Knowledge sharing between disparate sensors at different spatial and temporalresolutions
• Cyclone detection with high detection rate, low false alarm rate atreasonable spatial and temporal resolutions
• Cyclone tracking from multiple sensors

8
• MODIS (Pixel Level Product - Level 2) cloud products of interest
– Cloud Optical Properties: E.g. Thickness. (Image 1)
– Cloud Top Properties: E.g Temperature. (Image 2)
– Cirrus Reflectance (Image 3)
• MODIS atmospheric water vapor (Image 4)
– Amount derived from measurements of near-IR solar radiation reflected by
the land or the cloud surface, and over extended oceanic areas with Sun glint.
• QuikScat - Level 2B (Image 5)
– Wind Speed
– Wind Direction
QUIKSCAT Vs. MODIS for Cyclone Classification
Image 1 Image 3 Image 4 Image 5Image 2
Hurricane Dean 2007

9
QUIKSCAT and MODIS features Ranking

10
Single Sensor Cyclone Detection: QUIKSCAT
• QUIKSCAT: SeaWinds instrument on the QuikScat Satellite
– microwave radar measuring near-surface wind speed and direction under all
weather and cloud conditions over Earth oceans
• Swath Grid: 12.5km and 25km resolution
• Extract descriptive features from QuikSCAT regions

1111
Feature (Histogram)
1. Wind Speed Histogram (WS)
2. Wind Direction Histogram (WD)
3. Direction to Speed Ratio (DSR) Histogram with DSR at location (i,j) as
),(
),(),(
jiWS
jiWDjiDSR =

1212
Feature (DOWD)
Let u(i,j) and v(i,j) be the u-v components of the wind direction WD(i,j) at location(i,j) with 1 i m and 1 j n. One constructs a (m n)-by-2 matrices M of the form
Let and be the eigenvalues of matrix M such that
The eigenvalue ratio (Relative Strength of the Dominant Wind Direction(DOWD)) of a bounding box B of dimension m by n is
1
2=B
ER
1 2 21<
Eig-Ratio: 4.5204 Eig-Ratio: 3.5606 Eig-Ratio: 1.0402Eig-Ratio: 1.7160

1313
Feature (RWV)
The relative wind vorticity (RWV) at location (i,j) is
where u and v are the two wind vector components in the west-east and south-north directions, and d is the spatial distance between two adjacent QuikSCATmeasurements in a uniformly gridded data.

14
Support Vector Machine Classifier: Overview

1515
Cyclone Segmentation and Classification: QUIKSCAT
Is ROI > Y x Y degrees.?
(e.g. Y = 192 Km, 2o)
Input QUIKSCAT
Image
Yes No
Discard ROIConstruct bounding
box(es) around ROI(s)
Select Region(s) of Interest
(ROI) using a threshold (T=
12 m/s) on the wind speed
Compute 1) DOWD and 2) RWV
and construct 3) wind speed,
4) direction and 5) ratio
histograms for each box
5 independent ClassifiersClassification basedon majority vote

1616
Result 1
Cyclone
Detection
Algorithm
SVM
Ensemble
[HT08]
RWV DOWD CIS
[HT08]
TPR 0.9167
(77)
0.8810
(74)
0.8690
(73)
0.8452
(71)
0.7262
(61)
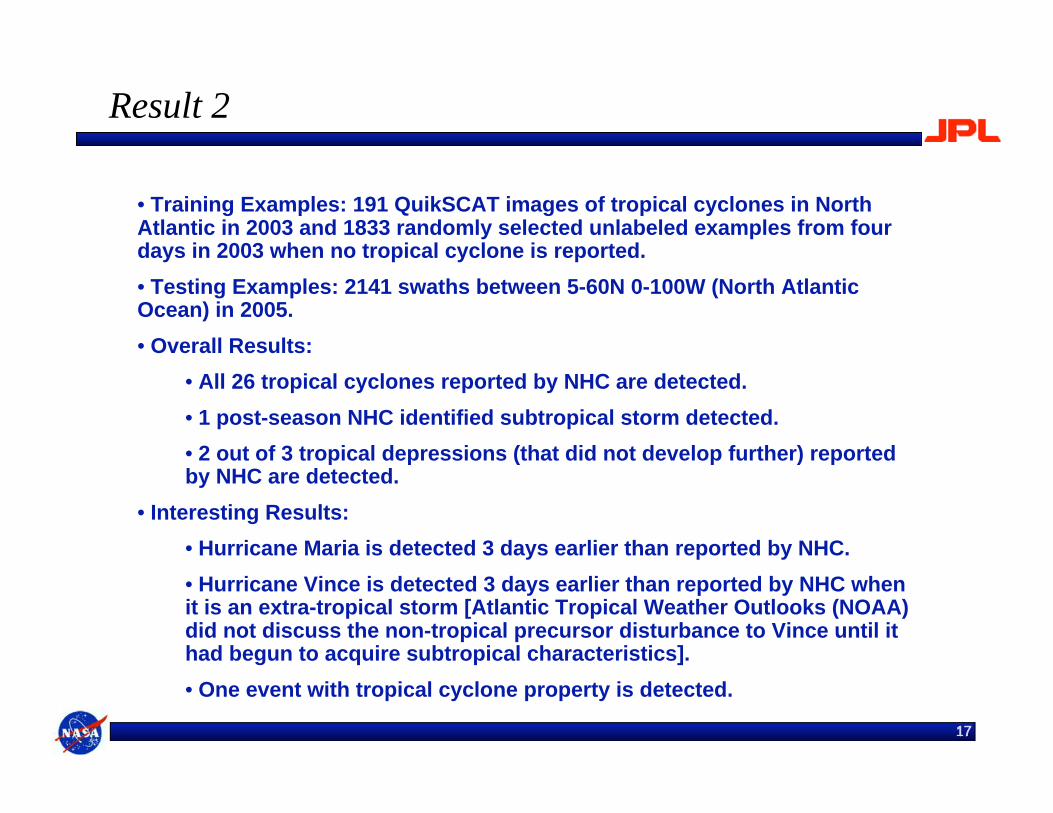
• Training Examples: 191 QuikSCAT images of tropical cyclones in NorthAtlantic in 2003 and 1833 randomly selected unlabeled examples from fourdays in 2003 when no tropical cyclone is reported.
• Testing Examples: 84 QuikSCAT images of tropical cyclones in NorthAtlantic in 2006.
1717
Result 2
• Training Examples: 191 QuikSCAT images of tropical cyclones in NorthAtlantic in 2003 and 1833 randomly selected unlabeled examples from fourdays in 2003 when no tropical cyclone is reported.
• Testing Examples: 2141 swaths between 5-60N 0-100W (North AtlanticOcean) in 2005.
• Overall Results:
• All 26 tropical cyclones reported by NHC are detected.
• 1 post-season NHC identified subtropical storm detected.
• 2 out of 3 tropical depressions (that did not develop further) reportedby NHC are detected.
• Interesting Results:
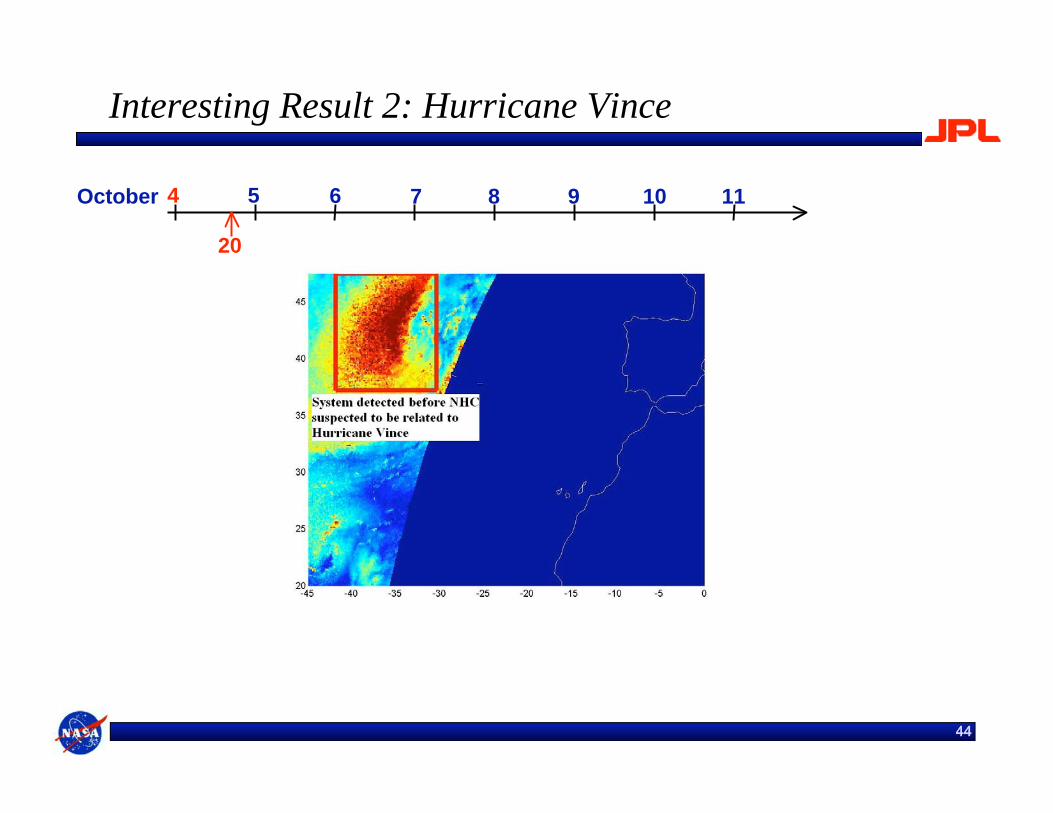
• Hurricane Maria is detected 3 days earlier than reported by NHC.
• Hurricane Vince is detected 3 days earlier than reported by NHC whenit is an extra-tropical storm [Atlantic Tropical Weather Outlooks (NOAA)did not discuss the non-tropical precursor disturbance to Vince until ithad begun to acquire subtropical characteristics].
• One event with tropical cyclone property is detected.

1818
Interesting Result 1: Hurricane Maria 2005
September 6 2005

1919
Interesting Result 1: Hurricane Maria
30 31 2 3 4 5 6 7 8August
7
29 1September
9 10

2020
Interesting Result 1: Hurricane Maria
30 31 2 3 4 5 6 7 8August
29 1September
9 10
19

2121
Interesting Result 1: Hurricane Maria
8
August30 31 2 3 4 5 6 7 829 1
September9 10

2222
Interesting Result 1: Hurricane Maria
20
August30 31 2 3 4 5 6 7 829 1
September9 10

2323
Interesting Result 1: Hurricane Maria
7
August30 31 2 3 4 5 6 7 829 1
September9 10

24
Definition
mesoscale convective system—(Abbreviated MCS.) A
cloud system that occurs in connection with an
ensemble of thunderstorms and produces a contiguous
precipitation area on the order of 100 km or more in
horizontal scale in at least one direction. An MCS
exhibits deep, moist convective overturning contiguous
with or embedded within a mesoscale vertical
circulation that is at least partially driven by the
convective overturning.

2525
Interesting Result 1: Hurricane Maria
9
August30 31 2 3 4 5 6 7 829 1
September9 10

2626
Interesting Result 1: Hurricane Maria
20
August30 31 2 3 4 5 6 7 829 1
September9 10

2727
Interesting Result 1: Hurricane Maria
8
August30 31 2 3 4 5 6 7 829 1
September9 10

2828
Interesting Result 1: Hurricane Maria
20
August30 31 2 3 4 5 6 7 829 1
September9 10

2929
Interesting Result 1: Hurricane Maria
21
August30 31 2 3 4 5 6 7 829 1
September9 10

3030
Interesting Result 1: Hurricane Maria
9
August30 31 2 3 4 5 6 7 829 1
September9 10

3131
Interesting Result 1: Hurricane Maria
21
August30 31 2 3 4 5 6 7 829 1
September9 10

3232
Interesting Result 1: Hurricane Maria
9
August30 31 2 3 4 5 6 7 829 1
September9 10

3333
Interesting Result 1: Hurricane Maria
20
August30 31 2 3 4 5 6 7 829 1
September9 10

3434
Interesting Result 1: Hurricane Maria
8
August30 31 2 3 4 5 6 7 829 1
September9 10

3535
Interesting Result 1: Hurricane Maria
20
August30 31 2 3 4 5 6 7 829 1
September9 10

3636
Interesting Result 1: Hurricane Maria
8
August30 31 2 3 4 5 6 7 829 1
September9 10

3737
Interesting Result 1: Hurricane Maria
19
August30 31 2 3 4 5 6 7 829 1
September9 10

3838
Interesting Result 1: Hurricane Maria
21
August30 31 2 3 4 5 6 7 829 1
September9 10

3939
Interesting Result 1: Hurricane Maria
7
August30 31 2 3 4 5 6 7 829 1
September9 10

4040
Interesting Result 1: Hurricane Maria
21
August30 31 2 3 4 5 6 7 829 1
September9 10

4141
Interesting Result 1: Hurricane Maria
7
August30 31 2 3 4 5 6 7 829 1
September9 10

4242
Interesting Result 1: Hurricane Maria
20
August30 31 2 3 4 5 6 7 829 1
September9 10
4343
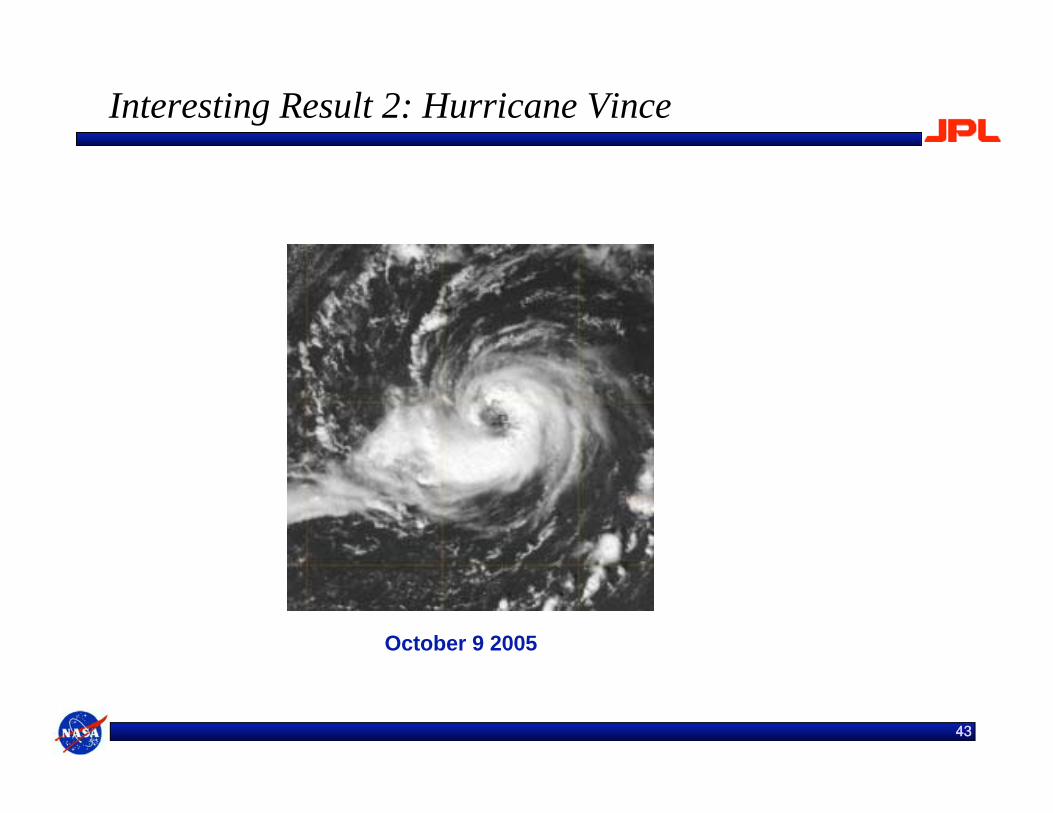
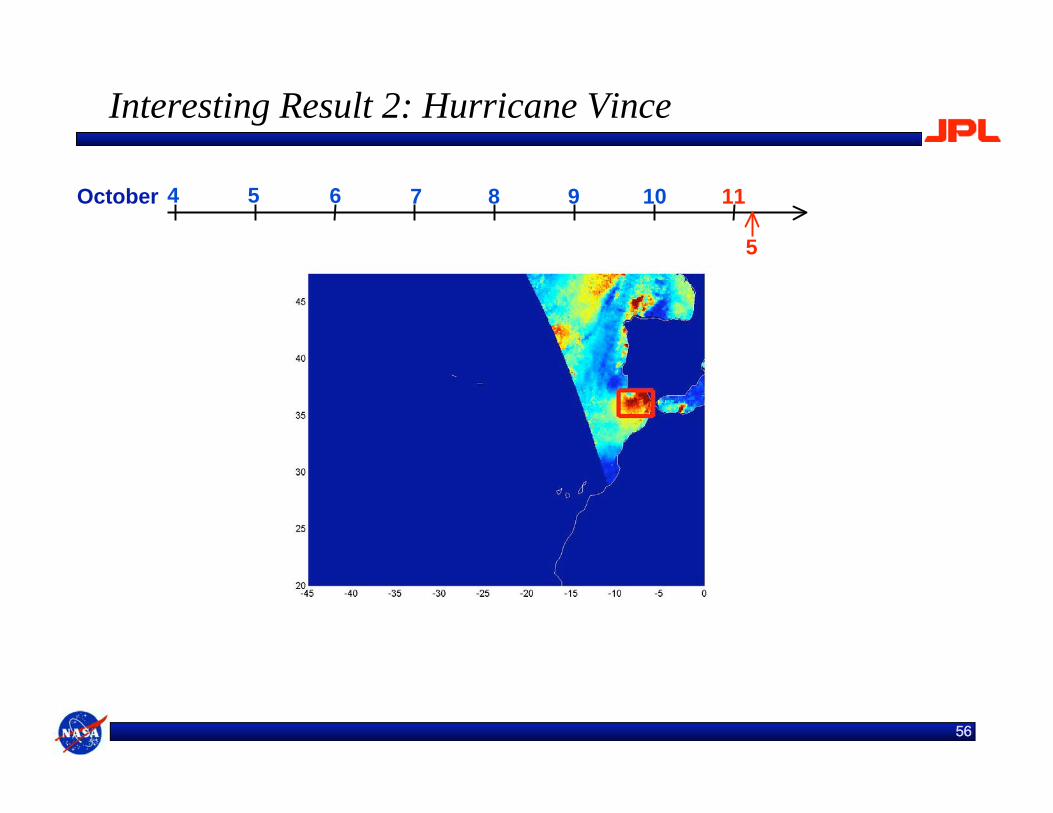
Interesting Result 2: Hurricane Vince
October 9 2005
4444
Interesting Result 2: Hurricane Vince
4 5 6 7 8 9 10 11October
20

4545
Interesting Result 2: Hurricane Vince
4 5 6 7 8 9 10 11October
20

4646
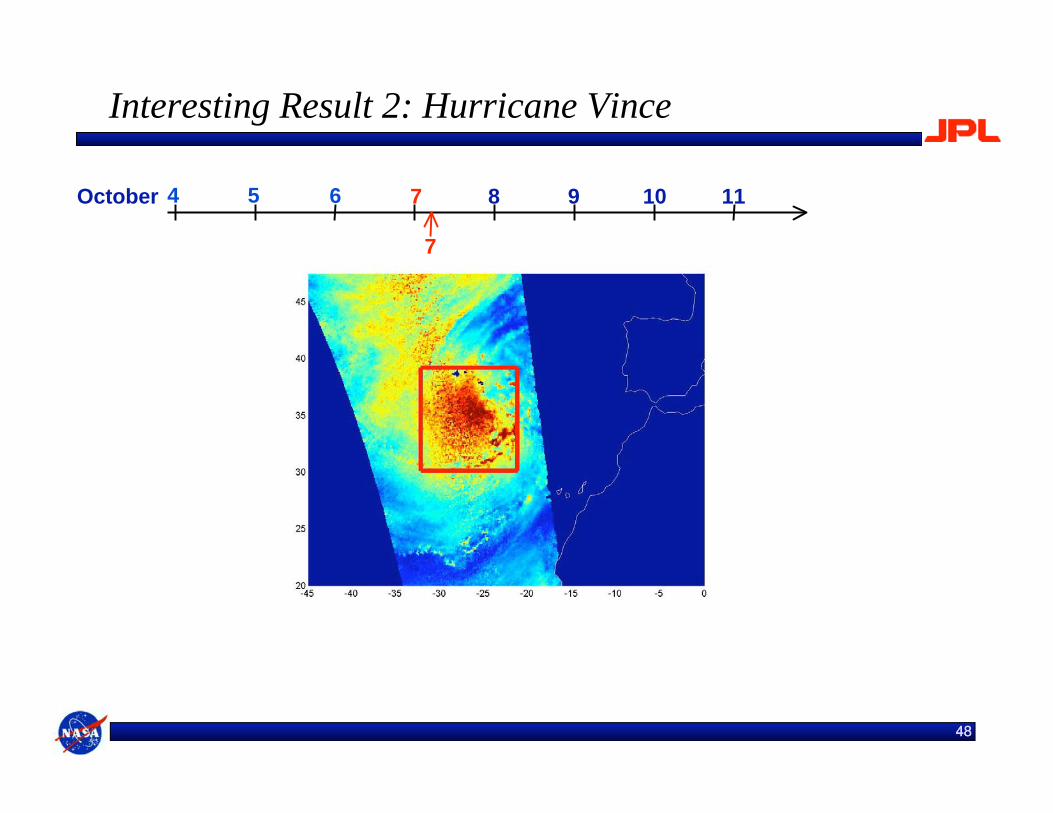
Interesting Result 2: Hurricane Vince
4 5 6 7 8 9 10 11October
7

4747
Interesting Result 2: Hurricane Vince
4 5 6 7 8 9 10 11October
19
4848
Interesting Result 2: Hurricane Vince
4 5 6 7 8 9 10 11October
7

4949
Interesting Result 2: Hurricane Vince
4 5 6 7 8 9 10 11October
19

5050
Interesting Result 2: Hurricane Vince
4 5 6 7 8 9 10 11October
6

5151
Interesting Result 2: Hurricane Vince
4 5 6 7 8 9 10 11October
18

5252
Interesting Result 2: Hurricane Vince
4 5 6 7 8 9 10 11October
6

5353
Interesting Result 2: Hurricane Vince
4 5 6 7 8 9 10 11October
18

5454
Interesting Result 2: Hurricane Vince
4 5 6 7 8 9 10 11October
6

5555
Interesting Result 2: Hurricane Vince
4 5 6 7 8 9 10 11October
17
5656
Interesting Result 2: Hurricane Vince
4 5 6 7 8 9 10 11October
5

5757
Multi-Satellite
Cyclone Detection and Tracking
using QuikSCAT wind
and TRMM precipitation data

5858
QuikSCAT: Issues and Challenges
• Non-continuous Region Monitoring
– Orbiting satellite can only measure a particular region at some time instance
per day
– Misses may occur for some region of interest.
White regionbetween any twoside-by-side swathsis a regionQuikSCAT fails tomeasure.
Ascending passes (http://manati.orbit.nesdis.noaa.gov/quikscat)

5959
QuikSCAT: Issues and Challenges
• Event Occlusion
– Orbiting satellite can only measure a particular region at some time instance
per day
– Misses may occur for some region of interest.
(A) (B) (C) (D)
Hurricane Dean 2007 in Image (B),(C) and (D) are occluded.

606060
TRMM Measurement Assimilation with QUIKSCAT
• Level 3B42 TRMM data product
– Global Precipitation estimates from combination of instruments: PR, TMI, SSMI,AMSR, AMSU.
– 0.25 deg x 0.25 deg per pixel
– Every 3 hours
– Measurement range [0, 100] mm/hr.
• Why Useful for Cyclone Detection?
– Rainfall always associated with cyclone.
– Improved (finer) temporal resolution in cyclone tracking
From http://trmm.gsfc.nasa.gov/ (3 hourly global rainfall)

61
TRMM (Precipitation)QuikSCAT (Wind)
QuikSCATDetector DetectorPredictor Tracker
Knowledge Sharing
TRMM (3B42RT)
Detector Detector TrackerDetector PredictorDetector Detector TrackerDetector TrackerPredictorPredictorDetector Predictor Detector TrackerPredictor DetectorPredictor TrackerDetector TrackerPredictor DetectorPredictor TrackerDetector TrackerPredictor DetectorPredictor TrackerDetector TrackerPredictorPredictor DetectorDetector TrackerTrackerPredictor DetectorPredictor TrackerDetector Tracker

62
Knowledge Sharing Novelties
62
• Addresses challenges of miningheterogeneous data from multipleorbiting satellites
• Knowledge sharing betweenheterogeneous sensor measurements
• for sensor measurement lacking adefinitive indicator for cyclones
• with different spatial and temporalresolutions.

6363
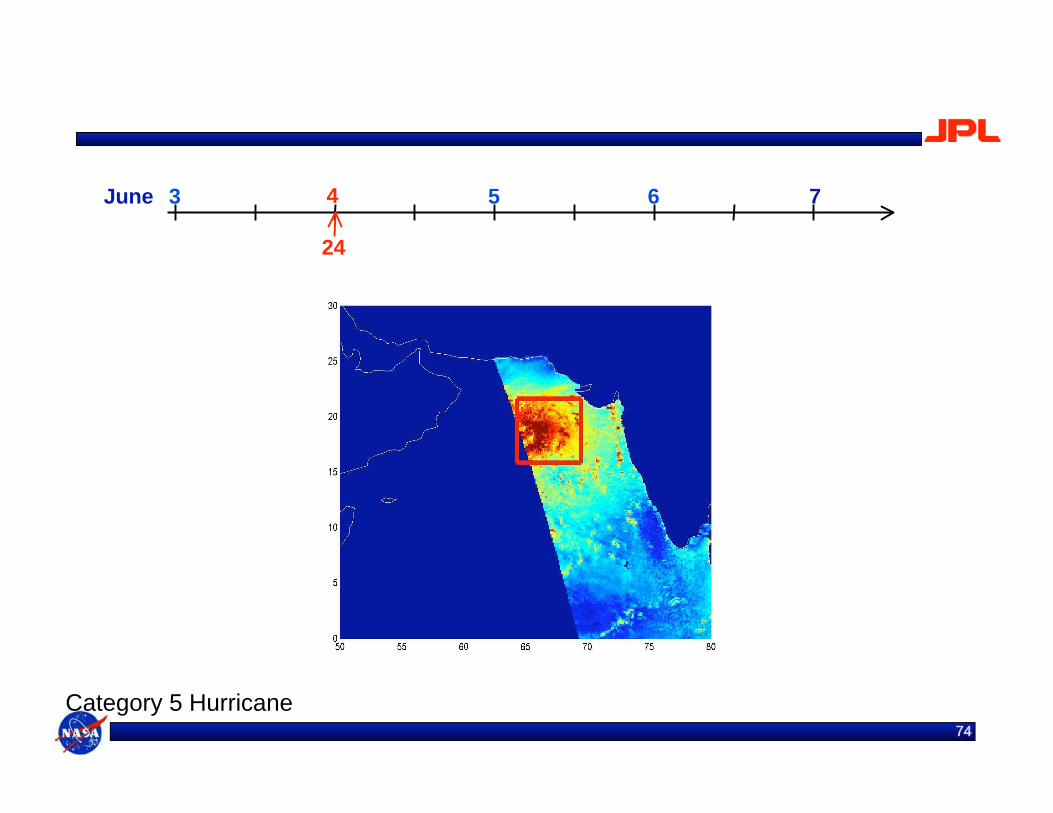
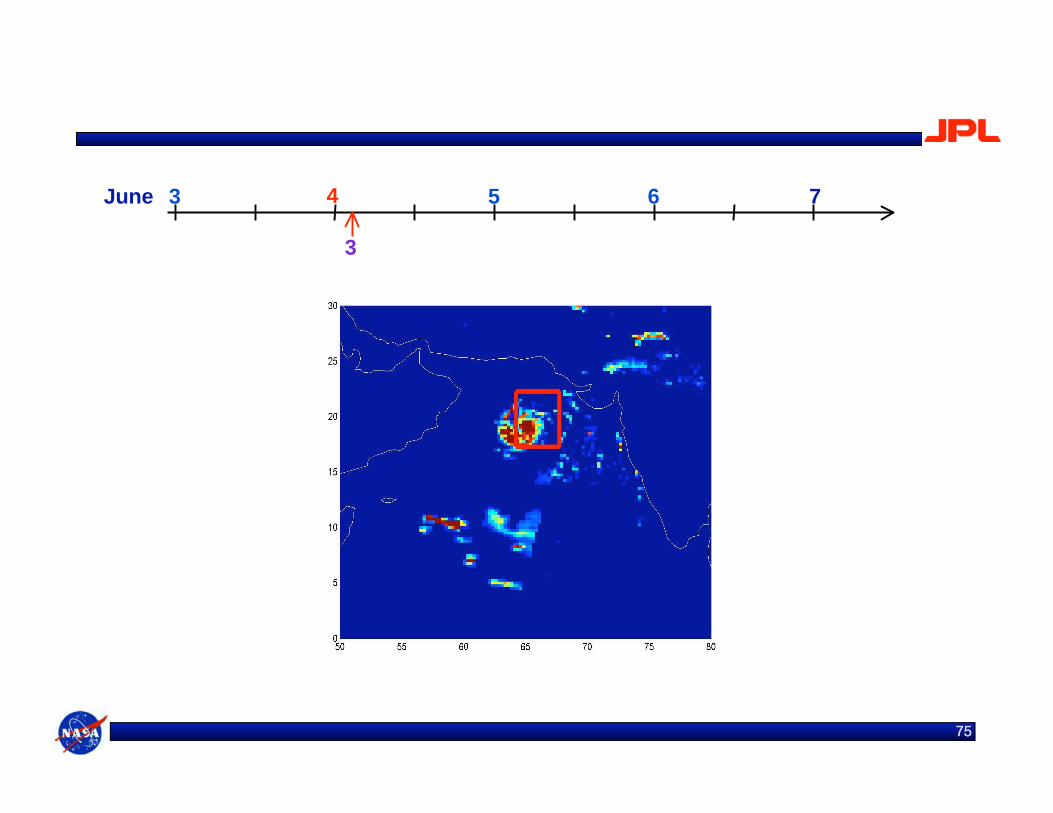
Results from knowledge sharing of TRMM+QuikSCAT
Demo for
Hurricane Gonu
in
Arabian Sea in 2007
63

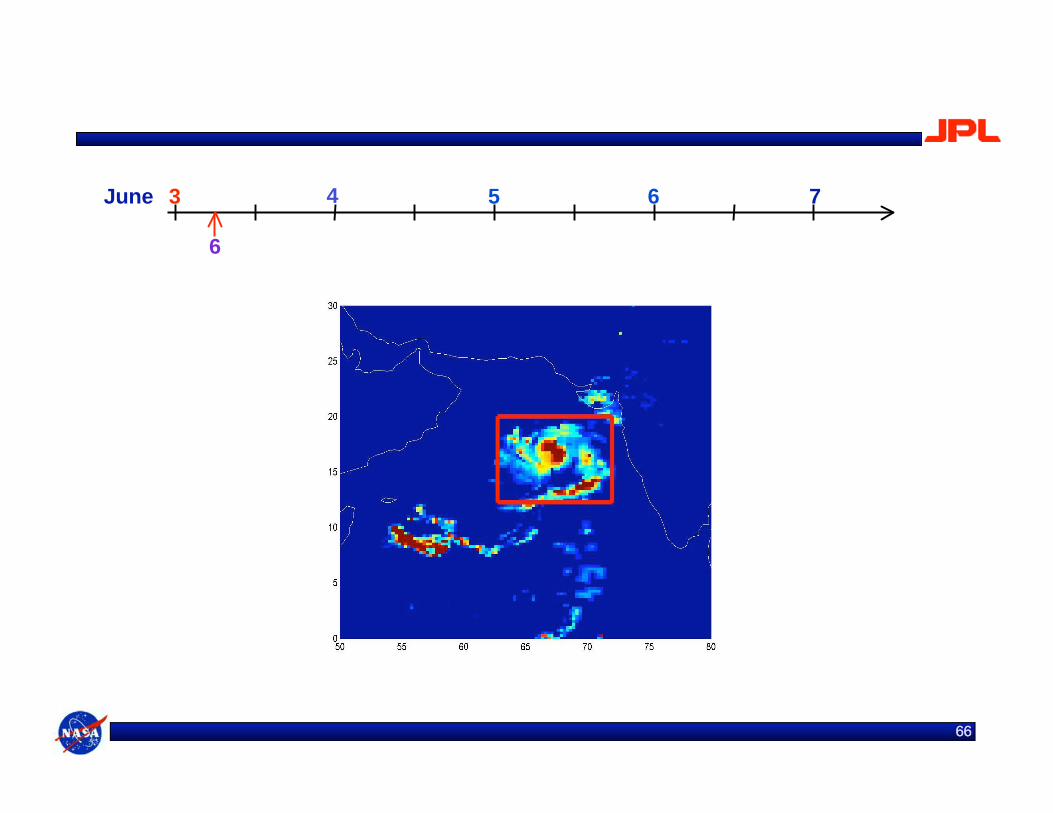
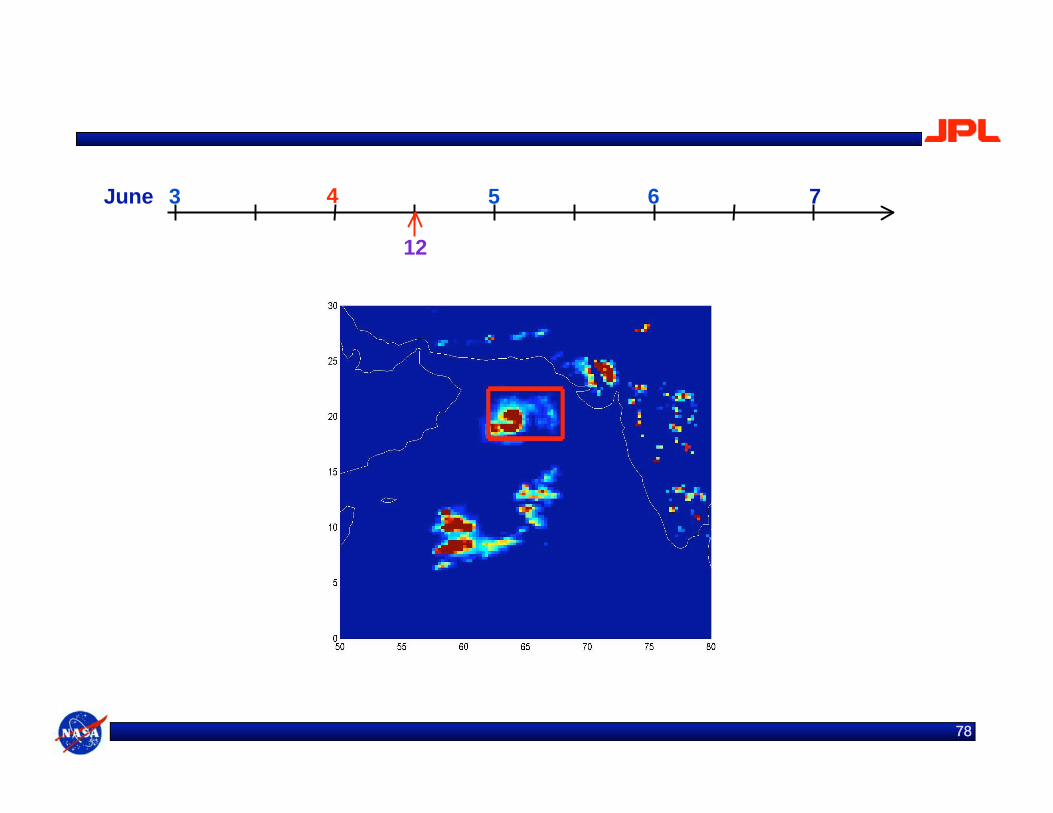
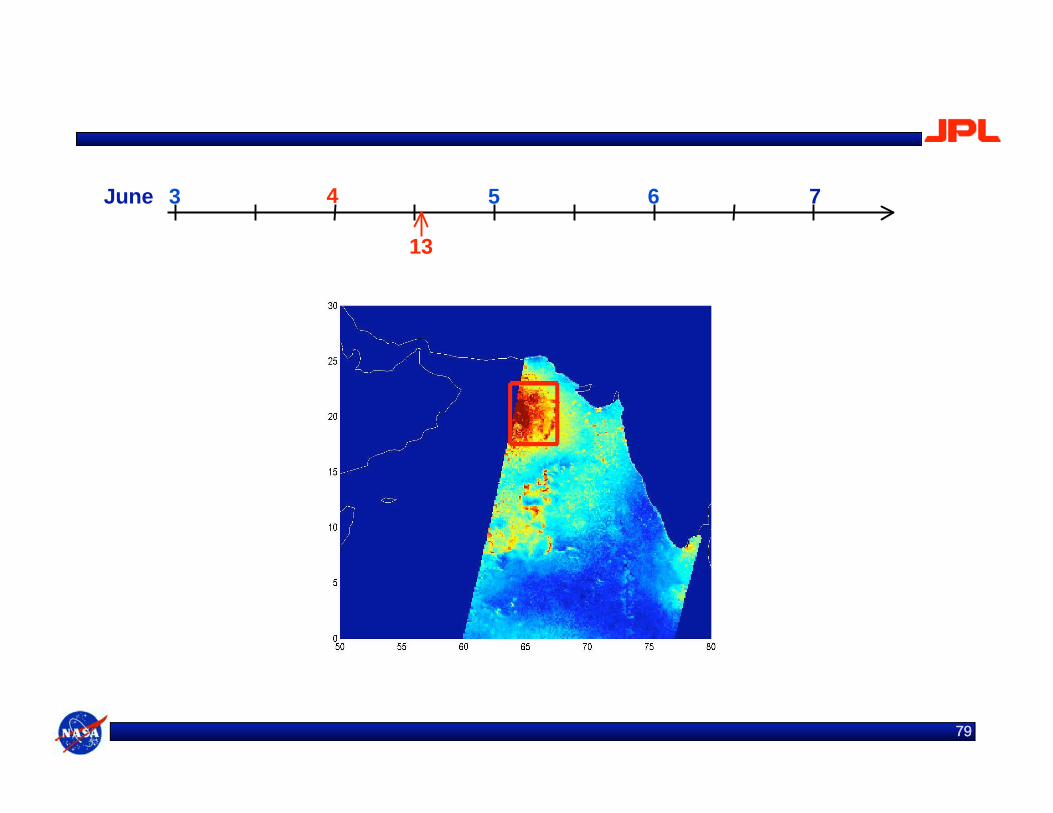
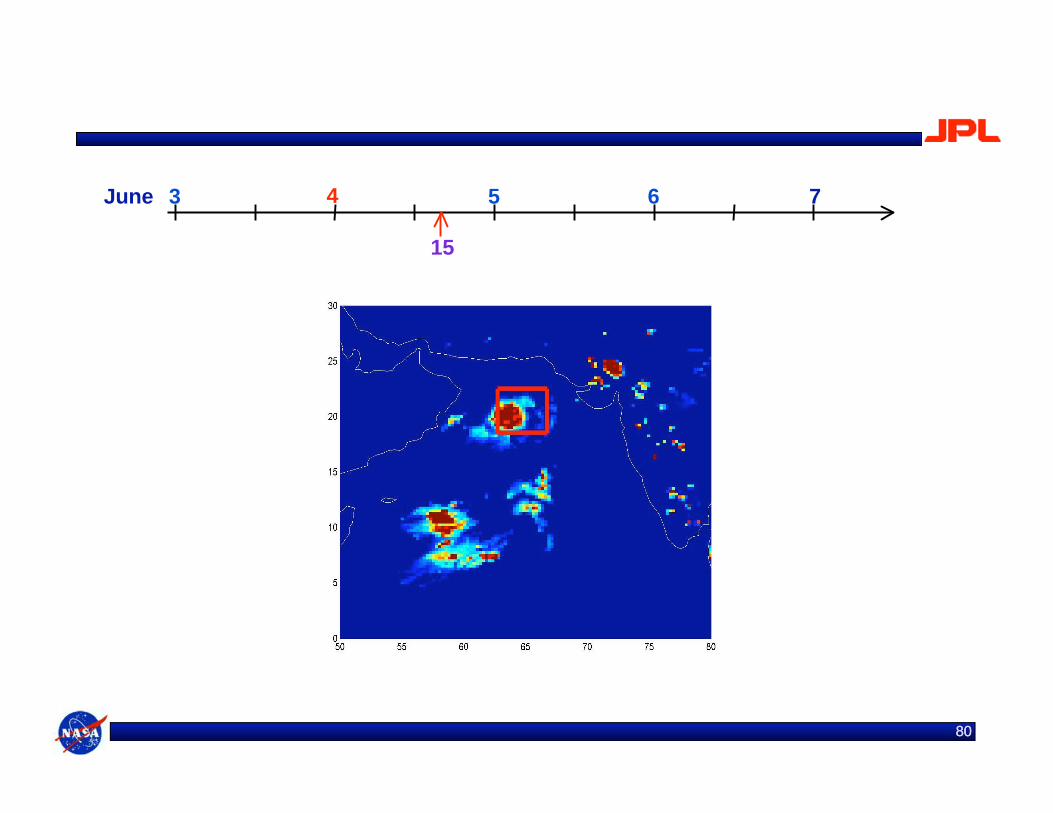
6464
Category 1 Hurricane Black Bounding Box: Area classified as a non-cyclone area
3 4 5 6 7June
1

6565
3 4 5 6 7June
3
6666
3 4 5 6 7June
6

6767
3 4 5 6 7June
9

6868
3 4 5 6 7June
12

6969
3 4 5 6 7June
13

7070
3 4 5 6 7June
15

7171
3 4 5 6 7June
18

7272
3 4 5 6 7June
21

7373
3 4 5 6 7June
24
7474
Category 5 Hurricane
3 4 5 6 7June
24
7575
3 4 5 6 7June
3

7676
3 4 5 6 7June
6

7777
3 4 5 6 7June
9
7878
3 4 5 6 7June
12
7979
3 4 5 6 7June
13
8080
3 4 5 6 7June
15

8181
3 4 5 6 7June
18

8282
3 4 5 6 7June
21

8383
3 4 5 6 7June
24

8484
3 4 5 6 7June
2

8585
3 4 5 6 7June
3

8686
3 4 5 6 7June
6

8787
3 4 5 6 7June
9

8888
3 4 5 6 7June
12

8989
3 4 5 6 7June
14

9090
3 4 5 6 7June
15

9191
3 4 5 6 7June
18

9292
3 4 5 6 7June
21

9393
3 4 5 6 7June
24

9494
3 4 5 6 7June
1

9595
3 4 5 6 7June
3

9696
3 4 5 6 7June
6

9797
3 4 5 6 7June
9

9898
3 4 5 6 7June
12

9999
3 4 5 6 7June
14

100100
3 4 5 6 7June
15

101101
3 4 5 6 7June
18

102102
3 4 5 6 7June
21

103
• Generally agreed requirements for cyclones to born and develop in tropics is:
• Over warm water (SST>26o C through an ocean depth of 60m or more) with sufficient ocean heat content to
sustain hurricane’s circulation through latent heat release;
• Far enough from the Equator (~ > 4o latitude ) with a significant Coriolis effect so that the influence of the
Earth’s rotation be strong enough to initiate a cyclonic circulation;
• Weak verticle wind shear (over the depth of troposphere is less than 10-15 m/s);
• Preexisting cyclonic relative vorticity in the lower troposphere (e.g. easterly waves, the monsoon trough)
Although tropical disturbances or mesoscale convective systems (MCS) occur frequently over tropical
oceans, only a small percentage evolve into full-blown hurricanes. The mechanisms that either inhibit or
favor development are still poorly understood
GLYDER For Tropical Cyclogenesis Studies: Case Study

104104
Significant Results and Events
• Perl and Shell script automation of satellite data acquisition from remote servers
• Earlier data extraction involved manually intensive process
• Validation of single sensor cyclone detection algorithm on full year (2005)
• Overall Results:
• All 26 tropical cyclones reported by NHC are detected.
• 1 post-season NHC identified subtropical storm detected.
• 2 out of 3 tropical depressions (that did not develop further) reported by NHC are detected.
• 2 tropical cyclones detected 3 days before NHC reports

105
Ongoing and Future Work
105
• Testing our implementation over longer time scale in a region that have multiple
cyclone occurrences
• Assimilate information from other measurements (e.g. AVHRR, GOES)
• Statistical tracker for “reverse storm tracking” (cyclogenesis)
– Yields multiple possible evolution paths of pre-storms and MCS when tracks are “weaker”
• Include TRMM 2B25 swath data to construct a vertical profile of reflectivity for
cyclone detection
• Include TRMM 3B40RT gridded data with an hourly temporal resolution to
improve quality and accuracy of cyclone tracking
• Explore “transfer learning” for cyclone detection
• Active learning for improved classifier design
• Integration with near real-time data streams
• Possible dissemination to wider science community
– Beta-Test toolkit for cyclogenesis and early evolution of cyclones

106
Additional References
For additional reading, please refer to:
• Publications –
– IEEE Aerospace Conference 2008 conference
– Knowledge and Data Mining Conference 2008 – Industrial Track
– AAAI Transfer Learning Workshop
• Contact:
– Ashit Talukder, PhD
Jet Propulsion Laboratory, MS 300-123
Pasadena, CA 91109
Ph: 818 354 1000
Email: [email protected]