GLYCOL NUCLEIC ACIDS AS DUPLEX SCAFFOLD FOR THE DESIGN OF SELF
252
GLYCOL NUCLEIC ACIDS AS DUPLEX SCAFFOLD FOR THE DESIGN OF SELF-ASSEMBLED AND SELF-ORGANIZED ARCHITECTURES A DISSERTATION in Chemistry Presented to the Faculties of Philipps-Universität Marburg in Partial Fulfillment of the Requirements for the Degree of Doctor of Science (Dr. rer. nat.) Hui Zhou Hunan, P. R. China Marburg/Lahn 2011
Transcript of GLYCOL NUCLEIC ACIDS AS DUPLEX SCAFFOLD FOR THE DESIGN OF SELF

GLYCOL NUCLEIC ACIDS AS DUPLEX
SCAFFOLD FOR THE DESIGN OF
SELF-ASSEMBLED AND SELF-ORGANIZED
ARCHITECTURES
A DISSERTATION
in
Chemistry
Presented to the Faculties of Philipps-Universität Marburg in Partial Fulfillment
of the Requirements for the Degree of Doctor of Science
(Dr. rer. nat.)
Hui Zhou
Hunan, P. R. China
Marburg/Lahn 2011

ii
Department of Chemistry of Philipps-Universität Marburg, accepted as a
dissertation on
Supervisor: Prof. Dr. Lilu Zhang
Second reviser: Prof. Dr. Eric Meggers
Date of submission: 07.11.2011
Date of defense: 06.12.2011

iii
Dedicated to my family for their unwavering love
and support

iv
Acknowledgments
These past four years in Marburg have been such an incredible experience for me.
I have many fond memories of department of chemistry of Philipps-Universität
Marburg, and it has been a pleasure to work with so many enthusiastic, bright people
during my graduated career. I would like to take this opportunity to express my
sincere gratitude to those who have helped me along the way.
First and forest, I would like to thank my research advisor, Prof. Dr. Lilu Zhang,
for her enthusiastic support and guidance. Without those, I would not have a thesis to
present. She has been a terrific mentor whom I admire greatly for her brilliant
creativity, passion of science, and generosity. Some of the things I will remember
most about working for Prof. Zhang are that she genuinely cares for her group
members. It has been a true honor to work with someone so well respected as both a
scientist and an all-around great person. I appreciated Prof. Zhang’s patience and
understanding over the past years. I wish her and her family all the best and continued
success at Philipps-Universität Marburg.
I would also like to thank Prof. Dr. Eric Meggers, the chair of chemical biology of
Philipps-Universität Marburg. Prof. Meggers maintains a passion for science that
inspires people around him. This passion and all things I learned from Prof. Meggers
are important lessons, which will no doubt be helpful in my future career. I wish him
and his family all the best and continued success at Philipps-Universität Marburg.
I wish to express my sincere appreciation to my master research advisor, Prof. Dr.
Qi Shen at Soochow University, who led me into the field of chemistry. She has been
a terrific mentor whom I admire greatly for her passion of science, generosity and
great personality. I wish her continued success in her research area and good health.
I would like to thank the facilities directors at Philipps-Universität Marburg
because they all maintained excellent facilities. Particularly, Dr. Xiulan Xie and Dr.
Uwe Linne who maintained the NMR facility and MS facility, respectively. Without

v
the hard work and dedication of these people, it would have made my research very
difficult.
In the Zhang group, it has been an honor to do my research with lab colleagues.
First and foremost, I would like to thank Yonggang Xiang for the generous offering of
perylene bismide phosphoramidate that had played a key role in my research. It is an
honor to work next to and closely with Yonggang. To be honest, I am not sure how
much I would have enjoyed Germany without Yonggang’s companionship. I wish him
all the best for his Ph.D. study in Marburg.
In the Meggers group, it has been an honor to work with the group members past
and present. First and foremost, I must thank Dr. Lei Gong for his help all the time. I
wish him and his family all the best and continued success in Xiamen. I would like to
thank Dr. Mark Schlegel for helping me to manage the DNA synthesizer and the
generous offering of the hydroxypyridone phosphoramidate at the initial time in
Marburg. I wish him all the best in his new position. Additionally, I would also like to
thank the secretary Ina Pinnschmidt and technician Katja Kräling for their willing
help. I am truly thankful to all of the group members of Meggers group, especially to
Ph.D. students Sebastian Blank, Sandra Dickmann, Stefan Mollin, Alexander Wilbur,
Zhijie Lin and Chen Fu.
During my four years in Marburg, I had the chance to get know some fantastic
people, Dong Sun, Min Zhao, Jie Hou, Yumei Lin, Zhiliang You, and Xianzhi Wang. I
thank them for bring happiness to me and I wish them all the best.
My family has always been supportive throughout my life, and I would not be
where I am today without them. My mother made many sacrifices to give my brother
and me the best opportunities possible. I cannot do or say thank you enough for all
that she has done for us. I am also thankful to my father for instilling values of a good
education and hard work. I would like to express my gratitude to my young brother,
Ming, for being an epitome of incredible generosity and support. I thank my future
in-laws for their encouragement and understanding while I finished my studies.
Finally, I would like to thank my dear Liu Feng, for filling my life with happiness.
I thank her for her love, patience, understanding and support. The past few years have

vi
been such an extraordinary adventure, and I cannot wait to start the next chapter of
our lives together.

vii
Table of Contents
Acknowledgments ...................................................................................................... iv
Table of Contents ....................................................................................................... vii
List of Schemes ............................................................................................................ x
List of Tables ................................................................................................................ x
List of Figures ............................................................................................................ xii
List of Abbreviations ............................................................................................... xxii
Chapter 1 Introduction ............................................................................................... 1
Chapter 1.1 Background ........................................................................................ 2
A. DNA termini Modifications. ...................................................................... 3
B. Nucleobase replacements. .......................................................................... 4
C. Nucleotide replacements. ........................................................................... 6
D. Natural base modifications. ........................................................................ 7
Chapter 1.2 Previous work with glycol nucleic acids (GNA) .............................. 10
Chapter 1.3 References ........................................................................................ 15
Chapter 2 Synthesis of Chromophore Glycol Nucleotides .................................... 19
Chapter 2.1 Introduction ...................................................................................... 20
Chapter 2.2 The synthesis of glycol nucleoside phosphoramidites based on the
nucleophilic ring-opening of epoxides ................................................................. 21
1. The application of Grignard reagents ........................................................ 21
2. The application of Grignard reagents containing a
metallation/transmetallation protocol ............................................................ 23
3. The application of organolithium reagents ................................................ 25
Chapter 2.3 Conclusions ...................................................................................... 29
Chapter 2.4 Experimental .................................................................................... 30
Chapter 2.5 References ........................................................................................ 62
Appendix to Chapter 2: 1H, 13C, 31P NMR spectra and IR spectra ...................... 65
Chapter 3 Pyrene Acetylide Nucleotides in GNA: Probing Duplex Formation and
viii
Sensing of Copper(II) Ions ..................................................................................... 104
Chapter 3.1 Introduction .................................................................................... 105
Chapter 3.2 Result and Discussion ..................................................................... 107
Chapter 3.2.1 Synthesis of pyrene-GNA ..................................................... 107
Chapter 3.2.2 Thermal stability ................................................................... 108
Chapter 3.2.3 CD spectroscopy .................................................................... 111
Chapter 3.2.4 Fluorescence spectroscopy .................................................... 112
Chapter 3.2.5 Design of a GNA-based copper ion sensor ........................... 114
Chapter 3.2.6 Design of a new generation GNA-based copper ion ............ 121
Chapter 3.3 Conclusions .................................................................................... 125
Chapter 3.4 Experimental .................................................................................. 126
Chapter 3.5 References ...................................................................................... 129
Chapter 4 Incorporation of Porphyrin Acetylides into Duplexes of the Simplified
Nucleic Acid GNA ................................................................................................... 131
Chapter 4.1 Introduction .................................................................................... 132
Chapter 4.2 Results and Discussion ................................................................... 134
Chapter 4.2.1 Synthesis of porphyrin-GNA ................................................ 134
Chapter 4.2.2 Thermal stability of duplex porphyrin-GNA ........................ 136
Chapter 4.2.3 Conformation of porphyrins in GNA ................................. 141
Chapter 4.3 Conclusions .................................................................................... 154
Chapter 4.4 Experimental .................................................................................. 155
Chapter 4.5 References ...................................................................................... 158
Chapter 5 GNA as a Supramolecular Scaffold for the Zipper-like Arrangement
of Perylene Bisimide and Porphyrin Units ........................................................... 161
Chapter 5.1 Introduction .................................................................................... 162
Chapter 5.2 Results and Discussion ................................................................... 163
Chapter 5.2.1 Electron donor-acceptor pair in duplex GNA ....................... 163
Chapter 5.2.2 Zipper-like arrangement of chromophores in GNA ............. 165
Chapter 5.2.3 Effect of natural bases on arrangement ................................ 176
Chapter 5.3 Conclusions .................................................................................... 182

ix
Chapter 5.4 Experimental .................................................................................. 183
Chapter 5.5 References ...................................................................................... 185
Chapter 6 Photochemical Ligation of GNA via Anthracene Cyclodimer
Formation ................................................................................................................ 187
Chapter 6.1 Introduction .................................................................................... 188
Chapter 6.2 Results and Discussion ................................................................... 190
Chapter 6.2.1 Synthesis of anthracene-GNA .............................................. 190
Chapter 6.2.2 Photochemical ligation of GNA ........................................... 191
Chapter 6.3 Conclusions .................................................................................... 204
Chapter 6.4 Experimental .................................................................................. 205
Chapter 6.5 References ...................................................................................... 212
Chapter 7 Summary and Outlook ......................................................................... 213
Kapitel 8 Zusammenfassung .................................................................................. 221

x
List of Schemes
Scheme 1.1 General synthesis of (S)-phosphoramidite building blocks for the synthesis
of GNA oligonucleotide. .............................................................................................. 11
Scheme 2.1 The general scheme of synthesis of glycol nucleoside phosphoramidites
based on Grignard reagents. ........................................................................................ 21
Scheme 2.2 The formation of Grignard reagent by transmetallation reaction. ........... 23
Scheme 2.3 The general synthesis of glycol nucleoside phosphoramidites based on
Grignard reagents containing a metallation/transmetallation sequence. ..................... 23
Scheme 2.4 The general synthesis of glycol nucleoside phosphoramidites based on
organolithium reagents. ............................................................................................... 25
Scheme 2.5 Synthesis of ring-opening compound 17c. .............................................. 28
Scheme 2.6 The synthesis of 2-bromoanthracene (8a). .............................................. 38
Scheme 2.7 The synthesis of 1-ethynylpyrene (16a). ................................................. 46
Scheme 2.8 The synthesis of 3-ethynylperylene (16b). .............................................. 49
Scheme 2.9 The synthesis of 5-bromo-10,20-diphenylporphinatozinc (30). ............. 53
Scheme 2.10 Synthesis of 5-ethynyl-10,20-diphenylporphinatozinc (16c). ............... 56
Scheme 7.1 (A) The synthesis of compounds 5, 9, 14 and 17 based on nucleophilic
ring-opening of dimethoxytrityliated (S)-glycidol 3 by carbon nucleophiles. (B) The
synthesis of compound 17c through Sonogashira coupling reaction. ....................... 214
List of Tables
Table 1.1 Thermal stabilities of GNA, DNA and RNA duplexes. ............................. 10
Table 2.1 The synthesis of glycol nucleoside phosphoramidites based on Grignard
reagents. ...................................................................................................................... 22
Table 2.2 The synthesis of glycol nucleoside phosphoramidites based on Grignard
xi
reagents containing a metallation/transmetallation sequence. .................................... 24
Table 2.3 The synthesis of glycol nucleoside phosphoramidites based on organolithium
reagents. ...................................................................................................................... 26
Table 2.4 The synthesis of glycol nucleoside phosphoramidites based on
alkynyllithium reagents. .............................................................................................. 27
Table 3.1 Thermal stability of GNA duplexes containing pyrene nucleotides. ........ 108
Table 3.2 Thermal stability of GNA duplexes containing pyrene acetylide nucleotides.
.................................................................................................................................... 110
Table 3.3 Comparison of thermal and excimer emission for D14 and D15. ............. 115
Table 3.4 MALDI-TOF MS data of used oligonucleotides. ..................................... 128
Table 4.1 Thermal stabilities of porphyrin-containing 16mer GNA duplexes together
with Watson-Crick reference duplexes. .................................................................... 136
Table 4.2 Thermal stabilities of porphyrin-containing 22mer GNA duplexes together
with Watson-Crick reference duplexes. .................................................................... 139
Table 4.3 Absorption of porphyrin in GNA strands as single and double strandsa .. 146
Table 4.4 MALDI-TOF MS data of used oligonucleotides. ..................................... 157
Table 5.1 Thermal stabilities of GNA duplexes containing chromophore pair together
with Watson-Crick reference duplexes. .................................................................... 164
Table 5.2 Thermal stabilities of 16mer modified duplexes together with Watson-Crick
reference duplexes. .................................................................................................... 166
Table 5.3 Absorption data of porphyrin Soret and PBI absorption bands in modified
GNA as single and double strands. ........................................................................... 172
Table 5.4 Presentation of functionalized GNA strands used in this chapter. ............ 176
Table 5.5 Presentation of GNA strands used to study the effect of natural bases on the
porphyrin and PBI arrangements. ............................................................................. 177
Table 5.6 MALDI-TOF MS data of used GNA oligonucleotides. ........................... 184
Table 6.1 Properties of the anthracene-containing GNA duplexes. .......................... 192
Table 6.2 Thermal stabilities of the anthracene-containing GNA duplexes before and
after photoirradiation. ................................................................................................ 195
Table 6.3 Thermal stabilities of the anthracene-containing GNA duplexes before and

xii
after photoirradiation. ................................................................................................ 198
Table 6.4 MALDI-TOF MS data of used GNA oligonucleotides. ........................... 205
List of Figures
Figure 1.1 Examples of chromophores incorporated into the DNA termini. (A)
5′-terminal modification. (B) 3′-terminal modification................................................. 3
Figure 1.2 (A) Examples of glycosides. Artificial bases replaced the DNA bases. (B)
Schematic representation of zipper-like inter-strand stacking within the DNA duplex
(right). ........................................................................................................................... 4
Figure 1.3 (A) A library of fluorescent deoxyribosides based on C-nucleosides. (B)
Structure of one tetrafluor assembled in a DNA backbone. .......................................... 5
Figure 1.4 Examples of nucleotide replacement. (A) Using acyclic linkers based on D-
or L-threoninol. (B) Using the chromophore itself as one part of the linker between the
phosphodiester functions. .............................................................................................. 7
Figure 1.5 Examples of DNA natural nucleoside modifications. (A) Modification at the
5′-position of pyrimidine. (B) Modification at the 7′-position with deazapurine. ........ 8
Figure 1.6 Comparison of the constitutions of DNA and RNA, with both enantiomers
of GNA. ....................................................................................................................... 10
Figure 1.7 (A) Determined structures of (S)-GNA duplex: 3′-GBrCGCGC-2′ (Br-GNA).
Single duplexes are shown in red sticks. On the right are views along the helical axis. (B)
Structure of a single Br-GNA. .................................................................................... 12
Figure 1.8 Metallo-base pairs investigated in GNA. .................................................. 13
Figure A2.1.1 1H-NMR spectrum of compound 3 (300 MHz, CDCl3)… . ................ 66
Figure A2.2.1 1H-NMR spectrum of compound 5a (300 MHz, CDCl3). ................... 66
Figure A2.2.2 13C-NMR spectrum of compound 5a (75 MHz, CDCl3). .................... 67
Figure A2.2.3 IR spectrum of compound 5a (solid). .................................................. 67
Figure A2.3.1 31P-NMR spectrum of compound 7a (121.5 MHz, CDCl3). ............... 68

xiii
Figure A2.3.2 IR spectrum of compound 7a (solid). .................................................. 68
Figure A2.4.1 1H-NMR spectrum of compound 5b (300 MHz, CDCl3). ................... 69
Figure A2.4.2 13C-NMR spectrum of compound 5b (75 MHz, CDCl3). ................... 69
Figure A2.4.3 IR spectrum of compound 5b (solid). ................................................. 70
Figure A2.5.1 31P-NMR spectrum of compound 7b (121.5 MHz, CDCl3). ............... 70
Figure A2.5.2 IR spectrum of compound 7b (solid). ................................................. 71
Figure A2.6.1 1H-NMR spectrum of compound 5c (300 MHz, CDCl3). ................... 71
Figure A2.6.2 13C-NMR spectrum of compound 5c (75 MHz, CDCl3). .................... 72
Figure A2.6.3 IR spectrum of compound 5c (solid). .................................................. 72
Figure A2.7. 1 31P-NMR spectrum of compound 7c (121.5 MHz, CDCl3). .............. 73
Figure A2.7.2 IR spectrum of compound 7c (solid). .................................................. 73
Figure A2.8.1 1H-NMR spectrum of compound 5d (300 MHz, CDCl3). ................... 74
Figure A2.8.2 13C-NMR spectrum of compound 5d (75 MHz, CDCl3). ................... 74
Figure A2.8.3 IR spectrum of compound 5d (solid). ................................................. 75
Figure A2.9.1 31P-NMR spectrum of compound 7d (121.5 MHz, CDCl3). ............... 75
Figure A2.9.2 IR spectrum of compound 7d (solid). ................................................. 76
Figure A2.10.1 1H-NMR spectrum of compound 5e (300 MHz, CDCl3). ................. 76
Figure A2.10.2 13C-NMR spectrum of compound 5e (75 MHz, CDCl3). .................. 77
Figure A2.10.3 IR spectrum of compound 5e (solid). ................................................ 77
Figure A2.11.1 31P-NMR spectrum of compound 7e (121.5 MHz, CDCl3). .............. 78
Figure A2.11.2 IR spectrum of compound 7e (solid). ................................................ 78
Figure A2.12.1 1H-NMR spectrum of compound 9a (300 MHz, CDCl3). ................. 79
Figure A2.12.2 13C-NMR spectrum of compound 9a (75 MHz, CDCl3). .................. 79
Figure A2.12.3 IR spectrum of compound 9a (solid). ................................................ 80
Figure A2.13.1 31P-NMR spectrum of compound 10a (121.5 MHz, CDCl3). ........... 80
Figure A2.13.2 IR spectrum of compound 10a (solid). .............................................. 81
Figure A2.14.1 1H-NMR spectrum of compound 9b (300 MHz, CDCl3). ................. 81
Figure A2.14.2 13C-NMR spectrum of compound 9b (75 MHz, CDCl3). ................. 82
Figure A2.14.3 IR spectrum of compound 9b (solid). ............................................... 82
Figure A2.15.1 31P-NMR spectrum of compound 10b (121.5 MHz, CDCl3). ........... 83

xiv
Figure A2.15.2 IR spectrum of compound 10b (solid). ............................................. 83
Figure A2.16.1 1H-NMR spectrum of compound 14a (300 MHz, CDCl3). ............... 84
Figure A2.16.2 13C-NMR spectrum of compound 14a (75 MHz, CDCl3). ................ 84
Figure A2.16.3 IR spectrum of compound 14a (solid). .............................................. 85
Figure A2.17.1 31P-NMR spectrum of compound 15a (121.5 MHz, CDCl3). ........... 85
Figure A2.17.2 IR spectrum of compound 15e (solid). .............................................. 86
Figure A2.18.1 1H-NMR spectrum of compound 14b (300 MHz, CDCl3). ............... 86
Figure A2.18.2 13C-NMR spectrum of compound 14b (75 MHz, CDCl3). ............... 87
Figure A2.18.3 IR spectrum of compound 14b (solid). ............................................. 87
Figure A2.19.1 31P-NMR spectrum of compound 15b (121.5 MHz, CDCl3). ........... 88
Figure A2.19.2 IR spectrum of compound 15b (solid). ............................................. 88
Figure A2.20.1 1H-NMR spectrum of compound 20 (300 MHz, CDCl3). ................. 89
Figure A2.21.1 1H-NMR spectrum of compound 16a (300 MHz, CDCl3). ............... 89
Figure A2.22.1 1H-NMR spectrum of compound 17a (300 MHz, CDCl3). ............... 90
Figure A2.22.2 13C-NMR spectrum of compound 17a (75 MHz, CDCl3). ................ 90
Figure A2.22.3 IR spectrum of compound17a (solid). ............................................... 91
Figure A2.23.1 31P-NMR spectrum of compound 18a (121.5 MHz, CDCl3). ........... 91
Figure A2.23.2 IR spectrum of compound 18a (solid). .............................................. 91
Figure A2.24.1 1H-NMR spectrum of compound 17b (300 MHz, CDCl3). ............... 92
Figure A2.24.2 13C-NMR spectrum of compound 17b (75 MHz, CDCl3). ............... 93
Figure A2.24.3 IR spectrum of compound17b (solid). .............................................. 93
Figure A2.25.1 31P-NMR spectrum of compound 15d (121.5 MHz, CDCl3). ........... 94
Figure A2.25.2 IR spectrum of compound 18b (solid). ............................................. 94
Figure A2.26.1 1H-NMR spectrum of compound 28 (300 MHz, CDCl3). ................. 95
Figure A2.27.1 1H-NMR spectrum of compound 30 (300 MHz, CDCl3). ................. 95
Figure A2.28.1 1H-NMR spectrum of compound 17s (300 MHz, CDCl3). ............... 96
Figure A2.28.2 13C-NMR spectrum of compound 17s (75 MHz, CDCl3). ................ 96
Figure A2.28.3 IR spectrum of compound 17s (solid). .............................................. 97
Figure A2.29.1 1H-NMR spectrum of compound 17d (300 MHz, CDCl3). ............... 97
Figure A2.29.2 13C-NMR spectrum of compound 17d (75 MHz, CDCl3). ............... 98

xv
Figure A2.29.3 IR spectrum of compound 17d (solid). ............................................. 98
Figure A2.30.1 31P-NMR spectrum of compound 18d (121.5 MHz, CDCl3). ........... 99
Figure A2.30.2 IR spectrum of compound 18d (solid). ............................................. 99
Figure A2.31.1 1H-NMR spectrum of compound 17c (300 MHz, CDCl3). ............. 100
Figure A2.31.2 13C-NMR spectrum of compound 17c (125.8 MHz, CDCl3). ......... 100
Figure A2.31.3 IR spectrum of compound 17c (solid). ............................................ 101
Figure A2.32.1 1H-NMR spectrum of compound 18c (500 MHz, CDCl3). ............. 101
Figure A2.32.2 13C-NMR spectrum of compound 18c (125.8 MHz, CDCl3). ......... 102
Figure A2.32.3 31P-NMR spectrum of compound 18c (121.5 MHz, CDCl3). ......... 102
Figure A2.32.4 IR spectrum of compound 18c (solid). ............................................ 103
Figure 3.1 Pyrene artificial C-nucleoside. ................................................................ 105
Figure 3.2 (A) Structure of pyrene phosphoramidites 10b and 15c. (B) Constitution of
(S)-GNA. Pyr:Me and Pyr′:H base pairs used in this study. ................................... 107
Figure 3.3 UV-melting curves of GNA duplexes containing pyrene nucleotides.
Changes in absorbance upon heating as monitored at 260 nm. (A) Duplexes D1, D2 and
D3. (B) Duplexes D1, D4, D5, D6 and D7 (see Table 3.1 for the sequences). ......... 109
Figure 3.4 UV-melting curves of GNA duplexes containing pyrene acetylide
nucleotides. Changes in absorbance upon heating as monitored at 260 nm. (A)
Duplexes D1, D8 and D9. (B) Duplexes D1, D10, D11, D12 and D13 (see Table 3.2 for
the sequences). ........................................................................................................... 110
Figure 3.5 CD spectra of GNA duplexes (A) containing pyrene and (B) pyrene
acetylide nucleotides (see Table 3.1 and 2.2 for the sequences).. .............................. 111
Figure 3.6 Fluorescence properties of pyrene nucleotides in GNA.. ........................ 112
Figure 3.7 Fluorescence properties of pyrene acetylide nucleotides in GNA.. ......... 113
Figure 3.8 Structure of the copper-mediated hydroxypyridone homo-base pairs M:M
(M = hydroxypyridone). ............................................................................................ 114
Figure 3.9 Copper(II)-dependent fluorescence properties of duplexes. (A) D14. (B)
D15 (see Table 3.3 for the sequences). ...................................................................... 115
Figure 3.10 NaCl concentration-dependent UV-melting curves of duplex D15 (see
Table 3.3 for the sequences). (A) Without Cu2+. (B) With one equivalent Cu2+. ...... 116

xvi
Figure 3.11 NaCl concentration-dependent fluorescence spectrums of duplex D15 (see
Table 3.3 for the sequences). (A) Without Cu2+. (B) With one equivalent Cu2+. ...... 117
Figure 3.12 Copper(II)-dependent fluorescence properties of duplexes D15 in
optimized condition. ................................................................................................... 117
Figure 3.13 Copper(II)-sensing with sensor D15 (see Table 3.3 for the sequences). (A)
Titration. (B) The trend of monomer emission and excimer emission in titration. .... 118
Figure 3.14 Metal ion-dependent UV-melting curves of duplex D15 (see Table 3.3 for
the sequences).. .......................................................................................................... 119
Figure 3.15 Metal ion-selectivity of sensor D15 at different temperatures (see Table 3.3
for the sequences). A) 25 oC. B) 40 oC. C) 50 oC. D) 60 oC. .................................... 120
Figure 3.16 Structure of the copper-mediated hydroxypyridone-pyridylpurine
hetero-base pairs (M = hydroxypyridone, P = pyridylpurine). ................................. 121
Figure 3.17 Copper(II)-dependent fluorescence properties of duplex D19.. ........... 122
Figure 3.18 (A) Metal-dependent UV-melting curves of duplex D19. (B) Metal
ion-selectivity of sensor D19.. .................................................................................. 123
Figure 3.19 Copper(II)-sensing with GNA D19 in Dulbecco’s Modified Eagle’s
medium.. .................................................................................................................... 123
Figure 4.1 Porphyrin artificial C-nucleoside. ........................................................... 132
Figure 4.2 (A) Structure of porphyrin acetylide phosphoramidite 18c. (B) Constitution
of the (S)-GNA backbone. P:H and PM:H base pairs used in this study. .................. 134
Figure 4.3 UV-melting curves of GNA duplexes. Changes in absorbance upon heating
as monitored at 260 nm. (A) Duplexes ON3:ON4, ON6:ON7, ON6:ON2, and
ON6:ON5. (B) Duplexes ON6:ON7, ON6Zn:ON7, ON6Ni:ON7, and ON6Mn:ON7
(see Tables 4.1 for the sequences). ............................................................................ 137
Figure 4.4 UV-melting curves of GNA duplexes ON3:ON4, ON10:ON11 and
ON10Zn:ON11Zn (see Tables 4.1 for the sequences).. ............................................... 138
Figure 4.5 UV-melting curves of GNA duplexes. Changes in absorbance upon heating
as monitored at 260 nm. (A) Duplexes ON14:ON15, ON16:ON17, ON16Zn:ON17Zn,
ON16Ni:ON17Ni and ON16Mn:ON17Mn. (B) Duplexes ON14:ON15, ON18:ON19,
ON18Zn:ON19Zn, ON18Ni:ON19Ni and ON18Mn:ON19Mn (see Table 4.2 for the

xvii
sequences). ................................................................................................................ 140
Figure 4.6 UV-vis Absorption spectra of porphyrin-GNA single strands without and
with incorporated imetals. (A) ON16, ON16Zn, ON16Ni and ON16Mn. (B) ON17,
ON17Zn, ON17Ni and ON17Mn. (C) ON18, ON18Zn, ON18Ni and ON18Mn. (D) ON19,
ON19Zn, ON19Ni and ON19Mn (see Tables 4.2 for the sequences). The insert shows the
expanded porphyrin Soret band region. .................................................................... 142
Figure 4.7 UV-vis spectra of GNA duplexes and their corresponding single strands. (A)
ON16, ON17 and ON16:ON17. (B) ON16Zn, ON17Zn and ON16Zn:ON17Zn. (C)
ON16Ni, ON17Ni and ON16Ni:ON17Ni. (D) ON16Zn, ON17Ni and ON16Zn:ON17Ni
(see Tables 4.2 for the sequences). The inserts show expanded porphyrin Soret band
regions. ...................................................................................................................... 143
Figure 4.8 UV-vis spectra of GNA duplexes and their corresponding single strands. (A)
ON18, ON19 and ON18:ON19. (B) ON18Zn, ON19Zn and ON18Zn:ON19Zn. (C)
ON18Ni, ON19Ni and ON18Ni:ON19Ni. (D) ON18Zn, ON19Ni and ON18Zn:ON19Ni (see
Tables 4.2 for the sequences). The inserts show expanded porphyrin Soret band regions.
................................................................................................................................... 144
Figure 4.9 UV-vis spectra of GNA duplexes and their corresponding single strands. (A)
ON16Mn, ON17Mn and ON16Mn:ON17Mn. (B) ON18Mn, ON19Mn and
ON18Mn:ON19Mn (see Tables 4.2 for the sequences). The inserts show expanded
porphyrin Soret band regions. ................................................................................... 145
Figure 4.10 Temperature-dependent UV-vis spectra of GNA duplexes at Soret band
region. (A) ON16:ON17. (B) ON16Zn:ON17Zn. (C) ON16Ni:ON17Ni. (D)
ON16Zn:ON17Ni (see Tables 4.2 for the sequences). ................................................ 147
Figure 4.11 Temperature-dependent UV-vis spectra of GNA duplexes at Soret band
region. (A) ON18:ON19. (B) ON18Zn:ON19Zn. (C) ON18Ni:ON19Ni. (D)
ON18Zn:ON19Ni (see Tables 4.2 for the sequences). ................................................ 148
Figure 4.12 Fluorescence spectra of GNA duplexes and their corresponding single
strands. (A) ON16, ON17, and ON16:ON17. (B) ON16Zn, ON17Zn, and
ON16Zn:ON17Zn (see Tables 4.2 for the sequences). ............................................... 149
Figure 4.13 Fluorescence spectra of GNA duplexes and their corresponding single

xviii
strands. (A) ON18, ON19, and ON18:ON19. (B) ON18Zn, ON19Zn and
ON18Zn:ON19Zn (see Tables 3.2 for the sequences). ................................................ 150
Figure 4.14 CD spectra of GNA duplexes and their corresponding single strands. (A)
ON16, ON17, ON16:ON17, and ON14:ON15. (B) ON16Ni, ON17Ni, and
ON16Ni:ON17Ni (see Tables 4.2 for the sequences). Inserts: overlap plot of CD and
absorption spectra at the Soret region. ...................................................................... 151
Figure 4.15 CD spectra of GNA duplexes and their corresponding single strands. (A)
ON16Zn, ON17Zn, and ON16Zn:ON17Zn. (B) ON16Zn, ON17Ni and ON16Zn:ON17Ni
(see Tables 4.2 for the sequences). Inserts: overlap plot of CD and absorption spectra at
the Soret region. ........................................................................................................ 152
Figure 4.16 Temperture-dependent CD spectra of GNA duplexes. (A) ON16:ON17. (B)
ON16Zn:ON17Zn. (C) ON16Ni:ON17Ni. (D) ON16Zn:ON17Ni (see Tables 4.2 for the
sequences). The inserts show expanded porphyrin Soret band regions. ................... 153
Figure 5.1 (A) Structure of chromophores used in the present study. (B) Position of
electron donor-acceptor stacking chromophores in the middle of duplex GNA. ...... 163
Figure 5.2 UV-melting curves of the GNA duplexes ON1:ON2, ON3:ON4, ON8:ON6,
ON8:ON7, ON8:ON9, and ON8:ON10 (see Table 5.1 for the sequences). ............ 165
Figure 5.3 UV-melting curves of the GNA duplexes ON3:ON4, ON8:ON10,
ON11:ON12, ON13:ON14, ON15:ON16, ON17:ON18, ON19:ON20, and
ON23:ON24 (see Table 5.2 for the sequences)... ..................................................... 167
Figure 5.4 UV-vis spectra of modified GNA duplexes and their corresponding single
strands. (A) ON8, ON10, and ON8:ON10. (B) ON11, ON12, and ON11:ON12. The
inset shows the expanded porphyrin Soret band and the PBI absorption band. ....... 168
Figure 5.5 CD spectra of modified GNA duplexes and their corresponding single
strands. (A) ON8, ON10, ON8:ON10, and ON3:ON4. (B) ON11, ON12, ON11:ON12,
and ON3:ON4. (C) ON11:ON12 and ON13:ON14. (D) ON8:ON10 and ON15:ON16.
The inset shows the expanded PBI absorption region.. ............................................ 169
Figure 5.6 Temperature-dependent UV-vis spectra of GNA duplexes at the porphyrin
Soret band and the PBI absorption band region. (A) ON8:ON10. (B) ON11:ON12.
................................................................................................................................... 170

xix
Figure 5.7 Temperature-dependent CD spectra of GNA duplexes. (A) ON8:ON10. (B)
ON11:ON12.. ............................................................................................................ 171
Figure 5.8 UV-vis spectra of GNA duplexes and their corresponding single strands. (A)
ON13, ON14, and ON13:ON14. (B) ON15, ON16, and ON15:ON16. (C) ON17,
ON18, and ON17:ON18. (D) ON19, ON20, and ON19:ON20. (E) ON23, ON24, and
ON23:ON24. The inset shows the expanded porphyrin Soret and PBI absorption bands.
................................................................................................................................... 173
Figure 5.9 CD spectra of GNA duplexes and their corresponding single strands. (A)
ON15, ON16, and ON15:ON16. (B) ON17, ON8, and ON17:ON18. (C) ON19, ON20,
and ON19:ON20. (D) ON23, ON24, and ON23:ON24. The inset shows the expanded
PBI absorption region.. ............................................................................................. 174
Figure 5.10 CD spectra of GNA duplexes the ON8:ON10, ON13:ON14, ON19:ON20,
and ON23:ON24. ...................................................................................................... 175
Figure 5.11 CD spectra of GNA strands. (A) ON15:ON16 and ON21:ON22. (B)
ON23:ON24 and ON29:ON30.. ............................................................................... 176
Figure 5.12 CD spectra of mixtures of GNA strands. Conditions: 10 mM sodium
phosphate, 100 mM NaCl, pH 7.0, and 12 M of each strand. (A) ON23:ON30,
ON29:ON24, ON29:ON30, and ON23:ON24. (B) ON34:ON30, ON34:ON24, and
ON23:ON24. ............................................................................................................. 178
Figure 5.13 Temperature-dependent CD spectra of chromophore helical arrays. A)
ON23:ON30; B) ON29:ON24; C) ON34:ON30; D) ON34:ON24.. ....................... 179
Figure 5.14 Melting curves of chromophore helical array. Temperature-dependent
changes in CD absorbance as monitored at porphyrin Soret band. A) ON23:ON30; B)
ON29:ON24; C) ON34:ON30; D) ON34:ON24. .................................................... 180
Figure 6.1 Artificial anthracene C-nucleosides. ....................................................... 188
Figure 6.2 Photodimerization of anthracenes. .......................................................... 188
Figure 6.3 (A) Structure of anthracene phosphoramidite 9a. (B) Constitution of the
(S)-GNA backbone. An:H base pair used in the present study. ................................ 190
Figure 6.4 Structures and sequences of the conjugate and template GNAs used in the
present study. ............................................................................................................. 191

xx
Figure 6.5 UV-melting curves of the GNA duplexes ON1:ON2 and ON3:ON4:ON2.
................................................................................................................................... 192
Figure 6.6 Fluorescence properties of anthracene nucleotides in GNA: ON1:ON2,
ON3:ON4:ON2, ON3, and ON4.. ........................................................................... 193
Figure 6.7 HPLC chromatograms of the reaction mixtures before and after 3 min of
photoirradiation for the tandem duplex ON3:ON4:ON2.. ........................................ 194
Figure 6.8 Fluorescence properties of anthracene nucleotides in GNA. (A) ON7, ON8
and ON7:ON8. (B) ON9, ON10 and ON9:ON10. ................................................... 195
Figure 6.9 (A) The fluorescence properties of anthracene-GNA duplexes before and
after photoirradiation: ON7:ON8, ON9:ON10, ON7:ON8* and ON9:ON10*. (B)
UV-melting curves of the GNA duplexes containing anthracene nucleotides: ON7:ON8,
ON9:ON10, ON7:ON8* and ON9:ON10*... ........................................................... 196
Figure 6.10 UV-melting curves of the GNA duplexes containing anthracene
nucleotides: ON11:ON8, ON9:ON12, ON11:ON8* and ON9:ON12*.. ................ 197
Figure 6.11 Fluorescence spectra of the duplex ON13:ON14 before and after
photoirradiation (Table 6.3; *after irradiation).. ....................................................... 198
Figure 6.12 (A) HPLC chromatograms of the reaction mixtures before and after 3 min
of photoirradiation for duplex ON13:ON14. (B) UV-melting curves of the duplex
ON13:ON14 and ON13:ON14*. Changes in the absorbance upon heating were
monitored at 260 nm.. ............................................................................................... 199
Figure 6.13 CD spectra of the GNA duplexes ON13:ON14, ON13:ON14* and
ON5:ON6 (Table 6.3).. ............................................................................................. 200
Figure 6.14 Pyrene acetylide GNA nucleotides (Pyr′). ........................................... 201
Figure 6.15 (A) HPLC chromatograms of the reaction mixtures before and after 3 min
of photoirradiation for duplex ON15:ON16. (B) UV-melting curves of the duplex
ON15:ON16 and ON15:ON16*.. ............................................................................. 202
Figure 6.16 (A) Fluorescence spectra of ON15:ON16 with and without urea
denaturation (Table 6.3; *after irradiation). (B) A photograph of denaturing urea
polyacrylamide gel (6%) electrophoresis mobility shift arrays showing the denatured
ON15:ON16, ON15, and ON16, as well as the photoreaction mixture of

xxi
ON15:ON16*. .......................................................................................................... 203
Figure 6.17 MALDI-TOF MS of the photoproduct ON13:ON14*. ........................ 206
Figure 6.18 MALDI-TOF MS of the photoproduct ON13:ON14*. ........................ 207
Figure 6.19 MALDI-TOF MS of the photoproduct ON15:ON16*. ........................ 208
Figure 6.20 MALDI-TOF MS of the photoproduct ON15:ON16*. ........................ 209
Figure 7.1 (A) Structure of Pyr:Me and Pyr′:H base pairs used in chapter 3. (B)
Fluorescence properties of pyrene nucleotides (Pyr) and pyrene acetylide nucleotides
(Pyr′) in GNA duplexes. ........................................................................................... 215
Figure 7.2 (A) Metal ion-selectivity of sensor D15. (B) Metal ion-selectivity of sensor
D19. ........................................................................................................................... 216
Figure 7.3 (A) Structure of PM:X base pair used in chapter 4. (B) UV-melting curves of
GNA duplexes containing PM:X base pair. ............................................................... 216
Figure 7.4 (A) Position of two PM:H base pair in the middle of GNA duplex
ON16:ON17. (B) UV-vis spectra of porphyrin Soret band regions for GNA duplexes.
(C) CD spectra of GNA duplexes. The insert shows expanded porphyrin Soret band
regions. ...................................................................................................................... 217
Figure 7.5 (A) Structure of P:B base pair used in chapter 5. (B) UV-melting curves of
GNA duplexes containing one P:B base pair. ........................................................... 218
Figure 7.6 (A) Position of B and P in the middle of GNA duplex ON23:ON24. (B) CD
and UV-vis spectra of GNA duplexes containing central chromophore cores: B-P,
B-P-B, P-B-P-B and P-B-P-B-P. ............................................................................. 219
Figure 7.7 (A) Photochemical ligation of GNA via anthracene cyclodimer formation.
(B) UV-melting curves of the duplexes before and after end-capping of duplex. .... 220

xxii
List of Abbreviations
A adenosine
ACN acetonitrile
AcOH acetic acid
aq aqueous
Ar aromatic
bp base pair
br broad
C cytosine
Calcd calculated
CD circular dichroism
CDCl3 deuterated chloroform
conc concentrated
CPG controlled porous glass
d doublet
dA 2′-deoxyadenpsine
dc 2′-deoxycytosine
DCE 1,2-dichloroethane
DCM dichloromethane
DDQ 2,3-dichloro-5,6-dicyanobenzoquinone
dG 2′-deoxyguanosine
DMAP 4-dimethylaminopyridine
DMEA N,N′-Dimethyl-1,2-ethanediamine
DMF N,N-dimethylformamide
DMTr 4,4′-dimethoxytrityl
DMSO dimethyl sulfoxide

xxiii
DNA deoxyribonucleic acid
DSSC dye sensitised solar cell
EDTA ethylenediaminetetraacetate acid
eq equivalent
ESI electrospray ionization
EtOH ethanol
G guanosine
GNA glycol nucleic acid
GQ guanosine quadruplex
h hour(s)
HPLC high performance liquid chromatography
HRMS high resolution mass spectrometry
IR infra-red spectroscopy
L liters
LNA locked nucleic acid
LRMS low resolution mass spectrometry
m multiplet
M mol/L
MALDI matrix assisted laser desorption ionization
MeOH methanol
min minute
mL milliliters
mmol millimole
NBS N-bromosuccinimide
NMR nuclear magnetic resonance
ON oligodeoxynucleotide
PAGE polyacryamide gel electrophoresis
Ph phenyl
ppm parts per million

xxiv
Rf retention factor
RT room temperature
s singlet
t triplet
T thymine
TBAF tetrabutyl ammonium fluoride
TEAA triethylammonium acetate
THF tetrahydrofuran
TLC thin layer chromatography
Tm melting temperature
TMPyP tetrakis[4-(N-methylpyridiumyl)]porphyrin
TMS tetramethylsilane
TNA L-α-threofuranosyl oligonucleotide
TOF time of flight
TPP 5,10,15,20-tetraphenylporphyrin
U uridine
UV-Vis ultraviolet-visible spectroscopy
µL microliters
µmol micromole

Chapter 1 Introduction
1
Chapter 1 Introduction

Chapter 1.1 Background
2
Chapter 1.1 Background
Chromophores play important roles as imaging tools in life sciences and as
components of industrial dyes and pigments.1-3 They also participate in natural
processes, such as photosynthesis, the processes in circulatory system and so on.4
Take photosynthesis as an example, the energy conversion of sunlight into chemical
material by photosysterms I and II relies on a controlled and defined arrangement of
the chlorophyll chromophores, which provides efficient light absorption, energy
transfer, and initiation of charge separation.4 This example demonstrates that the
defined chromophore organization is crucial for the performance of an assembly or
device. Thus, the design of defined chromophore arrays has been the focus of several
studies.
In order to organize chromophores into functional architectures, various
approaches for the precise positioning of chromophores have been developed. Among
those approaches, DNA constitutes and provides structural scaffolds with unique
combinations of properties for the assembly of chromophores5–7 such as the following:
(1) Highly reliable, automated oligonucleotide synthesis enables the solid-phase
synthesis of oligonucleotides bearing multiple site-specific modifications; (2) The
canonical Watson-Crick base-pairing rule allows the construction of defined helical
architectures with high predictability; and (3) The DNA backbone evolves to hold the
flat aromatic nucleobases in a well-organized orientation. In the double-helical
structure, the nucleobases are nearly perpendicular to the orientation of the backbone
and stack on one another. The base-pair distance along the helical axis of B-DNA is
3.4 Å, which provides an ideal basis for the photophysical interactions of
chromophores.
However, DNA itself lacks remarkable functionality. Thus, various strategies for
generating functionalized nucleic acids have been developed over the last decades.
The three general approaches to nucleic acid functionalization are the modifications
of the inter-nucleoside phosphate residue, the nucleoside unit, or the DNA termini.8
Based on aforementioned strategies, chromophores can be incorporated into DNA at

Chapter 1.1 Background
3
precise sites by following four main aspects: (A) DNA termini modifications, (B)
nucleobase replacements, (C) nucleotide replacements, and (D) natural base
modifications.
A. DNA termini Modifications.
A large variety of chromophores can be covalently linked to the DNA termini
using various methods, such as standard automated oligonucleotide synthesis,
post-DNA synthesis and so on. 5′-Terminal modifications are usually achieved by
reaction of a phosphitylated modifier with 5′-hydroxyl group, or linking the
modification via direct functionalisation of the 5′-position of the ribose moiety
(Figure 1.1A).8a,9 In contrast, the 3′-terminal modifications could be realized by using
modified linkers to attach modifications to the 3′-hydroxyl group (Figure 1.1B).10
Figure 1.1 Examples of chromophores incorporated into the DNA termini. (A) 5′-terminal modification.8a,9 (B) 3′-terminal modification.10
However, 5′-terminal modifications receive more attention because they are more
convenient and commercially feasible compared with 3′-terminal modifications,
which have been employed in increasing DNA stability toward enzymatic

Chapter 1.1 Background
4
degradation,11 improving duplex thermal stability through capping,12 enhancing DNA
target affinity to facilitate detection,13 or monitoring DNA structural changes.9
B. Nucleobase replacements.
Modification in duplex DNA
The four natural nucleobases represent a set of physicochemical and functional
properties but they are limited in numerous aspects, such as polarity, stacking ability,
non-fluorescent property, redox potentials and so on. However, the replacement of
natural nucleobase with an artificial one provides a wide range of modifications,
including but not limited to chromophores.14 Kool et al. have synthesized a library of
fluorescent deoxyribosides based on C-nucleosides and successfully introduced them
into DNA (Figure 1.2A), where the natural nucleobases are replaced by chromophores,
including pyrene, perylene, terphenyl, terthophene, dimethylaminostilbene,
binaphythyl, trinaphthyl, quinacridone and so on. For this strategy, the modifications
are incorporated into interior of DNA, namely internal modification.
Figure 1.2 (A) A library of fluorescent deoxyribosides was synthesized by Kool et al. Artificial bases replaced the DNA bases. (B) Schematic representation of zipper-like inter-strand stacking within the DNA duplex.14

Chapter 1.1 Background
5
The aromatic nature of chromophores is crucial to forming a stable duplex via
π–π stacking. Therefore, chromophores can be designed as artificial nucleobases to
stack on one other in a zipper-like fashion (Figure 1.2B).15,16 Leumann et al. showed
that incorporation of multiple biphenyl and/or bipyridyl residues into the middle of
duplex can form a zipper-like arrangement array inside the duplex, without perturbing
the conformation of DNA duplex. Using this artificial base pairing system, they
investigated electron transfer through a stacked phenanthrenyl pair in DNA.15
Modification in single strand DNA
Aside from the arrangement of chromophores in duplex DNA, chromophores can
be also assembled into a DNA-like single strand, where they interact with each other
both physically and electronically like the bases in natural DNA.
Figure 1.3 (A) Fluorescent deoxyribosides based on C-nucleosides. (B) Structure of one tetrafluor assembled in a DNA backbone.17,18
Kool et al. have investigated the interactions of multi-chromophores along the
DNA backbone (Figure 1.3).17,18 The replacement of natural nucleobases with flat
aromatic chromophores not only allows them to stack on one other, but also provides
water solubility due to the DNA backbone negative charges, thereby mimicking single
stranded fluorescent DNA (Figure 1.3B). The coexistence of the different

Chapter 1.1 Background
6
photophysical interactions within the stacking chromophore array generates
interesting optical properties. A 256-member library composed of all combinations of
fluorosides bearing quinacridone, pyrene, oxoperylene and dimethylaminostilbene as
artificial bases was formed. The tetra-fluorosides displayed remarkably different
optical properties from those of individual chromophores, such as high total molar
extinction coefficients and large Stockes shifts up to 220 nm.17 The
sequence-dependent fluorescent emission of fluorophores exhibited at least 50
different colors ranging from violet to yellow-orange, and from relatively bright to
nearly dark intensities. Subsequently, the study was extended to a 14641-member
library composed of 11 fluorosides for the potential application of such
tetra-fluorosides to sense UV or visible light exposure with distinct color changes.18
Similarly, Inouye et al. synthesized structurally defined fluorosides composed of
alkynyl C-nucleosides bearing pyrene, perylene and anthracene as chromophores.
Physical and electronic interactions of chromophores were observed and the
predominant excimer fluorescence was found to originate not only from
homo-oligomers but also from hetero-oligomers.19
C. Nucleotide replacements.
Nucleotide replacement involves the complete replacement of an oligonucleotide
section (Figure 1.4). In principle, any functional molecule containing two hydroxyl
groups can be used to form a building block for DNA automated solid phase synthesis,
in which one of the hydroxyl groups is protected by DMTr group, whereas the other
one is transformed into phosphoramidite. Generally, two approaches were employed
to introduced chromophores into DNA: one is using acyclic linkers based on D- or
L-threoninol and so on (Figure 1.4A),20,21 the other is ro use the chromophore itself as
one part of the linker between the phosphodiester functions (Figure 1.4B).22 By using
this method, various self-organization arrays composed of different classes of
chromophores, such as methyl red, naphythyl red, perylene bisimide, pyrene,
phenanthrene, have been generated by Asanuma,20 Wagenknecht,21 Haner22 et al.

Chapter 1.1 Background
7
Figure 1.4 Nucleotide replacements. (A) Using acyclic linkers based on D- or L-threoninol.20,21 (B) Using the chromophore itself as one part of the linker between the phosphodiester functions.22
The application of artificial and flexible linkers in the nucleoside analogs is one
advantage of this method, which allows the chromophores to intercalate efficiently
into DNA. Moreover, the interstrand stacking interactions of chromophores not only
stabilize the duplex, but also have a significant influence on the fluorescence
properties of duplex. For example, a helically organized chromophore array composed
of fourteen pyrenes within DNA, which was resulted from hybridization of two
complementary oligopyrene strands each containing seven pyrenes. This modified
duplex exhibited a strong enhanced stability (∆Tm = + 23 oC), and a blue shift in the
excimer fluorescence when the temperature was decreased.22
D. Natural base modifications.
DNA provides an ideal scaffold for introducing chromophores to the outer rim of
the DNA and forms a helical array upon duplex hybridization.23-28 In this aspect,
chromophores are located in the grooves of the DNA helix. Thus, this method is so
called external modification. Pyrimidines were modified at the 5′-position (Figure
1.5A), and purines were replaced with 7′-deazapurines at the 7′-position (Figure 1.5B)
to maintain the helical structure and base pairing. The self-organization of
chromophores along the DNA helix without significant perturbation of the canonical

Chapter 1.1 Background
8
Watson-Crick base-pairing property is one property of this strategy. The major groove
is a more commonly chosen site for modification pointing, because it is larger and can
accommodate bulky substituents better.
Figure 1.5 DNA natural base modifications. (A) Modification at the 5′-position of pyrimidine.25,26 (B) Modification at the 7′-position with deazapurine.24
A variety of chromophores have been attached with respect to natural nucleoside
modification, which may be potentially applied in redox and fluorescence labeling,
drug delivery, and nanotechnology. Nevertheless, by helical arranging chromophores,
DNA has been used as a scaffold to create photonic and electronic wires. Stulz25 and
Wagenkenecht26 et al. have shown that chromophores can be covalently bonded to
DNA by nucleoside modification, and aligned within the major groove to form helical
arrays which exhibit unique optical properties such as solvatochromism or
neighbourhood-dependent exciplex-type fluorescence and so on. For example, a
zipper-like assembly of eleven porphyrins on the major groove of DNA resulting from
the alternating arrangement of chromophores on two complementary strands, which
showed a enhanced stability even porphyrins were inserted by Zn(II) ions. Up on
annealing of the free and metalated strands, fluorescence of the Zn-porphyrin was
partially quenched at the same time fluorescence of the free porphyrin was increased,
indicating the efficient energy transfer in this system.25d These results represent the

Chapter 1.1 Background
9
potential of DNA as a scaffold to arrange metal ions on a nanometer scale.
Overall, chromophores can be incorporated into DNA at precise sites by
performing terminal, internal, or external modifications, generating defined
chromophore arrays in the interior and grooves of duplex DNA or in single DNA-like
strands. The chromophore organization proves to exhibit enhanced electronic
communication properties and promote various forms of photophysical interactions in
the excited state, such as energy transfer, excimer, exciplex, charge-transfer
interactions and so on.
Usually, phosphoramidites of modified nucleotides are incorporated into DNA by
automated solid phase synthesis, enabling the synthesis of oligonucleotides with more
than 100 bases. However, due to the stereocenters in the deoxyribose moiety
(especially the anomeric C1′-stereocenter), the synthesis of phosphoramidites of
2′-deoxynucleosides is very time-consuming because it includes long-reaction
sequence and chromatographic separation of diastereomers, which is challenging to
scale up. Thus, the chemical synthesis of artificial nucleotides is a critical bottleneck
for progress in this area of research.
To address the problem of tedious synthesis of nucleotide building blocks and
retain the desired base-pairing properties, Meggers et al. developed the glycol nucleic
acid (GNA) consisting of a simplified acyclic propylene glycol phosphodiester
backbone, which uniquely combines atomic economy, structural simplicity, and high
duplex stability (Figure 1.6).29

Chapter 1.2 Previous work with glycol nucleic acids
10
Figure 1.6 Comparison of the constitutions of DNA and RNA, with both enantiomers of GNA.29
Chapter 1.2 Previous work with glycol nucleic acids (GNA)
Analogous to DNA and RNA, the homoduplex formation of GNA relies on the
Watson-Crick base pairing with antiparallel strand complementarity and 1:1 strand
stoichiometry. (R)-GNA and (S)-GNA do not significantly cross-pair with each other,
either in a parallel or antiparallel manner.29,33 GNA duplexes exhibit high thermal and
thermodynamic stabilities, significantly exceeding those of analogous duplexes of
DNA and RNA.29,33,34 For example, in a 18mer GNA is much more stable than
DNA and RNA.29
Table 1.1 Thermal stabilities of GNA, DNA and RNA duplexes.29 System Sequence Tm (oC)
GNA 3′-TAAAATTTATATTATTAA-2′ 2′-ATTTTAAATATAATAATT-3′
63
DNA 5′-TAAAATTTATATTATTAA-3′ 3′-ATTTTAAATATAATAATT-5′
41
RNA 5′-TAAAATTTATATTATTAA-3′ 3′-ATTTTAAATATAATAATT-5′
43

Chapter 1.2 Previous work with glycol nucleic acids
11
Beside the high duplex stability, its straightforward chemical synthesis is another
very attractive feature of GNA. Long-reaction sequence and the painstaking
separation of anomeric mixtures are not issues for GNA. As shown in Scheme 1.1,
propylene glycol nucleotides with natural or artificial bases for automated solid-phase
nucleic acid synthesis can be easily obtained through several steps by the
regioselective and stereospecific epoxide ring-opening of protected glycidols.30-32
i
Scheme 1.1 General synthesis of (S)-phosphoramidite building blocks for the synthesis of GNA oligonucleotide (B represents a natural base or artificial base).30-32
The study of a crystal structure of a (S)-GNA duplex reveals that the GNA double
helix is distinct from canonical A- and B- form nucleic acids, and it may be described
as a helical ribbon loosely wrapped around the helical axis (Figure 1.7).35 (S)-GNA
undergoes extensive zipper-like interstrand interactions and at the same time
possesses a reduced intrastrand base–base stacking interaction because of a large
average slide between neighboring base pairs. (S)-GNA only displays one large
groove, whereas the canonical major groove is a convex surface.

Chapter 1.2 Previous work with glycol nucleic acids
12
Figure 1.7 (A) Determined structures of (S)-GNA duplex: 3′-GBrCGCGC-2′ (Br-GNA). Single duplexes are shown in red sticks. On the right are views along the helical axis. (B) Structure of a single Br-GNA.35
Considering the unique combination of high duplex stability, high-base pairing
fidelity, and easy synthetic access of GNA nucleotide building blocks, Meggers et al.
started investigating the functionalization of GNA by incorporating artificial
nucleotides into GNA oligonucleotides. In order to tune the electronic and magnetic
properties of nucleic acids, they explored the properties of metal-ion-mediated base
pairing in GNA duplexes (Figure 1.8).36 A nickel(II)-mediated pyridylpurine
homobase pair (P-Ni-P) or a copper(II)-mediated hydroxypyridone homobase pair
(M-Cu-M) was introduced into GNA,36 which had been developed for
metal-mediated base pairing in DNA.37,89
The study of the metal ion-dependent duplex formation reveals that the
pyridylpurine base pair P:P in GNA is most strongly stabilized by Ni2+ ions among
the tested ions.36 Ni2+-induced stabilization of the pyridylpurine base pair in GNA is
comparable with that of the analogous 2′-deoxynucleotide pyridylpurine base pair in
the DNA duplex.38
In contrast, the hydroxypyridone base pair M:M is most strongly stabilized by
Cu2+ ions.36 The copper(II)-induced stabilization of the hydroxypyridone base pair in

Chapter 1.2 Previous work with glycol nucleic acids
13
GNA significantly exceeds the stabilization of the analogous 2′-deoxynucleotide
hydroxypyridone base pair in DNA, indicating that the Cu2+ -mediated M:M base pair
is well-accommodated in the GNA duplex compared with DNA.37
Figure 1.8 Metallo-base pairs investigated in GNA.36
Furthermore, the metal-mediated cross-pairing of the hydroxypyridone and
pyridylpurine chelates was also investigated in GNA duplexes. The heterobase pair
M:P behaves similarly to the hydroxypyridone homobase pair M:M in its metal
selectivity, and the Cu2+-mediated M:P base pair exhibits higher stabilization than the
Cu2+-mediated M:M base pair. As far as we know, Cu2+-mediated M:P is the most
stable base pair for GNA to date.
To understand better the metallo-GNA duplex structure, Meggers et al.
investigated the crystal structure of a metallo-GNA duplex formed from the
Cu2+-mediated pairing of the self-complementary strand 3′-CGHATMCG-2′.39 The
duplex structure reveals that the GNA backbone accommodates the extended size of
the metallo-base pair by transforming the conformation of the hydroxypyridone base
pair.36 The crystal structure and high thermal stability of the GNA duplex containing
the copper (II)-hydroxypyridone base pair demonstrate that the metallo-base pair fits
very well into the overall GNA duplex structure.

Chapter 1.2 Previous work with glycol nucleic acids
14
With those results in mind, a study was proposed whose main goal was to
investigate the properties of chromophore assembly based on GNA backbone.
From the synthesis point of view, the modified GNA nucleotide building blocks
are economically accessible starting from commercially available glycidol, which
provides a promising straightforward methodology for the incorporation of
chromophores into an entire artificial nucleic acid backbone. Thus, the initial goal is
to synthesize a library of modified GNA nucleotide building blocks with
chromophores as artificial bases for the automated solid-phase nucleic acid synthesis.
From the structure point of view, GNA undergoes extensive zipper-like
interstrand interactions and at the same time possesses a reduced intrastrand
base–base stacking interaction. Moreover, the GNA backbone can adjust its
conformation according to the nature of the artificial base pairs. With the features,
GNA duplex architecture may provide challenging opportunities to arrange
chromophores in a controlled and unique fashion. Therefore, the next goal is to use
GNA as a simplified general duplex scaffold for the design of self-assembled and
self-organized functional architectures, and then investigate the properties of
assembled chromophores based on GNA backbone.
Furthermore, considering the usefulness of GNA backbone in the economical and
convenient synthesis of artificial nucleic acid, functional GNA architectures are
expected to evolve into biotechnological tools and used as analogs of DNA in the
medicinal and nanotechnological fields.

Chapter 1.3 References
15
Chapter 1.3 References
1. Hoeben, F. J.M.; Jonkheijm, P.; Meijer, E.W.; Schenning, A. P. H. J. Chemical
Reviews 2005, 105, 1491.
2. Palermo, V.; Schwartz, E.; Finlayson, C. E.; Liscio, A.; Otten, M. B. J.; Trapani,
S.; Müllen,K.; Beljonne, D.; Friend, R. H.; Nolte, R. J. M.; Rowan A. E.; Samori,
P. Advanced Materials 2010, 22, E81.
3. (a) Wasielewski, M. R.; Accounts of Chemical Research 2009, 42, 1910; (b)
Astruc, D.; Boisselier, E.; Ornelas, C. Chemical Reviews 2010, 110, 1857; (c)
Schenning, A. P. H. J.; Meijer, E. W. Chemical Communication 2005, 3245.
4. Schwartz, E.; Gac, S. Le; Cornelissen, J. J. L. M.; Nolte, R. J. M.; Rowan, A. E.
Chemical Society Reviews 2010, 39, 1576.
5. (a) Enthart, E. M.; Wagner, C.; Barbaric, J.; Wagenknecht, H.-A. Tetrahedron,
2007, 63, 3434; (b) Wagenknecht, H.-A. Angewandte Chemie International
Edition 2009, 48, 2838; (c) Varghese, R.; Wagenknecht, H.-A. Chemical
Communication 2009, 2615; (d) Gao, J.; Watanabe, S.; Kool, E. T. Journal of the
American Chemical Society 2004, 126, 12748.
6. Malinovskii, V. L.; Wenger, D.; Häner, R. Chemical Society Reviews 2010, 39,
410.
7. Hannah, K. C.; Armitage, B. A. Accounts of Chemical Research 2004, 37, 845.
8. (a) Uhlmann, E.; Peyman, A. Chemical Reviews 1990, 90, 544-584; (b) Varghese,
R.; Wagenhnecht, H.-A. Chemical Communication 2009, 2615-2624; (c)
Schwartz, E.; Gac, S. L.; Cornelissen, J. J. L. M.; Nolte, R. J. M.; Rowan, A. E.
Chemical Society Reviews 2010, 39, 1576-1599; (d) Bandy, T. J.; Brewer, A.;
Burns, J. R.; Marth, G.; Nguyen, T.; Stulz, E. Chemical Society Reviews
2011,40,138-148.
9. (a) Balaz, M.; Li, B. C.; Steinkruger, J. D.; Ellestad, G. A.; Nakanishi, K.; Berova,
N. Organic and Biomolecular Chemistry 2006, 4, 1865–1867; (b) mammmana,
A.; Pescitelli, G.; Asakawa, T.; Jockusch, S.; Petrovic, A. G.; Monaco, R. R.;

Chapter 1.3 References
16
Purrello, R.; Turro, N. J.; Nakanishi, K.; Ellestad, G. A.; Balaz, M.; Berova, N.
Chemistry – A European Journal 2009, 15, 11853-11866.
10. Mukae, M.; Ihara, T.; Tabara, M.; Jyo, A. Organic and Biomolecular Chemistry
2009, 7, 1349–1354.
11. Winkler, J.; Gilbert, M.; Kocourková, A.; Stessl, M.; Noe, C. R. ChemMedChem
2008, 3, 101-110.
12. Mokhir, A. A.; Tetzlaff, C. N.; Herzberger, S.; Mosbacher, A.; Richert, C.
Journal of Combinatorial Chemistry 2001, 3, 374-386.
13. Fahlman, R. P.; Sen, D. Journal of the American Chemical Society 2002, 124,
4610–4616.
14. Kool, E. T. Accounts of Chemical Research 2002, 35, 936-943.
15. Brotschi, C.; Mathis, G.; Leumann, C. J. Chemistry – A European Journal 2005,
11, 1911-1923.
16. Hainke, S.; Seitz, O. Angewandte Chemie International Edition 2009, 48,
8250-8253.
17. (a) Gao, J. M.; Strässler, C.; Tahmassebi, D.; Kool, E. T. Journal of the American
Chemical Society 2002, 124, 11590-11591; (b) Cuppoletti, A.; Cho, Y. J.; Park,
J.-S.; Strässler, C.; Kool, E. T. Bioconjugate chemistry 2005, 16, 528-534; (c)
Wilson, J. N.; Cho, Y. J.; Tan, S.; Cuppoletti, A.; Kool, E. T. ChemBioChem
2008, 9, 279-285; (d) Wilson, J. N.; Gao, J. M.; Kool, E. T. Tetrahedron, 2007,
63, 3427-3433.
18. Teo, Y. N.; Wilson, J. N.; Kool, E. T. Journal of the American Chemical Society
2009, 131, 3923-3933.
19. Chiba, J.; Takeshima, S.; Mishima, K.; Maeda, H.; Nanai, Y.; Mizuno, K.; Inouye,
M. Chemistry-A European Journal 2007, 13, 8124-8130.
20. (a) Asanuma, H.; Ahirasuka, K.; Komiyama, M. Chemical Letter 2002, 49; (b)
Kashida, H.; Tanaka, M.; Baba, S.; Sakamoto, T.; kawai, H.; Asanuma, H.;
Komiyama, M. Chemistry – A European Journal 2006, 12, 1911-1923.
21. (a) Wagner, C.; Wagenknecht, H.-A. Organic Letter 2006, 8, 419; (b) Baumstark,
D.; Wagenknecht, H.-A. Angewandte Chemie International Edition 2008, 47,

Chapter 1.3 References
17
2612; (c) Baumstark, D.; Wagenknecht, H.-A. Chemistry – A European Journal
2008, 14, 6640.
22. (a) Ackermann, D.; Häner, R. Helvetica Chimica Acta 2004, 87, 2790; (b)
Langenegger, S. M.; Häner, R. ChemBioChem 2005, 6, 2149; (c) Langenegger, S.
M.; Häner, R. Chemical Communcation 2005, 6, 2149; (d) Malinovskii, V. L.;
Samain, F.; Häner, R. Angewandte Chemie International Edition 2007, 46, 4464.
23. (a) Sørensen, M. D.; Petersenb, M.; Wengel, J. Chemical Communication 2003,
2130; (b) Hrdlicka, P. J.; Babu, B. R.; Sørensen, M. D.; Wengel, J. Chemical
Communication 2004, 1487.
24. (a) Vrabel, M.; Horakova, P.; Pivonkova, H.; Kalachova, L.; Cernocka, H.;
Cahova, H.; Pohl, R.; Sebest, P.; Havran, L.; Hocek, M.; Fojta, M. Chemistry – A
European Journal 2009, 15, 1144-1154; (b) Jager, S.; Rasched, G.;
kornreich-Leshem, H.; Engeser, M.; Thum, O.; Famulok, M. Journal of the
American Chemical Society 2005, 127, 15071.
25. (a) Fendt, L.-A.; Bouamaied, I.; Thöni, S.; Amiot, N.; Stulz, E. Journal of the
American Chemical Society 2007, 129, 15319; (b) Bouamaied, I.; Nguyen, T. N.;
Rühl, T.; Stulz, E. Organic & Biomoleculor Chemistry 2008, 6, 3888; (c) Nguyen,
T. N.; Brewer, A.; Stulz, E. Angewandte Chemie International Edition 2009, 48,
1974; (d) Bouamaied, I.; Fendt, L.-A.; Haeussinger, D.; Wiesner, M.; Thoeni, S.;
Amiot, N.; Stulz, E. Nucleotides Nucleic Acids 2007, 26, 1533.
26. Barbaric, J.; Wagenknecht, H.-A.; Organic and Biomolecular Chemistry 2006, 4,
2088–2090.
27. Datta, B.; Schuster, G. B. Journal of the American Chemical Society 2008, 130,
2965.
28. (a) Nakanura, M.; Ohtoshi, Y.; Yamana, K. Chemical Communication 2005, 5163.
(b) Nakanura, M.; Shimomura, Y.; Ohtoshi, Y.; Sasa, K.; Hayashi, H.; Nakano,
H.; Yamana, K. Organic and Biomolecular Chemistry 2007, 5, 1945–1951; (c)
Nakanura, M.; Murakami, Y.; Sasa, K.; Hayashi, H.; Yamana, K. Journal of the
American Chemical Society 2008, 130, 6904.
29. Zhang, L.; Peritz, A.; Meggers, E. Journal of the American Chemical Society

Chapter 1.3 References
18
2005, 127, 4174 –4175.
30. Zhang, L.; Peritz, A. E.; Meggers, E. Synthesis 2006, 645– 653.
31. Schlegel, M. K.; Meggers, E. Journal of Organic Chemistry 2009, 74,
4615–4618.
32. Schlegel, M. K.; Zhang, L.; Pagano, N.; Meggers, E. Organic and Biomolecular
Chemistry 2009, 7, 476–482.
33. Zhang, L.; Peritz, A.; Meggers, E. Journal of the American Chemical Society
2005, 127, 4174 –4175.
34. Schlegel, M. K.; Peritz, A. E.; Kittigowittana, K.; Zhang, L.; Meggers, E.
ChemBioChem 2007, 8, 927–932.
35. Schlegel, M. K.; Meggers, E. Journal of Organic Chemistry 2009, 74,
4615–4618.
36. Schlegel, M. K.; Essen, L.-O.; Meggers, E. Chemical Communication 2010, 46,
1094–1096.
37. Schlegel, M. K.; Zhang, L.; Pagano, N.; Meggers, E. Organic and Biomolecular
Chemistry 2009, 7, 476–482.
38. Tanaka, K.; Tengeiji, A.; Kato, T.; Toyama, N.; Shiro, M.; Shionoya, M. Journal
of the American Chemical Society 2002, 124, 12494 –12498.
39. Switzer, C.; Sinha, S.; Kim, P. H.; Heuberger, B. D. Angewandte Chemie
International Edition 2005, 44, 1529-1532.
40. Schlegel, M. K.; Essen, L.-O.; Meggers, E. Journal of the American Chemical
Society 2008, 130, 8158 –8159.

Chapter 2 Synthesis of chromophore glycol nucleotides
19
Chapter 2 Synthesis of Chromophore Glycol
Nucleotides

Chapter 2.1 Introduction
20
Chapter 2.1 Introduction
Epoxides are widely used as synthetic intermediates and considered as
“spring-loaded” rings for nucleophilic ring-opening reaction.1 The nucleophilic
ring-opening reaction of epoxides provides an efficient approach to convert readily
available, inexpensive chemicals into chiral, nonracemic products.2 A lot of
nucleophiles have been employed successfully in ring-opening reactions, including
carbon-,3-8 nitrogen-,9,10 oxygen-,11 sulphur-,12 halogen-based13 nucleophiles and so
on.
Among those reactions, the nucleophilic ring-opening reaction of epoxides by
carbon-based nucleophiles provides a useful method, which generates new
carbon-carbon σ bonds in a very simple and stereo-defined fashion. Epoxides can be
successfully alkylated by various organometallic reagents, such as
organomagnesium,3 organolithium,4 organocopper,5 organozinc,6 organoaluminum,7
organolanthanide8 compounds.
It is convenient to start from the enantiomerically enriched terminal epoxides and
allow them to react with the necessary carbon nucleophiles in a regioselective fashion
to offer enantiopure alcohols. This method has been widely used in the natural
products synthesis, where organocopper reagents alkylate enantiopure terminal
epoxides to give useful products.14
In this study, we describe the synthesis of glycol nucleoside phosphoramidites
GNA building blocks of different chromophores, which was based on the nucleophilic
ring-opening reaction of dimethoxytritylated (S)-glycidol by carbon nucleophiles.

Chapter 2.2 Synthesis of glycol nucleoside phosphoramidites
21
Chapter 2.2 The synthesis of glycol nucleoside phosphoramidites
based on the nucleophilic ring-opening of epoxides
Based on the nucleophilic ring-opening reaction of epoxides by carbon
nucleophiles, the synthesis of chromophore glycol nucleosides is involved three
methods: (1) the application of Grignard reagents, (2) the application of Grignard
reagents containing a metallation/transmetallation protocol, (3) the application of
organolithium reagents.
1. The application of Grignard reagents
The nucleophilic ring-opening reaction of epoxides by Grignard reagents is a
widely used method for generating new carbon-carbon σ bonds.3 Scheme 2.1 shows
the general synthesis of glycol nucleoside phosphoramidites, which was based on the
copper(I)-catalyzed reaction of Grignard reagents with epoxide.
Scheme 2.1 The general synthesis of glycol nucleoside phosphoramidites based on Grignard reagents.
Grignard reagents in this study are formed via the reaction of the corresponding
aryl bromide with magnesium metal. In the presence of I2, bromobezene (4a),
3-bromobiphyenyl (4b), 4-bromobiphyenyl (4c), 4-bromonaphthalene (4d) and
9-bromophenanthrene (4e) were converted into Grignard reagents successfully by
reacting with magnesium in THF, respectively. Being catalyzed with CuI, the
resulting Grignard reagents underwent a regioselective and stereospecific
ring-opening with dimethoxytrityliated (S)-glycidol (3)7 at -40 oC to afford the ring

Chapter 2.2 Synthesis of glycol nucleoside phosphoramidites
22
opening products 5a (85%), 5b (73%), 5c (74%), 5d (61%) and 5e (65%),
respectively. Then, compound 5 followed by the reaction with phosphoramidite
reagent 6 in the presence of Hünig’s base to afford the phosphoramidite product 7a
(84%), 7b (85%), 7c (85%), 7d (80%) and 7e (78%), respectively.
Table 2.1 The synthesis of glycol nucleoside phosphoramidites based on Grignard reagents.
Entry Substrate Ring-opening
product (yield %)
Phosphoramidite product
(yield %)
R-Br R
1 4a
5a (85) 7a (84)
2 4b
5b (73) 7b (85)
3 4c
5c (74) 7c (85)
4 4d
5d (61) 7d (80)
5 4e
5e (65) 7e (78)
As shown in table 2.1, glycol nucleoside phosphoramidite building blocks of
benzene 7a, biphyenyl 7b, biphyenyl 7c, naphthalene 7d and phenanthrene 7e were
obtained in two steps from dimethoxytritylated (S)-glycidol (3) with overall yields of
71%, 62%, 63%, 49% and 51%, respectively.

Chapter 2.2 Synthesis of glycol nucleoside phosphoramidites
23
2. The application of Grignard reagents containing a
metallation/transmetallation protocol
Although ring-opening reaction of epoxide 3 by Grignard reagents is efficient to
produce the precursors of phosphoramidites, there is a few of aryl bromide
compounds that could not be converted into Grignard reagents directly by reacting
with magnesium metal, such as 2-bromoanthracene or 1-bromopyrene. However, as
shown in scheme 2.2, a Grignard reagent could be formed by reacting of
organolithium compound and one equivalent of magnesium halide (scheme 2.2).1 This
transmetallation method may provide access to Grignard reagents that are difficult to
prepare directly.
Scheme 2.2 The formation of Grignard reagent by transmetallation reaction.
A protocol containing metallation/transmetallation sequence was applied to
produce the desired Grignard reagents of 2-bromoanthracene (8a)16 and
1-bromopyrene (8b).17 Scheme 2.3 shows the general synthesis of glycol nucleoside
phosphoramidites based on Grignard reagents containing a
metallation/transmetallation sequence.
Scheme 2.3 The general synthesis of glycol nucleoside phosphoramidites based on Grignard reagents containing a metallation/transmetallation sequence.
As shown in Scheme 2.3, compound 8 was first converted into lithium species by
reacting with n-BuLi at -78 oC in THF. The lithium species was subsequently

Chapter 2.2 Synthesis of glycol nucleoside phosphoramidites
24
transmetallated into a Grignard reagent by treatment with freshly prepared MgBr2
(synthesized from Mg turnings and 1, 2-dibromoethane). In the presence of CuI, the
resulting solution underwent a regioselective and stereospecific ring-opening reaction
with epoxide 3 to afford the compounds 9a and 9b in yields of 53% and 50%,
respectively. The subsequent reaction with the phosphoramidite reagents 6 in the
presence of Hünig’s base afforded phosphoramidite products 10a and 10b in yields of
69% and 84%, respectively.
Table 2.2 The synthesis of glycol nucleoside phosphoramidites based on Grignard reagents containing a metallation/transmetallation sequence.
Entry Substrate Ring-opening
product (yield %)
Phosphoramidite product
(yield %)
R-Br R
1 8a
9a (53) 10a (69)
2 8b
9b (50) 10b (84)
Altogether, through the application of Grignard reagents containing a
metallation/transmetallation sequence in the ring-opening reaction, the glycol
nucleoside phosphoramidite GNA building blocks of 10a and 10b were synthesized in
two steps from dimethoxytritylated (S)-glycidol (3) with overall yields of 37% and
42%, respectively.
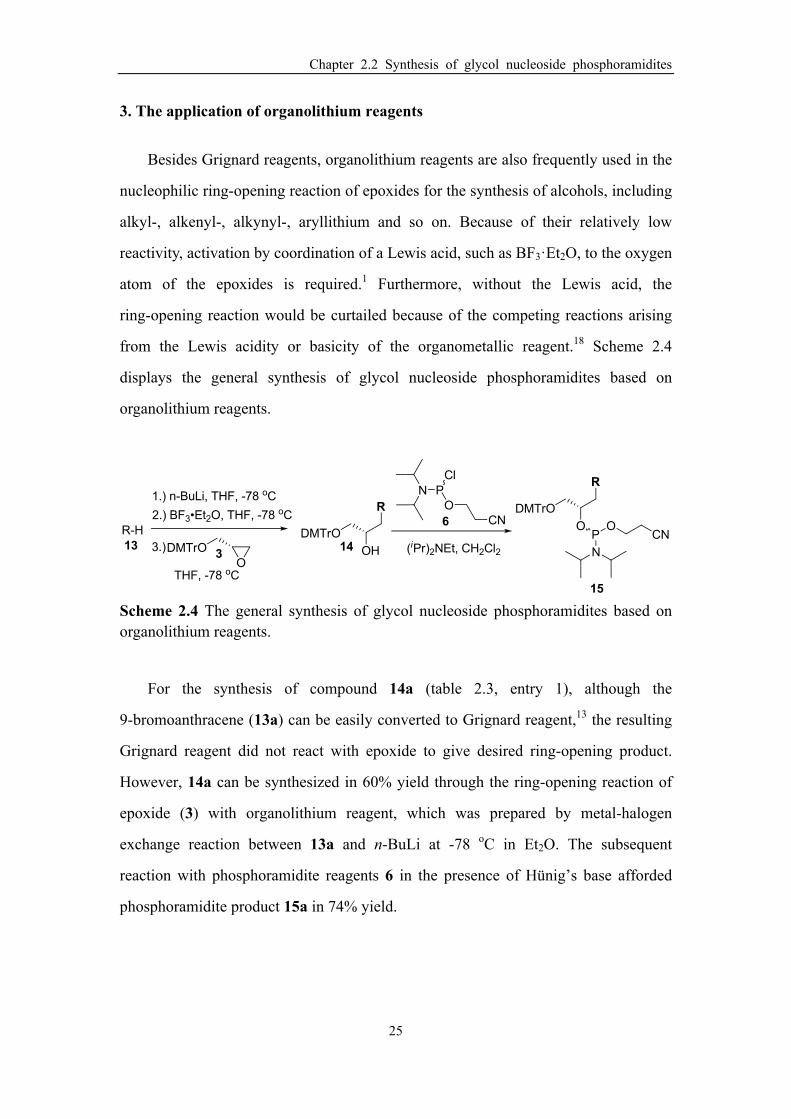
Chapter 2.2 Synthesis of glycol nucleoside phosphoramidites
25
3. The application of organolithium reagents
Besides Grignard reagents, organolithium reagents are also frequently used in the
nucleophilic ring-opening reaction of epoxides for the synthesis of alcohols, including
alkyl-, alkenyl-, alkynyl-, aryllithium and so on. Because of their relatively low
reactivity, activation by coordination of a Lewis acid, such as BF3·Et2O, to the oxygen
atom of the epoxides is required.1 Furthermore, without the Lewis acid, the
ring-opening reaction would be curtailed because of the competing reactions arising
from the Lewis acidity or basicity of the organometallic reagent.18 Scheme 2.4
displays the general synthesis of glycol nucleoside phosphoramidites based on
organolithium reagents.
i
Scheme 2.4 The general synthesis of glycol nucleoside phosphoramidites based on organolithium reagents.
For the synthesis of compound 14a (table 2.3, entry 1), although the
9-bromoanthracene (13a) can be easily converted to Grignard reagent,13 the resulting
Grignard reagent did not react with epoxide to give desired ring-opening product.
However, 14a can be synthesized in 60% yield through the ring-opening reaction of
epoxide (3) with organolithium reagent, which was prepared by metal-halogen
exchange reaction between 13a and n-BuLi at -78 oC in Et2O. The subsequent
reaction with phosphoramidite reagents 6 in the presence of Hünig’s base afforded
phosphoramidite product 15a in 74% yield.

Chapter 2.2 Synthesis of glycol nucleoside phosphoramidites
26
Table 2.3 The synthesis of glycol nucleoside phosphoramidites based on organolithium reagents.
Entry Substrate Ring-opening
Product (yield %)
Phosphoramidite product
(yield %)
R
1 13a
(R-Br)
14a (60) 15a (74)
2 13b
(R-H)
14b (73) 15b (79)
Furthermore, the application of organolithium reagents in ring-opening reaction,
including but not limited for halide compounds. The deprotonation of organic
compounds with an organolithium species, such as n-BuLi, has been widely used as a
method for the preparation of organolithium reagent. A few of organic compounds
containing acidic proton had been used in the ring-opening reaction of epoxides.
For the synthesis of compound 14b (table 2.3, entry 2), 9H-fluorene (13b) was
first deprotonated with n-BuLi at -78 oC in THF, the resulting organolithium reagents
then reacted with epoxide 3 in the presence of BF3·Et2O at -78 oC to afford the
ring-opening product 14b in 73% yield. Finally, 14b reacted with phosphoramidite
reagents 6 to afford product 15b in 79% yield.
Alkynyllithium reagents were also used in the ring-opening reaction of expoxides.
Because of their mild acidity, terminal alkynes are easily deprotonated by n-BuLi to
form alkynyllithium reagent. As shown in table 2.4, 1-ethynylpyrene (16a)19 and
3-ethynylperylene (16b)20 were first deprotonated with n-BuLi at -78 oC in THF.
Then, the resulting organolithium reagents reacted with epoxide 3 in the presence of
BF3·Et2O at -78 oC to afford the ring-opening products 17a and 17b in yields of 77%
and 78%, respectively. Subsequently, these ring-opening products followed by the
reaction with phosphoramidite reagent 6 in the presence of Hünig’s base to afford the

Chapter 2.2 Synthesis of glycol nucleoside phosphoramidites
27
phosphoramidites 18a (68%) and 18b (86%), respectively.
Thus, the compound which can be introduced alkyne group can be used to
synthesize glycol nucleoside by this method.
Table 2.4 The synthesis of glycol nucleoside phosphoramidites based on alkynyllithium reagents.
Entry Substrate Ring-opening
Product (yield %)
Phosphoramidite product
(yield %)
R-H R
1 16a
17a (77) 18a (68)
2 16b
17b (78) 18b (86)
3 16c
17c (26) 18c (74)
However, by using this method, the ring-opening product 17c was synthesized in
only 26% yield starting from 5-ethynyl-10,20-diphenylporphinatozinc (16c), the low
yield makes scale up very challenging. This low yield might be resulted from the
inefficient formation of alkynyllithium reagent by treating 16c with n-BuLi. The
strong base n-BuLi may cause the decomposition of 16c, because the starting material
16c as well as the corresponding free porphyrin were not separated from the reaction
mixture.

Chapter 2.2 Synthesis of glycol nucleoside phosphoramidites
28
Scheme 2.5 Synthesis of ring-opening compound 17c.
Another route was also tried to synthesize the compound 17c. As shown in
scheme 2.5, dimethoxytrityliated (S)-glycidol (3), that was reacted with trimethylsilyl
acetylene (16d) in the presence of n-BuLi and BF3·Et2O to produce the acetylenic
alcohol 17s (70%) in a regioselective and stereospecific epoxide ring-opening fashion.
After removal of the TMS group of 17s with TBAF (98%), a Pd-catalyzed
Sonogashira coupling reaction of 5-bromo-10,20-diphenylporphinatozinc (30)21 with
compound 17d afforded compound 17c smoothly in 95% yield. Further reaction with
compound 6 in the presence of Hünig’s base yielded the phosphoramidite building
block 18c (74%).
Overall, the fluorene phosphoramidite building block 15a, 9-substituted
anthracene building block 15b, ethynylpyrene building block 18a and ethynylperylene
building block 18b were synthesized in two steps from dimethoxytritylated
(S)-glycidol (3) with overall yields of 52%, 58%, 52% and 67%, respectively.
Porphyrin acetylide phosphoramidite 18c was synthesized in four steps from epoxide
3 with an overall yield of 48%.

Chapter 2.3 Conclusions
29
Chapter 2.3 Conclusions
In this chapter, we presented the synthesis of chromophore glycol nucleotides.
The key step of phosphoramidite synthesis was the regioselective and stereospecific
ring-opening reaction of dimethoxytrityliated (S)-glycidol. The phosphoramidite
precursors were synthesized by three efficient methods, namely, the application of
Grignard reagents, Grignard reagents containing a metallation/transmetallation
protocol and organolithum reagents. Subsequently, the precursors were converted to
glycol nucleoside phosphoramidites GNA building blocks in high yields. Thus, we
here demonstrated that GNA duplexes are very useful scaffolds for the economical
synthesis of modified nucleotide.

Chapter 2.4 Experimental
30
Chapter 2.4 Experimental
General procedures and reagents. NMR spectra were recorded on a Brucker
AVANCE 300 and Brucker DRX 500. Low-resolution mass spectra were obtained on
an LC platform from Agilent using ESI technique. Highresolution mass spectra were
obtained on a Thermo Finnigan LTQ FT instrument using APCI ionization. Infrared
spectra were recorded on a Brucker “Alpha-P” FT-IR spectrometer. HPLC was
performed using an Agilent technologies 1200 series instrument with fraction
collection. All non-aqueous operations were carried out under dry nitrogen
atmosphere. Solvents and reagents were used as supplied from Aldrich, Alfa Aesar or
Acros.
Compound 3 To a solution of (R)-(+)-glycidol (1) (1.21 g, 16.3 mmol) and Et3N (6.3
mL, 47.5 mmol) in CH2Cl2 (47 mL) was added DMTrCl (2) (6.64 g, 19.6 mmol).
After 12 h, the reaction mixture was poured into sat. aq NaHCO3 (60 mL). The
organic layer was envaporated, the residue was dissolved in EtOAc, washed with aq
sat. NaHCO3, and purified by chromatography over silica gel eluting with
hexanes/EtOAc/Et3N (10:1:0.01), affording compound 3 as an colorless oil (6.1 g,
quantitative yield). 1H NMR (300 MHz, CDCl3): δ = 7.47 (m, 2H), 7.35 (m, 4H), 7.29
(m, 2H), 7.21 (m, 1H), 6.84 (m, 4H), 3.79 (s, 6H), 3.32 (dd, J = 9.9, 2.2 Hz, 1H),
3.17-3.10 (m, 2H), 2.78 (dd, J = 5.0, 4.2 Hz, 1H), 2.63 (dd, J = 5.1, 2.5 Hz, 1H).
Spectroscopic data is in agreement with reference.23

Chapter 2.4 Experimental
31
Compound 5a To a suspention of copper iodide (0.04 g, 0.21 mmol) in THF (1 mL)
at -40 oC was added dropwise Grignard reagent [made as follows: to a magnesium
turnings (0.04 g, 1.73 mmol) and slurry of I2 in THF (3.46 mL) was added dropwise
bromobenzene (4a) (0.17 mL, 1.56 mmol), then the resulting mixture was stirred at
room temperature for 30 min]. After stirring for 30 min at -40 oC, epoxide (0.39 g,
1.05 mmol) in THF (2.1 mL) was added dropwise and stirring was continued at the
same temperature for 1 hours. The solution was warmed to 0 oC, stirred for another 1
hour, and the reaction mixture was poured into saturated NaHCO3 and extracted with
CH2Cl2 (3 × 50 mL). The combined organic extracts were dried over anhydrous
Na2SO4, concentrated in vacuo, and the resulting oil was purified by chromatography
over silica gel eluting with hexanes/ethyl acetate/triethylamine (5:1:0.01), affording
compound 5a as a colorless foam (0.40g, 85%). 1H NMR (300 MHz, CDCl3): δ =
7.35 (d, J = 8.1 Hz, 2H), 7.24 (m, 4H), 7.19-7.08 (m, 6H), 7.04 (m, 2H), 6.74 (d, J =
8.9 Hz, 4H), 7.89 (m, 1H), 3.71 (s, 6H), 3.12 (dd, J = 9.6, 4.3 Hz, 2H), 3.05 (dd, J =
9.5, 6.4 Hz, 2H), 2.70 (m, 2H), 2.17 (d, J = 4.4 Hz, 1H). 13C NMR (75 MHz, CDCl3):
δ = 158.53, 144.83, 138.12, 136.03, 130.06, 129.29, 128.35, 128.16, 127.83, 126.82,
126.30, 113.23, 113.14, 86.17, 71.94, 66.58, 55.22, 40.15. IR (thin film): 3058, 3029,
2930, 2835, 1735, 1606, 1581, 1507, 1462, 1444, 1413, 1372, 1299, 1245, 1174,
1154,113, 1072, 1031, 982, 950, 910, 826, 790, 774, 753, 727, 700, 634, 620, 582,
553, and 530 cm-1. HRMS: m/z [M +] calcd for C30H30O4: 454.2139 ; found: 454.2126.

Chapter 2.4 Experimental
32
Compound 7a To a solution of 5a (0.4 g, 0.89 mmol) and N,N-diisopropylethylamine
(0.89 mL, 4.74 mmol) in CH2Cl2 (15 mL) was added compound 6 (0.40 mL, 1.78
mmol). After 2 h, the reaction mixture was poured into sat. aq. NaHCO3 (30 mL) and
extracted with CH2Cl2 (3 × 30 mL). The combined organic layers were evaporated
and the residue was purified by chromatography over silica gel eluting with
hexanes/ethyl acetate/triethylamine (5:1:0.01), affording 7a as a colorless foam (0.49
g, 84%). 31P NMR (161.9 MHz, CDCl3): δ = 149.30, 148.12. IR (thin film): 2965,
2931, 2872, 2836, 1607, 1581, 1508, 1462, 1364, 1299, 1248, 1176, 1153, 1125, 1033,
975, 876, 726, 582 and 523 cm-1. HRMS: m/z [M + H+] calcd for C39H48N2O5P1:
655.3295; found: 655.3269.
Compound 5b To a suspention of copper iodide (0.05 g, 0.28 mmol) in THF (1 mL)
at -40 oC was added dropwise Grignard reagent [made as follows: to a magnesium
turnings (0.05 g, 2.27 mmol) and slurry of I2 in THF (4 mL) was added
3-bromobiphenyl (4b) (0.35 mL, 2.07 mmol), then the resulting mixture was stirred at
room temperature for 30 min]. After stirring for 30 min at -40 oC, epoxide (0.52 g,
1.34 mmol) in THF (2.8 mL) was added dropwise and stirring was continued at the
same temperature for 1 hours. The solution was warmed to 0 oC, stirred for another 1
hour, and the reaction mixture was poured into saturated NaHCO3 and extracted with

Chapter 2.4 Experimental
33
CH2Cl2 (3 × 50 mL). The combined organic extracts were dried over anhydrous
Na2SO4, concentrated in vacuo, and the resulting oil was purified by chromatography
over silica gel eluting with hexanes/ethyl acetate/triethylamine (5:1:0.01), affording
compound 5c as a colorless foam (0.53 g, 73%). 1H NMR (300 MHz, CDCl3): δ =
7.54 (d, J = 8.0 Hz, 2H), 7.45-7.27 (m, 13H), 7.25-7.11 (m, 3H), 6.80 (d, J = 9.0 Hz,
4H), 4.02 (m, 1H), 3.77 (s, 6H), 3.22 (dd, J = 9.4, 4.1 Hz, 1H), 3.15 (dd, J = 9.4, 6.5
Hz, 1H), 2.86 (m, 2H), 2.71 (d, J = 4.4 Hz, 2H). 13C NMR (75MHz, CDCl3): δ =
158.54, 144.88, 144.33, 141.18, 138.63, 136.06, 130.06, 128.78, 128.71, 128.28,
128.17, 127.85, 127.23, 127.19, 126.84, 125.22, 113.16, 86.22, 66.72, 60.40, 55.21,
40.26, 21.04. IR (thin film): 3055, 3033, 2999, 2869, 1606, 1579,1507, 1480, 1462,
1443, 1299, 1246, 1174, 1074, 1031, 982, 902, 826, 755, 726, 698, 582 and 529 cm-1.
HRMS: m/z [M + K+] calcd for C36H34O4K1: 569.2089; found: 569.2085.
Compound 7b To a solution of 5b (0.4 g, 0.78 mmol) and
N,N-diisopropylethylamine (0.34 mL, 4.11 mmol) in CH2Cl2 (13 mL) was added
compound 6 (0.34 mL, 1.56 mmol). After 2 h, the reaction mixture was poured into
sat. aq. NaHCO3 (40 mL) and extracted with CH2Cl2 (3 × 40 mL). The combined
organic layers were evaporated and the residue was purified by chromatography over
silica gel eluting with hexanes/ethyl acetate/triethylamine (5:1:0.01), affording 7c as a
colorless foam (0.47 g, 85%). 31P NMR (161.9 MHz, CDCl3): δ = 149.00, 148.40. IR
(thin film): 2964, 2930, 2873, 2835, 1607, 1508, 1248, 1176, 1030, 976, 827, 761,
697, 582 and 516 cm-1. HRMS: m/z [M+] calcd for C45H52N2O5P1: 731.3608; found:
731.3602.

Chapter 2.4 Experimental
34
Compound 5c To a suspention of copper iodide (0.09 g, 0.47 mmol) in THF (1 mL)
at -40 oC was added dropwise Grignard reagent [made as follows: to a magnesium
turnings (0.09 g, 3.85 mmol) and slurry of I2 in THF (10 mL) was added
4-bromobiphenyl (4c) (0.82 g, 3.50 mmol), then the resulting mixture was stirred at
room temperature for 30 min]. After stirring for 30 min at -40 oC, epoxide (0.88 g,
2.32 mmol) in THF (4.6 mL) was added dropwise and stirring was continued at the
same temperature for 1 hours. The solution was warmed to 0 oC, stirred for another 1
hour, and the reaction mixture was poured into saturated NaHCO3 and extracted with
CH2Cl2 (3 × 50 mL). The combined organic extracts were dried over anhydrous
Na2SO4, concentrated in vacuo, and the resulting oil was purified by chromatography
over silica gel eluting with hexanes/ethyl acetate/triethylamine (5:1:0.01), affording
compound 5c as a colorless foam (0.92 g, 74%). 1H NMR (300 MHz, CDCl3): δ =
7.49 (d, J = 8.0 Hz, 2H), 7.37 (m, 6H), 7.28-7.18 (m, 7H), 7.17-7.09 (m, 3H), 6.75 (d,
J = 9.0 Hz, 4H), 3.93 (m, 1H), 3.70 (s, 6H), 3.15 (dd, J = 9.4, 6.4 Hz, 1H), 3.07 (dd,
J = 9.4, 6.4 Hz, 1H), 2.75 (m, 2H). 13C NMR (75MHz, CDCl3): δ = 158.57, 144.86,
141.04, 139.26, 137.27, 136.03, 130.11, 129.74, 128.75, 128.20, 127.88, 127.40,
126.87, 113.18, 86.23, 55.22, 39.80. IR (thin film): 3047, 2922, 1585, 1505, 1385,
1304, 1239, 1169, 1078, 1051, 940, 829, 763, 707, and 590 cm-1. HRMS: m/z [M + K+]
calcd for C36H34O4K1: 569.2089; found: 569.2081.

Chapter 2.4 Experimental
35
Compound 7c To a solution of 5c (0.5 g, 0.99 mmol) and N,N-diisopropylethylamine
(0.99 mL, 5.26 mmol) in CH2Cl2 (16 mL) was added compound 6 (0.44 mL, 1.98
mmol). After 2 h, the reaction mixture was poured into sat. aq. NaHCO3 (40 mL) and
extracted with CH2Cl2 (3 × 40 mL). The combined organic layers were evaporated
and the residue was purified by chromatography over silica gel eluting with
hexanes/ethyl acetate/triethylamine (5:1:0.01), affording 7c as a colorless foam (0.60
g, 85%). 31P NMR (161.9 MHz, CDCl3): δ = 148.93, 148.84. IR (thin film): 2964,
2930, 2873, 2835, 1607, 1508, 1248, 1176, 1030, 976, 827, 761, 697, 582 and 516
cm-1. HRMS: m/z [M+] calcd for C45H52N2O5P1: 731.3603; found: 731.3608.
Compound 5d To a suspention of copper iodide (0.09 g, 0.45 mmol) in THF (1 mL)
at -40 oC was added dropwise Grignard reagent [made as follows: to a magnesium
turnings (0.04 g, 1.65 mmol) and slurry of I2 in THF (4 mL) was added
1-bromonaphthalene (4d) (0.31 g, 1.50 mmol), then the resulting mixture was stirred
at room temperature for 30 min]. After stirring for 30 min at -40 oC, epoxide (0.38 g,
1.00 mmol) in THF (2 mL) was added dropwise and stirring was continued at the
same temperature for 1 hours. The solution was warmed to 0 oC, stirred for another 1
hour, and the reaction mixture was poured into saturated NaHCO3 and extracted with

Chapter 2.4 Experimental
36
CH2Cl2 (3 × 50 mL). The combined organic extracts were dried over anhydrous
Na2SO4, concentrated in vacuo, and the resulting oil was purified by chromatography
over silica gel eluting with hexanes/ethyl acetate/triethylamine (5:1:0.01), affording
compound 5d as a colorless foam (0.37 g, 64%). 1H NMR (300 MHz, CDCl3): δ =
7.75 (m, 3H), 7.58 (s, 1H), 7.44 (m, 4H), 7.33-7.18 (m, 8H), 6.82 (d, J = 9.1 Hz, 4H),
4.06 (m, 1H), 3.78 (s, 6H), 3.23 (dd, J = 9.4, 4.2 Hz, 1H), 3.17 (dd, J = 9.4, 6.2 Hz,
1H), 2.96 (m, 2H), 2.77 (d, J = 4.5 Hz, 1H). 13C NMR (75MHz, CDCl3): δ = 158.57,
144.95, 144.67, 136.11, 135.78, 134.34, 133.96, 132.18, 130.13, 128.78, 128.23,
127.87, 127.51, 127.21, 126.86, 125.92, 125.54, 125.42, 123.92, 113.18, 86.34, 71.31,
67.00, 60.42, 55.23, 37.45. IR (thin film): 3055, 3000, 2930, 2835, 1734, 1606, 1581,
1507, 1462, 1444, 1413, 1396, 1372, 1299, 1245, 1174, 1154, 1113, 1070, 1030, 981,
951, 908, 826, 790, 776, 754, 726, 701, 635, 618, 582 and 525 cm-1. HRMS: m/z [M+]
calcd for C34H32O4: 504.2295; found: 504.2280.
Compound 7d To a solution of 5d (0.18 g, 0.31 mmol) and
N,N-diisopropylethylamine (0.81 mL, 3.63 mmol) in CH2Cl2 (5 mL) was added
compound 6 (0.10 mL, 0.46 mmol). After 2 h, the reaction mixture was poured into
sat. aq. NaHCO3 (40 mL) and extracted with CH2Cl2 (3 × 40 mL). The combined
organic layers were evaporated and the residue was purified by chromatography over
silica gel eluting with hexanes/ethyl acetate/triethylamine (5:1:0.01), affording 7c as a
colorless foam (0.21 g, 97%). 31P NMR (161.9 MHz, CDCl3): δ = 147.64, 147.15. IR
(thin film): 2931, 2874, 2793, 2267, 2237, 2200, 1607, 1581, 1508, 1445, 1396, 1364,
1299, 1248, 1176, 1155, 1073, 1032, 976, 878, 777 and 583 cm-1. HRMS: m/z [M +
H+] calcd for C43H50N2O5P1: 705.3452; found: 705.3422.

Chapter 2.4 Experimental
37
Compound 5e To a suspention of copper iodide (0.05 g, 0.25 mmol) in THF (2.5 mL)
at -40 oC was added dropwise Grignard reagent [made as follows: to a magnesium
turnings (0.05 g, 2.08 mmol) and slurry of I2 in THF (3.8 mL) was added
9-bromophenanthrene (4e) (0.49 g, 1.90 mmol), then the resulting mixture was stirred
at room temperature for 30 min]. After stirring for 30 min at -40 oC, epoxide (0.48 g,
1.27 mmol) in THF (2.5 mL) was added dropwise and stirring was continued at the
same temperature for 1 hours. The solution was warmed to 0 oC, stirred for another 1
hour, and the reaction mixture was poured into saturated NaHCO3 and extracted with
CH2Cl2 (3 × 50 mL). The combined organic extracts were dried over anhydrous
Na2SO4, concentrated in vacuo, and the resulting oil was purified by chromatography
over silica gel eluting with hexanes/ethyl acetate/triethylamine (5:1:0.01), affording
compound 5e as a colorless foam (0.46 g, 65%). 1H NMR (300 MHz, CDCl3): δ =
8.73 (d, J = 8.0 Hz, 1H), 8.65 (d, J = 8.2 Hz, 1H), 8.09 (d, J = 7.8 Hz, 1H), 7.78 (d,
J = 7.4 Hz, 1H), 7.54-7.70 (m, 5H), 7.47 (d, J = 8.8 Hz, 2H), 7.17-7.37 (m, 6H), 6.80
(d, J = 8.5 Hz, 4H), 4.2 (m, 1H), 3.78 (s, 6H), 3.42 (m, 1H), 3.30 (m, 2H), 3.21 (dd, J
= 7.6, 14.0 Hz, 1H). 13C NMR (75 MHz, CDCl3): δ = 158.55, 144.96, 136.01, 132.46,
131.63, 131.25, 130.81, 130.10, 129.90, 128.20, 128,18, 127.96, 127.85, 126.84,
126.60, 126.26, 126.22, 124.53, 123.24, 122.42, 113.16, 86.36, 70.80, 66.98, 55.20,
37.98. IR (thin film): 3412 (br), 2999, 1605, 1506, 1444, 1299, 1245, 1117, 1069,
1030, 901, 826, 747, 725, 700, 582, 526 and 509 cm-1. HRMS: m/z [M + K+] calcd for
C38H34O4K1: 593.2089; found: 593.2084.

Chapter 2.4 Experimental
38
Compound 7e To a solution of 5e (0.24 g, 0.44 mmol) and
N,N-diisopropylethylamine (0.44 mL, 2.34 mmol) in CH2Cl2 (7.2 mL) was added
compound 6 (0.20 mL, 0.88 mmol). After 2 h, the reaction mixture was poured into
sat. aq. NaHCO3 (40 mL) and extracted with CH2Cl2 (3 × 40 mL). The combined
organic layers were evaporated and the residue was purified by chromatography over
silica gel eluting with hexanes/ethyl acetate/triethylamine (5:1:0.01), affording 7e as a
colorless foam (0.25 g, 78%). 31P NMR (121 MHz, CDCl3): δ = 148.99. 148.42. IR
(thin film): 2963, 1606, 1461, 1445, 1363, 1300, 1247, 1175, 1075, 1031, 975, 945,
876, 827, 748, 725, 701, 582, 511 cm-1. HRMS: m/z [M + H+] calcd for C47H52N2O5P1:
755.3608; found: 755.3601.
Scheme 2.6 The synthesis of 2-bromoanthracene (8a).
Compound 12 Cupric bromide (17.87 g, 80.0 mmol, 2 equiv.) was dissolved in
CH3CN (96 mL) in a 500 mL flask. tert-Butyl nitrite (9.64 mL) was added to the
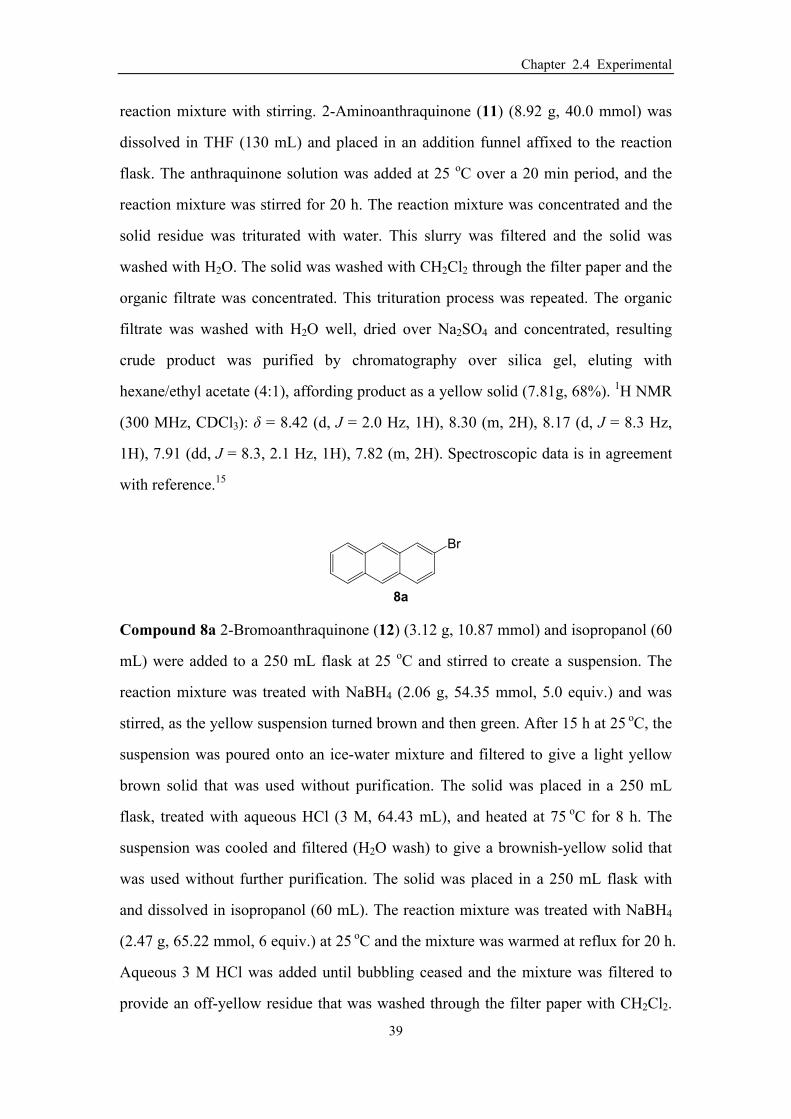
Chapter 2.4 Experimental
39
reaction mixture with stirring. 2-Aminoanthraquinone (11) (8.92 g, 40.0 mmol) was
dissolved in THF (130 mL) and placed in an addition funnel affixed to the reaction
flask. The anthraquinone solution was added at 25 oC over a 20 min period, and the
reaction mixture was stirred for 20 h. The reaction mixture was concentrated and the
solid residue was triturated with water. This slurry was filtered and the solid was
washed with H2O. The solid was washed with CH2Cl2 through the filter paper and the
organic filtrate was concentrated. This trituration process was repeated. The organic
filtrate was washed with H2O well, dried over Na2SO4 and concentrated, resulting
crude product was purified by chromatography over silica gel, eluting with
hexane/ethyl acetate (4:1), affording product as a yellow solid (7.81g, 68%). 1H NMR
(300 MHz, CDCl3): δ = 8.42 (d, J = 2.0 Hz, 1H), 8.30 (m, 2H), 8.17 (d, J = 8.3 Hz,
1H), 7.91 (dd, J = 8.3, 2.1 Hz, 1H), 7.82 (m, 2H). Spectroscopic data is in agreement
with reference.15
Compound 8a 2-Bromoanthraquinone (12) (3.12 g, 10.87 mmol) and isopropanol (60
mL) were added to a 250 mL flask at 25 oC and stirred to create a suspension. The
reaction mixture was treated with NaBH4 (2.06 g, 54.35 mmol, 5.0 equiv.) and was
stirred, as the yellow suspension turned brown and then green. After 15 h at 25 oC, the
suspension was poured onto an ice-water mixture and filtered to give a light yellow
brown solid that was used without purification. The solid was placed in a 250 mL
flask, treated with aqueous HCl (3 M, 64.43 mL), and heated at 75 oC for 8 h. The
suspension was cooled and filtered (H2O wash) to give a brownish-yellow solid that
was used without further purification. The solid was placed in a 250 mL flask with
and dissolved in isopropanol (60 mL). The reaction mixture was treated with NaBH4
(2.47 g, 65.22 mmol, 6 equiv.) at 25 oC and the mixture was warmed at reflux for 20 h.
Aqueous 3 M HCl was added until bubbling ceased and the mixture was filtered to
provide an off-yellow residue that was washed through the filter paper with CH2Cl2.
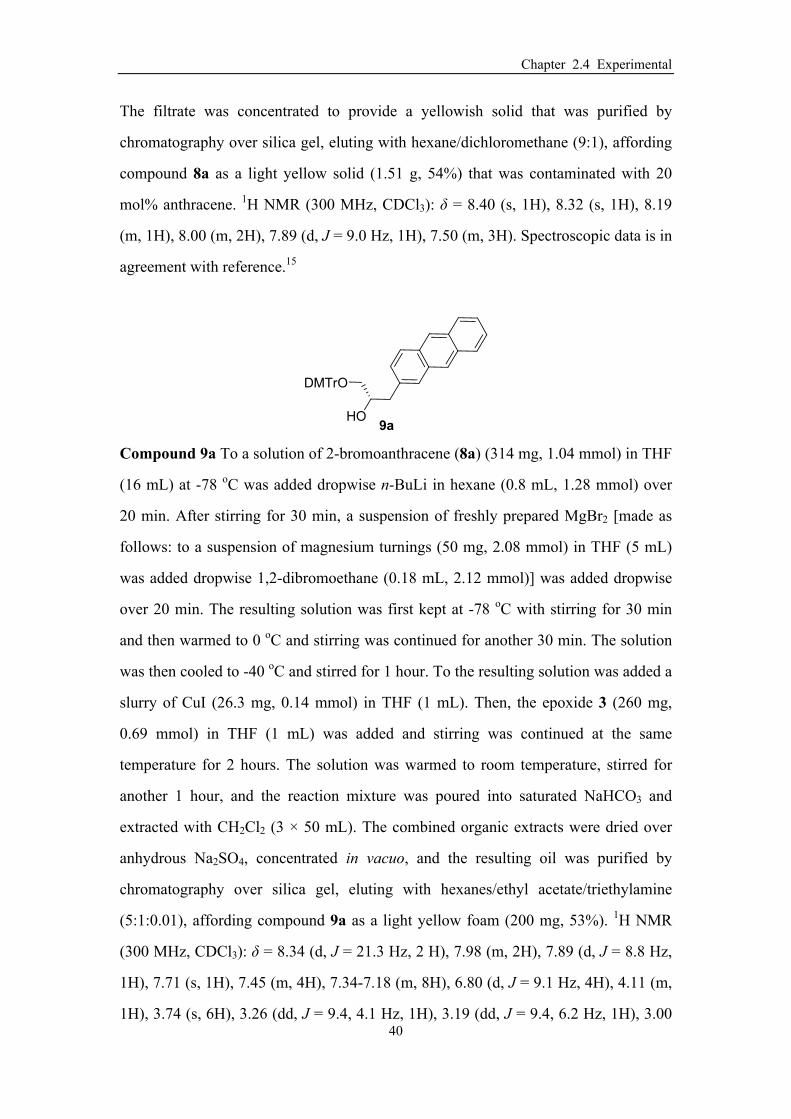
Chapter 2.4 Experimental
40
The filtrate was concentrated to provide a yellowish solid that was purified by
chromatography over silica gel, eluting with hexane/dichloromethane (9:1), affording
compound 8a as a light yellow solid (1.51 g, 54%) that was contaminated with 20
mol% anthracene. 1H NMR (300 MHz, CDCl3): δ = 8.40 (s, 1H), 8.32 (s, 1H), 8.19
(m, 1H), 8.00 (m, 2H), 7.89 (d, J = 9.0 Hz, 1H), 7.50 (m, 3H). Spectroscopic data is in
agreement with reference.15
Compound 9a To a solution of 2-bromoanthracene (8a) (314 mg, 1.04 mmol) in THF
(16 mL) at -78 oC was added dropwise n-BuLi in hexane (0.8 mL, 1.28 mmol) over
20 min. After stirring for 30 min, a suspension of freshly prepared MgBr2 [made as
follows: to a suspension of magnesium turnings (50 mg, 2.08 mmol) in THF (5 mL)
was added dropwise 1,2-dibromoethane (0.18 mL, 2.12 mmol)] was added dropwise
over 20 min. The resulting solution was first kept at -78 oC with stirring for 30 min
and then warmed to 0 oC and stirring was continued for another 30 min. The solution
was then cooled to -40 oC and stirred for 1 hour. To the resulting solution was added a
slurry of CuI (26.3 mg, 0.14 mmol) in THF (1 mL). Then, the epoxide 3 (260 mg,
0.69 mmol) in THF (1 mL) was added and stirring was continued at the same
temperature for 2 hours. The solution was warmed to room temperature, stirred for
another 1 hour, and the reaction mixture was poured into saturated NaHCO3 and
extracted with CH2Cl2 (3 × 50 mL). The combined organic extracts were dried over
anhydrous Na2SO4, concentrated in vacuo, and the resulting oil was purified by
chromatography over silica gel, eluting with hexanes/ethyl acetate/triethylamine
(5:1:0.01), affording compound 9a as a light yellow foam (200 mg, 53%). 1H NMR
(300 MHz, CDCl3): δ = 8.34 (d, J = 21.3 Hz, 2 H), 7.98 (m, 2H), 7.89 (d, J = 8.8 Hz,
1H), 7.71 (s, 1H), 7.45 (m, 4H), 7.34-7.18 (m, 8H), 6.80 (d, J = 9.1 Hz, 4H), 4.11 (m,
1H), 3.74 (s, 6H), 3.26 (dd, J = 9.4, 4.1 Hz, 1H), 3.19 (dd, J = 9.4, 6.2 Hz, 1H), 3.00

Chapter 2.4 Experimental
41
(m, 2H), 2.32 (d, J = 4.4 Hz, 1H). 13C NMR (75 MHz, CDCl3): δ = 158.53, 144.88,
136.00, 135.97, 135.10, 131.83, 131.74, 131.45, 130.67, 130.09, 128.25, 128.16,
128.15, 128.11, 127.87, 127.68, 127.50, 126.84, 125.93, 125.65, 125.32, 125.11,
113.15, 86.23, 71.69, 66.50, 55.18, 40.53. IR (thin film): 3051, 2999, 2929, 2834,
1606, 1580, 1507, 1461, 1444, 1410, 1350, 1299, 1246, 1174, 1156, 1068, 1031, 1011,
978, 934, 903, 884, 868, 826, 788, 754, 731, 701, 635, 617, 582 and 539 cm-1. HRMS:
m/z [M + H+] calcd for C38H34O4: 554.2452; found: 554.24549.
Compound 10a To a solution of 9a (307 mg, 0.55 mmol) and
N,N-diisopropylethylamine (0.55 mL, 2.94 mmol) in CH2Cl2 (9 mL) was added
compound 6 (0.25 mL, 1.11 mmol). After 2 h, the reaction mixture was poured into
sat. aq. NaHCO3 (40 mL) and extracted with CH2Cl2 (3 × 40 mL). The combined
organic extracts were dried over anhydrous Na2SO4, concentrated in vacuo, and the
resulting oil was purified by chromatography over silica gel eluting with
hexanes/ethyl acetate/triethylamine (5:1:0.01), affording compound 10a as a
colorless foam (283 mg, 69%). 31P NMR (121.5 MHz, CDCl3): δ = 148.98, 148.76. IR
(thin film): 2964, 2931, 1607, 1508, 1461, 1445, 1363, 1300, 1248, 1201, 1176, 1156,
1125, 1073, 1032, 1005, 977, 944, 879, 827, 790, 755, 731, 701, 643, 582, 541 and
520 cm-1. HRMS: m/z [M + H+] calcd for C47H52N2O5P1: 755.3608; found: 755.3601.
Compound 9b To a solution of 1-bromopyrene (8b) (2.56 g, 9.14 mmol) in THF (20

Chapter 2.4 Experimental
42
mL) at -78 oC was added dropwise n-BuLi in hexane (7.2mL, 11.5 mmol) over 20 min.
After stirring for 30 min, a suspension of freshly prepared MgBr2 [made as follows: to
a suspension of magnesium turnings (0.44 g, 18.3 mmol) in THF (37 mL) was added
dropwise 1,2-dibromoethane (1.62 mL, 18.7 mmol)] was added dropwise over 20 min.
The resulting solution was first kept at -78 oC with stirring for 30 min and then
warmed to 0 oC and stirring was continued for another 30 min. The solution was then
cooled to -40 oC and stirred for 1 hour. To the resulting solution was added a slurry of
CuI (0.23 g, 1.22 mmol) in THF (2.44 mL). Then, the epoxide 3 (2.37 g, 6.1 mmol) in
THF (12 mL) was added and stirring was continued at the same temperature for 2
hours. The solution was warmed to room temperature, stirred for another 1 hour, and
the reaction mixture was poured into saturated NaHCO3 and extracted with CH2Cl2 (3
× 50 mL). The combined organic extracts were dried over anhydrous Na2SO4,
concentrated in vacuo, and the resulting oil was purified by chromatography over
silica gel, first eluting with hexanes/ethyl acetate/triethylamine (5:1:0.01), then with
hexanes/ethyl acetate/triethylamine (3:1:0.01), affording compound 9b as a light
yellow foam (1.79 g, 50%). 1H NMR (300 MHz, CDCl3): δ = 8.26 (d, J = 9.3 Hz, 1H),
8.18 (d, J = 7.8 Hz, 2H), 7.98–8.09 (m, 5H), 7.79 (d, J = 7.8 Hz, 1H), 7.48 (m, 2H),
7.27–7.35 (m, 6H), 7.22 (m, 1H), 6.79 (dd, J = 9.0, 2.3 Hz, 4H), 4.20 (m, 1H), 3.74 (d,
J = 2.0 Hz, 6H), 3.58 (dd, J = 13.9, 6.0 Hz, 1H), 3.47 (dd, J =13.7, 7.3 Hz, 1H), 3.28
(m, 2H), 2.37 (d, J = 4.3 Hz, 1H). 13C NMR (75MHz, CDCl3): δ = 158.65, 145.02,
136.13, 132.46, 131.51, 130.99, 130.31, 130.22, 130.20, 129.35, 128.41, 128.30,
127.97, 127.60, 127.51, 126.96, 125.97, 125.18, 125.09, 125.04, 124.94, 124.81,
123.58, 113.26, 86.52, 72.31, 67.00, 55.29, 37.86. IR (thin film): 3037, 2929, 2834,
1605, 1583, 1507, 1461, 1444, 1299, 1175, 1154, 1069, 1031, 980, 907, 840, 827, 791,
754, 726, 703, 682, 647 and 582 cm-1. HRMS: m/z [M+] calcd for C40H34O4: 578.2452;
found: 578.2449.

Chapter 2.4 Experimental
43
Compound 10b To a solution of 9b (1.79 g, 3.09 mmol) and
N,N-diisopropylethylamine (3.09 mL, 16.4 mmol) in CH2Cl2 (52 mL) was added
compound 6 (1.37mL, 6.18 mmol). After 2 h, the reaction mixture was poured into sat.
aq. NaHCO3 (40 mL) and extracted with CH2Cl2 (3 × 40 mL). The combined organic
extracts were dried over anhydrous Na2SO4, concentrated in vacuo, and the resulting
oil was purified by chromatography over silica gel eluting with hexanes/ethyl
acetate/triethylamine (5:1:0.01), affording compound 10b as a light yellow foam (2.02
g, 84%). 31P NMR (121.5 MHz, CDCl3): δ = 147.53, 147.16. IR (thin film): 3038,
2964, 2929, 2872, 2835, 1606, 1583, 1507, 1461, 1445, 1415, 1395,1379, 1363, 1300,
1176, 1155, 1123, 1073, 1029, 975, 951, 894, 878, 843, 826, 790, 754, 725, 700, 682,
640, 616, 582, 552, 517 and 465 cm-1. HRMS: m/z [M + H+] calcd for C49H52N2O5P1:
779.3608; found: 779.3602.
Compound 14a To a solution of 9-bromoanthrancene (13a) (0.78 g, 3.05 mmol) in
Et2O (25 mL) at -40 oC was added slowly n-BuLi in hexane (2.35 mL, 3.75 mmol).
After stirring for 30 min at -40 oC, the resulting yellow-orange colored suspension
was warmed to 0 oC and stirred for another 30 min. The solution was then cooled to
-40 oC and stirred for 1 hour. The solution of compound 3 (1.15 mg, 3.05 mmol) in
THF (5 mL) was then added slowly at -40 oC. The resulting solution was first kept at
-40 oC with stirring for 30 min and then warmed to 0 oC and stirring was continued

Chapter 2.4 Experimental
44
for another 30 min. Then the reaction was quenched with saturated NaHCO3 (50 mL)
at 0 oC. The mixture was extracted with CH2Cl2 (3 × 60 mL). The combined organic
layers were dried over anhydrous Na2SO4, concentrated in vacuo, and the resulting
red oil was purified by chromatography over silica gel eluting with hexanes/ethyl
acetate/triethylamine (5:1:0.01), affording compound 14a as a colorless foam (1.02 g,
61%). 1H NMR (300 MHz, CDCl3): δ = 8.36 (s, 1H), 8.28 (m, 2H), 7.98 (m, 2H), 7.45
(m, 6H), 7.32-7.18 (m, 7 H), 6.79 (dd, J = 9.1, 2.7 Hz, 2H), 4.23 (m, 1H), 3.83 (m,
1H), 3.78 (d, J =1.4 Hz, 6H), 3.48 (dd, J = 14.2, 7.1 Hz, 1H), 3.36 (dd, J = 9.5, 6.2 Hz,
2H), 3.29 (dd, J = 9.5, 4.7 Hz, 2H), 2.19 (s, 1H). 13C NMR (75 MHz, CDCl3): δ =
158.56, 145.02, 136.16, 136.10, 131.60, 130.72, 130.58, 130.16, 129.17, 128.24,
127.86, 126.86, 126.48, 125.64, 124.85, 113.17, 86.56, 72.71, 67.67, 55.22, 32.21. IR
(thin film): 3463 (br), 2929, 1606, 1506, 1444, 1246, 1174, 1155, 1068, 1031, 1010,
826, 731, 701, 582 cm-1. HRMS: m/z [M + H+] calcd for C38H34O4: 554.2452; found:
554.2449.
Compound 15a To a solution of 14a (0.33 g, 0.59 mmol) and
N,N-diisopropylethylamine (0.59 mL, 3.12 mmol) in CH2Cl2 (9.6 mL) was added
compound 6 (0.26mL, 1.18 mmol). After 2 h, the reaction mixture was poured into sat.
aq. NaHCO3 (40 mL) and extracted with CH2Cl2 (3 × 40 mL). The combined organic
extracts were dried over anhydrous Na2SO4, concentrated in vacuo, and the resulting
oil was purified by chromatography over silica gel eluting with hexanes/ethyl
acetate/triethylamine (5:1:0.01), affording compound 15a as a colorless foam (0.32 g,
74%). 31P NMR (121 MHz, CDCl3): δ = 148.88, 138.30. IR (thin film): 2962, 1606,
1461, 1445, 1363, 1247, 1175, 1155, 1031, 1004, 976, 878, 731, 701, 582, 541 cm-1.

Chapter 2.4 Experimental
45
HRMS: m/z [M + H+] calcd for C47H52N2O5P1: 755.3608; found: 755.3601.
Compound 14b To a solution of 9H-fluorene (13b) (0.87 g, 4.24 mmol) in Et2O (7.5
mL) at -78 oC was added slowly n-BuLi in hexane (3.34 mL, 5.35 mmol). After
stirring for 1 hour at -78 oC, the resulting mixture was warm to room temperature
slowly and the stirring was continued for overnight. The solution was then cooled to
-78 oC and stirred for 1 hour. The solution of compound 3 (1.19 g, 3.17 mmol) in THF
(3 mL) was then added slowly at -78 oC. After stirring for another 1 hour at -78 oC,
the reaction mixture was warm to room temperature slowly and stirred for another 3
hours. Then the reaction was quenched with saturated NaHCO3 (50 mL). The mixture
was extracted with CH2Cl2 (3 × 40 mL). The combined organic layers were dried over
anhydrous Na2SO4, concentrated in vacuo, and the resulting red oil was purified by
chromatography over silica gel eluting with hexanes/ethyl acetate/triethylamine
(5:1:0.01), affording compound 14b as a light colorless foam (1.30 g, 75%). 1H NMR
(300 MHz, CDCl3): δ = 7.75 (d, J = 7.8 Hz, 1H), 7.69 (d, J = 7.3 Hz, 1H), 7.61 (d, J =
7.3 Hz, 1H), 7.43-7.27 (m, 8H), 7.26-7.18 (m, 7H), 6.80 (d, J = 9.0 Hz, 4H), 4.00 (m,
1H), 3.79 (s, 6H), 2.96 (m, 2H), 2.44 (d, J = 2.9 Hz, 1H), 2.26 (m, 1H). 13C NMR
(75MHz, CDCl3): δ = 158.54, 147.66, 146.86, 144.81, 141.01, 140.72, 135.97, 130.03,
128.12, 127.86, 127.12, 126.98, 126.94, 126.88,126.82, 125.20, 124.29, 120.03,
119.85, 113.18, 86.24, 68.87, 68.09, 55.23, 44.08, 37.11. IR (thin film): 2931, 2808,
1606, 1507, 1445, 1299, 1246, 1174, 1067, 1031, 975, 906, 827, 739, 583 and 529
cm-1. HRMS: m/z [M+] calcd for C37H34O4: 542.2452; found: 5422452.

Chapter 2.4 Experimental
46
Compound 15b To a solution of 14b (0.39 g, 0.73 mmol) and
N,N-diisopropylethylamine (0.73 mL, 3.87 mmol) in CH2Cl2 (12 mL) was added
compound 6 (0.32 mL, 1.44 mmol). After 2 h, the reaction mixture was poured into
sat. aq. NaHCO3 (40 mL) and extracted with CH2Cl2 (3 × 40 mL). The combined
organic layers were evaporated and the residue was purified by chromatography over
silica gel eluting with hexanes/ethyl acetate/triethylamine (5:1:0.01), affording 15b as
a colorless foam (0.42 g, 79%). 31P NMR (161.9 MHz, CDCl3): δ = 149.98, 148.63.
IR (thin film): 2930, 2872, 2809, 1580, 1508, 1462, 1364, 1299, 1248, 1176, 1154,
1076, 1032, 976, 878, 828, 740, 583 and 523 cm-1. HRMS: m/z [M+] calcd for
C46H52N2O5P1: 743.3608; found: 743.3602.
Scheme 2.7 The synthesis of 1-ethynylpyrene (16a).
Compound 8b To a stirred solution of pyrene (19) (2.02 g, 10 mmol) and
hydrobromic acid (1.24 mL of a 48% aqueous solution, 11 mmol) in methyl
alcohol-ether (20 mL, 1:1) was slowly added hydrogen peroxide (0.34 g, 0.86 mL of a
35% aqueous solution, 10 mL) over a period of 15 min at 10-15 oC. The reaction was

Chapter 2.4 Experimental
47
left at room temperature for 12 h while its progress was monitored by TLC. After the
completion of monobromination, the solvent was removed under reduced pressure
and the crude product was taken in ethyl acetate and washed with water and brine and
dried over anhydrous Na2SO4. The pure product was isolated by careful column
chromatography on silica gel to get pure 1-bromopyrene as a light yellow solid (2.44g,
87%). Spectroscopic data is in agreement with reference.16
Compound 20 1-Bromopyrene (8b) (1.68 g, 6.0 mmol), Pd(PPh3)2Cl2 (421.2 mg, 0.6
mmol) and CuI (228.6 mg, 1.2 mmol) were placed in a Schlenk flask and the flask
was evacuated and recharged with N2 gas. Piperidine (30 mL) was added and the
resulting mixture was degassed for 10 min. Then trimethylsilylacetylene (16d) (1.71
mL, 12.0 mmol) was added and the mixture was stirred for 12 hours at 80 C. After
cooling to room temperature, the slovent was removed under vacum, the resulting
residue was purified by chromatography over silica gel eluting with
hexanes/dichloromethane (100:1), affording compound 20 as a light yellow solid
(1.67 g, 93%). 1H NMR (300 MHz, CDCl3): δ = 8.57 (d, J = 9.15 Hz, 1H), 8.24-8.00
(m, 8H), 0.40 (s, 9H). Spectroscopic data is in agreement with reference.19
Compound 16a To a solution of compound 20 (1.58 g, 5.31 mmol) in THF (34 mL)
was added tetrabutylammonium fluoride (1 M, 15.93 mL) dropwise. The reaction
mixture was stirred at room temperature for 4 hours. Then the reaction was quenched
by H2O (50 mL), and stirred for another 30 min at room temperature. After that, the
reaction mixture was extracted by CH2Cl2 (3 × 40 mL) and the combined organic

Chapter 2.4 Experimental
48
layer was washed with brine for 3 times (3 × 40 mL). Then the organic layer was
dried over anhydrous Na2SO4, concentrated in vacuo, and the resulting crude product
was purified by chromatography over silica gel with hexanes/dichloromethane (100:1),
affording compound 16a as a dark red solid (1.12 g, 93%). 1H NMR (300 MHz,
CDCl3): δ = 8.60 (d, J = 9.18 Hz, 1H), 8.24-8.00 (m, 8H), 3.63 (s, 1H). Spectroscopic
data is in agreement with reference.19
Compound 17a To a solution of 1-ethynylpyrene (16a) (300 mg, 1.33 mmol) in THF
(8 mL) at -78 oC was added slowly n-BuLi in hexane (0.84 mL, 1.34 mmol). After
stirring for 10 min at -78 oC, BF3·Et2O (0.17 mL, 1.33 mmol) was added dropwise
and the stirring continued for another 5 min. The solution of compound 3 (498.6 mg,
1.33 mmol) in THF (5 mL) was then added slowly at -78 oC. Stirring was continued
for another 15 min at -78 oC, then the reaction was quenched with saturated NaHCO3
(50 mL) at -78 oC. The mixture was extracted with CH2Cl2 (3 × 40 mL). The
combined organic layers were dried over anhydrous Na2SO4, concentrated in vacuo,
and the resulting red oil was purified by chromatography over silica gel eluting with
hexanes/ethyl acetate/triethylamine (3:1:0.01), affording compound 17a as a light
yellow foam (0.55 g, 68%). 1H NMR (300 MHz, CDCl3): δ = 8.44 (d, J = 9.1 Hz, 1H),
8.20 (m, 2H), 7.96–8.10 (m, 6H), 7.52 (m, 2H), 7.40 (m, 4H), 7.31 (m, 2H), 7.21 (m,
1H), 6.81 (d, J = 8.9 Hz, 4H), 4.19 (m, 1H), 3.67 (s, 6H), 3.48 (m, 2H), 2.98 (d, J =
6.3Hz, 2H), 2.60 (d, J = 5.3Hz, 1H). 13C NMR (75MHz, CDCl3): δ = 158.46, 144.85,
135.84, 135.83, 131.78, 131.11, 130.95, 130.77, 130.05, 129.66, 128.08, 127.84,
127.78, 127.09, 126.79, 126.05, 125.42, 125.33, 125.29, 124.29, 124.26, 124.18,
118.05, 113.14, 91.53, 86.29, 81.76, 69.74, 66.15, 54.98, 25.34. IR (thin film): 3037,
2929, 2834, 1605, 1581, 1507, 1461, 1442, 1299, 1246, 1174, 1072, 1031, 905, 845,
826, 790, 754, 717, 701, 681, 613, 582 and 543 cm-1. HRMS: m/z [M+] calcd for

Chapter 2.4 Experimental
49
C42H34O4: 602.2452; found: 602.2429.
Compound 18a To a solution of 17a (1.0 g, 1.66 mmol) and
N,N-diisopropylethylamine (1.66 mL, 8.83 mmol) in CH2Cl2 (27 mL) was added
compound 6 (0.55 mL, 2.49 mmol). After 2 h, the reaction mixture was poured into
sat. aq. NaHCO3 (30 mL) and extracted with CH2Cl2 (3 × 30 mL). The combined
organic layers were evaporated and the residue was purified by chromatography over
silica gel eluting with hexanes/ethyl acetate/triethylamine (3:1:0.01), affording 18a as
a light yellow foam (1.03 g, 77%). 31P NMR (161.9 MHz, CDCl3): δ = 147.85, 147.80.
IR (thin film): 3038, 2964, 2930, 2872, 2835, 1606, 1582, 1507, 1461, 1445, 1414,
1395, 1379, 1363, 1300, 1247, 1201, 1176, 1155, 1123, 1077, 1030, 977, 952, 898,
878, 847, 827, 790, 754, 718, 700, 682, 642, 613, 582, 561, 521, 484 and 465 cm-1.
HRMS: m/z [M + H+] calcd for C51H51N2O5P1: 803.3608; found: 803.3570.
Scheme 2.8 The synthesis of 3-ethynylperylene (16b).

Chapter 2.4 Experimental
50
Compound 22 To a mixture of perylene (22) (300 mg, 1.20 mmol) and DMF (10 mL)
was added NBS (214 mg, 1.20 mmol), and the reaction mixture was stirred at room
temperature for 24 hour. Then, the mixture was poured into water (60 mL) and
extracted by dichloromethane (2 × 500 mL). The combined organic layer was dried
over Na2SO4, and evaporated under reduced pressure to offer a yellow solid. The
crude product was purified by chromatography over silica gel eluting first with
hexane/dichloromethane (10:1), last with dichloromethane, affording compound 22 as
a bright yellow solid (388 mg, 98%).20a
Compound 23 3-Bromoperylene (22) (200 mg, 0.61 mmol), Pd(PPh3)2Cl2 (282 mg,
0.25 mmol) and CuI (70 mg, 0.31 mmol) were placed in a Schlenk flask and the flask
was evacuated and recharged with N2 gas. Piperidine (13 mL) and THF (13 mL) were
added and the resulting mixture was degassed for 10 min. Then
trimethylsilylacetylene (16d) (0.26 mL, 1.82 mmol) was added and the mixture was
stirred for 12 hours at 80 C. After cooling to room temperature, the slovent was
removed under vacum, the resulting residue was purified by chromatography over
silica gel eluting with hexanes/dichloromethane (100:1), affording compound 23 as a
yellow solid (128 mg, 61%). 1H NMR (300 MHz, CDCl3): δ = 8.25-8.16 (m, 4H),
8.11 (d, J = 8.02 Hz, 1H), 7.70 (m, 3H), 7.58 (t, J = 7.9 Hz, 1H), 7.49 (td, J = 7.5, 1.7
Hz, 2H), 0.35 (s, 9H). Spectroscopic data is in agreement with reference.20

Chapter 2.4 Experimental
51
Compound 16b To a solution of compound 23 (243 mg, 0.70 mmol) in THF (15 mL)
was added tetrabutylammonium fluoride (1 M, 2.1 mL) dropwise. The reaction
mixture was stirred at room temperature for 4 hours. Then the reaction was quenched
by H2O (50 mL), and stirred for another 30 min at room temperature. After that, the
reaction mixture was extracted by CH2Cl2 (3 × 40 mL) and the combined organic
layer was washed with brine for 3 times (3 × 40 mL). Then the organic layer was
dried over anhydrous Na2SO4, concentrated in vacuo, and the resulting crude product
was purified by chromatography over silica gel with hexanes/dichloromethane (100:1),
affording compound 16b as a yellow solid (135 mg, 70%). 1H NMR (300 MHz,
CDCl3): δ = 8.25-8.16 (m, 4H), 8.11 (d, J = 7.9 Hz, 1H), 7.70 (m, 3H), 7.58 (dd, J =
1.7, 0.8 Hz, 1H), 7.49 (td, J = 7.8, 1.4 Hz, 2H), 3.55 (s, 1H). Spectroscopic data is in
agreement with reference.20
Compound 17b To a solution of 3-ethynylperylene (16b) (58 mg, 0.21 mmol) in
THF (4 mL) at -78 oC was added slowly n-BuLi in hexane (0.14 mL, 0.21 mmol).
After stirring for 10 min at -78 oC, BF3·Et2O (0.03 mL, 0.21 mmol) was added
dropwise and the stirring continued for another 5 min. The solution of compound 3
(83 mg, 0.21 mmol) in THF (0.5 mL) was then added slowly at -78 oC. Stirring was
continued for another 15 min at -78 oC, then the reaction was quenched with saturated
NaHCO3 (50 mL) at -78 oC. The mixture was extracted with CH2Cl2 (3 × 40 mL). The

Chapter 2.4 Experimental
52
combined organic layers were dried over anhydrous Na2SO4, concentrated in vacuo,
and the resulting dark yellow solid was purified by chromatography over silica gel
eluting fist with hexanes/ethyl acetate/triethylamine (2:1:0.01) and last with
hexanes/ethyl acetate/triethylamine (1:3:0.01), affording compound 14d as a dark
yellow foam (107 mg, 78%). 1H NMR (300 MHz, CDCl3): δ = 8.19 (m, 3H), 8.07 (m,
2H), 7.69 (d, J = 9.0 Hz, 2H), 7.48 (m, 6H), 7.38-7.26 (m, 7H), 7.21 (m, 1H), 6.81 (d,
J = 9.0 Hz, 4H), 4.08 (m, 1H), 3.72 (s, 6H), 3.42 (m, 2H), 2.90 (d, J = 6.4 Hz, 2H).
13C NMR (75MHz, CDCl3): δ = 158.57, 144.91, 135.95, 134.70, 134.61, 131.34,
131.26, 130.97, 130.74, 130.13, 128.41, 128.17, 127.92, 127.07, 126.88, 126.59,
126.52, 126.12, 120.65, 120.56, 120.46, 119.49, 113.23, 91.86, 86.36, 81.26, 69.78,
66.20, 63.71, 55.15, 25.38. IR (thin film): 3051, 2927, 2834, 1731, 1605, 1583, 1507,
1461, 1443, 1389, 1299, 1246, 1175, 1155, 1070, 1032, 984, 827, 810, 767, 701 and
582 cm-1. HRMS: m/z [M+] calcd for C42H34O4: 602.2452; found: 602.2429.
Compound 18b To a solution of 17b (395 mg, 0.61 mmol) and
N,N-diisopropylethylamine (0.61 mL, 3.22 mmol) in CH2Cl2 (10 mL) was added
compound 6 (0.27mL, 1.21 mmol). After 2 h, the reaction mixture was poured into sat.
aq. NaHCO3 (40 mL) and extracted with CH2Cl2 (3 × 40 mL). The combined organic
extracts were dried over anhydrous Na2SO4, concentrated in vacuo, and the resulting
oil was purified by chromatography over silica gel eluting with hexanes/ethyl
acetate/triethylamine (3:1:0.01), affording compound 18b as a dark yellow foam (446
mg, 86%). 31P NMR (121.5 MHz, CDCl3): δ = 149.27, 149.00. IR (thin film): 2963,
1507, 1460, 1444, 1389, 1362, 1259, 1175, 1079, 1022, 976, 798, 769, 702, 581 and
519 cm-1. HRMS: m/z [M + H+] calcd for C49H52N2O5P1: 779.3608; found: 779.3602.
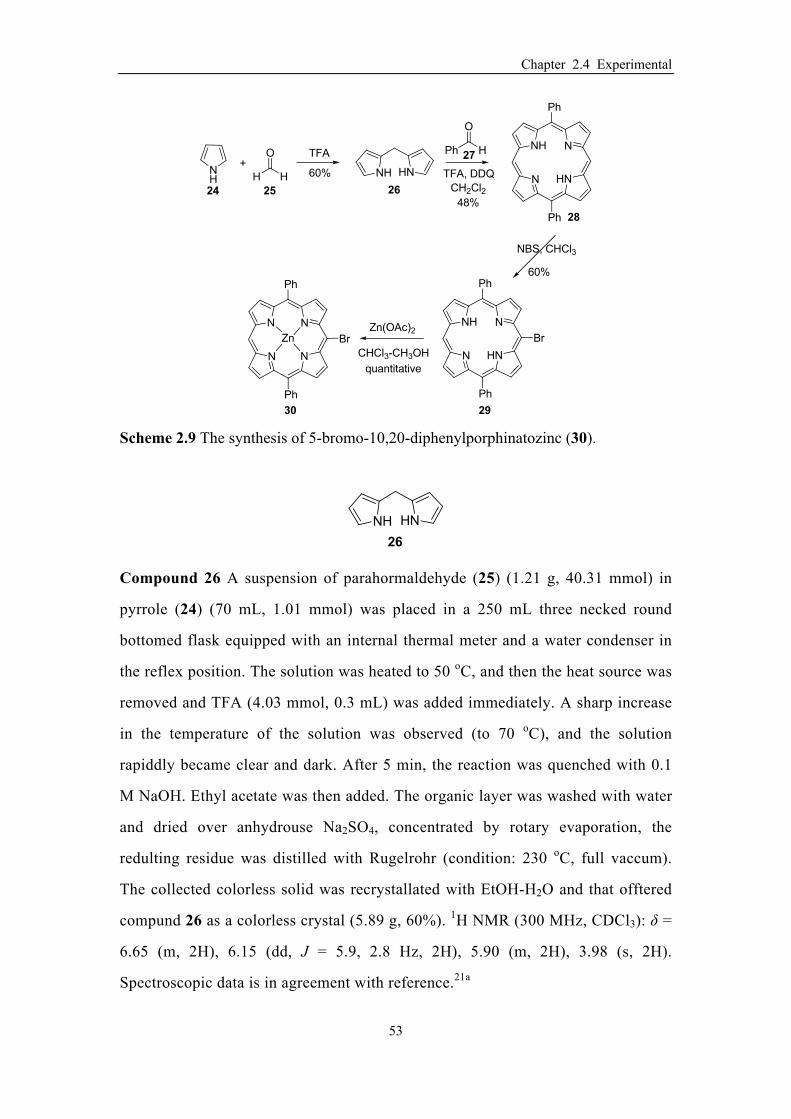
Chapter 2.4 Experimental
53
Scheme 2.9 The synthesis of 5-bromo-10,20-diphenylporphinatozinc (30).
Compound 26 A suspension of parahormaldehyde (25) (1.21 g, 40.31 mmol) in
pyrrole (24) (70 mL, 1.01 mmol) was placed in a 250 mL three necked round
bottomed flask equipped with an internal thermal meter and a water condenser in
the reflex position. The solution was heated to 50 oC, and then the heat source was
removed and TFA (4.03 mmol, 0.3 mL) was added immediately. A sharp increase
in the temperature of the solution was observed (to 70 oC), and the solution
rapiddly became clear and dark. After 5 min, the reaction was quenched with 0.1
M NaOH. Ethyl acetate was then added. The organic layer was washed with water
and dried over anhydrouse Na2SO4, concentrated by rotary evaporation, the
redulting residue was distilled with Rugelrohr (condition: 230 oC, full vaccum).
The collected colorless solid was recrystallated with EtOH-H2O and that offtered
compund 26 as a colorless crystal (5.89 g, 60%). 1H NMR (300 MHz, CDCl3): δ =
6.65 (m, 2H), 6.15 (dd, J = 5.9, 2.8 Hz, 2H), 5.90 (m, 2H), 3.98 (s, 2H).
Spectroscopic data is in agreement with reference.21a

Chapter 2.4 Experimental
54
Compound 28 A flame dried 1 L flask equipped with a magnetic stirring bar was
charged with 2,2′-dipyrrolmethane (26) (458 mg, 3.1 mmol), benzaldehyde (27) (315
µL, 3.1 mmol), and 600 mL of fleshly distilled methylene chloride. The solution was
degased with a stream of dry nitrogen for 15 min. Trifluoroacetic acid (150 µL, 1.95
mmol) was added via syringe, the flask was shield from light with aluminumfoil, and
the solution was stirred for 3 h at room temperature. The reaction was quenched by
the addition of 900 mg (3.96 mmol) of 2,3-dichloro-3,6-dicyanobenzoquinone (DDQ),
and the solution was stirred for an additional 30 min. pyridine (3 mL) was then added,
which serves two purpose: 1, it neutralizes exvess acid and
1,4-dihydroxy-2,3-dichloro-5,6-dicyanobenzone, and 2, it reacts with excess DDQ to
form an insoluble preciptate which can be filtered from the solution prior to
chromatographic work up. The solvent was evaporated leaving purple crystals 28 that
were washed with hexane, filtered and dried (680 mg, 48%). 1H NMR (300 MHz,
CDCl3): δ = 10.33 (s, 2H), 9.41 (d, J = 4.7 Hz, 4H), 9.10 (d, 4H), 8.29 (m, 4H), 7.82
(m, 6H), -3.12 (S, 2H). Spectroscopic data is in agreement with reference.21b
Compound 29 To a solution of compound 28 (76.1 mg, 0.16 mmol) and pyridine
(67 µL) in CHCl3 (53 mL) was added NBS (29 mg, 0.16 mmol) at 0 oC and was

Chapter 2.4 Experimental
55
stirred for 15 min, then acetone (2.6 mL) was added in. After that, the organic
layer was washed with water and dried over anhydrouse Na2SO4, concentrated by
rotary evaporation, the redulting residue was purified by chromatography over
silica gel eluting with hexanes/dichloromethane (5:1), finaly with
hexanes/dichloromethane (2:1), affording compound 29 as a purple solid (50 mg,
60%). 1H NMR (300 MHz, CDCl3): δ = 10.18 (s, 1H), 9.75 (d, J = 5.0 Hz, 2H),
9.29 (d, J = 4.6 Hz, 2H), 8.96 (dd, J = 4.6, 3.0 Hz, 4H), 8.22 (m, 4H), 7.79 (m, 6H),
-3.01 (s, 1H). Spectroscopic data is in agreement with reference.21c
Compound 30 To a solution of compound 29 (57.3mg, 1.06 mmol) in mixed solvents
CHCl3 (30 mL)-MeOH (3 mL) was added Zn(OAc)2 (192 mg, 10.6 mmol), and the
reaction mixture was stirred at 70 oC for overnight. After cooling to room
temperature, the reaction mixture was dilluted to 60 mL and washed well with
aqueous NaHCO3 and water. The organic layer was dried over anhydrous Na2SO4,
concentrated by rotary evaporation, offering product 30 as a purple red solid (64.1 mg,
quantitative) that was used in next step without further purification. 1H NMR (300
MHz, CDCl3): δ = 10.23 (s, 1H), 9.81 (d, J = 4.7 Hz, 2H), 9.37 (d, J = 4.6 Hz, 2H),
9.05 (dd, J = 4.6, 2.6 Hz, 4H), 8.22 (m, 4H), 7.80 (m, 6H). Spectroscopic data is in
agreement with reference.21d

Chapter 2.4 Experimental
56
Scheme 2.10 Synthesis of 5-ethynyl-10,20-diphenylporphinatozinc (16c).
Compound 31 Compound 30 (116 mg, 0.19 mmol), Pd(PPh3)4 (23.1 mg, 0.02
mmol) and CuI (7.3 mg, 0.04 mmol) were placed in a Schlenk flask and the flask
was evacuated and recharged with N2 gas. Dry THF (6 mL) and dry Et3N (4 mL)
were added and the resulting mixture was degassed for 10 min. Then a solution of
ethynyltrimethylsilane 16d (0.06 mL, 0.39 mmol) in dry THF (1 mL) was added
and the mixture was stirred for 12 hours at 65 C. After cooling to room
temperature, the mixture was poured into saturated aqueous NaHCO3, extracted
with CH2Cl2 (3 40 mL), dried over Na2SO4, filtered, and evaporated. The
resulting residue was purified by chromatography over silica gel eluting with
hexanes/dichloromethane (2:1), affording compound 31 as a purple solide (58 mg,
49%). 1H NMR (300 MHz, CDCl3): δ = 9.85 (s, 1H), 9.78 (d, J = 4.7 Hz, 2H), 9.10
(d, J = 4.6 Hz, 2H), 9.0 (d, J = 4.6 Hz, 2H), 8.89 (d, J = 4.5 Hz, 2H), 8.17 (dd, J =
1.6, 7.2 Hz, 4H), 7.78 (m, 6H), 0.65 (s, 9H). Spectroscopic data is in agreement
with reference.21b

Chapter 2.4 Experimental
57
Compound 16c To a solution of compound 31 (94 mg, 0.15 mmol) in THF (10 mL)
was added 1.0 M THF solution of tetrabutylammonium fluoride (0.45 mL) and
then stirred for 1 hour at room temperature. The reaction was quenched with H2O
and extracted with CH2Cl2 (3 30 mL). The combined organic extracts were dried
over anhydrous Na2SO4 and concentrated using rotary evaporation. The resulting
oil was purified by chromatography over silica gel eluting with hexanes/THF (8:1),
affording compound 16c as a purple solid (75 mg, 92%). 1H NMR (300 MHz,
DMSO): δ = 10.35 (s, 1H), 9.67 (d, J = 4.6 Hz, 2H), 9.46 (d, J = 4.5 Hz, 2H), 8.89
(d, J = 4.6 Hz, 2H), 8.84 (d, J = 4.5 Hz, 2H), 8.20 (m, 4H), 7.84 (m, 6H), 5.76 (s,
1H). Spectroscopic data is in agreement with reference.21b
Compound 17c Compound 21 (198 mg, 0.328 mmol), Pd(PPh3)4 (75.8 mg, 0.066
mmol) and CuI (25 mg, 0.131 mmol) were placed in a Schlenk flask and the flask was
evacuated and recharged with N2 gas. Dry THF (7 mL) and dry Et3N (6 mL) were
added and the resulting mixture was degassed for 10 min. Then compound 17d (263.8
mg, 0.656 mmol) in anhydrous THF (3 mL) was added and the mixture was stirred for
12 hours at 65 C. After cooling to room temperature, the mixture was poured into
saturated aqueous NaHCO3, extracted with CH2Cl2 (3 40 mL), dried over Na2SO4,
filtered, and evaporated. The resulting residue was purified by chromatography over

Chapter 2.4 Experimental
58
silica gel eluting with hexanes/dichloromethane/triethylamine (1:1:0.01), affording
compound 17c as a purple foam (289 mg, 95%). 1H NMR (300 MHz, CDCl3): δ =
10.05 (s, 1H), 9.41 (d, J = 4.6 Hz, 2H), 9.25 (d, J = 4.5 Hz, 2H), 8.96 (d, J = 4.5 Hz,
2H), 8.91 (d, J = 4.6 Hz, 2H), 8.19 (dd, J = 7.5, 1.6 Hz, 4H), 7.78 (m, 6H), 7.36 (m,
2H), 7.18-7.26 (m, 6H), 7.10-7.15 (m, 1H), 6.57 (dd, J = 8.9, 1.3 Hz, 4H), 3.74 (m,
1H), 3.38 (m, 1H), 3.33 (d, J = 2.0 Hz, 6H), 3.25 (m, 1H), 2.75 (m, 2H). 13C NMR
(125 MHz, CDCl3): δ = 158.42, 152.08, 150.42, 149.77, 149.61, 144.99, 142.94,
135.89, 134.90, 132.54, 132.34, 131.78, 130.97, 130.11, 128.18, 128.00, 127.52,
126.93, 126.69, 120.97, 113.29, 107.06, 86.41, 69.92, 66.35, 55.07, 53.55, 29.85,
25.42. IR (thin film): 3052, 2933, 2831, 1597, 1506, 1489, 1459, 1439, 1382, 1298,
1245, 1219, 1173, 1153, 1058, 1031, 989, 904, 825, 790, 749, 727, 716, 619 and 580
cm-1. HRMS: m/z [M + H+] calcd for C58H45N4O4Zn1: 925.2727; found: 925.2726.
Compound 18c To a solution of compound 17c (93.6 mg, 0.101 mmol) and
N,N-diisopropylethylamine (0.1 mL, 0.538 mmol) in anhydrous CH2Cl2 (4 mL) was
added phoramidite reagent 6 (0.034 mL, 0.152 mmol). After 2 h, the reaction mixture
was poured into saturated aqueous NaHCO3 and extracted by CH2Cl2 (3 40 mL).
The organic layer was evaporated to dryness and the resulting residue was purified by
chromatography over silica gel eluting with hexanes/dichloromethane/triethylamine
(2:1:0.01), affording compound 18c as a purple foam (85 mg, 74%). (compound 18c
is a mixture of two diastermers, the ratio of major and minor isomers is around 2:1
according to 1H NMR) 1H NMR (500 MHz, CDCl3): δ = 10.04 (s, 2H), 9.64 (d, J =
4.5 Hz, 2H), 9.59 (d, J = 4.6 Hz, 2H), 9.23 (d, J = 4.5 Hz, 4H), 8.93-3.98 (m, 8H),
8.23 (d, J = 7.3 Hz, 8H), 7.77-7.83 (m, 12H), 7.51-7.56 (m, 4H), 7.30-7.38(m, 8H),

Chapter 2.4 Experimental
59
7.19-7.25 (m, 4H), 7.09-7.14 (m, 2H), 6.50 (d, J = 8.9 Hz, 2H), 6.47 (d, J = 8.9 Hz,
2H), 6.40 (d, J = 8.9 Hz, 2H) (minor isomer), 6.32 (d, J = 8.8 Hz, 2H) (minor isomer),
4.57-4.69 (m, 2H), 3.63-3.98 (m, 12H), 3.55-3.60 (m, 2H), 3.38-3.46 (m, 2H), 3.23 (s,
3H), 3.18 (s, 3H), 3.08 (s, 3H) (minor isomer), 2.97 (s, 3H) (minor isomer), 2.41-2.60
(m, 2H), 2.31-2.37 (m, 2H) (minor isomer), 1.32 (d, J = 6.8 Hz, 6H) (minor isomer),
1.25 (d, J = 6.8 Hz, 6H) (minor isomer), 1.20 (d, J = 6.8Hz, 6H), 1.17 (d, J = 6.8 Hz,
6H). 13C NMR (125 MHz, CDCl3): δ = 158.22, 158.13, 158.10, 157.94, 152.20,
152.15, 150.43, 150.41, 149.83, 149.70, 149.67, 145.35, 145.32, 142.76, 136.38,
136.29, 136.04, 136.00, 134.72, 132.55, 132.50, 131.85, 131.30, 130.32, 130.13,
130.06, 128.32, 128.28, 127.90, 127.85, 127.62, 126.77, 121.10, 117.80, 117.63,
113.20, 113.17, 113.14, 113.11, 106.98, 86.35, 86.30, 73.12, 72.97, 72.33, 72.20,
65.95, 65.94, 65.79, 65.78, 58.78, 58.74, 58.64, 58.60, 55.10, 54.96, 54.92, 54.84,
43.64, 43.54, 43.49, 25.89, 25.84, 25.81, 24.91, 24.56, 24.81, 24.76, 20.48, 20.42,
20.41, 20.36. 31P NMR (121 MHz, CDCl3): δ = 148.05, 147.85. IR (thin film): 2962,
2930, 2866, 2834, 2253, 2227, 2022, 1507, 1490, 1460, 1440, 1382, 1363, 1297, 1248,
1176, 1154, 1124, 1060, 1032, 1002, 992, 908, 827, 792, 780, 751, 728, 717, 700, 658
and 582 cm-1. HRMS: m/z [M + H+] calcd for C67H62N6O5P1Zn1: 1125.3805; found:
1125.3807.
Compound 17s To a solution of ethynyltrimethylsilane (16d) (0.47 mL, 3.32 mmol)
in dry THF (8 mL) at -78 C was added slowly a 1.6 M hexane solution of n-BuLi
(2.1 mL, 3.36 mmol). After stirring for 10 min, boron trifluoride diethyl etherate
(BF3·Et2O) (0.42 mL, 3.32 mmol) was added dropwise. After an additional 5 min at
-78 C, a solution of compound 3 (1.25 g, 3.32 mmol) in anhydrous THF (4 mL) was
added slowly. The resulting solution was stirred for 15 min at -78 C. The reaction

Chapter 2.4 Experimental
60
was then quenched with saturated aqueous NaHCO3 (80 mL) at -78 C and extracted
with CH2Cl2 (3 60 mL). The combined organic layers were dried over anhydrous
Na2SO4, concentrated by rotary evaporation, and purified by flash chromatography
over silica gel eluting with hexanes/ethyl acetate/triethylamine (10:1:0.01),
affording compound 17s as a colorless oil (1.11 g, 70%). 1H NMR (300 MHz, CDCl3):
δ = 7.45 (m, 2H), 7.16-7.38 (m, 7H), 6.84 (d, J = 8.9 Hz, 4H), 3.92 (m, 1H), 3.79 (s,
6H), 3.24 (m, 2H), 2.52 (d, J = 6.4 Hz, 2H), 0.115 (s, 9H). 13C NMR (75 MHz,
CDCl3): δ = 158.65, 144.92, 136.08, 130.18, 128.26, 127.96, 126.95, 113.30, 102.79,
87.34, 86.32, 69.49, 66.10, 55.30, 25.46, 0.14. IR (thin film): 2956, 2933, 2175, 1607,
1580, 1508, 1462, 1445, 1414, 1335, 1298, 1246, 1174, 1155,1075, 1032, 826, 790,
756, 726, 701, 645 and 583 cm-1. HRMS: m/z [M + Na+] calcd for C29H34O4Si1Na1:
497.2119; found: 497.2120.
Compound 17d To a solution of compound 17s (1.73 g, 3.65 mmol) in THF (36.5 mL)
was added 1.0 M THF solution of tetrabutylammonium fluoride (11 mL) and then
stirred for 1 hour at room temperature. The reaction was quenched with H2O and
extracted with CH2Cl2 (3 50 mL). The combined organic extracts were dried over
anhydrous Na2SO4 and concentrated using rotary evaporation. The resulting oil was
purified by chromatography over silica gel eluting with hexanes/ethyl
acetate/triethylamine (5:1:0.01), affording compound 17d as a colourless oil (1.45 g,
98%).1H NMR (300 MHz, CDCl3): δ = 7.43 (m, 2H), 7.26-7.34 (m, 6H), 7.19-7.24 (m,
1H), 6.83 (d, J = 8.9 Hz, 4H), 3.91 (m, 1H), 3.79 (s, 6H), 3.24 (m, 2H), 2.47 (ddd, J =
6.2, 2.6, 0.8 Hz, 2H), 2.37 (d, J = 5.0 Hz, 1H), 1.98 (t, J = 2.7 Hz, 1H). 13C NMR (75
MHz, CDCl3): δ = 158.71, 144.88, 136.06, 130.20, 128.28, 128.00, 127.01, 113.32,
86.43, 80.52, 70.67, 69.45, 66.06, 55.37, 24.07. IR (thin film): 3287, 3000, 2836,
2045, 1734, 1607, 1581, 1507, 1462, 1444, 1299, 1245, 1174, 1154, 1072, 1031, 951,

Chapter 2.4 Experimental
61
913, 826, 790, 772, 754, 701, 634, and 582 cm-1. HRMS: m/z [M + Na+] calcd for
C26H26O4Na1: 425.1723; found: 425.1723.
Compound 18d To a solution of compound 17d (0.40 g, 0.99 mmol) and
N,N-diisopropylethylamine (0.99 mL, 5.24 mmol) in anhydrous CH2Cl2 (16 mL) was
added phosphoramidite reagent 6 (0.26 mL, 1.18 mmol). After 2 h, the reaction
mixture was poured into saturated aqueous NaHCO3 and extracted by CH2Cl2 (3 40
mL). The organic layer was evaporated to dryness and the resulting residue was
purified by chromatography over silica gel eluting with hexanes/ethyl acetate/
triethylamine (3:1:0.01), affording compound 18d as a colorless oil (0.58 g, 96%).31P
NMR (121 MHz, CDCl3): δ = 147.72, 147.64. IR (thin film): 3289, 2965, 2931, 2874,
2836, 1607, 1508, 1462, 1363, 1248, 1176, 1155, 1076, 1031, 976, 828, 727, 700, 640,
583, 524 cm-1. HRMS: m/z [M + Na+] calcd for C35H43N2O5P1Na1: 625.2802; found:
625.2801.

Chapter 2.5 References
62
Chapter 2.5 References
1. Kolb, H. C.; Finn, M. G.; Sharpless, K. B. Angewandte Chemie International
Edition 2001, 40, 2004.
2. Jacobsen, E. N.; Wu, M. H. In comprehensive Asymmetric Catalysis (Eds.:
Jacobsen, E. N.; Pfaltz, A.; Yamamoto, H.), Springer, New York, 1999; chapter
35.
3. (a) Huynh, D.; Derguini-Boumechal, F.; Linstrumelle, G. Tetrahedron letter 1979,
20, 1503-1506; (b) Schwartz, P.; Madan, P.; Whitesell, J. K.; Lawrence, R. M.
Organic syntheses 1990, 69, 1-9.
4. (a) Eis, M. J.; Wrobel, J. E.; Ganem, B. Journal of American Chemical Society
1984, 106, 3693-3694; (b) Reich, H. J.; Sanders, A. W.; Fiedler, A. T.; Bevan, M.
J. Journal of American Chemical Society 2002, 124, 13386-13387.
5. Chounan, Y.; Yamamoto, Y. in Modern Organocopper Chemisty (Ed.: N. Krause),
Wiley-VCH, Weinheim, 2002, chapter 9.
6. Uchiyama, M.; Kameda, M.; Mishima, O.; Yokoyama, N.; Koike, M.; Kondo, Y.;
Sakamoto, T. Journal of American Chemical Society 1998, 20, 4934-4946.
7. Schneider, C.; Brauner, J. European Journal of Organic Chemistry 2001,
4445-4450.
8. Mukeji, I.; Weyda, A. L.; Dabbagh, G.; Bertz, S. H. Angewandte Chemie
International Edition 1986, 25, 734-735.
9. (a) Nugent, W. A. Journal of the American Chemical Society 1992, 14,
2768–2769; (b) Martinez, L. E.; Leighton, J. L.; Carsten, D. H.; Jacobesen, E. N.
Journal of the American Chemical Society 1995, 117, 5887–5889; (c) Schaus, S.
E.; Larrow, J. F.; Jacobsen, E. N. Journal of Organic Chemistry 1997, 62,
4197-4199.
10. (a) Carrée, F.; Gil, R.; Collin, J. Organic Letters 2005, 7, 1023-1026; (b) Azoulay,
S.; Manabe, K.; Kobayashi, S. Organic Letters 2005, 7, 4593-4595.
11. (a) Iida, T.; Yamamoto, N.; Matsunaga, S.; Woo, H.-G.; Shibasaki, M.

Chapter 2.5 References
63
Angewandte Chemie International Edition 1998, 37, 2223-2226; (b) Schneider,
C.; Sreekanth, A. R.; Mai, E. Angewandte Chemie International Edition 2004, 43,
5691-5694.
12. (a) Iida, T.; Yamamoto, N. Journal of the American Chemical Society 1997, 119,
4783–4784; (b) Wu, M. H.; Jacobsen, E. N. Journal of Organic Chemistry 1998,
63, 5252-5254.
13. (a) Denmark, S. E.; Barsanti, P. A.; Wong, K.-T.; Stavenger, R. A. Journal of
Organic Chemistry 1998, 63, 2428-2429; (b) Nugent, W. A. Journal of the
American Chemical Society 1998, 120, 7139–7140.
14. (a) Hubbs, J. L.; Heathcock, C. H. Journal of the American Chemical Society
2003, 125, 12836–12843; (b) Hanessian, S.; Yang, Y.; Giroux, S.; Mascitti, V.;
Ma, J.; Raeppel, F. Journal of the American Chemical Society 2003, 125,
12784–13792; (c) Dakin, L. A.; Panek, J. S. Organic Letters 2003, 5, 3995-3998;
(d) Pichlmair, S.; Marques, M. M. B.; Green, M. P.; Martin, H. J.; Mulzer, J.
Organic Letters 2003, 5, 4657-4659; (e) kim, J. H.; Lim, H. J.; Cheon, S. H.
Tetrahedron 2003, 59, 7501-7507; (f) Schmidt, B.; pohel, M.; Cortisella, B.
Tetrahedron 2002, 58, 7951-7958.
15. Chemla, F.; Vrancken, E.; Patai Series: The Chemistry of Organolithium
Compounds (Ed.: Z. Rappoport), Wiley, Chichester, 2004, p. 1165-1242.
16. Coleman, R. S.; Mortensen, M. A. Tetrahedron Letter 2003, 44, 1215-1219.
17. Yang, S.-W.; Elangovan, A.; Hwang, K. -C. And Ho, T.-I. Journal of Physical
chemistry B 2005, 109, 16628-16635.
18. (a) Hodgson, D. M.; Gibbs, A. R.; Lee, G. P. Tetrahedron 1996, 52, 14361-14384;
(b) Satoh, T. Chemical Reviews 1996, 96, 3303-3325; (c) Doris, E.; Dechoux, L.;
Mioskowski, C. Synletter 1998, 337-343; (d) O’Brien, P. Journal of the Chemical
Society, Perkin Transactions 1 1998, 1439-1458; (e) Magnus, A.; Bertilsson, S.
K.; Andersson, P. G. Chemical Society Reviews 2002, 31, 223-229; (f) Hodgson,
D. M.; Gras, E. Synthesis 2002, 1625-1642.
19. Hissler, M.; Harriman, A.; Khatyr, A. and Ziessel, R. Chemistry - A European
Journal 1999, 5, 3366.

Chapter 2.5 References
64
20. (a) Burley, G. A.; Avent, A. G.; Gol’dt, I. V.; Hitchcick, P. B.; Al-Matar, H.;
Paolucci, D.; Paolucci, F.; Fowler, P. W.; Soncini, A.; Street, J. M.; Taylor, R.
Organic & Biomoleculor Chemistry 2004, 2, 319-329; (b) Andronova, V. L.;
Skorobogatyi, M. V.; manasova, E. V.; Berlin, Yu. A.; korshun, V. A.; Galegov, G.
A. Russian Journal of Bioorganic Chemistry 2003, 29, 290-295.
21. (a) Lin, V. S.-Y.; Iovine, P. M.; Dimango, S. G.; Therien, M. J. Inorganic
Syntheses 2002, 33, 55; (b) Fazekas, M.; Pintea, M.; Senge, M. O.; Zawadzka, M.
Tetrahedron Letters 2008, 49 (14), 2236; (c) Balaban, T. S.; Goddard, R.;
Schaetzel, M. L.; Lehn, J.-M. Journal of American Chemistry Society 2003, 125,
4233; (d) Kai, H.; Nara, S.; Kinbara, K.; Aida, T. Journal of American Chemistry
Society 2008, 130, 6725.
22. Zhang, L.; Peritz, A. E.; Carroll, P. J.; Meggers, E. Synthesis 2006, 645.
23. Zhang, L.; Peritz, A.; Meggers, E. Journal of the American Chemical Society
2005, 127, 4174 –4175.

Appedix to chapter 2
65
Appendix to Chapter 2: 1H, 13C, 31P NMR spectra and
IR spectra

Appedix to chapter 2
66
Figure A2.1.1 1H-NMR spectrum of compound 3 (300 MHz, CDCl3).
Figure A2.2.1 1H-NMR spectrum of compound 5a (300 MHz, CDCl3).
OH
DMTrO
5a
ODMTrO
3

Appedix to chapter 2
67
Figure A2.2.2 13C-NMR spectrum of compound 5a (75 MHz, CDCl3).
Figure A2.2.3 IR spectrum of compound 5a (solid).
OH
DMTrO
5a
O HD M T r O 5 a
OH
DMTrO
5a

Appedix to chapter 2
68
Figure A2.3.1 31P-NMR spectrum of compound 7a (121.5 MHz, CDCl3).
Figure A2.3.2 IR spectrum of compound 7a (solid).
O
DMTrO
PO
N
CN
7a
O
D M T r O
PO
N
C N
7 a

Appedix to chapter 2
69
Figure A2.4.1 1H-NMR spectrum of compound 5b (300 MHz, CDCl3).
Figure A2.4.2 13C-NMR spectrum of compound 5b (75 MHz, CDCl3).
OH
DMTrO
5b
OH
DMTrO
5b

Appedix to chapter 2
70
Figure A2.4.3 IR spectrum of compound 5b (solid).
Figure A2.5.131P-NMR spectrum of compound 7b (121.5 MHz, CDCl3).
OH
DMTrO
5b
O
DMTrO
PO
N
CN
7b

Appedix to chapter 2
71
Figure A2.5.2 IR spectrum of compound 7b (solid).
Figure A2.6.1 1H-NMR spectrum of compound 5c (300 MHz, CDCl3).
OH
DMTrO
5c
O
DMTrO
PO
N
CN
7b

Appedix to chapter 2
72
Figure A2.6.2 13C-NMR spectrum of compound 5c (75 MHz, CDCl3).
Figure A2.6.3 IR spectrum of compound 5c (solid).
OH
DMTrO
5c
OH
DMTrO
5c

Appedix to chapter 2
73
Figure A2.7. 1 31P-NMR spectrum of compound 7c (121.5 MHz, CDCl3).
Figure A2.7.2 IR spectrum of compound 7c (solid).
O
DMTrO
PO
N
CN
7c
O
D M T r O
PO
N
C N
7 c

Appedix to chapter 2
74
Figure A2.8.1 1H-NMR spectrum of compound 5d (300 MHz, CDCl3).
Figure A2.8.2 13C-NMR spectrum of compound 5d (75 MHz, CDCl3).
OH
DMTrO
5d
OH
DMTrO
5d

Appedix to chapter 2
75
Figure A2.8.3 IR spectrum of compound 5d (solid).
Figure A2.9.1 31P-NMR spectrum of compound 7d (121.5 MHz, CDCl3).
OH
DMTrO
5d
O
DMTrO
PO
N
CN
7d
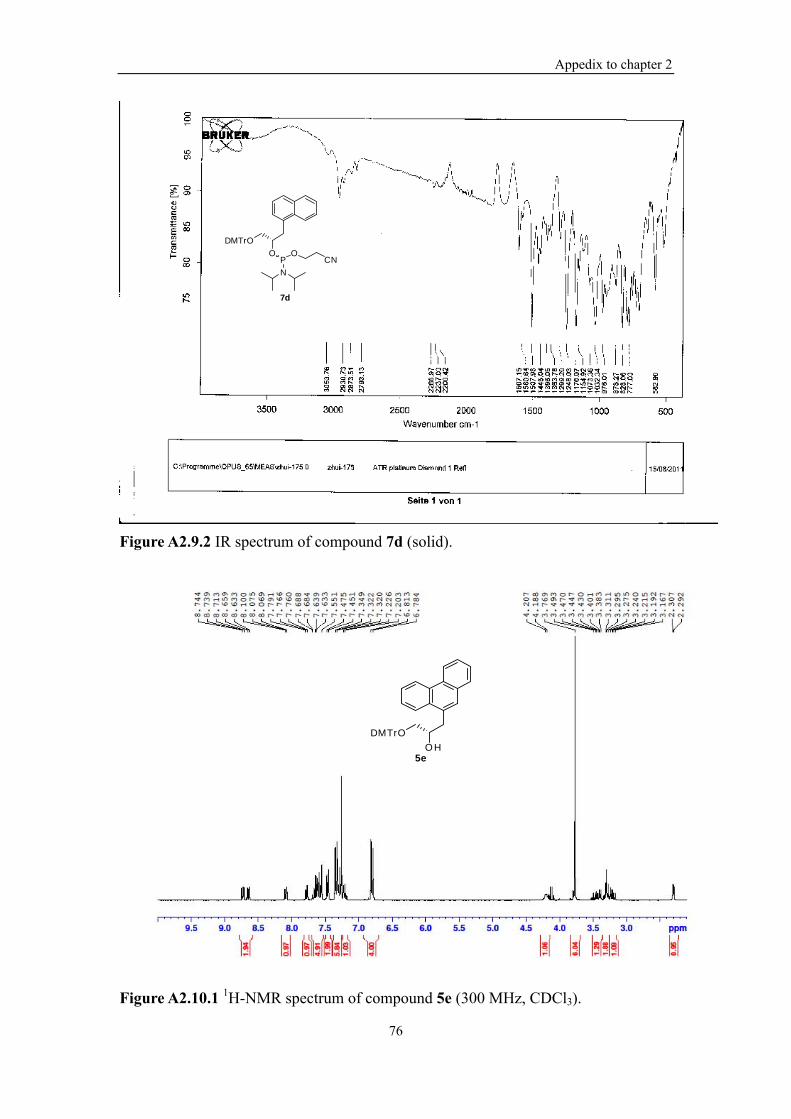
Appedix to chapter 2
76
Figure A2.9.2 IR spectrum of compound 7d (solid).
Figure A2.10.1 1H-NMR spectrum of compound 5e (300 MHz, CDCl3).
OH
DMTrO
5e
O
DMTrO
PO
N
CN
7d

Appedix to chapter 2
77
Figure A2.10.2 13C-NMR spectrum of compound 5e (75 MHz, CDCl3).
Figure A2.10.3 IR spectrum of compound 5e (solid).
OH
DMTrO
5e
O HD M T r O 5 e
O H
DM TrO
5e

Appedix to chapter 2
78
Figure A2.11.1 31P-NMR spectrum of compound 7e (121.5 MHz, CDCl3).
Figure A2.11.2 IR spectrum of compound 7e (solid).
O
DMTrO
PO
N
CN
7e
O
D M T r O
PO
N
C N
7 e
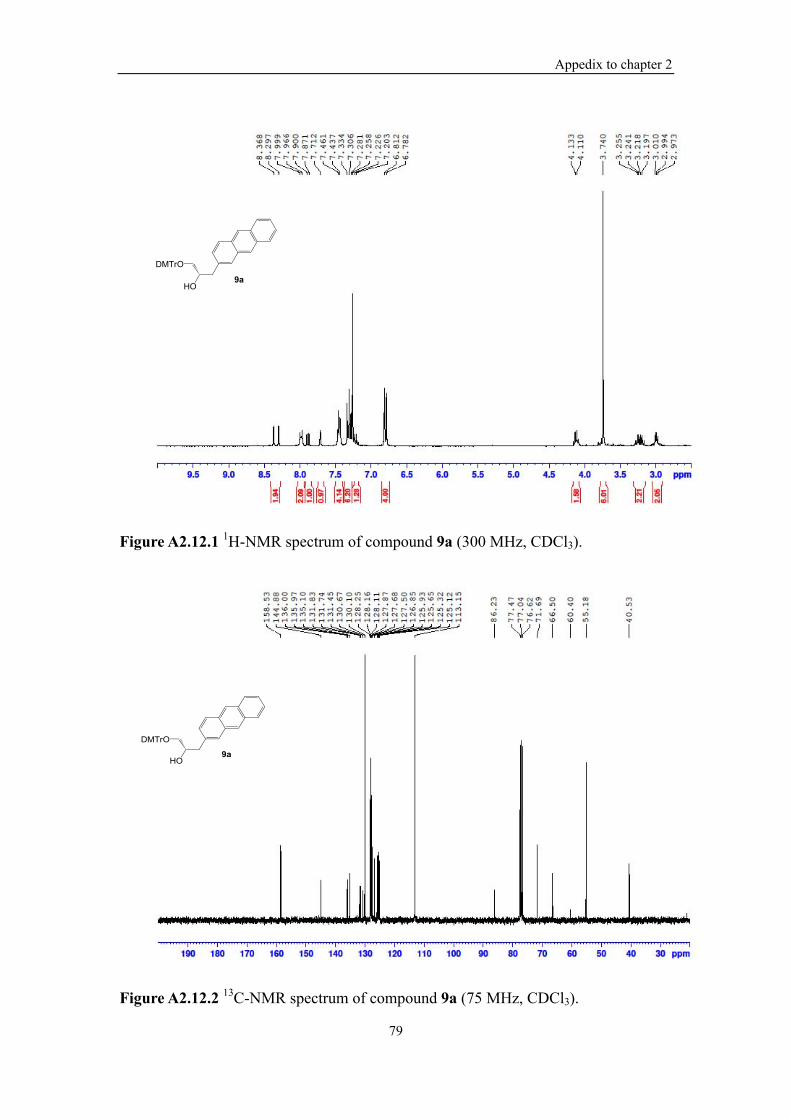
Appedix to chapter 2
79
Figure A2.12.1 1H-NMR spectrum of compound 9a (300 MHz, CDCl3).
Figure A2.12.2 13C-NMR spectrum of compound 9a (75 MHz, CDCl3).

Appedix to chapter 2
80
Figure A2.12.3 IR spectrum of compound 9a (solid).
Figure A2.13.1 31P-NMR spectrum of compound 10a (121.5 MHz, CDCl3).

Appedix to chapter 2
81
Figure A2.13.2 IR spectrum of compound 10a (solid).
Figure A2.14.1 1H-NMR spectrum of compound 9b (300 MHz, CDCl3).

Appedix to chapter 2
82
Figure A2.14.2 13C-NMR spectrum of compound 9b (75 MHz, CDCl3).
Figure A2.14.3 IR spectrum of compound 9b (solid).

Appedix to chapter 2
83
Figure A2.15.1 31P-NMR spectrum of compound 10b (121.5 MHz, CDCl3).
Figure A2.15.2 IR spectrum of compound 10b (solid).

Appedix to chapter 2
84
Figure A2.16.1 1H-NMR spectrum of compound 14a (300 MHz, CDCl3).
Figure A2.16.2 13C-NMR spectrum of compound 14a (75 MHz, CDCl3).

Appedix to chapter 2
85
Figure A2.16.3 IR spectrum of compound 14a (solid).
Figure A2.17.1 31P-NMR spectrum of compound 15a (121.5 MHz, CDCl3).
O
DMTrO
PO
N
CN
15e

Appedix to chapter 2
86
Figure A2.17.2 IR spectrum of compound 15e (solid).
Figure A2.18.1 1H-NMR spectrum of compound 14b (300 MHz, CDCl3).
O
DMTrO
PO
N
CN
15e

Appedix to chapter 2
87
Figure A2.18.2 13C-NMR spectrum of compound 14b (75 MHz, CDCl3).
Figure A2.18.3 IR spectrum of compound 14b (solid).
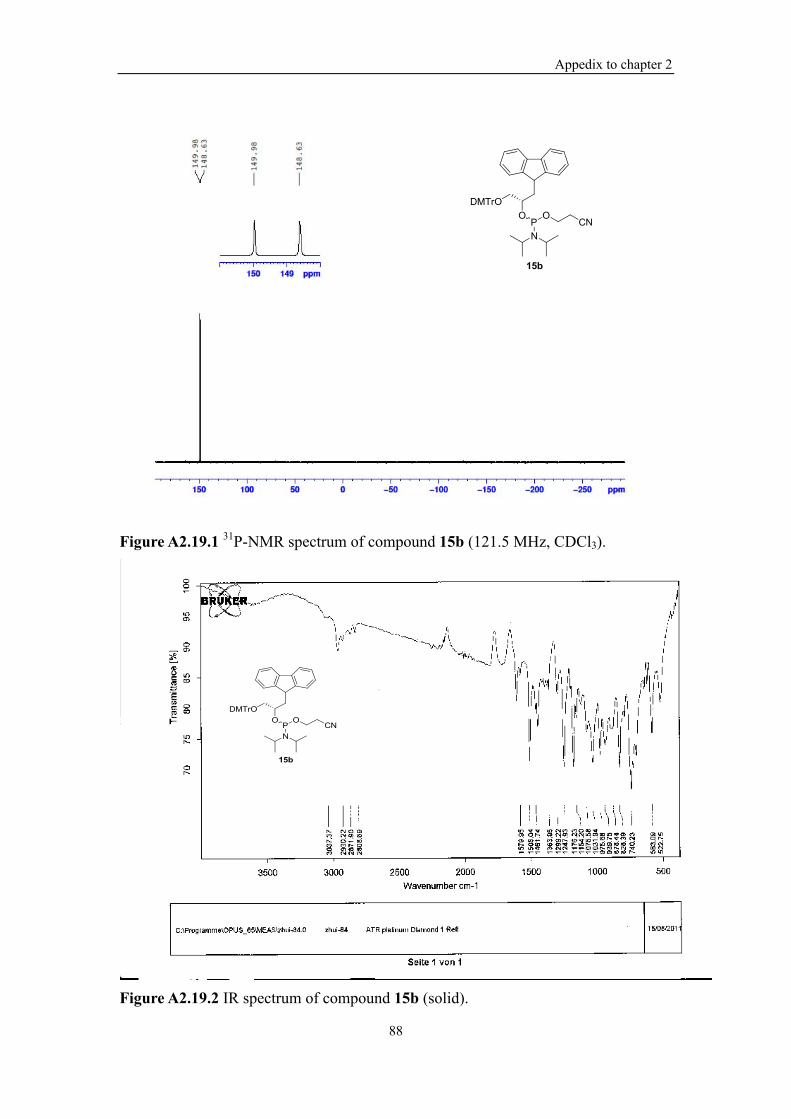
Appedix to chapter 2
88
Figure A2.19.1 31P-NMR spectrum of compound 15b (121.5 MHz, CDCl3).
Figure A2.19.2 IR spectrum of compound 15b (solid).

Appedix to chapter 2
89
Figure A2.20.1 1H-NMR spectrum of compound 20 (300 MHz, CDCl3).
Figure A2.21.1 1H-NMR spectrum of compound 16a (300 MHz, CDCl3).
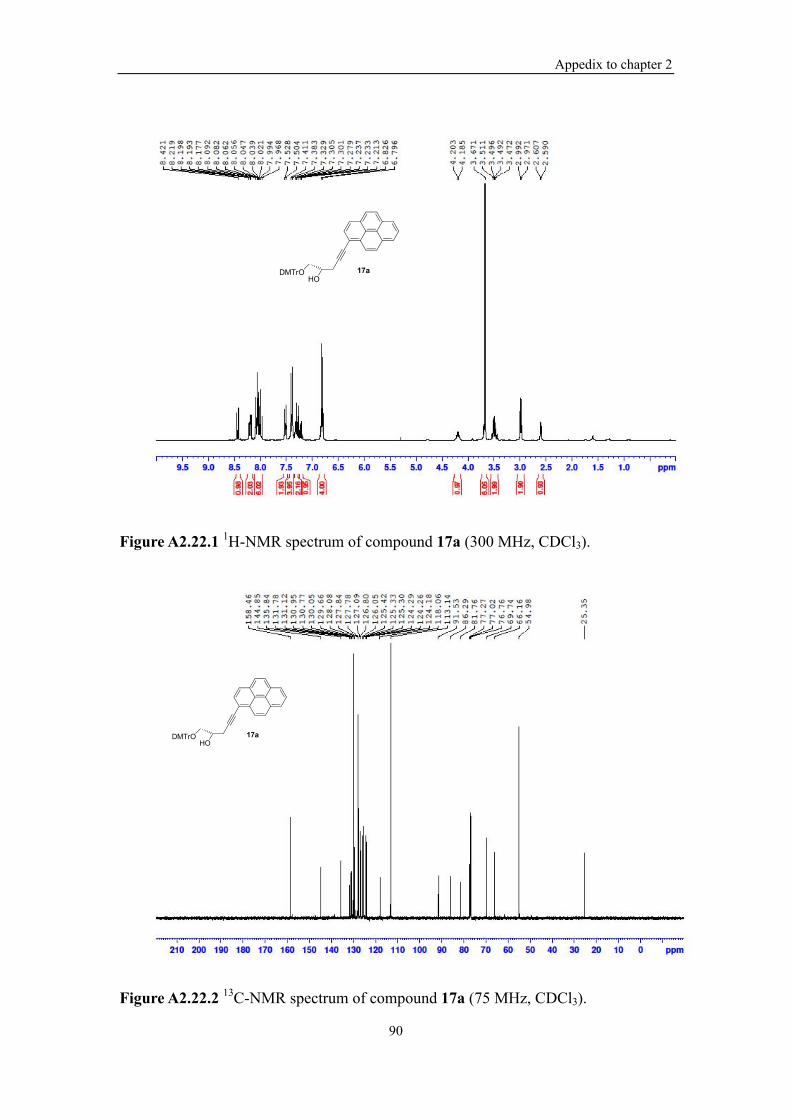
Appedix to chapter 2
90
Figure A2.22.1 1H-NMR spectrum of compound 17a (300 MHz, CDCl3).
Figure A2.22.2 13C-NMR spectrum of compound 17a (75 MHz, CDCl3).

Appedix to chapter 2
91
Figure A2.22.3 IR spectrum of compound17a (solid).
Figure A2.23.1 31P-NMR spectrum of compound 18a (121.5 MHz, CDCl3).

Appedix to chapter 2
92
Figure A2.23.2 IR spectrum of compound 18a (solid).
Figure A2.24.1 1H-NMR spectrum of compound 17b (300 MHz, CDCl3).

Appedix to chapter 2
93
Figure A2.24.2 13C-NMR spectrum of compound 17b (75 MHz, CDCl3).
Figure A2.24.3 IR spectrum of compound17b (solid).
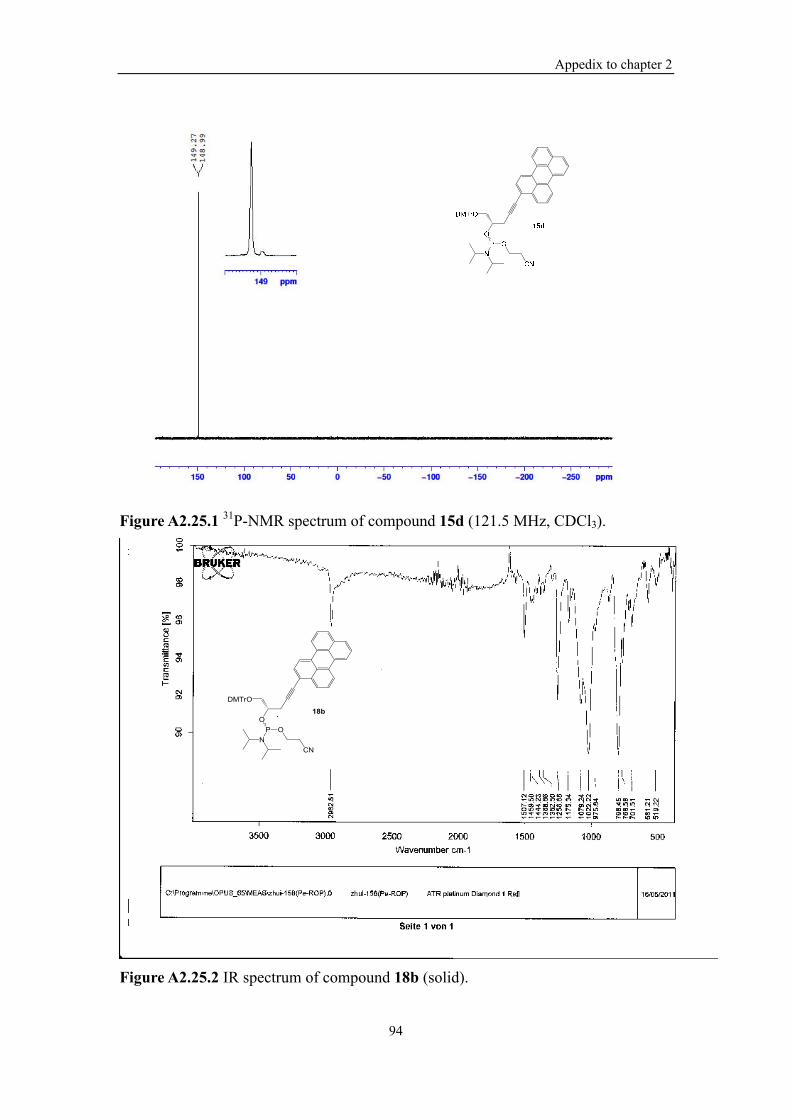
Appedix to chapter 2
94
Figure A2.25.1 31P-NMR spectrum of compound 15d (121.5 MHz, CDCl3).
Figure A2.25.2 IR spectrum of compound 18b (solid).

Appedix to chapter 2
95
Figure A2.26.1 1H-NMR spectrum of compound 28 (300 MHz, CDCl3).
Figure A2.27.1 1H-NMR spectrum of compound 30 (300 MHz, CDCl3).

Appedix to chapter 2
96
Figure A2.28.1 1H-NMR spectrum of compound 17s (300 MHz, CDCl3).
Figure A2.28.2 13C-NMR spectrum of compound 17s (75 MHz, CDCl3).

Appedix to chapter 2
97
Figure A2.28.3 IR spectrum of compound 17s (solid).
Figure A2.29.1 1H-NMR spectrum of compound 17d (300 MHz, CDCl3).

Appedix to chapter 2
98
Figure A2.29.2 13C-NMR spectrum of compound 17d (75 MHz, CDCl3).
Figure A2.29.3 IR spectrum of compound 17d (solid).
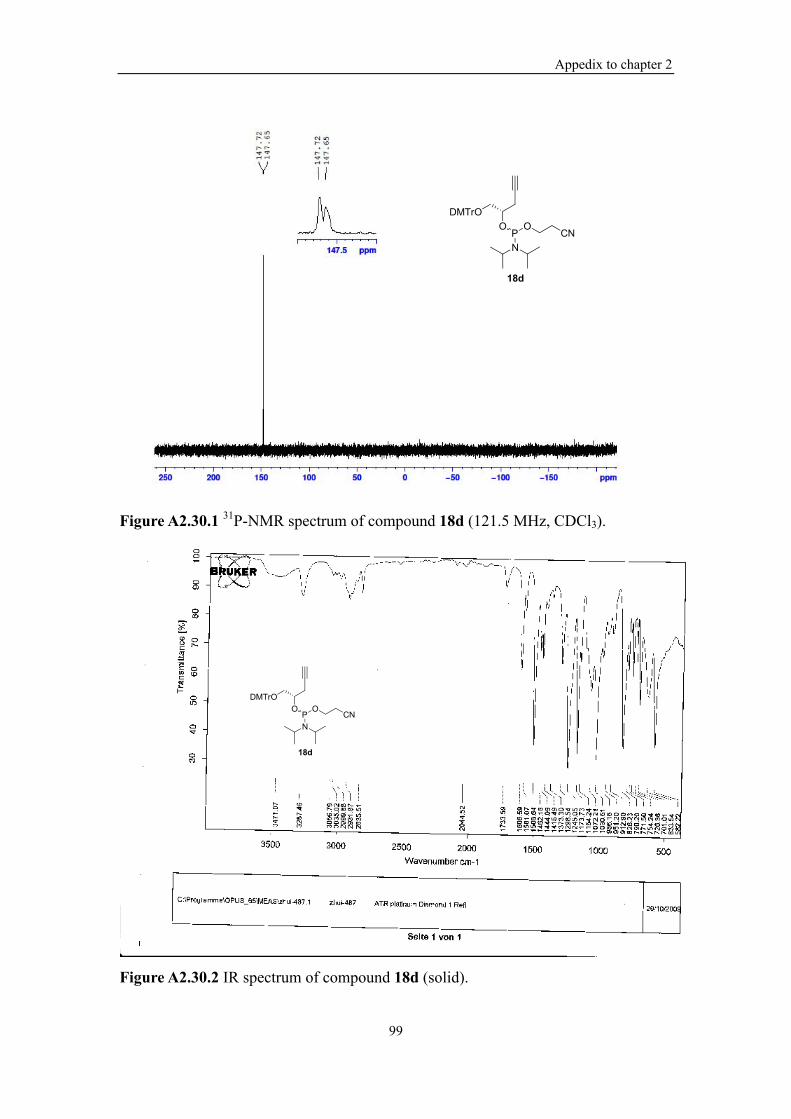
Appedix to chapter 2
99
Figure A2.30.1 31P-NMR spectrum of compound 18d (121.5 MHz, CDCl3).
Figure A2.30.2 IR spectrum of compound 18d (solid).

Appedix to chapter 2
100
Figure A2.31.1 1H-NMR spectrum of compound 17c (300 MHz, CDCl3).
Figure A2.31.2 13C-NMR spectrum of compound 17c (125.8 MHz, CDCl3).

Appedix to chapter 2
101
Figure A2.31. 3 IR spectrum of compound 17c (solid).
Figure A2.32.1 1H-NMR spectrum of compound 18c (500 MHz, CDCl3).

Appedix to chapter 2
102
Figure A2.32.2 13C-NMR spectrum of compound 18c (125.8 MHz, CDCl3).
Figure A2.32.3 31P-NMR spectrum of compound 18c (121.5 MHz, CDCl3).

Appedix to chapter 2
103
Figure A2.32.4 IR spectrum of compound 18c (solid).

Chapter 3 Pyrene acetylide nucleotides in GNA
104
Chapter 3 Pyrene Acetylide Nucleotides in GNA:
Probing Duplex Formation and Sensing of Copper(II)
Ions

Chapter 3.1 Introduction
105
Chapter 3.1 Introduction
Pyrene is a polycyclic aromatic hydrocarbon consisting of four fused benzenes
rings, resulting in a flat aromatic system. Because of efficient planar aromatic
stacking, their high quantum yields and their ability to form excimer emission upon
stacking, pyrenes have been used extensively in DNA in following three areas:
[1] As a nonpolar artificial base in DNA: Pyrene was introduced into DNA as the
nonpolar artificial bases because of its large planar aromatic structure.1 It was
found that dangling pyrene stacks on the duplex extremely strong and pyrene
and abasic site could form stable non-hydrogen base pair.1c In addition, pyrene
c-nucleotides were employed in enzymatic synthesis studies.2
O
OH
HO
P
Figure 3.1 Pyrene artificial C-nucleoside.
[2] As fluorophores for DNA probes: Fluorescence of pyrene monomer and
pyrene excimer has been widely investigated in the development of potential
probes for detecting of single nucleotide polymorphisms,3 single-base
mismatches,4 base-discriminating,5 DNA or RNA secondary and tertiary
structures,6 and real-time PCR techniques.7 Pyrene is among the most
attractive fluorophores for DNA probes due to the fact that pyrene’s long
fluorescence lifetimes, sensitivity to microenvironment and its inherent
chemical characteristics.8
[3] As a building block for constructing a high-ordered nanostructure: -arrays of
pyrene chromophores have been of considerable interest because these kind of
close proximity of fluorophores leads to useful changes in fluorescent
properties. DNA has been extensively used as a scaffold for assembling

Chapter 3.1 Introduction
106
pyrene in a controlled fashion. Up to 14 non-nucleosideic pyrene are
embedded in DNA offers an interstrand helical organization.9 Pyrenes have
been covalently attached to nucleobases for using DNA as a scaffold to create
helical arrays.10
In this chapter, we described the synthesis and evaluation of GNA duplexes
containing fluorescent pyrene nucleotides.

Chapter 3.2.1 Synthesis of pyrene-GNA
107
Chapter 3.2 Result and Discussion
Chapter 3.2.1 Synthesis of pyrene-GNA
As fluorescent GNA nucleotide building blocks we chose Pyr and Pyr′ in which
the natural nucleobases of propylene glycol nucleotides are replaced by pyrene and
pyrene-1-acetylide moieties as shown in Figure 3.2B.
Figure 3.2 (A) Structure of pyrene phosphoramidites 10b and 15c. (B) Constitution of (S)-GNA. Pyr:Me and Pyr′:H base pairs used in this study.
Pyrene phosphoramidites 10b and 15c were used to synthesize GNA strands with
incorporated pyrene (Pyr) and acetylide pyrene (Pyr′) nucleotides (Figure 3.2A).
Pyrene nucleotides have been demonstrated to fit into the base stacking of nucleic
acid duplexes by arranging them opposite abasic sites in order to accommodate for
their expanded size.1c We therefore chose GNA abasic sites based on ethylene glycol
(H) and (S)-(+)-1,2-propanediol (Me) shown in Figure 3.2B. GNA oligonucleotides
containing the pyrene nucleotides Pyr and Pyr′, as well as the abasic sites Me and H,
were synthesized on CPG supports. A standard protocol for 2-cyanoethyl
phosphoramidites (0.1 M) was used, except that the coupling was extended to 3
minutes. After the steps of detritylation and purification with a reversed phase HPLC
column, the pyrene-containing GNA strands were obtained in high purities.

Chapter 3.2.2 Thermal stability
108
Chapter 3.2.2 Thermal stability
We first incorporated the pyrene nucleotide Pyr into 16mer GNA
oligonucleotides. Table 3.1 reveals that Pyr was slightly better accommodated
opposite a methylated abasic site Me (Table 3.1, duplex D3) compared to the abasic
site H (Table 3.1, duplex D2), being only by 4 oC less stable than an A:T base pair at
the same position (Table 3.1, duplex D1). Encouraged by these stabilities, we
synthesized duplexes D4-D7 (Table 3.1), having incorporated all permutations of
adjacent Pyr:Me base pairs in order to investigate excimer fluorescence formation in
GNA duplexes. Table 3.1 demonstrates that all systems form stable duplexes at room
temperature.
Table 3.1 Thermal stability of GNA duplexes containing pyrene nucleotides.a 3′-TAAAAATNNTAATATT-2′ 2′-ATTTTTANNATTATAA-3′
Name Duplexes Tm(oC) ∆Tm(oC)
D1 AA TT
54 2
D2 HA
PyrT 49 -5
D3 MeA PyrT
50 -4
D4 MeMe PyrPyr
33 -21
D5 PyrPyr MeMe
42 -12
D6 MePyr PyrMe
36 -18
D7 PyrMe MePyr
43 -11
aConditions: 10 mM sodium phosphate, 100 mM NaCl, 2 µM of each strand.

Chapter 3.2.2 Thermal stability
109
20 30 40 50 60 70
0.00
0.05
0.10
0.15
0.20
0.25
Hyp
erch
rom
icit
y
Temperature (oC)
D1
D3
A)
D2
20 30 40 50 60 70
0.00
0.05
0.10
0.15
0.20
0.25B)
Hyp
erch
rom
icit
y
Temperature (oC)
D1 D4 D5 D6 D7
Figure 3.3 UV-melting curves of GNA duplexes containing pyrene nucleotides. Changes in absorbance upon heating as monitored at 260 nm. Conditions: 10 mM sodium phosphate, 100 mM NaCl, pH 7.0, and 2 M of each strand. (A) Duplexes D1, D2 and D3. (B) Duplexes D1, D4, D5, D6 and D7 (see Table 3.1 for the sequences).
We then investigated the thermal stability of GNA duplexes contain pyrene
acetylide nucleotide Pyr′. Interestingly, although significantly larger than Pyr, Pyr′
fits well into GNA duplexes opposite the abasic sites H (Tm = 51 oC, Table 3.2,
duplex D9) and Me (Tm = 50 oC, Table 3.2, duplex D8), with the base pair Pyr′:H
being only by 3 oC less stable than an A:T base pair at the same position (Table 3.2,
duplex D1). Subsequently, duplexes with all permutations of two adjacent Pyr′:H
base pairs were synthesized (Table 3.2, duplexes D10-D13), all resulting in thermally
stable duplexes at room temperature.

Chapter 3.2.2 Thermal stability
110
Table 3.2 Thermal stability of GNA duplexes containing pyrene acetylide nucleotides.a
3′-TAAAAATNNTAATATT-2′ 2′-ATTTTTANNATTATAA-3′
Name Duplexes Tm(oC) ∆Tm(oC)
D1 AA TT
54 2
D8 Pyr′A MeT
50 -4
D9 Pyr′A
HT 51 -3
D10 HH
Pyr′Pyr′ 32 -22
D11 Pyr′Pyr′
HH 39 -15
D12 HPyr′ Pyr′H
34 -20
D13 Pyr′H HPyr′
41 -13
aConditions: 10 mM sodium phosphate, 100 mM NaCl, 2 µM of each strand.
20 30 40 50 60 70
0.00
0.05
0.10
0.15
0.20
0.25
0.30
Temperature (oC)
Hyp
erch
rom
icit
y
D1 D8
A)
D9
20 30 40 50 60 70
0.00
0.05
0.10
0.15
0.20
0.25
0.30
Wavelength (nm)
Hyp
erch
rom
icit
y
D1 D10
D12 D13
B)
D11
Figure 3.4 UV-melting curves of GNA duplexes containing pyrene acetylide nucleotides. Changes in absorbance upon heating as monitored at 260 nm. Conditions: 10 mM sodium phosphate, 100 mM NaCl, pH 7.0, and 2 M of each strand. (A) Duplexes D1, D8 and D9. (B) Duplexes D1, D10, D11, D12 and D13 (see Table 3.2 for the sequences).

Chapter 3.2.3 CD spectroscopy
111
Chapter 3.2.3 CD spectroscopy
In order to obtain the information about the secondary structure of GNA
duplexes containing pyrene and pyrene acetylide nucleotides, pyrene and pyrene
acetylide modified GNA duplexes were investigated by CD spectroscopy.
200 220 240 260 280 300 320-15
-10
-5
0
5
10
A)
CD
(m
deg
)
Wavelength (nm)
D1 D4 D5 D6 D7
200 220 240 260 280 300 320-15
-10
-5
0
5
10B)
CD
(m
deg
)
Wavelength (nm)
D1 D10 D11 D12 D13
Figure 3.5 CD spectra of GNA duplexes (A) containing pyrene and (B) pyrene acetylide nucleotides (see Table 3.1 and 2.2 for the sequences). Conditions: 10 mM sodium phosphate, 100 mM NaCl, pH 7.0, and 8 M of each strand, 25 oC.
The CD signals of modified GNA duplexes are almost identical to native GNA
duplex D1, except for the lower signal intensities (Figure 3.5). It thus seems that
the incorporation of pyrene or pyrene acetylide to GNA duplex does not distort the
overall GNA duplex structure.

Chapter 3.2.4 Fluorecence spectroscopy
112
Chapter 3.2.4 Fluorescence spectroscopy
We then investigated the fluorescence properties of GNA strands which contain
pyrene and pyrene acetylide. Excimer emission results of pyrene-containing GNA
duplexes turned out to be disappointing.
400 450 500 550 600
0
100
200
300
400
RF
U
Wavelength (nm)
ss PyrPyr D3 D4 D5 D6 D7
Figure 3.6 Fluorescence properties of pyrene nucleotides in GNA. Conditions: 10 mM sodium phosphate, 100 mM NaCl, pH 7.0, and 2 µM of each strand of a duplex (D3-D7) or 2 µM for the single strand 3′-TAAAAATPyrPyrTAATATT-2′ (see Table 3.1 for the sequences), excitation at 315 nm with cutoff filter at 325 nm, fluorescence at 460 nm taken as indicator for excimer fluorescence.
Upon excitation at 315 nm, the duplexes D4-D6, containing each two adjacent
pyrene nucleobases, give overall low fluorescence quantum yields with low emissions
at 395 nm (regular emission) as well as low emissions at 460 nm (excimer emission)
as shown in Figure 3.6, compared to the duplex D3 harboring a single pyrene (strong
regular emission at 395 nm) and a Pyr-Pyr containing single strand (strong excimer
emission at 460 nm). Moreover, duplex D7 does not yield any excimer emission at all.
This latter result can be explained with the strong nucleobase-backbone inclination in
GNA duplexes which should result in only a very weak stacking of the two pyrene
nucleobase in duplex D7. However, the weak excimer emission of duplexes D4-D6,
in combination with the overall low fluorescence quantum yields, remains unclear.

Chapter 3.2.4 Fluorecence spectroscopy
113
400 450 500 550 600
0
200
400
600
800
1000
RF
U
Wavelength (nm)
ss Pyr'Pyr' D9 D10 D11 D12 D13
Figure 3.7 Fluorescence properties of pyrene acetylide nucleotides in GNA. Conditions: 10 mM sodium phosphate, 100 mM NaCl, pH 7.0, and 2 µM of each strand of a duplex (D9-D13) or 2 µM for the single strand 3′-TAAAAATPyr′Pyr′TAATATT-2′ (see Table 3.2 for the sequences), excitation at 315 nm with cutoff filter at 325 nm, fluorescence at 500 nm taken as indicator for excimer fluorescence.
Fortunately, replacing pyrene nucleotide Pyr by pyrene acetylide Pyr′, the
fluorescence properties were dramatically improved. Figure 3.7 demonstrates that in
particular the duplexes D10, D11, and D13 yield very strong excimer emission
intensities upon excitation at 315 nm which exceed the excimer emissions of the
corresponding pyrene duplexes D4, D5, and D7 (Figure 3.6) by around 10-fold. Most
interestingly, whereas D10 and D11 contain adjacent pyrene acetylides in the same
strand, duplex D13 provides strong excimer fluorescence despite the pyrene acetylide
nucleotides Pyr′ being in opposite strands. The arrangement of Pyr′ nucleotides in
opposite strands in D13 therefore allows to monitor duplex formation by following
the intensity of excimer emission relative to the regular emission of the single strands.
Compared to pyrene-containing duplexes (Pyr), pyrene acetylide-containing duplexes
(Pyr′) form much stronger excimers. Most likely, the superior behavior of Pyr′ in
GNA duplexes is due to a combination out of structural effects, influencing the
stacking of adjacent Pyr′ nucleobases, and electronic effects due to the conjugation of
the aromatic pyrene with the acetylide π-system.

Chapter 3.2.5 Design of a GNA-based copper ion sensor
114
Chapter 3.2.5 Design of a GNA-based copper ion sensor
As an application of excimer emission upon duplex formation with pyrene
acetylide containing GNA strands, we envisioned to develop a metal ion sensor by
additionally incorporating a metal-mediated base pair. The hydroxypyridone
homo-base pair M:M is known to increase DNA duplex stability in the presence of
Cu2+ ions (see Figure 3.8 for the molecular structure).12 The hydroxypyridone
homo-base pair is known to increase DNA and GNA duplex stability in the presence
of Cu2+ ions. This effect has been demonstrated to be even significant stronger in
GNA duplexes compared to DNA with an increase in duplex stability in the presence
of Cu2+ by around 30 oC.13
Figure 3.8 Structure of the copper-mediated hydroxypyridone homo-base pairs M:M (M = hydroxypyridone).
Sequence design
We first designed two duplexes D14 and D15 (Table 3.3), which include two
Pyr′:H base pairs in analogy to D13 in addition to a metal-mediated hydroxypyridone
homo-base pair M:M. D14 is 16 mers, while D15 is 15 mers. Beside of this, D14 and

Chapter 3.2.5 Design of a GNA-based copper ion sensor
115
D15 differ in the number of the natural base pairs between two Pyr′:H base pairs and
M:M base pair, D14 has 7 and D15 only has 4 base pairs.
Table 3.3 Comparison of thermal and excimer emission for D14 and D15.
Entry Sequence Tm (C)a Excimerb (without
Cu2+)
Excimerb (with Cu2+)
D13 3′-TAAAAATPyr′HTAATATT-2′ 2′-ATTTTTAHPyr′ATTATAA-3′
41 strong strong
D14 3′-TATPyr′HAAATAATMAAA-2′ 2′-ATAHPyr′TTTATTAMTTT-3′
no medium strong
D15 3′-TATAPyr′HTAATMTAAA-2′ 2′-ATATHPyr′ATTAMATTT-3′
no weak strong
aConditions: 10 mM sodium phosphate, 100 mM NaCl, 2 µM each strand of a duplex and without Cu2+. bExcitation at 315 nm with cutoff filter at 325 nm. Fluorescence at 500 nm taken as indicator for excimer fluorescence. 25 oC, 2 µM each strand of a duplex.
400 450 500 550 6000
100
200
300
400
500
600
700
D153'-TATAPyr'HTAATMTAAA-2'2'-ATATHPyr'ATTAMATTT-3'
B)
RF
U
Wavelength (nm)
no Cu2+
1 equiv. Cu2+
400 450 500 550 6000
100
200
300
400
500
600
700
800
D14 3'-TATPyr'HAAATAATMAAA-2' 2'-ATAHPyr'TTTATTAMTTT-3'
A)
RF
U
Wavelength (nm)
no Cu2+
1 equiv. Cu2+
Figure 3.9 Copper(II)-dependent fluorescence properties of duplexes. Conditions: 10 mM sodium phosphate, pH 7.0, 100 mM NaCl, 2 µM of each strand of a duplex, 25 oC, excitation at 315 nm with cutoff filter at 325 nm. (A) D14. (B) D15 (see Table 3.3 for the sequences).
We measured excimer emission of duplex D14 and D15 in the presence and
absence of CuCl2 (Figure 3.9). In presence of CuCl2, both D14 and D15 yielded

Chapter 3.2.5 Design of a GNA-based copper ion sensor
116
strong excimer emission (500 nm). However, D14 still yielded quite strong excimer
emission even in the absence of CuCl2 (Figure3.9A, black line). D15 only exhibited
very weak excimer emission (Figure 3.9B, black line), indicating the two stands of
D15 were mainly dissociated without Cu2+. Therefore, we chose D15 for further
studies.
Optimize the condition
Since the counter-cation concentration has stabilization effect on duplex
formation, we measured the melting point and fluorescence of D15 at varying NaCl
concentration in the presence or absence of Cu2+.
20 30 40 50 60 70 800.00
0.02
0.04
0.06
0.08
0.10
0.12 100 mM 50 mM
D153'-TATAPyr'HTAATMTAAA-2'2'-ATAAHPyr'ATTAMATTT-3'
A)
Hyp
erch
rom
icit
y
temperature (oC)
22.5 mM 12.5 mM
no Cu2+
20 30 40 50 60 70 800.00
0.02
0.04
0.06
0.08
0.10
0.12
0.14 100 mM 50 mM
D153'-TATAPyr'HTAATMTAAA-2'2'-ATAAHPyr'ATTAMATTT-3'
B)
Hyp
erch
rom
icit
y
Temperature (oC)
25 mM 12.5 mM No NaCl
1 equiv. Cu2+
Figure 3.10 NaCl concentration-dependent UV-melting curves of duplex D15 (see Table 3.3 for the sequences). Conditions: 10 mM sodium phosphate, pH 7.0, and 2 µM of each strand of a duplex. (A) Without Cu2+. (B) With one equivalent Cu2+.
In absence of CuCl2, cooperative melting behavior is not observed at different salt
concentrations (Figure 3.10A). However, after the addition of only one equivalent of
CuCl2, duplex D15 was strongly stabilized and cooperative melting behavior could be
observed (Figure 3.10B) at NaCl concentration of 12.5 mM or above.

Chapter 3.2.5 Design of a GNA-based copper ion sensor
117
350 400 450 500 550 6000
100
200
300
400
500
600
700
800
900
D153'-TATAPyr'HTAATMTAAA-2'2'-ATAAHPyr'ATTAMATTT-3'
A)R
FU
Wavelength (nm)
100 mM 50 mM 25 mM 12.5 mM 0 mM
no Cu2+
400 450 500 550 6000
100
200
300
400
500
600
700
D153'-TATAPyr'HTAATMTAAA-2'2'-ATAAHPyr'ATTAMATTT-3'
B)
RF
U
Wavelength (nm)
100 mM 50 mM 25.0 mM 12.5 mM 0 mM
1 equiv. Cu2+
Figure 3.11 NaCl concentration-dependent fluorescence spectrums of duplex D15 (see Table 3.3 for the sequences). Conditions: 10 mM sodium phosphate, pH 7.0, and 2 µM of each strand of a duplex, 25 oC, excitation at 315 nm with cutoff filter at 325 nm. (A) Without Cu2+. (B) With one equivalent Cu2+.
We next investigated the effect of salt concentration on the fluorescence property
of D15. Figure 3.11B reveals that D15 with one equivalent CuCl2 exhibits the
strongest excimer emission at 50 mM NaCl concentration. Together with Tm result, we
chose 50 mM NaCl concentration. The optimize condition of sensor D15 is 40 °C, 50
mL NaCl concentration (Figure 3.12).
350 400 450 500 550 600
0
100
200
300
400
500
600
700
800
D153'-TATAPyr'HTAATMTAAA-2'2'-ATAAHPyr'ATTAMATTT-3'
RF
U
Wavelength (nm)
no Cu2+
1 equiv. Cu2+
Figure 3.12 Copper(II)-dependent fluorescence properties of duplexes D15 in optimized condition. Conditions: 10 mM sodium phosphate, 50 mM NaCl, pH 7.0, 2 µM of each strand of a duplex, 40 oC, excitation at 315 nm with cutoff filter at 325 nm.

Chapter 3.2.5 Design of a GNA-based copper ion sensor
118
Titration Experiment
In order to experimental verify that one equivalent Cu2+ is need to stable the
hydroxypyridone base pair M:M in sensor D15, titration of Cu2+ to a denatured
duplex D15 is carried out under the optimized condition (10 mM sodium phosphate,
50 mM NaCl, pH 7.0, 2 µM each strand of a duplex, 40 oC).
400 450 500 550 600
0
100
200
300
400
500
600
700
800
900
D153'-TATAPyr'HTAATMTAAA-2'2'-ATAAHPyr'ATTAMATTT-3'
A)
RF
U
Wavelength (nm)
0 0.2 0.4 0.6 0.8 1.0 1.2 1.6 2.0 3.0
0.0 0.5 1.0 1.5 2.0 2.5 3.00
100
200
300
400
500
600
700
800
900
1000B)
RF
U
Equivalent of Cu2+
monomer emission excimer emission
Figure 3.13 Copper(II)-sensing with sensor D15 (see Table 3.3 for the sequences). Conditions: 10 mM sodium phosphate, 50 mM NaCl, pH 7.0, 2 µM of each strand of a duplex, 40 oC, excitation at 315 nm with cutoff filter at 325 nm. (A) Titration. (B) The trend of monomer emission and excimer emission in titration.
The titration experiment reveals that excimer emission increased with increasing
amount of Cu2+ until around one equivalent of Cu2+ is reached, with only a marginal
further increase upon addition of more Cu2+ (Figure 3.13). This is in agreement with
the notion that one equivalent was needed in order to stabilize the duplex D15 through
a copper(II)-mediated hydroxypyridone base pair.13

Chapter 3.2.5 Design of a GNA-based copper ion sensor
119
Metal ion selectivity
Selectivity is the most important characteristic as it determines the extent of
utility of any sensor. In order to evaluate whether this sensor exhibits selectivity
toward Cu2+, we first measured thermal stabilities of D15 in presence of different
metal ions by UV-monitored thermal melting. Figure 3.14 shows that D15 is only
stabilized by Cu2+ ion, other metal ions have no stabilization effect on D15.
0.00
0.02
0.04
0.06
0.08
0.10
0.12
20 30 40 50 60 70 80
Zn2+
Ni2+
Co2+
Cd2+
Cu2+
no metal
Hyp
erch
rom
icit
y
D153'-TATAPyr'HTAATMTAAA-2'2'-ATATHPyr'ATTAMATTT-3'
Temperature (oC)
Fe3+
Fe2+
Mn2+
Figure 3.14 Metal ion-dependent UV-melting curves of duplex D15 (see Table 3.3 for the sequences). Conditions: 10 mM sodium phosphate, 50 mM NaCl, pH 7.0, 1 equivalent metal ion and 2 µM of each strand of a duplex.

Chapter 3.2.5 Design of a GNA-based copper ion sensor
120
We next investigated the fluorescence properties of D15 with different metal ions
at different temperature. Figure 3.14 shows other metal ions such as Ni2+, Co2+, Zn2+,
Cd2+, Mn2+ or Fe2/3+ could not induce any excimer emission at 50 or 60 oC (Figure
3.15C and D), thus demonstrating D15 presents excellent selectivity in comparison
with other metal ions.
400 450 500 550 6000
100
200
300
400
500
600
700
800D)
RF
U
Wavelength (nm)
Cu2+
Zn2+
Ni2+
Co2+
Cd2+
Fe3+
Fe2+
Mn2+
400 450 500 550 6000
200
400
600
800
B) Cu2+
Zn2+
Ni2+
Co2+
Cd2+
Fe3+
Fe2+
Mn2+R
FU
Wavelength (nm)
400 450 500 550 6000
200
400
600
800
A) Cu2+
Zn2+
Ni2+
Co2+
Cd2+
Fe3+
Fe2+
Mn2+
RF
U
Wavelength (nm)
400 450 500 550 6000
100
200
300
400
500
600
700
800C)
RF
U
Wavelength (nm)
Cu2+
Zn2+
Ni2+
Co2+
Cd2+
Fe3+
Fe2+
Mn2+
Figure 3.15 Metal ion-selectivity of sensor D15 at different temperatures (see Table 3.3 for the sequences). Conditions: 10 mM sodium phosphate, 50 mM NaCl, pH 7.0, 1 equivalent metal ion and 2 μM of each strand of duplex, excitation at 315 nm with cutoff filter at 325 nm. A) 25 oC. B) 40 oC. C) 50 oC. D) 60 oC.

Chapter 3.2.6 Design of a new generation GNA-based copper ion
121
Chapter 3.2.6 Design of a new generation GNA-based copper ion
As reported in chapter 3.2.5, the GNA-based sensor D15 showed a good
selectivity for Cu2+ ions in optimized conditions (see Figure 3.15 for more details).
Unfortunately, D15 cannot be used in living cell, since living cell has high salt
concentration (0.9% NaCl, nearly 150 mM), and it can not stand the temperature
higher than 37 oC. We tried to modify current sensor for developing a GNA-based
copper ion sensor for using in living cell.
Figure 3.16 Structure of the copper-mediated hydroxypyridone-pyridylpurine hetero-base pairs (M = hydroxypyridone, P = pyridylpurine).
It has been reported that the hydroxypyridone-pyridylpurine hetero-base pair
(M:P) behaves similarly to the hydroxypyridone homo-base pair in its metal
selectivity, but the stabilization of M:P by Cu2+ surpasses the M:M. We expected that
replacing of M:M base pair with M:P in sensor duplex may be improve the sensitivity
of sensor. Normally, DNA duplexes with dangling ends have increased stability. It has
also been reported that a dangling pyrene base at 5′-end of DNA stabilizes the duplex
by 23 oC.1b We thus expect that moving pyrene acetylide nucleotide Pyr′ to the end of

Chapter 3.2.6 Design of a new generation GNA-based copper ion
122
GNA duplex might increase the stability of duplexes. Therefore, we designed the
following duplex sequence as a new sensor:
D19 3′-ATTPATTTTPyr′C3-2′ 2′-TAAMTAAAAHPyr′-3′
We investigated the fluorescence properties of duplex D19 in the presence or
absence of CuCl2 at 37 oC (Figure 3.17). In the absence of CuCl2, D19 exhibits
regular emission at around 400 nm (Figure 3.17, black line), indicating the two stands
of D19 were mainly dissociated. Upon the addition of one equivalent of CuCl2, D19
yields strong excimer emission (500 nm).
350 400 450 500 550 600
0
100
200
300
400
500
600
700
800
900
1000
D193'-ATTPATTTTPyr'C3-2'
2'-TAAMTAAAAHPyr'-3'
RF
U
Wavelength (nm)
no Cu2+
1 equiv. Cu2+
37 oC
Figure 3.17 Copper(II)-dependent fluorescence properties of duplex D19. Conditions: 10 mM sodium phosphate, pH 7.0, 100 mM NaCl, and 2 µM each strand of a duplex, excitation at 315 nm with cutoff filter at 325 nm, 37 oC.
Thermal stability and fluorescence studies of D19 with different metals show that
D19 has good selectivity for Cu2+ ion. Figure 3.18A reveals that only Cu2+ ion
stabilizes D19 strongly, Ni2+, Co2+ or Zn2+ only stabilizes D19 very slightly. Figure
3.18B shows that D19 only exhibits strong excimer emission in the presence of Cu2+,
in contrast, other metal ions such as Ni2+, Co2+, Zn2+, Cd2+, Mn2+ or Fe2/3+ do not
show any effect.

Chapter 3.2.6 Design of a new generation GNA-based copper ion
123
0.00
0.02
0.04
0.06
0.08
0.10
0.12
20 30 40 50 60 70 80
3'-ATTPATTTTPyr'C3-2'
2'-TAAMTAAAAHPyr'-3'H
yper
chro
mac
ity
Zn2+
Ni2+
Cd2+
Co2+
Fe3+
Fe2+
Mn2+
Temperature (oC)
Cu2+
A)
D19
no metal
400 450 500 550 600
0
500
1000
1500
2000
2500
3000
D193'-ATTPATTTTPyr'C3-2'
2'-TAAMTAAAAHPyr'-3'B)
RF
U
Wavelength (nm)/Ex:365nm
D19, 37 oC
Cu2+
Zn2+
Ni2+
Co2+
Cd2+
Fe3+
Fe2+
Mn2+ no metal
Figure 3.18 (A) Metal-dependent UV-melting curves of duplex D19. Conditions: 10 mM sodium phosphate, 100 mM NaCl, pH 7.0, 1 equivalent metal ion and 2 µM each strand of a duplex. (B) Metal ion-selectivity of sensor D19. Conditions: 15 mM sodium phosphate, 153 mM NaCl, pH 7.0, 1 equivalent ion and 1 μM each strand of duplex, excitation at 365 nm with cutoff filter at 420 nm, 37 oC.
It is worthy to note that regular emission and excimer emission of pyrene
acetylide are strongly increased upon excitation at 365 nm in comparison with that
upon excitation at 315 nm.
400 450 500 550 6000
100
200
300
400
500
600
700
800
900
1000
1100
3'-ATTPATTTTPyr'C3-2'
2'-TAAMTAAAAHPyr'-3'D19
RF
U
Wavelength (nm)
no Cu2+
2 equiv. Cu2+
4 equiv. Cu2+
8 equiv. Cu2+
12 equiv. Cu2+
37 oC
Figure 3.19 Copper(II)-sensing with GNA D19 in Dulbecco’s Modified Eagle’s medium. Conditions: in Dulbecco’s Modified Eagle’s medium, 1 µM each strand of a duplex, excitation at 365 nm with cutoff filter at 420 nm, 37 oC.
For testing the applicability of sensor D19 in biological system, we first studied
fluorescence properties of the D19 in the presence and absence of CuCl2 in

Chapter 3.2.6 Design of a new generation GNA-based copper ion
124
Dulbecco’s Modified Eagle’s medium. Dulbecco’s Modified Eagle’s medium is
widely used in cell culture, and is mainly consists of NaCl (6.4 g/L), NaHCO3 (3.7
g/L) and L-glutamine (0.58 g/L). Figure 3.19 shows that only weak excimer emission
is observed when four equivalent or above CuCl2 is added. The sensitivity of D19 is
dropped dramatically in Dulbecco’s Modified Eagle’s medium, based on this
disappointed result, we did not proceed the experiment with living cell.
Chapter 3.3 Conclusions
125
Chapter 3.3 Conclusions
In this chapter, we investigated the properties of GNA duplexes containing
fluorescent pyrene nucleotides. Pyrene phosphoramidite building block 10b and
pyrene acetylide phosphoramidite building block 15c were used to synthesize GNA
strands with incorporated pyrene (Pyr) and acetylide pyrene (Pyr′) nucleotides.
Pyrene acetylide GNA nucleotides enable to monitor duplex formation by excimer
fluorescence detection, and this was applied to the design of copper(II) ion sensor.
Although D15 is a very sensitive and selective Cu2+ “turn-on” fluorescent sensors, our
attempt to develop a Cu2+ sensor in real biological system was failed.
Chapter 3.4 Experimental
126
Chapter 3.4 Experimental
GNA oligonucleotide synthesis and purification (General protocol)
The synthesis and purification of phosphoramidites was followed by repeated
coevaporation with toluene to remove trace amounts of water. Then the
phosphoramidites was left under high vacuum and repeatedly dissolved and
evaporated with methylene chloride to remove traces of toluene. The
phosphoramdites were left overnight under high vacuum. The phosphoramidites were
dissolved using anhydrous acetonitrile to a final concentration of 100 mM. Solid
supports were synthesized from the dimethoxytrityl protected nucleosides as
previously reported.19
All oligonucleotides were prepared on an ABI 394 DNA/RNA Synthesizer on a 1
micromole scale. A standard protocol for 2-cyanoethyl phosphoramidites (0.1 M) was
used, except that the coupling was extended to 3 minutes. After the trityl-on synthesis,
the resin was incubated with conc. Aq. NH3 at 55 oC for 12 h and then evaporated.
The tritylated oligonucleotides were purified by C18 reverse phase HPLC (Merck
LiChroCART 250 × 4.6 mm, Purospher STAR RP-18e) with 0.05 M aq. TEAA and
MeCN as the eluent (gradient: 15–80% MeCN in 20 min). The oligonucleotides were
then detritylated with 80% AcOH for 20 min, precipitated with i-PrOH after addition
of NaOAc, and again purified by HPLC. In an alternative protocol, the tritylated
oligonucleotides were purified by Water Sep-Pak classic C18 cartridges. The trityl-off
oligonucleotides were purified by using a Waters Xterra column (MSC18, 4.6 × 50
mm) at 55 oC with 0.05 M aq. TEAA and MeCN as the eluent.
The identities of all oligonucleotides were confirmed by MALDI-TOF MS (Table
3.4). Samples were prepared at a concentration of approximately 10 μM. One
microliter of a saturated solution of trihydroxyacetophenone in 50% aqueous
acetonitrile was mixed with one microliter of 100 mM ammonium tartrate and then
one microliter of the GNA sample. The drided sample was then analyzed in the

Chapter 3.4 Experimental
127
negative mode for detection of the sample mass.
Thermal denaturation
The melting studies were carried out in 1 cm path length quartz cells (total
volume 325 µL; 200 µL sample solutions were covered by mineral oil) on a Beckman
800 UV-VIS spectrophotometer equipped with a thermo-programmer. Melting curves
were monitored at 260 nm with a heating rate of 1 oC/min. Melting temperatures were
calculated from the first derivatives of the heating curves. Experiments were
performed in duplicate and mean values were taken.
Fluorescence measurements
The experiments were performed in 96-well plates on a Molecular Devices
SpectraMax M5.
CD spectroscopy
CD measurements were performed on a JASCO J-810 spectrometer in a 1 mm
path length quartz cuvette. The GNA single strands or duplexes were prepared in 10
mM sodium phosphate, 100 mM NaCl, pH 7.0, and the concentration of each strand
was 8 M. Each measurement was repeated 5 times and the average taken.

Chapter 3.4 Experimental
128
Table 3.4 MALDI-TOF MS data of used oligonucleotides.
Name Oligonucleotides Mcalcd Mfound
D1 3′-TAAAAATAATAATATT-2′ C128H167N62O74P15(4220.7) 4223.3
2′-ATTTTTATTATTATAA-3′ C128H171N50O82P15(4184.7) 4185.5
D2 3′-TAAAAATHATAATATT-2′ C122H162N57O74P15(4073.7) 4076.0
2′-ATTTTTAPyrTATTATAA-3′ C139H175N48O80P15(4260.7) 4161.8
D3 3′-TAAAAATMeATAATATT-2′ C123H164N57O74P15(4087.7) 4090.3
2′-ATTTTTAPyrTATTATAA-3′ C139H175N48O80P15(4260.7) 4161.8
D4 3′-TAAAAATMeMeTAATATT-2′ C118H161N52O74P15(3954.6) 3956.6
2′-ATTTTTAPyrPyrATTATAA-3′ C150H179N46O78P15(4336.8) 4339.1
D5 3′-TAAAAATPyrPyrTAATATT-2′ C150H177N52O74P15(4354.8) 4356.0
2′-ATTTTTAMeMeATTATAA-3′ C118H163N46O78P15(3936.6) 3938.1
D6 3′-TAAAAATMePyrTAATATT-2′ C134H169N52O74P15(4154.7) 4155.9
2′-ATTTTTAPyrMeATTATAA-3′ C134H171N46O78P15(4136.7) 4137.5
D7 3′-TAAAAATPyrMeTAATATT-2′ C134H169N52O74P15(4154.7) 4156.5
2′-ATTTTTAMePyrATTATAA-3′ C134H171N46O78P15(4136.7) 4137.7
D8 3′-TAAAAATPyr′ATAATATT-2′ C141H172N57O74P15(4311.7) 4313.9
2′-ATTTTTAMeTATTATAA-3′ C123H167N48O80P15(4060.7) 4062.8
D9 3′-TAAAAATPyr′ATAATATT-2′ C141H172N57O74P15(4311.7) 4313.9
2′-ATTTTTAHTATTATAA-3′ C122H165N48O80P15(4046.6) 4048.2
D10 3′-TAAAAATHHTAATATT-2′ C116H157N52O74P15(3926.6) 3928.8
2′-ATTTTTAPyr′Pyr′ATTATAA-3′ C154H179N46O78P15(4384.8) 4387.1
D11 3′-TAAAAATPyr′Pyr′TAATATT-2′ C154H177N52O74P15(4402.8) 4405.2
2′-ATTTTTAHHATTATAA-3′ C116H159N46O78P15(3908.5) 3910.0
D12 3′-TAAAAATHPyr′TAATATT-2′ C135H167N52O74P15(4164.7) 4165.4
2′-ATTTTTAPyr′HTTATAA-3′ C135H169N46O78P15(4146.7) 4147.1
D13 3′-TAAAAATPyr′HTAATATT-2′ C135H167N52O74P15(4164.7) 4166.5
2′-ATTTTTAHPyr′ATTATAA-3′ C135H169N46O78P15(4146.7) 4148.6
D14 3′-TATPyr′HAAATAATMAAA-2′ C136H167N54O72P15(4174.6) 4174.9
2′-ATAHPyr′TTATTAMTTT-3′ C136H172N39O82P14(4129.5) 4128.7
D15 3′-TATAPyr′HTAATMTAAA-2′ C128H158N46O70P14(3892.7) 3893.3
2′-ATATHPyr′ATTAMATTT-3′ C128H160N40O74P14(3874.7) 3875.6
D16 3′-AATATTATTATTTTAPyr′C3-2′ C144H128N48O84P16(4424.8) 4424.7
2′-TTATAATAATAAAATHPyr′-3′ C143H177N57O78P16(4437.9) 4437.3
D17 3′-AATATTATTATTTTAHPyr′C3-2′ C146H187N48O88P17(4548.9) 4545.5
2′-TTATAATAATAAAATPyr′-3′ C141H172N57O74P15(4313.8) 4312.1
D18 3′-ATTATTPATTTTPyr′C3-2′ C125H153N36O70P13(3682.4) 3684.5
2′-TAATAAMTAAAAHPyr′-3′ C120H146N47O62P13(3641.4) 3643.0
D19 3′-ATTPATTTTPyr′C3-2′ C101H121N27O54P10(2886.9) 2886.8
2′-TAAMTAAAAHPyr′-3′ C96H115N35O48P10(2836.9) 2837.1

Chapter 3.5 Reference
129
Chapter 3.5 References
1. (a) Ren, R. X.-F; Chaudhuri, N. C.; Paris, P. L.; Rumney, S. and Kool, E. T.
Journal of American Chemical Society 1996, 118, 7671; (b) Guckian, K. M.;
Schweitzer, B. A.; Ren, R. X.-F.; Sheils, C. J.; Paris, P. L.; Tahamassebi, D. C.
and Kool, E. T. Journal of American Chemical Society 1996, 118, 8182; (c)
Matray, T. J. and Kool, E. T. Journal of American Chemical Society 1998, 120,
6191; (d) Guckian, K. M.; Schweitzer, B. A.; Ren, R. X.-F.; Sheils, C. J.; Paris, P.
L.; Tahamassebi, D. C. and Kool, E. T. Journal of American Chemical Society
2000, 122, 2213.
2. Cho, Y. J. and Kool, E. T. ChemBioChem 2006, 7, 669.
3. (a) Sun, L. P.; Wang, M.; Kool, E. T. and Taylor, J.-S. Biochemistry 2000, 39,
14603; (b) Sun, L. P.; Zhang, K. J.; Zhou, L. L.; Hohler, P.; Kool, E. T.; Yuan, F.
H.; Wang, Z. G. and Taylor, J.-S. Biochemistry 2003, 42, 9431.
4. Lewis, F. D.; Zhang, Y. F. and Letsinger, R. L. Journal of American Chemical
Society 1997, 119, 5451.
5. Okamoto, A.; Kanatani; K. and Saito, I. Journal of American Chemical Society
2004, 126, 4820.
6. (a) Kierzek, R.; Li, Y.; Turner, D. H.; Bevilacqua, P. C. Journal of American
Chemical Society 1993, 115, 4985; (b) Bevilacqua, P. C.; Kierzek, R.; Johnson, K.
A.; Turner, D. H. Science 1992, 258, 1355; (c) Yamana, K.; Gokota, T.; Ozaki,
H.; Nakano, H.; Sangen, O.; Shimidzu, T. Nucleosides & Nucleotides 1992, 11,
383; (d) Okamoto, A.; Ochi, Y. and Saito, I. Chemical Communication 2005,
1128.
7. (a) Jung, D.; Cho, Y.; Meyer, J. N. and Di Giulio, R. T. Comparative
Biochemistry and Physiology, Part C 2009, 149, 182; (b) Tang, S.-C.; Sheu, G.-T.;
Wong, R.-H.; Weng, M.-W.; Lee, L.-W. and Hsu, C.-P. Toxicology Letters 2010,
192, 316.
8. (a) Saito, Y.; Miyauchi, Y.; Okamoto, A. and Saito, I. Chemical communication

Chapter 3.5 Reference
130
2004, 1704; (b) Mahara, A.; Iwase, R.; Sakamoto, Y.; Yamana, K.; Tamaoka, T.
and Murakami, A. Angewandte Chemie International Edition 2002, 41, 3648; (d)
Zhang, Y. and Letsinger, R. L. Journal of American Chemical Society 1997, 119,
5451.
9. Malinovskii, V. L.; Samain, F. and Hӓner, R. Angewandte Chemie International
Edition 2007, 46, 4464.
10. (a) M-Enthart, E. and Wagenknecht, H.-A. Angewandte Chemie International
Edition 2006, 45, 3372; (b) Barbaric, J. and Wagenknecht, H.-A. Organic &
Biomoleculor Chemistry 2006, 4, 2088.
11. Hissler, M.; Harriman, A.; Khatyr, A. and Ziessel, R. Chemistry - A European
Journal 1999, 5, 3366.
12. Tanaka, K.; Tengeiji, A.; Kato, T.; Toyama, N.; Shiro, M. and Shionoya, M.
Journal of American Chemistry Society 2002, 124, 12494.
13. Schlegel, M. K.; Zhang, L.; Pagano, N. and Meggers, E. Organic & Biomoleculor
Chemistry 2009, 7, 476-482.
14. Zhang, L.; Peritz, A. E.; Carroll, P. J.; Meggers, E. Synthesis 2006,645.
15. (a) Ferreira, F.; Meyer, A.; Vasseur, J.-J. and Morvan, F. Journal Organic
Chemistry 2005, 70, 9198; (b) Mahajan, S.; Kumar, P. and Gupta, K. C.
Bioconjugate Chemistry 2006, 17, 1184.
16. (a) Fathi, R.; Rudolph, M. J.; Gentles, R. G.; Patel, R.; Macmillan, E.W.; Reitman,
M. S.; Pelham, D. and Cook, A. F. Journal of Organic Chemistry 1996, 61, 5600;
(b) Fontanel, M.-L.; Bazin, H. and Teoule, R. Nucleic Acids Research 1994, 22,
2022.
17. Damha, M. J.; Giannaris, P. A.; Zabarylo, S. V. Nucleic Acids Research 1990, 18,
3813-3821.
18. Yang, S.-W.; Elangovan, A.; Hwang, K. -C. And Ho, T.-I. Journal of Physical
chemistry B 2005, 109, 16628-16635.
19. Damha, M. J.; Giannaris, P. A.; Zabarylo, S. V. Nucleic Acids Research 1990, 18,
3813-3821.

Chapter 4 Incorporation of porphyrin acetylides into GNA
131
Chapter 4 Incorporation of Porphyrin Acetylides into
Duplexes of the Simplified Nucleic Acid GNA

Chapter 4.1 Introduction
132
Chapter 4.1 Introduction
Porphyrins are heterocyclic macrocycles composed of four modified pyrrole
subunits interconnected at their α carbon atoms via methine bridges. Due to the
unique and highly tunable chemical and photophysical properties, porphyrins have
been introduced extensively into DNA for following four purposes:
[1] As DNA binding agents: Porphyrins are one of the most widely investigated
DNA binding agents. Porphyrins have been employed for studies on electron
transfer through DNA,1 nucleic acid-directed porphyrin aggregation2,
potential DNA damage induced by sensitizers for photodynamic therapy of
neoplastic tissue3, and so on.
[2] As sensors of DNA probes: Porphyrins have been attracted widespread
attention as chromophores for studies on circular dichroism (CD), owing to
their unique electronic and geometric properties. They are capable of serving
as versatile and powerful CD reporter groups to detect DNA conformational
changes,4 porphyrin-DNA interaction,5 and conformation of porphyrins in
DNA.6 Moreover, porphyrins’ unique UV-vis absorption and fluorescence
spectra enable themselves to be spectroscopic sensors for conformation
studies of DNA.6,7
Figure 4.1 Porphyrin artificial C-nucleoside.
[3] As an artificial base in DNA: Porphyrins, which contain flat aromatic
heterocycle and entirely hydrophobic core, are incorporated into DNA as the
artificial base, and strongly intercalate in the duplex when introduced in the
Chapter 4.1 Introduction
133
middle of DNA.8,9 Although the non-hydrogen base pair of porphyrin and
abasic site destabilize duplex significantly, the well-designed structures with
porphyrin C-nucleotides as dangling ends could provide substantial
stabilization of the helix.9
[4] As a building block for constructing a highly ordered nanostructure:
Researches on DNA as supramolecular scaffolds to create high ordered
structures have achieved impressive progress, such as in producing helical
multiporphyrin arrays,11 which are attractive for the design of artificial light
harvesting systems and photoelectrical devices.10 Up to eleven porphyrines
were introduced into DNA through attachment of porphyrins to position 5 of
2′-deoxyuridine via a rigid acetylene spacer, offering helical porphyrin arrays
in single strand or within the major groove of duplexes.11a,c
However, there are only very few reports in which porphyrins are placed in the
interior of the DNA as part of the -stacking, most likely due to the challenging
synthesis of the necessary porphyrin nucleotide building blocks.7,9
As discussed before, GNA has been employed as a convenient duplex scaffold for
the generation of functional architectures recently.12 Thus, the high duplex stabilities
exceeding the stabilities of analogous DNA and RNA duplexes, in combination with
an economical and fast synthesis of (modified) phosphoramidite building blocks,
render GNA an attractive nucleic acid scaffold for introduction of porphyrin in the
interior of the molecule.
In this part, we described the incorporation of a porphyrin-modified GNA
nucleotide into GNA, and behavior of such non-metallated and metallated porphyrins
in the context of GNA duplexes.

Chapter 4.2.1 Synthesis of porphyrin-GNA
134
Chapter 4.2 Results and Discussion
Chapter 4.2.1 Synthesis of porphyrin-GNA
We were looking for a propane-1,2-diol-modified porphyrin building block that
has a unique combination properties: (i) The building block is capable of stacking in
GNA duplexes opposite an ethylene glycol spacer as shown in Figure 4.2; and (ii) the
phosphoramidite building block is synthetically easily accessible. Based on these two
criteria we selected 18c as the phosphoramidite building block, which was used to
synthesize GNA strands with incorporated diphenylporphyrin acetylide nucleotides (P,
Figure 4.2).
Figure 4.2 (A) Structure of porphyrin acetylide phosphoramidite 18c. (B) Constitution of the (S)-GNA backbone. P:H and PM:H base pairs used in this study.
The porphyrin-GNA strands were synthesized according to previous method. Due
to the low solubility in the standard solvent acetonitrile, porphyrin acetylide
phosphoramidite 18c was dissolved in THF for the use in the DNA synthesizer and
the coupling times were extended to 15 minutes. The synthesis and detritylation of
GNA strands was followed by an additional purification step with a reversed phase
HPLC column, the porphyrin-containing GNA strands were obtained in high purities
and devoid of the Zinc ions, most likely due to the acidic conditions during the

Chapter 4.2.1 Synthesis of porphyrin-GNA
135
individual detritylation steps.11a
However, zinc(II), manganese(II) and nickel(II) ions could be readily
(re)introduced into the coordination sites of the porphyrin nucleotides in GNA
oligunucleotides to give PM (Figure 4.2) by mixing the purified single strands with
Zn(OAc)2, Ni(OAc)2 and MnCl2 in Tris-HCl buffered solution. Other metal ions we
tested which could not be introduced into porphyrin properly, for example, CdSO4,
FeCl2 or FeCl3 do not metallate the porphyrin in GNA, while CuCl2 leads to the
decomposition of GNA strands during the reaction.
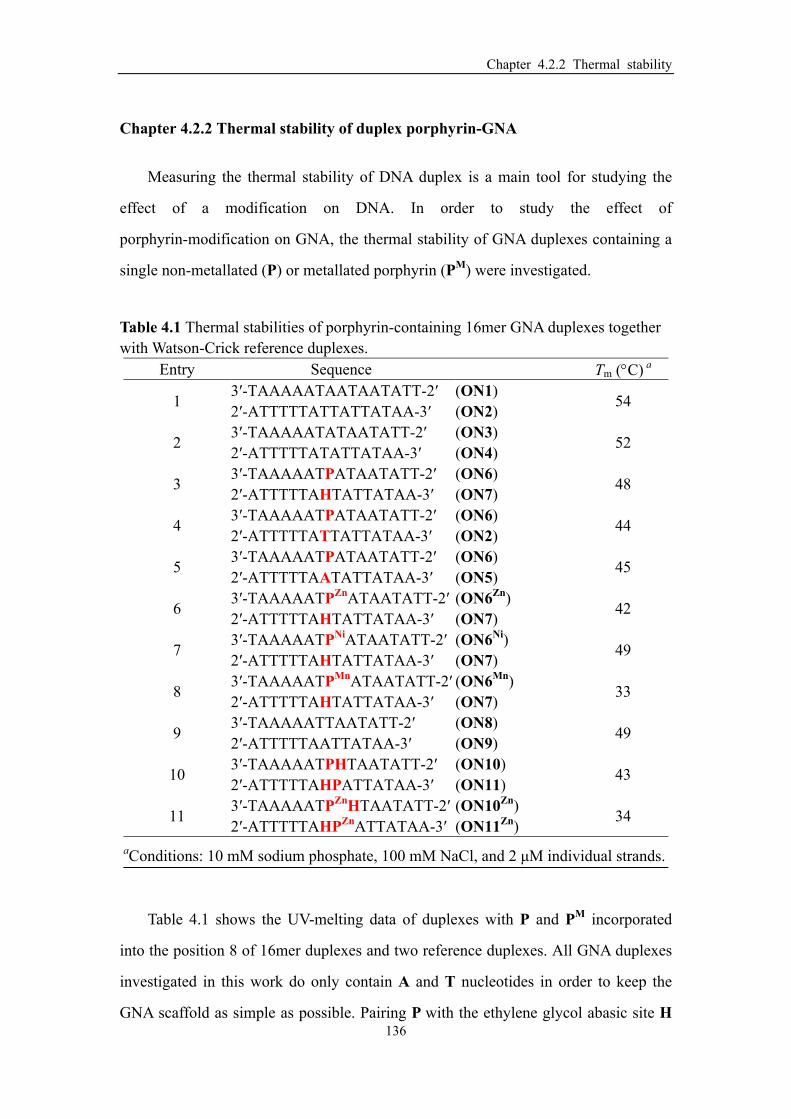
Chapter 4.2.2 Thermal stability
136
Chapter 4.2.2 Thermal stability of duplex porphyrin-GNA
Measuring the thermal stability of DNA duplex is a main tool for studying the
effect of a modification on DNA. In order to study the effect of
porphyrin-modification on GNA, the thermal stability of GNA duplexes containing a
single non-metallated (P) or metallated porphyrin (PM) were investigated.
Table 4.1 Thermal stabilities of porphyrin-containing 16mer GNA duplexes together with Watson-Crick reference duplexes.
Entry Sequence Tm (C) a
1 3′-TAAAAATAATAATATT-2′ 2′-ATTTTTATTATTATAA-3′
(ON1) (ON2)
54
2 3′-TAAAAATATAATATT-2′ 2′-ATTTTTATATTATAA-3′
(ON3) (ON4)
52
3 3′-TAAAAATPATAATATT-2′ 2′-ATTTTTAHTATTATAA-3′
(ON6) (ON7)
48
4 3′-TAAAAATPATAATATT-2′ 2′-ATTTTTATTATTATAA-3′
(ON6) (ON2)
44
5 3′-TAAAAATPATAATATT-2′ 2′-ATTTTTAATATTATAA-3′
(ON6) (ON5)
45
6 3′-TAAAAATPZnATAATATT-2′ 2′-ATTTTTAHTATTATAA-3′
(ON6Zn) (ON7)
42
7 3′-TAAAAATPNiATAATATT-2′ 2′-ATTTTTAHTATTATAA-3′
(ON6Ni) (ON7)
49
8 3′-TAAAAATPMnATAATATT-2′ 2′-ATTTTTAHTATTATAA-3′
(ON6Mn) (ON7)
33
9 3′-TAAAAATTAATATT-2′ 2′-ATTTTTAATTATAA-3′
(ON8) (ON9)
49
10 3′-TAAAAATPHTAATATT-2′ 2′-ATTTTTAHPATTATAA-3′
(ON10) (ON11)
43
11 3′-TAAAAATPZnHTAATATT-2′ 2′-ATTTTTAHPZnATTATAA-3′
(ON10Zn) (ON11Zn)
34
aConditions: 10 mM sodium phosphate, 100 mM NaCl, and 2 μM individual strands.
Table 4.1 shows the UV-melting data of duplexes with P and PM incorporated
into the position 8 of 16mer duplexes and two reference duplexes. All GNA duplexes
investigated in this work do only contain A and T nucleotides in order to keep the
GNA scaffold as simple as possible. Pairing P with the ethylene glycol abasic site H

Chapter 4.2.2 Thermal stability
137
afforded a duplex melting point (Tm) of 48 °C (Table 4.1, entry 3), compared to 54 °C
for an A:T base pair at the same position (Table 4.1, entry 1). Removing one A:T base
pair of the Watson-Crick reference duplex as in ON3:ON4 (Table 4.1, entry 2)
resulted in a melting point of 52 °C, thus demonstrating that the incorporation of a
single P:H base pair has a net destabilizing effect of ∆Tm = 4 °C. Replacing the abasic
site H of the P:H base pair in ON6:ON7 (Table 4.1, entry 3) for the natural
nucleobases T or A, resulting in P:T and P:A base pairs, reduces the stability by
additional 4 and 3 °C, respectively (Table 4.1, entries 4 and 5). Apparently, these
larger natural nucleobases cannot be accommodated well opposite the space
consuming diphenylporphyrin acetylide nucleobase P, suggesting that the porphyrin
nucleobase is accommodated within the π-π stacking of the GNA duplex.
20 30 40 50 60
0.00
0.05
0.10
0.15
0.20
0.25
0.30
0.35
Hyp
erch
rom
icit
y
Temperature (oC)
ON3 : ON4A) ON6 : ON7 ON6 : ON2 ON6 : ON5
20 30 40 50 60
0.00
0.05
0.10
0.15
0.20
0.25B)
Hyp
erch
rom
icit
y
Temperature oC
ON6 : ON7
ON6Zn : ON7
ON6Ni : ON7
ON6Mn : ON7
Figure 4.3 UV-melting curves of GNA duplexes. Changes in absorbance upon heating as monitored at 260 nm. Conditions: 10 mM sodium phosphate, 100 mM NaCl, pH 7.0, and 2 M of each strand. (A) Duplexes ON3:ON4, ON6:ON7, ON6:ON2, and ON6:ON5. (B) Duplexes ON6:ON7, ON6Zn:ON7, ON6Ni:ON7, and ON6Mn:ON7 (see Tables 4.1 for the sequences).
Interestingly, the incorporation of a Zn2+ ion or Mn2+ ion into the porphyrin
results in a significant further destabilization for duplex containing PZn:H base pair
(Tm = 42 °C, Table 4.1, entry 6), or PMn:H base pair (Tm = 33 °C, Table 4.1, entry 8)
respectively. Whereas the incorporation of a Ni2+ ion slightly increases the stability
compared to P:H (∆Tm = + 1 °C), and is only by 3 °C less stable than ON3:ON4.
These modulations of duplex stabilities by the nature of the metal ion incorporated

Chapter 4.2.2 Thermal stability
138
into the porphyrin nucleobases can be interpreted by their different coordination
behavior. Zn2+ and Mn2+ prefer to coordinate to axial ligands13a when incorporated
into a porphyrin in an octahedral fashion, and needs to dissociate these ligands if it
wants to stack within GNA between neighboring base pairs. In contrast, Ni2+ prefers
square planar coordination and can thus be accommodated easily in the base
stacking.13b
20 30 40 50 60 70
0.00
0.05
0.10
0.15
0.20
0.25
0.30
ON10 : ON11 ON3 : ON4
Temperature (oC)
Hyp
erch
rom
icit
y
ON10Zn : ON11Zn
Figure 4.4 UV-melting curves of GNA duplexes ON3:ON4, ON10:ON11 and ON10Zn:ON11Zn (see Tables 4.1 for the sequences). Changes in absorbance upon heating as monitored at 260 nm. Conditions: 10 mM sodium phosphate, 100 mM NaCl, pH 7.0, and 2 M of each strand.
Duplexes containing two adjacent porphyrin acetylide nucleobases were also
investigated. Incorporation of a second adjacent P:H base pair positioning the
porphyrins on opposite strands (Table 4.1, entry 10) reduces the duplex melting
temperature further (Tm = 43 °C), being 6 °C below the melting temperature of a
reference duplex that is devoid of the two P:H base pairs (Table 4.1, entry 9).
Nevertheless, the incorporation of two adjacent P:H base pairs still affords a duplex
that is thermally stable at room temperature. As expected, the introduction of Zn2+
ions into the two porphyrins strongly destabilized the duplex to Tm = 34 °C (Table 4.1,
entry 11), similar to what was observed in duplex with a single Zn(II)-porphyrin
(Table 4.1, entry 6).

Chapter 4.2.2 Thermal stability
139
Table 4.2 Thermal stabilities of porphyrin-containing 22mer GNA duplexes together with Watson-Crick reference duplexes.
Entry Sequence Tm (C)a
1 3′-TTATAAAAATAATAATATTAAT-2′ 2′-AATATTTTTATTATTATAATTA-3′
(ON12) (ON13)
63
2 3′-TTATAAAAATTAATATTAAT-2′ 2′-AATATTTTTAATTATAATTA-3′
(ON14) (ON15)
61
3 3′-TTATAAAAATPHTAATATTAAT-2′ 2′-AATATTTTTAHPATTATAATTA-3′
(ON16) (ON17)
56
4 3′-TTATAAAAATHPTAATATTAAT-2′ 2′-AATATTTTTAPHATTATAATTA-3′
(ON18) (ON19)
56
5 3′-TTATAAAAATPZnHTAATATTAAT-2′ 2′-AATATTTTTAHPZnATTATAATTA-3′
(ON16Zn) (ON17Zn)
48
6 3′-TTATAAAAATPNiHTAATATTAAT-2′ 2′-AATATTTTTAHPNiATTATAATTA-3′
(ON16Ni) (ON17Ni)
59
7 3′-TTATAAAAATPZnHTAATATTAAT-2′ 2′-AATATTTTTAHPNiATTATAATTA-3′
(ON16Zn) (ON17Ni)
54
8 3′-TTATAAAAATPNiHTAATATTAAT-2′ 2′-AATATTTTTAHPZnATTATAATTA-3′
(ON16Ni) (ON17Zn)
52
9 3′-TTATAAAAATPMnHTAATATTAAT-2′ 2′-AATATTTTTAHPMnATTATAATTA-3′
(ON16Mn) (ON17Mn)
51
10 3′-TTATAAAAATHPZnTAATATTAAT-2′ 2′-AATATTTTTAPZnHATTATAATTA-3′
(ON18Zn) (ON19Zn)
49
11 3′-TTATAAAAATHPNiTAATATTAAT-2′ 2′-AATATTTTTAPNiHATTATAATTA-3′
(ON18Ni) (ON19Ni)
60
12 3′-TTATAAAAATHPMnTAATATTAAT-2′ 2′-AATATTTTTAPMnHATTATAATTA-3′
(ON18Mn)(ON19Mn)
52
aConditions: 10 mM sodium phosphate, 100 mM NaCl, and 2 μM individual strands.
Due to this general destabilization trend, we continued to evaluate duplexes
containing two porphyrins in longer (22mer) and thus more stable duplexes as
displayed in Table 4.2. These data confirm that two adjacent P:H base pairs in
opposite orientation lead to a destabilization relative to the reference duplexes
ON12:ON13 and ON14:ON15, but still provide duplexes with robust stabilities
(Table 4.2, entries 1-4). And this stability can be modulated by the incorporation of
Zn2+ (further destabilization), Mn2+ (further destabilization) and Ni2+ (stabilization
relative to the free porphyrin). Duplex ON16Ni:ON17Ni containing
nickel(II)-porphyrin is only by 1 °C less stable than the reference duplex (Table 4.2,
entries 5-12).

Chapter 4.2.2 Thermal stability
140
20 30 40 50 60 70 80
0.00
0.05
0.10
0.15
0.20
0.25
0.30 OD14 : OD15 OD18 : OD19 OD18Zn : OD19Zn
OD18Ni : OD19Ni
B)
Temperature (oC)
Hyp
erch
rom
icit
y
OD18Mn : OD19Mn
20 30 40 50 60 70 80
0.00
0.05
0.10
0.15
0.20
0.25
0.30 OD14 : OD15
Temperature (oC)
Hyp
erch
rom
icit
y
OD16 : OD17 OD16Zn : OD17Zn
OD16Ni : OD17Ni
A)
OD16Mn : OD17Mn
Figure 4.5 UV-melting curves of GNA duplexes. Changes in absorbance upon heating as monitored at 260 nm. Conditions: 10 mM sodium phosphate, 100 mM NaCl, pH 7.0, and 2 M of each strand. (A) Duplexes ON14:ON15, ON16:ON17, ON16Zn:ON17Zn, ON16Ni:ON17Ni and ON16Mn:ON17Mn. (B) Duplexes ON14:ON15, ON18:ON19, ON18Zn:ON19Zn, ON18Ni:ON19Ni and ON18Mn:ON19Mn (see Table 4.2 for the sequences).
It is obvious that the slopes of the melting curves of GNA duplexes containing
porphyrins are more shallow compared to the related unmodified duplexes, which
might be caused by lower cooperativity among the nucleobases due to interference by
the porphyrin macrocycle (Figure 4.5).11 Additionally, the hyperchromicity of the
duplexes containing porphyrins is reduced, presumably due to a weaker stacking of
base pairs in proximity of P:H base pairs.

Chapter 4.2.3 Conformation of porphyrins in GNA
141
Chapter 4.2.3 Conformation of porphyrins in GNA
UV-Vis and circular dichroism spectroscopy are important tools for
understanding the relative conformation of closely located molecules. In addition, the
fluorescence of chromophores was also used in aggregation analysis. Here, we
investigated porphyrin-modified GNA by UV-vis, fluorescence and CD spectrometry
to get the conformation information of porphyrins in GNA.
UV-vis spectroscopy
Due to increased duplex stabilities we investigated the UV-vis absorption
properties of porphyrin GNA strands and the corresponding duplexes with the 22mer
system. We began by analyzing porphyrin-modified single strands without and with
incorporated zinc(II), Mn(II) and nickel(II) ions.

Chapter 4.2.3 Conformation of porphyrins in GNA
142
200 300 400 500 600 700
0.0
0.1
0.2
0.3
0.4
0.5
0.6
0.7
0.8
0.9
1.0A)
400 420 440 460 480 5000.0
0.1
0.2
0.3
0.4
0.5
0.6
0.7
0.8
471.0 nm
430.0 nm
426.0 nm
421.0 nm
Ab
sorb
ance
Wavelength (nm)
ON16
ON16Zn
ON16Ni
ON16Mn
200 300 400 500 600 700
0.0
0.1
0.2
0.3
0.4
0.5
0.6
0.7
0.8
0.9
1.0B)
400 420 440 460 480 500
0.0
0.2
0.4
0.6
0.8
471.0 nm
420.0 nm
428.0 nm
431.0 nm
Ab
sorb
ance
Wavelength (nm)
ON17
ON17Zn
ON17Ni
ON17Mn
200 300 400 500 600 700
0.0
0.2
0.4
0.6
0.8
1.0C)
400 420 440 460 480 5000.0
0.2
0.4
0.6
0.8
471.0 nm
430.0 nm
427.0 nm
419.0 nm
Ab
sorb
ance
Wavelength (nm)
ON18
ON18Zn
ON18Ni
ON18Mn
200 300 400 500 600 700
0.0
0.2
0.4
0.6
0.8
1.0D)
400 420 440 460 480 500
0.0
0.2
0.4
0.6
0.8
471.0 nm
431.0 nm
428.0 nm
420.0 nm
Ab
sorb
ance
Wavelength (nm)
ON19
ON19Zn
ON19Ni
ON19Mn
Figure 4.6 UV-vis Absorption spectra of porphyrin-GNA single strands without and with incorporated metal ions. Conditions: 10 mM sodium phosphate, 100 mM NaCl, pH 7.0, and 2 μM of single strands. (A) ON16, ON16Zn, ON16Ni and ON16Mn. (B) ON17, ON17Zn, ON17Ni and ON17Mn. (C) ON18, ON18Zn, ON18Ni and ON18Mn. (D) ON19, ON19Zn, ON19Ni and ON19Mn (see Tables 4.2 for the sequences). The insert shows the expanded porphyrin Soret band region.
Taking ON16 for example to illustrate the changes after metalation of porphyrin
in GNA, the UV-vis spectra of the single strands ON16, ON16Zn, ON16Mn and
ON16Ni are shown in Figure 4.6A and clearly confirm the successful insertion of the
metal ions into the porphyrins. The absorption spectrum of ON16 displays a Soret
band at 428 nm and four Q bands, while ON16Zn, ON16Mn and ON16Ni exhibit one
Soret band at 431 nm, 471 nm and 420 nm respectively, and just two Q bands. The
reduced number of Q bands is typical of metalloporphyrins.14 In addition, the obvious
red shift of the Soret band for ON16Zn and ON16Mn, and blue shift for ON16Ni are
consistent with the well-known red shift of porphyrin Soret bands upon Zn(II) or
Mn(II) coordination, and blue shift of Soret bands upon Ni(II) coordination.14 UV-vis

Chapter 4.2.3 Conformation of porphyrins in GNA
143
spectra of single strands ON17, ON18, ON19 and their metal derivatives are also
provided in Figure 4.6 and reveal the successful insertion of the metal ions into the
porphyrins.
Next, we compared the UV-vis spectra of duplexes and their corresponding single
strands in order to obtain information about the relative orientations of the porphyrin
units in the GNA duplexes. Pronounced changes in the absorption spectra were
observed upon duplex formation.
200 300 400 500 600 700
0.0
0.1
0.2
0.3
0.4
0.5
0.6
0.7
0.8
0.9
1.0
3'-TTATAAAAATPHTAATATTAAT-2' (ON16)2'-AATATTTTTAHPATTATAATTA-3' (ON17)
A)
380 390 400 410 420 430 440 450
0.0
0.1
0.2
0.3
0.4
0.5
0.6
0.7
0.8
428.0 nm426.0 nm
425.0 nm
409.0 nm
Ab
sorb
ance
Wavelength (nm)
ON16 : ON17 ON16 ON17
200 300 400 500 600 700
0.0
0.1
0.2
0.3
0.4
0.5
0.6
0.7
0.8
0.9
1.0
3'-TTATAAAAATPZnHTAATATTAAT-2' (ON16Zn)
2'-AATATTTTTAHPZnATTATAATTA-3' (ON17Zn)B)
380 390 400 410 420 430 440 450
0.0
0.1
0.2
0.3
0.4
0.5
0.6
0.7
0.8
431.0 nm430.0 nm
429.0 nm
412.0 nm
Ab
sorb
ance
Wavelength (nm)
ON16Zn : ON17Zn
ON16Zn
ON17Zn
200 300 400 500 600 700
0.0
0.1
0.2
0.3
0.4
0.5
0.6
0.7
0.8
0.9
1.0
3'-TTATAAAAATPNiHTAATATTAAT-2' (ON16Ni)
2'-AATATTTTTAHPNiATTATAATTA-3' (ON17Ni)C)
380 390 400 410 420 430 440 450
0.0
0.1
0.2
0.3
0.4
0.5
0.6
0.7
0.8
420.0 nm
421.0 nm404.0 nm
Ab
sorb
ance
Wavelength (nm)
ON16Ni : ON17Ni
ON16Ni
ON17Ni
200 300 400 500 600 700
0.0
0.1
0.2
0.3
0.4
0.5
0.6
0.7
0.8
0.9
1.0
3'-TTATAAAAATPZnHTAATATTAAT-2' (ON16Zn)
2'-AATATTTTTAHPNiATTATAATTA-3' (ON17Ni)D)
380 390 400 410 420 430 440 450
0.0
0.1
0.2
0.3
0.4
0.5
0.6
0.7
0.8
420.0 nm
430.0 nm
427.0 nm
407.0 nm
Ab
sorb
ance
Wavelength (nm)
ON16Zn : ON17Ni
ON16Zn
ON17Ni
Figure 4.7 UV-vis spectra of GNA duplexes and their corresponding single strands. Conditions: 10 mM sodium phosphate, 100 mM NaCl, pH 7.0, and 2 M of each strand. (A) ON16, ON17 and ON16:ON17. (B) ON16Zn, ON17Zn and ON16Zn:ON17Zn. (C) ON16Ni, ON17Ni and ON16Ni:ON17Ni. (D) ON16Zn, ON17Ni and ON16Zn:ON17Ni (see Tables 4.2 for the sequences). The inserts show expanded porphyrin Soret band regions.

Chapter 4.2.3 Conformation of porphyrins in GNA
144
As displayed in Figure 4.7, duplexes ON16:ON17, ON16Zn:ON17Zn,
ON16Ni:ON17Ni and ON16Zn:ON17Ni show clear peak splits of the Soret band. The
splitting energies between the low- and high-energy Soret bands are 920 cm-1 for
duplex ON16:ON17, 962 cm-1 for duplex ON16Zn:ON17Zn, and duplex
ON16Zn:ON17Ni with the mixed metal porphyrins having the highest excition energy
(1151 cm-1). The duplex ON16Ni:ON17Ni exhibits a broadened Soret band instead of
two distinct peaks.
200 300 400 500 600 700
0.0
0.1
0.2
0.3
0.4
0.5
0.6
0.7
0.8
0.9
1.0
3'-TTATAAAAATHPTAATATTAAT-2' (ON18)2'-AATATTTTTAPHATTATAATTA-3' (ON19)
A)
380 390 400 410 420 430 440 450
0.0
0.1
0.2
0.3
0.4
0.5
0.6
0.7
0.8
427.0 nm428.0 nm
415.0 nm
Ab
sorb
ance
Wavelength (nm)
ON18 : ON19 ON18 ON19
200 300 400 500 600 700
0.0
0.1
0.2
0.3
0.4
0.5
0.6
0.7
0.8
0.9
1.0
3'-TTATAAAAATHPZnTAATATTAAT-2' (ON18Zn)
2'-AATATTTTTAPZnHATTATAATTA-3' (ON19Zn)B)
380 390 400 410 420 430 440 450
0.0
0.1
0.2
0.3
0.4
0.5
0.6
0.7
0.8
431.0 nm430.0 nm
429.0 nm
411.0 nm
Ab
sorb
ance
Wavelength (nm)
ON18Zn : ON19Zn
ON18Zn
ON19Zn
200 300 400 500 600 700
0.0
0.1
0.2
0.3
0.4
0.5
0.6
0.7
0.8
0.9
1.0
3'-TTATAAAAATHPNiTAATATTAAT-2' (ON18Ni)
2'-AATATTTTTAPNiHATTATAATTA-3' (ON19Ni)
C)
380 390 400 410 420 430 440 450
0.0
0.1
0.2
0.3
0.4
0.5
0.6
0.7
0.8
420.0 nm
419.0 nm
404.0 nm
Ab
sorb
ance
Wavelength (nm)
ON18Ni : ON19Ni
ON18Ni
ON19Ni
200 300 400 500 600 700
0.0
0.1
0.2
0.3
0.4
0.5
0.6
0.7
0.8
0.9
1.0
3'-TTATAAAAATHPZnTAATATTAAT-2' (ON18Zn)
2'-AATATTTTTAPNiHATTATAATTA-3' (ON19Ni)D)
380 390 400 410 420 430 440 450
0.0
0.1
0.2
0.3
0.4
0.5
0.6
0.7
0.8
420.0 nm
430.0 nm408.0 nm
Ab
sorb
ance
Wavelength (nm)
ON18Zn : ON19Ni
ON18Zn
ON19Ni
Figure 4.8 UV-vis spectra of GNA duplexes and their corresponding single strands. Conditions: 10 mM sodium phosphate, 100 mM NaCl, pH 7.0, and 2 M of each strand. (A) ON18, ON19 and ON18:ON19. (B) ON18Zn, ON19Zn and ON18Zn:ON19Zn. (C) ON18Ni, ON19Ni and ON18Ni:ON19Ni. (D) ON18Zn, ON19Ni and ON18Zn:ON19Ni (see Tables 4.2 for the sequences). The inserts show expanded porphyrin Soret band regions.

Chapter 4.2.3 Conformation of porphyrins in GNA
145
Figure 4.8 shows the obvious change of the Soret band of duplexes ON18:ON19,
ON18Zn:ON19Zn, ON18Ni:ON19Ni and ON18Zn:ON19Ni. The splitting energies
between the low- and high-energy Soret bands are 1021 cm-1 for duplex
ON18Zn:ON19Zn, and duplexes ON18:ON19, ON18Ni:ON19Ni and ON18Zn:ON19Ni
all show a blue-shifted and broadened Soret band instead of two distinct peaks.
200 300 400 500 600 700
0.0
0.2
0.4
0.6
0.8
1.0
3'-TTATAAAAATPMnHTAATATTAAT-2' (ON16Mn)
2'-AATATTTTTAHPMnATTATAATTA-3' (ON17Mn)A)
300 350 400 450 500 550
0.0
0.1
0.2
0.3
471.0 nm
Ab
sorb
ance
Wavelength (nm)
ON16Mn : ON17Mn
ON16Mn
ON17Mn
200 300 400 500 600 700
0.0
0.2
0.4
0.6
0.8
1.0
3'-TTATAAAAATHPMnTAATATTAAT-2' (ON18Mn)
2'-AATATTTTTAPMnHATTATAATTA-3' (ON19Mn)B)
300 350 400 450 500 550
0.0
0.1
0.2
0.3
471.0 nm
Ab
sorb
ance
Wavelength (nm)
ON18Mn : ON19Mn
ON18Mn
ON19Mn
Figure 4.9 UV-vis spectra of GNA duplexes and their corresponding single strands. Conditions: 10 mM sodium phosphate, 100 mM NaCl, pH 7.0, and 2 M of each strand. (A) ON16Mn, ON17Mn and ON16Mn:ON17Mn. (B) ON18Mn, ON19Mn and ON18Mn:ON19Mn (see Tables 4.2 for the sequences). The inserts show expanded porphyrin Soret band regions.
However, the duplex ON16Mn:ON17Mn and ON18Mn:ON19Mn do not show
obvious change of the Soret band (Figure 4.9), which remains unclear.
The obvious change of the Soret bands of the duplex accompanied by a blue shift
reveals that a ground state interaction of the two porphyrin moieties occurred in GNA.
It has been reported that split Soret bands can be caused by dipole-dipole exciton
coupling from slipped-cofacial interactions between two porphyrins.15Thus, the two
adjacent porphyrin units in the GNA duplex might adopt slipped-cofacial geometry.
The Soret band of duplexes shifted to shorter wavelengths, indicating that in each
duplex two porphyrin units overlap face-to-face (H-dimer).16

Chapter 4.2.3 Conformation of porphyrins in GNA
146
Table 4.3 Absorption of porphyrin in GNA strands as single and double strandsa Entry Abs. of Soret band (nm) Abs. of Q band (nm)
ON 16 426 523, 558, 597, 652 ON 16Zn 430 564, 605 ON 16Mn 471 574, 609 ON 16Ni 421 531, 566 ON 17 428 525, 560, 599, 654
ON 17Zn 431 563, 606 ON 17Mn 471 575, 599 ON 17Ni 420 532, 567 ON 18 427 522, 558, 597, 652
ON 18Zn 430 565, 607 ON 18Ni 419 531, 566 ON 18Mn 471 577, 612
ON 19 428 523, 559, 597, 653 ON 19Zn 431 565, 607 ON 19Mn 471 575, 613 ON 19Ni 420 532, 565
ON16:ON17 409, 425 525, 561, 602,656 ON16Zn:ON17Zn 412, 429 562, 604 ON16Mn:ON17Mn 471 576, 613 ON16N:ON17Ni 404 533, 567
ON18:ON19 415 567, 623 ON18Zn:ON19Zn 411, 429 563, 604 ON18Ni:ON19Ni 404 534, 567
ON18Mn:ON19Mn 471 580, 612 aConditions: 10 mM sodium phosphate, 100 mM NaCl, and 2 M individual strands.

Chapter 4.2.3 Conformation of porphyrins in GNA
147
Subsequently, we analyzed the influence of temperature on the UV-vis spectra for
the duplexes. The duplex ON16Mn:ON17Mn and ON18Mn:ON19Mn were not
investigated, since they do not show obvious change of the Soret band.
380 390 400 410 420 430 440 450
0.0
0.1
0.2
0.3
0.4
0.5
0.6
0.7
0.8
0.9
1.0
1.1
1.2A)
425.0 nm
409.0 nm
ON16 : ON17
20 oC
30 oC
40 oC
45 oC
50 oC
55 oC
60 oC
65 oC
70 oC
80 oC
Ab
sorb
ance
Wavelength (nm)
380 390 400 410 420 430 440 450
0.0
0.1
0.2
0.3
0.4
0.5
0.6
0.7
0.8
0.9
1.0
1.1
1.2
1.3
1.4
1.5B)
429.0 nm
412.0 nm
Ab
sorb
ance
Wavelength (nm)
ON16Zn : ON17Zn
20 oC
30 oC
40 oC
45 oC
50 oC
55 oC
60 oC
65 oC
70 oC
80 oC
380 390 400 410 420 430 440 450
0.0
0.1
0.2
0.3
0.4
0.5
0.6
0.7
0.8
0.9
1.0C)
420.0 nm
404.0 nm
ON16Ni : ON17Ni
20 oC
30 oC
40 oC
45 oC
50 oC
55 oC
60 oC
65 oC
70 oC
80 oC
Ab
sorb
ance
Wavelength (nm)
380 390 400 410 420 430 440 450
0.0
0.1
0.2
0.3
0.4
0.5
0.6
0.7
0.8
0.9
1.0D)427.0 nm
407.0 nm
Ab
sorb
ance
Wavelength (nm)
ON16Zn : ON17Ni
20 oC
30 oC
40 oC
45 oC
50 oC
55 oC
60 oC
65 oC
70 oC
80 oC
Figure 4.10 Temperature-dependent UV-vis spectra of GNA duplexes at Soret band region. Conditions: 10 mM sodium phosphate, 100 mM NaCl, pH 7.0, and 2 M of each strand. (A) ON16:ON17. (B) ON16Zn:ON17Zn. (C) ON16Ni:ON17Ni. (D) ON16Zn:ON17Ni (see Tables 4.2 for the sequences).

Chapter 4.2.3 Conformation of porphyrins in GNA
148
380 390 400 410 420 430 440 450 460
0.0
0.1
0.2
0.3
0.4
0.5
0.6
0.7
0.8
0.9
1.0
1.1A)
434.0 nm
415.0 nm
Ab
sorb
ance
Wavelength (nm)
ON18 : ON19
20 oC
30 oC
40 oC
45 oC
50 oC
55 oC
60 oC
65oC
70 oC
80 oC
380 390 400 410 420 430 440 450
0.0
0.1
0.2
0.3
0.4
0.5
0.6
0.7
0.8
0.9
1.0
1.1
1.2
1.3
1.4
1.5B) 429.0 nm
411.0 nm
Ab
sorb
ance
Wavelength (nm)
ON18Zn : ON19Zn
20 oC
30 oC
40 oC
45 oC
50 oC
55 oC
60 oC
65 oC
70 oC
80 oC
380 390 400 410 420 430 440 450
0.0
0.1
0.2
0.3
0.4
0.5
0.6
0.7
0.8
0.9
1.0
1.1
1.2C)
419.0 nm
404.0 nm
Ab
sorb
ance
Wavelength (nm)
ON18Ni : ON19Ni
20 oC
30 oC
40 oC
45 oC
50 oC
55 oC
60 oC
65 oC
70 oC
80 oC
380 390 400 410 420 430 440 450
0.0
0.1
0.2
0.3
0.4
0.5
0.6
0.7
0.8
0.9
1.0D) 427.0 nm
408.0 nmA
bso
rban
ce
Wavelength (nm)
ON18Zn : ON19Ni
20 oC
30 oC
40 oC
45 oC
50 oC
55 oC
60 oC
65 oC
70 oC
80 oC
Figure 4.11 Temperature-dependent UV-vis spectra of GNA duplexes at Soret band region. Conditions: 10 mM sodium phosphate, 100 mM NaCl, pH 7.0, and 2 M of each strand. (A) ON18:ON19. (B) ON18Zn:ON19Zn. (C) ON18Ni:ON19Ni. (D) ON18Zn:ON19Ni (see Tables 4.2 for the sequences).
The results are shown in Figure 4.10 and 4.11, by increasing the temperature from
20 to 80 oC, the peaks gradually shifted to a longer wavelength accompanied by
disappearance of the splitting of the peaks, and this shift could be interpreted by the
dissociation of the duplexes into their single strands: two porphyrin moieties in two
strands lost their interaction.

Chapter 4.2.3 Conformation of porphyrins in GNA
149
Fluorescence spectroscopy
In order to obtain the fluorescence properties of porphyrins in GNA, the duplexes
were investigated by fluorescence spectrometry. Mn(II) and Ni(II) porphyrins could
not be investigated because they are not fluorescent.14
575 600 625 650 675 700 725 750 775
0
200
400
600
800
1000
1200
3'-TTATAAAAATPHTAATATTAAT-2' (ON16)2'-AATATTTTTAHPATTATAATTA-3' (ON17)
A)
725.0 nm
615.0 nm
660.0 nm
RF
U
Wavelength (nm)
ON16 : ON17 ON16 ON17
575 600 625 650 675 700 725 750 775
0
200
400
600
800
1000
1200
3'-TTATAAAAATPZnHTAATATTAAT-2' (ON16Zn)
2'-AATATTTTTAHPZnATTATAATTA-3' (ON17Zn)B)
615.0 nm
665.0 nmRF
U
Wavelength (nm)
ON16Zn : ON17Zn
ON16Zn
ON17Zn
Figure 4.12 Fluorescence spectra of GNA duplexes and their corresponding single strands. Conditions: 10 mM sodium phosphate, 100 mM NaCl, pH 7.0, and 2 M of each strand. (A) ON16, ON17, and ON16:ON17. (B) ON16Zn, ON17Zn, and ON16Zn:ON17Zn (see Tables 4.2 for the sequences).
Figure 4.12 shows the fluorescence spectra of ON16, ON17, ON16:ON17, and
ON16Zn, ON17Zn, ON16Zn:ON17Zn. ON16 and ON17 which contain free porphyrins
displayed the characteristic two emission peaks at 660 nm and 725 nm, while ON16Zn
and ON17Zn showed features of Zn(II)-prophyrin emission spectra: the emission
peaks are situated at 615 nm and 665 nm which are 50 nm blue shifted compared to
ON16 and ON17.14 Aside from the change in intensity, the fluorescent spectra of
duplexes ON16:ON17 and ON16Zn:ON17Zn are rather similar. The decrease of
fluorescence intensity is consistent with the formation of porphyrin aggregates. In
addition, ON16:ON17 shows lower emission quantity compared to ON16Zn:ON17Zn,
which is in agreement with the fact that the free porphyrins can stack better within the
GNA duplex.
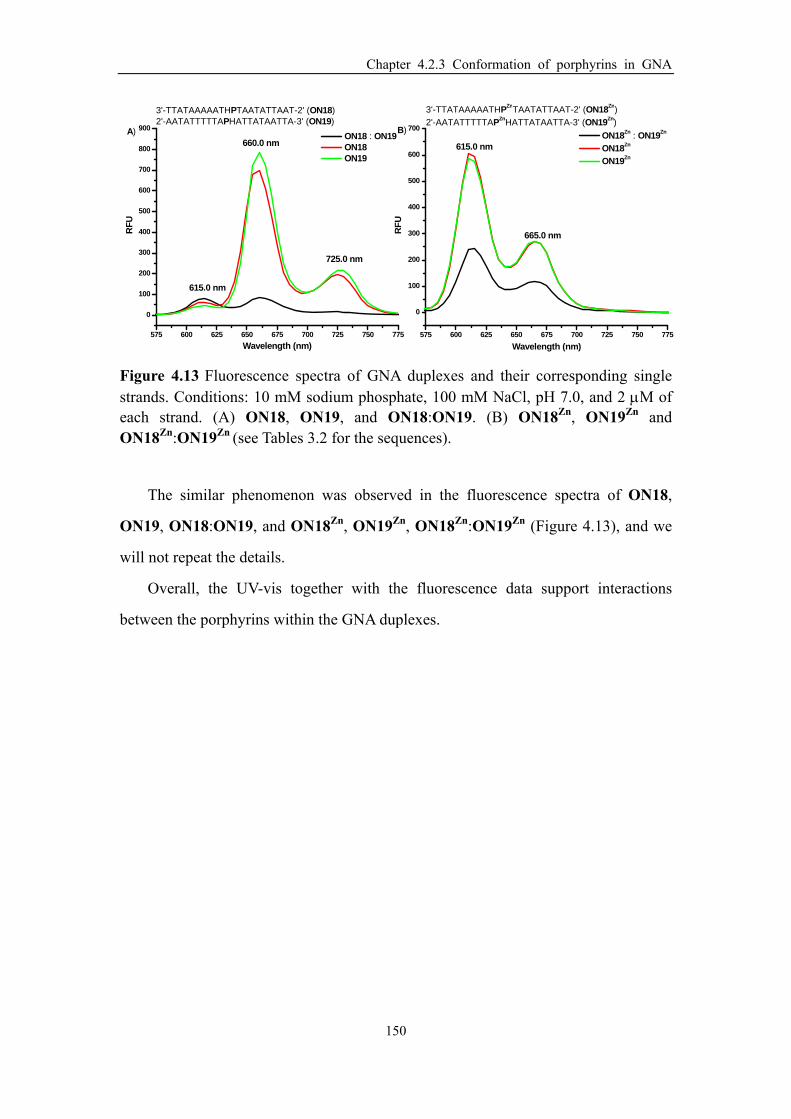
Chapter 4.2.3 Conformation of porphyrins in GNA
150
575 600 625 650 675 700 725 750 775
0
100
200
300
400
500
600
700
800
900
3'-TTATAAAAATHPTAATATTAAT-2' (ON18)2'-AATATTTTTAPHATTATAATTA-3' (ON19)
A)
615.0 nm
725.0 nm
660.0 nm
RF
U
Wavelength (nm)
ON18 : ON19 ON18 ON19
575 600 625 650 675 700 725 750 775
0
100
200
300
400
500
600
700
3'-TTATAAAAATHPZnTAATATTAAT-2' (ON18Zn)
2'-AATATTTTTAPZnHATTATAATTA-3' (ON19Zn)B)
615.0 nm
665.0 nmRF
U
Wavelength (nm)
ON18Zn : ON19Zn
ON18Zn
ON19Zn
Figure 4.13 Fluorescence spectra of GNA duplexes and their corresponding single strands. Conditions: 10 mM sodium phosphate, 100 mM NaCl, pH 7.0, and 2 M of each strand. (A) ON18, ON19, and ON18:ON19. (B) ON18Zn, ON19Zn and ON18Zn:ON19Zn (see Tables 3.2 for the sequences).
The similar phenomenon was observed in the fluorescence spectra of ON18,
ON19, ON18:ON19, and ON18Zn, ON19Zn, ON18Zn:ON19Zn (Figure 4.13), and we
will not repeat the details.
Overall, the UV-vis together with the fluorescence data support interactions
between the porphyrins within the GNA duplexes.

Chapter 4.2.3 Conformation of porphyrins in GNA
151
CD spectroscopy
In order to learn more about the conformation of the porphyrins in GNA duplex,
porphyrin-modified GNA duplexes were investigated by CD spectroscopy.
200 250 300 350 400 450 500
-25
-20
-15
-10
-5
0
5
10
15
Tm = 56 oC
3'-TTATAAAAATPHTAATATTAAT-2' (ON16)2'-AATATTTTTAHPATTATAATTA-3' (ON17)
A)
360 380 400 420 440-5.0
-4.5
-4.0
-3.5
-3.0
-2.5
-2.0
-1.5
-1.0
-0.5
0.0
0.5
0.0
0.3
0.6
0.9
1.2
405.5 nm
UV-Vis
CD
Ab
sorb
ance
CD
(m
deg
)
425.0 nm
426.5 nm
426.0 nm428.0 nm
409.0 nm
Wavelength (nm)
CD
(m
deg
)
ON16 : ON17 ON16 ON17 ON14 : ON15
200 250 300 350 400 450 500
-20
-15
-10
-5
0
5
10
Tm = 59 oC3'-TTATAAAAATPNiHTAATATTAAT-2' (ON16Ni)
2'-AATATTTTTAHPNiATTATAATTA-3' (ON17Ni)B)
360 380 400 420 440-7
-6
-5
-4
-3
-2
-1
0
0.0
0.2
0.4
0.6
0.8
1.0
1.2
UV-Vis
CD419.5 nm
404.0 nm
400.0 nm
Ab
sorb
ance
CD
(m
deg
)
421.0 nm
CD
(m
deg
)
Wavelength (nm)
ON16Ni : ON17Ni
ON16Ni
ON17Ni
Figure 4.14 CD spectra of GNA duplexes and their corresponding single strands. Conditions: 10 mM sodium phosphate, 100 mM NaCl, pH 7.0, and 12 M of each strand. (A) ON16, ON17, ON16:ON17, and ON14:ON15. (B) ON16Ni, ON17Ni, and ON16Ni:ON17Ni (see Tables 4.2 for the sequences). Inserts: overlap plot of CD and absorption spectra at the Soret region.
As shown in Figure 4.14, the CD signals of porphyrin-GNA duplexes in the GNA
absorption region are almost identical to those of the unmodified GNA duplex, except
for the lower signal intensities. It thus seems that the porphyrin modifications do not
distort the overall GNA duplex conformation to a significant extent. In the porphyrin
absorption region, induced negative Cotton effects at 406 nm and 400 nm are
observed in the case of ON16:ON17 (Figure 4.14A) and ON16Ni:ON17Ni (Figure
4.14B), respectively. Typically for porphyrin-modified DNA system, an induced
negative Cotton effect in the Soret region is a signature of the intercalation of the
porphyrin moiety into the DNA duplex.17,18 Together with the Tm data, we therefore
conclude that the porphyrin rings in duplex ON16:ON17 and ON16Ni:ON17Ni
intercalate into the GNA duplex and stack to neighboring base pairs.

Chapter 4.2.3 Conformation of porphyrins in GNA
152
200 250 300 350 400 450 500
-15
-10
-5
0
5
Tm = 48 oC
3'-TTATAAAAATPZnHTAATATTAAT-2' (ON16Zn)
2'-AATATTTTTAHPZnATTATAATTA-3' (ON17Zn)
A)
380 400 420 440 460-6
-5
-4
-3
-2
-1
0
1
2
3
0.0
0.5
1.0
1.5
2.0
440.5 nm
CD
UV-Vis
Ab
sorb
ance
CD
(m
deg
)
429.0 nm 431.0 nm
429.0 nm408.5 nm
412.0 nm
CD
(m
deg
)
Wavelength (nm)
ON16Zn : ON17Zn
ON16Zn
ON17Zn
200 250 300 350 400 450 500
-10
-5
0
5
Tm = 54 oC
3'-TTATAAAAATPZnHTAATATTAAT-2' (ON16Zn)
2'-AATATTTTTAHPNiATTATAATTA-3' (ON17Ni)
B)
360 380 400 420 440 460 480-4.0
-3.5
-3.0
-2.5
-2.0
-1.5
-1.0
-0.5
0.0
0.5
0.0
0.2
0.4
0.6
0.8
1.0
1.2
1.4
1.6
CD
439.0 nm
419.5 nm
403.0 nm
407.0 nm
Ab
sorb
ance
CD
(m
deg
)
UV-Vis
420.0 nm427.0 nm
430.0 nm
CD
(m
deg
)
Wavelength (nm)
ON16Zn : ON17Ni
ON16Zn
ON17Ni
Figure 4.15 CD spectra of GNA duplexes and their corresponding single strands. Conditions: 10 mM sodium phosphate, 100 mM NaCl, pH 7.0, and 12 M of each strand. (A) ON16Zn, ON17Zn, and ON16Zn:ON17Zn. (B) ON16Zn, ON17Ni and ON16Zn:ON17Ni (see Tables 4.2 for the sequences). Inserts: overlap plot of CD and absorption spectra at the Soret region.
However, the CD spectra of duplexes containing Zn(II)-porphyrins are different.
In the case of ON16Zn:ON17Zn (Figure 4.15A), a clear multisignate CD spectrum,
consisting of two negative bands at 409 and 429 nm and a positive band at 441 nm is
observed. The CD spectrum of ON16Zn:ON17Ni (Figure 4.15B) shows a strong
negative band at 403 nm and a weak positive band at 439 nm. Bisignate or
multisignate CD spectra were observed in a system with porphyrins covalently
attached to the 5′-end of DNA duplexes, and such CD spectra were interpreted for the
evidence of through space dipole-dipole electronic interactions between the two
porphyrin chromophores.18 Together with the melting point results (Tables 4.2), we
thus assume that the Zn(II)-porphyrins interact with each other although they are not
as close in contact as the porphyrins in the analogous systems devoid of any metal or
coordinated to nickel ions.

Chapter 4.2.3 Conformation of porphyrins in GNA
153
200 250 300 350 400 450 500-12
-8
-4
0
4
D)
360 380 400 420 440 460-2.0
-1.5
-1.0
-0.5
0.0
0.5
439.0 nm
403.0 nm
CD
(m
deg
)
Wavelength (nm)
ON16Zn : ON17Ni
20 oC 50 oC
30 oC 60 oC
40 oC 70 oC
200 250 300 350 400 450 500
-20
-16
-12
-8
-4
0
4
8C)
360 370 380 390 400 410 420 430 440-4.0
-3.5
-3.0
-2.5
-2.0
-1.5
-1.0
-0.5
0.0
0.5
400.0 nm
CD
(m
deg
)
Wavelength (nm)
ON16Ni : ON17Ni
20 oC 50 oC
30 oC 60 oC
40 oC 70 oC
200 250 300 350 400 450 500
-16
-12
-8
-4
0
4
8A)
370 380 390 400 410 420 430 440 450 460 470-2.5
-2.0
-1.5
-1.0
-0.5
0.0
0.5
405.5 nm
CD
(m
deg
)
Wavelength (nm)
ON16 : ON17
20 oC 50 oC
30 oC 60 oC
40 oC 70 oC
200 250 300 350 400 450 500
-12
-8
-4
0
4
8B)
380 390 400 410 420 430 440 450 460
-2.0
-1.5
-1.0
-0.5
0.0
0.5
1.0
1.5
2.0
440.5 nm
429.0 nm408.5 nm
CD
(m
deg
)
Wavelength (nm)
ON16Zn : ON17Zn
20 oC 50 oC
30 oC 60 oC
40 oC 70 oC
Figure 4.16 Temperture-dependent CD spectra of GNA duplexes. Conditions: 10 mM sodium phosphate, 100 mM NaCl, pH 7.0, and 12 M of each strand. (A) ON16:ON17. (B) ON16Zn:ON17Zn. (C) ON16Ni:ON17Ni. (D) ON16Zn:ON17Ni
(see Tables 4.2 for the sequences). The inserts show expanded porphyrin Soret band regions.
Next, we studied the influence of temperature on the CD spectra for the
duplexes ON16:ON17, ON16Zn:ON17Zn, ON16Ni:ON17Ni and ON16Zn:ON17Ni.
Upon increasing the temperature, the CD singal in the 200-300 nm region
gradually disappeared, indicating the loss of helicity due to the denaturation.
While in the Soret band of the porphyrin moieties, the peaks gradually disappeared
which could be attributed to the dissociation of the duplexes into their single
strands: two porphyrin moieties lost their electronic interaction or intercalation
with GNA.

Chapter 4.3 Conclusions
154
Chapter 4.3 Conclusions
In this chapter, we described a straightforward synthetic strategy to use GNA as a
scaffold to organize porphyrins chromophores. A diphenylporphyrin acetylide
phosphoramidite GNA building block 18c was used to synthesize GNA strands with
incorporated diphenylporphyrin acetylide nucleotides (P). Incorporated opposite an
ethylene glycol abasic site (H), such porphyrin acetylides (P) did not significantly
perturb the overall GNA duplex structures.
Interestingly, the thermal stabilities of duplex contaiing P:H base pairs can be
modulated by the incorporation of zinc(II) and nickel(II) ion which lead to a decrease
or increase in duplex stability, respectively. This can be rationalized with a
flipped-out conformation of the zinc-porphyrin in contrast to a stacking of the
nickel-porpyhrin within the base stacking of the GNA duplex. Thus, the
conformation of porphyrins in GNA can be modulated by the bound metal ions.
Furthermore, we demonstrated that GNA duplexes are a suitable scaffold to bring
two porphyrins into close contact and to allow the interaction of porphyrins with
different coordinated metal ions.
Future work will be focused on applications of such porphyrin-GNA conjugates
as well as modified GNA containing porphyrin and other chromophores for light
harvesting and charge transport.
Chapter 4.4 Experimental
155
Chapter 4.4 Experimental
Synthesis of metalloporphyrin-GNA oligonucleotide and purification
Zinc metallation of porphyrin in GNA. To a solution of porphyrin-GNA
single strands (12.0 nmol GNA single strands in 140 μL of 10 mM Tris-HCl buffer
solution, pH 7.6) was added a solution of Zn(OAc)2 in H2O (10 mM, 12 μL,10 eq.).
The solution was shaken at 25 oC and the reaction was followed by absorption
spectroscopy. After around 2 hours, the reaction mixture was diluted to 1000 μL
with 3% ammonia solution. Excess Zn2+ was removed by treating the reaction
mixture with ion-exchange resins (Chelex 100 sodium form). The strands were
purified by HPLC using a Water XTerra colume at 55 C with aqueous TEAA and
acetonitrile as the eluent. The identities of the oligonucleotides were confirmed by
MALDI-TOF MS (Table 4.4).
Nickel metallation of porphyrin in GNA. Nickel metallation was carried out
by heating (80 ºC) under nitrogen atomosphere a solution of porphyrin-GNA
single strands (2.5 nmol GNA in 325 μL of 10 mM Tris-HCl buffer solution, pH
7.6, and 60 equiv. Ni(OAc)2 (10 mM)). The reaction was followed by absorption
spectroscopy and found to be completed after heating for 16 hours. Workup was
performed in analogy to the zinc(II) complexation.
Manganese metallation of porphyrin in GNA. Manganese metallation was
carried out by heating (80 ºC) under nitrogen atomosphere a solution of
porphyrin-GNA single strands (2.5 nmol GNA in 300 μL of 10 mM Tris-HCl
buffer solution, pH 7.6, and 60 equiv. MnCl2 (10 mM)). The reaction was followed
by absorption spectroscopy and found to be completed after heating for 1 hour.
Workup was performed in analogy to the zinc(II) complexation.
Other metallatons of porphyrin in GNA. Other metallations were carried out
accoring to the nickel metallation. Unfortunately, the GNA strand was
decomposed duiring the copper metallation that was confirmed by MALDI-TOF

Chapter 4.4 Experimental
156
MS. Other metal complexes such as CdSO4, AgPF6, FeCl2 and FeCl3 do not
metallate the porphyrin in GNA.
Thermal denaturation
The melting studies were carried out in 1 cm path length quartz cells (total
volumn 325 L; 200 L sample solutions were covered by mineral oil) on a
Beckman 800 UV-Vis spectrophotometer equipped with a thermo-programmer.
Melting curves were monitored at 260 nm with a heating rate of 1 C/min. Melting
temperatures were calculated from the first derivatives of the heating curves.
Experiments were performed in duplicate and mean values were taken.
UV-vis spectroscopy
The absorptions of oligonucleotide solutions were measured in a quartz
cuvette with a path length of 1 cm at 260 nm on Beckman 800 UV-Vis
spectrophotometer. Temperature-dependent absorption spectra were obtained on
Beckman 800 UV-Vis spectrophotometer equipped with a temperature controller.
Spectra were obtained every 10 C by heating from 20 to 80 C. Both single
strands and duplexes (2 M of each strand) were prepared in 10 mM sodium
phosphate, 100 mM NaCl, pH 7.0.
Fluorescence spectroscopy
The experiments were performed in 96-well plates on a Molecular Devices
SpectraMax M5 with excitation at 427 nm and a cutoff filter at 435 nm. The
experiments with single strands or duplexes were performed in 10 mM sodium
phosphate, 100 mM NaCl, pH 7.0, and the concentration of each strand was 2 M.
CD spectroscopy
CD measurements were performed on a JASCO J-810 spectrometer in a 1 mm
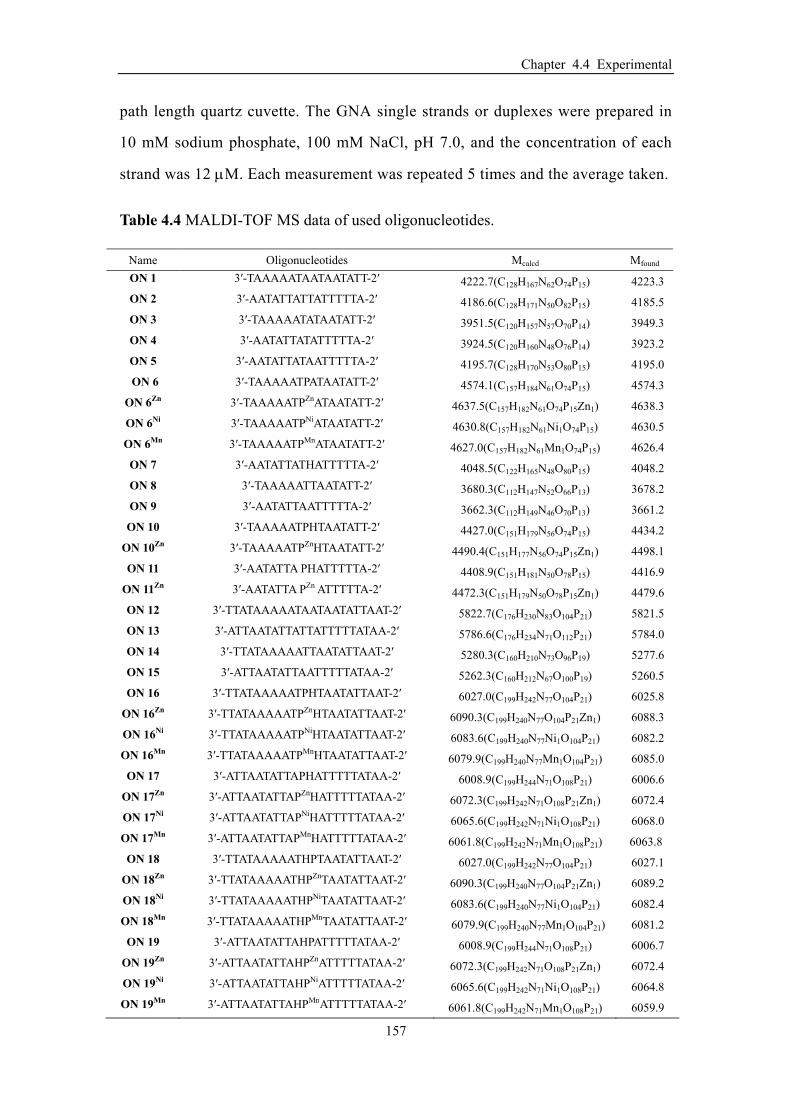
Chapter 4.4 Experimental
157
path length quartz cuvette. The GNA single strands or duplexes were prepared in
10 mM sodium phosphate, 100 mM NaCl, pH 7.0, and the concentration of each
strand was 12 M. Each measurement was repeated 5 times and the average taken.
Table 4.4 MALDI-TOF MS data of used oligonucleotides.
Name Oligonucleotides Mcalcd Mfound
ON 1 3′-TAAAAATAATAATATT-2′ 4222.7(C128H167N62O74P15) 4223.3
ON 2 3′-AATATTATTATTTTTA-2′ 4186.6(C128H171N50O82P15) 4185.5
ON 3 3′-TAAAAATATAATATT-2′ 3951.5(C120H157N57O70P14) 3949.3
ON 4 3′-AATATTATATTTTTA-2′ 3924.5(C120H160N48O76P14) 3923.2
ON 5 3′-AATATTATAATTTTTA-2′ 4195.7(C128H170N53O80P15) 4195.0
ON 6 3′-TAAAAATPATAATATT-2′ 4574.1(C157H184N61O74P15) 4574.3
ON 6Zn 3′-TAAAAATPZnATAATATT-2′ 4637.5(C157H182N61O74P15Zn1) 4638.3
ON 6Ni 3′-TAAAAATPNiATAATATT-2′ 4630.8(C157H182N61Ni1O74P15) 4630.5
ON 6Mn 3′-TAAAAATPMnATAATATT-2′ 4627.0(C157H182N61Mn1O74P15) 4626.4
ON 7 3′-AATATTATHATTTTTA-2′ 4048.5(C122H165N48O80P15) 4048.2
ON 8 3′-TAAAAATTAATATT-2′ 3680.3(C112H147N52O66P13) 3678.2
ON 9 3′-AATATTAATTTTTA-2′ 3662.3(C112H149N46O70P13) 3661.2
ON 10 3′-TAAAAATPHTAATATT-2′ 4427.0(C151H179N56O74P15) 4434.2
ON 10Zn 3′-TAAAAATPZnHTAATATT-2′ 4490.4(C151H177N56O74P15Zn1) 4498.1
ON 11 3′-AATATTA PHATTTTTA-2′ 4408.9(C151H181N50O78P15) 4416.9
ON 11Zn 3′-AATATTA PZn ATTTTTA-2′ 4472.3(C151H179N50O78P15Zn1) 4479.6
ON 12 3′-TTATAAAAATAATAATATTAAT-2′ 5822.7(C176H230N83O104P21) 5821.5
ON 13 3′-ATTAATATTATTATTTTTATAA-2′ 5786.6(C176H234N71O112P21) 5784.0
ON 14 3′-TTATAAAAATTAATATTAAT-2′ 5280.3(C160H210N73O96P19) 5277.6
ON 15 3′-ATTAATATTAATTTTTATAA-2′ 5262.3(C160H212N67O100P19) 5260.5
ON 16 3′-TTATAAAAATPHTAATATTAAT-2′ 6027.0(C199H242N77O104P21) 6025.8
ON 16Zn 3′-TTATAAAAATPZnHTAATATTAAT-2′ 6090.3(C199H240N77O104P21Zn1) 6088.3
ON 16Ni 3′-TTATAAAAATPNiHTAATATTAAT-2′ 6083.6(C199H240N77Ni1O104P21) 6082.2
ON 16Mn 3′-TTATAAAAATPMnHTAATATTAAT-2′ 6079.9(C199H240N77Mn1O104P21) 6085.0
ON 17 3′-ATTAATATTAPHATTTTTATAA-2′ 6008.9(C199H244N71O108P21) 6006.6
ON 17Zn 3′-ATTAATATTAPZnHATTTTTATAA-2′ 6072.3(C199H242N71O108P21Zn1) 6072.4
ON 17Ni 3′-ATTAATATTAPNiHATTTTTATAA-2′ 6065.6(C199H242N71Ni1O108P21) 6068.0
ON 17Mn 3′-ATTAATATTAPMnHATTTTTATAA-2′ 6061.8(C199H242N71Mn1O108P21) 6063.8
ON 18 3′-TTATAAAAATHPTAATATTAAT-2′ 6027.0(C199H242N77O104P21) 6027.1
ON 18Zn 3′-TTATAAAAATHPZnTAATATTAAT-2′ 6090.3(C199H240N77O104P21Zn1) 6089.2
ON 18Ni 3′-TTATAAAAATHPNiTAATATTAAT-2′ 6083.6(C199H240N77Ni1O104P21) 6082.4
ON 18Mn 3′-TTATAAAAATHPMnTAATATTAAT-2′ 6079.9(C199H240N77Mn1O104P21) 6081.2
ON 19 3′-ATTAATATTAHPATTTTTATAA-2′ 6008.9(C199H244N71O108P21) 6006.7
ON 19Zn 3′-ATTAATATTAHPZnATTTTTATAA-2′ 6072.3(C199H242N71O108P21Zn1) 6072.4
ON 19Ni 3′-ATTAATATTAHPNiATTTTTATAA-2′ 6065.6(C199H242N71Ni1O108P21) 6064.8
ON 19Mn 3′-ATTAATATTAHPMnATTTTTATAA-2′ 6061.8(C199H242N71Mn1O108P21) 6059.9

Chapter 4.5 References
158
Chapter 4.5 References
1. Brun, A. M.; Harriman, A. Journal of American Chemical Society 1994, 116,
10383-10393.
2. Pasternack, R. F.; Collings, P. J. Science 1995, 269, 935-939.
3. (a) Meunier, B. Chemical Review 1992, 92, 1411-1456; (b) Marzilli, L. G. New
Journal of Chemistry 1990, 14, 409-420; (c) Pass, H. I. Journal of the National
Cancer Institute 1993, 85, 443-456; (d) O’Connor, A. E.; Gallagher, W. M.;
Byrne, A. T. Photochemistry and Photobiology 2009, 85, 1053.
4. (a) Balaz, M.; Holmes, A. E.; Benedetti, M.; Rodriguez, P. C.; Berova, N.;
Nakanishi, K.; Proni, G. Journal of American Chemical Society 2005, 127, 4172;
(b) Balaz, M.; Li, B. C.; Steinkruger, J. D.; Ellestad, G.A.; Nakanishi, K.; Berova,
N. Organic & Biomoleculor Chemistry 2006, 4, 1865-1867; (c) Balaz, M.;
Bitsch-Jensen, K.; Mammana, A.; Ellestad, G. A.; Nakanishi, K. and Berova, N.
Pure Apply Chemistry 2007, 79, 801.
5. (a) Pasternack, R. F.; Gibbs, E. J. Metal Ions in Biological Systems. In Probing of
Nucleic Acids by Metal Ions Complexes of Small Molecules; Sigel, A., Sigel, H.,
Eds.; Marcel Dekker: New York, 1996; Vol. 33, pp 367-397; (b) Wall, R. K.;
Shelton, A. H.; Bonaccorsi, L. C.; Bejune, S. A.; Dube, D.; McMillin, D. R.
Journal of American Chemical Society 2001, 123, 11480.
6. (a) Endo, M.; Fujitsuka, M.; Majima, T. Journal of Organic Chemistry 2008, 73,
1106-1112; (b) Mammana, A.; Pescitelli, G.; Asakawa, T.; Jockusch, S.; Petrovic,
A. G.; Monaco, R. R.; Purrello, R.; Turro, N. J.; Nakanishi, K; Ellestad, G. A.;
Balaz, M.; Berova, N. Chemistry-A European Journal 2009, 15,11853.
7. (a) Murashima, T.; Hayata, K.; Saiki, Y.; Matsui, J.; Miyoshi, D.; Yamada, T.;
Miyazawa, T. and Sugimoto, N. Tetrahedron Letter 2007, 48, 8514; (b) Berlin, K.;
Jain, R. K.; Simon, M. D.; Richert, C. Journal of Organic Chemistry 1998, 63,
1527.
8. The Porphyrin Handbook; Kadish, K. M, Smith, K. M, Guilard, R., Eds.;
Chapter 4.5 References
159
Academic Press: Boston, MA, 2000; Vols. 1-10.
9. Morales-Rojas, H.; Kool, E. T. Organic Letters 2002, 4, 4377.
10. (a) Choi, M.-S.; Yamazaki, T.; Yamazaki, I. and Aida, T. Angewandte Chemie
International Edition 2004, 43, 150; (b) Kim, D. and Osuka, A. Accounts of
Chemical Research 2004, 37, 735; (c) Balaban, T. S. Accounts of Chemical
Research 2005, 38, 612; (d) Endo, M., Fujitsuka, M. and Majima, T. Chemistry-A
European Journal 2007, 13,8660.
11. (a) Fendt, L.-A.; Bouamaied, I.; Thöni, S.; Amiot, N.; Stulz, E. Journal of the
American Chemical Society 2007, 129, 15319; (b) Bouamaied, I.; Nguyen, T. N.;
Rühl, T.; Stulz, E. Organic & Biomoleculor Chemistry 2008, 6, 3888; (c) Nguyen,
T. N.; Brewer, A.; Stulz, E. Angewandte Chemie International Edition 2009, 48,
1974; (d) Endo, M.; Fujitsuka, M.; Majima, T.; Tetrahedron 2008, 64, 1839; (e)
Bouamaied, I.; Fendt, L.-A.; Haeussinger, D.; Wiesner, M.; Thoeni, S.; Amiot, N.;
Stulz, E. Nucleotides Nucleic Acids 2007, 26, 1533.
12. Zhou, H.; Ma, X.; Wang, J.; Zhang, L. Organic & Biomoleculor Chemistry 2009,
7, 2297.
13. (a) Elemans, J. A. A. W.; Bijsterveld, E. J. A.; Rowan, A., E.; Nolte, R. J. M.
Eropean Journal of Organic Chemistry 2007, 751; (b) Pasternack, R. F.;
Francescon, L.; Raff, D.; Spiro, E. Inorganic Chemistry 1973, 12, 2606.
14. Zhen, W.; Shan, N.; Yu, L.; Wang, X. Dyes and Pigments 2007, 77, 153.
15. (a) Kobuke, Y.; Miyaji, H. Journal of American Chemistry Society 1994, 116,
4111; (b) Hajjaj, F.; Yoon, Z. S.; Yoon, M.-C.; Park, J.; Satake, A.; Kim, D.;
Kobuke, Y. Journal of American Chemistry Society 2006, 128, 4612; (c) Ogawa,
K.; Zhang, T.; Yoshihara, K.; Kobuke, Y. Journal of American Chemistry Society
2002, 124, 22.
16. (a) Shirakawa, M.; Kawano, S.-I.; Fujita, N.; Sada, K.; Shinkai, S. Journal of
Organic Chemistry 2003, 68, 5037; (b) Maiti, N. C.; Mazumdar, S.; Periasamy, N.
J. Porphyrins Phthalocyanines 1998, 2, 369.
17. McMillin, D. R.; Shelton, A. H.; Bejune, S. A.; Fanwick, P. E.; Wall, R. K.
Coordination Chemistry Review 2005, 249(13-14), 1451.

Chapter 4.5 References
160
18. Nitta, Y.; Kuroda, R. Biopolymers 2006, 81, 376.
19. (a) Mammana, A.; Asakawa, T.; Jensen, K. B.; Wolfe, A.; Chaturantabut, S.;
Otani, Y.; Li, X.; Li, Z.; Nakanishi, K.; Balaz, M.; Ellestad, G. A.; Berova, N.
Bioorganic & Medical Chemistry 2008, 16, 6544; (b) Balaz, M.; Jensen, K. B.;
Mammana, A.; Ellestad, G. A.; Nakanishi, K.; Berova, N. Pure and Apply
Chemistry 2007, 79, 801.
20. Meggers, E. and Zhang, L. Accounts of Chemical Research 2010, 43, 1092.
21. Synthesis of the 5-ethynyl-10,20-diphenylporphinatozinc 3.3: (a) Lin, V. S.-Y.;
Iovine, P. M.; Dimango, S. G.; Therien, M. J. Inorganic Syntheses 2002, 33, 55; (b)
Fazekas, M.; Pintea, M.; Senge, M. O.; Zawadzka, M. Tetrahedron Letters 2008,
49 (14), 2236; (c) Balaban, T. S.; Goddard, R.; Schaetzel, M. L.; Lehn, J.-M.
Journal of American Chemistry Society 2003, 125, 4233; (d) Kai, H.; Nara, S.;
Kinbara, K.; Aida, T. Journal of American Chemistry Society 2008, 130, 6725.
22. Zhang, L.; Peritz, A. E.; Carroll, P. J.; Meggers, E. Synthesis 2006, 645.

Chapter 5 Zipper-like arrangement of PBI and porphyrin
161
Chapter 5 GNA as a Supramolecular Scaffold for the
Zipper-like Arrangement of Perylene Bisimide and
Porphyrin Units

Chapter 5.1 Introduction
162
Chapter 5.1 Introduction
Over the past decades, DNA emerged as one of the most appealing scaffolds for
the precise arrangement of chromophores. The π-π stacking chromophore arrays can
be organized in the DNA-like single strand, and the interior or grooves of duplex
DNA.
Although studies on DNA as a scaffold for the arrangement of chromophores
have achieved remarkable success, few studies have reported on electron
donor-acceptor systems composed of interstrand-stacked chromophores in DNA.1
With all the nucleotides in hand, we try to organize them in zipper-like fashion to
examine the properties of resulting systems. Here we described the organization of
donor-acceptor chromophore systems in duplex GNA, which was mainly composed
of perylene bisimide (PBI) and acetylide porphyrin (P).

Chapter 5.2.1 Electron donor-acceptor pair in duplex GNA
163
Chapter 5.2 Results and Discussion
Chapter 5.2.1 Electron donor-acceptor pair in duplex GNA
In this study, perylene bisimide (PBI) was chosen as electron acceptor
chromophore, and the electron donor chromophores were pyrene (Pyr), acetylide
pyrene (Pyr′), acetylide perylene (Pe′) and acetylide porphyrin (P). To study the
effect of incorporating electron donor-acceptor chromophores on GNA, the thermal
stability of duplexes GNA containing two adjacent chromophores was investigated.
The adjacency of chromophores increases the potential of forming interstrand-stacked
pairs.
Figure 5.1 (A) Structure of chromophores used in the present study. (B) Position of electron donor-acceptor stacking chromophores in the middle of duplex GNA.
Table 5.1 lists the electron donor-acceptor chromophore pairs that were
incorporated into the middle of a 16mer duplex GNA. The combination includes
B-Pyr, B-Pyr′, B-Pe′, and B-P. The resulting contribution of the π-π stacking
between electron donor-acceptor chromophores in the GNA interior to the duplex

Chapter 5.2.1 Electron donor-acceptor pair in duplex GNA
164
stability was measured by thermal denaturation experiments. A duplex without the
artificial nucleotide was used for comparison.
Table 5.1 Thermal stabilities of GNA duplexes containing chromophore pair together with Watson-Crick reference duplexes.a
Entry GNA duplex Tm [°C]a
1 3′-TAAAAATTAATATT-2′ 2′-ATTTTTAATTATAA-3′
(ON1) (ON2)
49
2 3′-TAAAAATAATAATATT-2′ 2′-ATTTTTATTATTATAA-3′
(ON3) (ON4)
54
3 3′-TAAAAATBHTAATATT-2′
2′-ATTTTTAHPyrATTATAA-3′ (ON8) (ON6) 50
4 3′-TAAAAATBHTAATATT-2′
2′-ATTTTTAHPyr′ATTATAA-3′ (ON8) (ON7) 57
5 3′-TAAAAATBHTAATATT-2′
2′-ATTTTTAHPe′ATTATAA-3′ (ON8) (ON9) 57
6 3′-TAAAAATBHTAATATT2′ 2′-ATTTTTAHPATTATAA-3′
(ON8) (ON10) 64
7 3′-TAAAAATPHTAATATT-2′ 2′-ATTTTTAHBATTATAA-3′
(ON11) (ON12) 63
aConditions: 10 mM sodium phosphate, 100 mM NaCl, and 2 μM of each strand.
As described in Table 5.1, B-Pyr pair afforded a duplex melting point (Tm) of
50 °C (entry 3), compared with 54 °C for two A:T base pairs at the same position
(entry 2). Removing two A:T base pairs of the Watson-Crick reference duplex as in
ON1:ON2 (entry 1) resulted in a melting point of 49 °C, demonstrating that the
incorporation of a B-Pyr pair had a very slight stabilizing effect (∆Tm = 1 °C).
However, replacing Pyr of the B-Pyr pair in ON8:ON6 (entry 3) by Pyr′, Pe′, or P
resulted in B-Pyr′, B-Pe′ or B-P, and increased stability by additional 8, 8, and 15 °C,
respectively (entries 4-6). The B-P pair evidently stabilized the duplex more strongly
than the other electron donor-acceptor pair shown in Table 5.1. This finding indicates
a stronger π-π stacking between porphyrin and PBI in the duplex.

Chapter 5.2.2 Zipper-like arrangement of chromophores in GNA
165
0.00
0.05
0.10
0.15
0.20
0.25
0.30
0.35
20 30 40 50 60 70 80
ON3:ON4 ON8:ON6 ON8:ON7 ON8:ON9
Temperature (oC)
Hyp
erch
rom
icit
y ON8:ON10
ON1:ON2
Figure 5.2 UV-melting curves of the GNA duplexes ON1:ON2, ON3:ON4, ON8:ON6, ON8:ON7, ON8:ON9, and ON8:ON10 (see Table 5.1 for the sequences). Changes in absorbance upon heating were monitored at 260 nm. Conditions: 10 mM sodium phosphate, 100 mM NaCl, pH 7.0, and 2 M of each strand.
Chapter 5.2.2 Zipper-like arrangement of chromophores in GNA
Both photo-induced electron transfer and energy transfer between porphyrin and
PBI have been theoretically predicted.2 Hence, porphyrin and PBI have been
frequently employed in building photoactive systems recently. Porphyrins are
normally electron donors and energy acceptors, whereas PBIs are electron acceptors
and energy donors in porphyrin-PBI systems.3 π-π stacking array composed of
porphyrin and PBI was seldom investigated in DNA.
Chromophores in DNA have been reported to recognize each other based on
interstrand aromatic stacking to form zipper-like aggregates.4 As discussed in chapter
5.2.1, the interstrand-stacking P-B pair significantly stabilized the duplex. This
exciting result stimulated us to introduce additional B and P into the duplex for
creating a π-π stacking array of B and P. The corresponding modified GNA duplexes
are shown in Table 5.2. The porphyrin and PBI nucleotides were organized in the
middle of a 16mer duplex GNA. The number of stacking chromophores ranged from
two to five.

Chapter 5.2.2 Zipper-like arrangement of chromophores in GNA
166
Thermal stability
The influence of porphyrin and PBI nucleotides on the stability of the duplexes
was evaluated by thermal denaturation studies. Table 5.2 shows the experimental Tm
values of the corresponding duplexes as well as of the reference duplex.
Table 5.2 Thermal stabilities of 16mer modified duplexes together with Watson-Crick reference duplexes.a
Entry GNA duplex Tm [°C] ∆Tm [°C]
1 3′-TAAAAATAATAATATT-2′ 2′-ATTTTTATTATTATAA-3′
(ON3) (ON4)
54
2 3′-TAAAAATBHTAATATT-2′ 2′-ATTTTTAHPATTATAA-3′
(ON8) (ON10) 64 +10
3 3′-TAAAAATPHTAATATT-2′ 2′-ATTTTTAHBATTATAA-3′
(ON11) (ON12) 63 +9
4 3′-TAAAAAHPHTAATATT-2′ 2′-ATTTTTBHBATTATAA-3′
(ON13) (ON14) 57 +3
5 3′-TAAAAAHBHTAATATT-2′ 2′-ATTTTTPHPATTATAA-3′
(ON15) (ON16) 78 +23
6 3′-TAAAAAHPHPAATATT-2′ 2′-ATTTTTBHBHTTATAA-3′
(ON17) (ON18) 70 +16
7 3′-TAAAAAHBHBAATATT-2′ 2′-ATTTTTPHPHTTATAA-3′
(ON19) (ON20) 66 +12
8 3′-TAAAAAHBHBHATATT-2′ 2′-ATTTTTPHPHPTATAA-3′
(ON23) (ON24) 79 +25
aConditions: 10 mM sodium phosphate, 100 mM NaCl, and 2 μM individual strand.
As shown in Table 5.2, the GNA duplex containing sandwich-type P-B-P
exhibited a melting point (Tm) of 78 °C, it improved the duplex stability by an
additional 23 °C (entry 5). When the B-P-B-P and P-B-P-B were incorporated into
the GNA duplex, the corresponding duplexes showed melting points of 70 and 66 °C,
respectively (entries 6 and 7). The duplex modified by P-B-P-B-P had the highest
melting point (Tm = 79 °C; entry 8). Overall, Table 5.2 reveals that porphyrin-PBI
aggregates have remarkably positive effects on the stabilization of the duplex.

Chapter 5.2.2 Zipper-like arrangement of chromophores in GNA
167
20 30 40 50 60 70 80 90
0.00
0.05
0.10
0.15
0.20
0.25
0.30
0.35
Hyp
erch
rom
icit
y
Temperature (oC)
ON3:ON4 ON8:ON10 ON11:ON12 ON13:ON14 ON15:ON16 ON17:ON18 ON19:ON20 ON23:ON24
Figure 5.3 UV-melting curves of the GNA duplexes ON3:ON4, ON8:ON10, ON11:ON12, ON13:ON14, ON15:ON16, ON17:ON18, ON19:ON20, and ON23:ON24 (see Table 5.2 for the sequences). Changes in absorbance upon heating were monitored at 260 nm. Conditions: 10 mM sodium phosphate, 100 mM NaCl, pH 7.0, and 2 M of each strand.
Interactions of chromophores in heteroaggregates
The J-aggregation of identical dyes is known to show a red shift of the absorption
band because of the strong exciton coupling. In contrast, H-aggregation shows a blue
shift of the absorption for the same reason.5 However, little experimental and
theoretical investigations on such heteroaggregations have been performed. As far as
we know, only several heteroaggregates of chromophores in DNA were reported by
Asanuma et al.6 and Haner et al.1,7 The heteroaggregate of porphyrin and PBI in DNA
is not reported.
To acquire information about the interaction between porphyrin and PBI in the
GNA duplexes in the present study, the modified duplexes and their corresponding
single strands were investigated by UV-vis and circular dichroism (CD) spectrometry.

Chapter 5.2.2 Zipper-like arrangement of chromophores in GNA
168
200 300 400 500 600 700 800
0.0
0.2
0.4
0.6
0.8
1.0
3'-TAAAAATBHTAATATT-2' (ON8)2'-ATTTTTAHPATTATAA-3' (ON10)
A)
400 420 440 460 480 500 520 540 560 580
0.0
0.1
0.2
0.3
0.4
0.5
0.6
549.0513.5
547.5509.0
432.0
426.0
Ab
sorb
ance
Wavelength (nm)
ON8:ON10 ON8 ON10 ON8+ON10
200 300 400 500 600 700 800
0.0
0.2
0.4
0.6
0.8
1.0
3'-TAAAAATHBTAATATT-2' (ON11)2'-ATTTTTAPHATTATAA-3' (ON12)
B)
400 420 440 460 480 500 520 540 560 580
0.0
0.1
0.2
0.3
0.4
0.5
0.6
515.0 548.5
544.0506.0
432.0
428.0
Ab
sorb
ance
Wavelength (nm)
ON11:ON12 ON11 ON12 ON11+ON12
Figure 5.4 UV-vis spectra of modified GNA duplexes and their corresponding single strands. Conditions: 10 mM sodium phosphate, 100 mM NaCl, pH 7.0, and 2 M of each strand. (A) ON8, ON10, and ON8:ON10. (B) ON11, ON12, and ON11:ON12. The inset shows the expanded porphyrin Soret band and the PBI absorption band.
The UV-vis spectra of duplexes containing B-P and their corresponding single
strands were first analyzed. Figure 5.4 shows the changes in the absorption band of
the chromophores upon duplex formation. For ON8:ON10, the Soret band shifted
from 426 to 432 nm, whereas the PBI absorption band shifted from 509 to 514 nm.
Similar red shifts were also observed for ON11:ON12. The UV-vis spectra of
ON8:ON10 and ON11:ON12 did not coincide with the simple sum of the spectra of
each strand.

Chapter 5.2.2 Zipper-like arrangement of chromophores in GNA
169
200 300 400 500 600 700
-15
-10
-5
0
5C)
CD
(m
deg
)
Wavelength (nm)
ON11:ON12 (P-B) ON13:ON14 (B-P-B)
200 300 400 500 600 700-15
-10
-5
0
5
D)
CD
(m
deg
)
Wavelength (nm)
ON8:ON10 (B-P) ON15:ON16 (P-B-P)
200 300 400 500 600 700
-15
-10
-5
0
5
3'-TAAAAATBHTAATATT-2' (ON8)2'-ATTTTTAHPATTATAA-3' (ON10)
450 500 550 600-3
-2
-1
0
1
2
3
553.0
428.0
441.5
A)C
D (
md
eg)
Wavelength (nm)
ON8:ON10 ON8 ON10 ON3:ON4
200 300 400 500 600 700
-16
-12
-8
-4
0
4
8
3'-TAAAAATHBTAATATT-2' (ON11)2'-ATTTTTAPHATTATAA-3' (ON12)
450 500 550 600-2
-1
0
1
2
545.5
429.0
445.0
B)
CD
(m
deg
)
Wavelength (nm)
ON11:ON12 ON11 ON12 ON3:ON4
Figure 5.5 CD spectra of modified GNA duplexes and their corresponding single strands. (A) ON8, ON10, ON8:ON10, and ON3:ON4. (B) ON11, ON12, ON11:ON12, and ON3:ON4. (C) ON11:ON12 and ON13:ON14. (D) ON8:ON10 and ON15:ON16. The inset shows the expanded PBI absorption region. Conditions: 10 mM sodium phosphate, 100 mM NaCl, pH 7.0, and 12 M of each strand.
Aside from the red-shifted absorption band, both ON8:ON10 and ON11:ON12
containing B-P showed bisignate CD spectra with a major negative peak in the
porphyrin Soret band and a weak signal in the PBI region (Figure 5.5A and B).
Typical for a porphyrin-modified DNA system, an induced negative Cotton effect in
the Soret region is a signature of the intercalation of the porphyrin moiety into the
DNA duplex.8 Together with the Tm data, we therefore believe the porphyrin rings
intercalate into the GNA duplex and stack to neighboring base pairs due to the π-π
stacking interaction of B and P.
These spectroscopic behaviors demonstrate that B and P in the heteroaggregates
interacted with each other and had different spectroscopic properties from those in the
monomeric states. This statement was further supported by the increased intensities of

Chapter 5.2.2 Zipper-like arrangement of chromophores in GNA
170
the bisignate CD spectra in the Soret bands of ON13:ON14 and ON15:ON16,
resulting from the π-π stacking interaction in sandwich-like aggregates B-P-B or
P-B-P (Figure 5.5C and D).
350 400 450 500 550 600
0.0
0.1
0.2
0.3
0.4
0.5
0.6
0.7
3'-TAAAAATBHTAATATT-2' (ON8)2'-ATTTTTAHPATTATAA-3' (ON10)
511.0 549.0
431.0
503.0539.0
428.0
A)
Ab
sorb
ance
Wavelength (nm)
ON8:N10
20 oC
30 oC
40 oC
50 oC
60 oC
70 oC
80 oC
350 400 450 500 550 600
0.0
0.1
0.2
0.3
0.4
0.5
0.6
0.7
3'-TAAAAATHBTAATATT-2' (ON11)2'-ATTTTTAPHATTATAA-3' (ON12)
548.5515.0
432.0
506.0
544.0
428.0
B)
Ab
sorb
ance
Wavelenght (nm)
ON11:ON12
20 oC
30 oC
40 oC
50 oC
60 oC
70 oC
80 oC
Figure 5.6 Temperature-dependent UV-vis spectra of GNA duplexes at the porphyrin Soret band and the PBI absorption band region. (A) ON8:ON10. (B) ON11:ON12. Conditions: 10 mM sodium phosphate, 100 mM NaCl, pH 7.0, and 2 M of each strand.
The influence of temperature on the UV-vis spectra of the duplexes was analyzed
next. As shown in Figure 5.6, heating from 20 to 80 °C resulted in the gradual shift of
the absorption band to a shorter wavelength. At 70 °C, which is higher than the
melting temperature Tm of ON8:ON10 and ON11:ON12, the spectra almost coincided
with the simple sum of the two individual spectra of their corresponding single
strands. This shift could be explained by the dissociation of the duplexes into their
single strands (porphyrin and PBI moieties), leading to no interaction.

Chapter 5.2.2 Zipper-like arrangement of chromophores in GNA
171
200 300 400 500 600 700-15
-10
-5
0
5
10
3'-TAAAAATBHTAATATT-2' (ON8)2'-ATTTTTAHPATTATAA-3' (ON10)
A)
441.5
428.0
CD
(m
deg
)
Wavelength (nm)
ON8:ON10
20 oC 60 oC
30 oC 70 oC
40 oC 80 oC
50 oC
200 300 400 500 600 700-16
-12
-8
-4
0
4
8
12
3'-TAAAAATHBTAATATT-2' (ON11)2'-ATTTTTAPHATTATAA-3' (ON12)
B)
445.0
429.0
CD
(m
deg
)
Wavelength (nm)
ON11:ON12
20 oC 60 oC
30 oC 70 oC
40 oC 80 oC
50 oC
Figure 5.7 Temperature-dependent CD spectra of GNA duplexes. (A) ON8:ON10. (B) ON11:ON12. Conditions: 10 mM sodium phosphate, 100 mM NaCl, pH 7.0, and 12 M of each strand.
Concurrently, in the CD spectra of ON8:ON10 and ON11:ON12, the peaks
gradually disappeared (Figure 5.7). This disappearance was illustrated by the loss of
helicity due to denaturation, whereas the PBI and porphyrin moieties, as in two
separate strands, lost their interaction.
Overall, these spectroscopic behaviors combined with the melting temperature
data demonstrated the π-π stacking interaction of porphyrin and PBI in GNA.
Conformation of heteroaggregates
Subsequently, the absorption spectra of the duplexes containing more than two
chromophores and their corresponding single strands were investigated. Figure 5.8
demonstrates similar red shifts in the absorption bands of the chromophores upon
duplex formation. Table 5.3 reveals that ON25:ON26 containing P-B-P-B-P had the
largest red shift of 19 nm in the porphyrin Soret band and 12 nm red shift in the PBI
absorption, which could be associated with an increase in the aggregation number.

Chapter 5.2.2 Zipper-like arrangement of chromophores in GNA
172
Table 5.3 Absorption data of porphyrin Soret and PBI absorption bands in modified GNA as single and double strands.a
Entry Absorbance of Soret band
(nm)
Red-shift (P) (nm)
Absorbance of B band (nm)
Red-shift (B) (nm)
ON8 509.0, 547.5 ON10 426.0
ON8:ON10 432.0 6.0 513.5, 549.0 4.5 ON11 428.0 ON12 506.0, 544.0
ON11:ON12 432.0 4.0 515.0, 548.5 9.0 ON13 424.0 ON14 505.5, 546.0
ON13:ON14 432.0 8.0 509.0, 547.0 3.5 ON15 504.5, 542.0 ON16 409.0
ON15:ON16 424.0 15.0 544.0 2.0 ON17 408.0 ON18 505.0, 545.0
ON17:ON18 424.0 16.0 509.0, 548.0 4.0 ON19 505.0, 547.0 ON20 409.0
ON19:ON20 424.0 15.0 509.0, 548.0 4.0 ON23 505.0, 546.0 ON24 404.0
ON23:ON24 423.0 19.0 517.0, 553.0 12.0 aConditions: 10 mM sodium phosphate, 100 mM NaCl, and 2 µM individual strand.
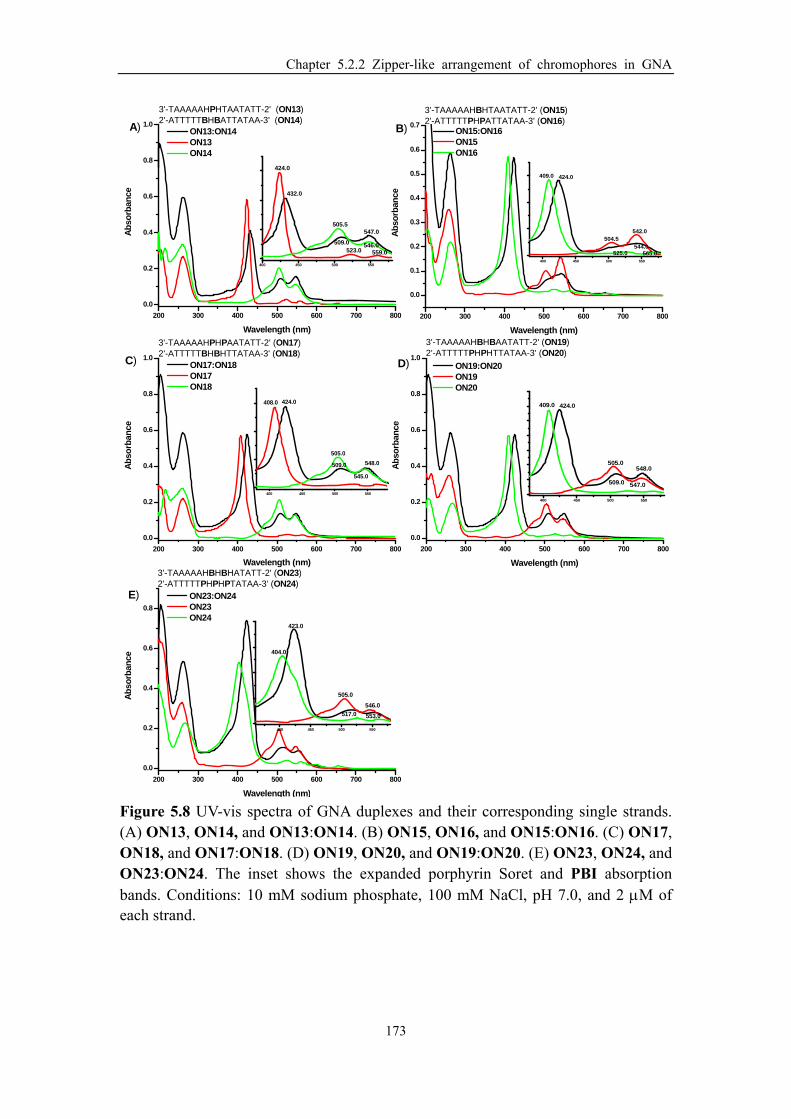
Chapter 5.2.2 Zipper-like arrangement of chromophores in GNA
173
200 300 400 500 600 700 800
0.0
0.2
0.4
0.6
0.8
1.0
3'-TAAAAAHPHTAATATT-2' (ON13)2'-ATTTTTBHBATTATAA-3' (ON14)
A)
400 450 500 550
559.0523.0
546.0509.0
547.0505.5
432.0
424.0
Ab
sorb
ance
Wavelength (nm)
ON13:ON14 ON13 ON14
200 300 400 500 600 700 800
0.0
0.1
0.2
0.3
0.4
0.5
0.6
0.7
3'-TAAAAAHBHTAATATT-2' (ON15)2'-ATTTTTPHPATTATAA-3' (ON16)
B)
400 450 500 550
544.0565.0525.0
542.0504.5
424.0409.0
Ab
sorb
ance
Wavelength (nm)
ON15:ON16 ON15 ON16
200 300 400 500 600 700 800
0.0
0.2
0.4
0.6
0.8
1.0
3'-TAAAAAHPHPAATATT-2' (ON17)2'-ATTTTTBHBHTTATAA-3' (ON18)
C)
400 450 500 550
545.0
548.0509.0
505.0
424.0408.0
Ab
sorb
ance
Wavelength (nm)
ON17:ON18 ON17 ON18
200 300 400 500 600 700 800
0.0
0.2
0.4
0.6
0.8
1.0
3'-TAAAAAHBHBAATATT-2' (ON19)2'-ATTTTTPHPHTTATAA-3' (ON20)
D)
400 450 500 550
547.0509.0
548.0505.0
424.0409.0
Ab
sorb
ance
Wavelength (nm)
ON19:ON20 ON19 ON20
200 300 400 500 600 700 800
0.0
0.2
0.4
0.6
0.8
3'-TAAAAAHBHBHATATT-2' (ON23)2'-ATTTTTPHPHPTATAA-3' (ON24)
E)
400 450 500 550
553.0517.0546.0
505.0
423.0
404.0
Ab
sorb
ance
Wavelength (nm)
ON23:ON24 ON23 ON24
Figure 5.8 UV-vis spectra of GNA duplexes and their corresponding single strands. (A) ON13, ON14, and ON13:ON14. (B) ON15, ON16, and ON15:ON16. (C) ON17, ON18, and ON17:ON18. (D) ON19, ON20, and ON19:ON20. (E) ON23, ON24, and ON23:ON24. The inset shows the expanded porphyrin Soret and PBI absorption bands. Conditions: 10 mM sodium phosphate, 100 mM NaCl, pH 7.0, and 2 M of each strand.

Chapter 5.2.2 Zipper-like arrangement of chromophores in GNA
174
200 300 400 500 600 700
-12
-8
-4
0
4
3'-TAAAAAHBHTAATATT-2' (ON15)2'-ATTTTTPHPATTATAA-3' (ON16)
450 500 550 600-4
-3
-2
-1
0
1
2
3
4
566.0
421.5
436.0A)C
D (
md
eg)
Wavelength (nm)
ON15:ON16 ON15 ON16
200 300 400 500 600 700
-8
-4
0
4
8
3'-TAAAAAHPHPAATATT-2' (ON17)2'-ATTTTTBHBHTTATAA-3' (ON18)
450 500 550 600-4
-3
-2
-1
0
1
2
3
4
561.5
502.0
564.5
502.0
437.0
422.0
B)
CD
(m
deg
)
Wavelength (nm)
ON17:ON18 ON17 ON18
200 300 400 500 600 700-12
-8
-4
0
4
8
3'-TAAAAAHBHBAATATT-2' (ON19)2'-ATTTTTPHPHTTATAA-3' (ON20)
450 500 550 600 650-3
-2
-1
0
1
2
3
437.0
421.0
C)
CD
(m
deg
)
Wavelength (nm)
ON19:ON20 ON19 ON20
200 300 400 500 600 700
-12
-8
-4
0
4
8
12
3'-TAAAAAHBHBHATATT-2' (ON23)2'-ATTTTTPHPHPTATAA-3' (ON24)
460 480 500 520 540 560 580 600 620 640-1.5
-1.0
-0.5
0.0
0.5
1.0
1.5
509.0
505.0 562.0
565.0
D)
415.5
429.5
CD
(m
deg
)
Wavelength (nm)
ON23:ON24 ON23 ON24
Figure 5.9 CD spectra of GNA duplexes and their corresponding single strands. (A) ON15, ON16, and ON15:ON16. (B) ON17, ON8, and ON17:ON18. (C) ON19, ON20, and ON19:ON20. (D) ON23, ON24, and ON23:ON24. The inset shows the expanded PBI absorption region. Conditions: 10 mM sodium phosphate, 100 mM NaCl, pH 7.0, and 12 M of each strand.
The CD spectra of the modified duplexes containing more than two
chromophores were next investigated. Figure 5.9 shows the obvious bisignate CD
spectra in the Soret band of porphyrin upon duplex formation. The peak intensity of
the bisignate CD signal gradually increased with the increased amount of porphyrin
nucleobases in the duplex. Figure 5.9D illustrates that ON23:ON24, which contains
P-B-P-B-P, had a very classic bisignate CD signal. The intensity of the positive peak
was almost equal to the negative peak.

Chapter 5.2.2 Zipper-like arrangement of chromophores in GNA
175
200 300 400 500 600 700
-15
-10
-5
0
5
10
15
20
3'-TAAAAAHBHBHATATT-2' (ON23)2'-ATTTTTPHPHPTATAA-3' (ON24)
400 410 420 430 440 450
-10
-5
0
5
10
437.0
429.5
431.5
429.0
422.0415.5
CD
(m
deg
)
Wavelength (nm)
ON8:ON10 (B-P) ON13:ON14 (B-P-B) ON19:ON20 (P-B-P-B) ON23:ON24 (P-B-P-B-P)
Figure 5.10 CD spectra of GNA duplexes the ON8:ON10, ON13:ON14, ON19:ON20, and ON23:ON24. Conditions: 10 mM sodium phosphate, 100 mM NaCl, pH 7.0, and 12 M of each strand. The insets show the expanded porphyrin Soret band region.
The intensity of the CD signal accompanying the blue-shift of the bisignate CD
spectra in the Soret band increased with the increased amount of chromophore
moieties (Figure 5.10). Generally, a continuous shift in a CD spectrum with increased
amounts of chromophores (without a sudden major change in shape) indicates highly
ordered helical structures.9 Therefore, together with the melting temperature and the
UV-vis data, we propose that the aggregate P-B-P-B-P in ON23:ON24 was highly
organized in a zipper-like arrangement.

Chapter 5.2.3 Effect of natural bases on arrangement
176
Chapter 5.2.3 Effect of natural bases on arrangement
As described in chapter 5.2.2, a zipper-like P-B-P-B-P interstrand stacking array
stabilized the duplex by an additional 25 °C, which prompted us to construct hecial
array composed of B and P with less natural base pairs. At the initial stage, to test the
recognition ability of P and B based on interstrand π-π stacking in short duplex, the
amount of natural base pairs in the modified duplexes was decreased to four. A 7mer
duplex ON21:ON22 and a 9mer duplex ON29:ON30 were synthesized based on
ON15:ON16 and ON23:ON24 (Table 5.4), respectively.
Table 5.4 Presentation of functionalized GNA strands used in this chapter. Entry GNA duplex
1 3′-TAAAAAHBHTAATATT-2′ 2′-ATTTTTPHPATTATAA-3′
(ON15) (ON16)
2 3′-AAHBHTA-2′ 2′-TTPHPAT-3′
(ON21) (ON22)
3 3′-TAAAAAHBHBHATATT-2′ 2′-ATTTTTPHPHPTATAA-3′
(ON23) (ON24)
4 3′-AAHBHBHAT-2′ 2′-TTPHPHPTA-3′
(ON29) (ON30)
200 300 400 500 600 700
-12
-9
-6
-3
0
3
6
400 410 420 430 440 450-12
-9
-6
-3
0
3
6
433.5436.0
420.5
421.5
A)
CD
(m
deg
)
Wavelength (nm)
ON15:ON16 ON21:ON22
200 300 400 500 600 700
-10
-5
0
5
10
450 500 550 600 650
-1
0
1
2
B)
563.0
500.0
429.5
415.5
CD
(m
deg
)
Wavelength (nm)
OD23:OD24 OD29:OD30
Figure 5.11 CD spectra of GNA strands. (A) ON15:ON16 and ON21:ON22. (B) ON23:ON24 and ON29:ON30. Conditions: 10 mM sodium phosphate, 100 mM NaCl, pH 7.0, and 12 M of each strand.
As expected, the CD signals intensity of ON21:ON22 in the GNA absorption was
much lower than that of ON15:ON16 (Figure 5.11A), there are only 4 natrual base

Chapter 5.2.3 Effect of natural bases on arrangement
177
pairs in duplex. However, the intensity of CD signals of ON21:ON22 in the Soret
band was only slight lower of ON15:ON16. Accordingly, the conformation of P-B-P
in ON15:ON16 may be retained in ON21:ON22.
Figure 5.11B shows the CD spectra of ON29:ON30. In the porphyrin Soret band
region, there is almost no bisignate CD signal, indicating there is no helical
conformation of P-B-P-B-P. This revealed that natural bases played an important role
in the formation of chromophore helical array and a certain amount of natural base
pairs is needed for the formation of the helical array.
To explore the effect of natural bases on the P and PBI arrangements, the
“duplexes” listed in Table 5.5 were synthesized and analyzed. Mixtures of modified
strands with equal amounts of P and B moieties but with different natural bases were
investigated by CD spectrometry to illustrate the conformation of P-B-P-B-P.
Table 5.5 Presentation of GNA strands used to study the effect of natural bases on the porphyrin and PBI arrangements.
Entry Mixtures of GNA strands Bisignate CD
spectra in Soret band
Tm*[oC]a
1 3′-TAAAAAHBHBHATATT-2′ 2′-ATTTTTPHPHPTATAA-3′
(ON23) (ON24)
(–/+) 79
2 3′-TAAAAAHBHBHATATT-2′
2′-TTPHPHPTA-3′ (ON23) (ON30)
(–/+) 50
3 3′-AAHBHBHAT-2′
2′-ATTTTTPHPHPTATAA-3′ (ON29) (ON24)
(–/+) 50
4 3′-AAHBHBHAT-2′ 2′-TTPHPHPTA-3′
(ON29) (ON30)
No
5 3′-HBHBC3-2′
2′-C3PHPHP-3′ (ON34) (ON31)
×
6 3′-AAHBHBHAT-2′
2′-C3PHPHP-3′ (ON29) (ON31)
×
7 3′-HBHBC3-2′
2′-TTPHPHPTA-3′ (ON34) (ON30)
(+/–) 50
8 3′-HBHBC3-2′
2′-ATTTTTPHPHPTATAA-3′ (ON34) (ON24)
(+/–) 45
*See details in the next chapter.

Chapter 5.2.3 Effect of natural bases on arrangement
178
200 300 400 500 600 700-12
-8
-4
0
4
8
12A)
CD
(m
deg
)
Wavelength (nm)
ON23:ON30 ON29:ON24 ON29:ON30 ON23:ON24
200 300 400 500 600 700
-12
-8
-4
0
4
8
12B)
CD
(m
deg
)
Wavelength (nm)
ON34-ON30 ON34-ON24 ON23-ON24
Figure 5.12 CD spectra of mixtures of GNA strands. Conditions: 10 mM sodium phosphate, 100 mM NaCl, pH 7.0, and 12 M of each strand. (A) ON23:ON30, ON29:ON24, ON29:ON30, and ON23:ON24. (B) ON34:ON30, ON34:ON24, and ON23:ON24.
Interestingly, as shown in Figure 5.12A, ON23:ON30 or ON29:ON24 containing
a natural overhang in one strand displayed a similar bisignate CD spectra (–/+) in the
Soret band compared with ON23:ON24.
The possibility of a pure P-B-P-B-P array existing without the assistance of
flanking natural base pairs was also investigated. Unfortunately, a porphyrin-GNA
strand ON31without the natural base cannot be purified given its poor water solubility.
However, Figure 5.12B shows that ON34:ON30 or ON34:ON24 exhibited an
opposite bisignate CD signal (+/–) in the porphyrin Soret band although there were no
flanking natural base pairs. This result suggested a different aggregation of
P-B-P-B-P compared with ON23:ON24.
Overall, flanking natural base pairs or natural overhangs play a key role in
affording helical structures. This was consistent with the report of Leumann et al.,
where they demonstrated that a few natural base pairs at the end of the duplex DNA is
apparently required to align two strands in a defined structural register and to prevent
undefined aggregation.9 In addition, the conformation of porphyrin and PBI
aggregates could be switched by adjusting natural overhangs in a GNA strand,
although the function of this switching is still unknown.

Chapter 5.2.3 Effect of natural bases on arrangement
179
Thermal stability of chromophore helical array
It is necessary to obtain the thermal stability of chromophore helical array.
Unfortunately, our attempt to monitor the changes in absorbance upon heating at 260
nm failed to offer Tm of such chromophore array, because the low hyperchromicity of
the short duplex with few natural base pairs. However, Figure 5.13 shows obvious
changes in the Soret band of short duplexes upon heating from 10 °C to 90 °C, which
give access to investigate the thermal stabilities of those arrays through monitoring
the temperature-dependent changes in CD absorbance at porphyrin Soret band.
200 300 400 500 600 700-8
-6
-4
-2
0
2
4
6
8
561.5
498.5
A) 428.5
415.0
CD
(m
deg
)
Wavelength (nm)
ON 23: ON 30
10 oC 60 oC
20 oC 70 oC
30 oC 80 oC
40 oC 90 oC
50 oC
200 300 400 500 600 700
-8
-6
-4
-2
0
2
4
6
8
10
12
563.0
496.0
B)429.0
414.5
CD
(m
deg
)
Wavelength (nm)
ON29:ON24
10 oC 60 oC
20 oC 70 oC
30 oC 80 oC
40 oC 90 oC
50 oC
200 300 400 500 600 700-6
-4
-2
0
2
4
6C)
426.0
421.5
CD
(m
deg
)
Wavelength (nm)
ON34:ON30
10 oC 60 oC
20 oC 70 oC
30 oC 80 oC
40 oC 90 oC
50 oC
200 300 400 500 600 700
-12
-9
-6
-3
0
3
6
9
12D)
428.0
414.5
CD
(m
deg
)
Wavelength (nm)
ON34:ON24
10 oC 60 oC
20 oC 70 oC
30 oC 80 oC
40 oC 90 oC
50 oC
Figure 5.13 Temperature-dependent CD spectra of chromophore helical arrays. A) ON23:ON30; B) ON29:ON24; C) ON34:ON30; D) ON34:ON24. Conditions: 10 mM sodium phosphate, 100 mM NaCl, pH 7.0, and 12 M of each strand.

Chapter 5.2.3 Effect of natural bases on arrangement
180
10 20 30 40 50 60 70 80 90-7
-6
-5
-4
-3
-2
-1
0
1A)
CD
(m
deg
)
Temperature (oC)
ON23:ON30
10 20 30 40 50 60 70 80 90
-7
-6
-5
-4
-3
-2
-1
0
1B)
CD
(m
deg
)
Temperature (oC)
ON29:ON24
10 20 30 40 50 60 70 80 901.5
2.0
2.5
3.0
3.5
4.0
4.5C)
CD
(m
deg
)
Temperature (oC)
ON34:ON30
10 20 30 40 50 60 70 80 90
2
4
6
8
10
12D)
CD
(m
deg
)
Temperature (oC)
ON34:ON24
Figure 5.14 Melting curves of chromophore helical array. Temperature-dependent changes in CD absorbance as monitored at porphyrin Soret band. *Conditions (Tm*): 10 mM sodium phosphate, 100 mM NaCl, pH 7.0, and 12 M of each strand. A) ON23:ON30; B) ON29:ON24; C) ON34:ON30; D) ON34:ON24.
The thermal stabilities of ON23:ON30, ON29:ON24, ON34:ON30 and
ON34:ON24 were investigated by temperature-dependent CD spectrometry. The
melting curves were obtained by monitoring changes in CD absorbance of porphyrin
Soret band. As shown in Figure 5.14, the melting curves suggested that the melting
point of those chromophore helical array ranged from 45 to 50 oC, thus dominated the
stabilities of ON23:ON30, ON29:ON24, ON34:ON30 and ON34:ON24 at room
temperature.

Chapter 5.2.3 Effect of natural bases on arrangement
181
Crystallography of modified GNA duplexes
To understand better the conformation of porphyrin and PBI based on the GNA
backbone, we attempted to obtain the crystals of the modified GNA duplexes listed
Table 5.5.
The purification of the GNA oligonucleotides for crystallization was generally
followed by desalting over Sep-Pak C18 columns in order to remove residual buffer
and/or excess metal cations. After desalting, a single strand GNA was concentrated
and then redissolved in water to prepare a 2 mM stock solution. The GNA duplex
samples were prepared as a 1 mM stock solution (considering the poor water
solubility of porphyrin-GNA strands), and were then denatured on a thermal heater.
After cooling down to room temperature, the stock solution was finally filtered to
remove insoluble particles.
Afterward, the oligonucleotide stock solution was placed in a 4 °C cold room for
several hours prior to use. The coldness ensured the equilibration of the solution.
Crystallization buffers were obtained using the Nucleic Acid Mini Screen
(Hampton Research, HR2-118). This screen consisted of 24 buffers with various pH,
salt, and polyamine conditions. The crystallization buffers were also equilibrated (by
storage in a cold room) at 4 °C overnight to reduce temperature fluctuation during the
crystallization setup. The hanging drop vapor diffusion technique was initially used
for crystallization. The sitting drop vapor diffusion method was later used because of
its easier procedure.
Finally, the modified GNA duplex stock solution (2 μL) was mixed with the
crystallization buffers (2 μL) at 4 °C. The mixture was equilibrated against a well of
35% 2-methyl-2,4-pentanediol (1 mL) after the plate was sealed with a clear,
transparent tape.
Unfortunately, our attempt to crystallize the modified GNA duplex samples in a
buffer failed. No crystal was obtained from the system because the samples easily
precipitated directly from the buffer within half an hour at 4 °C. Crystallization at
lower duplex concentrations (0.25 and 0.125 mM) was also tried, but to no avail.

Chapter 5.3 Conclusions
182
Chapter 5.3 Conclusions
In this chapter, GNA duplexes containing two different chromophores such as
B-Pyr, B-Pyr′, B-Pe′ and B-P were investigated. Porphyrin (P) and PBI (B)
stabilized the GNA duplex most significantly among all the tested chromophores.
Accordingly, a zipper-like P-B-P-B-P was organized in the middle of a 16mer duplex
GNA, which was examined by UV-vis and CD spectrometry. Flanking natural base
pairs and natural overhangs helped chromophores to form a helical conformation in
GNA duplex. Future works will be focused on the light harvesting and charge
transport of porphyrin and PBI in GNA.

Chapter 5.4 Experimental
183
Chapter 5.4 Experimental
GNA oligonucleotide synthesis and purification
All the oligonucleotides were prepared on an ABI 394 DNA/RNA synthesizer on
a 1 micromole scale according to previous method. After the steps of detritylation and
purification, the identities of all oligonucleotides were confirmed by MALDI–TOF
MS (Table 5.6).
Thermal denaturation
The melting studies were carried out in 1 cm path length quartz cells (total
volume 325 µL; 200 µL sample solutions were covered by mineral oil) on a Beckman
800 UV-VIS spectrophotometer equipped with a thermo-programmer. Melting curves
were monitored at 260 nm with a heating rate of 1 oC/min. Melting temperatures were
calculated from the first derivatives of the heating curves. Experiments were
performed in duplicate and mean values were taken.
CD spectroscopy
CD measurements were performed on a JASCO J-810 spectrometer in a 1 mm
path length quartz cuvette. The GNA single strands or duplexes were prepared in 10
mM sodium phosphate, 100 mM NaCl, pH 7.0, and the concentration of each strand
was 8 M. Each measurement was repeated 5 times and the average taken.

Chapter 5.4 Experimental
184
Table 5.6 MALDI-TOF MS data of used GNA oligonucleotides.
(ON8, ON12, ON14, ON15, ON18 and ON19 were provided by Yonggang Xiang.)
Name Oligonucleotides Mcalcd Mfound ON 1 3′-TAAAAATTAATATT-2′ 3951.5(C120H157N57O70P14) 3949.3 ON 2 3′-AATATTAATTTTTA-2′ 3924.5(C120H160N48O76P14) 3923.2 ON 3 3′-TAAAAATAATAATATT-2′ 4222.7(C128H167N62O74P15) 4223.3 ON 4 3′-AATATTATTATTTTTA-2′ 4186.6(C128H171N50O82P15) 4185.5 ON 6 3′-AATATTAPyrHATTTTTA-2′ C134H171N46O78P15(4136.7) 4137.7 ON 7 3′-AATATTAPyr′HATTTTTA-2′ C135H169N46O78P15(4146.7) 4147.1 ON 8 3′-TAAAAATBHTAATATT-2′ ON 9 3′-AATATTAPe′HATTTTTA-2′ 4198.8(C139H171N46O78P15) 4198.2 ON 10 3′-AATATTAPHATTTTTA-2′ 4408.9(C151H181N50O78P15) 4416.9 ON 11 3′-TAAAAATPHTAATATT-2′ 4427.0(C151H179N56O74P15) 4434.2 ON 12 3′-AATATTABHATTTTTA-2′ ON 13 3′-TAAAAAHPHTAATATT-2′ 4288.8(C145H173N54O72P15) 4289.5 ON 14 3′-AATATTABHBTTTTTA-2′ ON 15 3′-TAAAAAHBHTAATATT-2′ ON 16 3′-AATATTAPHPTTTTTA-2′ 6027.0(C199H242N77O104P21) 6025.8 ON 17 3′-TAAAAAHPHPAATATT-2′ 6008.9(C199H244N71O108P21) 6006.6 ON 18 3′-AATATTHBHBTTTTTA-2′ ON 19 3′-TAAAAAHBHBAATATT-2′ ON 20 3′-AATATTHPHPTTTTTA-2′ 4613.3(C174H193N44O78P15) 4613.6 ON 21 3′-AAHBHTA-2′ 1948.4(C71H83N19O35P6) 1949.3 ON 22 3′-TAPHPTT-2′ 2364.9(C108H103N19O32P6) 2366.4 ON 23 3′-TAAAAAHBHBHATATT-2′ 4630.2(C164H192N47O84P15) 4631.5 ON 24 3′-AATATPHPHPTTTTTA-2′ 4973.7(C203H209N46O76P15) 4975.7 ON 25 3′-TAAAAAHBBHAATATT-2′ 4777.3(C170H197N52O84P15) 4778.4 ON 26 3′-AATATTPHHPTTTTTA-2′ 4613.3(C174H193N44O78P15) 4614.5 ON 27 3′-TAAAAAHPPHAATATT-2′ 4649.3(C174H189N56O70P15) 4650.5 ON 28 3′-AATATTBHHBTTTTTA-2′ 4741.2(C170H201N40O92P15) 4740.5 ON 29 3′-AAHBHBHAT-2′ 2759.0(C108H119N21O50P8) 2760.4 ON 30 3′-ATPHPHPTT-2′ 3111.6(C147H135N23O40P8) 3110.7 ON 31 3′-HBHBC3-2′ 1697.36(C77H80N4O32P4) 1697.3

Chapter 5.5 References
185
Chapter 5.5 References
1. Bouquin, N.; Malinovskii, V. L.; Haner, R. Chemical Communication 2008,
1974-1976.
2. (a) Giaimo, J. M.; Gusev, A. V.; Wasielewski, M. R. Journal of the American
Chemical Society 2002, 124, 8530–8531. (b) Fuller, M. J.; Sinks, L E.;
Rybtchinski, B.; Giaimo, J. M.; Li, X.; Wasielewski, M. R. The Journal of
Physical Chemistry A 2005, 109, 970–975.
3. (a) Muthukumaran, K.; Schwartz, J. K.; Sazanovich, I. V.; Kirmaier, C.; Hindin,
E.; Diers, J. R.; Taniguchi, M.; Bocian, D. F.; Holten, D.; Lindsey, J. S. The
Journal of Physical Chemistry B 2003, 107, 3443–3454. (b) Muthukumaran, K.;
Loewe, R. S.; Kirmaier, C.; Hindin, E.; Schwartz, J. K.; Sazanovich, I. V.; Diers,
J. R.; Bocian, D. F.; Holten, D.; Lindsey, J. S. The Journal of Physical Chemistry
B 2003, 107, 3431–3442.
4. (a) Brotschi, C.; Häberli, A.; Leumann, D. J. Angewandte Chemie International
Edition 2001, 40, 3012-3014; (b) Brotschi, C.; Leumann, D. J. Angewandte
Chemie International Edition 2003, 42, 1655-1658; (c) Brotschi, C.; Mathis, G.;
Leumann, D. J. Chemistry-A European Journal 2005, 11, 1911-1923; (d) Zahn, A.;
Leumann, C. J. Chemistry-A European Journal 2008, 14, 1087-1094; (e) Johar, Z.;
Zahn, A.; Leumann, C. J.; Jaun, B. Chemistry-A European Journal 2008, 14,
1080-1086.
5. Kasha, M.; Rawls, H.R.; El-Bayoumi, M. A. Pure and Applied Chemistry 1965,
11(3-4), 371-392.
6. Kashida, H.; Asanuma, H.; Komiyama, M. Angewandte Chemie International
Edition 2004, 43, 6522-6525.
7. Bouquin, N.; Malinovskii, V. L.; Guegano, X.; Liu, S. X.; Decurtins, S.; Haner, R.
Chemistry-A European Journal 2008, 14, 5732-5736.
8. (a) McMillin, D. R.; Shelton, A. H.; Bejune, S. A.; Fanwick, P. E.; Wall, R. K.
Coordination Chemistry Review 2005, 249(13-14), 1451; (b) Nitta, Y.; Kuroda, R.

Chapter 5.5 References
186
Biopolymers 2006, 81, 376.
9. Brotschi, C.; Mathis, G.; Leumann, D. J. Chemistry-A European Journal 2005, 11,
1911-1923.

Chapter 6 Photochemical ligation of GNA via anthracene cyclodimer formation
187
Chapter 6 Photochemical Ligation of GNA via
Anthracene Cyclodimer Formation

Chapter 6.1 Introduction
188
Chapter 6.1 Introduction
Anthracene is a polycyclic aromatic hydrocarbon consisting of three fused
benzene rings. Due to their unique photophysical and photochemical properties,
anthracenes have been used in DNA in serveal areas.
Figure 6.1 Artificial anthracene C-nucleosides.4
As efficient photosensitizers, anthracenes and their derivatives have been widely
used as cleaving agents in the study of DNA photocleavage.1 Nevertheless, the
fluorescence characteristics of anthracene monomers and excimers have been
explored in the development of potential probes for detecting single DNA base-pair
mismatches2 and single nucleotide polymorphisms.3 Anthracenes have also been
introduced into DNA as nonpolar artificial bases for the development of potential van
der Waals probes (Figure 6.1).4
Figure 6.2 Photodimerization of anthracenes.5
Aside from the application for photosensitizer and probe, anthracenes had been
used as a phototriggered joint for DNA. Two anthracenes are known to form a dimer
by the [4π + 4π] photoreaction (Figure 6.2).5 The photochemical properties of
anthracenes are the base of their potential applications. Over the past several years,

Chapter 6.1 Introduction
189
anthracene cyclodimer formation has been applied in the DNA photoligation.6 Ihara et
al. investigated the photochemical ligation of DNA conjugates via the cycloaddition
of anthracenes. Anthracene-DNA conjugates were synthesized by linking the 5′- or
3′-end of oligodeoxyribonucleotides to anthracene (1-, 2-, or 9-positions) using
multi-methenylene linkers.6 The use of such multi-methenylene linkers enables
appropriate slacking in the chains, which is always required for efficient dimerization
by the entropic demand in terms of statics.6a However, the cycloaddition of
anthracenes without multi-methenylene linkers in interior of DNA was rarely
investigated, probably due to inefficient dimerization of anthracenes in duplex DNA.
Considering the significantly decreased yield of modified GNA strand with
multi-incorporated chromophores, photochemical ligation of GNA was developed in
order to address this problem. In the chapter, we describe the incorporation of
anthracenes as artificial bases into GNA and the photochemical ligation of GNA via
anthracene cyclodimer formation.

Chapter 6.2.1 Synthesis of anthracene-GNA
190
Chapter 6.2 Results and Discussion
Chapter 6.2.1 Synthesis of anthracene-GNA
The propane-1,2-diol-modified anthracene building block (An) was selected to
use in the ligation of GNA (Figure 6.3B), because the ligation of DNA conjugates
with 2-substituted anthracenes have been reported to proceed more efficiently than
that with 9-substituted anthracenes.6f The phosphoramidite 9a was used to synthesize
GNA strands with incorporated anthracene nucleotides (An, Figure 6.3A). The
anthracene-GNA strands were prepared according to the previous method.
Figure 6.3 (A) Structure of anthracene phosphoramidite 9a. (B) Constitution of the (S)-GNA backbone. An:H base pair used in the present study.

Chapter 6.2.2 Photochemical ligation of GNA
191
Chapter 6.2.2 Photochemical ligation of GNA
Subsequently, the photochemical ligation of GNA via anthracene cyclodimer
formation was investigated in terms of three aspects, namely, template-supported
GNA ligation, interstrand crosslinking in the middle of the GNA duplex, and end
capping of the GNA duplex.
A. Template-supported GNA ligation
The structures and sequences of the GNA strands used in the present study are
shown in Figure 6.4. ON3 and ON4 were 8-mer and 14-mer GNA nucleotides
containing anthracene nucleotides on their 3′ and 2′ termini. The sequences of the
strands were designed to be complementary to the neighboring sites of the template
strand ON2. A pair of the strands were hybridized to the template with their
anthracene units facing each other to form a tandem duplex. The model template ON2
was a 22-mer sequence containing two adjacent abasic sites, which are supposed to
offer the space for the anthracenes upon the formation of the tandem duplex.
Figure 6.4 Structures and sequences of the conjugate and template GNAs used in the present study.

Chapter 6.2.2 Photochemical ligation of GNA
192
Table 6.1 Properties of the anthracene-containing GNA duplexes.a Entry Sequence Tm (C) Tm (C)* Excimer
1 3′-TTATAAAAATAATAnAnTATTAAT-2′ 2′-AATATTTTTATTAHHATAATTA-3′
(ON1) (ON2)
52 Weak
2 3′-AnTATTAAT-2′ 3′-TTATAAAAATAATAn-2′ 2′-AATATTTTTATTAHHATAATTA-3′
(ON4) (ON3) (ON2)
53 53 No
aConditions: 10 mM sodium phosphate, 100 mM NaCl, and 2 μM individual strands.*After photoirradiation.
The thermal stabilities of the duplexes were first analyzed by UV melting
experiments. Table 6.1 reveals that the Tm of the tandem duplex ON4:ON3:ON2
(Table 6.1, entry 1) was only slightly higher than that of duplex ON1:ON2 (Table 6.1,
entry 2) by 1 °C.
20 30 40 50 60 70 80
0.00
0.05
0.10
0.15
0.20
0.25
0.30
Hyp
erch
rom
icit
y
Temperature (oC)
ON1:ON2 ON3:ON4:ON2
Figure 6.5 UV-melting curves of the GNA duplexes ON1:ON2 and ON3:ON4:ON2. Changes in the absorbance upon heating were monitored at 260 nm. Conditions: 10 mM sodium phosphate, 100 mM NaCl, pH 7.0, and 2 M of each strand.
Excimer formation is regarded as a prerequisite for the photodimerization of
anthracenes,6a the fluorescence properties of the GNA strands containing anthracene
were analyzed to explore whether the stacking anthracenes were formed in the tandem
duplex ON3:ON4:ON2.

Chapter 6.2.2 Photochemical ligation of GNA
193
400 420 440 460 480 500 520 540 560 580 600
0
20
40
60
80
100
120
140
160
180
RF
U
Wavelength (nm)
ON4:ON3:ON2 ON1:ON2 ON4 ON3 ON4+ON3+ON2
Figure 6.6 Fluorescence properties of anthracene nucleotides in GNA: ON1:ON2, ON3:ON4:ON2, ON3, and ON4. Conditions: 10 mM sodium phosphate, 100 mM NaCl, pH 7.0, and 2 µM of each strand of a duplex; excitation at 350 nm with a cutoff filter at 420 nm.
Upon excitation at 350 nm, duplex ON1:ON2 containing two adjacent anthracene
nucleobases in one strand yielded a weak fluorescence emission at around 500 nm
(excimer emission). In contrast, the tandem duplex ON4:ON3:ON2 only gave a
strong fluorescence emission at 435 nm (regular emission), which was much higher in
intensity than the simple sum of the spectra of each strand. This result together with
the thermal stabilities might indicate no stacking of two anthracenes in the tandem
duplex.
Although excimer emissions of anthracenes were not observed in the duplexes,
the photochemical ligation of GNA in the tandem duplex ON4:ON3:ON2 was
examined. Solutions containing 8 M GNA oligonucleotides of each strand were
irradiated at 366 nm in an N2 atmosphere at 0 °C for 3 min. A high-pressure mercury
lamp equipped with longpass optical filters was used.

Chapter 6.2.2 Photochemical ligation of GNA
194
Figure 6.7 HPLC chromatograms of the reaction mixtures before and after 3 min of photoirradiation for the tandem duplex ON3:ON4:ON2. The chromatograms were obtained under the following conditions: Waters Xterra column (MS C18, 4.6 mm × 50 mm); solution A, 50 mM triethylamine-acetic acid buffer (pH 7); solution B, acetonitrile; linear gradient, 4%–20% in 40 min; flow rate, 1 mL/min.
The mixture of the photoreaction was analyzed by reversed-phase HPLC. Figure
6.7 shows the chromatograms of the reaction mixture for the tandem duplex
ON4:ON3:ON2 before and after photoirradiation. No new peak was observed in the
chromatogram after photoirradiation, indicating no photochemical ligation of GNA in
the tandem duplex. A new peak did not appear even after a prolonged irradiation time
of 15 min.
B. Interstrand crosslinking in the middle of the GNA duplex
Anthracene nucleotides were introduced into the middle of a 16-mer GNA duplex.
The duplexes ON7:ON8 and ON9:ON10 containing two adjacent anthracene
nucleobases (Table 6.2, entries 2 and 3) were expected to form a hairpin structure as a
result of the photoirradiation.
Table 6.2 reveals that duplexes ON7:ON8 and ON9:ON10 containing two
adjacent anthracene nucleobases (Table 6.2, entries 2 and 3) yielded an overall low

Chapter 6.2.2 Photochemical ligation of GNA
195
melting temperature (Tm) of 31 and 35 C, respectively, compared with 54 °C for an
A:T base pair at the same position (Table 6.2, entry 1). On the other hand, duplexes
ON3:ON4 and ON5:ON6 were stable at room temperature. Hence, they are suitable
for use in the next studies.
Table 6.2 Thermal stabilities of the anthracene-containing GNA duplexes before and after photoirradiation.a
Entry Sequence Tm (C) Tm (C)*
1 3′-TAAAAATAATAATATT-2′ 2′-ATTTTTATTATTATAA-3′
(ON5) (ON6)
54
2 3′-TAAAAATHAnTAATATT-2′ 2′-ATTTTTAAnHATTATAA-3′
(ON7) (ON8)
31 72
3 3′-TAAAAATAnHTAATATT-2′ 2′-ATTTTTAHAnATTATAA-3′
(ON9) (ON10)
35 77
4 3′-TAAAAATHATAATATT-2′
2′-ATTTTTAAnHATTATAA-3′ (ON11) (ON8)
30 30
5 3′-TAAAAATAnHTAATATT-2′ 2′-ATTTTTAHTATTATAA-3′
(ON9) (ON12)
32 31
aConditions: 10 mM sodium phosphate, 100 mM NaCl, and 2 μM individual strands.*After photoirradiation.
400 410 420 430 440 450 460 470 480 490 500
0
20
40
60
80
100
120
140
160
180
200A)
RF
U
Wavelength (nm)
ON7:ON8 ON7 ON8 ON7+ON8
400 410 420 430 440 450 460 470 480 490 500
0
20
40
60
80
100
120
140
160
180
200
220
240B)
RF
U
Wavelength (nm)
ON9:ON10 ON9 ON10 ON9+ON10
Figure 6.8 Fluorescence properties of anthracene nucleotides in GNA. Conditions: 10 mM sodium phosphate, 100 mM NaCl, pH 7.0, and 2 µM of each strand of a duplex (Table 6.2); excitation at 350 nm with a cutoff filter at 420 nm. (A) ON7, ON8 and ON7:ON8. (B) ON9, ON10 and ON9:ON10.
As shown in Figure 6.8, duplexes ON7:ON8 and ON9:ON10, each containing
two adjacent anthracene nucleobases, exhibited no excimer emission. However, they

Chapter 6.2.2 Photochemical ligation of GNA
196
showed much lower fluorescence intensity than the simple sum of the spectra of each
strand, indicating the possible π-π stacking interactions of anthracenes in the
duplexes.
400 420 440 460 480 500
0
20
40
60
80
100
120A)
RF
U
Wavelength (nm)
ON7:ON8 ON7:ON8* ON9:ON10 ON9:ON10*
20 30 40 50 60 70 80 90
0.00
0.05
0.10
0.15
0.20
0.25
0.30 ON7:ON8 ON9:ON10
B)
Hyp
erch
rom
icit
y
Temperature (oC)
ON7:ON8* ON9:ON10*
Figure 6.9 (A) The fluorescence properties of anthracene-GNA duplexes before and after photoirradiation: ON7:ON8, ON9:ON10, ON7:ON8* and ON9:ON10*. (B) UV-melting curves of the GNA duplexes containing anthracene nucleotides: ON7:ON8, ON9:ON10, ON7:ON8* and ON9:ON10*. Changes in the absorbance upon heating were monitored at 260 nm. Conditions: 10 mM sodium phosphate, 100 mM NaCl, pH 7.0, and 2 M of each strand (Table 6.2; *after irradiation).
Figure 6.9A shows that the fluorescence emission of anthracene in the duplex was
significantly decreased after photoirradiation. This result is due to the highly efficient
crosslinking reaction of anthracenes, which could be used as a probe to monitor
photoirradiation reactions.
Figure 6.9B reveals the high stability of the duplexes ON7:ON8 and ON9:ON10
after irradiation at 366 nm UV light for 3 min. Table 6.2 shows that ON7:ON8* and
ON9:ON10* exhibited melting temperatures (Tm) at 72 and 77 °C, respectively. This
increased duplex stability could be associated with the crosslinking reaction of
anthracenes in the duplex after photoirradiation, but not with the undesired
crosslinking reactions with nucleobases.5 This was further supported by the
un-increased duplex stabilities for the photoirradiated duplexes ON11:ON8* and
ON9:ON12* each contained a single anthracene nucleotide (Table 6.2, entries 4 and 5;
Figure 6.10B).

Chapter 6.2.2 Photochemical ligation of GNA
197
20 30 40 50 60 70 80 90
0.00
0.02
0.04
0.06
0.08
0.10
0.12
0.14
0.16
0.18 ON11:ON8 ON9:ON12
Temperature (oC)
Hyp
erch
rom
icit
y
ON11:ON8* ON9:ON12*
Figure 6.10 UV-melting curves of the GNA duplexes containing anthracene nucleotides: ON11:ON8, ON9:ON12, ON11:ON8* and ON9:ON12*. Changes in the absorbance upon heating were monitored at 260 nm. Conditions: 10 mM sodium phosphate, 100 mM NaCl, pH 7.0, and 2 M of each strand.
Unfortunately, our attempt to separate the photoproducts of ON7:ON8* and
ON9:ON10* by HPLC failed.
C. End capping of the GNA duplex
To investigate whether the ends of a duplex were crosslinked by the
photoreaction, anthracene-GNA ON13 and ON14 were designed. These duplexes
contained two adjacent anthracene nucleotides dangling at the ends of the duplex. The
sequences of ON13 and ON14 were complementary to each other, and the duplex
ON13:ON14 was expected to form a hairpin structure as a result of the
photoirradiation.

Chapter 6.2.2 Photochemical ligation of GNA
198
Table 6.3 Thermal stabilities of the anthracene-containing GNA duplexes before and after photoirradiation.a Entry Sequence Tm (C) Tm (C)*
1 3′-TAAAAATAATAATATT-2′ 2′-ATTTTTATTATTATAA-3′
(ON5) (ON6)
54
2 3′-AnTAAAAATAATAATATT-2′
2′-C3AnHATTTTTATTATTATAA-3′ (ON13) (ON14)
56 82
3 3′-AnTAAAAATAATAATATTPyr′C3-2′
2′-C3AnHATTTTTATTATTATAAHPyr′-3′ (ON15) (ON16)
58 85
aConditions: 10 mM sodium phosphate, 100 mM NaCl, and 2 μM individual strands.*After photoirradiation.
400 420 440 460 480 500
0
5
10
15
20
25
30
35
40
45
50
55
RF
U
Wavelength (nm)
ON13:ON14 ON13:ON14* photoirradiation for 1 min ON13:ON14* photoirradiation for 3 min ON13:ON14* photoirradiation for 5 min
Figure 6.11 Fluorescence spectra of the duplex ON13:ON14 before and after photoirradiation (Table 6.3; *after irradiation). Conditions: 10 mM sodium phosphate, 100 mM NaCl (pH 7.0), and 2 M of each strand.
Figure 6.11 reveals that the fluorescence intensity of anthracenes decreased with a
prolonged photoirradiation time of 3 min. Only a marginal reduction further occurred
upon an increase in irradiation time. This finding indicated the nearly complete
photodimerization of anthracenes in ON13:ON14. Thus, the photoirradiation time
was set at 3 min.

Chapter 6.2.2 Photochemical ligation of GNA
199
20 30 40 50 60 70 80 90
0.00
0.05
0.10
0.15
0.20
0.25
0.30B)
ON13:ON14
Temperature (oC)H
yper
chro
mic
ity
ON13:ON14*
Figure 6.12 (A) HPLC chromatograms of the reaction mixtures before and after 3 min of photoirradiation for duplex ON13:ON14. The chromatograms were obtained under the following conditions: Waters Xterra column (MS C18; 4.6 mm × 50 mm); solution A, 50 mM triethylamine-acetic acid buffer (pH 7); solution B, acetonitrile; linear gradient, 10%–20% in 40 min; flow rate, 1 mL/min. (B) UV-melting curves of the duplex ON13:ON14 and ON13:ON14*. Changes in the absorbance upon heating were monitored at 260 nm. Conditions: 10 mM sodium phosphate, 100 mM NaCl (pH 7.0), and 2 M of each strand.
The products of the photoreactions were analyzed by reversed-phase HPLC.
Figure 6.12A shows the chromatograms of the reaction mixtures for the duplex
ON13:ON14 before and after photoirradiation for 3 min. The chromatograms show
the appearance of new peaks, along with the disappearance of the starting strands.
MALDI-TOF MS indicated that the asterisked peaks in HPLC chromatogram were
the crosslinked products between the two corresponding strands (Figure 6.17 and
6.18). Duplex ON13:ON14* displayed several peaks in the HPLC chromatogram
because it could form a maximum of eight isomers, including two pairs of
enantiomers.
To evaluate the thermal stability of the dimerized structure, melting experiments
were carried out using the photoproducts. Table 6.12B reveals that the photoproduct
ON13:ON14* exhibited a melting temperature much higher than that of duplex
ON13:ON14 by 26 °C. This remarkable increase in melting temperature was
consistent with the formation of an intramolecular duplex with a hairpin structure.
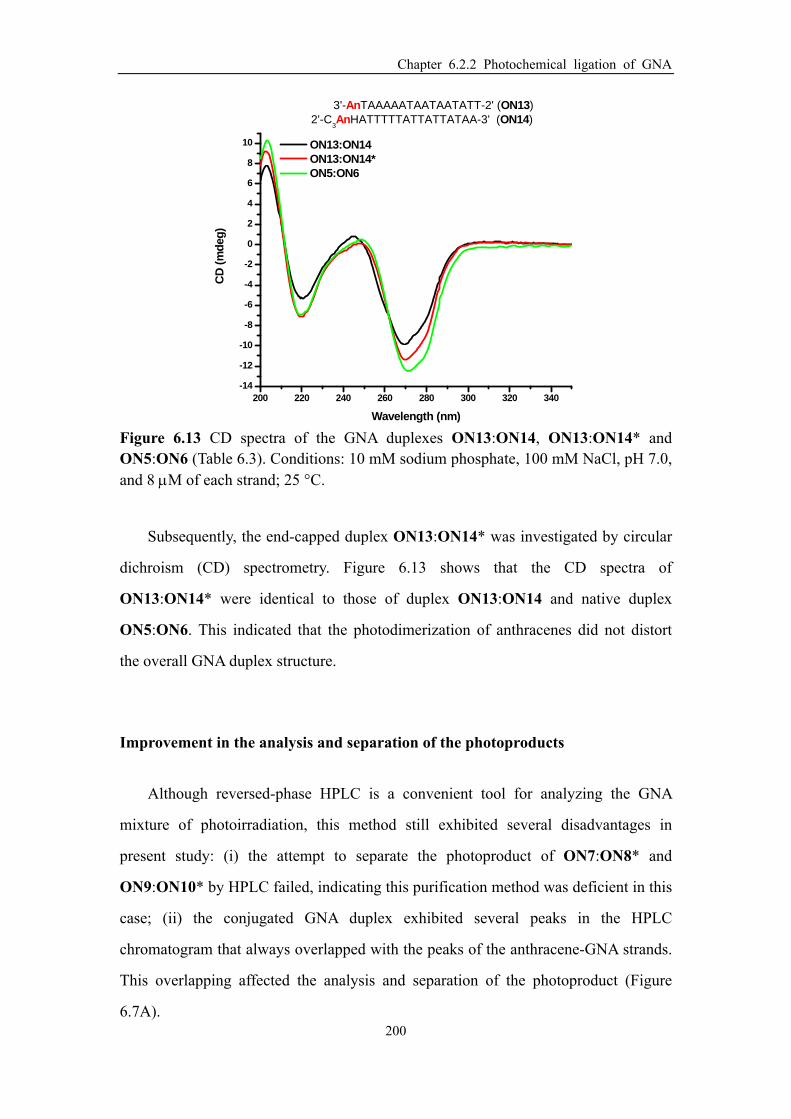
Chapter 6.2.2 Photochemical ligation of GNA
200
200 220 240 260 280 300 320 340-14
-12
-10
-8
-6
-4
-2
0
2
4
6
8
10
3'-AnTAAAAATAATAATATT-2' (ON13)2'-C
3AnHATTTTTATTATTATAA-3' (ON14)
CD
(m
deg
)
Wavelength (nm)
ON13:ON14 ON13:ON14* ON5:ON6
Figure 6.13 CD spectra of the GNA duplexes ON13:ON14, ON13:ON14* and ON5:ON6 (Table 6.3). Conditions: 10 mM sodium phosphate, 100 mM NaCl, pH 7.0, and 8 M of each strand; 25 °C.
Subsequently, the end-capped duplex ON13:ON14* was investigated by circular
dichroism (CD) spectrometry. Figure 6.13 shows that the CD spectra of
ON13:ON14* were identical to those of duplex ON13:ON14 and native duplex
ON5:ON6. This indicated that the photodimerization of anthracenes did not distort
the overall GNA duplex structure.
Improvement in the analysis and separation of the photoproducts
Although reversed-phase HPLC is a convenient tool for analyzing the GNA
mixture of photoirradiation, this method still exhibited several disadvantages in
present study: (i) the attempt to separate the photoproduct of ON7:ON8* and
ON9:ON10* by HPLC failed, indicating this purification method was deficient in this
case; (ii) the conjugated GNA duplex exhibited several peaks in the HPLC
chromatogram that always overlapped with the peaks of the anthracene-GNA strands.
This overlapping affected the analysis and separation of the photoproduct (Figure
6.7A).

Chapter 6.2.2 Photochemical ligation of GNA
201
Denaturing urea polyacrylamide gel electrophoresis (PAGE) is widely used to
analyze or purify single DNA or RNA fragments based on their molecular weights.
DNA migrates through a gel toward the positive electrode in the presence of current.
Shorter oligonucleotides migrate faster through the gel than longer ones, because
shorter oligonucleotides more easily travel through the pores of the gel. DNA is only
absorbed in the UV region, visualization is generally achieved by staining the
oligonucleotides with a visible dye. However, fluorescent tags such as ethidium
bromide do not stain GNA because they could not intercalate into GNA.
Figure 6.14 Pyrene acetylide GNA nucleotides (Pyr′).
To visualize the GNA used in the gel electrophoresis, pyrene acetylide
nucleotides (Pyr′), expected to function as fluorescence tags, were introduced into
GNA. In addition, pyrene acetylide GNA nucleotides enable to monitor duplex
formation by excimer fluorescence detection, and this would be applied in sensing the
GNA duplex denaturing. Accordingly, duplex ON15:ON16 was designed to contain
two adjacent pyrene acetylide nucleotides (Pyr′) in the duplex terminus (Table 6.3,
entry 3).

Chapter 6.2.2 Photochemical ligation of GNA
202
20 30 40 50 60 70 80 90
0.00
0.05
0.10
0.15
0.20
0.25
0.30
0.35
Hyp
erch
rom
icit
yTemperature (oC)
ON15:ON16B)
ON15:ON16*
Figure 6.15 (A) HPLC chromatograms of the reaction mixtures before and after 3 min of photoirradiation for duplex ON15:ON16. The chromatograms were obtained under the following conditions: Waters Xterra column (MS C18; 4.6 mm × 50 mm); solution A, 50 mM triethylamine-acetic acid buffer (pH 7); solution B, acetonitrile; linear gradient, 10%–40% in 30 min; flow rate, 1 mL/min. (B) UV-melting curves of the duplex ON15:ON16 and ON15:ON16*. Changes in the absorbance upon heating were monitored at 260 nm. Conditions: 10 mM sodium phosphate, 100 mM NaCl (pH 7.0), and 2 M of each strand.
After photoirradiation for 3 min, the reaction mixture of duplex ON15:ON16 was
first analyzed by reversed-phase HPLC. Figure 6.15A shows the chromatograms of
duplex ON15:ON16 before and after photoirradiation. Although the chromatogram
shows the appearance of several new peaks, it cannot reveal the percent conversion of
duplex ON15:ON16 to photoproduct because of overlapping peaks.
Thus, denaturing urea PAGE was selected to analyze the conversion of this
reaction. Before the denaturing urea PAGE, the fluorescence properties of duplex
ON15:ON16 with and without urea denaturation were analyzed. Figure 6.16A shows
that ON15:ON16 emitted a strong excimer emission of pyrenes in the buffer solution.
In contrast, the denatured ON15:ON16 only emitted a monomer emission of pyrene,
indicating the dissociation of complementary strands.

Chapter 6.2.2 Photochemical ligation of GNA
203
400 450 500 550 600
0
2000
4000
6000
8000
10000
12000
14000
16000
18000
20000A)
RF
U
Wavelength (nm)
Denatured with urea Without urea
Figure 6.16 (A) Fluorescence spectra of ON15:ON16 with and without urea denaturation (Table 6.3; *after irradiation). Conditions: 10 mM sodium phosphate, 100 mM NaCl (pH 7.0), and 8 M of each strand; excitation at 365 nm with a cutoff filter at 420 nm; fluorescence at 500 nm taken as the indicator of excimer fluorescence. (B) A photograph of denaturing urea polyacrylamide gel (6%) electrophoresis mobility shift arrays showing the denatured ON15:ON16 (lane 1), ON15 (lane 2), and ON16 (lane 3), as well as the photoreaction mixture of ON15:ON16* (lane 4).
Subsequently, the GNA mixture of the photoreaction was analyzed by denaturing
urea PAGE. Figure 6.16B shows a photograph of the denaturing urea PAGE mobility
shift arrays of ON15:ON16 before and after irradiation. The denaturing urea PAGEs
of ON15:ON16, ON15, and ON16 (Figure 6.16B, lanes 1–3) indicates duplex
ON15:ON16 was dissociated complementary, which was consistent with the
fluorescence experiment (Figure 6.16A). After photoirradiation for 3 min, the
conversion of ON15:ON16 (lane 1) to the crosslinking product ON15:ON16* (lane 4)
was complete.
Thus, the photoproduct ON15:ON16* can be collected according to the
asterisked peaks in HPLC chromatograms (Figure 6.15A). MALDI-TOF MS
indicated that the collected peaks are the crosslinked products between the two
corresponding strands (Figure 6.19 and 6.20). Figure 6.15B shows that the
photoproduct ON15:ON16* exhibited a melting temperature much higher than that of
duplex ON15:ON16 by 27 °C (Tm = 85 C; Table 6.3, entry 3). This significant
increase in the melting temperature revealed the formation of a crosslinked duplex via
the photodimerization of anthracenes.

Chapter 6.3 Conclusions
204
Chapter 6.3 Conclusions
In this chapter, we introduced anthracene as an artificial nucleosidic base into
GNA, and investigated the photochemical ligation of GNA through anthracene
cyclodimer formation. The photoreaction of GNA was analyzed by HPLC, UV-vis,
CD, MALDI-TOF MS and denaturing urea PAGE. The template-supported GNA
photoligation did not occur, probably due to the inefficient dimerization of
anthracenes in tandem duplex. In contrast, both the interstrand crosslinking in middle
of duplex and the end capping of duplex proved to be feasible. The photochemical
ligation of GNA via anthracene cyclodimer formation is a useful method for the
crosslinking of interstrand GNA, which may be applied in the construction of
functional GNA-supramolecules in the future.

Chapter 6.4 Experimental
205
Chapter 6.4 Experimental
GNA oligonucleotide synthesis and purification
All the GNA oligonucleotides were prepared according to previous method. The
MALDI–TOF MS data of used GNA oligonucleotides and photoproducts were shown
in Table 6.4. Figure 6.17-6.20 presented the MALDI–TOF MS spectrums of
conjugated GNA strands ON13:ON14* and ON15:ON16*.
Table 6.4 MALDI-TOF MS data of used GNA oligonucleotides.
Name Oligonucleotides Mcalcd Mfound
ON 1 3′-TTATAAAAATAATAnAnTATTAAT-2′ 5908.9(C194H240N73O104P21) 5910.2
ON 2 2′-AATATTTTTATTAHHATAATTA-3′ 5510.4(C164H222N67O108P21) 5510.7
ON 3 3′-TTATAAAAATAATAnC3-2′ 3870.5(C124H158N50O68P14) 3870.5
ON 4 3′-AnTATTAAT-2′ 2114.4(C73H90N23O38P7) 2114.3
ON 5 3′-TAAAAATAATAATATT-2′ 4222.7(C128H167N62O74P15) 4223.3
ON 6 3′-AATATTATTATTTTTA-2′ 4186.6(C128H171N50O82P15) 4185.5
ON 7 3′-TAAAAATHAnTAATATT-2′ 4188.7(C131H167N57O74P15) 4194.1
ON 8 2′-ATTTTTAHAnATTATAA-3′ 4100.6(C131H169N46O78P15) 4101.1
ON 9 3′-TAAAAATAnHTAATATT-2′ 4188.7(C131H167N57O74P15) 4193.1
ON 10 2′-ATTTTTAAnHATTATAA-3′ 4100.6(C131H169N46O78P15) 4100.0
ON 11 2′-ATTTTTAHTATTATAA-3′ C122H165N48O80P15(4046.6) 4048.2
ON 12 3′-TAAAAATHATAATATT-2′ C122H162N57O74P15(4073.7) 4076.0
ON 13 3′-AnTAAAAATAATAATATT-2′ 4536.9(C145H182N62O78P16) 4536.5
ON 14 2′-C3AnHATTTTTATTATTATAA-3′ 4772.0(C150H197N53O92P18) 4764.5
ON 15 3′-AnTAAAAATAATAATATTPyr′C3-2′ 5037.3(C169H204N62O86P18) 5037.7
ON 16 2′-C3AnHATTTTTATTATTATAAHPyr′-3′ 5249.3(C173H218N50O102P20) 5249.7
ON13:ON14*
9308.9
(C295H370N115O170P34) 9305.5
ON15:ON16*
10286.7
(C342H422N112O188P38) 10286.4

Chapter 6.4 Experimental
206
Figure 6.17 MALDI-TOF MS of the photoproduct ON13:ON14*.

Chapter 6.4 Experimental
207
Figure 6.18 MALDI-TOF MS of the photoproduct ON13:ON14*.
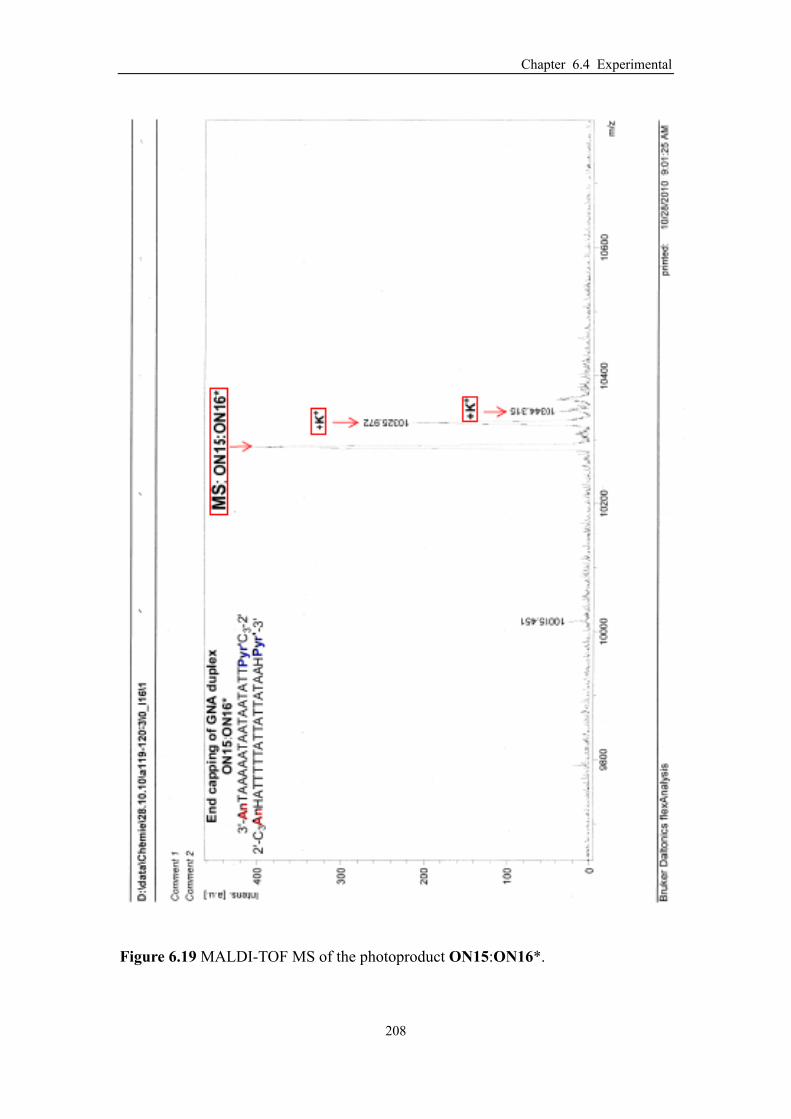
Chapter 6.4 Experimental
208
Figure 6.19 MALDI-TOF MS of the photoproduct ON15:ON16*.

Chapter 6.4 Experimental
209
Figure 6.20 MALDI-TOF MS of the photoproduct ON15:ON16*.

Chapter 6.4 Experimental
210
Photoirradiation experiments
The anthracene-GNAs (8 M of each strand) were irradiated in buffer solution
containing 10 mM sodium phosphate and 100 mM NaCl. Prior to irradiation, reaction
mixtures were heated to 80 oC and then annealed with slow cooling to 0 oC on a
heating block. Reaction mixtures were irradiated in an N2 atmosphere with a
high-pressure mercury lamp (200 W) equipped with longpass optical filters (330 nm).
The products formed after photoirradiation were analyzed using RP-HPLC on a
Waters Xterra column (MS C18, 4.6 × 50mm): solution A, 50 mM TEAA
(triethylamine-acetic acid) buffer (pH 7.0); solution B, acetonitrile; linear gradient,
depending on the anthracene-GNA, for example, 4-20% in 40 min for tandem duplex
ON4:ON3:ON2; flow rate, 1 mL/min. Elution of the reaction products was monitored
by absorption at 260 nm. All peaks were identified by MALDI–TOF MS.
Denaturing urea polyacrylamide gel electrophoresis
The denaturing urea polyacrylamide gel (6%) was used in the electrophoresis
experiment for present study, which was prepared as follows: combine 16.8 g urea, 4
mL 10 × TBE buffer and 10 mL 30% acrylamide : N,N′-methylenbisacrylamide (19:1)
in a beaker. Bring the volume of the solution to 35 mL using deionized water. Place
the beaker in a hot water bath, once the urea has dissolved, bring the solution to a
final volume of 50 mL with deionized water. To finalize the gel solution, first add 250
µL of 10% ammonium persulfate (APS) to the 6% acrylamide solution. Then add 25
µL of TEMED and quickly but gently mix. Upon the addition of APS and TEMED,
carefully pipet the gel between the galss plates using a sterile plastic pipet. After gel
prerunning in buffer solution (1 × TBE, 7 M urea) for half an hour, the denatured
GNA sample was loaded into the wells. Then adjust the settings to approximately 20
watts, the other setting read 50 milliamps and 120 volts. Once the gel has run to
experimental specifications, cut off the power source and disconnect the leads.
Chapter 6.4 Experimental
211
Thermal denaturation
The melting studies were carried out in 1 cm path length quartz cells (total
volume 325 µL; 200 µL sample solutions were covered by mineral oil) on a Beckman
800 UV-VIS spectrophotometer equipped with a thermo-programmer. Melting curves
were monitored at 260 nm with a heating rate of 1 oC/min. Melting temperatures were
calculated from the first derivatives of the heating curves. Experiments were
performed in duplicate and mean values were taken.
Fluorescence measurements
The experiments were performed in 96-well plates on a Molecular Devices
SpectraMax M5.
CD spectroscopy
CD measurements were performed on a JASCO J-810 spectrometer in a 1 mm
path length quartz cuvette. The GNA single strands or duplexes were prepared in 10
mM sodium phosphate, 100 mM NaCl, pH 7.0, and the concentration of each strand
was 8 M.

Chapter 6.5 References
212
Chapter 6.5 References
1. (a) Gude, L.; Fernández, M.-J.; Grant, K. B.; Lorente, A. Tetrahedron Letter 2002,
43, 4723-4727; (b) Bhattacharya, S.; Mandal, S. S. Chemical Communication
1996, 1515-1516; (c) Gude, L.; Fernández, M.-J.; Grant, K. B.; Lorente, A.
Organic & Biomoleculor Chemistry 2005, 3, 1856-1862; (d) Dong, S.; Hwang,
H.-M.; Harrison, C.; Holloway, L.; Shi, X.; Yu, H. Bulletin of Environmental
Contamination and Toxicology 2000, 64, 467-474; (e) Dong, S.; Fu, P. P.; Shirsat,
R. N.; Hwang, H.-M.; Leszczynski, J.; Yu, H. Chemical Research in Toxicology
2002, 15, 400-407.
2. Moran, N.; Bassani, D. M.; Desvergne, J.-P.; Keiper, S.; Lowden, P. A. S.; Vyle, J.
S. V.; Tucker, J. H. R. Chemical Communication 2006, 5003-5005.
3. Granzhan, A.; Teulade-Fichou, M.-P. Chemistry-A European Journal 2009, 15,
1314-1318.
4. Coleman, R. S.; Mortensen, M. A. Tetrahedron Letter 2003, 44, 1215-1219.
5. (a) Bouas-Lauren, H.; Castellan, A.; Desvergne, J-P.; Lapouyade, R. Chemical
Society Reviews 2000, 29, 43-55; (b) Backer, H.-D. Chemical Reviews 1993, 93,
145-172.
6. (a) Ihara, T.; Fujii, T.; Mukae, M.; Kitamura, Y.; Jyo, A. Journal of American
Chemical Society 2004, 126, 8880-8881; (b) Ihara, T., Mukae, M.; Fujii, T.;
Kitamura, Y.; Jyo, A. Nucleic Acids Symposium Series 2004, 48, 125-126; (c)
Ihara, T.; Mukae, M.; Tabara, M.; Kitamura, Y.; Jyo, A. Nucleic Acids Symposium
Series 2005, 49, 41-42; (d) Arslan, P.; Ihara, T.; Mukae, M.; Jyo, A. Nucleic Acids
Symposium Series 2007, 51, 237-238; (e) Arslan, P.; Ihara, T.; Jyo, A. Nucleic
Acids Symposium Series 2008, 52, 389-390; (f) Mukae, M.; Ihara, T.; Tabara, M.;
Jyo, A. Organic & Biomoleculor Chemistry 2009, 7, 1349-1354.; (g) Arslan, P.;
Jyo, A.; Ihara, T. Organic & Biomoleculor Chemistry 2010, 8, 4843-4848.

Chapter 7 Summary and outlook
213
Chapter 7 Summary and Outlook

Chapter 7 Summary and outlook
214
In this thesis, GNA is explored as a simplified duplex scaffold for arranging
different chromophores and the properties of the resulting chromophore assemblies
are investigated.
Chromophore nucleotides were incorporated into GNA by automated solid phase
synthesis of oligonucleotides. The synthesis of different chromophore glycol
nucleoside GNA building blocks was presented in chapter 2. The key step for synthesizing these glycol nucleosides was the regioselective and stereospecific
ring-opening of dimethoxytrityliated (S)-glycidol (3). As shown in Scheme 7.1A,
compounds 5, 9, 14 and 17 were synthesized by three efficient methods, namely, the
application of Grignard reagents, Grignard reagents containing a
metallation/transmetallation protocol, and organolithum reagents. Among these
compounds, compound 17c can be also synthesized by Pd-catalyzed Sonogashira
coupling reaction of compound 30 with compound 17d (Scheme 7.1 B), thus any
chromophore with alkyne groups can be introduced to GNA by this method.
5a 5b5c
5d 5e
Scheme 7.1 (A) The synthesis of compounds 5, 9, 14 and 17 based on nucleophilic ring-opening of dimethoxytrityliated (S)-glycidol 3 by carbon nucleophiles. (B) The synthesis of compound 17c through Sonogashira coupling reaction.

Chapter 7 Summary and outlook
215
Subsequently, compounds 5, 9, 14 and 17 were converted to glycol nucleoside
phosphoramidites in high yields, which were successfully used to synthesize modified
GNA strands.
400 450 500 550 600
0
100
200
300
400
500
600
700
800
900
1000
41
34
43
36
Tm(oC)
NNNN
Pyr'HHPyr'
HPyr'Pyr'H
PyrMeMePyr
MePyrPyrMe
3'-TAAAAATNNTAATATT-2'2'-ATTTTTANNATTATAA-3'
RF
U
Wavelength (nm)
D6
D7
D12
D13
Figure 7.1 (A) Structure of Pyr:Me and Pyr′:H base pairs used in chapter 3. (B) Fluorescence properties of pyrene nucleotides (Pyr) and pyrene acetylide nucleotides (Pyr′) in GNA duplexes.
In chapter 3, we investigated GNA duplexes containing fluorescent pyrene (Pyr)
and pyrene acetylide nucleotides (Pyr′) (Figure 7.1A). Duplexes with one or two
adjacent Pyr:Me or Pyr′:H base pairs were synthesized, all resulting in thermally
stable duplexes at room temperature. The incorporation of pyrene or pyrene acetylide
to GNA duplexes did not distort the overall GNA duplex structure.
Interestingly, only the pyrene acetylides but not the related pyrene nucleotides,
could form strong excimers upon interstrand stacking within the GNA duplexes
(Figure 7.1B). The reason for this may be a combination of structural effects,
influence of the stacking of adjacent pyrene acetylides nucleobases, and electronic
effects due to the conjugation of the aromatic pyrene with the acetylide π-system.
As an application of excimer emission upon duplex formation with pyrene
acetylide containing GNA strands, we developed a metal ion sensor by additionally
incorporating a metal-mediated base pair: hydroxypyridone homo-base pair (M:M) or

Chapter 7 Summary and outlook
216
hydroxypyridone-pyridylpurine hetero-base pair (M:P). As shown in Figure 7.2, D15
and D19 are very sensitive and selective Cu2+ “turn-on” fluorescent sensors.
Unfortunately, our attempt to develop a Cu2+ sensor for a complex biological
environment failed.
400 450 500 550 6000
100
200
300
400
500
600
700
800
D153'-TATAPyr'HTAATMTAAA-2'2'-ATAAHPyr'ATTAMATTT-3'
RF
U
Wavelength (nm)/Ex:315nm)
D15, 50 oC
Cu2+
Zn2+
Ni2+
Co2+
Cd2+
Fe3+
Fe2+
Mn2+
400 450 500 550 600
0
500
1000
1500
2000
2500
3000
D193'-ATTPATTTTPyr'C
3-2'
2'-TAAMTAAAAHPyr'-3'
RF
U
Wavelength (nm)/Ex:365nm
D19, 37 oC
Cu2+
Zn2+
Ni2+
Co2+
Cd2+
Fe3+
Fe2+
Mn2+
Figure 7.2 (A) Metal ion-selectivity of sensor D15. (B) Metal ion-selectivity of sensor D19.
In chapter 4, the porphyrin acetylide nucleotide (P) was incorporated into GNA
duplexes opposite ethylene glycol abasic sites and the duplexes were analyzed by
UV-melting, UV-vis, fluorescence spectroscopy, and circular dichroism.
20 30 40 50 60
0.00
0.05
0.10
0.15
0.20
0.25
3349
42484544
X Tm(oC)
H
H
H
HAT
Hyp
erch
rom
icit
y
Temperature (oC)
ON6:ON2 ON6:ON5
3'-TAAAAATPATAATATT-2' 2'-ATTTTTAXTATTATAA-3'
ON6:ON7
ON6Zn:ON7
ON6Ni:ON7
ON6Mn:ON7
Figure 7.3 (A) Structure of PM:X base pair used in chapter 4. (B) UV-melting curves of GNA duplexes containing PM:X base pair.

Chapter 7 Summary and outlook
217
The modified duplexes display lower thermal stabilities, however the thermal
stabilities of duplex containing P:H base pairs could be modulated by the
incorporation of zinc(II), manganes(II) or nickel(II) ions into P (Figure 7.3B). The
incorporation of zinc(II) or manganes(II) ion led to a decrease in duplex stability, but
the incorporation of nickel(II) resulted in increased duplex stability. These
modulations of duplex stabilities by the nature of the metal ion can be interpreted
by their differenct coordination behavior. Zn2+ or Mn2+ prefers to coordinate to
axial ligands when incorporated into a porphyrin in an octahedral fashion and
needs to dissociate these ligands if it wants to stack within GNA between
neighboring base pairs. In contrast, Ni2+ prefers square planar coordination and can
therefore be accommodated easily in the base stacking.
Furthermore, GNA duplexes provided a suitable scaffold to bring two
porphyrins into close contact and to allow the interaction of porphyrins with
different coordinated metal ions. The obvious change of the Soret bands accompanied
by a blue shift (Figure 7.4B), together with the decrease of fluorescence intensity
upon duplex formation revealed that a ground state interaction between two porphyrin
moieties occurred in GNA, performing in face-to-face (H-dimer) fashion.
Blue shif tPeak splits
350 375 400 425 450 475
0.0
0.2
0.4
0.6
0.8
1.0
3'-TTATAAAAATPHTAATATTAAT-2' (ON16)2'-AATATTTTTAHPATTATAATTA-3' (ON17)
Ab
sorb
ance
Wavelength (nm)
ON16:ON17
ON16Zn:ON17Zn
ON16Ni:ON17Ni
ON16Zn:ON17Ni
200 250 300 350 400 450 500
-25
-20
-15
-10
-5
0
5
10
15
20
25
360 380 400 420 440 460-4
-3
-2
-1
0
1
2
3
CD
(m
deg
)
Wavelength (nm)
ON14:ON15 ON16:ON17
ON16Zn:ON17Zn
ON16Ni:ON17Ni
ON16Zn:ON17Ni
Figure 7.4 (A) Position of two PM:H base pair in the middle of GNA duplex ON16:ON17. (B) UV-vis spectra of porphyrin Soret band regions for GNA duplexes. (C) CD spectra of GNA duplexes. The insert shows expanded porphyrin Soret band regions.

Chapter 7 Summary and outlook
218
In chapter 5, Electron donor-acceptor chromophores systems, mainly composed
of perylene bisimide (PBI) and porphyrin (P) units were organized in duplex GNA
(Figure 7.5A).
The GNA duplexes which contain B-Pyr, B-Pyr′, B-Pe′ and B-P were
investigated. The thermal stabilities revealed that B-P pair stabilizes the GNA duplex
the most significantly, exceeding the stability of the native GNA duplex by additional
10 oC. The significantly increased duplex stability together with the red-shifted
absorption band and induced CD signal at Soret band indicated the interstrand π-π
stacking of B-P pair in the duplex.
20 30 40 50 60 70 80
0.00
0.05
0.10
0.15
0.20
0.25
0.30
0.35
63
64
54
PHHB
AATT
BHHP
Tm(oC)
NNNN
3'-TAAAAATNNTAATATT-2'2'-ATTTTTANNATTATAA-3'
Hyp
erch
rom
icit
y
Temperature (oC)
ON3:ON4
ON8:ON10
ON11:ON12
Figure 7.5 (A) Structure of P:B base pair used in chapter 5. (B) UV-melting curves of GNA duplexes containing one P:B base pair.
Subsequently, we investigated the systems which contain a couple of porphyrin
and PBI building blocks. As shown in Figure 7.6B, the intensity of the CD signal
accompanying the blue-shift of the bisignate CD spectra in the Soret band increased
with the increasing amount of chromophore moieties. This continuous shift in a CD
spectrum with increased amounts of chromophores indicated the interaction between
PBI and porphyrin resulted in a highly ordered helical structure.

Chapter 7 Summary and outlook
219
200 300 400 500 600
0.0
0.2
0.4
0.6
0.8
1.0
1.2
1.4
1.6
1.8
2.0
-30
-25
-20
-15
-10
-5
0
5
10
3'-TAAAAAHBHBHATATT-2' (ON23)2'-ATTTTTPHPHPTATAA-3' (ON24)
CD
(m
deg
)
Ab
sorb
ance
Wavelength (nm)
ON8:ON10 (B-P) ON13:ON14 (B-P-B) ON19:ON20 (P-B-P-B) ON23:ON24 (P-B-P-B-P)
Blue shif t
Figure 7.6 (A) Position of B and P in the middle of GNA duplex ON23:ON24. (B) CD and UV-vis spectra of GNA duplexes containing central chromophore cores: B-P, B-P-B, P-B-P-B and P-B-P-B-P.
In addition, we also synthesized some single strands which consisted of entirely
PBIs or porphyrins. However, combining these single strands did not give us desired
helical structure according to CD analysis. It seems that flanking natural base pairs or
natural overhangs play a key role in affording helical structures.
Considering the significantly decreased yield of modified GNA strand with
multi-incorporated chromophores, photochemical ligation of GNA was developed in
order to address this problem. In chapter 6, the photochemical ligation of GNA via
anthracene cyclodimer formation was explored. Anthrancenes were introduced into
GNA not only as artificial nucleosidic bases but also as phototriggered joints (Figure
7.7A). Upon the duplex formation, the two adjacent anthracene nucleobases get close
to each other, and the duplex was expected to generate a hairpin structure via
anthracene cyclodimer formation as a result of the photoirradiation (366 nm).
The photochemical ligation of GNA via anthracene cyclodimer formation was
investigated in terms of three aspects, namely, template-supported GNA ligation,
interstrand crosslinking in the middle of the GNA duplex, and end capping of the
GNA duplex.
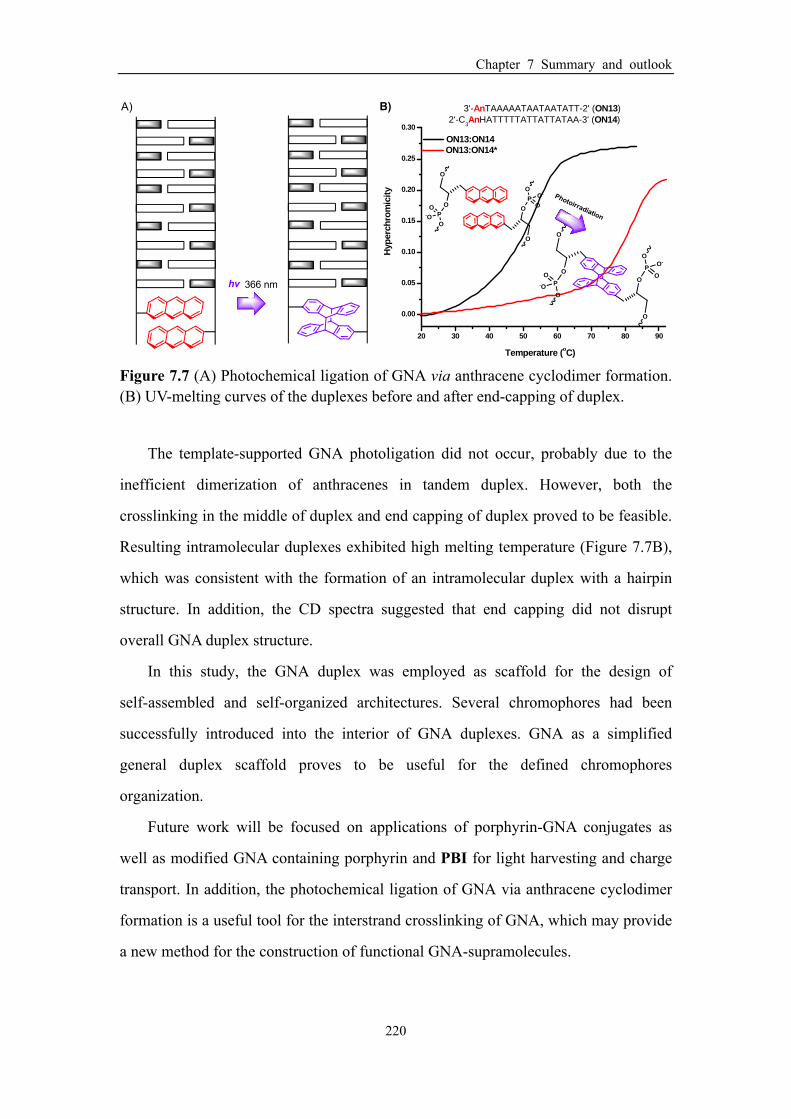
Chapter 7 Summary and outlook
220
20 30 40 50 60 70 80 90
0.00
0.05
0.10
0.15
0.20
0.25
0.30
3'-AnTAAAAATAATAATATT-2' (ON13)2'-C
3AnHATTTTTATTATTATAA-3' (ON14)
ON13:ON14
Temperature (oC)
Hyp
erch
rom
icit
y
ON13:ON14*
O
O
PO
-O
O
O
O
PO
O-
O
O
O
PO
-O
O
O
O
PO
O-
O
Figure 7.7 (A) Photochemical ligation of GNA via anthracene cyclodimer formation. (B) UV-melting curves of the duplexes before and after end-capping of duplex.
The template-supported GNA photoligation did not occur, probably due to the
inefficient dimerization of anthracenes in tandem duplex. However, both the
crosslinking in the middle of duplex and end capping of duplex proved to be feasible.
Resulting intramolecular duplexes exhibited high melting temperature (Figure 7.7B),
which was consistent with the formation of an intramolecular duplex with a hairpin
structure. In addition, the CD spectra suggested that end capping did not disrupt
overall GNA duplex structure.
In this study, the GNA duplex was employed as scaffold for the design of
self-assembled and self-organized architectures. Several chromophores had been
successfully introduced into the interior of GNA duplexes. GNA as a simplified
general duplex scaffold proves to be useful for the defined chromophores
organization.
Future work will be focused on applications of porphyrin-GNA conjugates as
well as modified GNA containing porphyrin and PBI for light harvesting and charge
transport. In addition, the photochemical ligation of GNA via anthracene cyclodimer
formation is a useful tool for the interstrand crosslinking of GNA, which may provide
a new method for the construction of functional GNA-supramolecules.

Kapitel 8 Zusammenfassung
221
Kapitel 8 Zusammenfassung

Kapitel 8 Zusammenfassung
222
In dieser Dissertation wurde GNA als ein einfaches Duplexgerüst für die
Anordnung verschiedener Chromophoren verwendet und die Eigenschaften der
resultierenden Chromophoreinheiten wurden untersucht.
Durch automatisierte Festphasensynthese von Oligonukletioden wurden
Chromophornukleotide in GNA eingebaut, die Synthese der verschiedenen
Chromophorglykolnukleosidbausteinen wurde bereits in Kapitel 2 vorgestellt. Dabei
war die regioselektive und stereospezifische Ringöffnungsreaktion von
dimethoxytrityliertem (S)-Glycidol (3) entscheidend. Verbindungen 5, 9, 14 und 17
wurden unter Verwendung drei effektiver Methoden synthetisiert: durch Anwendung
von Grignard-Reagenzien, Grignard-Reagenzien in Verbindung mit Metallierung/
Transmetallierung und Organolithum-Verbindungen (Schema 8.1 A).
Schema 8.1 (A) Synthesen von Verbindungen 5, 9, 14 und 17 basierend auf nukleophiler Ringöffnung von dimethoxytritylierten (S)-Glycidol 3. (B) Synthese von Verbindung 17c durch eine Sonogashira-Kupplungsreaktion.
Anschließend wurden die Verbindungen 5, 9, 14 und 17 mit hoher Ausbeute zu
Glykolnukleosidphosphoramidite umgesetzt, die für die weitere Synthese von
modifizierten GNA-Strängen verwendet wurden.

Kapitel 8 Zusammenfassung
223
400 450 500 550 600
0
100
200
300
400
500
600
700
800
900
1000
41
34
43
36
Tm(oC)
NNNN
Pyr'HHPyr'
HPyr'Pyr'H
PyrMeMePyr
MePyrPyrMe
3'-TAAAAATNNTAATATT-2'2'-ATTTTTANNATTATAA-3'
RF
UWavelength (nm)
D6
D7
D12
D13
Abbildung 8.1 (A) Struktur des in Kapitel 3 verwendeten Basenpaares: Pyr:Me and Pyr′:H. (B) Fluoreszenzspektroskopie von Pyrennukleotid (Pyr) und Pyrenacetylidnukleotide (Pyr′) in GNA Duplexeinheiten.
In Kapitel 3 wurden GNA Duplexeinheiten mit fluoreszierenden Pyrennukleotide
(Pyr) und Pyrenacetylidnukleotide (Pyr′) untersucht (Abbildung 8.1A). Zusätzlich
wurden Duplexeinheiten mit ein oder zwei benachbarten Pyr:Me oder Pyr′:H
Basenpaare synthetisiert. Diese Duplexeinheiten waren bei Raumtemperatur waren
thermisch stabil.
Interessanterweise konnten nur die Pyrenacetylidnukleotide, aber nicht die
entsprechenden Pyrennukleotide durch “interstrand-stacking” innerhalb der
GNA-Duplexeinheit einen starken Excimer bilden (Abbildung 8.1B). Dieser wurde
als Metallionensensor verwendet, indem ein Metall-vermittelten Basenpaar eingebaut
wurde. Dabei wurde ein Hydroxypyridon homo-Basenpaar (M:M) oder ein
Hydroxypyridon-pyridylpurine hetero-Basenpaar (M:P) verwendet. Abbildung 8.2
zeigt, dass mit D15 und D19 sehr empfindliche und selektive Cu2+ “turn-on”
Fluoreszenzsensoren erhalten wurden.

Kapitel 8 Zusammenfassung
224
400 450 500 550 6000
100
200
300
400
500
600
700
800
D153'-TATAPyr'HTAATMTAAA-2'2'-ATAAHPyr'ATTAMATTT-3'
RF
U
Wavelength (nm)/Ex:315nm)
D15, 50 oC
Cu2+
Zn2+
Ni2+
Co2+
Cd2+
Fe3+
Fe2+
Mn2+
400 450 500 550 600
0
500
1000
1500
2000
2500
3000
D193'-ATTPATTTTPyr'C
3-2'
2'-TAAMTAAAAHPyr'-3'
RF
U
Wavelength (nm)/Ex:365nm
D19, 37 oC
Cu2+
Zn2+
Ni2+
Co2+
Cd2+
Fe3+
Fe2+
Mn2+
Abbildung 8.2 (A) Metallionen-Selektivität des Sensors D15. (B) Metallionen-Selektivität des Sensors D19.
Kapitel 4 beschäftigt sich mit dem Einbau von Porphyrinacetylidnukleotid (P) in
GNA-Duplexeinheiten gegenüber von nichtbasischem Ethylenglykol. Die
Verbindungen wurden durch UV-Schmelzkurvenanalyse, UV-Vis Spektroskopie,
Fluoreszenzspektroskopie und Circulardichroismus analysiert.
20 30 40 50 60
0.00
0.05
0.10
0.15
0.20
0.25
3349
42484544
X Tm(oC)
H
H
H
HAT
Hyp
erch
rom
icit
y
Temperature (oC)
ON6:ON2 ON6:ON5
3'-TAAAAATPATAATATT-2' 2'-ATTTTTAXTATTATAA-3'
ON6:ON7
ON6Zn:ON7
ON6Ni:ON7
ON6Mn:ON7
Abbildung 8.3 (A) Struktur des in Kapitel 4 verwendeten PM:X Basenpaars. (B) UV-Schmelzkurven von GNA-Duplexeinheiten mit PM:X Basenpaar.
Die modifizierten Duplexeinheiten zeigten geringe thermische Stabilität, diese
konnte aber durch Koordination an Zink(II)-, Mangan(II)- oder Nickel(II)ionen in P
gesteigert werden (Abbildung 8.3B).

Kapitel 8 Zusammenfassung
225
Darüber hinaus boten die GNA-Duplexeinheiten ein geeignetes Gerüst um zwei
Porphyrine in engen Kontakt zu bringen, woraus Wechselwirkungen zwischen den
beiden Porphyrinen resultierten, die jeweils an verschiedenen Metallionen gebunden
waren. Die klare Änderung der Soretbanden, die von einer Blauverschiebung begleitet
war und die Abnahme der Fluorenzintensität durch Bildung einer Duplexeinheit
(Abbildung 8.4B) zeigte, dass eine Wechselwirkung im Grundzustand zwischen zwei
Porphyrineinheiten in der GNA auftrat. Dabei handelte es sich um eine “face-to-face”
(H-dimer) Wechselwirkung.
350 375 400 425 450 475
0.0
0.2
0.4
0.6
0.8
1.0
3'-TTATAAAAATPHTAATATTAAT-2' (ON16)2'-AATATTTTTAHPATTATAATTA-3' (ON17)
Ab
sorb
ance
Wavelength (nm)
ON16:ON17
ON16Zn:ON17Zn
ON16Ni:ON17Ni
ON16Zn:ON17Ni
200 250 300 350 400 450 500
-25
-20
-15
-10
-5
0
5
10
15
20
25
360 380 400 420 440 460-4
-3
-2
-1
0
1
2
3
CD
(m
deg
)
Wavelength (nm)
ON14:ON15 ON16:ON17
ON16Zn:ON17Zn
ON16Ni:ON17Ni
ON16Zn:ON17Ni
Abbildung 8.4 (A) Position von zwei PM:H in der Mitte der GNA-Duplexeinheit ON16:ON17. (B) UV-Vis-Spektren der Soretbande Region von Porphyrin in GNA-Duplexeinheit. (C) CD-Spektren von GNA-Duplexeinheiten. Der Einschub zeigt die vergrößerte Soretbanden Region von porphyrin.
In Kapitel 5 wurden die Donor-Akzeptor enthaltenden Chromophorsysteme, die
hauptsächlich aus Perylenbisimid- (B) und Porphyrinbausteinen (P) bestehen, in
GNA-Duplexeinheiten eingebunden (Abbildung 8.5A).
GNA-Duplexeinheiten mit B-Pyr, B-Pyr′, B-Pe′ und B-P wurden thermisch
untersucht. Dabei zeigte sich, dass das B-P Paar die GNA-Duplexeinheiten um
zusätzlich 10 °C im Vergleich zur Schmelztemperatur der nativen GNA-Duplexeinheit
stabilisieren konnte. Die deutlich erhöhte Stabilität der Duplexeinheit, zusammen mit
der rotverschobenen Absorptionsbande und das induzierte CD-Signal bei der
Soretbande deuteten auf eine “π-π stacking” Wechselwirkung der B-P Paaren
zwischen beiden Strängen in der Duplexeinheit.

Kapitel 8 Zusammenfassung
226
20 30 40 50 60 70 80
0.00
0.05
0.10
0.15
0.20
0.25
0.30
0.35
63
64
54
PHHB
AATT
BHHP
Tm(oC)
NNNN
3'-TAAAAATNNTAATATT-2'2'-ATTTTTANNATTATAA-3'
Hyp
erch
rom
icit
yTemperature (oC)
ON3:ON4
ON8:ON10
ON11:ON12
Abbildung 8.5 (A) Struktur des in Kapitel 5 verwendetem B:P Basenpaares. (B) UV-Schmelzkurven von GNA-Duplexeneinheiten mit einem B:P Basenpaar.
Anschließend wurden die Systeme mit Porphyrin und PBI Bausteine untersucht.
Wie Abbildung 8.6 B zeigt, erhöhte sich die Intensität des CD-Signals mit der
zunehmenden Anzahl von Chromophoreinheiten. Diese kontinuierliche Verschiebung
resultiert aus der Wechselwirkung zwischen PBI und Porphyrin, was eine
hochgeordnete Helixstruktur zur Folge hat.
200 300 400 500 600
0.0
0.2
0.4
0.6
0.8
1.0
1.2
1.4
1.6
1.8
2.0
-30
-25
-20
-15
-10
-5
0
5
10
3'-TAAAAAHBHBHATATT-2' (ON23)2'-ATTTTTPHPHPTATAA-3' (ON24)
CD
(m
deg
)
Ab
sorb
ance
Wavelength (nm)
ON8:ON10 (B-P) ON13:ON14 (B-P-B) ON19:ON20 (P-B-P-B) ON23:ON24 (P-B-P-B-P)
Abbildung 8.6 (A) Position von B und P in der Mitte der GNA-Duplexeinheit ON23:ON24. (B) CD-und UV-Vis-Spektren der Duplexeinheiten mit zentralen Chromophorkernen: B-P, B-P-B, P-B-P-B und P-B-P-B-P.

Kapitel 8 Zusammenfassung
227
Angesichts der deutlich verringerten Ausbeute an modifiziertem GNA-Strang mit dem
mehrfach eingebauten Chromophor, wurde photochemisches Anbinden von GNA
entwickelt. In Kapitel 6 wurde Anthracen in GNA als photoreaktives Zentrum
eingeführt (Abbildung 8.7A). Bei der Duplexbildung, näherten sich die beiden
angrenzenden Anthracen-Nucleobasen einander und es wurde erwartet, dass die
Duplexeinheit eine Haarnadelstruktur durch Anthracencyclodimerisierung als Folge
der Bestrahlung von Licht (366 nm) erzeugt hat.
Die Reaktion wurde im Hinblick auf drei Aspekte untersucht, nämlich
templatgestütztes GNA-Anbinden, Crosslinking zwischen den Strängen in der Mitte
der GNA-Duplexeinheit und “end capping” der Duplexeinheit.
20 30 40 50 60 70 80 90
0.00
0.05
0.10
0.15
0.20
0.25
0.30
3'-AnTAAAAATAATAATATT-2' (ON13)2'-C
3AnHATTTTTATTATTATAA-3' (ON14)
ON13:ON14
Temperature (oC)
Hyp
erch
rom
icit
y
ON13:ON14*
Abbildung 8.7 (A) Photochemische Reaktion von GNA über Anthracen-cyclodimerisierung. (B) UV-Schmelzkurven der GNA-Einheiten vor bzw. nach dem “end-capping”.
Die templatgestützte Photoreaktion hat aufgrund ineffizienten Dimerisierung von
Anthracen in Tandemduplexeinheiten der nicht stattgefunden. Allerdings erwiesen
sich sowohl das Crosslinking in der Mitte des Duplexes, als auch “end-capping” des
Duplexes als möglich. Die erzeugten intramolekularen Duplexeinheiten zeigten eine
hohe Schmelztemperatur (Abbildung 8.7B), was im Einklang mit der Bildung eines
intramolekularen Duplex mit einer Haarnadelstruktur steht.
In dieser Studie wurden GNA-Duplexeinheiten als Gerüst für das Design von
Kapitel 8 Zusammenfassung
228
selbstangeordneten und selbstorganisierten Architekturen verwendet. Mehrere
Chromophore wurden erfolgreich in GNA-Duplexeinheiten eingeführt. GNA erwies
sich als und generelles Duplexgerüst für die definierte Chromophororganisation.