Glycemic Management Protocol- Basal Bolus Insulin Protocol by ...
141
Glycemic Management Protocol‐ Basal Bolus Insulin Protocol by Pharmacy Glendale Adventist Medical Center 1509 Wilson Terrace, Glendale, CA 91206 https://www.adventisthealth.org/glendale/pages/default.aspx 2016 Vanguard Award – Hospital Quality Institute Application for Consideration: Quality Improvement Focus Contact Information: Valena Emery, RHIA, CPHQ, MAM, CLSSBB Director of Organizational Performance [email protected] 818‐409‐8258 As physician champion for the Glycemic Management Performance Improvement Team at Glendale Adventist Medical Center, I can attest that this protocol greatly improved the care provided to patients with diabetes. This new protocol can be replicated elsewhere and benefit patients with a comorbidity of diabetes contributing to a reduction in blood glucose levels, length of stay, and cost of care. ‐ Arby Nahapetian, MD, Vice President and Chief Medical Officer, Adventist Health Southern California Network 1
Transcript of Glycemic Management Protocol- Basal Bolus Insulin Protocol by ...
Glycemic Management Protocol‐
Basal Bolus Insulin Protocol
by Pharmacy
Glendale Adventist Medical Center
1509 Wilson Terrace, Glendale, CA 91206
https://www.adventisthealth.org/glendale/pages/default.aspx
2016 Vanguard Award – Hospital Quality Institute
Application for Consideration: Quality Improvement Focus
Contact Information: Valena Emery, RHIA, CPHQ, MAM, CLSSBB
Director of Organizational Performance
818‐409‐8258
As physician champion for the Glycemic Management Performance Improvement Team at Glendale
Adventist Medical Center, I can attest that this protocol greatly improved the care provided to patients
with diabetes. This new protocol can be replicated elsewhere and benefit patients with a comorbidity of
diabetes contributing to a reduction in blood glucose levels, length of stay, and cost of care.
‐ Arby Nahapetian, MD,
Vice President and Chief Medical Officer, Adventist Health Southern California Network
1
TABLE OF CONTENTS
2016 Vanguard Award Application – Hospital Quality Institute
Glycemic Management Protocol‐ Basal Bolus Insulin Protocol by Pharmacy
Section Page #
I. COVER PAGE AND FACILITY INFORMATION …………………………………………….........1
II. EXECUTIVE SUMMARY ……….…………………………………………………….……………….….. 3
III. BACKGROUND AND RELEVANCE …………………………………………………………………... 4
IV. PERFORMANCE IMPROVEMENT EFFORTS ……………………………………………….….… 5
V. RESULTS OF THE EFFORT ………………………………………………..………………………….…. 7
VI. SIGNIFICANCE OF THE RESULTS …………………………………………………………………….. 8
VII. PROJECT SUSTANABILITY & SCALING ………………………………………………………….….10
VIII. KEY LESSONS LEARNED & ADVICE ………………………………………………………………… 10
IX. APPENDIX A: BIOGRAPHICAL INFORMATION OF TEAM LEADS ……………………… 12
X. APPENDIX B: FULL SIX SIGMA PROJECT PRESENTATION …………………………………16
XI. APPENDIX C: FACT SHEET …………………………………………………………………………….102
XII. APPENDIX D: CURRENT ONGOING BBIP MONITORING RESULTS ………………… 104
2
Glycemic Management Protocol‐ Basal Bolus Insulin Protocol by Pharmacy Glendale Adventist Medical Center
EXECUTIVE SUMMARY
Word Count: 196
The Glycemic Management Improvement Project resulted in the sustainable implementation and
on‐going maintenance of a Basal Bolus Insulin Protocol (BBIP) beginning in September 2013. The
BBIP Protocol in place promotes pharmacy and physician partnership in glycemic monitoring
through use of insulin to mirror nutritional intake in order to prevent episodes of hyperglycemia,
hypoglycemia, and associated complications. The team formed with the goal of reducing
incidents of hyperglycemia and reducing the length of diabetic patient stays on telemetry and
medical surgical units by deploying the BBIP protocol including pharmacist monitoring and
physician and nursing education. Through this protocol, diabetic patients for whom their
attending physician consents are placed on the BBIP protocol. Patients on the BBIP experienced
a 26% reduction in their Pre‐BBIP blood glucose levels. Average daily glucose levels were
consistently under 180 after 3 days on protocol. The team also achieved a reduction of .55 days
in the average length of stay in the diabetic population in 2013 through 2015 compared to pre‐
implementation timeframe (2012). The reduction in ALOS led to an annual estimated cost savings
of $197,400. GAMC has continued to improve physician participation and realized sustained
improvements in timely management of hyperglycemic episodes.
3
Glycemic Management Protocol‐ Basal Bolus Insulin Protocol by Pharmacy
Glendale Adventist Medical Center APPLICATION NARRATIVE
Introduction:
The Glycemic Management Improvement Project began in late 2012 and resulted in the rollout
of the Basal Bolus Insulin Protocol beginning in September 2013. The Basal Bolus Insulin
Protocol (BBIP) promotes pharmacy and physician partnership in glycemic monitoring through
the use of insulin to mirror nutritional intake in order to prevent episodes of hyperglycemia and
hypoglycemia. The use of the BBIP protocol does this by:
Mimicking the natural production of sugars
Standardizing care for patients with diabetes
Creating stability for patients with diabetes by preventing peaks & valleys in their sugars
Background and Relevance of the Problem being Addressed and Effort Undertaken:
Diabetes is becoming more common in the US with approximately 21 million Americans
diagnosed in 2014 and over 8 million still may remain undiagnosed (CDC, 2012). In 2012, it was
estimated that the total medical cost of diagnosed diabetes is $245 billion, with largest
component (~43%) being cost for hospital inpatient care. Approximately 26% of GAMC’s adult
inpatients have a co‐morbidity of diabetes (diagnosis codes 250.0‐250.9). Physicians may each
manage blood glucose levels differently resulting in the potential for inconsistent follow‐up.
Without consistent glycemic management, patients are at an increased risk for complications.
Uncontrolled hyperglycemia is associated with adverse outcomes and longer length of hospital
stay. AHRQ Patient Safety Indicator # 10 is intended to flag cases of postoperative metabolic or
physiologic complications in elective surgical patients for review and possible process
improvement. This PSI rate has shown much variability. This measure includes uncontrolled
diabetes and renal failure. This process improvement initiative focused on Glycemic Control for
all patients at GAMC, not only post‐operative patients.
The glycemic management of all inpatients at Glendale Adventist needed to be streamlined to
reduce variability thus improving outcomes. The implementation of the Basal Bolus Insulin
Protocol followed evidence based medicine, the ADA Guidelines, and had strong clinical and
economic studies to support its implementation.
4

In addition to an overall desire to improve diabetic patient care, the following elements
represent the motivating factors behind the creation of the Glycemic Management PI Team and
the BBIP protocol:
Patients with blood glucose values running too high across the entire hospital – within
the acceptable range less than 50% of the time in many cases
Desire to implement AACE/ADA guidelines & evidence‐based care
Opportunity for better diabetic education given patients do not manage their sugars
with a sliding scale‐only regimen at home
Performance Improvement Efforts:
The Glycemic Management Performance Improvement Team was created with the goal of
reducing incidents of hyperglycemia and reducing the length of inpatient diabetic patient stays
by deploying the basal bolus insulin protocol including pharmacist monitoring and physician
and nursing education. Additional goals included (1) the deployment of the Basal Bolus Insulin
Protocol (BBIP) program including pharmacy management of patient blood glucose levels, (2)
improving glycemic management of patients thereby reducing the number of episodes of
hyperglycemia, and (3) reducing the average length of stay of diabetic patients by a minimum
of .345 days. In order to achieve these goals, Glendale Adventist Medical Center adopted and
implemented a new Basal Bolus Insulin Protocol. Basal Bolus protocol includes the daily
monitoring of blood glucose values by a dedicated pharmacist who reviews all elevated results
and responds immediately to order the necessary medication and coordinate patient education
and follow‐up. Through this protocol all diabetic patients on telemetry and medical surgical
units for whom their attending physician consented were placed on the basal bolus insulin
protocol (BBIP) by pharmacy. The BBIP protocol involves the use of basal bolus insulin
administration coupled with dosing and active monitoring of blood glucose levels by dedicated
pharmacist resources.
5
The pharmacy dedicated resources to daily monitoring of patients’ blood sugar levels and
tailoring of insulin and medication through a pharmacy and physician partnership. In addition
to developing the BBIP protocol as a multidisciplinary approach towards managing appropriate
insulin dosing and timing, the project included enhancement patient education on diabetes and
insulin therapy by pharmacy staff.
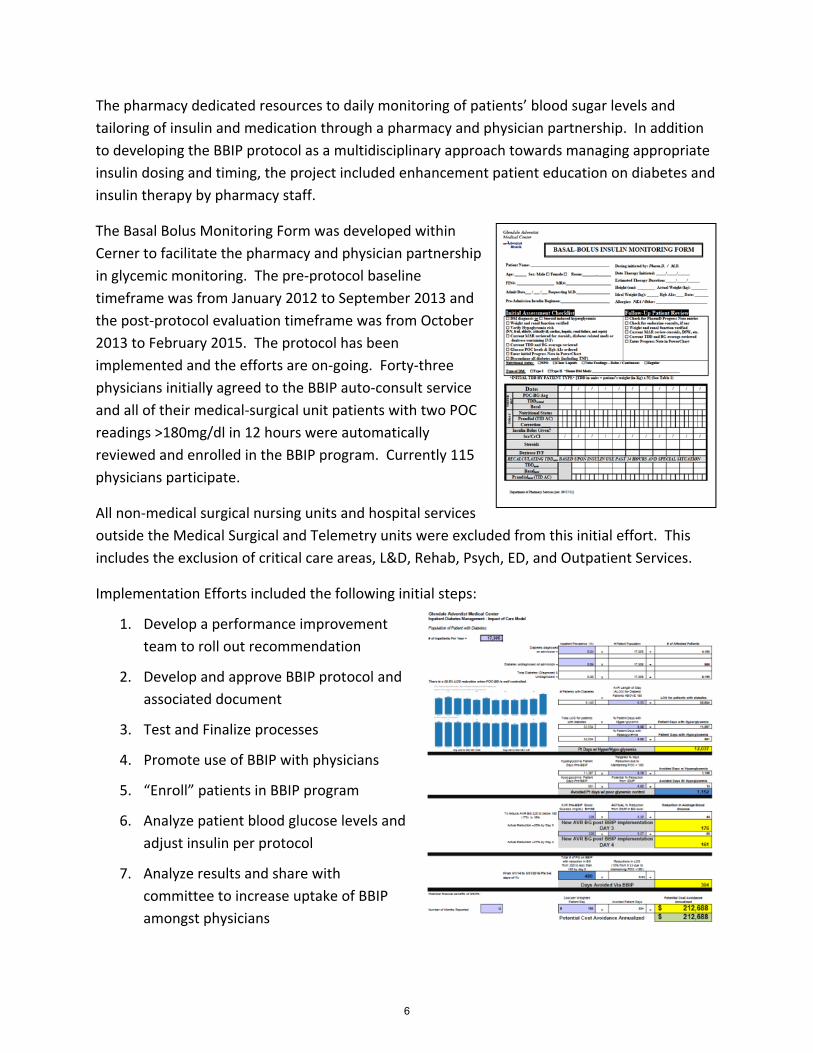
The Basal Bolus Monitoring Form was developed within
Cerner to facilitate the pharmacy and physician partnership
in glycemic monitoring. The pre‐protocol baseline
timeframe was from January 2012 to September 2013 and
the post‐protocol evaluation timeframe was from October
2013 to February 2015. The protocol has been
implemented and the efforts are on‐going. Forty‐three
physicians initially agreed to the BBIP auto‐consult service
and all of their medical‐surgical unit patients with two POC
readings >180mg/dl in 12 hours were automatically
reviewed and enrolled in the BBIP program. Currently 115
physicians participate.
All non‐medical surgical nursing units and hospital services
outside the Medical Surgical and Telemetry units were excluded from this initial effort. This
includes the exclusion of critical care areas, L&D, Rehab, Psych, ED, and Outpatient Services.
Implementation Efforts included the following initial steps:
1. Develop a performance improvement
team to roll out recommendation
2. Develop and approve BBIP protocol and
associated document
3. Test and Finalize processes
4. Promote use of BBIP with physicians
5. “Enroll” patients in BBIP program
6. Analyze patient blood glucose levels and
adjust insulin per protocol
7. Analyze results and share with
committee to increase uptake of BBIP
amongst physicians
6

A detailed financial Impact of Care Model was developed and utilized to estimate expected
decreased in length of stay (LOS) and cost savings. The impact of care model provides a
conservative estimate of potential cost savings. Variation in insurance reimbursement is not
included; however this information is included in reported cost savings. The model predicted a
reduction of up to .345 in ALOS which was exceeded by the project results.
Results of the Effort: Impact on Patient Safety and Quality
During the timeframe the program
has been active in either the
planning and staff engagement or
implementation phases there has
been an improvement in glycemic
management (values below 180)
and a decrease in ALOS in the
diabetic population by .55 days. The
program resulted in a 26% reduction
in the Pre‐BBIP blood glucose levels
for patients on the BBIP protocol.
7
Average daily glucose levels were consistently under 180 after 3 days on protocol. The team
also achieved an average reduction of .55 days in the average length of stay (ALOS) in the
diagnosed (coded) diabetic population compared to pre‐implementation timeframe. This
reduction in length of stay led to an estimated annual cost savings of $197,400 per year,
$394,800 for two years. Overall, the annual impact of the decrease in ALOS was a cost
reduction of just over $249,000; however revenue was also lost due to the decrease in length of
stay on per diem contracts. Since the LOS decrease would actually impact reimbursement for a
few insurance carriers, the net impact of realized cost savings was reduced to an annual
estimate of $197,400. Patients with a length of stay greater than 14 were excluded. The cost
savings were enough to cover the additional $150,000 in pharmacy staffing costs annually with
a total net contribution of $47,400 in savings. Soft benefits have also included (1) the post‐
discharge benefits of medication education to diabetic patients, (2) the Introduction of
collaborative glycemic monitoring has improved interdepartmental communication, and (3)
Potential reductions in diabetic complications shown to be associated with the incidence of
hyperglycemia. Unanticipated positive results included the decrease in workload of physicians,
allowing them to focus more on other chronic conditions.
Significance of the Results:
Over the last year, several different methods were used to evaluate the statistical significance
of the results of the first two years of project planning and implementation. Actual analysis of
BBIP project success and tests for significance were done based on the strict implementation
timeframes and does not include planning timeframes therefore ALOS values are different. A
two sample T‐test was conducted to evaluate if the difference between the pre‐BBIP average
length of stay (ALOS) of 6.16 days and post‐BBIP ALOS of 5.86 was significant. All diabetic
patients meeting BBIP criteria were included in the two sample T‐test per criteria. Comparison
of the pre and post timeframe data showed a significant decrease in diabetic patient mean
length of stay with a p value of 0.014. In addition to reducing the mean length of stay, the
overall spread also decreased post‐BBIP implementation with the standard deviation in length
of stay decreasing from 8.13 to 6.51.
8
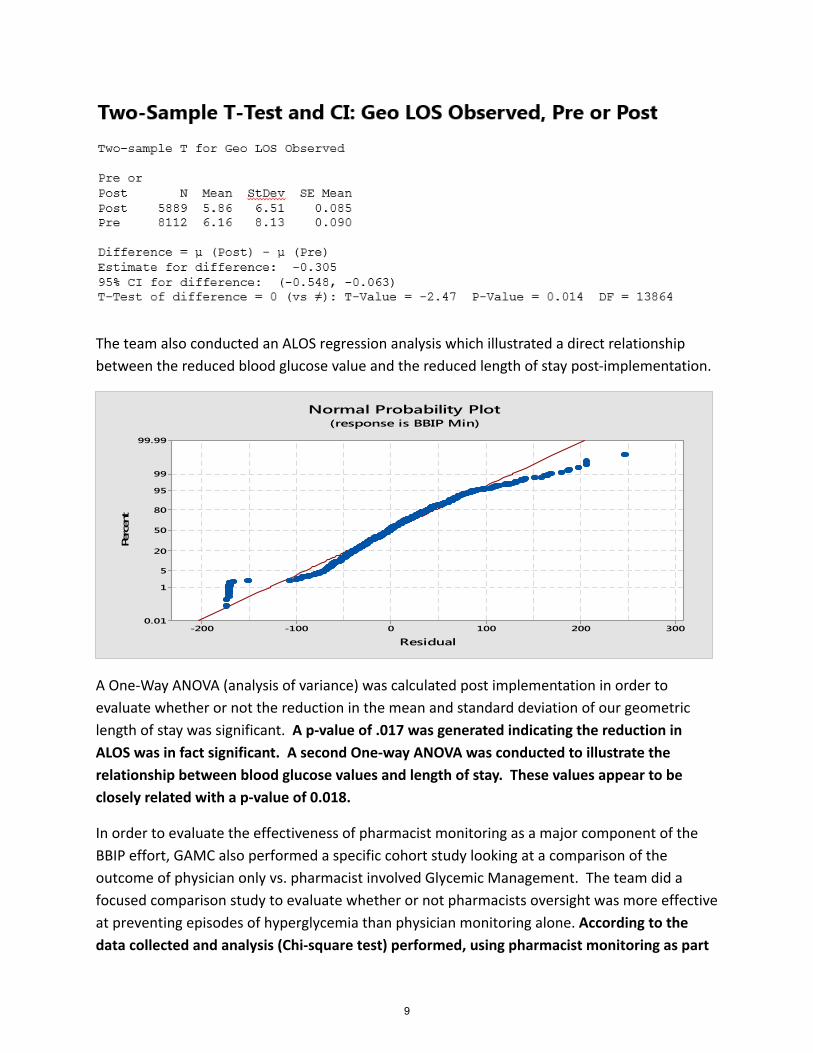
The team also conducted an ALOS regression analysis which illustrated a direct relationship
between the reduced blood glucose value and the reduced length of stay post‐implementation.
A One‐Way ANOVA (analysis of variance) was calculated post implementation in order to
evaluate whether or not the reduction in the mean and standard deviation of our geometric
length of stay was significant. A p‐value of .017 was generated indicating the reduction in
ALOS was in fact significant. A second One‐way ANOVA was conducted to illustrate the
relationship between blood glucose values and length of stay. These values appear to be
closely related with a p‐value of 0.018.
In order to evaluate the effectiveness of pharmacist monitoring as a major component of the
BBIP effort, GAMC also performed a specific cohort study looking at a comparison of the
outcome of physician only vs. pharmacist involved Glycemic Management. The team did a
focused comparison study to evaluate whether or not pharmacists oversight was more effective
at preventing episodes of hyperglycemia than physician monitoring alone. According to the
data collected and analysis (Chi‐square test) performed, using pharmacist monitoring as part
3002001000-100-200
99.99
99
95
80
50
20
5
1
0.01
Residual
Perc
ent
Normal Probability Plot(response is BBIP Min)
9
of the BBIP protocol, significantly (P value = 0.024.) reduced the risk of having patients
experience blood sugar swings resulting in episodes of hypoglycemia under 70 mg/dL. Also, a
secondary Chi‐Square test was performed that illustrated using pharmacist monitoring as part
of the BBIP protocol, also significantly reduced the risk of having patients experience blood
sugar swings resulting in episodes of hypoglycemia under 40 mg/dL (P value = 0.048).
From a six sigma perspective, the team also developed process capability reports and measured
sigma values both of which experienced considerable improvement year over year. The
process capability report generated for the post‐BBIP implementation, revealed a centralization
of reduced blood glucose values after BBIP treatment between 70‐180 with 32.87% of values
observed outside of the desired range. There is still a great deal of improvement to be made
and the team continues to monitor progress.
Project Sustainability and Scaling of Achievements:
Glycemic Management Performance Improvement Team continues to promote the BBIP
protocol and monitor progress on a monthly basis. As of July 2016, a total of 2,670 patients
have participated in the Basal Bolus Insulin Protocol since its onset. Physician participation has
increased greatly with currently 115 physicians consenting to glycemic management by
pharmacy through BBIP. The project team and staff supporting this effort are completely
sustainable. The pharmacy staff supporting the basal bolus insulin protocol are full time
integrated staff including a full time pharmacist who has been dedicated solely to this effort
since 2013.
Patient participation continues to increase over time with an average of 12.2 patients each day
on the protocol since onset. An average of 14 patients per day were on the protocol in July
2016 making this last month one of our highest for BBIP participation. The total number of
physician auto consults also hit an all‐time high of 51 consults per month in June and July 2016.
The BBIP protocol has now been utilized for thousands of GAMC patients and represents a best
practice model that can potentially be deployed at similar scale organizations and health
systems.
Key Lessons Learned and Advice for Sharing:
Several key lessons were learned during the planning and implementation phases of the
glycemic management project. A dedicated physician champion was paramount to the
project’s success, and the team recommends physician champions be engaged early on to craft
and drive physician related initiatives. Another important lesson is the need to schedule
additional time for information technology solutions, order set development, testing, and
technical delays as these items often take longer and are more involved than anticipated. Our
key lesson learned from an evaluation perspective is to ensure data collection both pre and
10
post‐project is well‐thought out and consistent. In the case of this project, data collection and
documentation post‐implementation was far more thorough and deliberate. Collecting
different data elements pre and post implementation in an effort to improve the data collection
process can result in limitations on the type of statistical analysis available and results that can
be showcased. Lastly, implementing facility‐wide change effectively requires a long term
investment in staff engagement including a full scale roll‐out of education to teach and adjust
culture accordingly.
Sections 2‐8 Total Word Count: 2303 of 2400 Max
11

APPENDIX A: BIOGRAPHICAL INFORMATION OF TEAM LEADS
12
FULL NAME: Emery, Valena J PREFERRED ADDRESS: Glendale Adventist Medical Center 1509 Wilson Terrace Glendale, CA 91206 CONTACT INFO: (P) 818-409-8258
(F) 818-546-5616 (E-MAIL)[email protected]
PRESENT POSITION: Glendale Adventist Medical Center Director of Organizational Performance Responsible for the following functions: - Hospital-wide Quality Outcomes Program including Publicly Reported Quality Measures - Hospital-wide Organizational Performance Improvement Program - Medical Staff Peer Review Program - Hospital wide Policies and Procedures PROF. ASSOCIATIONS: - California Association for Healthcare Quality – President for 2010-2011
(President Elect 2009-2010 and Past-President 2011-2012) - Hospital Association of Southern California (HASC) – Accreditation and
Licensure Committee - California Hospital Association (CHA) - Hospital Quality Committee
EDUCATION: Loma Linda University, BS Degree, Health Information Management, 1994 Redlands University, Masters in Management Degree, Quality Management Emphasis, 1998 CPHQ (Certified Professional Healthcare Quality) RHIA (Registered Health Information Administrator) CTR (Certified Tumor Registrar) HACP (Healthcare Accreditation Certified Professional) CLSSBB (Certified Lean Six Sigma Black Belt) Glendale Adventist Medical Center (GAMC): GAMC is a 515 bed facility. The hospital is a full service acute care and Heart and Vascular Institute, Orthopedics Institute, Women’s Center, Psychiatric and Substance Abuse Center, and Cancer Center. Ms. Emery leads the quality and performance improvement efforts at GAMC. GAMC has been a top performer as reflected in the following Quality Achievements for 2015:
1. Recognized by the Joint Commission as an Advanced Primary Stroke Center and has received Orthopedic Joint Replacement Disease Specific Certification.
2. Certified as a DNV Comprehensive Stroke Center, reflecting the highest levels of competence for treatment of serious stroke events.
3. Leapfrog Group hospital Safety Score- Letter Grade: A 4. U.S. News and World Report rates GAMC as High Performing in Heart Failure 5. 2015 Women’s Choice Award for patient safety, heart care, and orthopedics.
Professional Experience & Qualifications: Ms. Emery is academically prepared in Quality Management and Health Information Management with extensive experience working with performance improvement initiatives, clinical quality, health information systems, and total quality management programs. Ms. Emery has been a guest speaker for HASC Seminars on Accreditation and Licensure topics, for CAHQ Annual Meeting addressing the AHRQ Measure “Failure to Rescue”, and for Lumetra for the ACM Collaborative on Core Measures. She has spoken at the 17th PreCALS / Medical Staff Leadership Conference sponsored by IMQ, and at the International Congress on Performance Measurement and Improvement in Health Care sponsored by the Joint Commission. Ms. Emery initiated the “Score 100” Campaign focusing on the reduction in failure rate for Core Measures at Glendale Adventist Medical Center. Publications: Published Article, “Hospital Acquired Conditions (HACs)”, in CAHQ Journal, Quarter 4, 2009 Published Article, “The Bottom Line: The Human Touch”, in CAHQ Journal, Quarter 4, 2009 Published Article, “Score 100”, in CAHQ Forum, Volume 29/#3, 3rd Quarter 2005 Published Article, “Chapter 3 Protocols: Development, Implementation, and Evaluation, Protocol 9” in Measuring and Managing Health Care Quality, Goldfield N, Pine M, Pine J, Eds. 2nd Edition, Aspen Publishers, NY, NY 2002 Published Article “Making the CPR a Reality”, CHIA Journal, November 1994 Published Article “DRG’s Are Not the Answer”, QRC Advisor, Aspen Publication, Volume 1/#10, August 1985
13
Published Annual “Cancer Program Report”, for Parkview Community Hospital Medical Center and for physicians and residents of Riverside County, 1982-2001 Responsible for Publication of two audiovisual programs, “Watch What You Say” and “You and Your Medical Record” Professional Recognitions:
International Who’s Who of Professionals, 1996 California Health Information Association (CHIA) Award for Outstanding Performance; June 7, 1995 Registered Health Information Administrator, 1994; Placing at 98% of United States on examination
14
Romic Eskandarian, Pharm.D. Senior Director of Pharmacy Services at Glendale Adventist Medical Center
Biographical Information
Romic Eskandarian, Pharm.D., is the senior director of pharmacy services at Glendale Adventist
Medical Center. He has served in this position for the past eight years, where he is responsible
for planning, implementing, managing and improving both inpatient and outpatient clinical
pharmacy services.
As Senior Director of Pharmaceutical Services at Glendale Adventist Medical Center, Dr.
Eskandarian also participates as a member of several committees including the Governing
Board, Clinical Improvement Council, P&T, Antimicrobial Stewardship ‐Chair Committee and
Medication Error Prevention Committee‐Chair.
Before joining Glendale Adventist Medical Center in 2005, Dr. Eskandarian worked as a clinical
pharmacist at White Memorial Medical Center. His first role at Glendale was clinical
coordinator, where he took his practice experience and passion for education and began
providing advanced elective clerkships in conjunction with local pharmacy schools. The
following year, he expanded education efforts by starting a PGY1 pharmacy residency. He
currently holds adjunct faculty positions at Western University, Loma Linda, USC, and Touro
University.
Dr. Eskandarian’s interests focus on practice innovation, teaching effectiveness, medication
safety, and management. He has published several articles in peer reviewed journals, and has
presented at various local and national conferences. Dr. Eskandarian spearheaded the
implementation of the Basal Bolus Insulin protocol at Glendale Adventist Medical Center.
15

APPENDIX B: FULL SIX SIGMA PROJECT PRESENTATION
16
Rob Bryant Proprietary and Confidential
Six Sigma Project Report PresentationGlycemic Management Protocol-
Basal Bolus Insulin Protocolby Pharmacy
Black Belt Name: Valena Emery Team Leader: Romic Eskandarian
Project Sponsor: Arby Nahapetian, MDGlendale Adventist Medical Center
S:\15 GAMC QAShared\Glycemic Management\Vanguard Award Documents
17

Rob Bryant Proprietary and Confidential 2
Roles & ResponsibilitiesRoles & Responsibilities
Project StatementProject Statement Project Deliverables/BenefitsProject Deliverables/Benefits
Champion: Arby Nahapetian, MDProcess Owner: Romic Eskandarian, PharmDProject BB/GB: Valena EmeryFinance Contact: Deana Allington
Problem StatementApproximately 26% of GAMC’s adult inpatients have a co-morbidity of diabetes. Physicians may each manage blood glucose levels differently resulting in the potential for inconsistent follow-up. Without consistent glycemic management, patients are at an increased risk for complications. AHRQ Patient Safety Indicator # 10 is intended to flag cases of postoperative metabolic or physiologic complications in elective surgical patients for review and possible process improvement. This PSI rate shows much variability. This measure includes uncontrolled diabetes and renal failure.
Project ScopeIn Scope:All diabetic patients on telemetry and medical surgical units for whom their attending physician consent to using the basal bolus insulin protocol (BBIP) by pharmacy.
Out of Scope:All other nursing units and hospital services outside the Medical Surgical and Telemetry units. This exclusion includes all critical care and women’s services patients.
Project GoalDeploy the Basal Bolus Insulin Protocol (BBIP) program including pharmacy management of patient blood glucose levels. Improve glycemic management of patients thereby reducing the number of episodes of hyperglycemia. Reduce the average length of stay of diabetic patients by a minimum of .345 days. Benefits will be evaluated quarterly following implementation.
Key DeliverablesSix Sigma project documentation, project plan and validated cost savings to meet project targets
Financial and Operational BenefitsHard: Potential financial benefit of at least $150,000 per annum realized through decrease in average length of stay. This savings will cover additional pharmacy coverage and program cost.Soft: Improved glycemic management and reduction in episodes of hyperglycemia for diabetic patients
Core team members: Pablo Bassuk, MDMonica Ludwick, PharmD Oliver Ong, MD –EndocrinologyZarmen Iraelian, MD - Endo Jhanna Nariyants, MD – EndoTerri Hansen Zarmine NacashianJudy Blair – CNO Delia DuenasDebra Balderama Jocelyn CajanapKathy Rodrigue John DeyellWende Brookshire Rebecca PawTamar Apelian Punnoose VargheseTerri VanHouten Yu-Wen Zoe ChenKimberly Groome Parastoo Rezai
Define Phase – Glycemic Management Protocol Project Charter
18
Rob Bryant Proprietary and Confidential 3
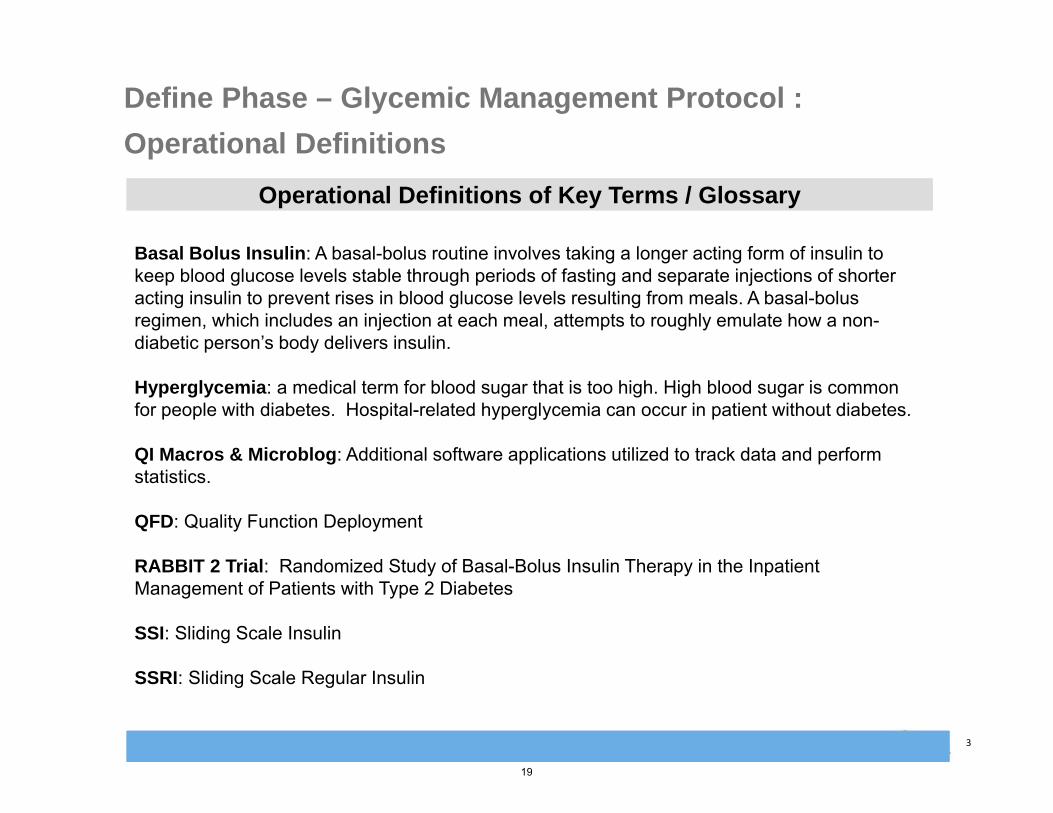
Basal Bolus Insulin: A basal-bolus routine involves taking a longer acting form of insulin to keep blood glucose levels stable through periods of fasting and separate injections of shorter acting insulin to prevent rises in blood glucose levels resulting from meals. A basal-bolus regimen, which includes an injection at each meal, attempts to roughly emulate how a non-diabetic person’s body delivers insulin.
Hyperglycemia: a medical term for blood sugar that is too high. High blood sugar is common for people with diabetes. Hospital-related hyperglycemia can occur in patient without diabetes.
QI Macros & Microblog: Additional software applications utilized to track data and perform statistics.
QFD: Quality Function Deployment
RABBIT 2 Trial: Randomized Study of Basal-Bolus Insulin Therapy in the Inpatient Management of Patients with Type 2 Diabetes
SSI: Sliding Scale Insulin
SSRI: Sliding Scale Regular Insulin
Operational Definitions of Key Terms / GlossaryOperational Definitions of Key Terms / Glossary
Define Phase – Glycemic Management Protocol :
Operational Definitions
19
Rob Bryant Proprietary and Confidential 4
Define Phase – Financial Impact / COPQ (Cost of Poor Quality)
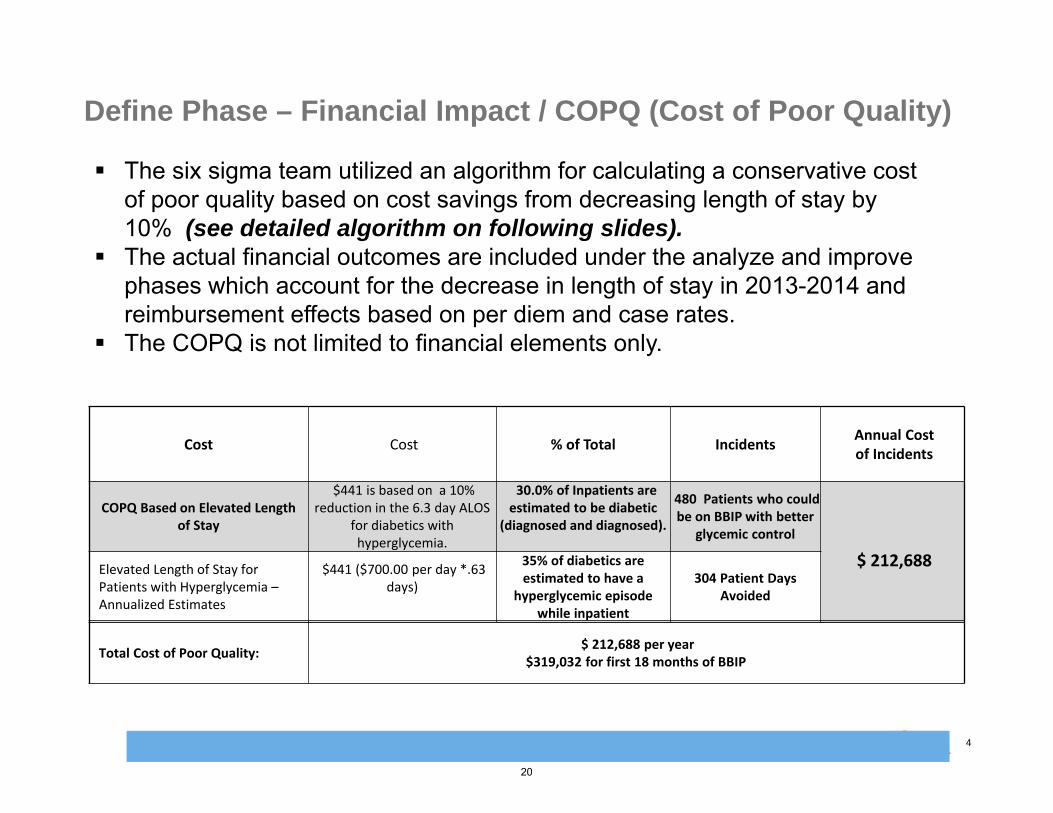
Cost Cost % of Total IncidentsAnnual Costof Incidents
COPQ Based on Elevated Length of Stay
$441 is based on a 10% reduction in the 6.3 day ALOS
for diabetics with hyperglycemia.
30.0% of Inpatients are estimated to be diabetic
(diagnosed and diagnosed).
480 Patients who couldbe on BBIP with better
glycemic control
$ 212,688Elevated Length of Stay for Patients with Hyperglycemia –Annualized Estimates
$441 ($700.00 per day *.63 days)
35% of diabetics are estimated to have a
hyperglycemic episode while inpatient
304 Patient Days Avoided
Total Cost of Poor Quality:$ 212,688 per year
$319,032 for first 18 months of BBIP
The six sigma team utilized an algorithm for calculating a conservative cost of poor quality based on cost savings from decreasing length of stay by 10% (see detailed algorithm on following slides).
The actual financial outcomes are included under the analyze and improve phases which account for the decrease in length of stay in 2013-2014 and reimbursement effects based on per diem and case rates.
The COPQ is not limited to financial elements only.
20

Rob Bryant Proprietary and Confidential 5
Define Phase – Financial Impact / COPQ (Cost of Poor Quality)
According to 2013 data, there is a 28.5% LOS reduction when POC-BG is well controlled. Our conservative estimates only include a 10% reduction.
21
Rob Bryant Proprietary and Confidential 6
Define Phase – Financial Impact / COPQ (Cost of Poor Quality)
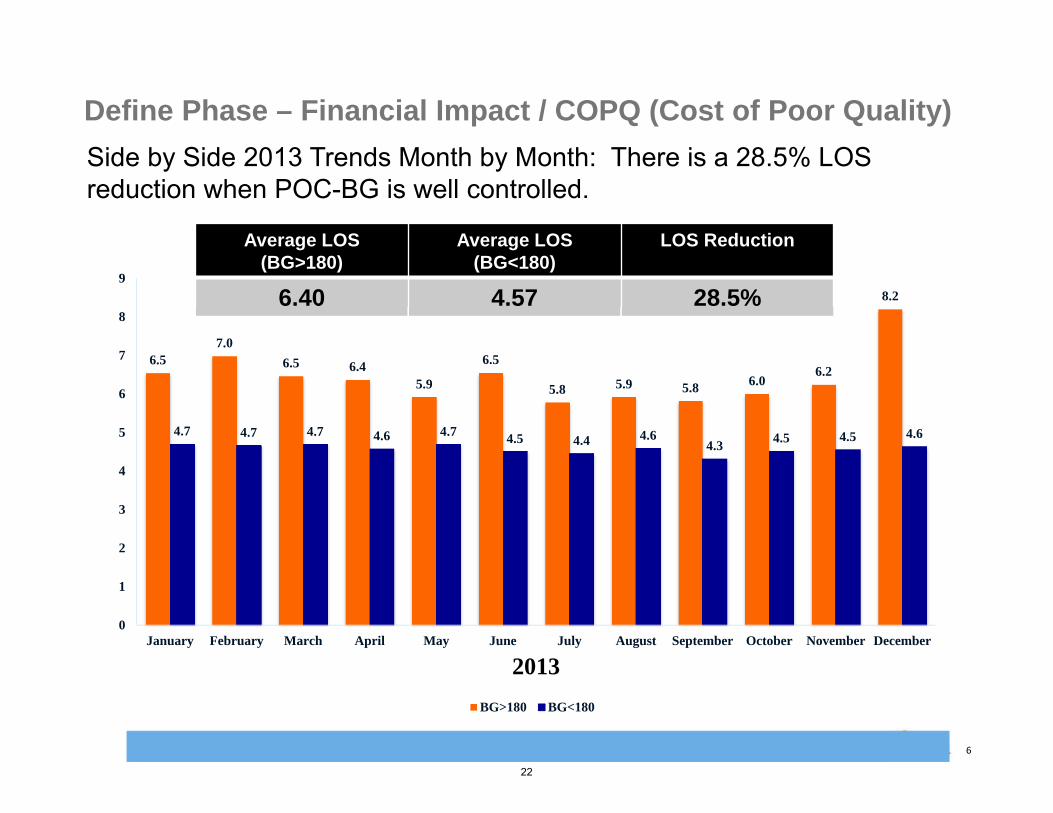
Side by Side 2013 Trends Month by Month: There is a 28.5% LOS reduction when POC-BG is well controlled.
Average LOS (BG>180)
Average LOS (BG<180)
LOS Reduction
6.40 4.57 28.5%
6.57.0
6.5 6.45.9
6.5
5.8 5.9 5.8 6.06.2
8.2
4.7 4.7 4.7 4.6 4.7 4.5 4.4 4.64.3 4.5 4.5 4.6
0
1
2
3
4
5
6
7
8
9
January February March April May June July August September October November December
2013BG>180 BG<180
22
Rob Bryant Proprietary and Confidential 7
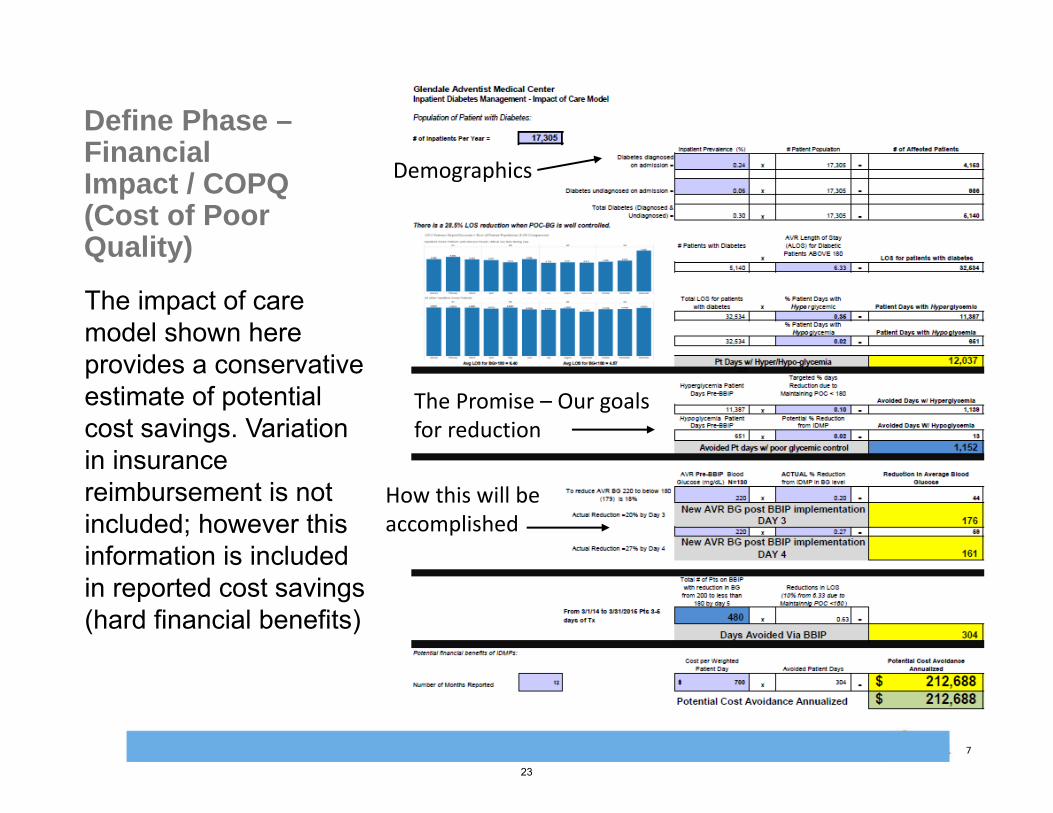
Define Phase –Financial Impact / COPQ (Cost of Poor Quality)
The impact of care model shown here provides a conservative estimate of potential cost savings. Variation in insurance reimbursement is not included; however this information is included in reported cost savings (hard financial benefits)
Demographics
The Promise – Our goals for reduction
How this will be accomplished
23
Rob Bryant Proprietary and Confidential 8
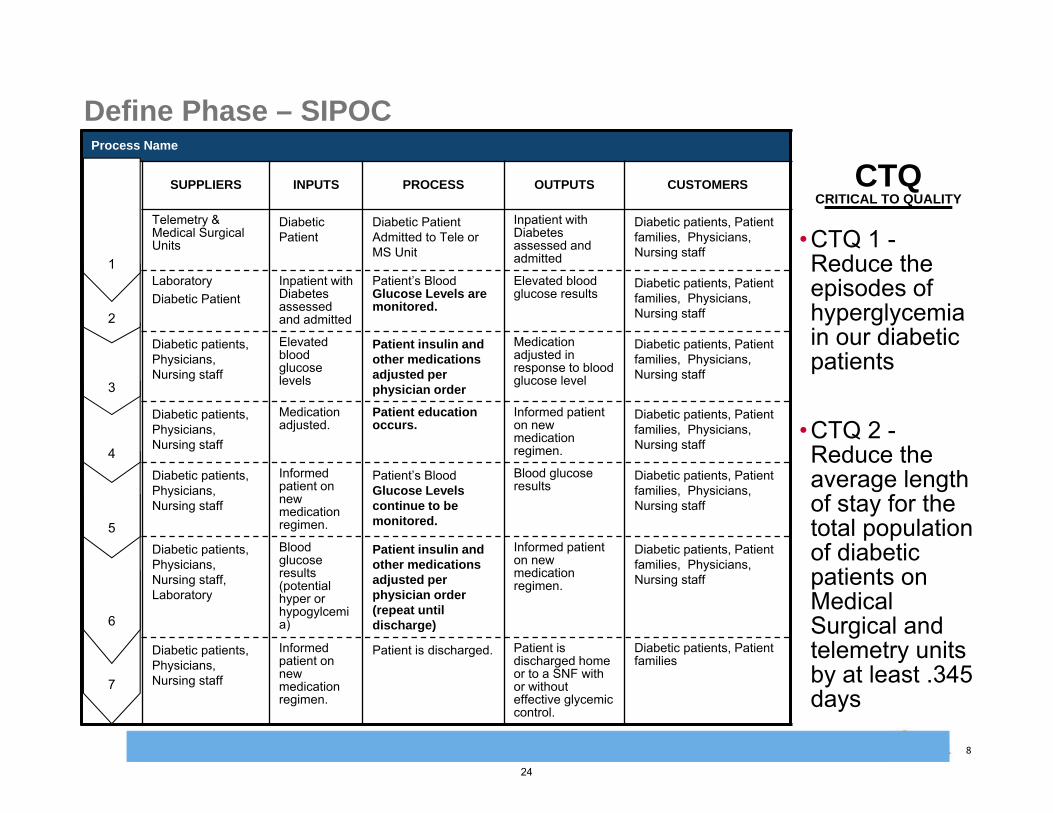
CTQCRITICAL TO QUALITY
•CTQ 1 -Reduce the episodes of hyperglycemia in our diabetic patients
•CTQ 2 -Reduce the average length of stay for the total population of diabetic patients on Medical Surgical and telemetry units by at least .345 days
Process Name
SUPPLIERS INPUTS PROCESS OUTPUTS CUSTOMERS
Telemetry & Medical Surgical Units
Diabetic Patient
Diabetic Patient Admitted to Tele or MS Unit
Inpatient with Diabetes assessed and admitted
Diabetic patients, Patient families, Physicians,Nursing staff
LaboratoryDiabetic Patient
Inpatient with Diabetes assessed and admitted
Patient’s Blood Glucose Levels are monitored.
Elevated blood glucose results
Diabetic patients, Patient families, Physicians,Nursing staff
Diabetic patients, Physicians,Nursing staff
Elevated blood glucose levels
Patient insulin and other medications adjusted per physician order
Medication adjusted in response to blood glucose level
Diabetic patients, Patient families, Physicians,Nursing staff
Diabetic patients, Physicians,Nursing staff
Medication adjusted.
Patient education occurs.
Informed patient on new medication regimen.
Diabetic patients, Patient families, Physicians,Nursing staff
Diabetic patients, Physicians,Nursing staff
Informed patient on new medication regimen.
Patient’s Blood Glucose Levels continue to be monitored.
Blood glucose results
Diabetic patients, Patient families, Physicians,Nursing staff
Diabetic patients, Physicians,Nursing staff, Laboratory
Blood glucose results (potential hyper or hypogylcemia)
Patient insulin and other medications adjusted per physician order (repeat until discharge)
Informed patient on new medication regimen.
Diabetic patients, Patient families, Physicians,Nursing staff
8
Diabetic patients, Physicians,Nursing staff
Informed patient on new medication regimen.
Patient is discharged. Patient is discharged home or to a SNF with or without effective glycemic control.
Diabetic patients, Patient families
7
6
5
4
3
2
1
Define Phase – SIPOC
24
Rob Bryant Proprietary and Confidential 9
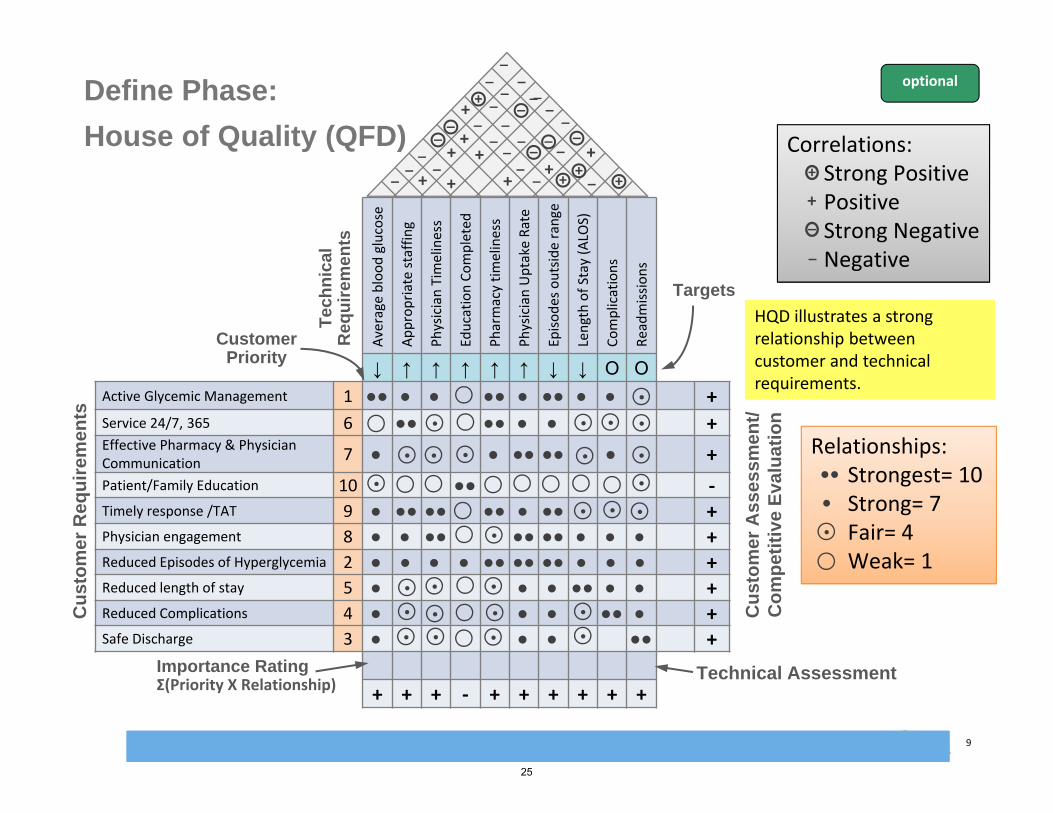
Define Phase:
House of Quality (QFD)
optional
HQD illustrates a strong relationship between customer and technical requirements.
Average blood glucose
Appropriatestaffing
Physician Tim
eliness
EducationCompleted
Pharmacytimeliness
Physician Uptake Rate
Episodes
outside range
Length of Stay (ALO
S)
Complications
Readmissions
↓ ↑ ↑ ↑ ↑ ↑ ↓ ↓ O OActive Glycemic Management 1 ●● ● ● ●● ● ●● ● ● +Service 24/7, 365 6 ●● ●● ● ● +Effective Pharmacy & Physician Communication
7 ● ● ●● ●● ● +
Patient/Family Education 10 ●● ‐Timely response /TAT 9 ● ●● ●● ●● ● ●● +Physician engagement 8 ● ● ●● ●● ●● ● ● ● +Reduced Episodes of Hyperglycemia 2 ● ● ● ● ●● ●● ●● ● ● ● +Reduced length of stay 5 ● ● ● ●● ● ● +Reduced Complications 4 ● ● ● ●● ● +Safe Discharge 3 ● ● ● ●● +
+ + + ‐ + + + + + +
Customer Priority
Cu
sto
mer
Req
uir
emen
ts
Tec
hn
ical
R
equ
irem
ents
Targets
Correlations:Strong PositivePositiveStrong NegativeNegative
+
+_
_
Relationships:Strongest= 10Strong= 7Fair= 4Weak= 1
●●
●
•
•
•
•
•
•
+
_
+ _
_
+
++_ _
+
Cu
sto
mer
Ass
essm
ent/
Co
mp
etit
ive
Eva
luat
ion
Importance RatingΣ(Priority X Relationship)
Technical Assessment
•
•
•
•
•
•
•
•
•
•
•
•
•
•
•
• •
• •
•
•
•
_ +
__
+
__
_
__
+
__
__
_+
__
++ _
__
_
___
_+
25
Rob Bryant Proprietary and Confidential 10
Define Phase
VOC Translation
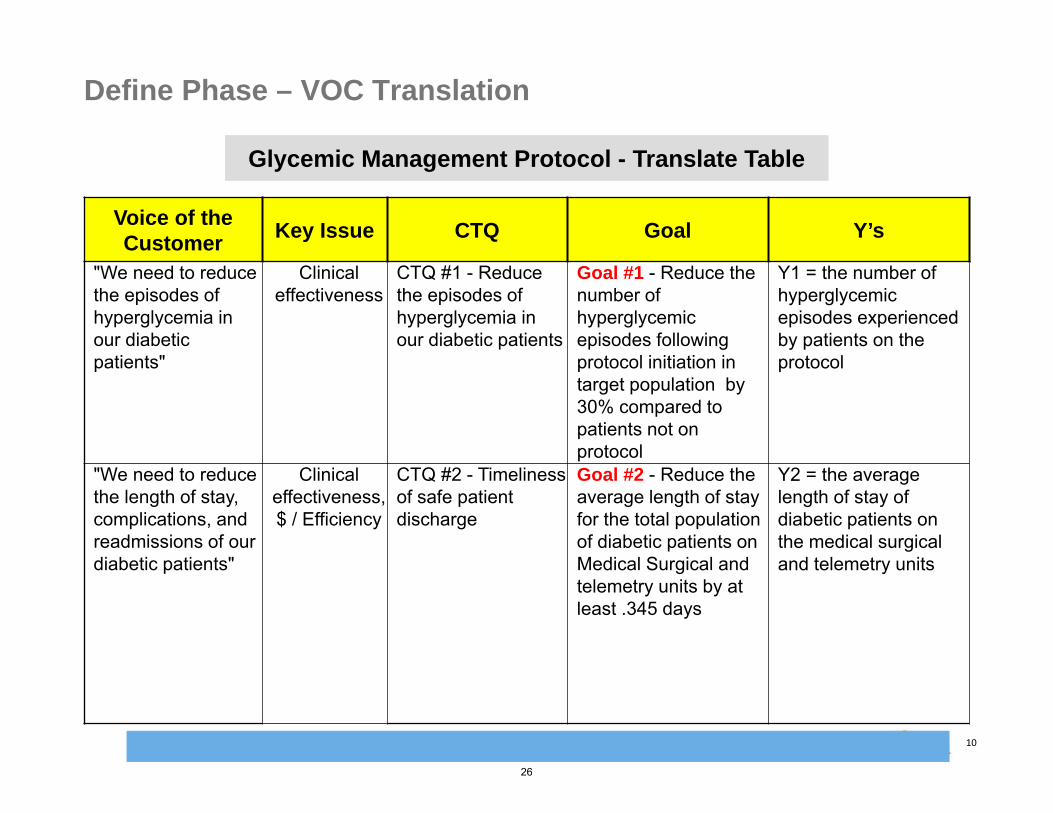
Define Phase – VOC Translation
Glycemic Management Protocol - Translate TableGlycemic Management Protocol - Translate Table
Voice of the Customer
Key Issue CTQ Goal Y’s
"We need to reduce the episodes of hyperglycemia in our diabetic patients"
Clinical effectiveness
CTQ #1 - Reduce the episodes of hyperglycemia in our diabetic patients
Goal #1 - Reduce the number of hyperglycemicepisodes following protocol initiation in target population by 30% compared to patients not on protocol
Y1 = the number of hyperglycemicepisodes experienced by patients on the protocol
"We need to reduce the length of stay, complications, and readmissions of our diabetic patients"
Clinical effectiveness, $ / Efficiency
CTQ #2 - Timeliness of safe patient discharge
Goal #2 - Reduce the average length of stay for the total population of diabetic patients on Medical Surgical and telemetry units by at least .345 days
Y2 = the average length of stay of diabetic patients on the medical surgical and telemetry units
26
Rob Bryant Proprietary and Confidential 11
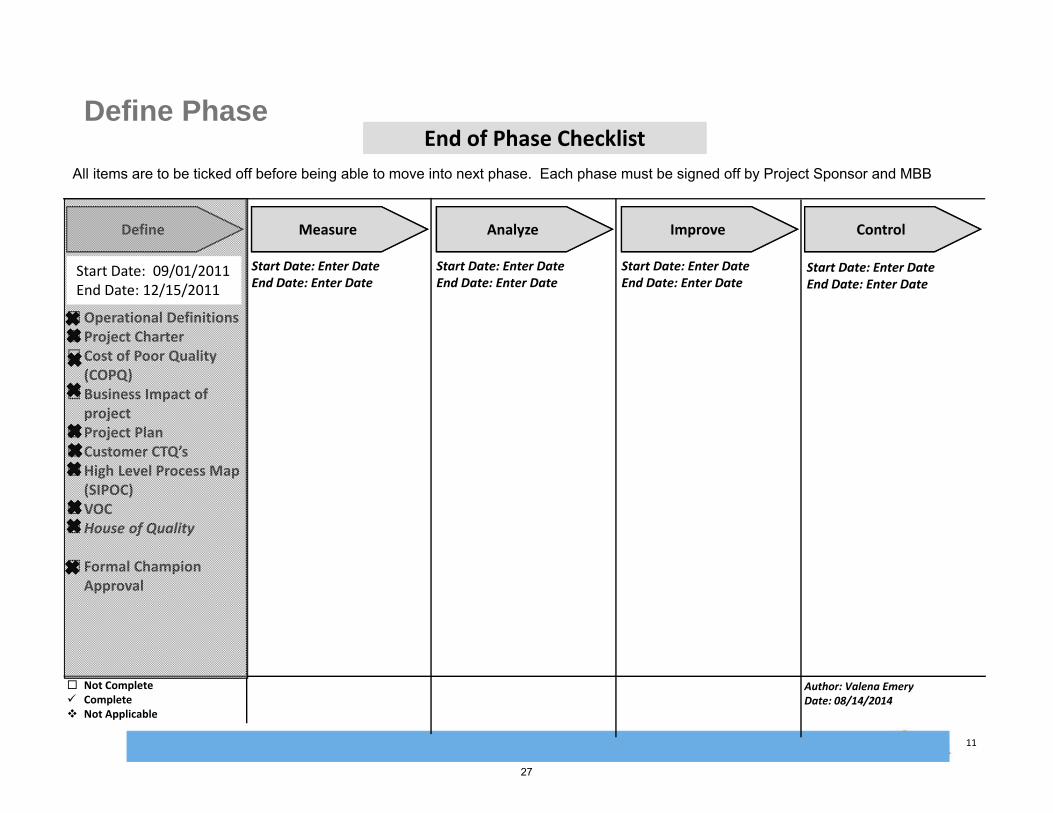
End of Phase ChecklistEnd of Phase Checklist
Start Date: Enter DateEnd Date: Enter Date
Operational Definitions Project Charter Cost of Poor Quality
(COPQ) Business Impact of
project Project Plan Customer CTQ’sHigh Level Process Map
(SIPOC)VOCHouse of Quality
Formal Champion Approval
Define Measure Analyze Improve Control
Start Date: Enter DateEnd Date: Enter Date
Start Date: Enter DateEnd Date: Enter Date
Start Date: Enter DateEnd Date: Enter Date
Start Date: Enter DateEnd Date: Enter Date
Not Complete Complete Not Applicable
Author: Valena Emery Date: 08/14/2014
All items are to be ticked off before being able to move into next phase. Each phase must be signed off by Project Sponsor and MBB
Define Phase
Start Date: 09/01/2011End Date: 12/15/2011
27
Rob Bryant Proprietary and Confidential 12
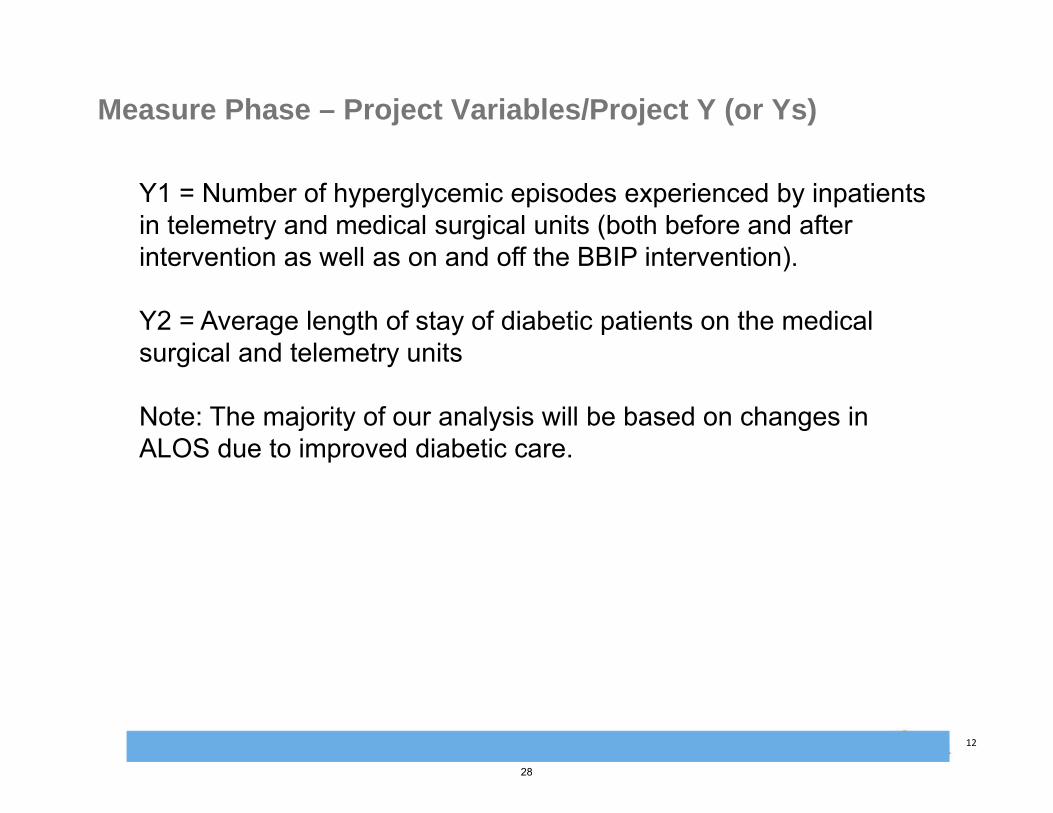
Measure Phase – Project Variables/Project Y (or Ys)
Y1 = Number of hyperglycemic episodes experienced by inpatients in telemetry and medical surgical units (both before and after intervention as well as on and off the BBIP intervention).
Y2 = Average length of stay of diabetic patients on the medical surgical and telemetry units
Note: The majority of our analysis will be based on changes in ALOS due to improved diabetic care.
28

Rob Bryant Proprietary and Confidential 13
Measure Phase – Glycemic Management Protocol: Process Map
29
Rob Bryant Proprietary and Confidential 14
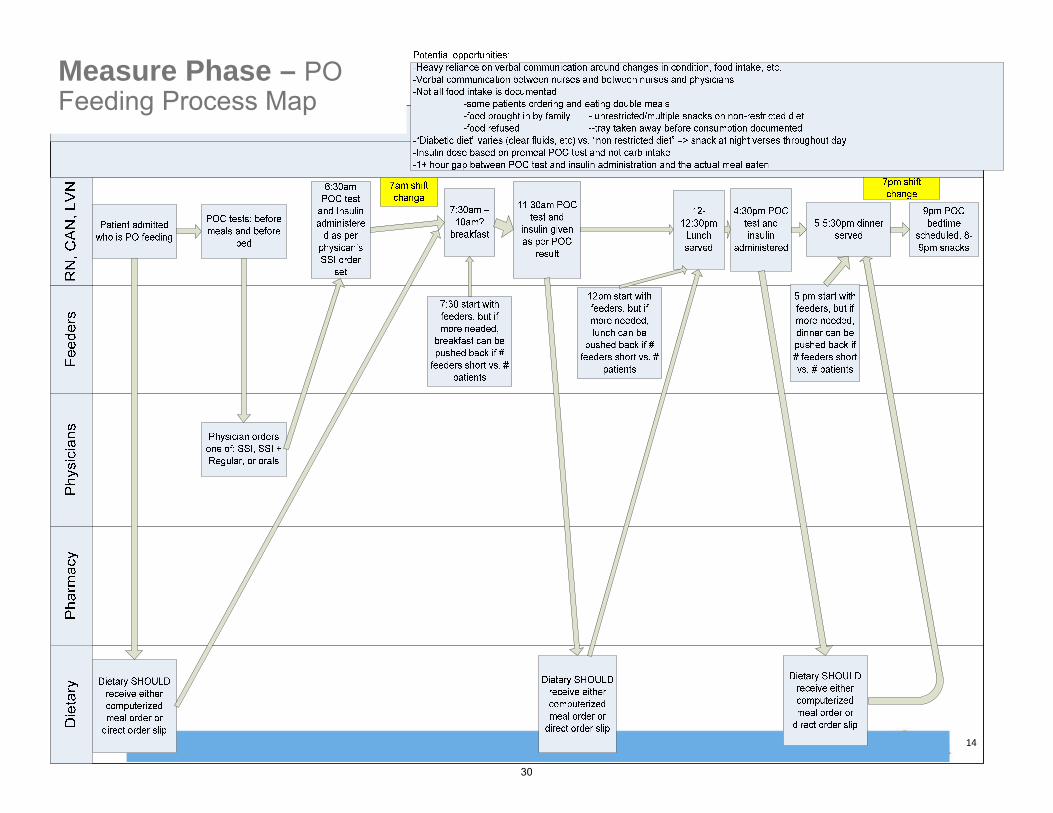
Measure Phase – PO Feeding Process Map
30
Rob Bryant Proprietary and Confidential 15
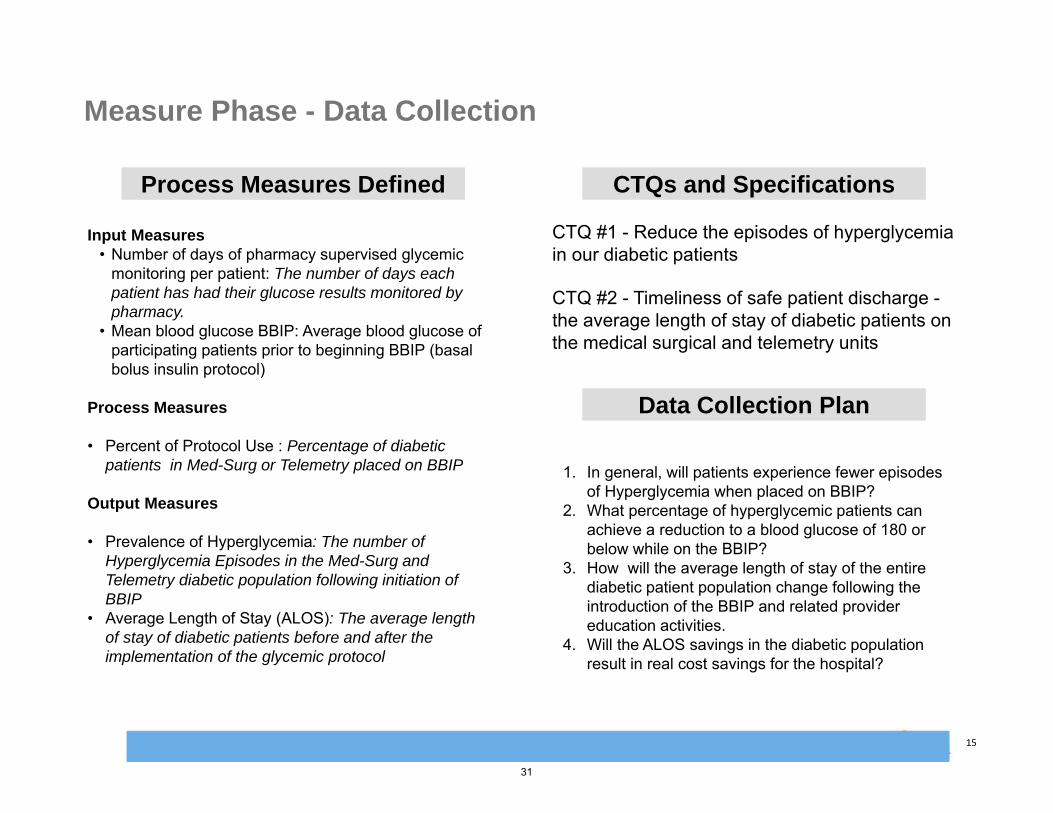
Measure Phase - Data Collection
CTQs and SpecificationsCTQs and SpecificationsProcess Measures DefinedProcess Measures Defined
Input Measures• Number of days of pharmacy supervised glycemic
monitoring per patient: The number of days each patient has had their glucose results monitored by pharmacy.
• Mean blood glucose BBIP: Average blood glucose of participating patients prior to beginning BBIP (basal bolus insulin protocol)
Process Measures
• Percent of Protocol Use : Percentage of diabetic patients in Med-Surg or Telemetry placed on BBIP
Output Measures
• Prevalence of Hyperglycemia: The number of Hyperglycemia Episodes in the Med-Surg and Telemetry diabetic population following initiation of BBIP
• Average Length of Stay (ALOS): The average length of stay of diabetic patients before and after the implementation of the glycemic protocol
CTQ #1 - Reduce the episodes of hyperglycemia in our diabetic patients
CTQ #2 - Timeliness of safe patient discharge -the average length of stay of diabetic patients on the medical surgical and telemetry units
Data Collection PlanData Collection Plan
1. In general, will patients experience fewer episodes of Hyperglycemia when placed on BBIP?
2. What percentage of hyperglycemic patients can achieve a reduction to a blood glucose of 180 or below while on the BBIP?
3. How will the average length of stay of the entire diabetic patient population change following the introduction of the BBIP and related provider education activities.
4. Will the ALOS savings in the diabetic population result in real cost savings for the hospital?
31
Rob Bryant Proprietary and Confidential 16
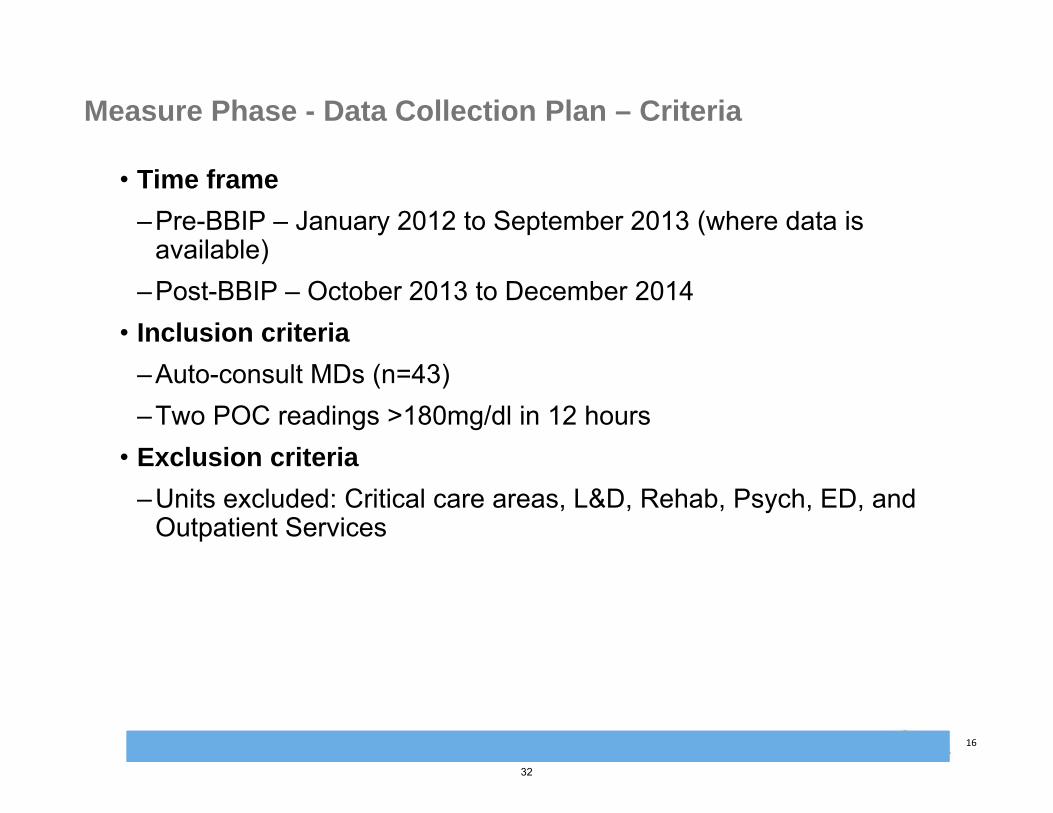
Measure Phase - Data Collection Plan – Criteria
• Time frame
–Pre-BBIP – January 2012 to September 2013 (where data is available)
–Post-BBIP – October 2013 to December 2014• Inclusion criteria
–Auto-consult MDs (n=43)–Two POC readings >180mg/dl in 12 hours
• Exclusion criteria
–Units excluded: Critical care areas, L&D, Rehab, Psych, ED, and Outpatient Services
32

Rob Bryant Proprietary and Confidential 17
Measure Phase - Data Collection Plan 1 of 2
Data Collection Plan
Data Collection Objective: To collect data on the incidence of hyperglycemia to evaluated and improve glycemic management at Glendale Adventist Medical Center.
What to Measure Operational Definition Sampling Plan Collection
Measure Type Measure
Type Data
Stratification
What How What Where When How Many
Collection Method
Responsible
Incidence of Hyperglycemia
Y1
DiscreteYes or No (Yes can occur multiple times)
Did the patienthave an incidence of hyperglycemia (BG>180)?
Blood glucose levels from routine finger sticks will be analyzed
Blood Glucose levels
Datapulled from testing data for all GAMCInpatient Areas
Jan 2012 –Ongoing
100% sample All Diabetic patients
Automated throughtesting and Pharmacy systems
Pharmacy
AverageLength of Stay
Y2
Continuous
None- No grouping occurs
The average length of time diabetics stay in the hospital
The totalamount of time the patient has spent in the hospital
Length of stay in the hospital
GAMC –all patients with diabetes on all units
Jan 2012 –Ongoing
100% sample All Diabetic patients
Data pulled from Quality advisor for all diabetic patients. Finance to add cost component
Org Performance and Finance
Participation in BBIP program
X1
Discrete Yes or No Did the physician place the patient on the BBIP or not?
BBIP order entered and patient added to pharmacy queue for monitoring
Patient included in BBIP list
Internal trackingdatabase managed by pharmacy
September 2013 -Ongoing
100% sample All patients who participate in BBIP
Pharmacy database internal tracking of BBIP patients
Pharmacy
33

Rob Bryant Proprietary and Confidential 18
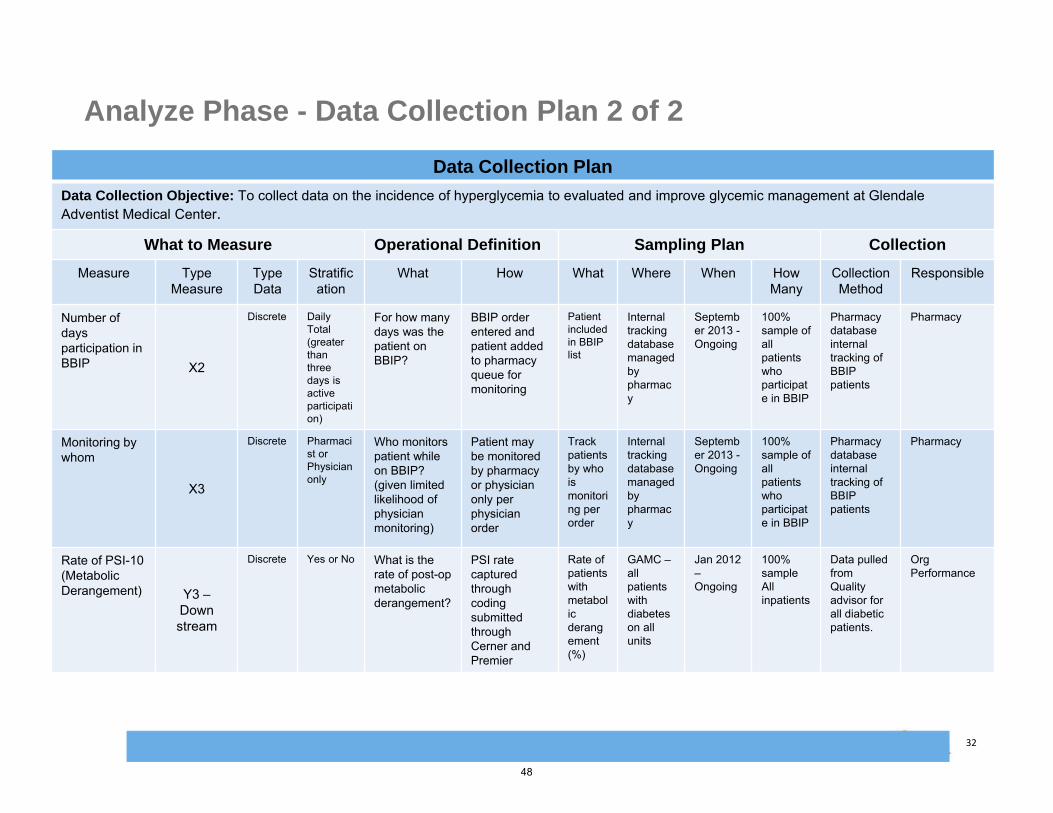
Measure Phase - Data Collection Plan 2 of 2
Data Collection Plan
Data Collection Objective: To collect data on the incidence of hyperglycemia to evaluated and improve glycemic management at Glendale Adventist Medical Center.
What to Measure Operational Definition Sampling Plan Collection
Measure Type Measure
Type Data
Stratification
What How What Where When How Many
Collection Method
Responsible
Number of days participation in BBIP X2
Discrete Daily Total (greaterthan three days is active participation)
For how many days was the patient on BBIP?
BBIP order entered and patient added to pharmacy queue for monitoring
Patient included in BBIP list
Internal trackingdatabase managed by pharmacy
September 2013 -Ongoing
100% sample ofall patients who participate in BBIP
Pharmacy database internal tracking of BBIP patients
Pharmacy
Monitoring by whom
X3
Discrete Pharmacist or Physician only
Who monitorspatient while on BBIP? (given limited likelihood of physician monitoring)
Patient may be monitored by pharmacyor physician only per physician order
Trackpatients by who is monitoring per order
Internal trackingdatabase managed by pharmacy
September 2013 -Ongoing
100% sample ofall patients who participate in BBIP
Pharmacy database internal tracking of BBIP patients
Pharmacy
Rate of PSI-10 (Metabolic Derangement) Y3 –
Down stream
Discrete Yes or No What is the rate of post-op metabolic derangement?
PSI rate captured through coding submitted through Cerner and Premier
Rate of patients withmetabolic derangement (%)
GAMC –all patients with diabetes on all units
Jan 2012 –Ongoing
100% sample All inpatients
Data pulled from Quality advisor for all diabetic patients.
Org Performance
34
Rob Bryant Proprietary and Confidential 19
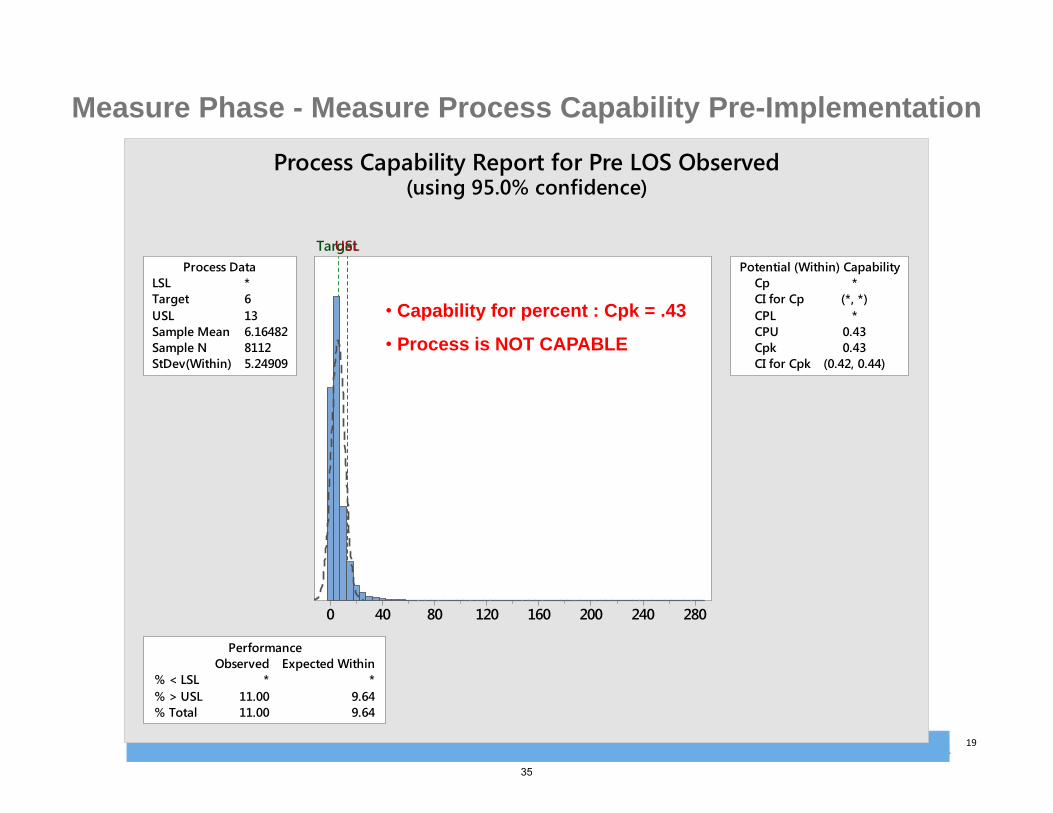
28024020016012080400
LSL *Target 6USL 13Sample Mean 6.16482Sample N 8112StDev(Within) 5.24909
Process DataCp *CI for Cp (*, *)CPL *CPU 0.43Cpk 0.43CI for Cpk (0.42, 0.44)
Potential (Within) Capability
% < LSL * *% > USL 11.00 9.64% Total 11.00 9.64
Observed Expected WithinPerformance
TargetUSL
Process Capability Report for Pre LOS Observed(using 95.0% confidence)
Measure Phase - Measure Process Capability Pre-Implementation
• Capability for percent : Cpk = .43
• Process is NOT CAPABLE
35

Rob Bryant Proprietary and Confidential 20
Measure Phase - Baseline Performance of Ys
Baseline Process MeasuresBaseline Process MeasuresCollected DataCollected Data
Baseline Process SigmaBaseline Process SigmaGraphical OverviewGraphical Overview
Data was successfully collected throughout 2013 – Spring 2015, including incidence of hyperglycemia, average length of stay, and the program uptake and success as seen in analysis section.
Baseline process measures include: The incidence of hyperglycemia in the
diabetic population pre-BBIP The average length of stay for diabetic
patients pre-BBIP
The graphics presented in the subsequent slides provides a summary of the incidence of hyperglycemia and elevate average length of stay in the diabetic patient population prior to program roll-out.
A defect is defined as any incidence of hyperglycemia above the threshold of 180. Baseline Process Sigma: 1.3 (Based on a Cpk of 0.43)
Post-implementation, a defect will be defined as a patient who experiences an episode of hyperglycemia above 180 after 3 or more days of participation in the BBIP.
36
Rob Bryant Proprietary and Confidential 21
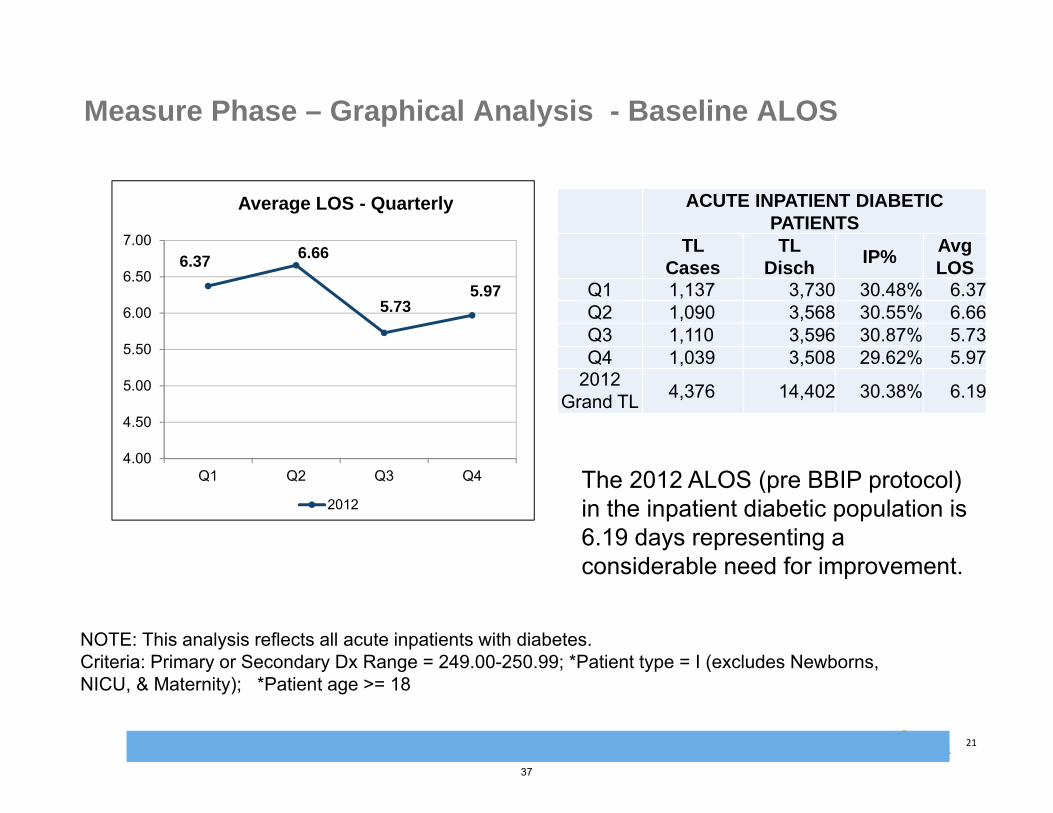
Measure Phase – Graphical Analysis - Baseline ALOS
6.37 6.66
5.735.97
4.00
4.50
5.00
5.50
6.00
6.50
7.00
Q1 Q2 Q3 Q4
Average LOS - Quarterly
2012
ACUTE INPATIENT DIABETICPATIENTS
TL Cases
TL Disch
IP%AvgLOS
Q1 1,137 3,730 30.48% 6.37Q2 1,090 3,568 30.55% 6.66Q3 1,110 3,596 30.87% 5.73Q4 1,039 3,508 29.62% 5.97
2012 Grand TL 4,376 14,402 30.38% 6.19
The 2012 ALOS (pre BBIP protocol) in the inpatient diabetic population is 6.19 days representing a considerable need for improvement.
NOTE: This analysis reflects all acute inpatients with diabetes.Criteria: Primary or Secondary Dx Range = 249.00-250.99; *Patient type = I (excludes Newborns, NICU, & Maternity); *Patient age >= 18
37

Rob Bryant Proprietary and Confidential 22
28024020016012080400
Geo LOS Observed
Each symbol represents up to 86 observations.Results include rows where 'Pre or Post' = "Pre".
January 2012 through September 2013 Dotplot of ALOS
Measure Phase – Graphical Analysis – Pre-Implementation ALOS
During the pre‐implementation timeframe, there were more outliers and extended lengths of stay. The mean ALOS was 6.16 with a high StDev of 8.13.
N Mean StDev SE MeanPre 8112 6.16 8.13 0.090
38
Rob Bryant Proprietary and Confidential 23
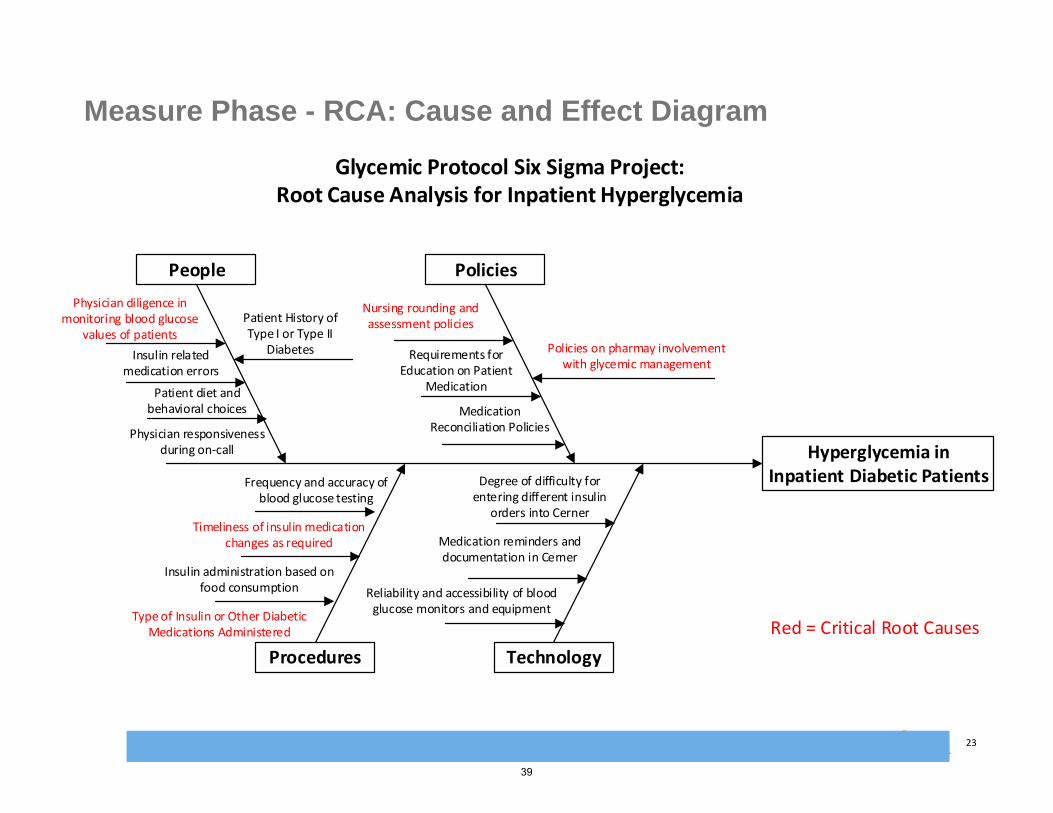
Measure Phase - RCA: Cause and Effect Diagram
Hyperglycemia in Inpatient Diabetic Patients
People Policies
Physician diligence in monitoring blood glucose
values of patients
Degree of difficulty for entering different insulin
orders into Cerner
Frequency and accuracy of blood glucose testing
Nursing rounding and assessment policies
Medication Reconciliation Policies
Requirements for Education on Patient
Medication
Policies on pharmay involvement with glycemic management
Insulin related medication errors
Patient diet and behavioral choices
Timeliness of insulin medication changes as required
Insulin administration based on food consumption
Medication reminders and documentation in Cerner
Physician responsiveness during on‐call
Reliability and accessibility of blood glucose monitors and equipment
Type of Insulin or Other Diabetic Medications Administered
Glycemic Protocol Six Sigma Project:Root Cause Analysis for Inpatient Hyperglycemia
Patient History of Type I or Type II
Diabetes
Red = Critical Root Causes
39

Rob Bryant Proprietary and Confidential 24
Measure Phase – Root Cause Analysis: Clinical Triggers of Hypoglycemia
• Tube Feeding Changes: Decrease in tube feed rate, or hold or discontinuation of tube feeds.
• Insulin Hypersensitivity: Patient is very sensitive to insulin dosing; small doses of insulin causing a large decrease in blood glucose.
• Dietary Inconsistency: Changes to diet where patient is taking in less food than usual.
• Insulin Stacking: Insulin dose is given later than scheduled, and multiple insulin doses are given very close to each other.Declining Renal Function: Poor renal function leads to insulin accumulation.
• Other: Includes but not limited to change in steroid administrations, unknown etiology, etc.
40
Rob Bryant Proprietary and Confidential 25
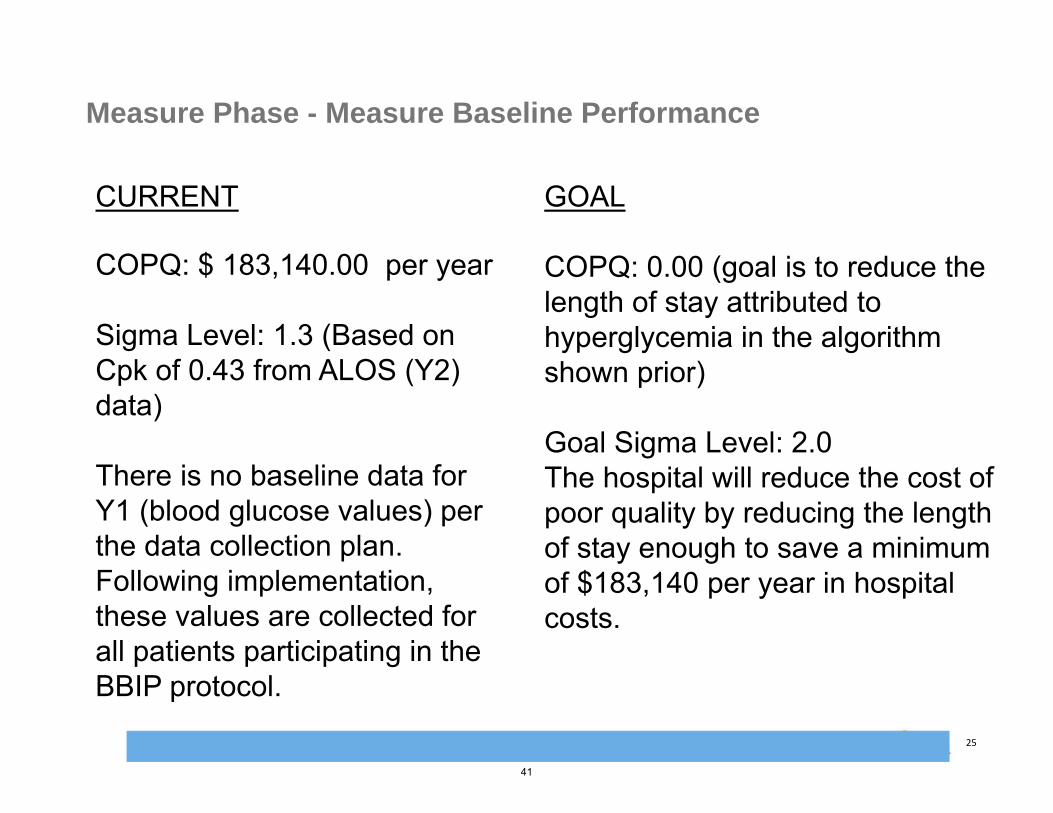
Measure Phase - Measure Baseline Performance
CURRENT
COPQ: $ 183,140.00 per year
Sigma Level: 1.3 (Based on Cpk of 0.43 from ALOS (Y2) data)
There is no baseline data for Y1 (blood glucose values) per the data collection plan. Following implementation, these values are collected for all patients participating in the BBIP protocol.
GOAL
COPQ: 0.00 (goal is to reduce the length of stay attributed to hyperglycemia in the algorithm shown prior)
Goal Sigma Level: 2.0 The hospital will reduce the cost of poor quality by reducing the length of stay enough to save a minimum of $183,140 per year in hospital costs.
41
Rob Bryant Proprietary and Confidential 26
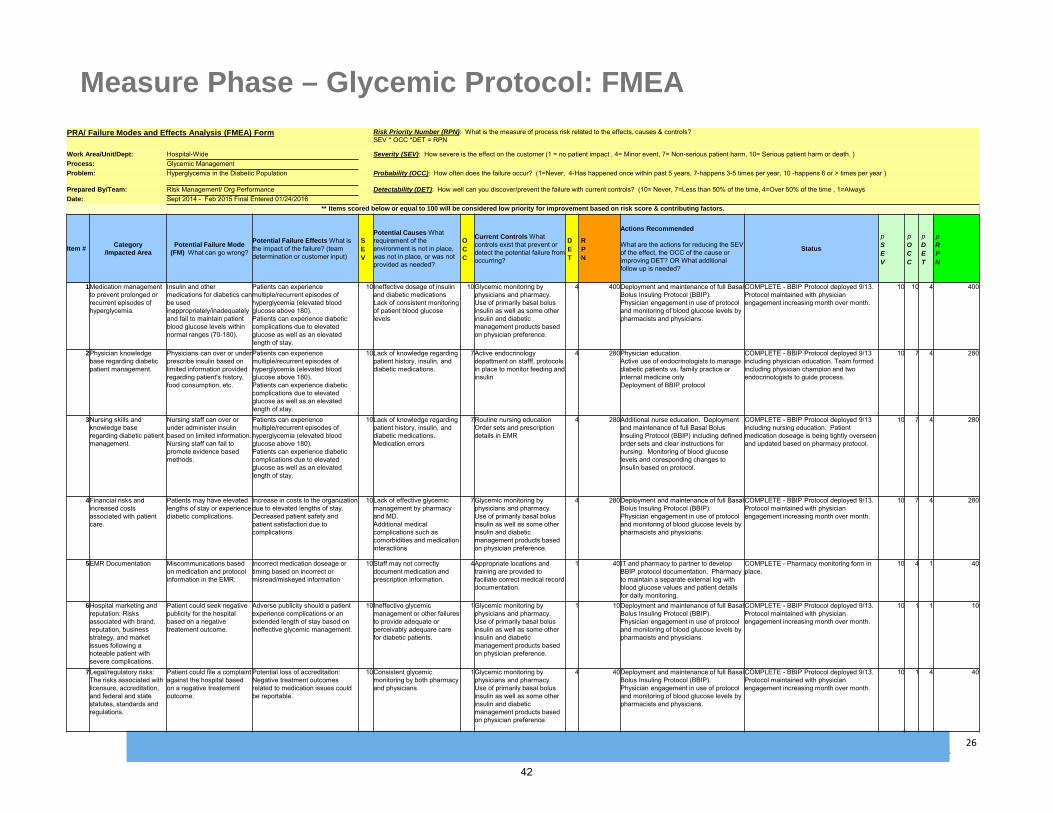
Measure Phase – Glycemic Protocol: FMEA
PRA/ Failure Modes and Effects Analysis (FMEA) Form Risk Priority Number (RPN): What is the measure of process risk related to the effects, causes & controls? SEV * OCC *DET = RPN
Work Area/Unit/Dept: Hospital-Wide Severity (SEV): How severe is the effect on the customer (1 = no patient impact , 4= Minor event, 7= Non-serious patient harm, 10= Serious patient harm or death. ) Process: Glycemic ManagementProblem: Hyperglycemia in the Diabetic Population Probability (OCC): How often does the failure occur? (1=Never, 4-Has happened once within past 5 years, 7-happens 3-5 times per year, 10 -happens 6 or > times per year )
Prepared By/Team: Risk Management/ Org Performance Detectability (DET): How well can you discover/prevent the failure with current controls? (10= Never, 7=Less than 50% of the time, 4=Over 50% of the time , 1=AlwaysDate: Sept 2014 - Feb 2015 Final Entered 01/24/2016
** Items scored below or equal to 100 will be considered low priority for improvement based on risk score & contributing factors.
Item #Category
/Impacted AreaPotential Failure Mode
(FM) What can go wrong?
Potential Failure Effects What is the impact of the failure? (team determination or customer input)
SEV
Potential Causes What requirement of the environment is not in place, was not in place, or was not provided as needed?
OCC
Current Controls What controls exist that prevent or detect the potential failure from occurring?
DET
RPN
Actions Recommended
What are the actions for reducing the SEV of the effect, the OCC of the cause or improving DET? OR What additional follow up is needed?
Status
pSEV
pOCC
pDET
pRPN
1Medication management to prevent prolonged or recurrent episodes of hyperglycemia.
Insulin and other medications for diabetics can be used inappropriately/inadequately and fail to maintain patient blood glucose levels within normal ranges (70-180).
Patients can experience multiple/recurrent episodes of hyperglycemia (elevated blood glucose above 180).Patients can experience diabetic complications due to elevated glucose as well as an elevated length of stay.
10Ineffective dosage of insulin and diabetic medicationsLack of consistent monitoring of patient blood glucose levels
10Glycemic monitoring by physicians and pharmacy. Use of primarily basal bolus insulin as well as some other insulin and diabetic management products based on physician preference.
4 400Deployment and maintenance of full Basal Bolus Insuling Protocol (BBIP).Physician engagement in use of protocol and monitoring of blood glucose levels by pharmacists and physicians.
COMPLETE - BBIP Protocol deployed 9/13. Protocol maintained with physician engagement increasing month over month.
10 10 4 400
2Physician knowledge base regarding diabetic patient management.
Physicians can over or under prescribe insulin based on limited information provided regarding patient's history, food consumption, etc.
Patients can experience multiple/recurrent episodes of hyperglycemia (elevated blood glucose above 180).Patients can experience diabetic complications due to elevated glucose as well as an elevated length of stay.
10Lack of knowledge regarding patient history, insulin, and diabetic medications.
7Active endocrinology depattment on stafff, protocols in place to monitor feeding and insulin
4 280Physician education. Active use of endocrinologists to manage diabetic patients vs. family practice or internal medicine onlyDeployment of BBIP protocol
COMPLETE - BBIP Protocol deployed 9/13 including physician education. Team formed including physician champion and two endocrinologists to guide process.
10 7 4 280
3Nursing skills and knowledge base regarding diabetic patient management.
Nursing staff can over or under administer insulin based on limited information. Nursing staff can fail to promote evidence based methods.
Patients can experience multiple/recurrent episodes of hyperglycemia (elevated blood glucose above 180).Patients can experience diabetic complications due to elevated glucose as well as an elevated length of stay.
10Lack of knowledge regarding patient history, insulin, and diabetic medications.Medication errors
7Routine nursing educationOrder sets and prescription details in EMR
4 280Additional nurse education. Deployment and maintenance of full Basal Bolus Insuling Protocol (BBIP) including defined order sets and clear instructions for nursing. Monitoring of blood glucose levels and coresponding changes to insulin based on protocol.
COMPLETE - BBIP Protocol deployed 9/13 including nursing education. Patient medication doseage is being tightly overseen and updated based on pharmacy protocol.
10 7 4 280
4Financial risks and increased costs associated with patient care.
Patients may have elevated lengths of stay or experience diabetic complications.
Increase in costs to the organization due to elevated lengths of stay.Decreased patient safety and patient satisfaction due to complications.
10Lack of effective glycemic management by pharmacy and MD. Additional medical complications such as comorbidities and medication interactions
7Glycemic monitoring by physicians and pharmacy. Use of primarily basal bolus insulin as well as some other insulin and diabetic management products based on physician preference.
4 280Deployment and maintenance of full Basal Bolus Insuling Protocol (BBIP).Physician engagement in use of protocol and monitoring of blood glucose levels by pharmacists and physicians.
COMPLETE - BBIP Protocol deployed 9/13. Protocol maintained with physician engagement increasing month over month.
10 7 4 280
5EMR Documentation Miscommunications based on medication and protocol information in the EMR.
Incorrect medication doseage or timing based on incorrect or misread/miskeyed information
10Staff may not correctly document medication and prescription information.
4Appropriate locations and training are provided to faciliate correct medical record documentation.
1 40IT and pharmacy to partner to develop BBIP protocol documentation. Pharmacy to maintain a separate external log with blood glucose values and patient details for daily monitoring.
COMPLETE - Pharmacy monitoring form in place.
10 4 1 40
6Hospital marketing and reputation: Risks associated with brand, reputation, business strategy, and market issues following a noteable patient with severe complications.
Patient could seek negative publicity for the hospital based on a negative treatement outcome.
Adverse publicity should a patient experience complications or an extended length of stay based on ineffective glycemic management.
10Ineffective glycemic management or other failures to provide adequate or perceivably adequare care for diabetic patients.
1Glycemic monitoring by physicians and pharmacy. Use of primarily basal bolus insulin as well as some other insulin and diabetic management products based on physician preference.
1 10Deployment and maintenance of full Basal Bolus Insuling Protocol (BBIP).Physician engagement in use of protocol and monitoring of blood glucose levels by pharmacists and physicians.
COMPLETE - BBIP Protocol deployed 9/13. Protocol maintained with physician engagement increasing month over month.
10 1 1 10
7Legal/regulatory risks: The risks associated with licensure, accreditation, and federal and state statutes, standards and regulations.
Patient could file a complaint against the hospital based on a negative treatement outcome.
Potential loss of accreditaiton: Negative treatment outcomes related to medication issues could be reportable.
10Consistent glycemic monitoring by both pharmacy and physicians
1Glycemic monitoring by physicians and pharmacy. Use of primarily basal bolus insulin as well as some other insulin and diabetic management products based on physician preference.
4 40Deployment and maintenance of full Basal Bolus Insuling Protocol (BBIP).Physician engagement in use of protocol and monitoring of blood glucose levels by pharmacists and physicians.
COMPLETE - BBIP Protocol deployed 9/13. Protocol maintained with physician engagement increasing month over month.
10 1 4 40
42
Rob Bryant Proprietary and Confidential 27
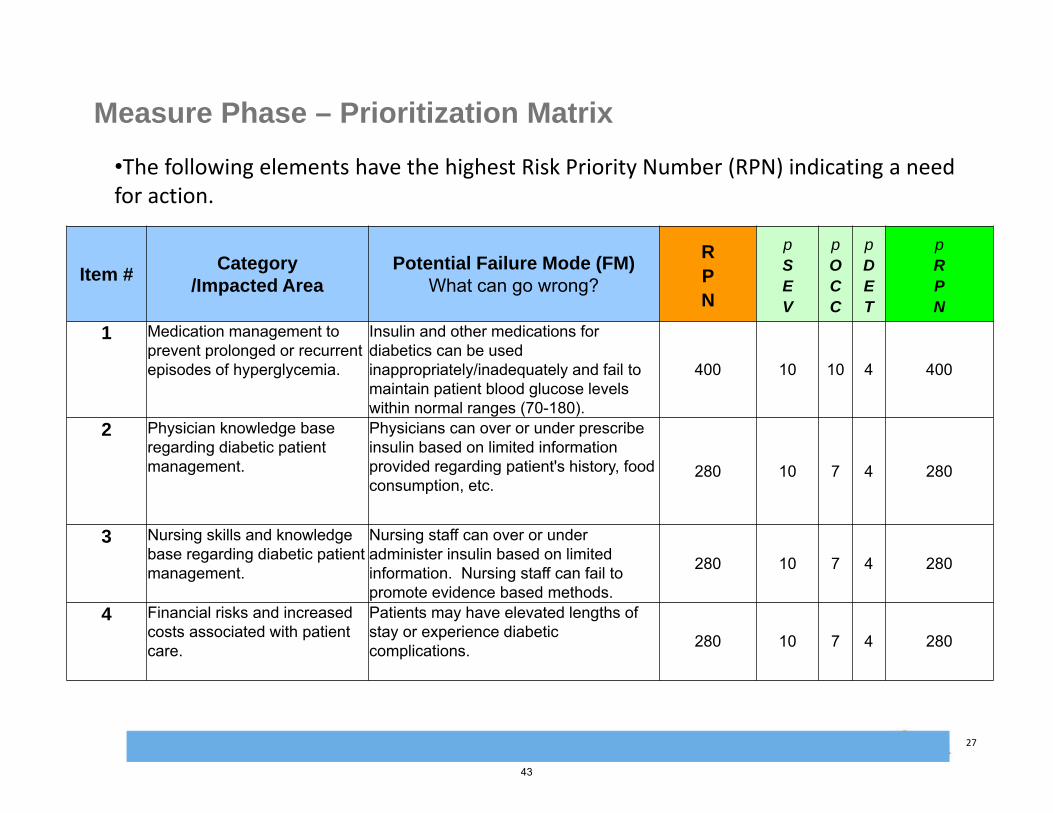
Measure Phase – Prioritization Matrix
Item #Category
/Impacted AreaPotential Failure Mode (FM)
What can go wrong?
RPN
pSEV
pOCC
pDET
pRPN
1 Medication management to prevent prolonged or recurrent episodes of hyperglycemia.
Insulin and other medications for diabetics can be used inappropriately/inadequately and fail to maintain patient blood glucose levels within normal ranges (70-180).
400 10 10 4 400
2 Physician knowledge base regarding diabetic patient management.
Physicians can over or under prescribe insulin based on limited information provided regarding patient's history, food consumption, etc.
280 10 7 4 280
3 Nursing skills and knowledge base regarding diabetic patient management.
Nursing staff can over or under administer insulin based on limited information. Nursing staff can fail to promote evidence based methods.
280 10 7 4 280
4 Financial risks and increased costs associated with patient care.
Patients may have elevated lengths of stay or experience diabetic complications. 280 10 7 4 280
•The following elements have the highest Risk Priority Number (RPN) indicating a need for action.
43

Rob Bryant Proprietary and Confidential 28
Measure Phase – Glycemic Management: Measure Baseline Performance and VOC Translation
CURRENT
COPQ: $ $ 212,688.00 per year
GOAL
COPQ: $0 of $212,688.00 (goal is to reduce the length of stay attributed to hyperglycemia in the algorithm shown prior)
Voice of the Customer
Key Issue CTQ Goal Y’s Potential X's
"We need to reduce the episodes of hyperglycemia in our diabetic patients"
Clinical effectiveness
CTQ #1 - Reduce the episodes of hyperglycemia in our diabetic patients
Goal #1 - Reduce the number of hyperglycemicepisodes following protocol initiation in target population by 30% compared to patients not on protocol
Y1 = the number of hyperglycemicepisodes experienced by patients on the protocol
X1 = Participation in BBIP program
X2 = Number of days participation in BBIP
X3 = Monitoring by whom
"We need to reduce the length of stay, complications, and readmissions of our diabetic patients"
Clinical effectiveness, $
/ Efficiency
CTQ #2 - Timeliness of safe patient discharge
Goal #2 - Reduce the average length of stay for the total population of diabetic patients on Medical Surgical and telemetry units by at least .345 days
Y2 = the average length of stay of diabetic patients on the medical surgical and telemetry units
X1 = Participation in BBIP program
X2 = Number of days participation in BBIP
X3 = Monitoring by whom
44

Rob Bryant Proprietary and Confidential 29
End of Phase ChecklistEnd of Phase Checklist
Start Date: Enter DateEnd Date: Enter Date
Operational Definitions Project Charter Cost of Poor Quality
(COPQ) Business Impact of
project Project Plan Customer CTQ’sHigh Level Process Map
(SIPOC)VOCHouse of Quality
Formal Champion Approval
Define Measure Analyze Improve Control
Start Date: Enter DateEnd Date: Enter Date
Start Date: Enter DateEnd Date: Enter Date
Start Date: Enter DateEnd Date: Enter Date
Not Complete Complete Not Applicable
Author: Valena Emery Date: 08/14/2014
All items are to be ticked off before being able to move into next phase. Each phase must be signed off by Project Sponsor and MBB
Measure Phase
Start Date: 09/01/2011End Date: 12/15/2011
Identify Project Y(s) and Xs (Y = f(xn))
Current state process maps
Data Collection PlanMSAEstablish Baseline Performance (i.e. Process Capability, Pareto charts)
Cause & Effect FMEAPriority Matrix
Formal Champion Approval
Start Date: 12/16/2011End Date: 03/23/2012
45
Rob Bryant Proprietary and Confidential 30
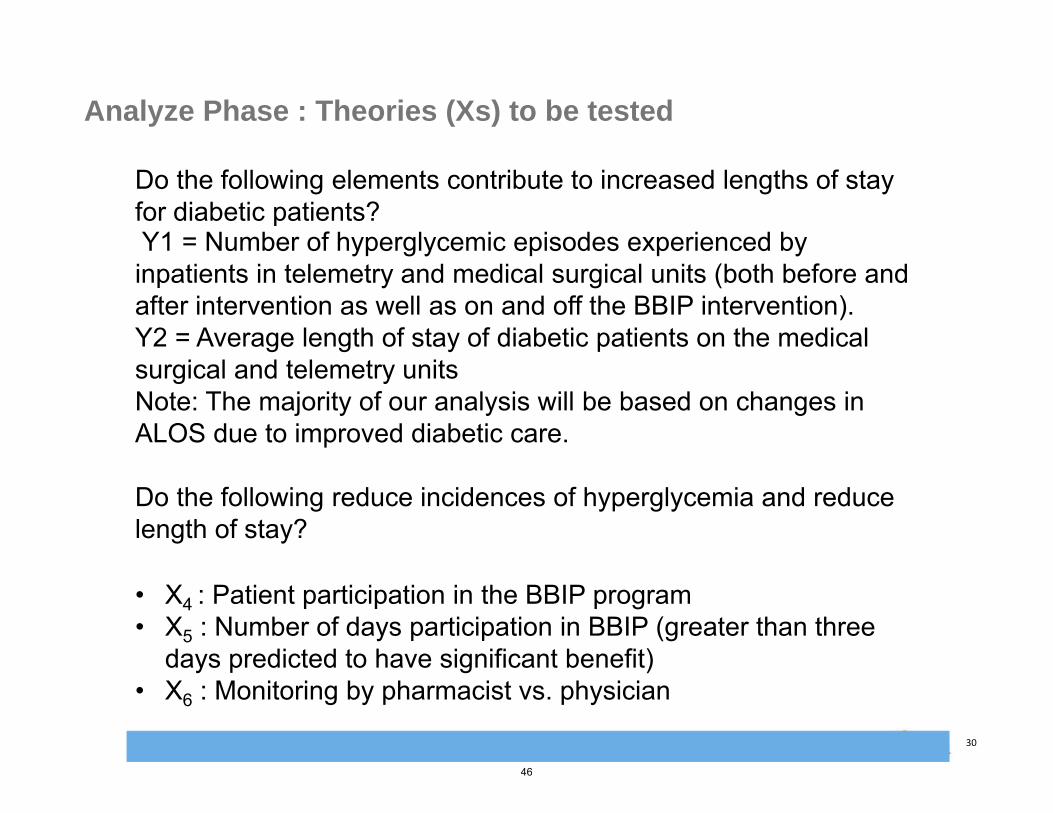
Analyze Phase : Theories (Xs) to be tested
Do the following elements contribute to increased lengths of stay for diabetic patients?Y1 = Number of hyperglycemic episodes experienced by inpatients in telemetry and medical surgical units (both before and after intervention as well as on and off the BBIP intervention). Y2 = Average length of stay of diabetic patients on the medical surgical and telemetry unitsNote: The majority of our analysis will be based on changes in ALOS due to improved diabetic care.
Do the following reduce incidences of hyperglycemia and reduce length of stay?
• X4 : Patient participation in the BBIP program• X5 : Number of days participation in BBIP (greater than three
days predicted to have significant benefit)• X6 : Monitoring by pharmacist vs. physician
46
Rob Bryant Proprietary and Confidential 31
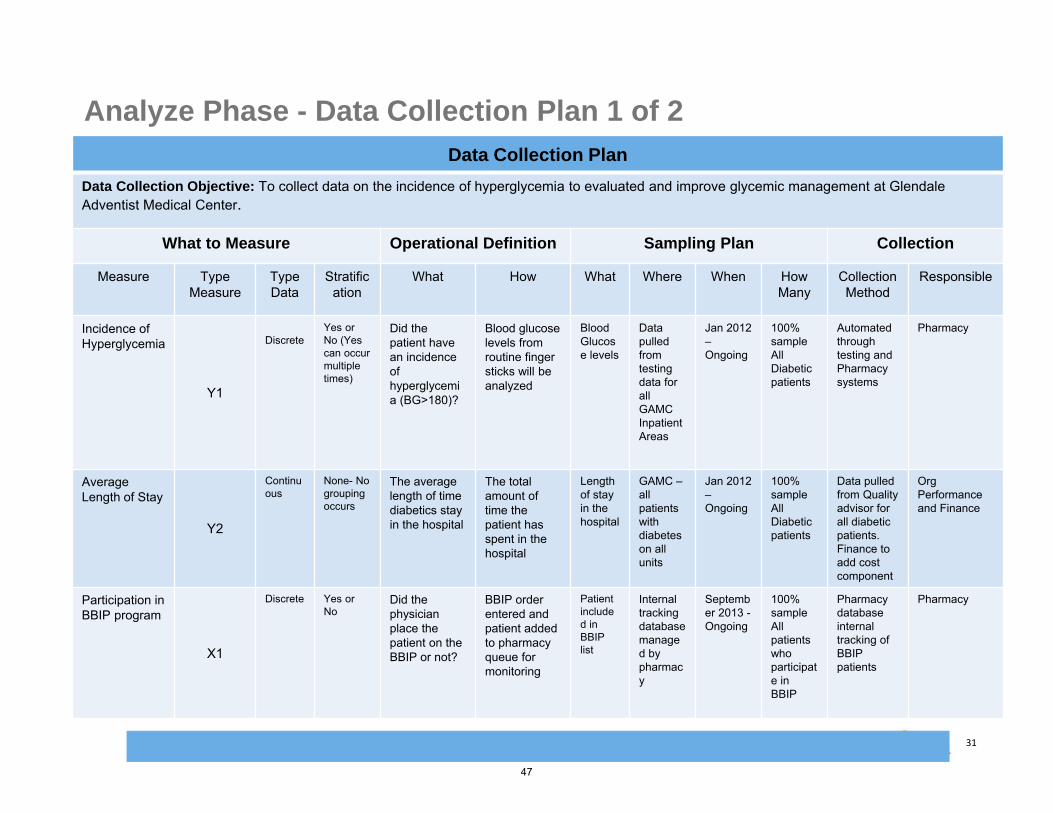
Analyze Phase - Data Collection Plan 1 of 2
T-test
Data Collection Plan
Data Collection Objective: To collect data on the incidence of hyperglycemia to evaluated and improve glycemic management at Glendale Adventist Medical Center.
What to Measure Operational Definition Sampling Plan Collection
Measure Type Measure
Type Data
Stratification
What How What Where When How Many
Collection Method
Responsible
Incidence of Hyperglycemia
Y1
DiscreteYes or No (Yescan occur multiple times)
Did the patient have an incidence of hyperglycemia (BG>180)?
Blood glucose levels from routine finger sticks will be analyzed
Blood Glucose levels
Datapulled from testing data for all GAMCInpatient Areas
Jan 2012 –Ongoing
100% sample All Diabetic patients
Automated throughtesting and Pharmacy systems
Pharmacy
AverageLength of Stay
Y2
Continuous
None- No grouping occurs
The average length of time diabetics stay in the hospital
The totalamount of time the patient has spent in the hospital
Length of stay in the hospital
GAMC –all patients with diabetes on all units
Jan 2012 –Ongoing
100% sample All Diabetic patients
Data pulled from Quality advisor for all diabetic patients. Finance to add cost component
Org Performance and Finance
Participation in BBIP program
X1
Discrete Yes or No
Did the physician place the patient on the BBIP or not?
BBIP order entered and patient added to pharmacy queue for monitoring
Patient included inBBIP list
Internal trackingdatabase managed by pharmacy
September 2013 -Ongoing
100% sample All patients who participate in BBIP
Pharmacy database internal tracking of BBIP patients
Pharmacy
47
Rob Bryant Proprietary and Confidential 32
Analyze Phase - Data Collection Plan 2 of 2
T-test
Data Collection Plan
Data Collection Objective: To collect data on the incidence of hyperglycemia to evaluated and improve glycemic management at Glendale Adventist Medical Center.
What to Measure Operational Definition Sampling Plan Collection
Measure Type Measure
Type Data
Stratification
What How What Where When How Many
Collection Method
Responsible
Number of days participation in BBIP X2
Discrete Daily Total (greaterthan three days is active participation)
For how many days was the patient on BBIP?
BBIP order entered and patient added to pharmacy queue for monitoring
Patient included in BBIP list
Internal trackingdatabase managed by pharmacy
September 2013 -Ongoing
100% sample ofall patients who participate in BBIP
Pharmacy database internal tracking of BBIP patients
Pharmacy
Monitoring by whom
X3
Discrete Pharmacist or Physician only
Who monitorspatient while on BBIP? (given limited likelihood of physician monitoring)
Patient may be monitored by pharmacyor physician only per physician order
Trackpatients by who is monitoring per order
Internal trackingdatabase managed by pharmacy
September 2013 -Ongoing
100% sample ofall patients who participate in BBIP
Pharmacy database internal tracking of BBIP patients
Pharmacy
Rate of PSI-10 (Metabolic Derangement) Y3 –
Down stream
Discrete Yes or No What is the rate of post-op metabolic derangement?
PSI rate captured through coding submitted through Cerner and Premier
Rate of patients withmetabolic derangement (%)
GAMC –all patients with diabetes on all units
Jan 2012 –Ongoing
100% sample All inpatients
Data pulled from Quality advisor for all diabetic patients.
Org Performance
48
Rob Bryant Proprietary and Confidential 33
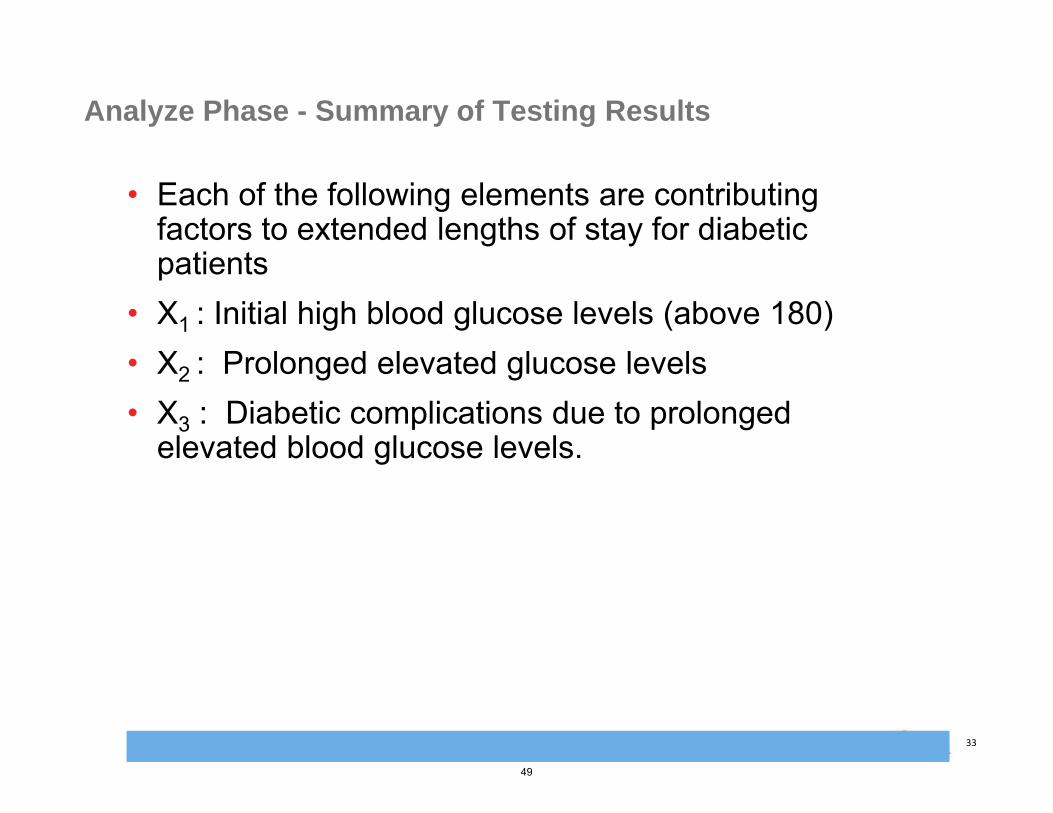
Analyze Phase - Summary of Testing Results
• Each of the following elements are contributing factors to extended lengths of stay for diabetic patients
• X1 : Initial high blood glucose levels (above 180)• X2 : Prolonged elevated glucose levels• X3 : Diabetic complications due to prolonged
elevated blood glucose levels.
49

Rob Bryant Proprietary and Confidential 34
Analyze Phase - Vital Few X’s for CTQ #2
Note: CTQ #1 is an input (X) for our ultimate CTQ #2
• Y = Diabetic Patient Length of Stay– Y = f (X1, X2, X3, X4, X5, X6)
Vital Few Xs are:• X1 : Initial high blood glucose levels (above 180)• X2 : Prolonged elevated glucose levels• X3 : Diabetic complications due to prolonged elevated blood glucose levels.
Mitigated by our strategies:• X4 : Patient participation in the BBIP program
• ***reductions illustrated in graphs on slides 55, 59, and 61• X5 : Number of days participation in BBIP (greater than three days predicted to have
significant benefit) • ***sizeable reductions after 3 days of BBIP illustrated in graphs on slides 53-54
• X6 : Monitoring by pharmacist vs. physician • ***see Chi square test on pages 66 and 67 illustrating better monitoring with less
chance of hypoglycemic when monitored by pharmacist vs. physician only
50
Rob Bryant Proprietary and Confidential 35
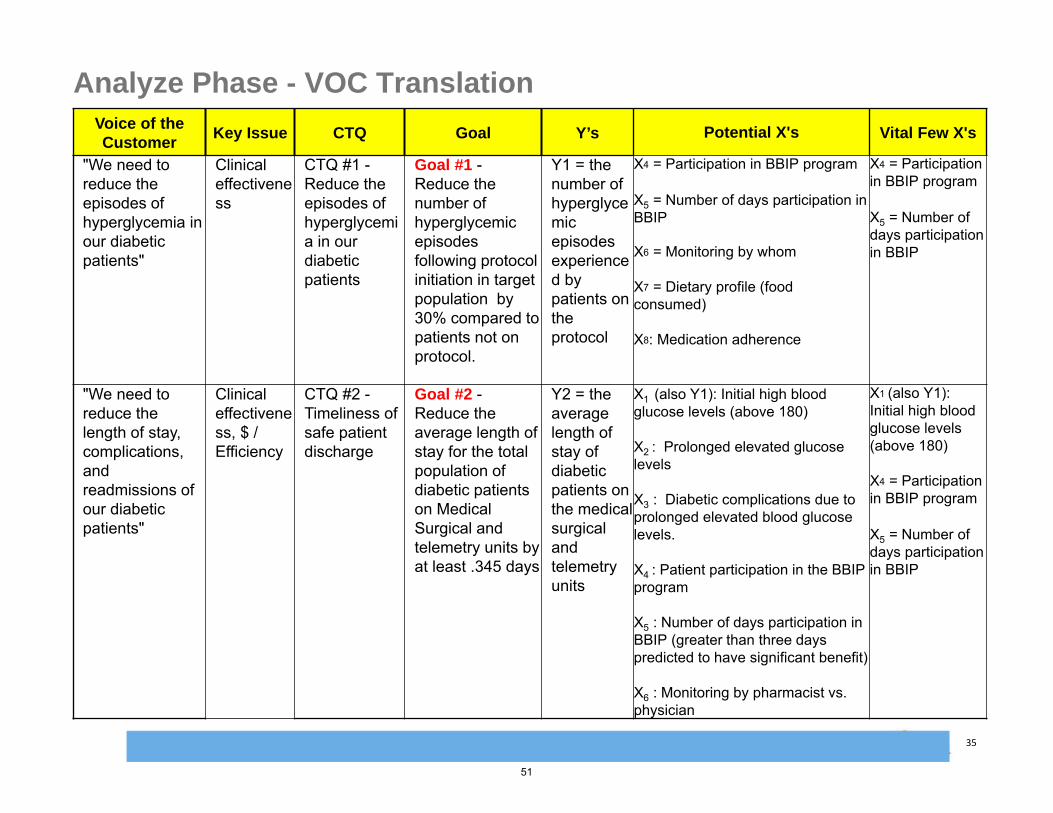
Analyze Phase - VOC TranslationVoice of the Customer
Key Issue CTQ Goal Y’s Potential X's Vital Few X's
"We need to reduce the episodes of hyperglycemia in our diabetic patients"
Clinical effectiveness
CTQ #1 -Reduce the episodes of hyperglycemia in our diabetic patients
Goal #1 -Reduce the number of hyperglycemicepisodes following protocol initiation in target population by 30% compared to patients not on protocol.
Y1 = the number of hyperglycemicepisodes experienced by patients on the protocol
X4 = Participation in BBIP program
X5 = Number of days participation in BBIP
X6 = Monitoring by whom
X7 = Dietary profile (food consumed)
X8: Medication adherence
X4 = Participation in BBIP program
X5 = Number of days participation in BBIP
"We need to reduce the length of stay, complications, and readmissions of our diabetic patients"
Clinical effectiveness, $ / Efficiency
CTQ #2 -Timeliness of safe patient discharge
Goal #2 -Reduce the average length of stay for the total population of diabetic patients on Medical Surgical and telemetry units by at least .345 days
Y2 = the average length of stay of diabetic patients on the medical surgical and telemetry units
X1 (also Y1): Initial high blood glucose levels (above 180)
X2 : Prolonged elevated glucose levels
X3 : Diabetic complications due to prolonged elevated blood glucose levels.
X4 : Patient participation in the BBIP program
X5 : Number of days participation in BBIP (greater than three days predicted to have significant benefit)
X6 : Monitoring by pharmacist vs. physician
X1 (also Y1): Initial high blood glucose levels (above 180)
X4 = Participation in BBIP program
X5 = Number of days participation in BBIP
51
Rob Bryant Proprietary and Confidential 36
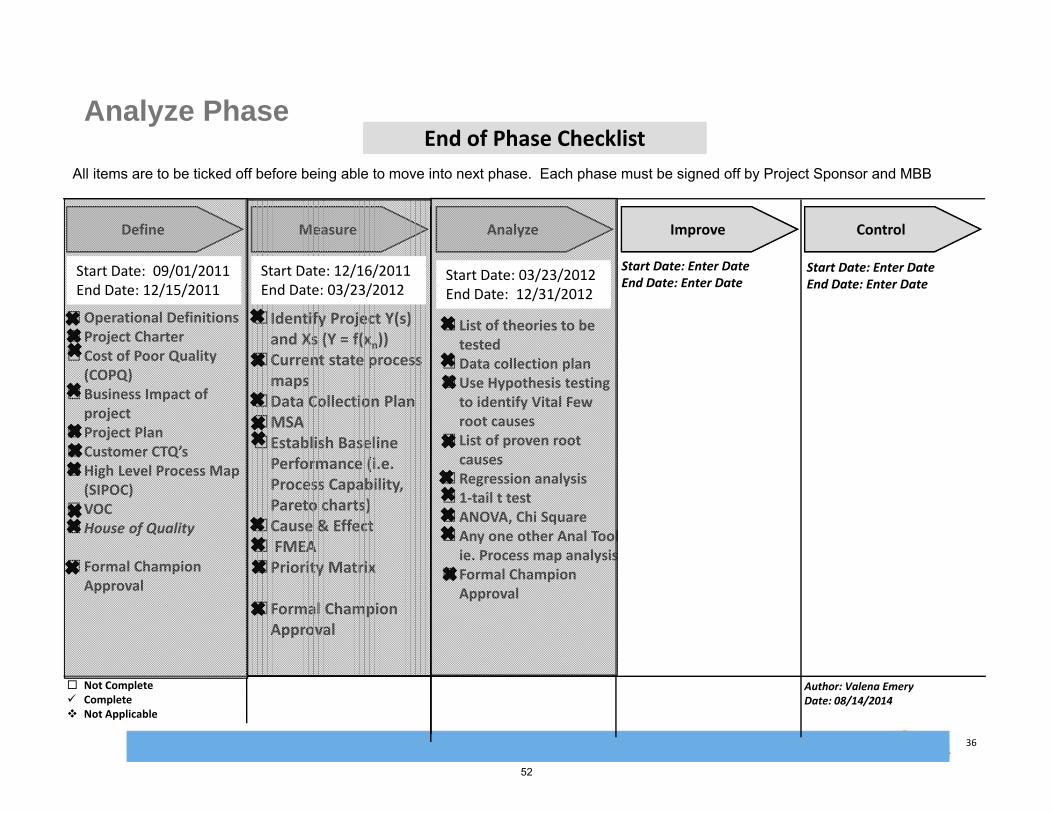
End of Phase ChecklistEnd of Phase Checklist
Start Date: Enter DateEnd Date: Enter Date
Operational Definitions Project Charter Cost of Poor Quality
(COPQ) Business Impact of
project Project Plan Customer CTQ’sHigh Level Process Map
(SIPOC)VOCHouse of Quality
Formal Champion Approval
Define Measure Analyze Improve Control
Start Date: Enter DateEnd Date: Enter Date
Start Date: Enter DateEnd Date: Enter Date
Start Date: Enter DateEnd Date: Enter Date
Not Complete Complete Not Applicable
Author: Valena Emery Date: 08/14/2014
All items are to be ticked off before being able to move into next phase. Each phase must be signed off by Project Sponsor and MBB
Analyze Phase
Start Date: 09/01/2011End Date: 12/15/2011
Identify Project Y(s) and Xs (Y = f(xn))
Current state process maps
Data Collection PlanMSAEstablish Baseline Performance (i.e. Process Capability, Pareto charts)
Cause & Effect FMEAPriority Matrix
Formal Champion Approval
Start Date: 12/16/2011End Date: 03/23/2012
Start Date: Enter DateEnd Date: Enter Date
List of theories to be tested
Data collection planUse Hypothesis testing
to identify Vital Few root causes
List of proven root causes
Regression analysis 1‐tail t testANOVA, Chi SquareAny one other Anal Tool
ie. Process map analysis Formal Champion
Approval
Start Date: 03/23/2012End Date: 12/31/2012
52
Rob Bryant Proprietary and Confidential 37
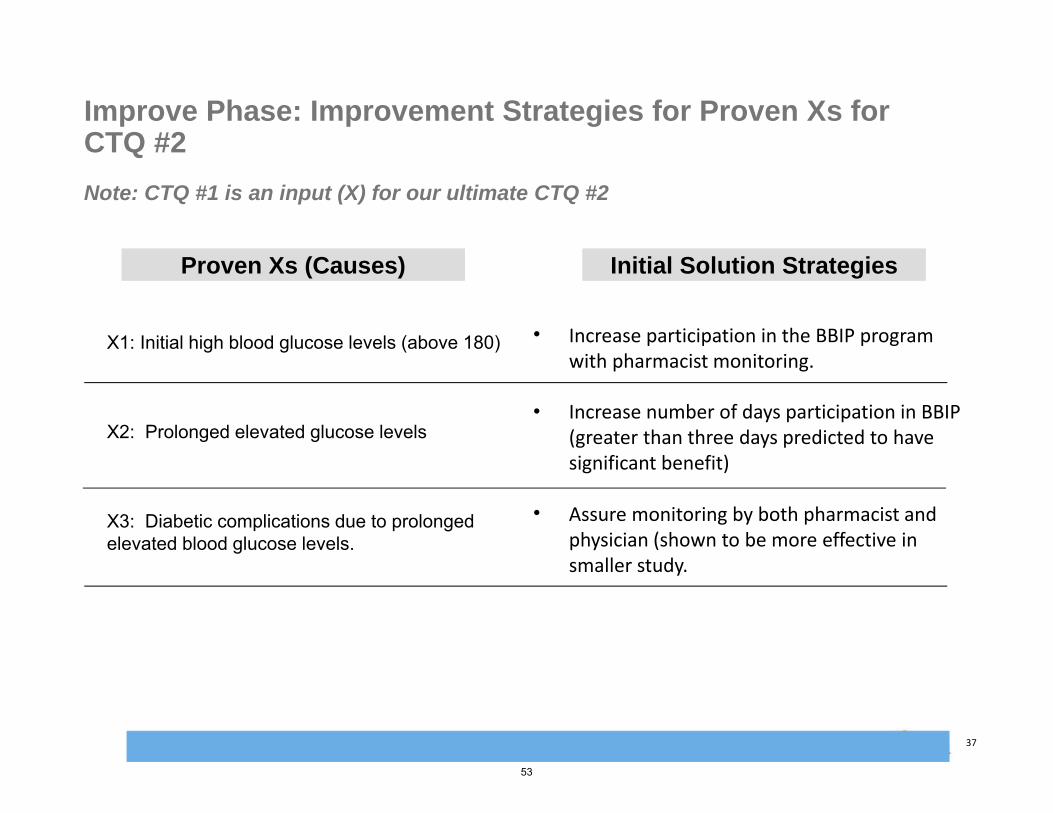
Improve Phase: Improvement Strategies for Proven Xs for CTQ #2
Note: CTQ #1 is an input (X) for our ultimate CTQ #2
Initial Solution StrategiesInitial Solution StrategiesProven Xs (Causes)Proven Xs (Causes)
X1: Initial high blood glucose levels (above 180)
X2: Prolonged elevated glucose levels
X3: Diabetic complications due to prolonged elevated blood glucose levels.
• Increase participation in the BBIP program with pharmacist monitoring.
• Increase number of days participation in BBIP (greater than three days predicted to have significant benefit)
• Assure monitoring by both pharmacist and physician (shown to be more effective in smaller study.
53
Rob Bryant Proprietary and Confidential 38
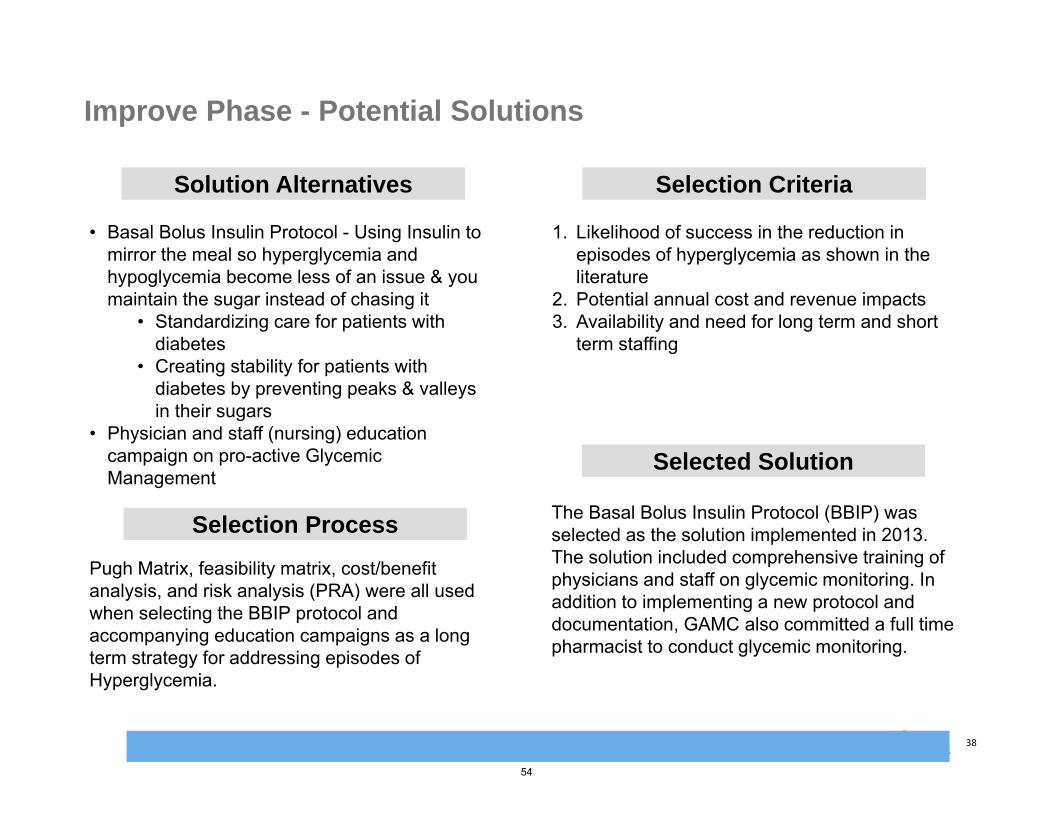
Improve Phase - Potential Solutions
Selection CriteriaSelection CriteriaSolution AlternativesSolution Alternatives
• Basal Bolus Insulin Protocol - Using Insulin to mirror the meal so hyperglycemia and hypoglycemia become less of an issue & you maintain the sugar instead of chasing it
• Standardizing care for patients with diabetes
• Creating stability for patients with diabetes by preventing peaks & valleys in their sugars
• Physician and staff (nursing) education campaign on pro-active Glycemic Management
1. Likelihood of success in the reduction in episodes of hyperglycemia as shown in the literature
2. Potential annual cost and revenue impacts3. Availability and need for long term and short
term staffing
Selected SolutionSelected Solution
The Basal Bolus Insulin Protocol (BBIP) was selected as the solution implemented in 2013. The solution included comprehensive training of physicians and staff on glycemic monitoring. In addition to implementing a new protocol and documentation, GAMC also committed a full time pharmacist to conduct glycemic monitoring.
Selection ProcessSelection Process
Pugh Matrix, feasibility matrix, cost/benefit analysis, and risk analysis (PRA) were all used when selecting the BBIP protocol and accompanying education campaigns as a long term strategy for addressing episodes of Hyperglycemia.
54
Rob Bryant Proprietary and Confidential 39
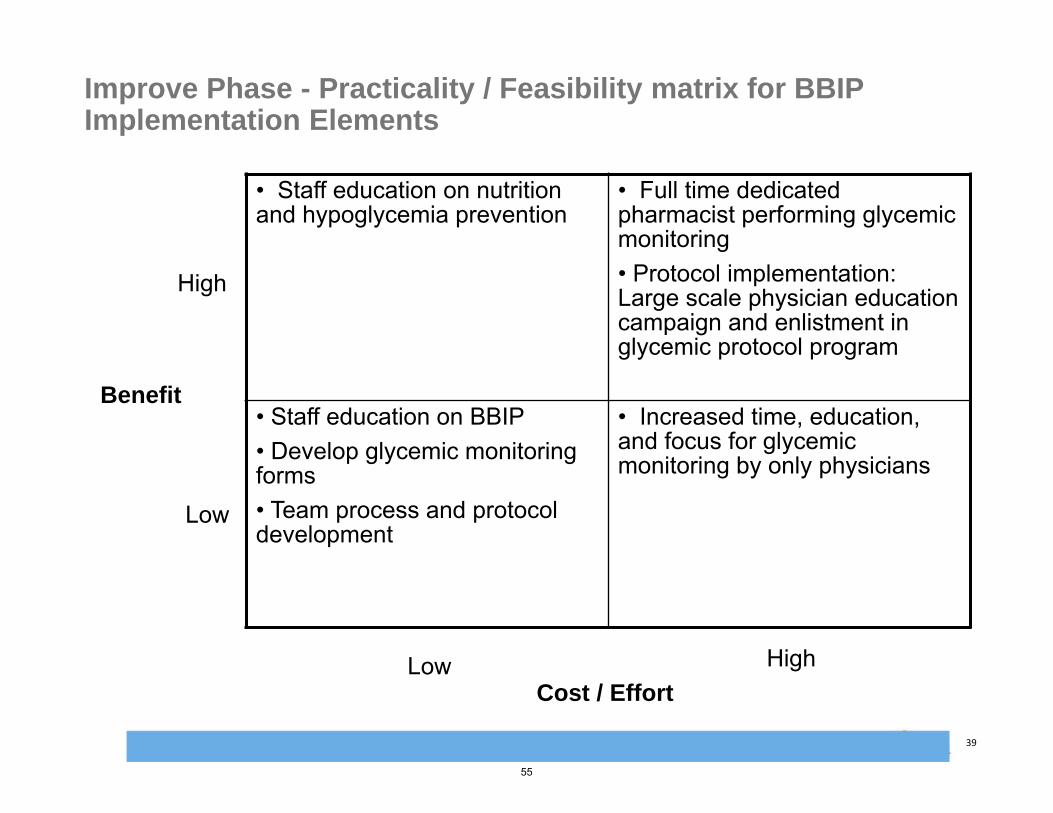
Improve Phase - Practicality / Feasibility matrix for BBIP Implementation Elements
• Staff education on nutrition and hypoglycemia prevention
• Full time dedicated pharmacist performing glycemic monitoring• Protocol implementation: Large scale physician education campaign and enlistment in glycemic protocol program
• Staff education on BBIP• Develop glycemic monitoring forms• Team process and protocol development
• Increased time, education, and focus for glycemic monitoring by only physicians
Cost / EffortLow
Low
High
High
Benefit
55
Rob Bryant Proprietary and Confidential 40
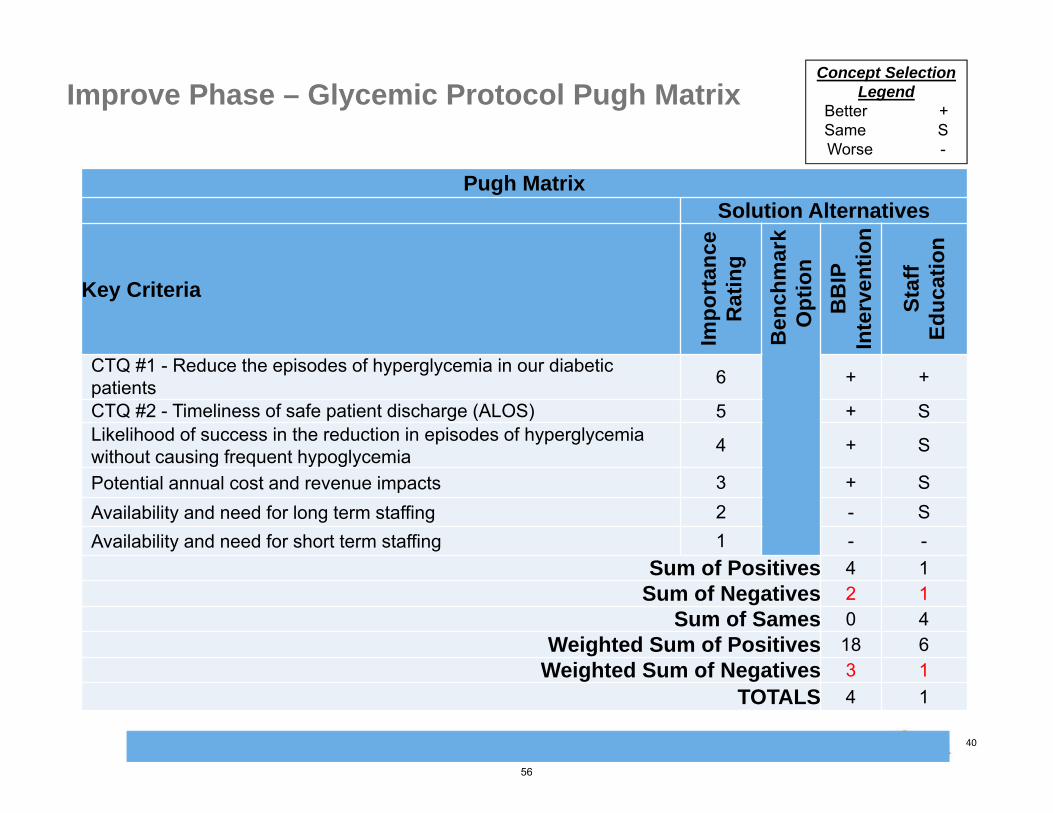
Improve Phase – Glycemic Protocol Pugh Matrix
Pugh MatrixSolution Alternatives
Key Criteria
Imp
ort
ance
R
atin
g
Ben
chm
ark
Op
tio
n
BB
IPIn
terv
enti
on
Sta
ff
Ed
uca
tio
n
CTQ #1 - Reduce the episodes of hyperglycemia in our diabetic patients 6 + +
CTQ #2 - Timeliness of safe patient discharge (ALOS) 5 + SLikelihood of success in the reduction in episodes of hyperglycemiawithout causing frequent hypoglycemia 4 + S
Potential annual cost and revenue impacts 3 + SAvailability and need for long term staffing 2 - SAvailability and need for short term staffing 1 - -
Sum of Positives 4 1Sum of Negatives 2 1
Sum of Sames 0 4Weighted Sum of Positives 18 6
Weighted Sum of Negatives 3 1TOTALS 4 1
Concept Selection Legend
Better +Same SWorse -
56
Rob Bryant Proprietary and Confidential 41
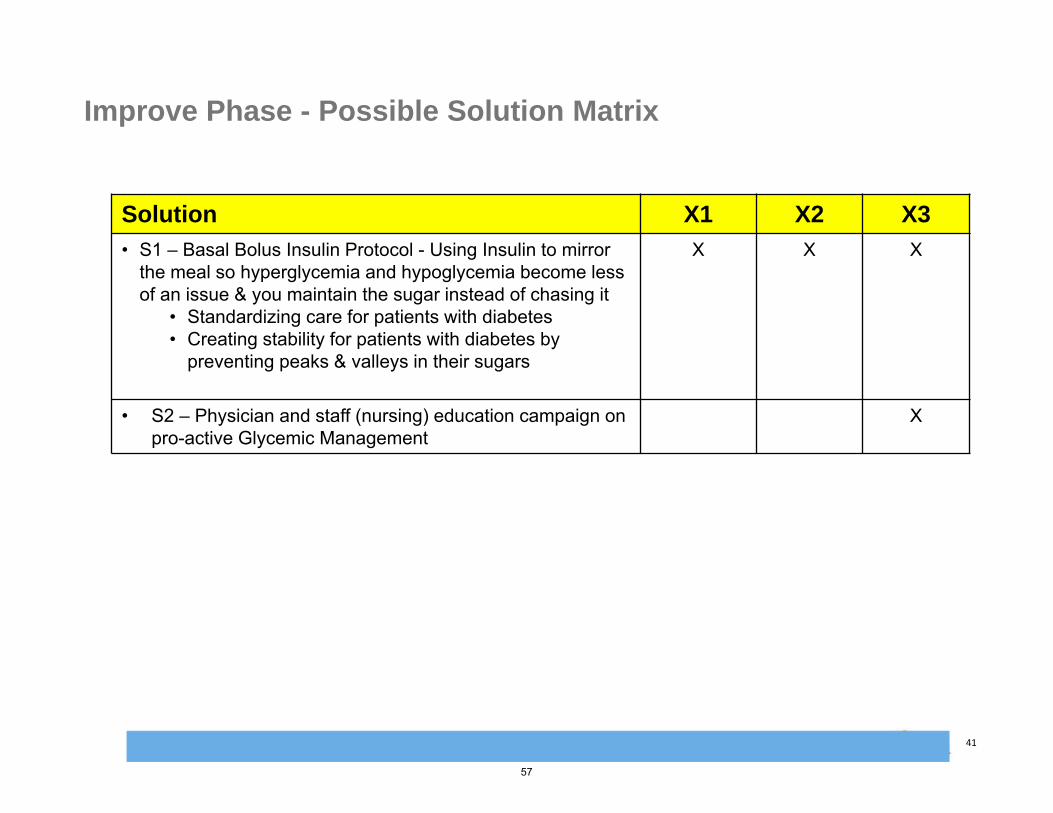
Improve Phase - Possible Solution Matrix
Solution X1 X2 X3
• S1 – Basal Bolus Insulin Protocol - Using Insulin to mirror the meal so hyperglycemia and hypoglycemia become less of an issue & you maintain the sugar instead of chasing it
• Standardizing care for patients with diabetes• Creating stability for patients with diabetes by
preventing peaks & valleys in their sugars
X X X
• S2 – Physician and staff (nursing) education campaign on pro-active Glycemic Management
X
57
Rob Bryant Proprietary and Confidential 42
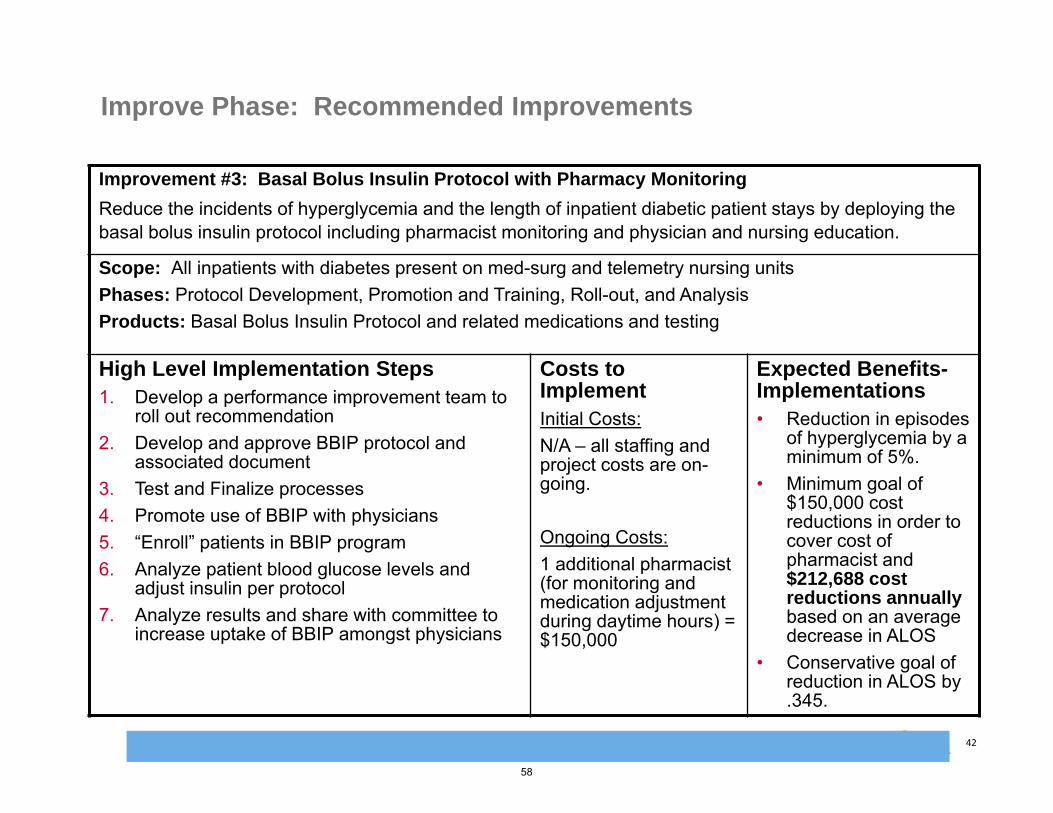
Improve Phase: Recommended Improvements
Improvement #3: Basal Bolus Insulin Protocol with Pharmacy Monitoring
Reduce the incidents of hyperglycemia and the length of inpatient diabetic patient stays by deploying the basal bolus insulin protocol including pharmacist monitoring and physician and nursing education.
Scope: All inpatients with diabetes present on med-surg and telemetry nursing unitsPhases: Protocol Development, Promotion and Training, Roll-out, and Analysis Products: Basal Bolus Insulin Protocol and related medications and testing
High Level Implementation Steps1. Develop a performance improvement team to
roll out recommendation2. Develop and approve BBIP protocol and
associated document3. Test and Finalize processes4. Promote use of BBIP with physicians5. “Enroll” patients in BBIP program6. Analyze patient blood glucose levels and
adjust insulin per protocol7. Analyze results and share with committee to
increase uptake of BBIP amongst physicians
Costs to ImplementInitial Costs:N/A – all staffing and project costs are on-going.
Ongoing Costs:1 additional pharmacist (for monitoring and medication adjustment during daytime hours) = $150,000
Expected Benefits-Implementations• Reduction in episodes
of hyperglycemia by a minimum of 5%.
• Minimum goal of $150,000 cost reductions in order to cover cost of pharmacist and $212,688 cost reductions annually based on an average decrease in ALOS
• Conservative goal of reduction in ALOS by .345.
58
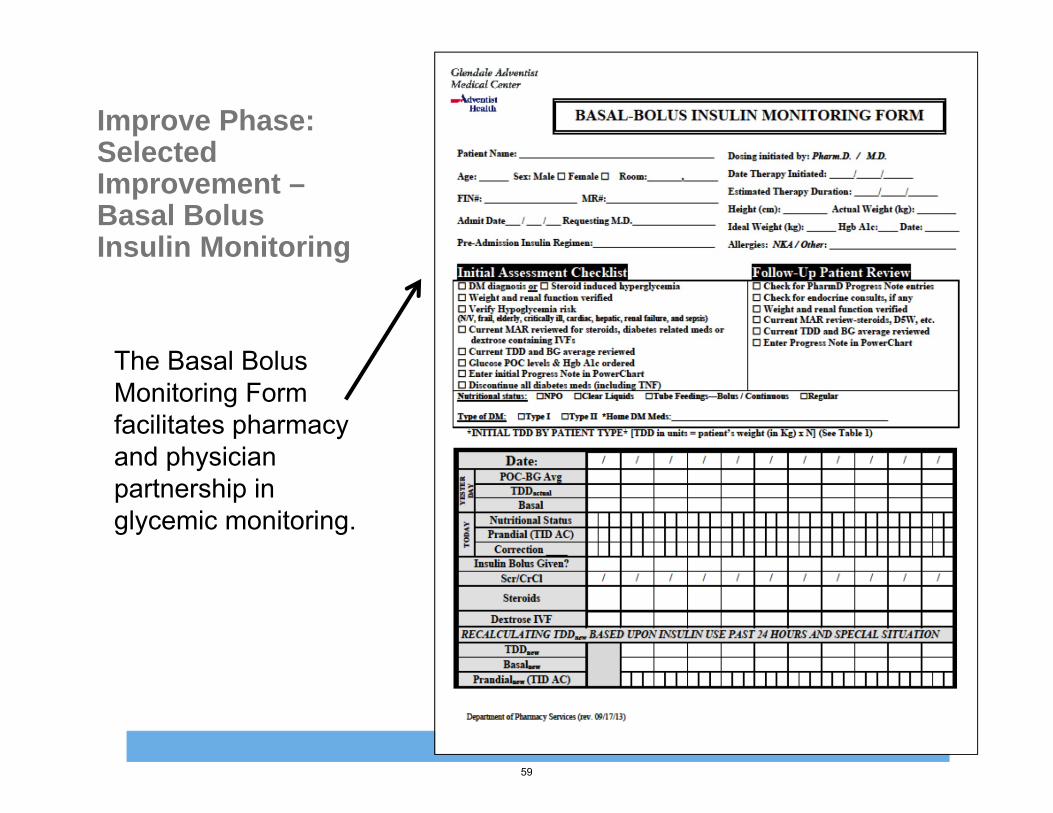
Rob Bryant Proprietary and Confidential 43
Improve Phase: Selected Improvement –Basal Bolus Insulin Monitoring
The Basal Bolus Monitoring Form facilitates pharmacy and physician partnership in glycemic monitoring.
59
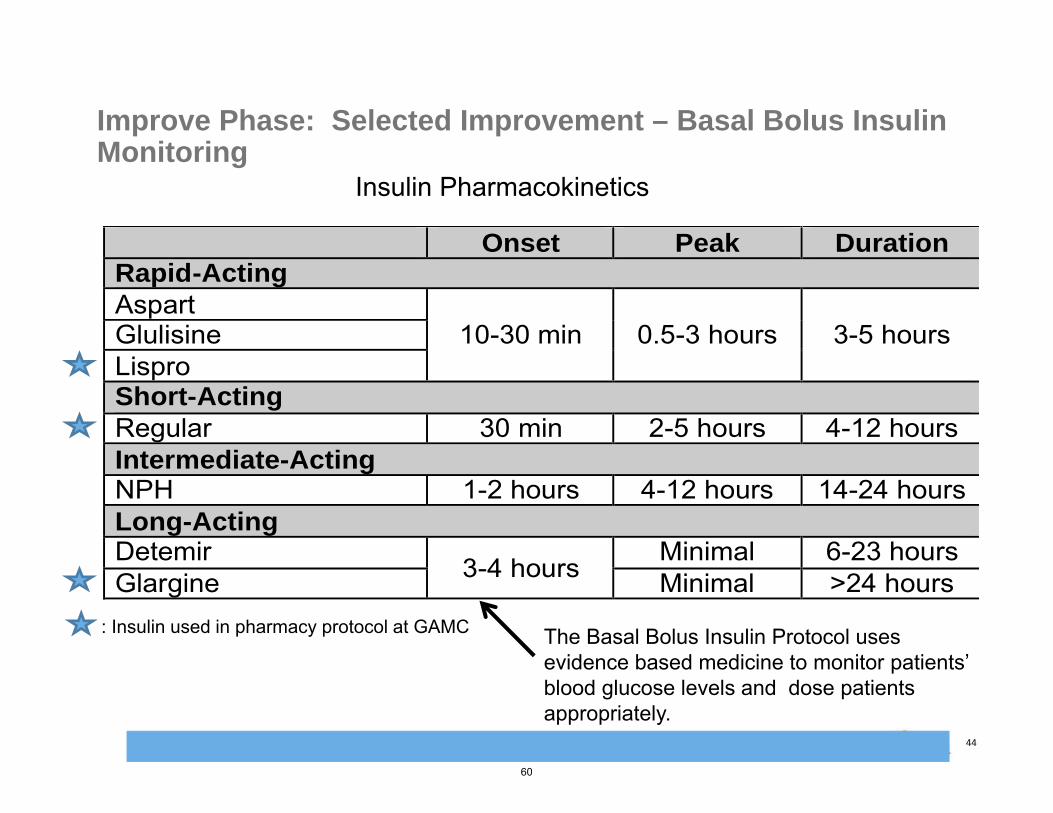
Rob Bryant Proprietary and Confidential 44
Improve Phase: Selected Improvement – Basal Bolus Insulin Monitoring
The Basal Bolus Insulin Protocol uses evidence based medicine to monitor patients’ blood glucose levels and dose patients appropriately.
Insulin Pharmacokinetics
Onset Peak Duration Rapid-Acting Aspart
10-30 min 0.5-3 hours 3-5 hours Glulisine Lispro Short-Acting Regular 30 min 2-5 hours 4-12 hours Intermediate-Acting NPH 1-2 hours 4-12 hours 14-24 hours Long-Acting Detemir 3-4 hours Minimal 6-23 hours Glargine Minimal >24 hours
: Insulin used in pharmacy protocol at GAMC
60

Rob Bryant Proprietary and Confidential 45
Pre-implementation Workflow – Prior to Glycemic Management Protocol
61
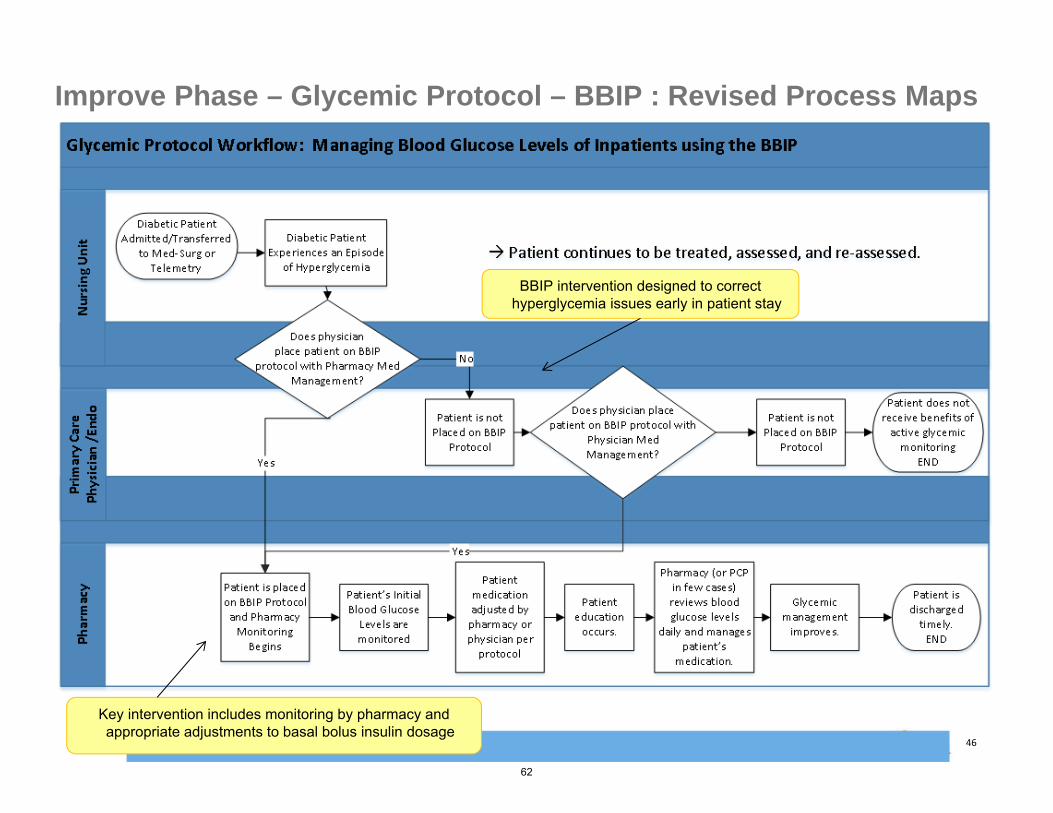
Rob Bryant Proprietary and Confidential 46
Improve Phase – Glycemic Protocol – BBIP : Revised Process Maps
Key intervention includes monitoring by pharmacy and appropriate adjustments to basal bolus insulin dosage
BBIP intervention designed to correct hyperglycemia issues early in patient stay
62
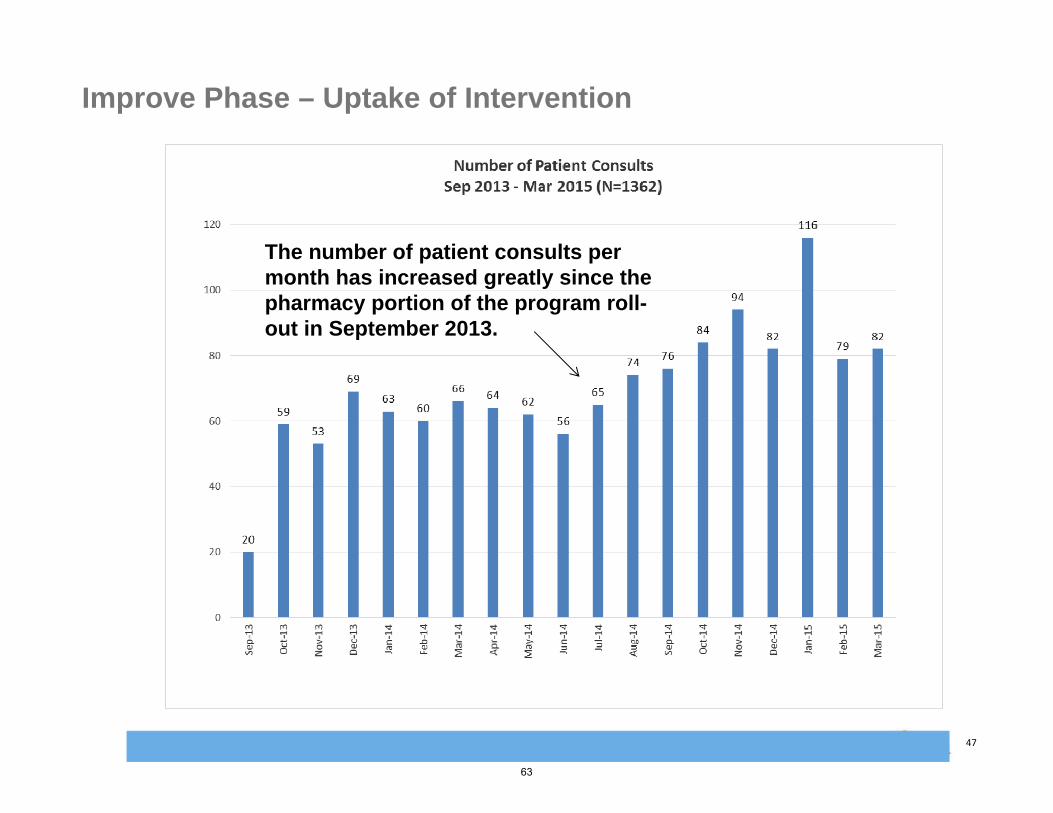
Rob Bryant Proprietary and Confidential 47
Improve Phase – Uptake of Intervention
The number of patient consults per month has increased greatly since the pharmacy portion of the program roll-out in September 2013.
63
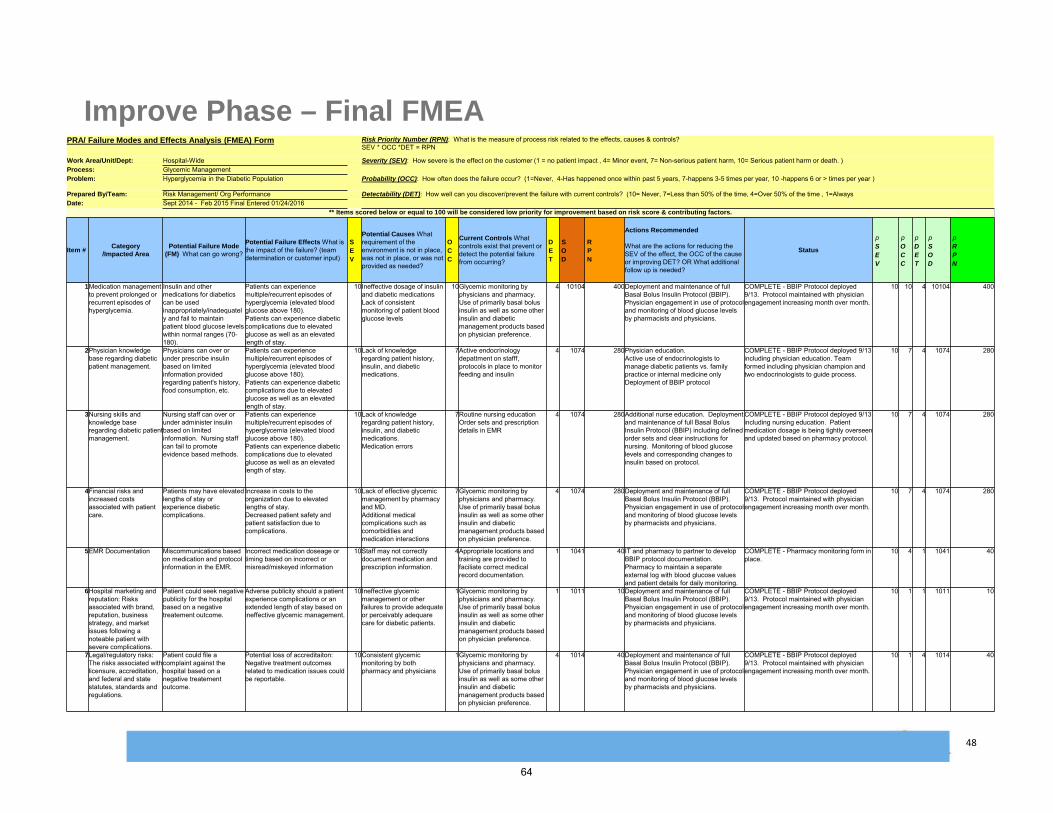
Rob Bryant Proprietary and Confidential 48
Improve Phase – Final FMEAPRA/ Failure Modes and Effects Analysis (FMEA) Form Risk Priority Number (RPN): What is the measure of process risk related to the effects, causes & controls?
SEV * OCC *DET = RPN
Work Area/Unit/Dept: Hospital-Wide Severity (SEV): How severe is the effect on the customer (1 = no patient impact , 4= Minor event, 7= Non-serious patient harm, 10= Serious patient harm or death. ) Process: Glycemic ManagementProblem: Hyperglycemia in the Diabetic Population Probability (OCC): How often does the failure occur? (1=Never, 4-Has happened once within past 5 years, 7-happens 3-5 times per year, 10 -happens 6 or > times per year )
Prepared By/Team: Risk Management/ Org Performance Detectability (DET): How well can you discover/prevent the failure with current controls? (10= Never, 7=Less than 50% of the time, 4=Over 50% of the time , 1=AlwaysDate: Sept 2014 - Feb 2015 Final Entered 01/24/2016
** Items scored below or equal to 100 will be considered low priority for improvement based on risk score & contributing factors.
Item #Category
/Impacted AreaPotential Failure Mode
(FM) What can go wrong?
Potential Failure Effects What is the impact of the failure? (team determination or customer input)
SEV
Potential Causes What requirement of the environment is not in place, was not in place, or was not provided as needed?
OCC
Current Controls What controls exist that prevent or detect the potential failure from occurring?
DET
SOD
RPN
Actions Recommended
What are the actions for reducing the SEV of the effect, the OCC of the cause or improving DET? OR What additional follow up is needed?
Status
pSEV
pOCC
pDET
pSOD
pRPN
1Medication management to prevent prolonged or recurrent episodes of hyperglycemia.
Insulin and other medications for diabetics can be used inappropriately/inadequately and fail to maintain patient blood glucose levels within normal ranges (70-180).
Patients can experience multiple/recurrent episodes of hyperglycemia (elevated blood glucose above 180).Patients can experience diabetic complications due to elevated glucose as well as an elevated length of stay.
10Ineffective dosage of insulin and diabetic medicationsLack of consistent monitoring of patient blood glucose levels
10Glycemic monitoring by physicians and pharmacy. Use of primarily basal bolus insulin as well as some other insulin and diabetic management products based on physician preference.
4 10104 400Deployment and maintenance of full Basal Bolus Insulin Protocol (BBIP).Physician engagement in use of protocol and monitoring of blood glucose levels by pharmacists and physicians.
COMPLETE - BBIP Protocol deployed 9/13. Protocol maintained with physician engagement increasing month over month.
10 10 4 10104 400
2Physician knowledge base regarding diabetic patient management.
Physicians can over or under prescribe insulin based on limited information provided regarding patient's history, food consumption, etc.
Patients can experience multiple/recurrent episodes of hyperglycemia (elevated blood glucose above 180).Patients can experience diabetic complications due to elevated glucose as well as an elevated length of stay.
10Lack of knowledge regarding patient history, insulin, and diabetic medications.
7Active endocrinology depattment on stafff, protocols in place to monitor feeding and insulin
4 1074 280Physician education. Active use of endocrinologists to manage diabetic patients vs. family practice or internal medicine onlyDeployment of BBIP protocol
COMPLETE - BBIP Protocol deployed 9/13 including physician education. Team formed including physician champion and two endocrinologists to guide process.
10 7 4 1074 280
3Nursing skills and knowledge base regarding diabetic patient management.
Nursing staff can over or under administer insulin based on limited information. Nursing staff can fail to promote evidence based methods.
Patients can experience multiple/recurrent episodes of hyperglycemia (elevated blood glucose above 180).Patients can experience diabetic complications due to elevated glucose as well as an elevated length of stay.
10Lack of knowledge regarding patient history, insulin, and diabetic medications.Medication errors
7Routine nursing educationOrder sets and prescription details in EMR
4 1074 280Additional nurse education. Deployment and maintenance of full Basal Bolus Insulin Protocol (BBIP) including defined order sets and clear instructions for nursing. Monitoring of blood glucose levels and corresponding changes to insulin based on protocol.
COMPLETE - BBIP Protocol deployed 9/13 including nursing education. Patient medication dosage is being tightly overseen and updated based on pharmacy protocol.
10 7 4 1074 280
4Financial risks and increased costs associated with patient care.
Patients may have elevated lengths of stay or experience diabetic complications.
Increase in costs to the organization due to elevated lengths of stay.Decreased patient safety and patient satisfaction due to complications.
10Lack of effective glycemic management by pharmacy and MD. Additional medical complications such as comorbidities and medication interactions
7Glycemic monitoring by physicians and pharmacy. Use of primarily basal bolus insulin as well as some other insulin and diabetic management products based on physician preference.
4 1074 280Deployment and maintenance of full Basal Bolus Insulin Protocol (BBIP).Physician engagement in use of protocol and monitoring of blood glucose levels by pharmacists and physicians.
COMPLETE - BBIP Protocol deployed 9/13. Protocol maintained with physician engagement increasing month over month.
10 7 4 1074 280
5EMR Documentation Miscommunications based on medication and protocol information in the EMR.
Incorrect medication doseage or timing based on incorrect or misread/miskeyed information
10Staff may not correctly document medication and prescription information.
4Appropriate locations and training are provided to faciliate correct medical record documentation.
1 1041 40IT and pharmacy to partner to develop BBIP protocol documentation. Pharmacy to maintain a separate external log with blood glucose values and patient details for daily monitoring.
COMPLETE - Pharmacy monitoring form in place.
10 4 1 1041 40
6Hospital marketing and reputation: Risks associated with brand, reputation, business strategy, and market issues following a noteable patient with severe complications.
Patient could seek negative publicity for the hospital based on a negative treatement outcome.
Adverse publicity should a patient experience complications or an extended length of stay based on ineffective glycemic management.
10Ineffective glycemic management or other failures to provide adequate or perceivably adequare care for diabetic patients.
1Glycemic monitoring by physicians and pharmacy. Use of primarily basal bolus insulin as well as some other insulin and diabetic management products based on physician preference.
1 1011 10Deployment and maintenance of full Basal Bolus Insulin Protocol (BBIP).Physician engagement in use of protocol and monitoring of blood glucose levels by pharmacists and physicians.
COMPLETE - BBIP Protocol deployed 9/13. Protocol maintained with physician engagement increasing month over month.
10 1 1 1011 10
7Legal/regulatory risks: The risks associated with licensure, accreditation, and federal and state statutes, standards and regulations.
Patient could file a complaint against the hospital based on a negative treatement outcome.
Potential loss of accreditaiton: Negative treatment outcomes related to medication issues could be reportable.
10Consistent glycemic monitoring by both pharmacy and physicians
1Glycemic monitoring by physicians and pharmacy. Use of primarily basal bolus insulin as well as some other insulin and diabetic management products based on physician preference.
4 1014 40Deployment and maintenance of full Basal Bolus Insulin Protocol (BBIP).Physician engagement in use of protocol and monitoring of blood glucose levels by pharmacists and physicians.
COMPLETE - BBIP Protocol deployed 9/13. Protocol maintained with physician engagement increasing month over month.
10 1 4 1014 40
64
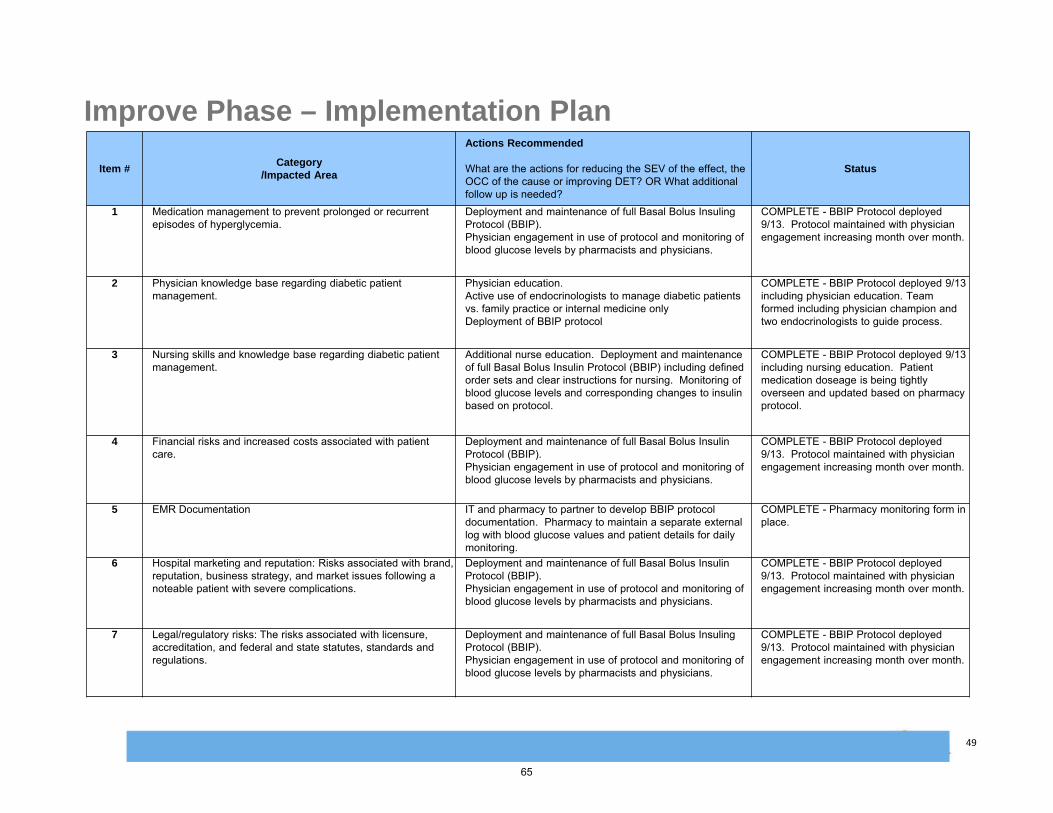
Rob Bryant Proprietary and Confidential 49
Improve Phase – Implementation Plan
Item #Category
/Impacted Area
Actions Recommended
What are the actions for reducing the SEV of the effect, the OCC of the cause or improving DET? OR What additional follow up is needed?
Status
1 Medication management to prevent prolonged or recurrent episodes of hyperglycemia.
Deployment and maintenance of full Basal Bolus Insuling Protocol (BBIP).Physician engagement in use of protocol and monitoring of blood glucose levels by pharmacists and physicians.
COMPLETE - BBIP Protocol deployed 9/13. Protocol maintained with physician engagement increasing month over month.
2 Physician knowledge base regarding diabetic patient management.
Physician education. Active use of endocrinologists to manage diabetic patients vs. family practice or internal medicine onlyDeployment of BBIP protocol
COMPLETE - BBIP Protocol deployed 9/13 including physician education. Team formed including physician champion and two endocrinologists to guide process.
3 Nursing skills and knowledge base regarding diabetic patient management.
Additional nurse education. Deployment and maintenance of full Basal Bolus Insulin Protocol (BBIP) including defined order sets and clear instructions for nursing. Monitoring of blood glucose levels and corresponding changes to insulin based on protocol.
COMPLETE - BBIP Protocol deployed 9/13 including nursing education. Patient medication doseage is being tightly overseen and updated based on pharmacy protocol.
4 Financial risks and increased costs associated with patient care.
Deployment and maintenance of full Basal Bolus InsulinProtocol (BBIP).Physician engagement in use of protocol and monitoring of blood glucose levels by pharmacists and physicians.
COMPLETE - BBIP Protocol deployed 9/13. Protocol maintained with physician engagement increasing month over month.
5 EMR Documentation IT and pharmacy to partner to develop BBIP protocol documentation. Pharmacy to maintain a separate external log with blood glucose values and patient details for daily monitoring.
COMPLETE - Pharmacy monitoring form in place.
6 Hospital marketing and reputation: Risks associated with brand, reputation, business strategy, and market issues following a noteable patient with severe complications.
Deployment and maintenance of full Basal Bolus Insulin Protocol (BBIP).Physician engagement in use of protocol and monitoring of blood glucose levels by pharmacists and physicians.
COMPLETE - BBIP Protocol deployed 9/13. Protocol maintained with physician engagement increasing month over month.
7 Legal/regulatory risks: The risks associated with licensure, accreditation, and federal and state statutes, standards and regulations.
Deployment and maintenance of full Basal Bolus InsulingProtocol (BBIP).Physician engagement in use of protocol and monitoring of blood glucose levels by pharmacists and physicians.
COMPLETE - BBIP Protocol deployed 9/13. Protocol maintained with physician engagement increasing month over month.
65
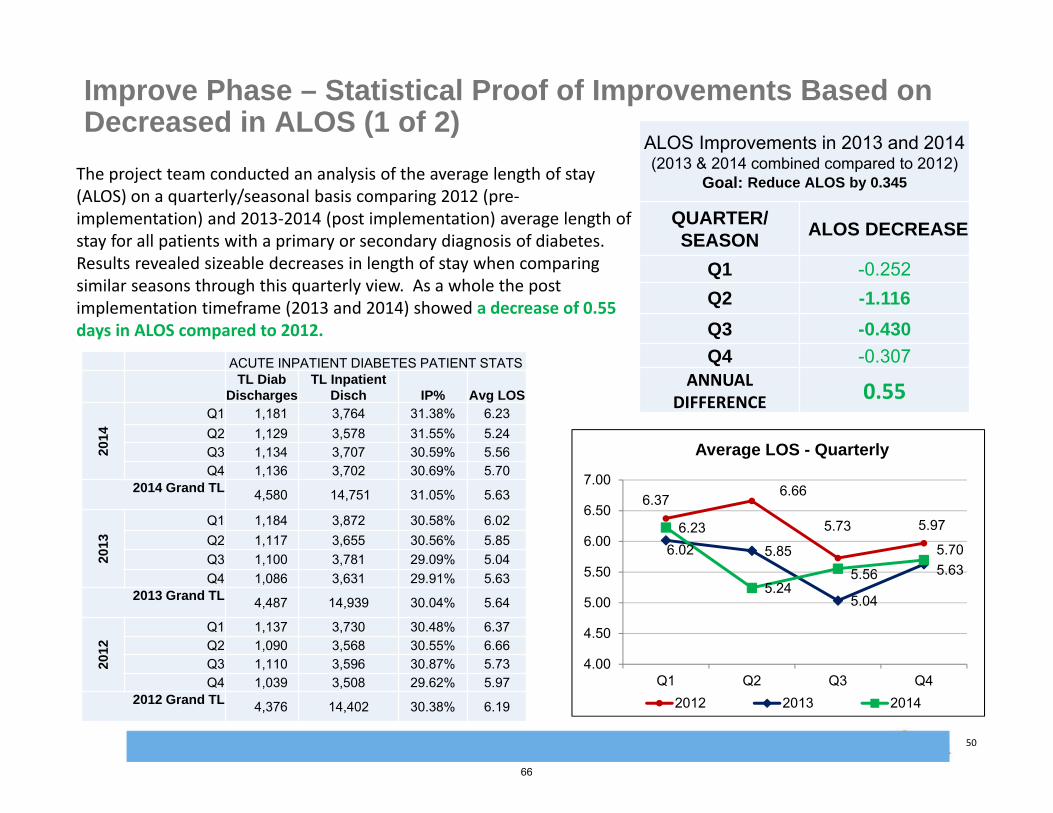
Rob Bryant Proprietary and Confidential 50
Improve Phase – Statistical Proof of Improvements Based on Decreased in ALOS (1 of 2)
ALOS Improvements in 2013 and 2014(2013 & 2014 combined compared to 2012)
Goal: Reduce ALOS by 0.345
QUARTER/ SEASON
ALOS DECREASE
Q1 -0.252Q2 -1.116
Q3 -0.430
Q4 -0.307ANNUAL
DIFFERENCE0.55
The project team conducted an analysis of the average length of stay (ALOS) on a quarterly/seasonal basis comparing 2012 (pre‐implementation) and 2013‐2014 (post implementation) average length of stay for all patients with a primary or secondary diagnosis of diabetes. Results revealed sizeable decreases in length of stay when comparing similar seasons through this quarterly view. As a whole the post implementation timeframe (2013 and 2014) showed a decrease of 0.55 days in ALOS compared to 2012.
6.376.66
5.73 5.97
6.02 5.85
5.04
5.63
6.23
5.245.56
5.70
4.00
4.50
5.00
5.50
6.00
6.50
7.00
Q1 Q2 Q3 Q4
Average LOS - Quarterly
2012 2013 2014
ACUTE INPATIENT DIABETES PATIENT STATSTL Diab
DischargesTL Inpatient
Disch IP% Avg LOS
2014
Q1 1,181 3,764 31.38% 6.23Q2 1,129 3,578 31.55% 5.24Q3 1,134 3,707 30.59% 5.56Q4 1,136 3,702 30.69% 5.70
2014 Grand TL 4,580 14,751 31.05% 5.63
2013
Q1 1,184 3,872 30.58% 6.02Q2 1,117 3,655 30.56% 5.85Q3 1,100 3,781 29.09% 5.04Q4 1,086 3,631 29.91% 5.63
2013 Grand TL 4,487 14,939 30.04% 5.64
2012
Q1 1,137 3,730 30.48% 6.37Q2 1,090 3,568 30.55% 6.66Q3 1,110 3,596 30.87% 5.73Q4 1,039 3,508 29.62% 5.97
2012 Grand TL 4,376 14,402 30.38% 6.19
66
Rob Bryant Proprietary and Confidential 51
Improve Phase – Statistical Proof of Improvements Based on Decreased in ALOS (2 of 2)
Overall, the annual impact of the decrease in variance was a cost reduction of just over $249,000.
Since the LOS decrease would actually impact reimbursement for a few insurance carriers, the net impact of realized cost savings was reduced to $197,400.
In summary, a comparison of average length of stay (ALOS) between 2012 (pre-intervention and planning) and 2013 & 2014 ( planning and intervention timeframe) revealed an approximate cost savings of $197,400 a year due to a decrease in length of stay.
Methods: Patients with LOS’s greater than 14 were excluded for financial analysis only. For the remaining patients, the team compared the variance of Actual LOS to GMLOS by insurance company for 2012 to the variance of Actual to GMLOS for 2013-2014 combined.
67

Rob Bryant Proprietary and Confidential 52
Pre-BBIP Day 1 Day 2 Day 3 Day 4 Day 5
Nov 210 216 191 187 175 157Dec 231 222 192 193 183 182Jan 208 198 183 183 166 156Feb 208 197 182 164 156 172Mar 203 200 186 164 162 164
Overall 214 206 187 181 175 169
Improve Phase – Statistical Proof of Improvements Based on Decreased in POC Glucose
The average POC glucose levels following BBIP gradually decreased below the threshold of 180.
S:\15 GAMC QAShared\Special Projects\Glycemic Management\Glycemic Protocol Presentation & Back‐Up\S:\15 GAMC QAShared\Special P j t \Gl i M t\Gl i P t l P t ti & B k U68
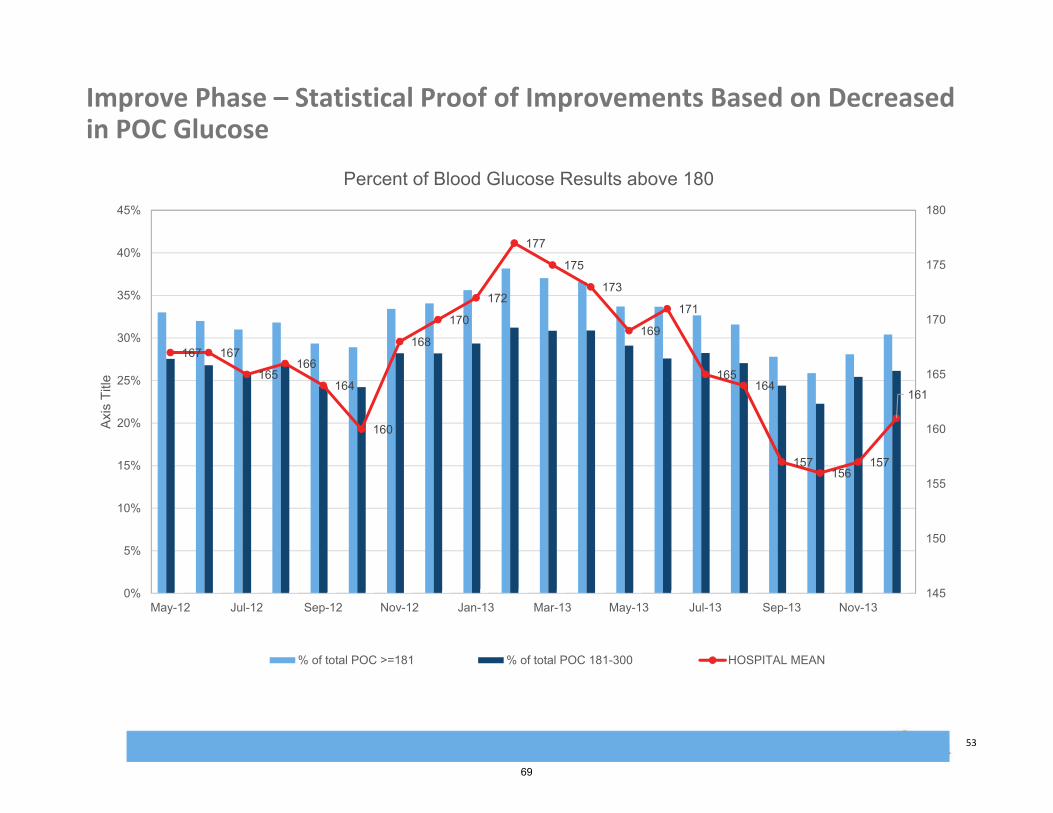
Rob Bryant Proprietary and Confidential 53
Improve Phase – Statistical Proof of Improvements Based on Decreased in POC Glucose
167 167
165166
164
160
168
170
172
177
175
173
169
171
165164
157156
157
161
145
150
155
160
165
170
175
180
0%
5%
10%
15%
20%
25%
30%
35%
40%
45%
May-12 Jul-12 Sep-12 Nov-12 Jan-13 Mar-13 May-13 Jul-13 Sep-13 Nov-13
Axi
s Ti
tle
Percent of Blood Glucose Results above 180
% of total POC >=181 % of total POC 181-300 HOSPITAL MEAN
69
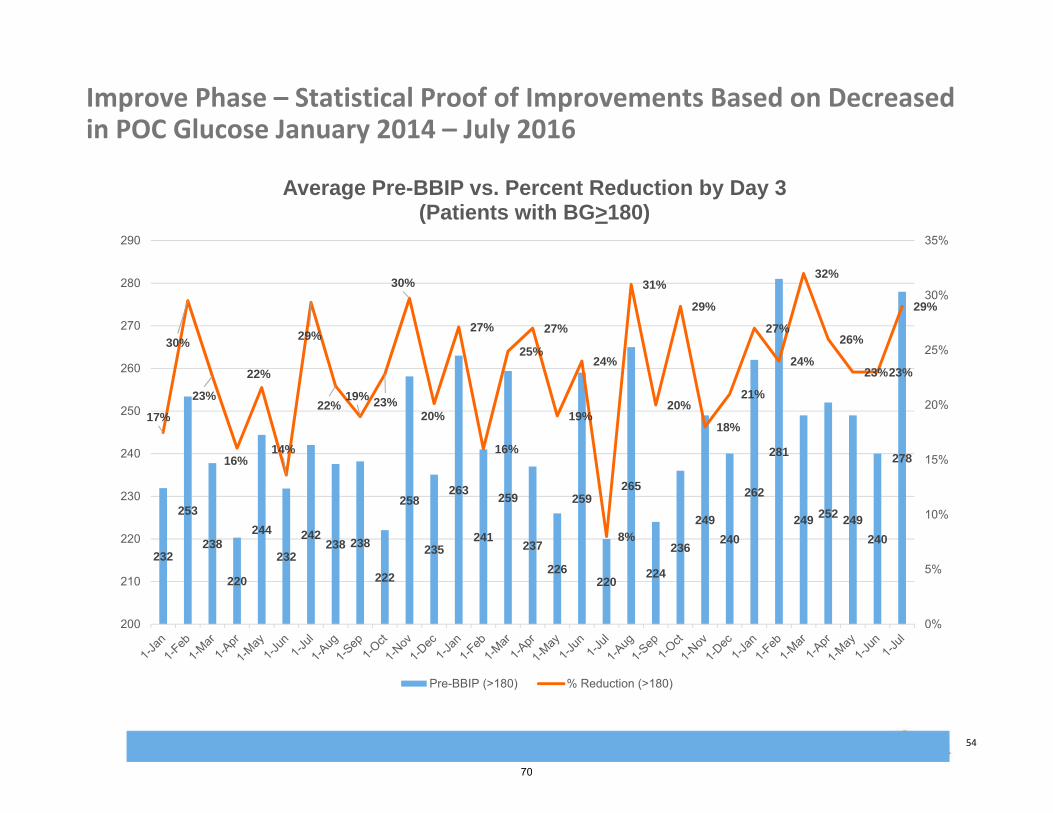
Rob Bryant Proprietary and Confidential 54
Improve Phase – Statistical Proof of Improvements Based on Decreased in POC Glucose January 2014 – July 2016
232
253
238
220
244
232
242238 238
222
258
235
263
241
259
237
226
259
220
265
224
236
249
240
262
281
249 252 249
240
278
17%
30%
23%
16%
22%
14%
29%
22%19% 23%
30%
20%
27%
16%
25%
27%
19%
24%
8%
31%
20%
29%
18%
21%
27%
24%
32%
26%
23%23%
29%
0%
5%
10%
15%
20%
25%
30%
35%
200
210
220
230
240
250
260
270
280
290
Average Pre-BBIP vs. Percent Reduction by Day 3(Patients with BG>180)
Pre-BBIP (>180) % Reduction (>180)
70

Rob Bryant Proprietary and Confidential 55
Improve Phase – Statistical Proof of Improvements Based on Decreased in POC Glucose – January 2014 – July 2016
S:\15 GAMC QAShared\Special Projects\Glycemic Management\Glycemic Protocol Presentation & Back‐Up\S:\15 GAMC QAShared\Special Projects\Glycemic Management\Glycemic Protocol Presentation & Back‐Up
221224
211
197
216 217
226
200
218
205
215210
231
208203
198 197
204
184
232
202 201
210
221224
264
227232
227 225231
18%
21%
16%
11%
15%
9%
26%
11%
15%
17%
19%
11%
16%
12%
17%
21%
10%
13%
1%
27%
13%
20%
9%
16%
19%
22%
27%
22%
18%18%19%
0%
5%
10%
15%
20%
25%
30%
35%
180
190
200
210
220
230
240
250
Average Pre-BBIP vs. Percent Reduction by Day 3(ALL Patients)
Pre-BBIP (ALL) % Reduction (ALL)
71
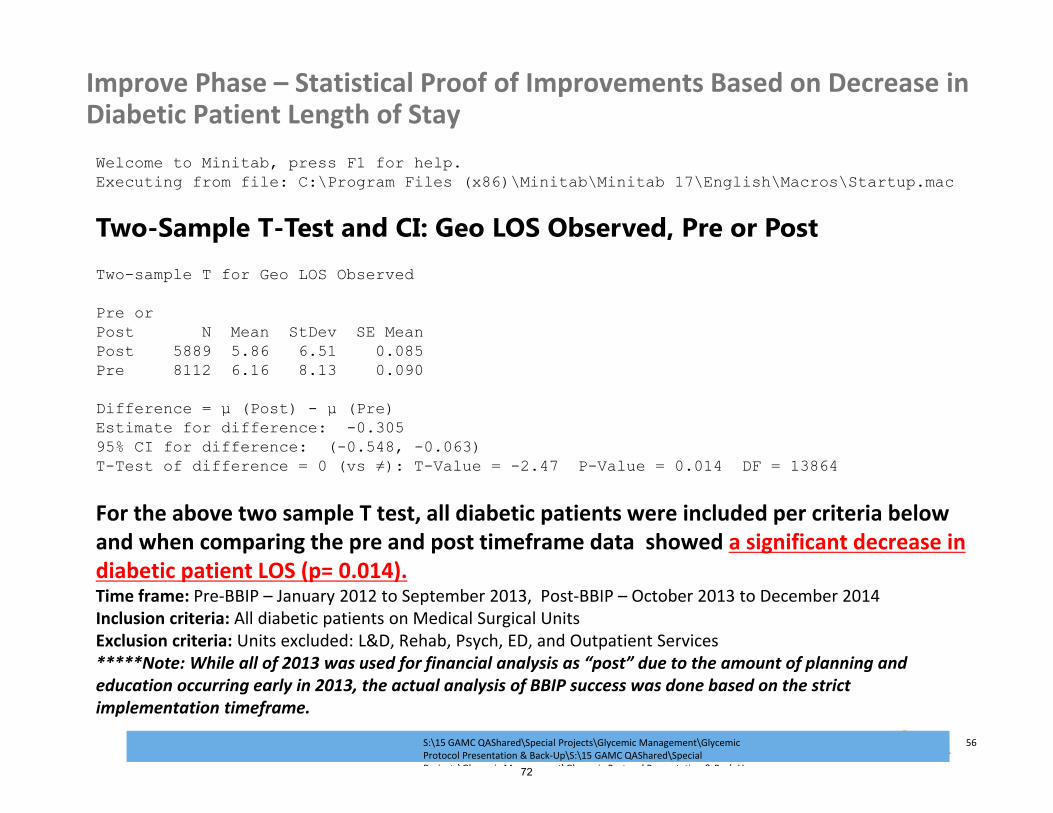
Rob Bryant Proprietary and Confidential 56
Improve Phase – Statistical Proof of Improvements Based on Decrease in Diabetic Patient Length of Stay
For the above two sample T test, all diabetic patients were included per criteria below and when comparing the pre and post timeframe data showed a significant decrease in diabetic patient LOS (p= 0.014). Time frame: Pre‐BBIP – January 2012 to September 2013, Post‐BBIP – October 2013 to December 2014Inclusion criteria: All diabetic patients on Medical Surgical Units Exclusion criteria: Units excluded: L&D, Rehab, Psych, ED, and Outpatient Services*****Note: While all of 2013 was used for financial analysis as “post” due to the amount of planning and education occurring early in 2013, the actual analysis of BBIP success was done based on the strict implementation timeframe.
Welcome to Minitab, press F1 for help.Executing from file: C:\Program Files (x86)\Minitab\Minitab 17\English\Macros\Startup.mac
Two-Sample T-Test and CI: Geo LOS Observed, Pre or Post Two-sample T for Geo LOS Observed
Pre orPost N Mean StDev SE MeanPost 5889 5.86 6.51 0.085Pre 8112 6.16 8.13 0.090
Difference = μ (Post) - μ (Pre)Estimate for difference: -0.30595% CI for difference: (-0.548, -0.063)T-Test of difference = 0 (vs ≠): T-Value = -2.47 P-Value = 0.014 DF = 13864
S:\15 GAMC QAShared\Special Projects\Glycemic Management\Glycemic Protocol Presentation & Back‐Up\S:\15 GAMC QAShared\Special P j t \Gl i M t\Gl i P t l P t ti & B k U72

Rob Bryant Proprietary and Confidential 57
Improve Phase – Statistical Proof of Improvements Based on Decrease in Diabetic Patient Length of Stay
Time framePre‐BBIP – January 2012 to September 2013Post‐BBIP – October 2013 to December 2014
PrePost
300
250
200
150
100
50
0
Pre or Post
Geo
LO
S O
bser
ved
Boxplot of Geo LOS Observed
N Mean StDev SE MeanPost 5889 5.86 6.51 0.085Pre 8112 6.16 8.13 0.090
Post implementation data illustrates a lower mean as well as a tighter spread (StDev of 6.51) and elimination of outlier cases.
73
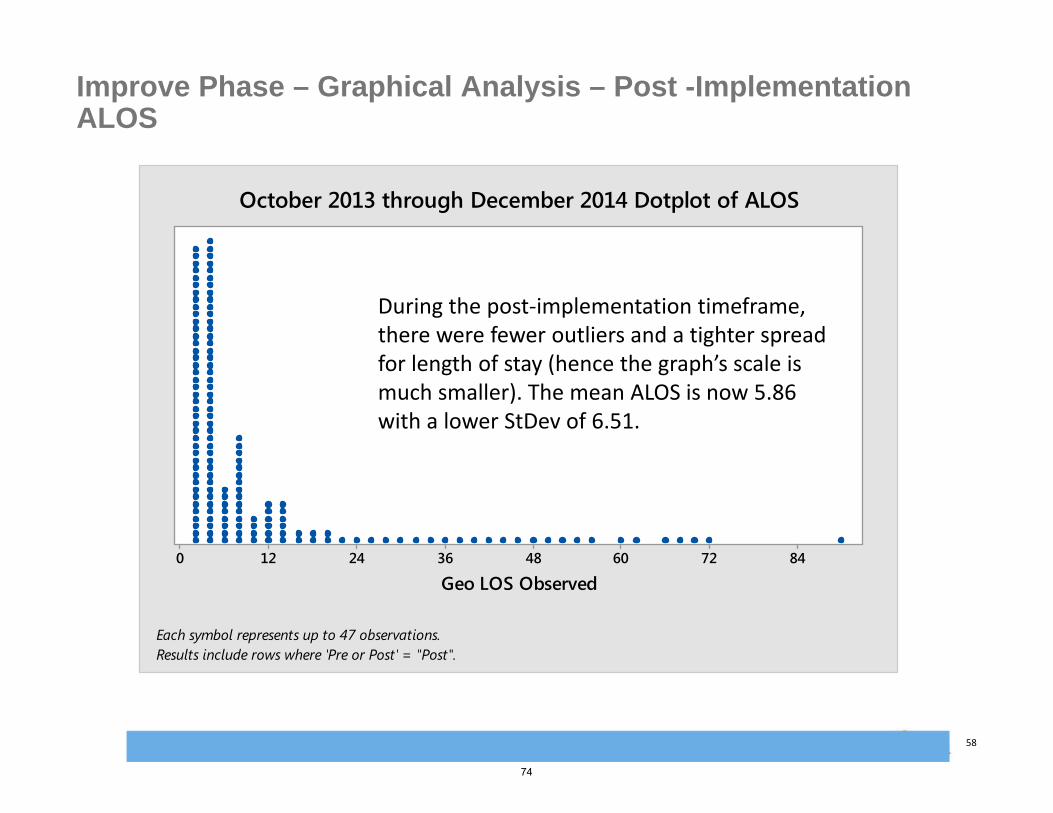
Rob Bryant Proprietary and Confidential 58
847260483624120
Geo LOS Observed
Each symbol represents up to 47 observations.Results include rows where 'Pre or Post' = "Post".
October 2013 through December 2014 Dotplot of ALOS
Improve Phase – Graphical Analysis – Post -Implementation ALOS
During the post‐implementation timeframe, there were fewer outliers and a tighter spread for length of stay (hence the graph’s scale is much smaller). The mean ALOS is now 5.86 with a lower StDev of 6.51.
74
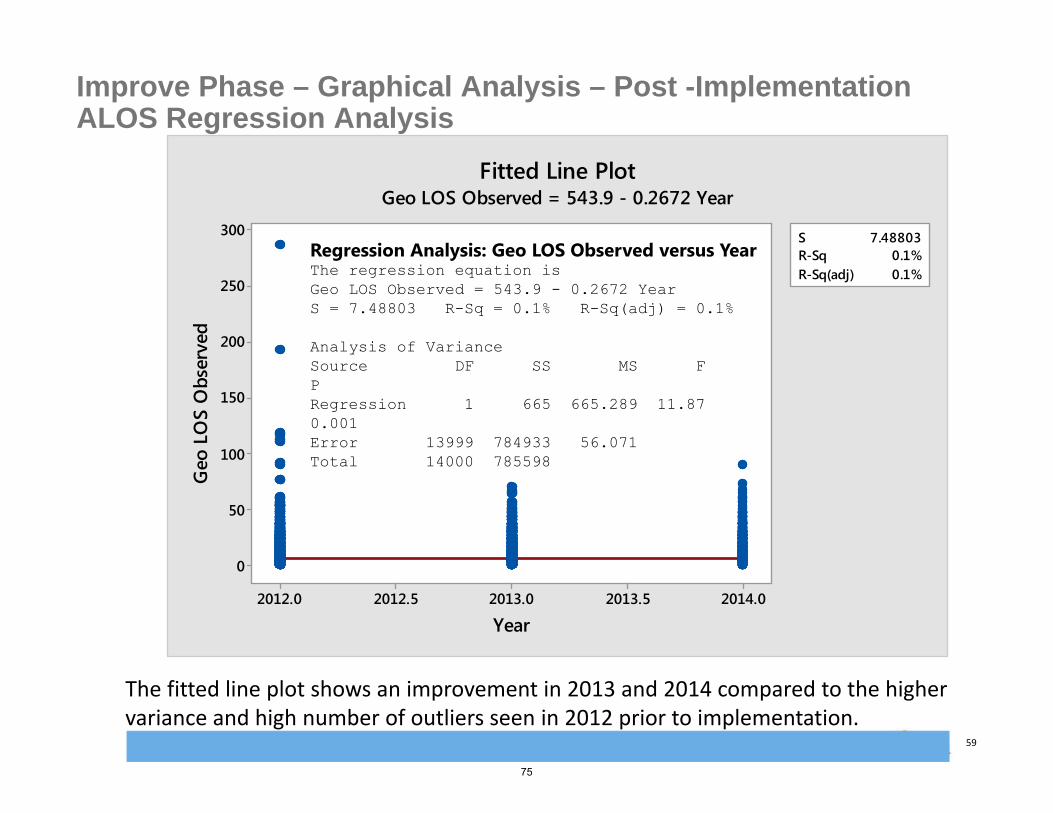
Rob Bryant Proprietary and Confidential 59
Improve Phase – Graphical Analysis – Post -Implementation ALOS Regression Analysis
2014.02013.52013.02012.52012.0
300
250
200
150
100
50
0
S 7.48803R-Sq 0.1%R-Sq(adj) 0.1%
Year
Geo
LO
S O
bser
vedFitted Line Plot
Geo LOS Observed = 543.9 - 0.2672 Year
The fitted line plot shows an improvement in 2013 and 2014 compared to the higher variance and high number of outliers seen in 2012 prior to implementation.
Regression Analysis: Geo LOS Observed versus Year The regression equation isGeo LOS Observed = 543.9 - 0.2672 YearS = 7.48803 R-Sq = 0.1% R-Sq(adj) = 0.1%
Analysis of VarianceSource DF SS MS F PRegression 1 665 665.289 11.87 0.001Error 13999 784933 56.071Total 14000 785598
75
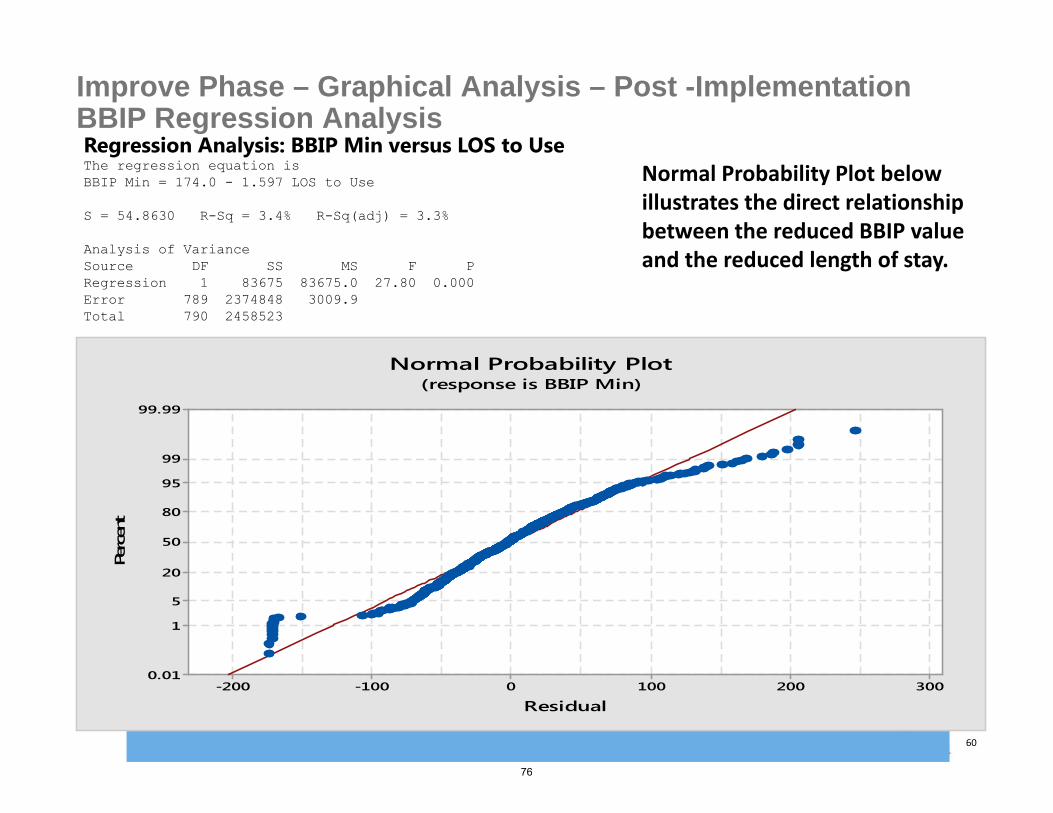
Rob Bryant Proprietary and Confidential 60
Improve Phase – Graphical Analysis – Post -Implementation BBIP Regression AnalysisRegression Analysis: BBIP Min versus LOS to Use The regression equation isBBIP Min = 174.0 - 1.597 LOS to Use
S = 54.8630 R-Sq = 3.4% R-Sq(adj) = 3.3%
Analysis of VarianceSource DF SS MS F PRegression 1 83675 83675.0 27.80 0.000Error 789 2374848 3009.9Total 790 2458523
3002001000-100-200
99.99
99
95
80
50
20
5
1
0.01
Residual
Perc
ent
Normal Probability Plot(response is BBIP Min)
Normal Probability Plot below illustrates the direct relationship between the reduced BBIP value and the reduced length of stay.
76

Rob Bryant Proprietary and Confidential 61
Improve Phase – Graphical Analysis – Post -Implementation ALOS ANOVAOne-way ANOVA: Geo LOS Observed versus Pre or Post MethodNull hypothesis All means are equalAlternative hypothesis At least one mean is differentSignificance level α = 0.05Rows unused 53
Equal variances were assumed for the analysis.
Factor Information
Factor Levels ValuesPre or Post 2 Post, Pre
Analysis of VarianceSource DF Adj SS Adj MS F-Value P-ValuePre or Post 1 318 318.27 5.67 0.017Error 13999 785280 56.10Total 14000 785598
Model Summary
S R-sq R-sq(adj) R-sq(pred)7.48969 0.04% 0.03% 0.01%
Means
Pre orPost N Mean StDev 95% CIPost 5889 5.8594 6.5113 (5.6681, 6.0507)Pre 8112 6.1648 8.1265 (6.0018, 6.3278)
Pooled StDev = 7.48969
The post‐implementation One‐way ANOVA illustrates the reduction in mean and standard deviation following the implementation of the BBIP protocol with a P Value of 0.017.
77
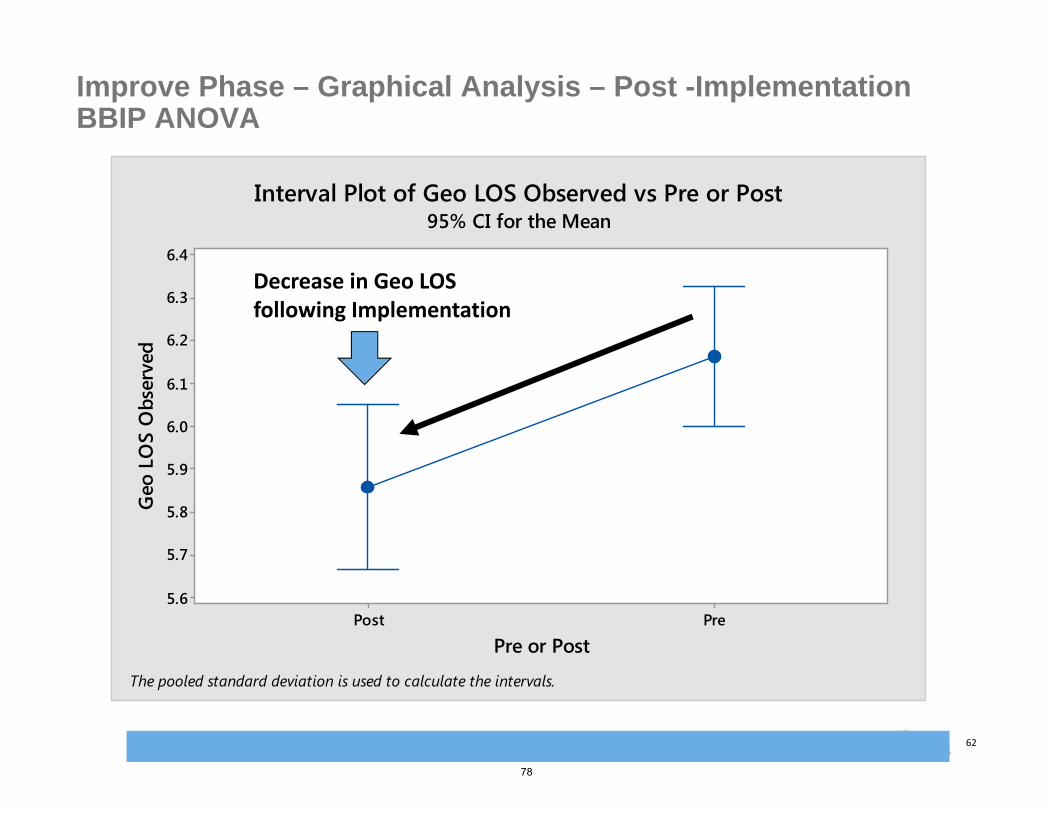
Rob Bryant Proprietary and Confidential 62
Improve Phase – Graphical Analysis – Post -Implementation BBIP ANOVA
PrePost
6.4
6.3
6.2
6.1
6.0
5.9
5.8
5.7
5.6
Pre or Post
Geo
LO
S O
bser
ved
Interval Plot of Geo LOS Observed vs Pre or Post95% CI for the Mean
The pooled standard deviation is used to calculate the intervals.
Decrease in Geo LOS following Implementation
78
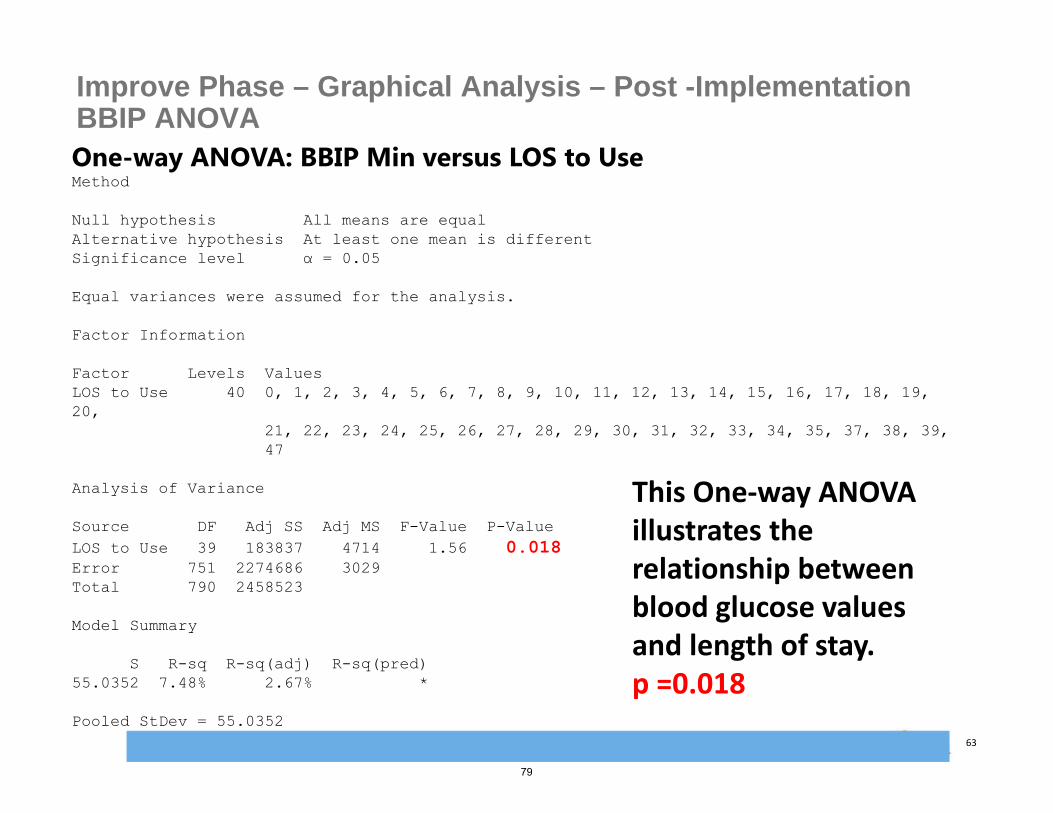
Rob Bryant Proprietary and Confidential 63
Improve Phase – Graphical Analysis – Post -Implementation BBIP ANOVAOne-way ANOVA: BBIP Min versus LOS to Use Method
Null hypothesis All means are equalAlternative hypothesis At least one mean is differentSignificance level α = 0.05
Equal variances were assumed for the analysis.
Factor Information
Factor Levels ValuesLOS to Use 40 0, 1, 2, 3, 4, 5, 6, 7, 8, 9, 10, 11, 12, 13, 14, 15, 16, 17, 18, 19, 20,
21, 22, 23, 24, 25, 26, 27, 28, 29, 30, 31, 32, 33, 34, 35, 37, 38, 39,47
Analysis of Variance
Source DF Adj SS Adj MS F-Value P-ValueLOS to Use 39 183837 4714 1.56 0.018Error 751 2274686 3029Total 790 2458523
Model Summary
S R-sq R-sq(adj) R-sq(pred)55.0352 7.48% 2.67% *
Pooled StDev = 55.0352
This One‐way ANOVA illustrates the relationship between blood glucose values and length of stay. p =0.018
79

Rob Bryant Proprietary and Confidential 64
Improve Phase – Graphical Analysis – Post -Implementation BBIP ANOVA
4739383735343332313029282726252423222120191817161514131211109876543210
350
300
250
200
150
100
50
0
LOS to Use
BBIP
Min
Interval Plot of BBIP Min vs LOS to Use95% CI for the Mean
The pooled standard deviation is used to calculate the intervals.
Figure illustrates the relationship between the BBIP values and patient length of stay.
Higher BBIP values are associated with higher lengths of stay and more variation.
80
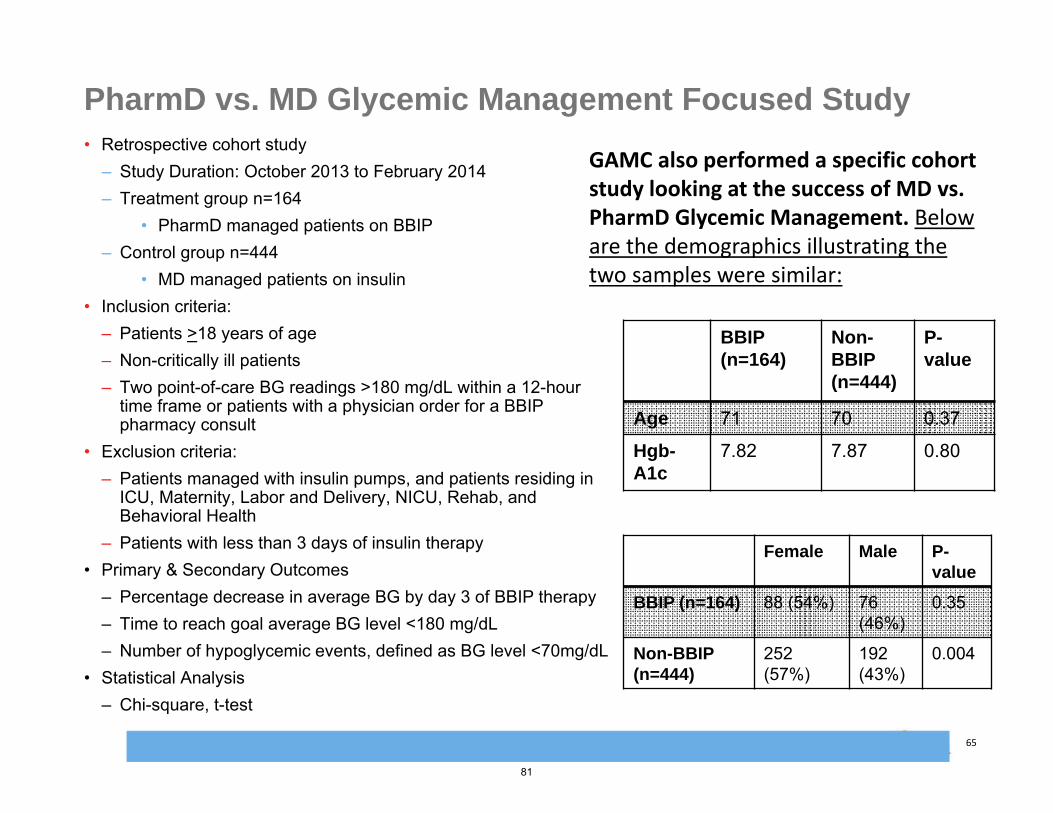
Rob Bryant Proprietary and Confidential 65
PharmD vs. MD Glycemic Management Focused Study• Retrospective cohort study
– Study Duration: October 2013 to February 2014– Treatment group n=164
• PharmD managed patients on BBIP– Control group n=444
• MD managed patients on insulin• Inclusion criteria:
– Patients >18 years of age– Non-critically ill patients – Two point-of-care BG readings >180 mg/dL within a 12-hour
time frame or patients with a physician order for a BBIP pharmacy consult
• Exclusion criteria:– Patients managed with insulin pumps, and patients residing in
ICU, Maternity, Labor and Delivery, NICU, Rehab, and Behavioral Health
– Patients with less than 3 days of insulin therapy• Primary & Secondary Outcomes
– Percentage decrease in average BG by day 3 of BBIP therapy– Time to reach goal average BG level <180 mg/dL– Number of hypoglycemic events, defined as BG level <70mg/dL
• Statistical Analysis– Chi-square, t-test
BBIP (n=164)
Non-BBIP (n=444)
P-value
Age 71 70 0.37
Hgb-A1c
7.82 7.87 0.80
Female Male P-value
BBIP (n=164) 88 (54%) 76 (46%)
0.35
Non-BBIP(n=444)
252 (57%)
192 (43%)
0.004
GAMC also performed a specific cohort study looking at the success of MD vs. PharmD Glycemic Management. Below are the demographics illustrating the two samples were similar:
81
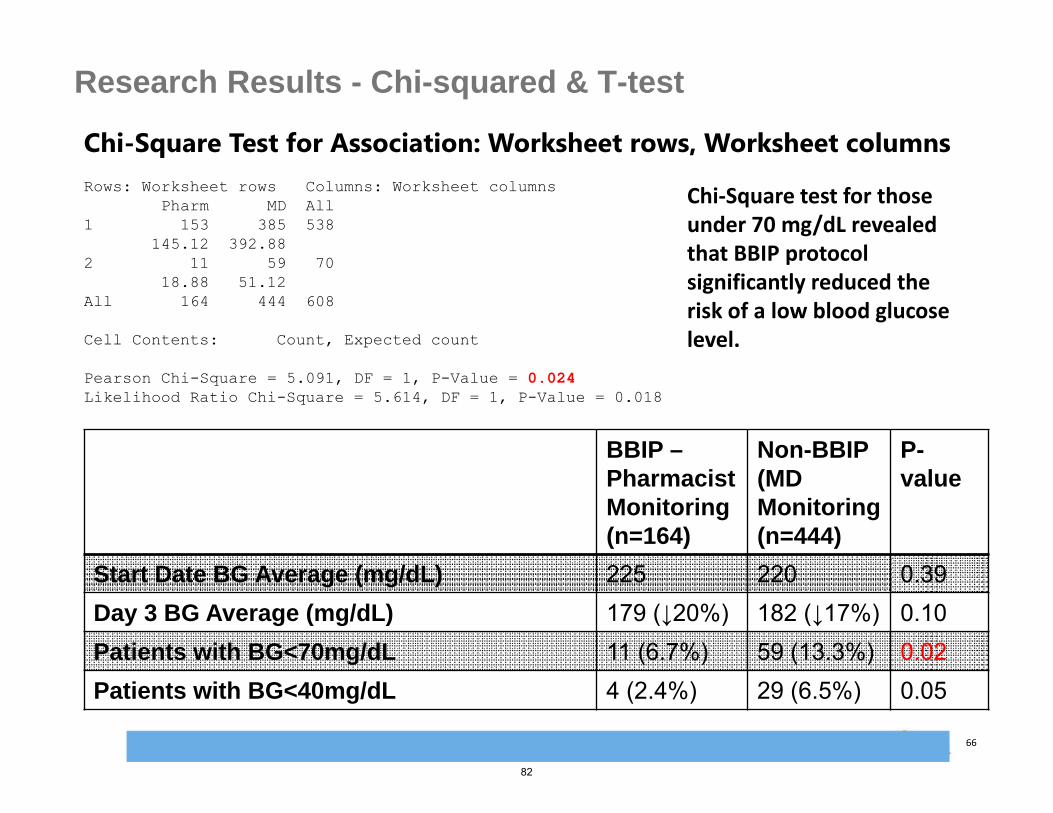
Rob Bryant Proprietary and Confidential 66
Research Results - Chi-squared & T-test
BBIP –PharmacistMonitoring(n=164)
Non-BBIP (MD Monitoring(n=444)
P-value
Start Date BG Average (mg/dL) 225 220 0.39Day 3 BG Average (mg/dL) 179 (↓20%) 182 (↓17%) 0.10Patients with BG<70mg/dL 11 (6.7%) 59 (13.3%) 0.02Patients with BG<40mg/dL 4 (2.4%) 29 (6.5%) 0.05
Chi-Square Test for Association: Worksheet rows, Worksheet columns Rows: Worksheet rows Columns: Worksheet columns
Pharm MD All1 153 385 538
145.12 392.882 11 59 70
18.88 51.12All 164 444 608
Cell Contents: Count, Expected count
Pearson Chi-Square = 5.091, DF = 1, P-Value = 0.024Likelihood Ratio Chi-Square = 5.614, DF = 1, P-Value = 0.018
Chi‐Square test for those under 70 mg/dL revealed that BBIP protocol significantly reduced the risk of a low blood glucose level.
82
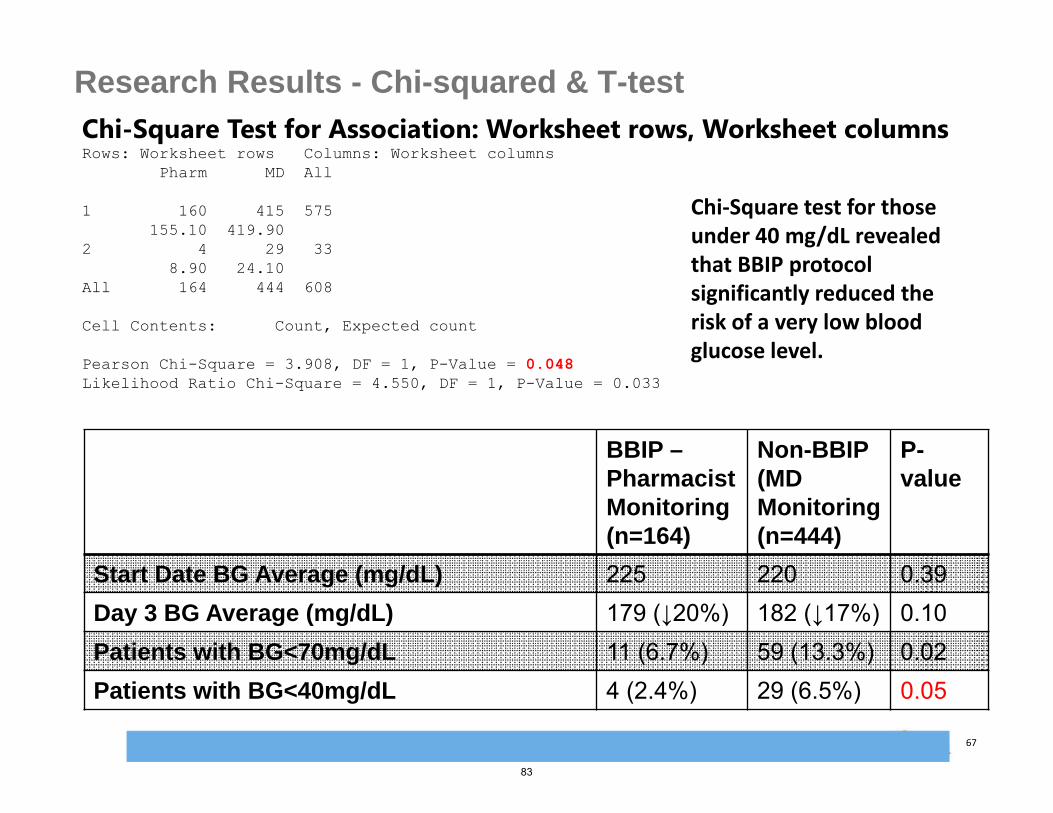
Rob Bryant Proprietary and Confidential 67
Research Results - Chi-squared & T-test
BBIP –PharmacistMonitoring(n=164)
Non-BBIP (MD Monitoring(n=444)
P-value
Start Date BG Average (mg/dL) 225 220 0.39Day 3 BG Average (mg/dL) 179 (↓20%) 182 (↓17%) 0.10Patients with BG<70mg/dL 11 (6.7%) 59 (13.3%) 0.02Patients with BG<40mg/dL 4 (2.4%) 29 (6.5%) 0.05
Chi-Square Test for Association: Worksheet rows, Worksheet columns Rows: Worksheet rows Columns: Worksheet columns
Pharm MD All
1 160 415 575155.10 419.90
2 4 29 338.90 24.10
All 164 444 608
Cell Contents: Count, Expected count
Pearson Chi-Square = 3.908, DF = 1, P-Value = 0.048Likelihood Ratio Chi-Square = 4.550, DF = 1, P-Value = 0.033
Chi‐Square test for those under 40 mg/dL revealed that BBIP protocol significantly reduced the risk of a very low blood glucose level.
83

Rob Bryant Proprietary and Confidential 68
Research Results - Conclusion
A pharmacist managed BBIP significantly reduced BG levels to below 180mg/dL by day 3 after initial hyperglycemic alert.
Glycemic control at GAMC has improved after implementation of the BBIP, with a 6% lower number of POC Glucose values >180mg/dL.
*** The incidence of hypoglycemic events were significantly lower in the pharmacist managed population compared with the physician managed population.
Therefore a pharmacist managed basal bolus insulin service is as effective and may be safer than physician managed glycemic control.
84
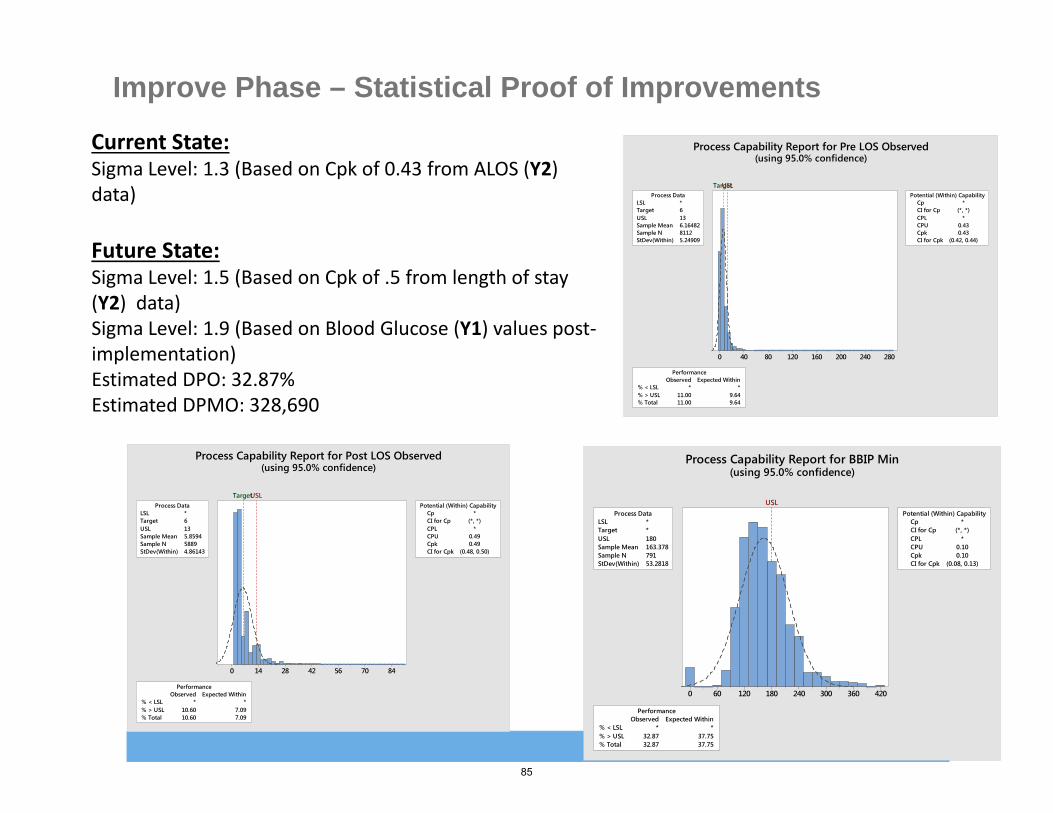
Rob Bryant Proprietary and Confidential 69
Improve Phase – Statistical Proof of Improvements
Current State:Sigma Level: 1.3 (Based on Cpk of 0.43 from ALOS (Y2) data)
Future State: Sigma Level: 1.5 (Based on Cpk of .5 from length of stay (Y2) data)Sigma Level: 1.9 (Based on Blood Glucose (Y1) values post‐implementation) Estimated DPO: 32.87%Estimated DPMO: 328,690
420360300240180120600
LSL *Target *USL 180Sample Mean 163.378Sample N 791StDev(Within) 53.2818
Process DataCp *CI for Cp (*, *)CPL *CPU 0.10Cpk 0.10CI for Cpk (0.08, 0.13)
Potential (Within) Capability
% < LSL * *% > USL 32.87 37.75% Total 32.87 37.75
Observed Expected WithinPerformance
USL
Process Capability Report for BBIP Min(using 95.0% confidence)
28024020016012080400
LSL *Target 6USL 13Sample Mean 6.16482Sample N 8112StDev(Within) 5.24909
Process DataCp *CI for Cp (*, *)CPL *CPU 0.43Cpk 0.43CI for Cpk (0.42, 0.44)
Potential (Within) Capability
% < LSL * *% > USL 11.00 9.64% Total 11.00 9.64
Observed Expected WithinPerformance
TargetUSL
Process Capability Report for Pre LOS Observed(using 95.0% confidence)
8470564228140
LSL *Target 6USL 13Sample Mean 5.8594Sample N 5889StDev(Within) 4.86143
Process DataCp *CI for Cp (*, *)CPL *CPU 0.49Cpk 0.49CI for Cpk (0.48, 0.50)
Potential (Within) Capability
% < LSL * *% > USL 10.60 7.09% Total 10.60 7.09
Observed Expected WithinPerformance
TargetUSL
Process Capability Report for Post LOS Observed(using 95.0% confidence)
85

Rob Bryant Proprietary and Confidential 70
Improve Phase – Process Capability Report – Blood Glucose Levels Post Implementation – October 2013 – December 2014
420360300240180120600
LSL *Target *USL 180Sample Mean 163.378Sample N 791StDev(Within) 53.2818
Process DataCp *CI for Cp (*, *)CPL *CPU 0.10Cpk 0.10CI for Cpk (0.08, 0.13)
Potential (Within) Capability
% < LSL * *% > USL 32.87 37.75% Total 32.87 37.75
Observed Expected WithinPerformance
USL
Process Capability Report for BBIP Min(using 95.0% confidence)
The Process Capability Report shows a centralization of reduced blood glucose values after BBIP treatment between 70‐180 with 32.87% of values observed outside of the desired range. There is still a great deal of improvement to be made.
86

Rob Bryant Proprietary and Confidential 71
Improve Phase - VOC Translation
Voice of the Customer
Key Issue CTQ Goal Y’s Potential X'sVital Few X's Solutions
"We need to reduce the episodes of hyperglycemia in our diabetic patients"
Clinical effectivenes
s
CTQ #1 -Reduce the episodes of hyperglycemia in our diabetic patients
Goal #1 - Reduce the number of hyperglycemicepisodes following protocol initiation in target population by 30% compared to patients not on protocol
Y1 = the number of hyperglycemicepisodes experienced by patients on the protocol
X1 = Participation in BBIP program
X2 = Number of days participation in BBIP
X3 = Monitoring by whom
X1 = Participation in BBIP program
X2 = Number of days participation in BBIP
S1 – Implement BBIPS2 – Conduct nursing and physician education on glycemic management
"We need to reduce the length of stay, complications, and readmissionsof our diabetic patients"
Clinical effectivenes
s, $ / Efficiency
CTQ #2 -Timeliness of safe patient discharge
Goal #2 - Reduce the average length of stay for the total population of diabetic patients on Medical Surgical and telemetry units by at least .345 days
Y2 = the average length of stay of diabetic patients on the medical surgical and telemetry units
X1 = Participation in BBIP program
X2 = Number of days participation in BBIP
X3 = Monitoring by whom
X2 = Number of days participation in BBIP
S1 – Implement BBIPS2 – Conduct nursing and physician education on glycemic management
87

Rob Bryant Proprietary and Confidential 72
Fishbone: Solution FocusedImprove Phase – Glycemic Protocol: Fishbone of a Solution
88

Rob Bryant Proprietary and Confidential 73
Improve PhaseRCA Validation/Problem ManagementGo/No Go TableImprove Phase – Glycemic Management: Mistake Proof Table
Sol
utio
n
SCALE9: Strong relationship4: Moderate relationship1: Weak relationship0: No relationship
Mai
nten
ance
Effe
ctiv
enes
s
Tim
e to
Dev
elop
Trai
ning
Cos
t
Mistake Proofing Opportunities 5% 40% 15% 5% 30% 100%
1 Increase Physician Participation in BBIP to reduce patients "falling through" the cracks 9 9 1 9 4 4.74
2 Electronic Medical Record Controls including Dosage Monitoring and Flags 9 9 4 1 4 4.71
3 Pharmacist Review of Dosage 9 9 1 9 9 5.415
4 Pharmacist Daily Review of Blood Glucose Values 9 9 1 9 9 5.415
5 Nursing Monitoring of Clinical Triggers for Hyperglycemia 9 9 4 9 1 4.785
6 Patient Education and Discharge Home with Basal Bolus Insulin 9 9 1 9 1 4.335
89
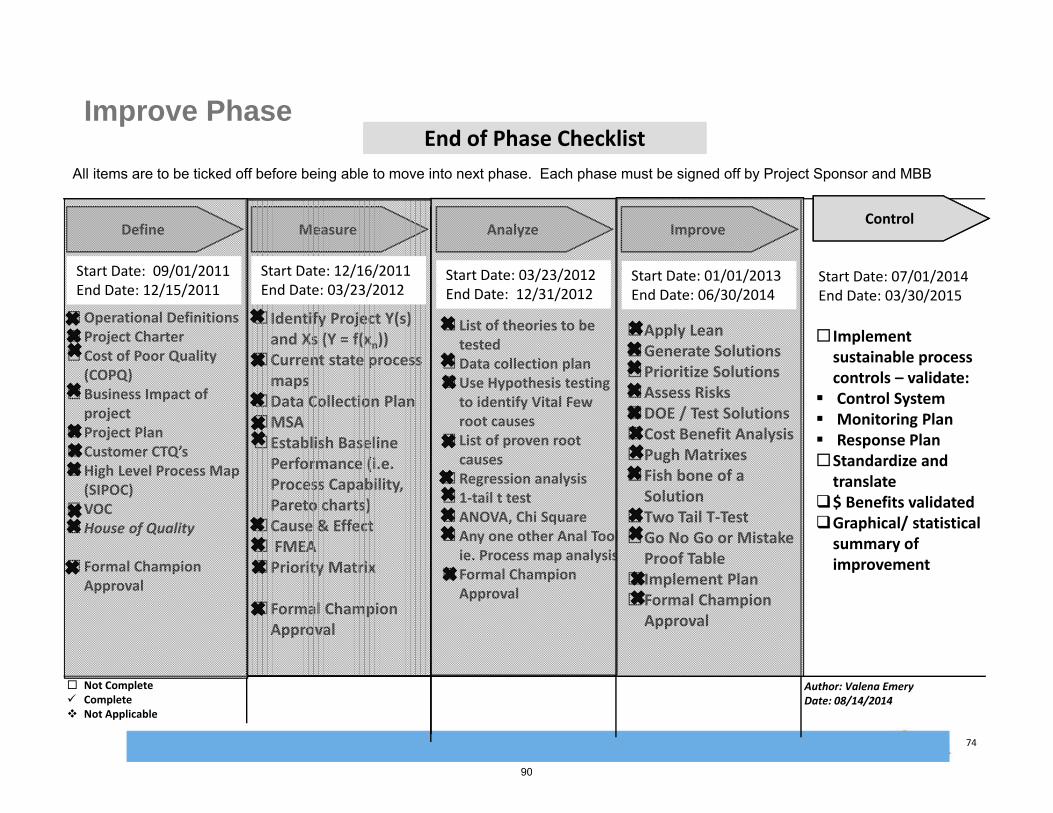
Rob Bryant Proprietary and Confidential 74
End of Phase ChecklistEnd of Phase Checklist
Start Date: Enter DateEnd Date: Enter Date
Operational Definitions Project Charter Cost of Poor Quality
(COPQ) Business Impact of
project Project Plan Customer CTQ’sHigh Level Process Map
(SIPOC)VOCHouse of Quality
Formal Champion Approval
Define Measure Analyze ImproveControl
Start Date: Enter DateEnd Date: Enter Date
Start Date: Enter DateEnd Date: Enter Date
Not Complete Complete Not Applicable
Author: Valena Emery Date: 08/14/2014
All items are to be ticked off before being able to move into next phase. Each phase must be signed off by Project Sponsor and MBB
Improve Phase
Start Date: 09/01/2011End Date: 12/15/2011
Identify Project Y(s) and Xs (Y = f(xn))
Current state process maps
Data Collection PlanMSAEstablish Baseline Performance (i.e. Process Capability, Pareto charts)
Cause & Effect FMEAPriority Matrix
Formal Champion Approval
Start Date: 12/16/2011End Date: 03/23/2012
Start Date: Enter DateEnd Date: Enter Date
List of theories to be tested
Data collection planUse Hypothesis testing
to identify Vital Few root causes
List of proven root causes
Regression analysis 1‐tail t testANOVA, Chi SquareAny one other Anal Tool
ie. Process map analysis Formal Champion
Approval
Start Date: 03/23/2012End Date: 12/31/2012
Start Date: Enter DateEnd Date: Enter Date
Apply LeanGenerate SolutionsPrioritize SolutionsAssess RisksDOE / Test SolutionsCost Benefit AnalysisPugh MatrixesFish bone of a Solution
Two Tail T‐TestGo No Go or Mistake Proof Table
Implement PlanFormal Champion Approval
Start Date: Enter DateEnd Date: Enter Date
Implement sustainable process controls – validate:
Control System Monitoring Plan Response PlanStandardize and translate
$ Benefits validatedGraphical/ statistical summary of improvement
Start Date: 01/01/2013End Date: 06/30/2014
Start Date: 07/01/2014End Date: 03/30/2015
90
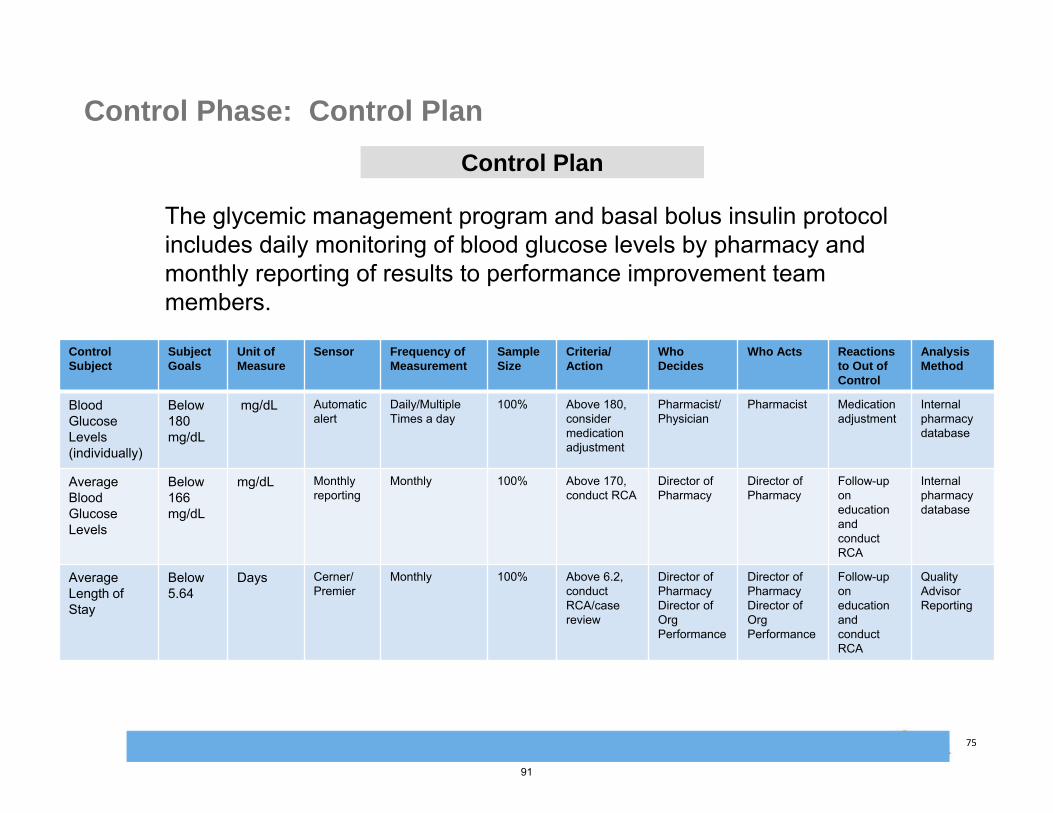
Rob Bryant Proprietary and Confidential 75
Control Phase: Control Plan
Control PlanControl Plan
The glycemic management program and basal bolus insulin protocol includes daily monitoring of blood glucose levels by pharmacy and monthly reporting of results to performance improvement team members.
Control Subject
SubjectGoals
Unit of Measure
Sensor Frequency of Measurement
Sample Size
Criteria/ Action
Who Decides
Who Acts Reactions to Out of Control
Analysis Method
BloodGlucose Levels (individually)
Below 180 mg/dL
mg/dL Automaticalert
Daily/Multiple Times a day
100% Above 180, considermedication adjustment
Pharmacist/ Physician
Pharmacist Medication adjustment
Internal pharmacy database
Average Blood GlucoseLevels
Below 166 mg/dL
mg/dL Monthly reporting
Monthly 100% Above 170, conduct RCA
Director of Pharmacy
Director of Pharmacy
Follow-up on education and conduct RCA
Internal pharmacy database
AverageLength of Stay
Below 5.64
Days Cerner/ Premier
Monthly 100% Above 6.2, conductRCA/case review
Director of PharmacyDirector of Org Performance
Director of PharmacyDirector of Org Performance
Follow-up on education and conduct RCA
QualityAdvisor Reporting
91

Rob Bryant Proprietary and Confidential 76
Control Phase – Procedures which effect Glycemic Management
• The other side of the dilemma – Procedures put in place to deal with the following causes of hypoglycemia during BBIP:
–Tube Feeding Changes: Decrease in tube feed rate, or hold or discontinuation of tube feeds.
– Insulin Hypersensitivity: Patient is very sensitive to insulin dosing; small doses of insulin causing a large decrease in blood glucose.
–Dietary Inconsistency: Changes to diet where patient is taking in less food than usual.
– Insulin Stacking: Insulin dose is given later than scheduled, and multiple insulin doses are given very close to each other.Declining Renal Function: Poor renal function leads to insulin accumulation.
–Other: Includes but not limited to change in steroid administrations, unknown etiology, etc.
92

Rob Bryant Proprietary and Confidential 77
Control Phase – Monitoring of Hypoglycemic Events post-BBIP
93
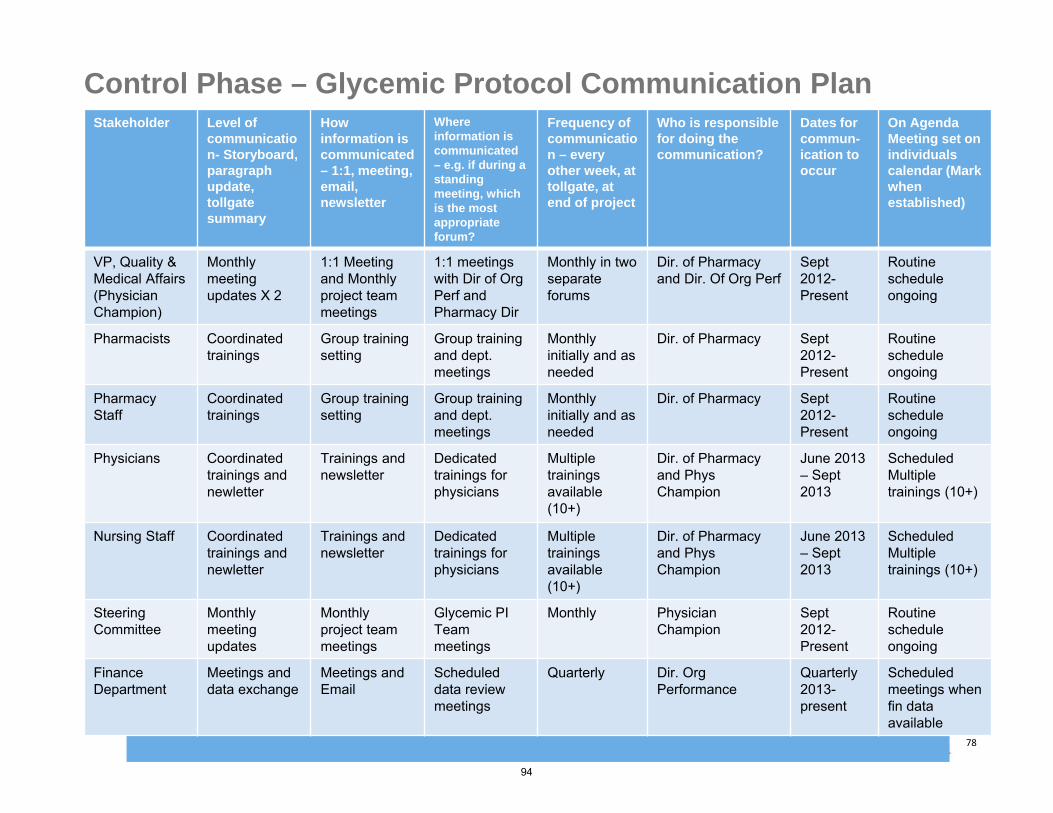
Rob Bryant Proprietary and Confidential 78
Control Phase – Glycemic Protocol Communication PlanStakeholder Level of
communication- Storyboard,paragraph update, tollgate summary
How information is communicated – 1:1, meeting, email, newsletter
Where information is communicated – e.g. if during a standing meeting, which is the most appropriateforum?
Frequency of communication – every other week, at tollgate, at end of project
Who is responsible for doing the communication?
Dates for commun-ication to occur
On Agenda Meeting set on individuals calendar (Markwhen established)
VP, Quality & Medical Affairs (Physician Champion)
Monthly meetingupdates X 2
1:1 Meeting and Monthly project team meetings
1:1 meetingswith Dir of Org Perf and Pharmacy Dir
Monthly in two separate forums
Dir. of Pharmacy and Dir. Of Org Perf
Sept2012-Present
Routine schedule ongoing
Pharmacists Coordinatedtrainings
Group training setting
Group training and dept. meetings
Monthly initially and as needed
Dir. of Pharmacy Sept2012-Present
Routine schedule ongoing
Pharmacy Staff
Coordinatedtrainings
Group training setting
Group training and dept. meetings
Monthly initially and as needed
Dir. of Pharmacy Sept2012-Present
Routine schedule ongoing
Physicians Coordinatedtrainings and newletter
Trainings and newsletter
Dedicated trainings for physicians
Multiple trainings available (10+)
Dir. of Pharmacy and Phys Champion
June 2013 – Sept 2013
Scheduled Multiple trainings (10+)
Nursing Staff Coordinatedtrainings and newletter
Trainings and newsletter
Dedicated trainings for physicians
Multiple trainings available (10+)
Dir. of Pharmacy and Phys Champion
June 2013 – Sept 2013
Scheduled Multiple trainings (10+)
Steering Committee
Monthly meetingupdates
Monthly project team meetings
Glycemic PI Team meetings
Monthly PhysicianChampion
Sept2012-Present
Routine schedule ongoing
FinanceDepartment
Meetings and data exchange
Meetings and Email
Scheduleddata review meetings
Quarterly Dir. OrgPerformance
Quarterly2013-present
Scheduled meetings when fin data available
94
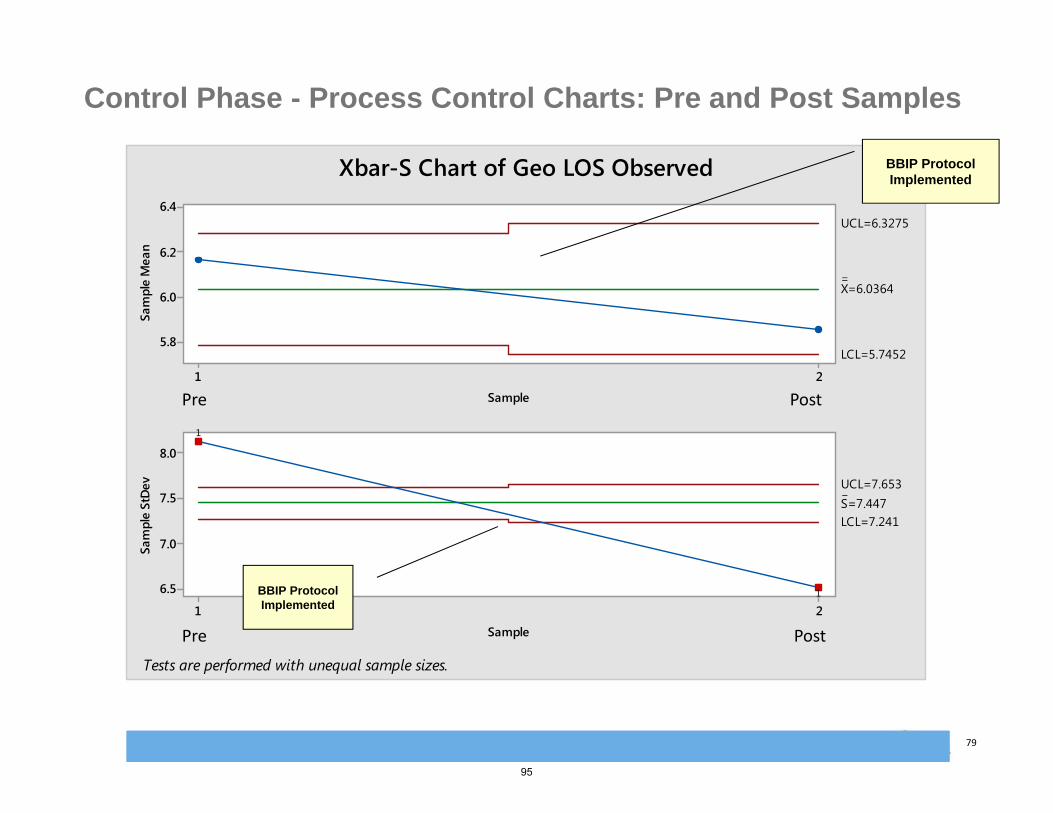
Rob Bryant Proprietary and Confidential 79
21
6.4
6.2
6.0
5.8
Sample
Sam
ple
Mea
n
__X=6.0364
UCL=6.3275
LCL=5.7452
21
8.0
7.5
7.0
6.5
Sample
Sam
ple
StD
ev _S=7.447UCL=7.653
LCL=7.241
1
1
Xbar-S Chart of Geo LOS Observed
Tests are performed with unequal sample sizes.
Control Phase - Process Control Charts: Pre and Post Samples
BBIP Protocol Implemented
BBIP Protocol Implemented
Pre Post
Pre Post
95

Rob Bryant Proprietary and Confidential 80
Control Phase: Control Chart: I Chart
Blood glucose values for protocol participants are only available as a post measure and were only collected starting in October 2013. Data above represents the trend in blood glucose levels from October 2013‐ December 2014. Note that acceptable values are between 70 and 180. Red marks indicate individual outliers.
Blood glucose values improved after BBIP treatment (values included are final values of participants following BBIP protocol prior to discharge). These values have become more centralized over time.
761685609533457381305229153771
450
400
350
300
250
200
150
100
50
Observation
Indi
vidu
al V
alue
_X=166.1UB=180
LB=70
11
1
11
11
1
1
11
1
I Chart of BBIP Min
96

Rob Bryant Proprietary and Confidential 81
Control Phase - Project Results/Benefits
Soft BenefitsSoft BenefitsFinancial (Hard) BenefitsFinancial (Hard) Benefits
Reduce average length of stay (ALOS) by .55 days in diagnosed (coded) diabetic population in 2013 and 2014 compared to pre-implementation timeframe (2012).
Estimated annual cost savings of $197,400 per year, $394,800 for two years. Cost savings are enough to cover the additional $150,000 in pharmacy staffing costs annually with a total net contribution of $47,400.
26% reduction in the Pre-BBIP blood glucose levels for patients on BBIP. Average daily glucose levels are consistently under 180 after 3 days on protocol.
Post-discharge benefits of medication education to diabetic patients.
Introduction of collaborative glycemic monitoring has improved interdepartmental communication
Potential reductions in diabetic complications shown to be associated with the incidence of hyperglycemia.
Project BaselineProject Baseline Project TargetProject Target Project ActualProject Actual
COPQ = -$212,688.00 per yearALOS (2012): 6.19 days(all diagnosed diabetic patients included in ALOS)
COPQ = $0.00ALOS= 6.19-.345 = 5.845 days
COPQ = $212,688.00- $197,400.00 = +$15,288.00 per yearALOS = 5.64 days in 2013 & 2014 (5.86 Sept 2013-Dec 2014 only)Note: $150,000 of $197,400 in cost savings is needed to offset pharmacy staffing costs
97
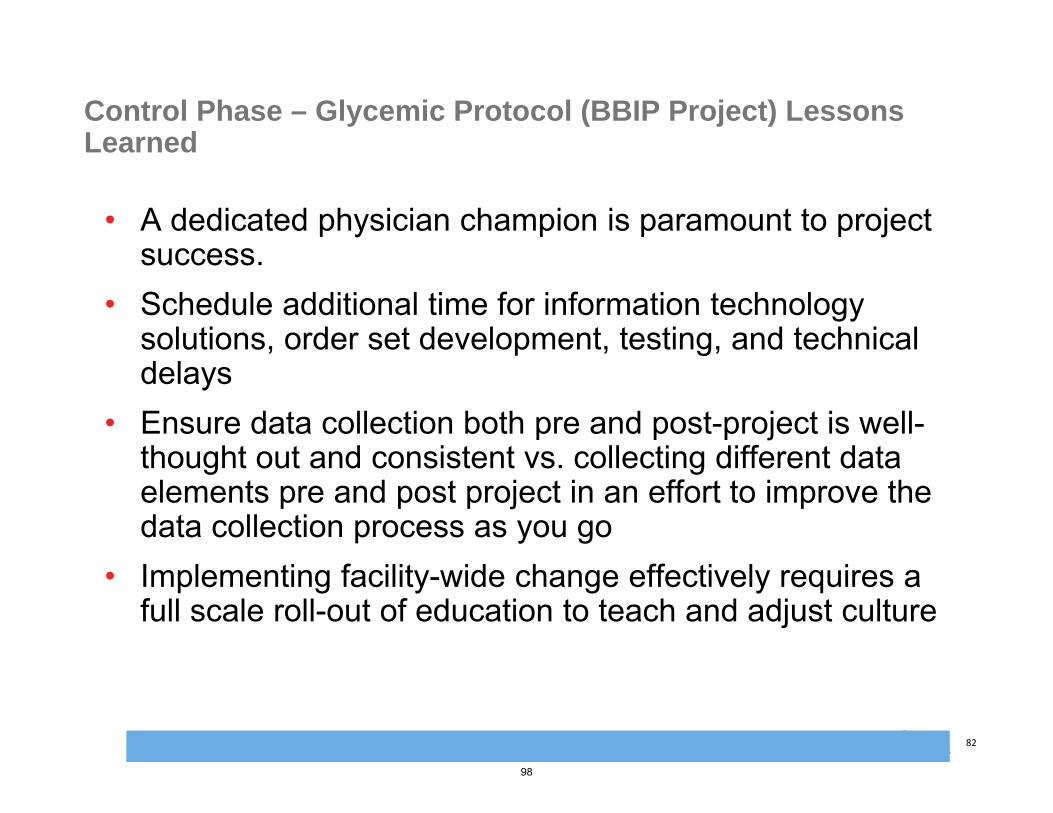
Rob Bryant Proprietary and Confidential 82
Control Phase – Glycemic Protocol (BBIP Project) Lessons Learned
• A dedicated physician champion is paramount to project success.
• Schedule additional time for information technology solutions, order set development, testing, and technical delays
• Ensure data collection both pre and post-project is well-thought out and consistent vs. collecting different data elements pre and post project in an effort to improve the data collection process as you go
• Implementing facility-wide change effectively requires a full scale roll-out of education to teach and adjust culture
98
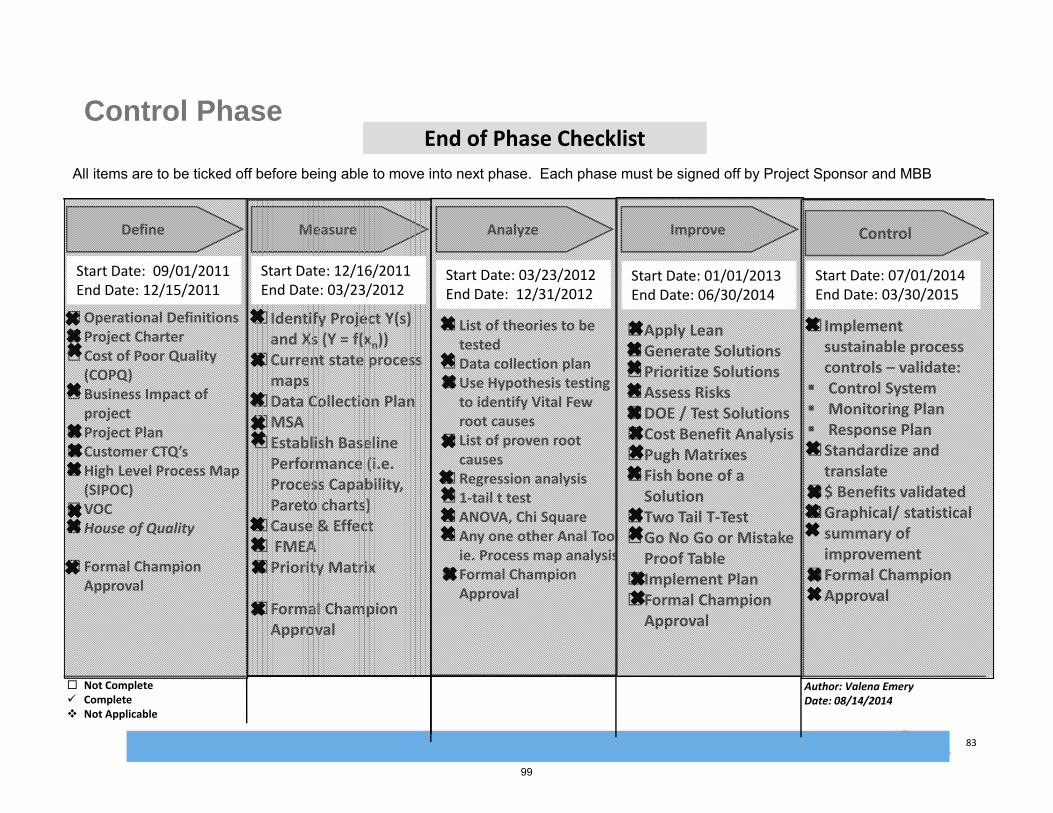
Rob Bryant Proprietary and Confidential 83
End of Phase ChecklistEnd of Phase Checklist
Start Date: Enter DateEnd Date: Enter Date
Operational Definitions Project Charter Cost of Poor Quality
(COPQ) Business Impact of
project Project Plan Customer CTQ’sHigh Level Process Map
(SIPOC)VOCHouse of Quality
Formal Champion Approval
Define Measure Analyze Improve
Start Date: Enter DateEnd Date: Enter Date
Start Date: Enter DateEnd Date: Enter Date
Not Complete Complete Not Applicable
Author: Valena Emery Date: 08/14/2014
All items are to be ticked off before being able to move into next phase. Each phase must be signed off by Project Sponsor and MBB
Control Phase
Start Date: 09/01/2011End Date: 12/15/2011
Identify Project Y(s) and Xs (Y = f(xn))
Current state process maps
Data Collection PlanMSAEstablish Baseline Performance (i.e. Process Capability, Pareto charts)
Cause & Effect FMEAPriority Matrix
Formal Champion Approval
Start Date: 12/16/2011End Date: 03/23/2012
Start Date: Enter DateEnd Date: Enter Date
List of theories to be tested
Data collection planUse Hypothesis testing
to identify Vital Few root causes
List of proven root causes
Regression analysis 1‐tail t testANOVA, Chi SquareAny one other Anal Tool
ie. Process map analysis Formal Champion
Approval
Start Date: 03/23/2012End Date: 12/31/2012
Start Date: Enter DateEnd Date: Enter Date
Apply LeanGenerate SolutionsPrioritize SolutionsAssess RisksDOE / Test SolutionsCost Benefit AnalysisPugh MatrixesFish bone of a Solution
Two Tail T‐TestGo No Go or Mistake Proof Table
Implement PlanFormal Champion Approval
Start Date: 01/01/2013End Date: 06/30/2014
Control
Start Date: Enter DateEnd Date: Enter Date
Implement sustainable process controls – validate:
Control System Monitoring Plan Response PlanStandardize and translate
$ Benefits validatedGraphical/ statistical summary of improvement
Formal Champion Approval
Start Date: 07/01/2014End Date: 03/30/2015
99
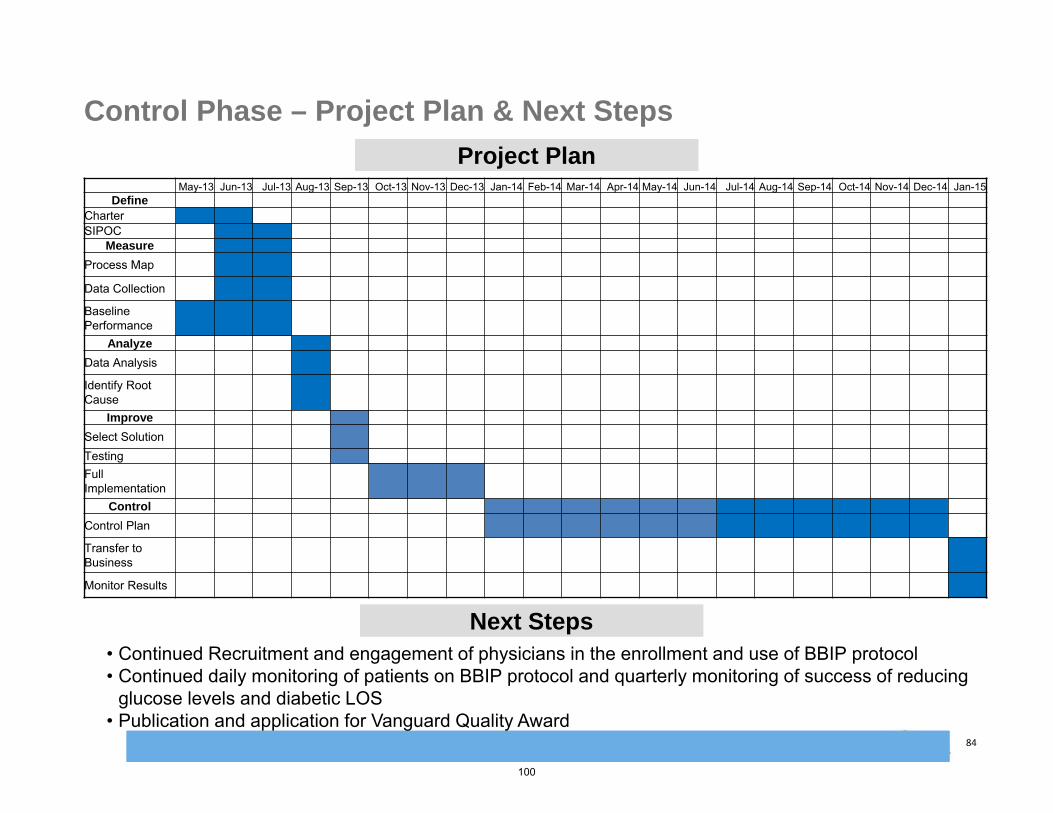
Rob Bryant Proprietary and Confidential 84
Next StepsNext Steps• Continued Recruitment and engagement of physicians in the enrollment and use of BBIP protocol• Continued daily monitoring of patients on BBIP protocol and quarterly monitoring of success of reducing
glucose levels and diabetic LOS • Publication and application for Vanguard Quality Award
Control Phase – Project Plan & Next Steps
Project PlanProject PlanMay-13 Jun-13 Jul-13 Aug-13 Sep-13 Oct-13 Nov-13 Dec-13 Jan-14 Feb-14 Mar-14 Apr-14 May-14 Jun-14 Jul-14 Aug-14 Sep-14 Oct-14 Nov-14 Dec-14 Jan-15
Define CharterSIPOC
Measure
Process Map
Data Collection
Baseline Performance
Analyze
Data Analysis
Identify Root Cause
Improve
Select SolutionTestingFull Implementation
Control
Control Plan
Transfer to Business
Monitor Results
100

Rob Bryant Proprietary and Confidential 8/19/2016 11:31 AM PPT 2007_Planning_FMT 85
THANK YOU
Thank you very much for taking the time to hear about our work on the Glycemic
Management Protocol.
PRESENTATION TITLE
101

APPENDIX C: FACT SHEET
102
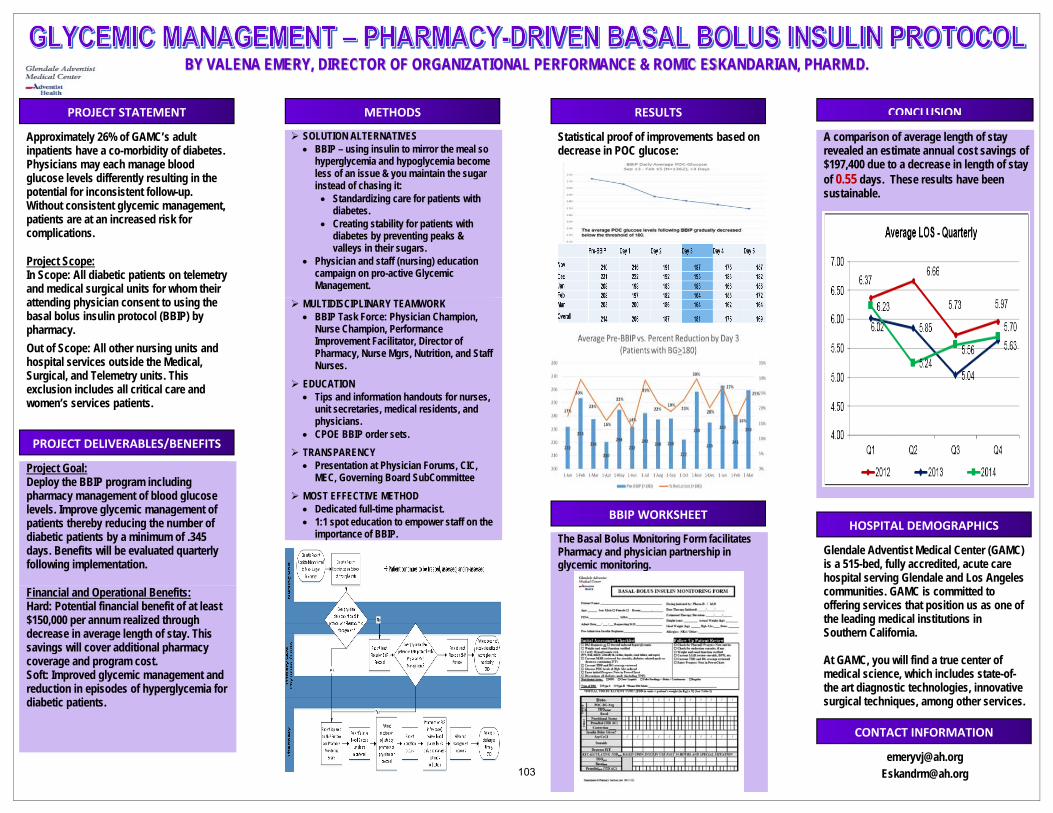
BY VALENA EMERY, DIRECTOR OF ORGANIZATIONAL PERFORMANCE & ROMIC ESKANDARIAN, PHARM.D.
Approximately 26% of GAMC’s adult inpatients have a co-morbidity of diabetes. Physicians may each manage blood glucose levels differently resulting in the potential for inconsistent follow-up. Without consistent glycemic management, patients are at an increased risk for complications.
Project Scope: In Scope: All diabetic patients on telemetry and medical surgical units for whom their attending physician consent to using the basal bolus insulin protocol (BBIP) by pharmacy.
Out of Scope: All other nursing units and hospital services outside the Medical, Surgical, and Telemetry units. This exclusion includes all critical care and women’s services patients.
Project Goal: Deploy the BBIP program including pharmacy management of blood glucose levels. Improve glycemic management of patients thereby reducing the number of diabetic patients by a minimum of .345 days. Benefits will be evaluated quarterly following implementation.
Financial and Operational Benefits: Hard: Potential financial benefit of at least $150,000 per annum realized through decrease in average length of stay. This savings will cover additional pharmacy coverage and program cost. Soft: Improved glycemic management and reduction in episodes of hyperglycemia for diabetic patients.
SOLUTION ALTERNATIVES BBIP – using insulin to mirror the meal so
hyperglycemia and hypoglycemia become less of an issue & you maintain the sugar instead of chasing it: Standardizing care for patients with
diabetes. Creating stability for patients with
diabetes by preventing peaks & valleys in their sugars.
Physician and staff (nursing) education campaign on pro-active Glycemic Management.
MULTIDISCIPLINARY TEAMWORK BBIP Task Force: Physician Champion,
Nurse Champion, Performance Improvement Facilitator, Director of Pharmacy, Nurse Mgrs, Nutrition, and Staff Nurses.
EDUCATION Tips and information handouts for nurses,
unit secretaries, medical residents, and physicians.
CPOE BBIP order sets.
TRANSPARENCY Presentation at Physician Forums, CIC,
MEC, Governing Board SubCommittee
MOST EFFECTIVE METHOD Dedicated full-time pharmacist. 1:1 spot education to empower staff on the
importance of BBIP.
Statistical proof of improvements based on decrease in POC glucose:
The Basal Bolus Monitoring Form facilitates Pharmacy and physician partnership in glycemic monitoring.
A comparison of average length of stay revealed an estimate annual cost savings of $197,400 due to a decrease in length of stay of 0.55 days. These results have been sustainable.
Glendale Adventist Medical Center (GAMC) is a 515-bed, fully accredited, acute care hospital serving Glendale and Los Angeles communities. GAMC is committed to offering services that position us as one of the leading medical institutions in Southern California. At GAMC, you will find a true center of medical science, which includes state-of-the art diagnostic technologies, innovative surgical techniques, among other services.
PROJECT STATEMENT
PROJECT DELIVERABLES/BENEFITS
METHODS RESULTS
BBIP WORKSHEET
CONCLUSION
HOSPITAL DEMOGRAPHICS
CONTACT INFORMATION
103

APPENDIX D: CURRENT ONGOING BBIP MONITORING RESULTS
104
Basal Bolus Insulin Protocol (BBIP)
Romic Eskandarian, Pharm.D.
Director of Pharmacy
Glendale Adventist Medical Center
105
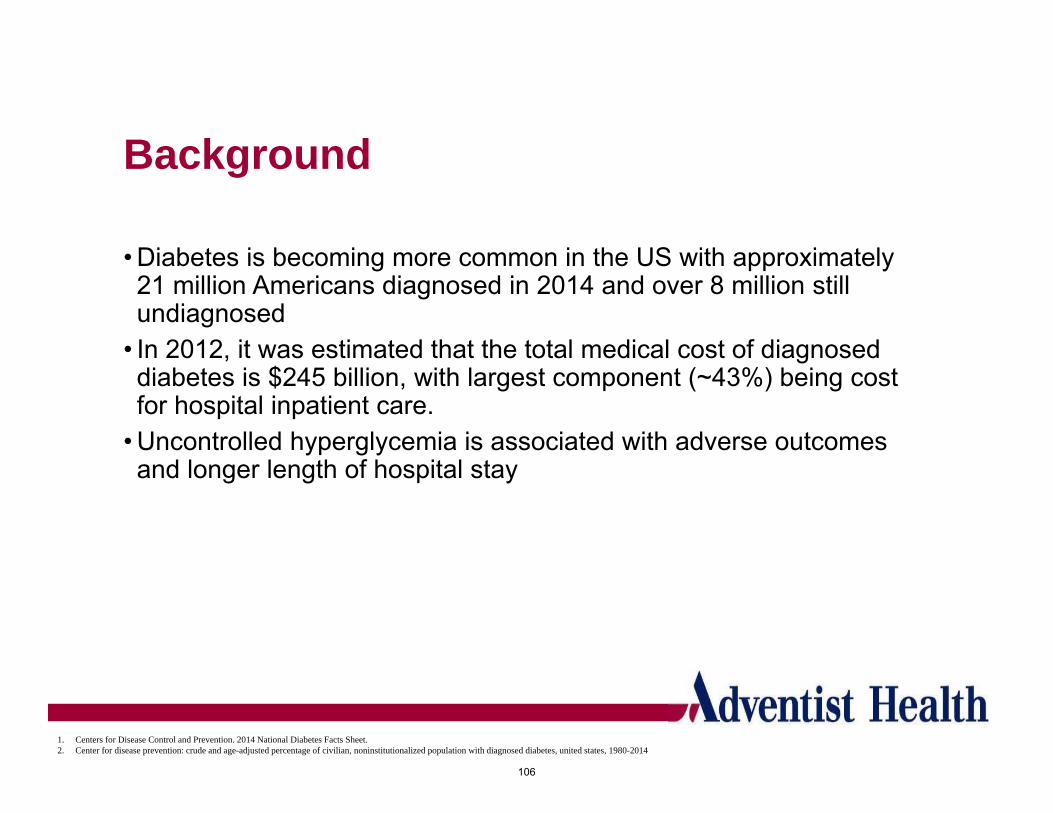
Background
• Diabetes is becoming more common in the US with approximately 21 million Americans diagnosed in 2014 and over 8 million still undiagnosed
• In 2012, it was estimated that the total medical cost of diagnosed diabetes is $245 billion, with largest component (~43%) being cost for hospital inpatient care.
• Uncontrolled hyperglycemia is associated with adverse outcomes and longer length of hospital stay
1. Centers for Disease Control and Prevention. 2014 National Diabetes Facts Sheet.2. Center for disease prevention: crude and age-adjusted percentage of civilian, noninstitutionalized population with diagnosed diabetes, united states, 1980-2014
106
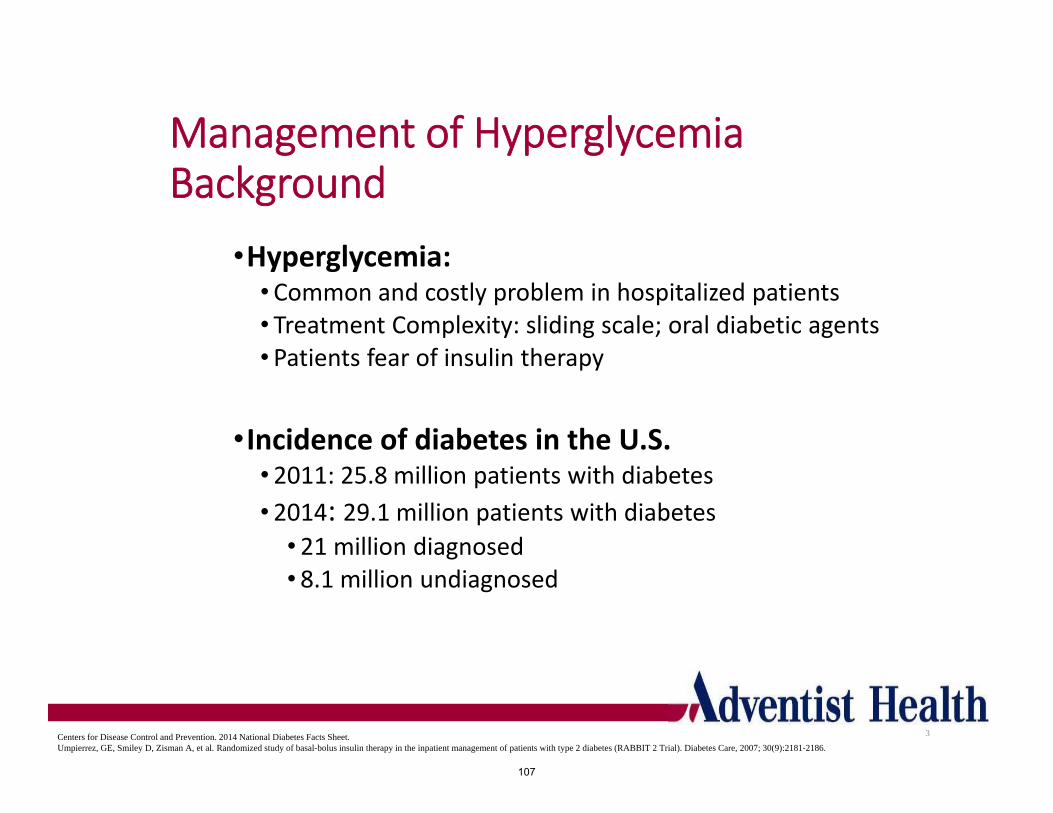
Management of HyperglycemiaBackground
•Hyperglycemia: •Common and costly problem in hospitalized patients• Treatment Complexity: sliding scale; oral diabetic agents• Patients fear of insulin therapy
•Incidence of diabetes in the U.S.• 2011: 25.8 million patients with diabetes
• 2014: 29.1 million patients with diabetes
• 21 million diagnosed• 8.1 million undiagnosed
3Centers for Disease Control and Prevention. 2014 National Diabetes Facts Sheet.Umpierrez, GE, Smiley D, Zisman A, et al. Randomized study of basal-bolus insulin therapy in the inpatient management of patients with type 2 diabetes (RABBIT 2 Trial). Diabetes Care, 2007; 30(9):2181-2186.
107
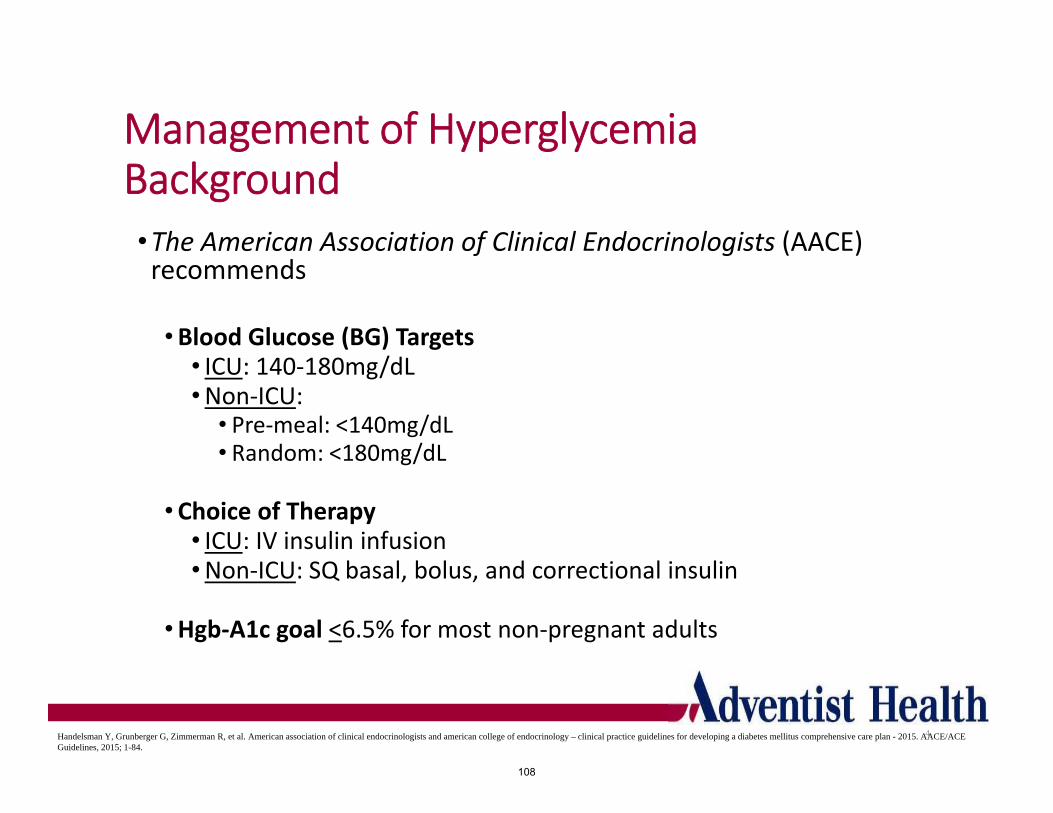
Management of HyperglycemiaBackground•The American Association of Clinical Endocrinologists (AACE) recommends
•Blood Glucose (BG) Targets• ICU: 140‐180mg/dL•Non‐ICU:
• Pre‐meal: <140mg/dL• Random: <180mg/dL
•Choice of Therapy• ICU: IV insulin infusion•Non‐ICU: SQ basal, bolus, and correctional insulin
•Hgb‐A1c goal <6.5% for most non‐pregnant adults
4Handelsman Y, Grunberger G, Zimmerman R, et al. American association of clinical endocrinologists and american college of endocrinology – clinical practice guidelines for developing a diabetes mellitus comprehensive care plan - 2015. AACE/ACE Guidelines, 2015; 1-84.
108
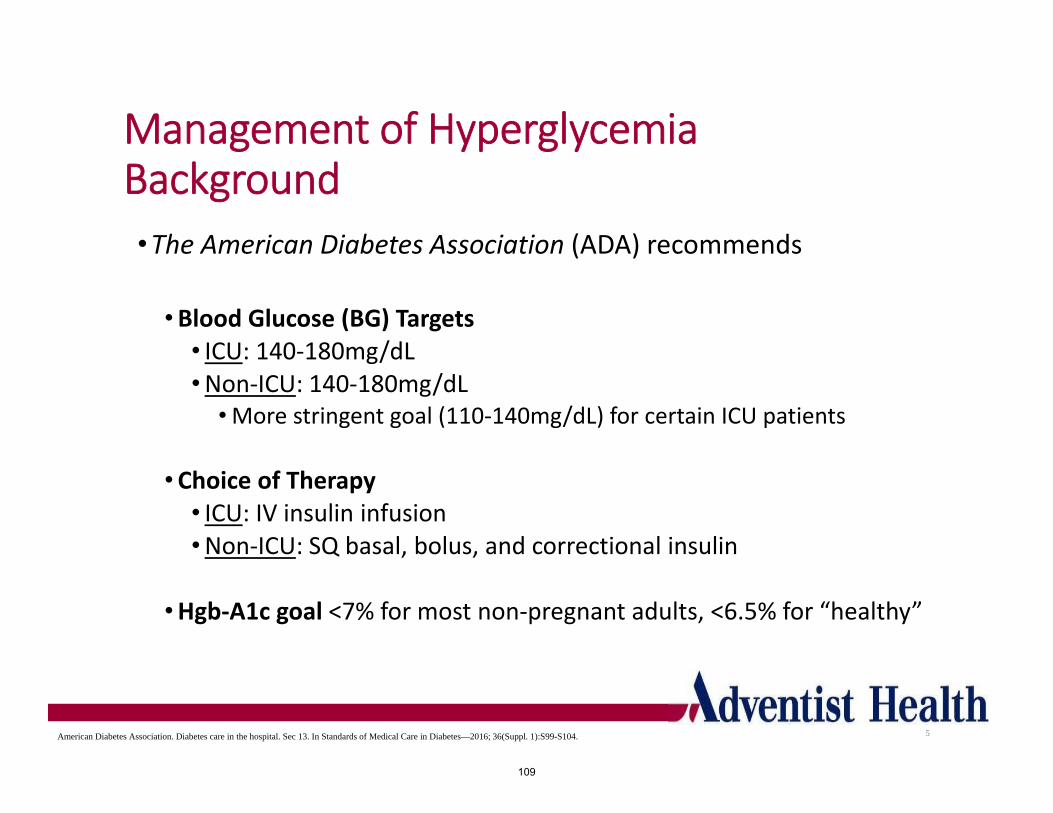
Management of HyperglycemiaBackground•The American Diabetes Association (ADA) recommends
•Blood Glucose (BG) Targets• ICU: 140‐180mg/dL•Non‐ICU: 140‐180mg/dL
•More stringent goal (110‐140mg/dL) for certain ICU patients
•Choice of Therapy• ICU: IV insulin infusion•Non‐ICU: SQ basal, bolus, and correctional insulin
•Hgb‐A1c goal <7% for most non‐pregnant adults, <6.5% for “healthy”
5American Diabetes Association. Diabetes care in the hospital. Sec 13. In Standards of Medical Care in Diabetes—2016; 36(Suppl. 1):S99-S104.
109
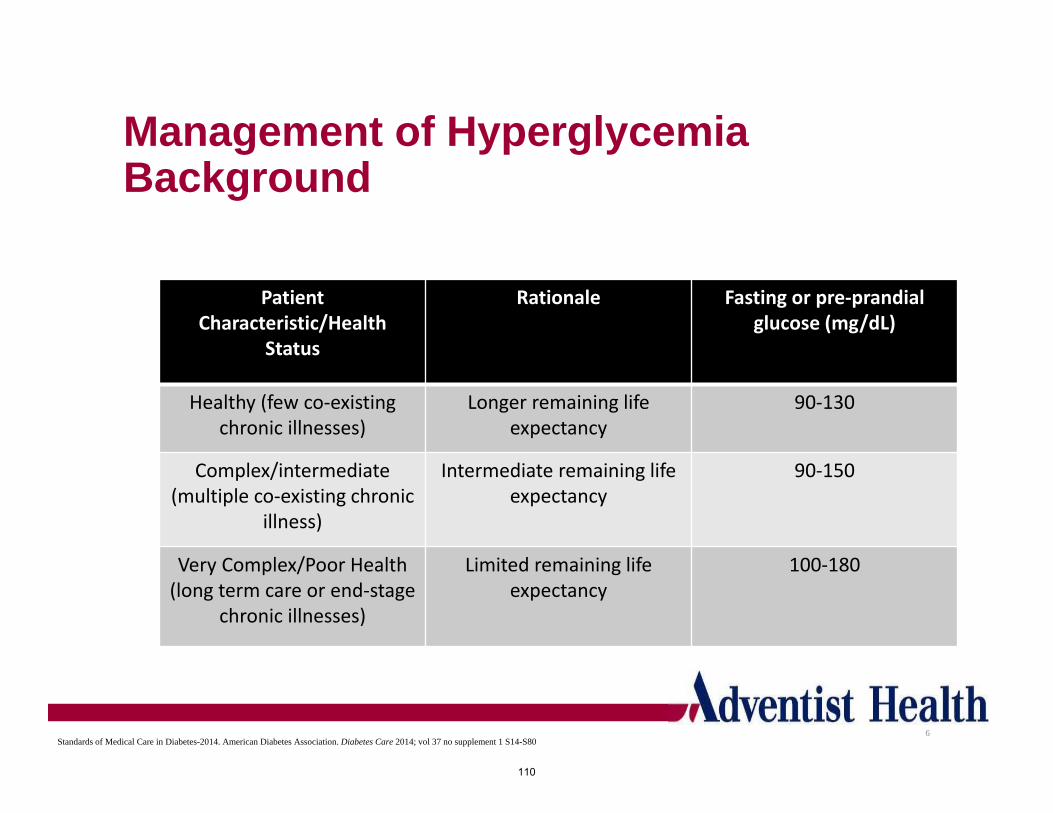
Management of HyperglycemiaBackground
Patient Characteristic/Health
Status
Rationale Fasting or pre‐prandial glucose (mg/dL)
Healthy (few co‐existingchronic illnesses)
Longer remaining lifeexpectancy
90‐130
Complex/intermediate (multiple co‐existing chronic
illness)
Intermediate remaining life expectancy
90‐150
Very Complex/Poor Health (long term care or end‐stage
chronic illnesses)
Limited remaining life expectancy
100‐180
6Standards of Medical Care in Diabetes-2014. American Diabetes Association. Diabetes Care 2014; vol 37 no supplement 1 S14-S80
110
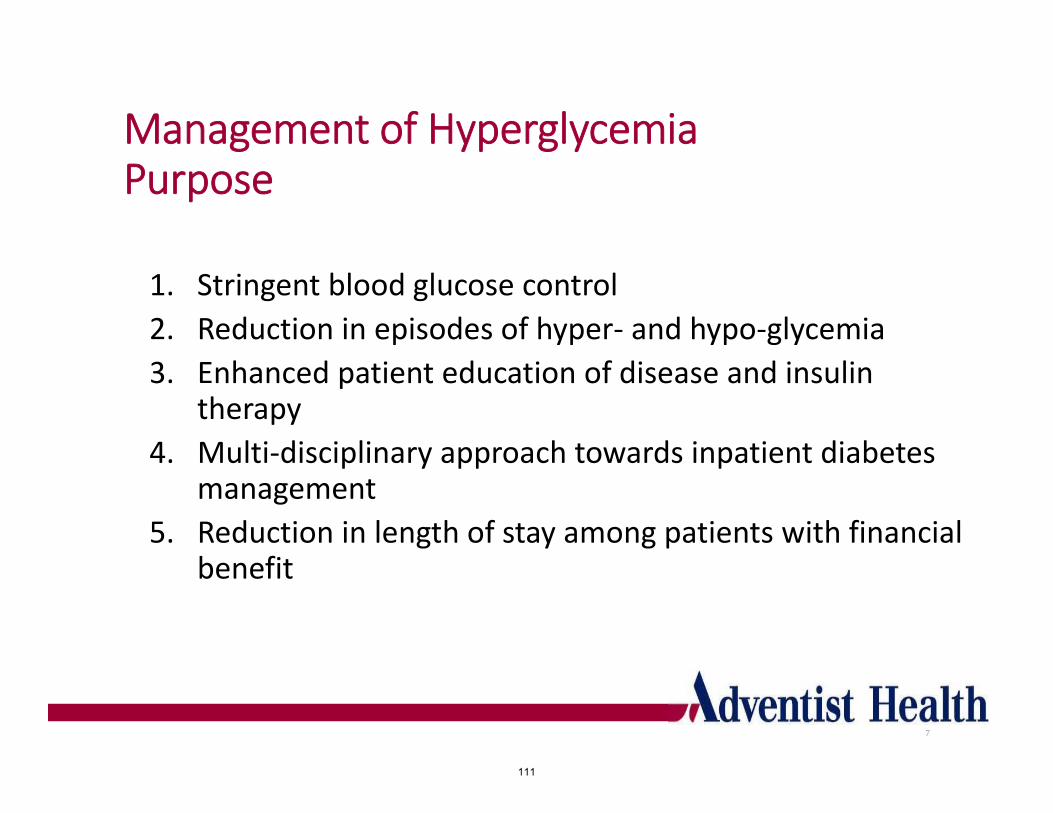
Management of HyperglycemiaPurpose
1. Stringent blood glucose control
2. Reduction in episodes of hyper‐ and hypo‐glycemia
3. Enhanced patient education of disease and insulin therapy
4. Multi‐disciplinary approach towards inpatient diabetes management
5. Reduction in length of stay among patients with financial benefit
7
111

Hyperglycemia vs Rest of Patient Population (2013 Patients Length of Stay Comparison)
6.57.0
6.5 6.45.9
6.5
5.8 5.9 5.8 6.06.2
8.2
4.7 4.7 4.7 4.6 4.7 4.5 4.4 4.64.3 4.5 4.5 4.6
0
1
2
3
4
5
6
7
8
9
January February March April May June July August September October November December
BG>180 BG<180
Average LOS (BG>180) Average LOS (BG<180) LOS Reduction
6.40 4.57 28.5%
112

Insulin Pharmacokinetics
9
Onset Peak Duration Rapid-Acting Aspart
10-30 min 0.5-3 hours 3-5 hours Glulisine Lispro Short-Acting Regular 30 min 2-5 hours 4-12 hours Intermediate-Acting NPH 1-2 hours 4-12 hours 14-24 hours Long-Acting Detemir 3-4 hours Minimal 6-23 hours Glargine Minimal >24 hours
: Insulin used in pharmacy protocol at GAMC
113
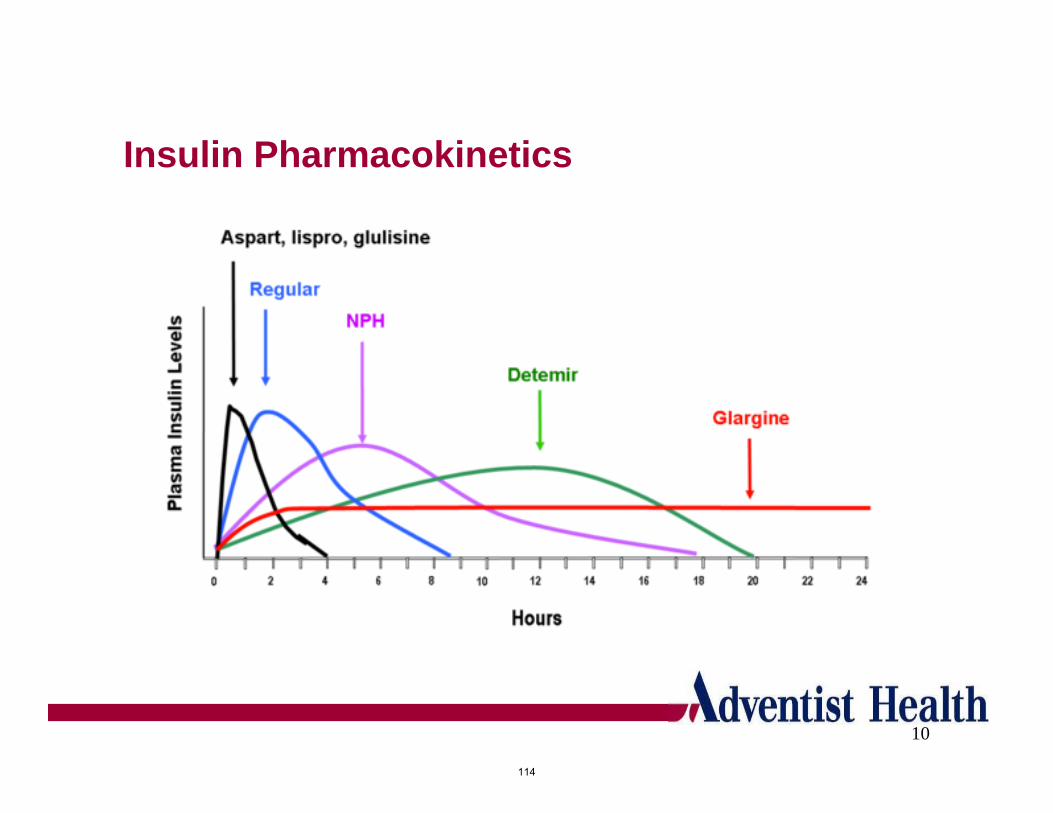
Insulin Pharmacokinetics
10
114
Outcomes AnalysisSep 2013 to July 2016
Total Patients Since Go-Live: 2,670
115
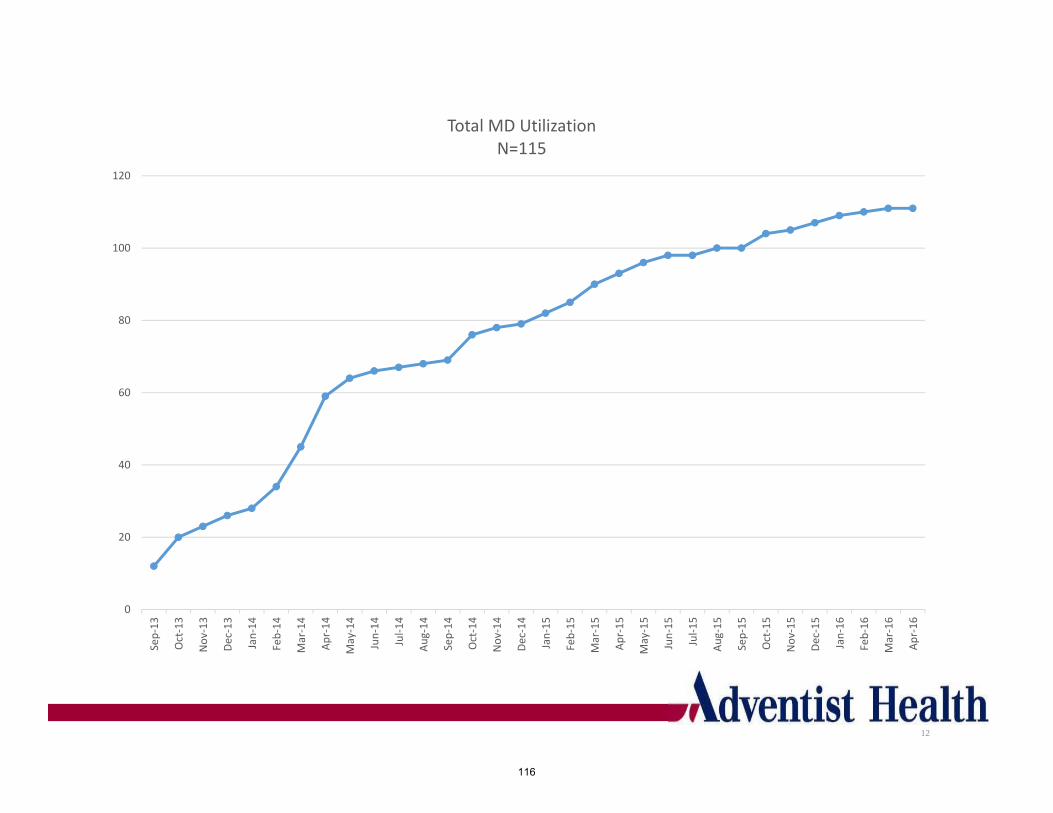
12
0
20
40
60
80
100
120
Sep‐13
Oct‐13
Nov‐13
Dec‐13
Jan‐14
Feb‐14
Mar‐14
Apr‐14
May‐14
Jun‐14
Jul‐14
Aug‐14
Sep‐14
Oct‐14
Nov‐14
Dec‐14
Jan‐15
Feb‐15
Mar‐15
Apr‐15
May‐15
Jun‐15
Jul‐15
Aug‐15
Sep‐15
Oct‐15
Nov‐15
Dec‐15
Jan‐16
Feb‐16
Mar‐16
Apr‐16
Total MD UtilizationN=115
116
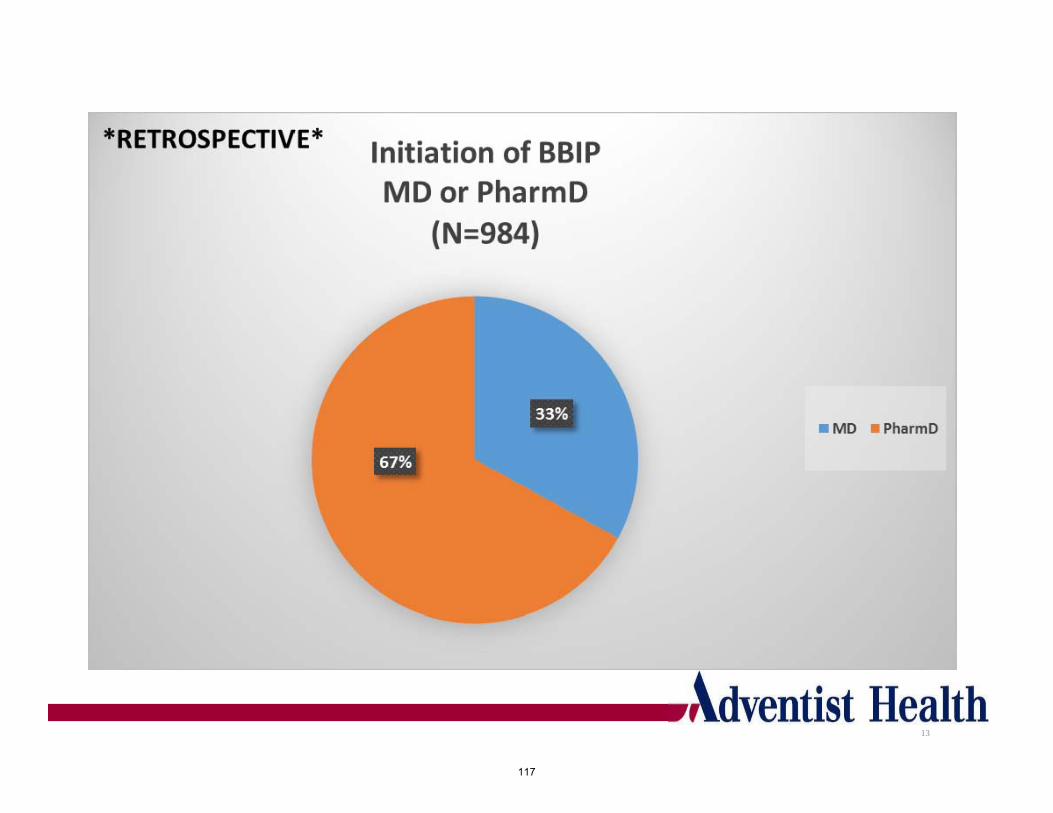
13
117
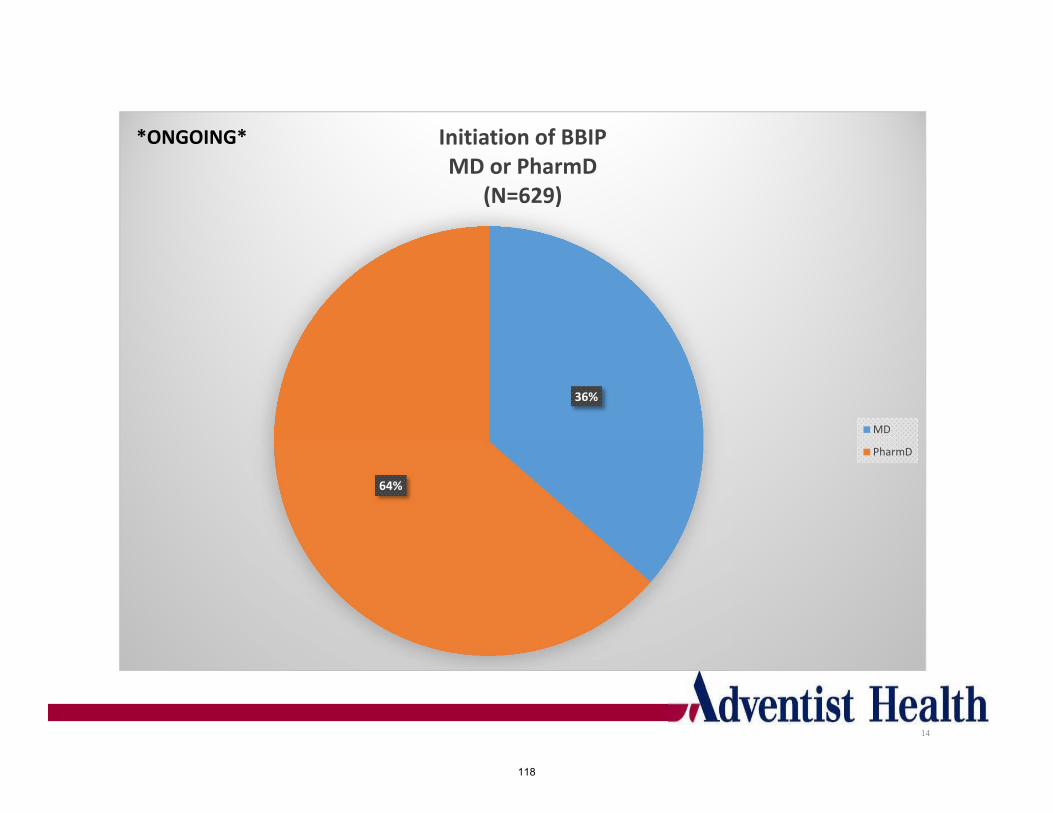
14
36%
64%
Initiation of BBIPMD or PharmD
(N=629)
MD
PharmD
*ONGOING*
118

15
39
312
363 372 363
324334 325 317
257
359 350332
303
336
380
528
392414
395 403 406391
407
382
467
430
333
408
381
299
356
384
338
435
0
100
200
300
400
500
Sep‐13
Oct‐13
Nov‐13
Dec‐13
Jan‐14
Feb‐14
Mar‐14
Apr‐14
May‐14
Jun‐14
Jul‐14
Aug‐14
Sep‐14
Oct‐14
Nov‐14
Dec‐14
Jan‐15
Feb‐15
Mar‐15
Apr‐15
May‐15
Jun‐15
Jul‐15
Aug‐15
Sep‐15
Oct‐15
Nov‐15
Dec‐15
Jan‐16
Feb‐16
Mar‐16
Apr‐16
May‐16
Jun‐16
Jul‐16
Number Patient Days of TherapySep 13 ‐ Jul 16
Total Consult Days (N=12615), Total Patients Consulted (N=2445)
119
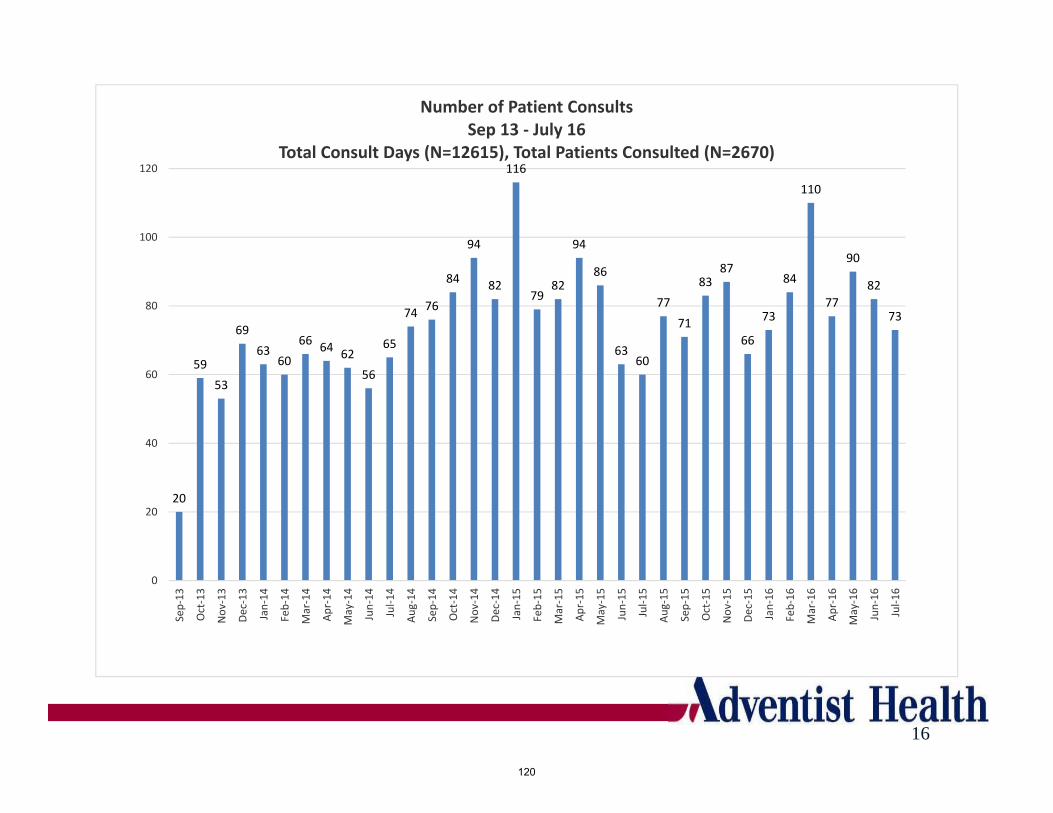
16
20
59
53
69
6360
6664
62
56
65
7476
84
94
82
116
7982
94
86
6360
77
71
8387
66
73
84
110
77
90
82
73
0
20
40
60
80
100
120Sep‐13
Oct‐13
Nov‐13
Dec‐13
Jan‐14
Feb‐14
Mar‐14
Apr‐14
May‐14
Jun‐14
Jul‐14
Aug‐14
Sep‐14
Oct‐14
Nov‐14
Dec‐14
Jan‐15
Feb‐15
Mar‐15
Apr‐15
May‐15
Jun‐15
Jul‐15
Aug‐15
Sep‐15
Oct‐15
Nov‐15
Dec‐15
Jan‐16
Feb‐16
Mar‐16
Apr‐16
May‐16
Jun‐16
Jul‐16
Number of Patient ConsultsSep 13 ‐ July 16
Total Consult Days (N=12615), Total Patients Consulted (N=2670)
120

2.0
5.3
6.8
5.4
5.8
5.45.1 5.1 5.1
4.6
5.5
4.7
4.4
3.6 3.6
4.6 4.6
5.0 5.0
4.2
4.7
6.4 6.5
5.3 5.45.6
4.9 5.0
5.6
4.5
2.7
4.6
4.34.1
6.0
‐0.5
0.5
1.5
2.5
3.5
4.5
5.5
6.5
7.5
Sep‐13
Oct‐13
Nov‐13
Dec‐13
Jan‐14
Feb‐14
Mar‐14
Apr‐14
May‐14
Jun‐14
Jul‐14
Aug‐14
Sep‐14
Oct‐14
Nov‐14
Dec‐14
Jan‐15
Feb‐15
Mar‐15
Apr‐15
May‐15
Jun‐15
Jul‐15
Aug‐15
Sep‐15
Oct‐15
Nov‐15
Dec‐15
Jan‐16
Feb‐16
Mar‐16
Apr‐16
May‐16
Jun‐ 16
Jul‐16
Average Days of TherapySep 13 ‐ Jul 16
Overall Average Length of Therapy (4.9 days), Total Patient Consults (N=2670)
17
121

18
0.0
1.0
2.0
3.0
4.0
5.0
6.0
7.0
QTR 4 2013 QTR 1 2014 QTR 2 2014 QTR 3 2014 QTR 4 2014 QTR 1 2015 QTR 2 2015 QTR 3 2015 QTR 4 2015 QTR 1 2016 QTR 2 2016
Average Days of Therapy (Quarterly)Sep 13 ‐ Jun 16
Overall Average Length of Therapy (4.9 days), Total Patient Consults (N=2597)
122
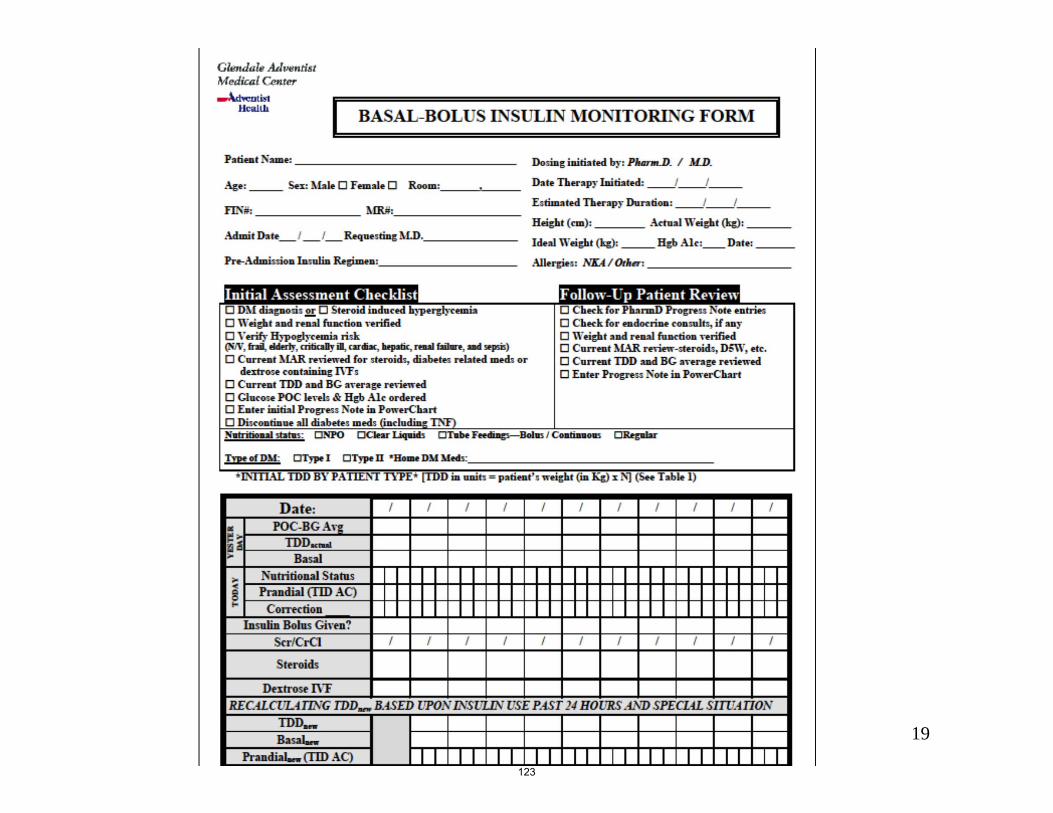
19
123
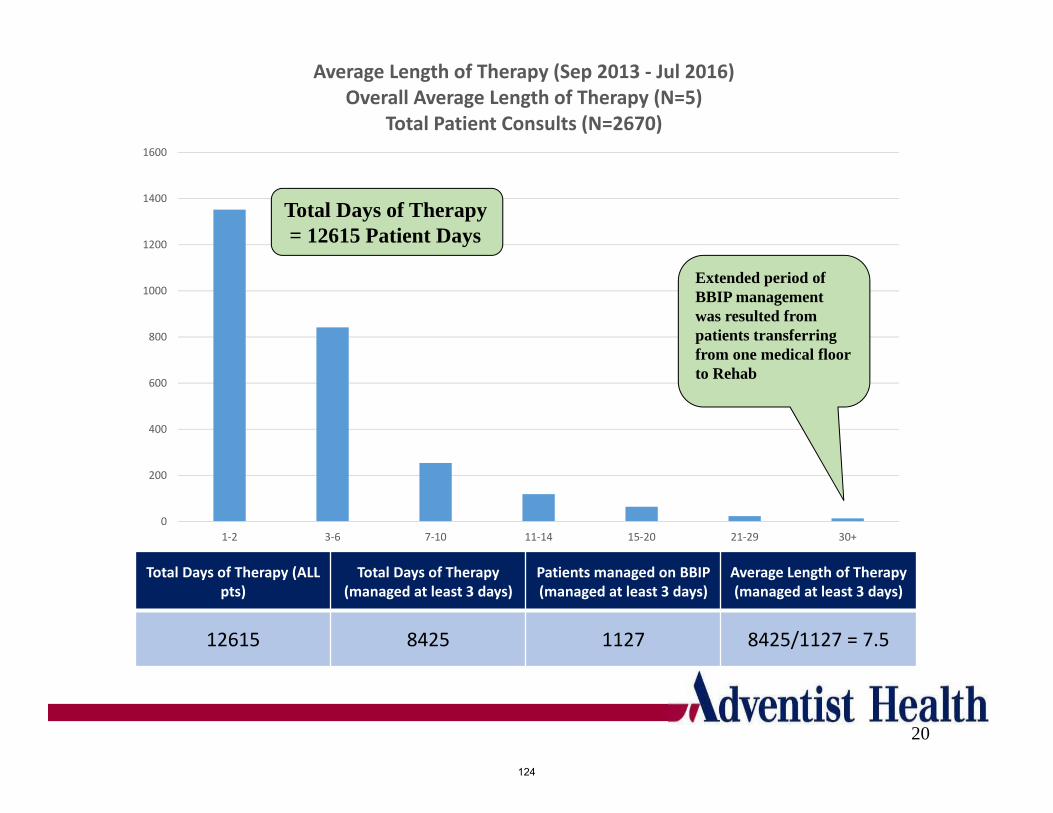
0
200
400
600
800
1000
1200
1400
1600
1‐2 3‐6 7‐10 11‐14 15‐20 21‐29 30+
Average Length of Therapy (Sep 2013 ‐ Jul 2016)Overall Average Length of Therapy (N=5)
Total Patient Consults (N=2670)
20
Extended period of BBIP management was resulted from patients transferring from one medical floor to Rehab
Total Days of Therapy = 12615 Patient Days
Total Days of Therapy (ALL pts)
Total Days of Therapy (managed at least 3 days)
Patients managed on BBIP (managed at least 3 days)
Average Length of Therapy (managed at least 3 days)
12615 8425 1127 8425/1127 = 7.5
124

21
12
27
31
34 34
37 3840 40 41 41 41 41 42 42 42 42 43 43 43 43 43 43 43 44 44 44 45 45 46
48 4850 51 51
‐5
5
15
25
35
45
55
Sep‐13
Oct‐13
Nov‐13
Dec‐13
Jan‐14
Feb‐14
Mar‐14
Apr‐14
May‐14
Jun‐14
Jul‐14
Aug‐14
Sep‐14
Oct‐14
Nov‐14
Dec‐14
Jan‐15
Feb‐15
Mar‐15
Apr‐15
May‐15
Jun‐15
Jul‐15
Aug‐15
Sep‐15
Oct‐15
Nov‐15
Dec‐15
Jan‐16
Feb‐16
Mar‐16
Apr‐16
May‐16
Jun‐16
Jul‐16
Total Number of Physician Auto‐Consults
125
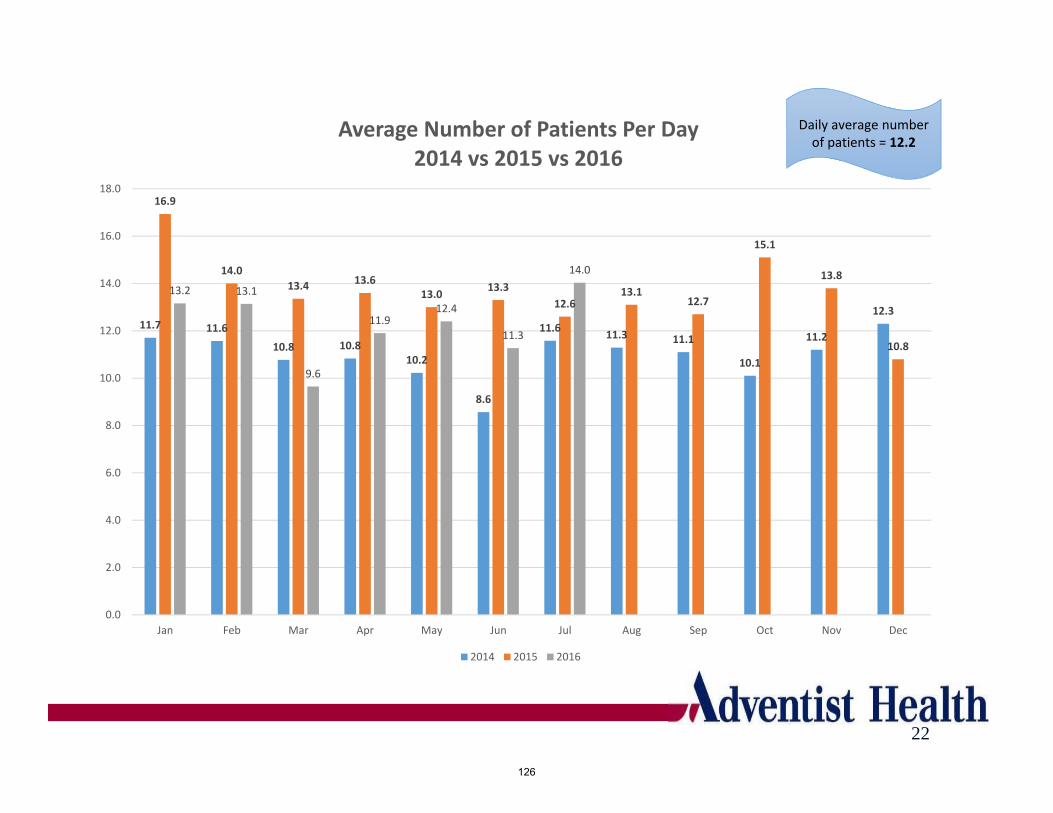
22
Daily average number of patients = 12.2
11.7 11.6
10.8 10.810.2
8.6
11.611.3 11.1
10.1
11.2
12.3
16.9
14.0
13.4 13.613.0
13.3
12.613.1
12.7
15.1
13.8
10.8
13.2 13.1
9.6
11.912.4
11.3
14.0
0.0
2.0
4.0
6.0
8.0
10.0
12.0
14.0
16.0
18.0
Jan Feb Mar Apr May Jun Jul Aug Sep Oct Nov Dec
Average Number of Patients Per Day2014 vs 2015 vs 2016
2014 2015 2016
126

23
11.7 11.610.8 10.8 10.2
8.6
11.6 11.3 11.110.1
11.212.3
16.9
14.013.4 13.6 13.0 13.3
12.6 13.1 12.7
15.113.8
10.8
13.2 13.1
9.6
11.9 12.411.3
14.0
0.0
2.0
4.0
6.0
8.0
10.0
12.0
14.0
16.0
18.0
Jan Feb Mar Apr May Jun Jul Aug Sep Oct Nov Dec
Average Number of Patients Per Day2014 vs 2015 vs 2016
2014 2015 2016
5.85.4
5.1 5.1 5.14.6
5.5
4.74.4
3.6 3.6
4.64.65.0 5.0
4.24.7
6.4 6.5
5.3 5.4 5.6
4.9 5.0
5.6
4.5
2.7
4.64.3 4.1
6
0.0
1.0
2.0
3.0
4.0
5.0
6.0
7.0
Days of Tx by Month2014 vs 2015 vs 2016
2014 2015 2016
127
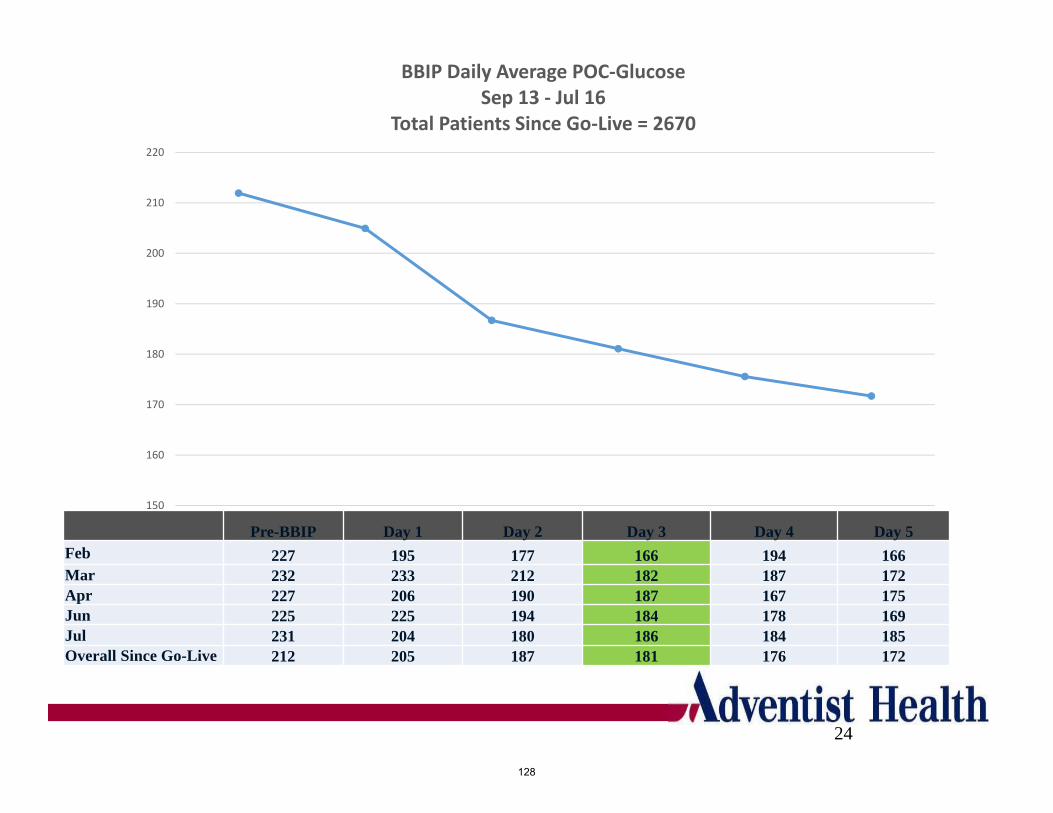
150
160
170
180
190
200
210
220
1 2 3 4 5 6
BBIP Daily Average POC‐GlucoseSep 13 ‐ Jul 16
Total Patients Since Go‐Live = 2670
24
Pre-BBIP Day 1 Day 2 Day 3 Day 4 Day 5Feb 227 195 177 166 194 166Mar 232 233 212 182 187 172Apr 227 206 190 187 167 175Jun 225 225 194 184 178 169Jul 231 204 180 186 184 185Overall Since Go-Live 212 205 187 181 176 172
128
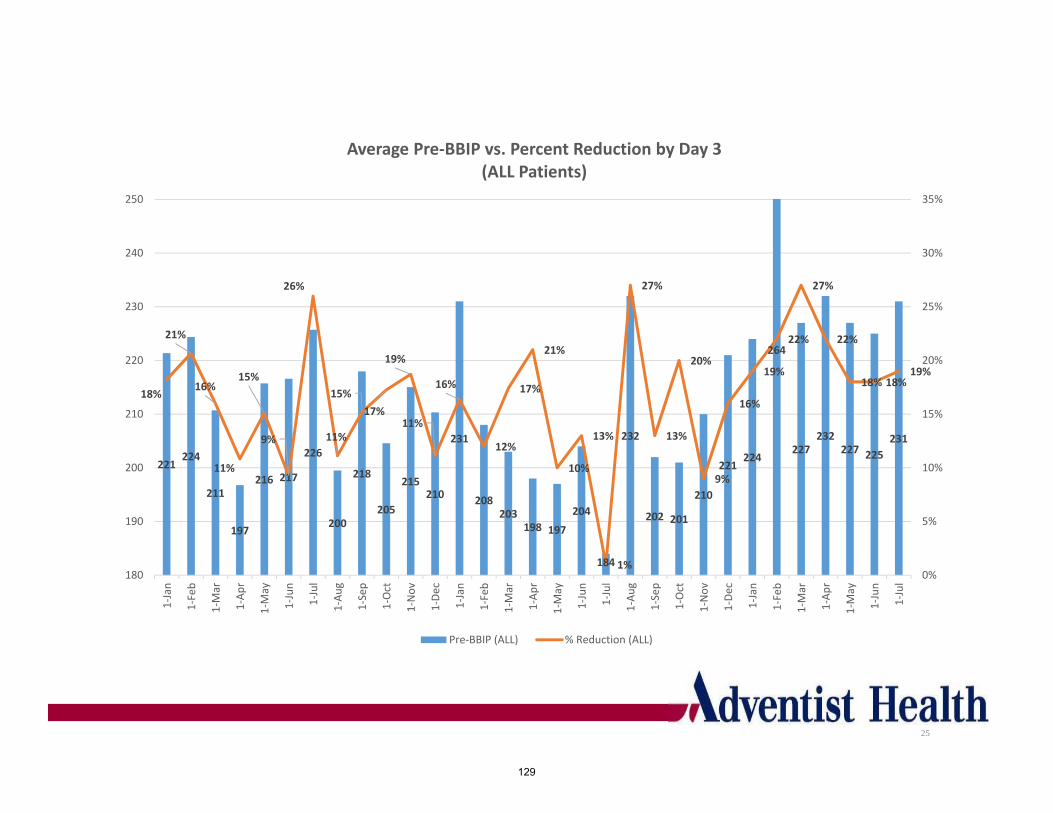
25
221224
211
197
216 217
226
200
218
205
215210
231
208203
198 197
204
184
232
202 201
210
221224
264
227232
227 225
231
18%
21%
16%
11%
15%
9%
26%
11%
15%
17%
19%
11%
16%
12%
17%
21%
10%
13%
1%
27%
13%
20%
9%
16%
19%
22%
27%
22%
18% 18%19%
0%
5%
10%
15%
20%
25%
30%
35%
180
190
200
210
220
230
240
250
1‐Jan
1‐Feb
1‐M
ar
1‐Apr
1‐M
ay
1‐Jun
1‐Jul
1‐Aug
1‐Sep
1‐Oct
1‐Nov
1‐Dec
1‐Jan
1‐Feb
1‐M
ar
1‐Apr
1‐M
ay
1‐Jun
1‐Jul
1‐Aug
1‐Sep
1‐Oct
1‐Nov
1‐Dec
1‐Jan
1‐Feb
1‐M
ar
1‐Apr
1‐M
ay
1‐Jun
1‐Jul
Average Pre‐BBIP vs. Percent Reduction by Day 3(ALL Patients)
Pre‐BBIP (ALL) % Reduction (ALL)
129
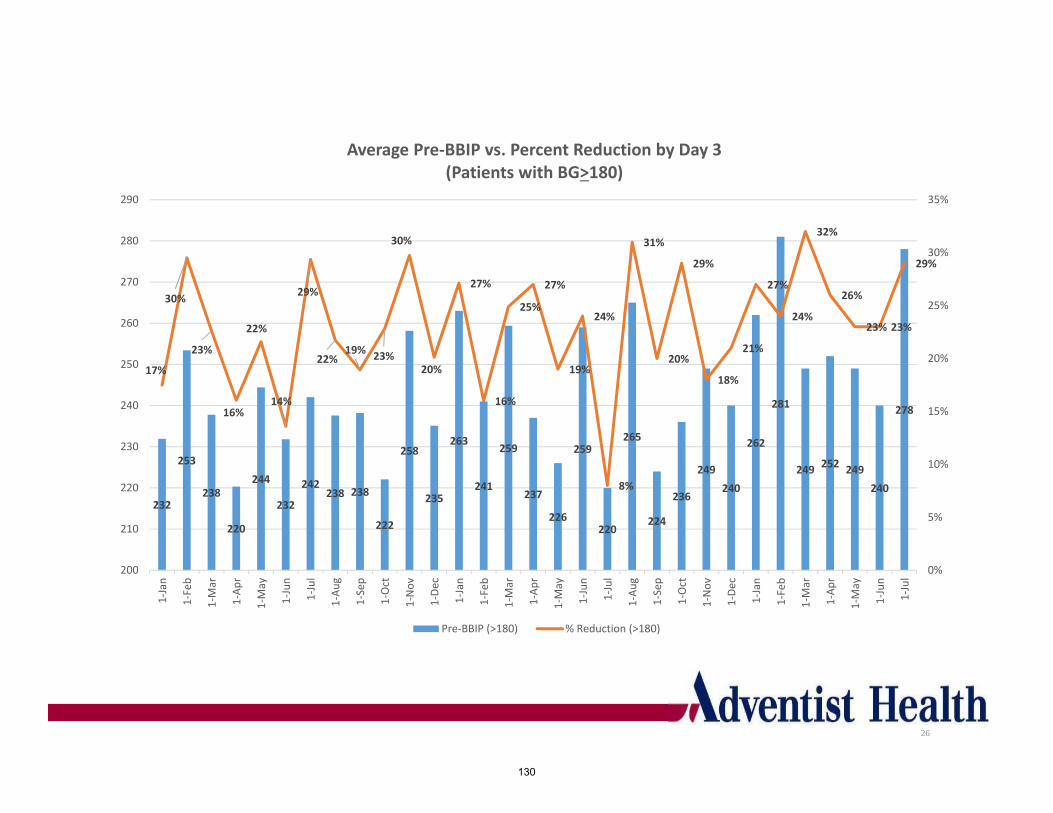
26
232
253
238
220
244
232
242238 238
222
258
235
263
241
259
237
226
259
220
265
224
236
249
240
262
281
249252
249
240
278
17%
30%
23%
16%
22%
14%
29%
22%19%
23%
30%
20%
27%
16%
25%
27%
19%
24%
8%
31%
20%
29%
18%
21%
27%
24%
32%
26%
23% 23%
29%
0%
5%
10%
15%
20%
25%
30%
35%
200
210
220
230
240
250
260
270
280
290
1‐Jan
1‐Feb
1‐M
ar
1‐Apr
1‐M
ay
1‐Jun
1‐Jul
1‐Aug
1‐Sep
1‐Oct
1‐Nov
1‐Dec
1‐Jan
1‐Feb
1‐M
ar
1‐Apr
1‐M
ay
1‐Jun
1‐Jul
1‐Aug
1‐Sep
1‐Oct
1‐Nov
1‐Dec
1‐Jan
1‐Feb
1‐M
ar
1‐Apr
1‐M
ay
1‐Jun
1‐Jul
Average Pre‐BBIP vs. Percent Reduction by Day 3(Patients with BG>180)
Pre‐BBIP (>180) % Reduction (>180)
130
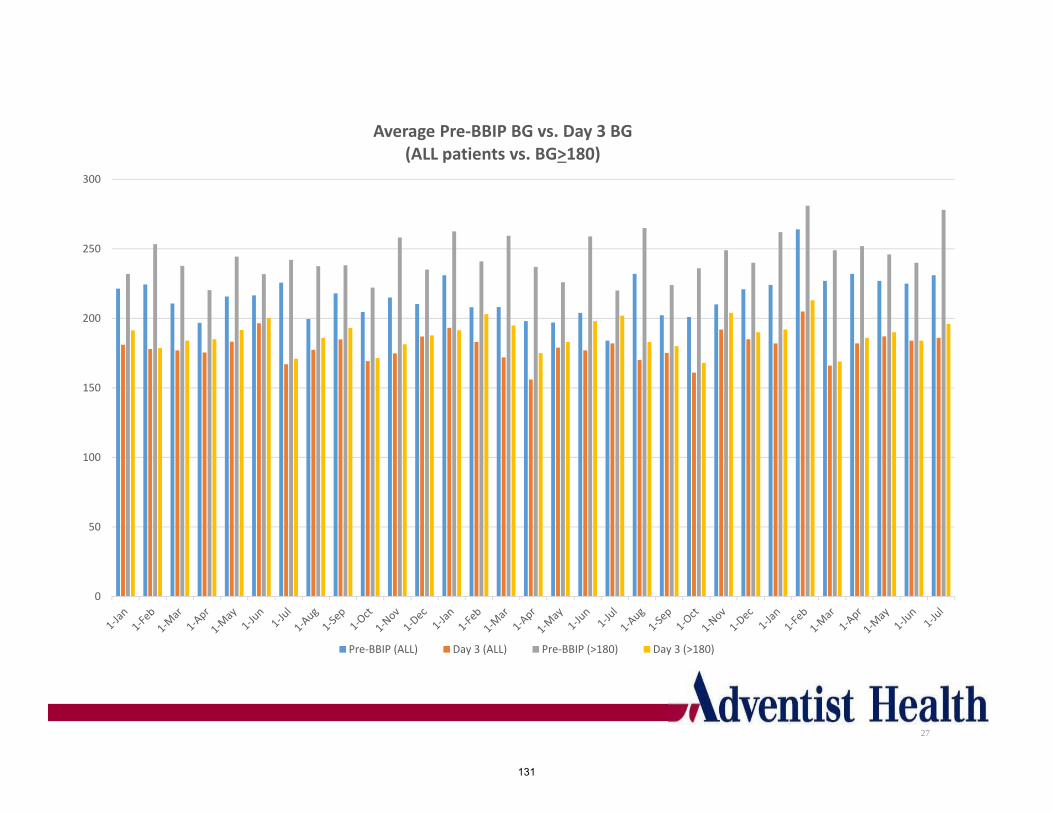
27
0
50
100
150
200
250
300
Average Pre‐BBIP BG vs. Day 3 BG(ALL patients vs. BG>180)
Pre‐BBIP (ALL) Day 3 (ALL) Pre‐BBIP (>180) Day 3 (>180)
131

Outcome AnalysisGAMC Data
Sep 2013 to Jul 2016
28
132

29
ValueClinical
OutcomesPatient
SatisfactionPhysician
and Nursing Satisfaction
ADE Prevention
Financial Outcomes
• Instantaneous response to uncontrolled BG
• Daily PharmDMonitoring of BG
• Stringent BG control ↓ risk of infections ↓ length of stay and ↓ mortality
• Improvedglycemic control vs home
• Improvedunderstanding disease state and insulin therapy via face to face PharmD& patient interaction
• Decreasing workload of physicians, allowing more time to focus on other conditions
• Collaborative and interdisciplinary care with nursing for inpatients with diabetes
• Reducedincidence of Hyper- and Hypo-glycemia
• Reduced incidence of potential DDIs with oral agents
• Tighter glucose control in steroid induced hyperglycemia
• Potential decrease in hospital length of stay and hospital complications, resulting in significant cost savings
133

Acute Inpatient Average LOS 2012-2014
30
6.376.66
5.73
5.97
6.02 5.85
5.04
5.63
6.23
5.24
4.00
4.50
5.00
5.50
6.00
6.50
7.00
7.50
Q1 Q2 Q3 Q4
2012 2013 2014
ALOS Diff (2013‐2014)Q1 0.210
Q2 ‐0.603
Overall ‐0.393
134

Conclusion
•Significant Reduction in BG levels to below 180mg/dLby day 3 after initial hyperglycemic alert
•Improvement of overall glycemic control in GAMC with a 6% lower number of POC Glucose values >180mg/dL
•Reduction in length of stay among patients with diabetes by 0.55 days vs 0.395 targeted
•Estimated annual reduction in costs was known to be $197,400
31
135
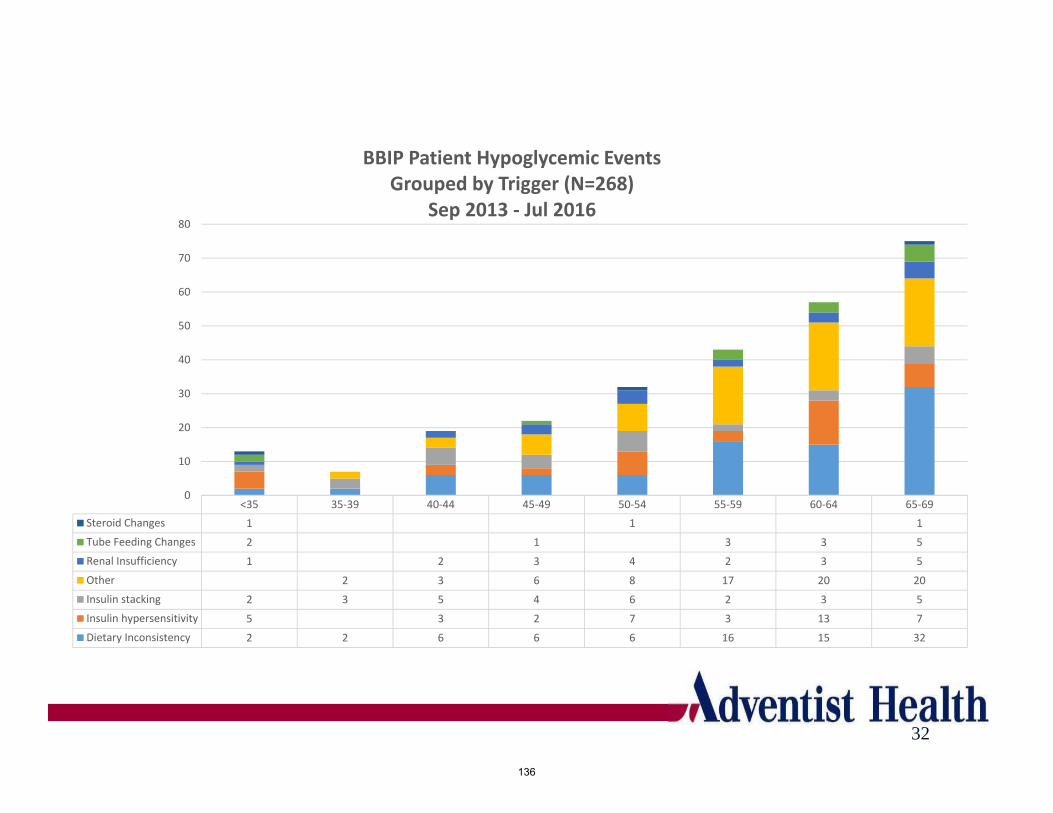
32
<35 35‐39 40‐44 45‐49 50‐54 55‐59 60‐64 65‐69
Steroid Changes 1 1 1
Tube Feeding Changes 2 1 3 3 5
Renal Insufficiency 1 2 3 4 2 3 5
Other 2 3 6 8 17 20 20
Insulin stacking 2 3 5 4 6 2 3 5
Insulin hypersensitivity 5 3 2 7 3 13 7
Dietary Inconsistency 2 2 6 6 6 16 15 32
0
10
20
30
40
50
60
70
80
BBIP Patient Hypoglycemic EventsGrouped by Trigger (N=268)
Sep 2013 ‐ Jul 2016
136
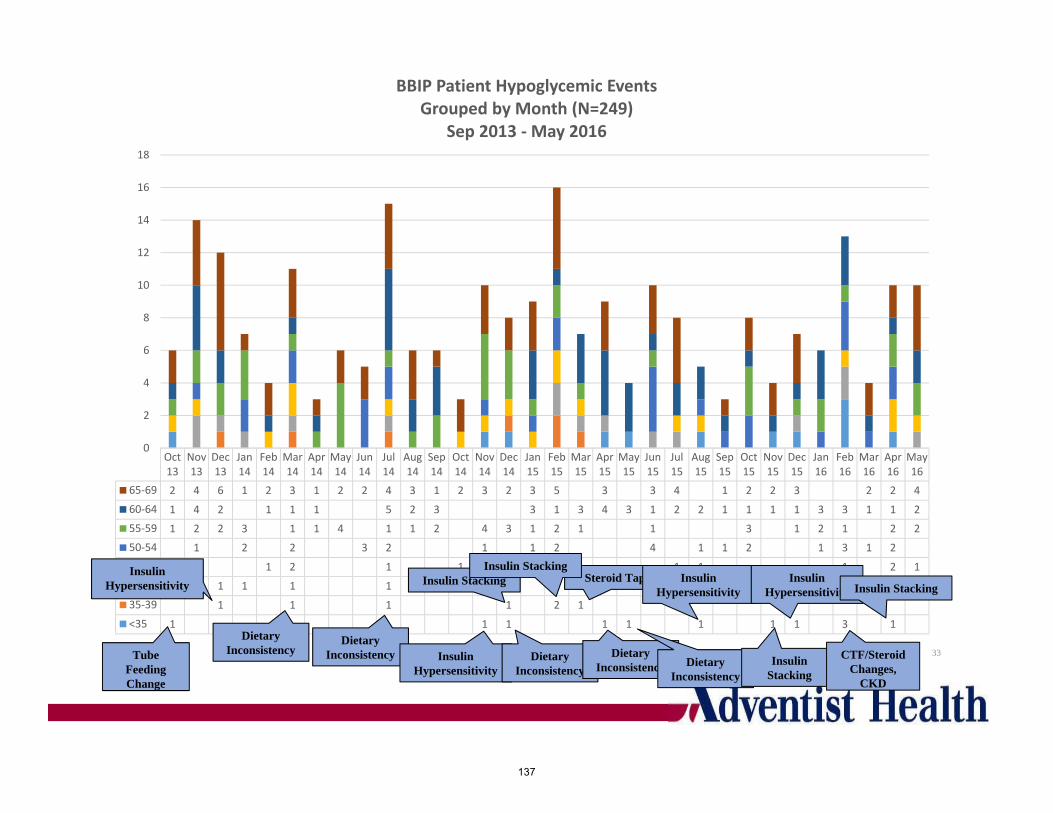
Oct13
Nov13
Dec13
Jan14
Feb14
Mar14
Apr14
May14
Jun14
Jul14
Aug14
Sep14
Oct14
Nov14
Dec14
Jan15
Feb15
Mar15
Apr15
May15
Jun15
Jul15
Aug15
Sep15
Oct15
Nov15
Dec15
Jan16
Feb16
Mar16
Apr16
May16
65‐69 2 4 6 1 2 3 1 2 2 4 3 1 2 3 2 3 5 3 3 4 1 2 2 3 2 2 4
60‐64 1 4 2 1 1 1 5 2 3 3 1 3 4 3 1 2 2 1 1 1 1 3 3 1 1 2
55‐59 1 2 2 3 1 1 4 1 1 2 4 3 1 2 1 1 3 1 2 1 2 2
50‐54 1 2 2 3 2 1 1 2 4 1 1 2 1 3 1 2
45‐49 1 1 1 2 1 1 1 1 1 2 1 1 1 1 2 1
40‐44 2 1 1 1 1 2 1 1 1 1 1 2 1
35‐39 1 1 1 1 2 1
<35 1 1 1 1 1 1 1 1 3 1
0
2
4
6
8
10
12
14
16
18
BBIP Patient Hypoglycemic EventsGrouped by Month (N=249)
Sep 2013 ‐May 2016
33Tube Feeding Change
Insulin Hypersensitivity
Dietary Inconsistency
Dietary Inconsistency Insulin
HypersensitivityDietary
Inconsistency
Insulin Stacking Steroid Taper
Dietary Inconsistency Dietary
Inconsistency
Insulin Hypersensitivity
Insulin Stacking
Insulin Hypersensitivity
CTF/Steroid Changes,
CKD
Insulin Stacking
Insulin Stacking
137
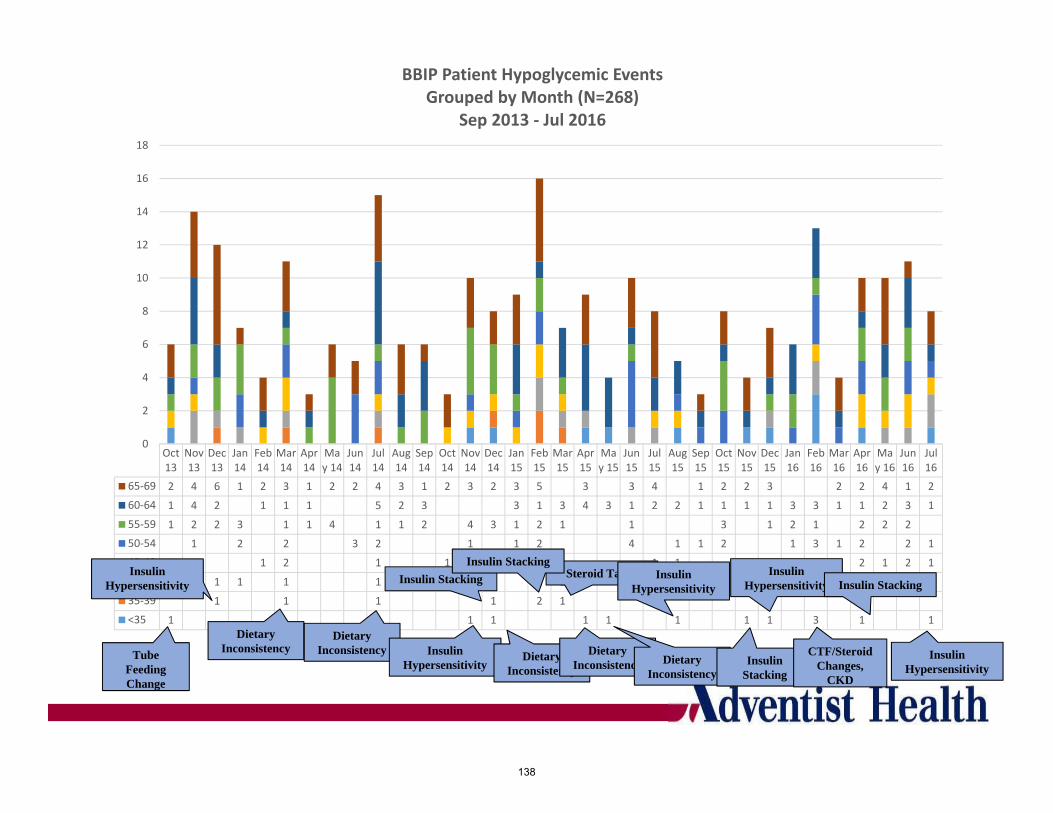
Oct13
Nov13
Dec13
Jan14
Feb14
Mar14
Apr14
May 14
Jun14
Jul14
Aug14
Sep14
Oct14
Nov14
Dec14
Jan15
Feb15
Mar15
Apr15
May 15
Jun15
Jul15
Aug15
Sep15
Oct15
Nov15
Dec15
Jan16
Feb16
Mar16
Apr16
May 16
Jun16
Jul16
65‐69 2 4 6 1 2 3 1 2 2 4 3 1 2 3 2 3 5 3 3 4 1 2 2 3 2 2 4 1 2
60‐64 1 4 2 1 1 1 5 2 3 3 1 3 4 3 1 2 2 1 1 1 1 3 3 1 1 2 3 1
55‐59 1 2 2 3 1 1 4 1 1 2 4 3 1 2 1 1 3 1 2 1 2 2 2
50‐54 1 2 2 3 2 1 1 2 4 1 1 2 1 3 1 2 2 1
45‐49 1 1 1 2 1 1 1 1 1 2 1 1 1 1 2 1 2 1
40‐44 2 1 1 1 1 2 1 1 1 1 1 2 1 1 2
35‐39 1 1 1 1 2 1
<35 1 1 1 1 1 1 1 1 3 1 1
0
2
4
6
8
10
12
14
16
18
BBIP Patient Hypoglycemic EventsGrouped by Month (N=268)
Sep 2013 ‐ Jul 2016
34Tube Feeding Change
Insulin Hypersensitivity
Dietary Inconsistency
Dietary Inconsistency Insulin
HypersensitivityDietary
Inconsistency
Insulin Stacking Steroid Taper
Dietary Inconsistency Dietary
Inconsistency
Insulin Hypersensitivity
Insulin Stacking
Insulin Hypersensitivity
CTF/Steroid Changes,
CKD
Insulin Stacking
Insulin Stacking
Insulin Hypersensitivity
138
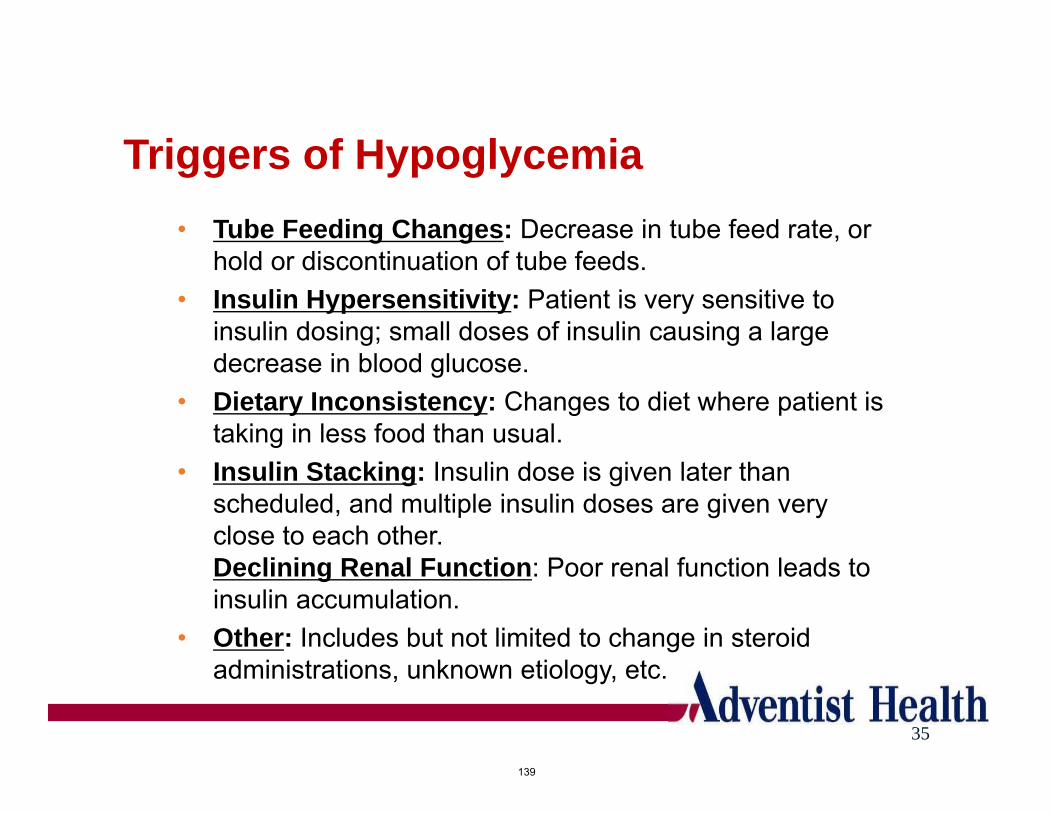
Triggers of Hypoglycemia
35
• Tube Feeding Changes: Decrease in tube feed rate, or hold or discontinuation of tube feeds.
• Insulin Hypersensitivity: Patient is very sensitive to insulin dosing; small doses of insulin causing a large decrease in blood glucose.
• Dietary Inconsistency: Changes to diet where patient is taking in less food than usual.
• Insulin Stacking: Insulin dose is given later than scheduled, and multiple insulin doses are given very close to each other.Declining Renal Function: Poor renal function leads to insulin accumulation.
• Other: Includes but not limited to change in steroid administrations, unknown etiology, etc.
139
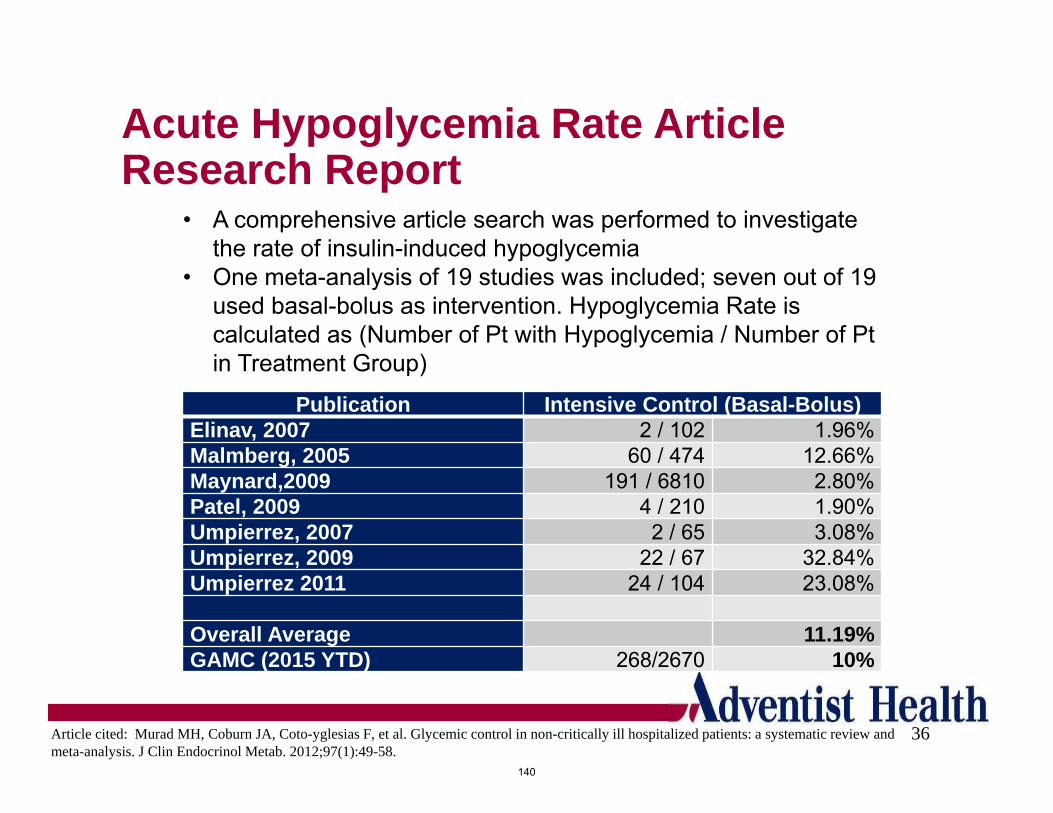
Acute Hypoglycemia Rate Article Research Report
36
Publication Intensive Control (Basal-Bolus)Elinav, 2007 2 / 102 1.96%Malmberg, 2005 60 / 474 12.66%Maynard,2009 191 / 6810 2.80%Patel, 2009 4 / 210 1.90%Umpierrez, 2007 2 / 65 3.08%Umpierrez, 2009 22 / 67 32.84%Umpierrez 2011 24 / 104 23.08%
Overall Average 11.19%GAMC (2015 YTD) 268/2670 10%
• A comprehensive article search was performed to investigate the rate of insulin-induced hypoglycemia
• One meta-analysis of 19 studies was included; seven out of 19 used basal-bolus as intervention. Hypoglycemia Rate is calculated as (Number of Pt with Hypoglycemia / Number of Pt in Treatment Group)
Article cited: Murad MH, Coburn JA, Coto-yglesias F, et al. Glycemic control in non-critically ill hospitalized patients: a systematic review and meta-analysis. J Clin Endocrinol Metab. 2012;97(1):49-58.
140
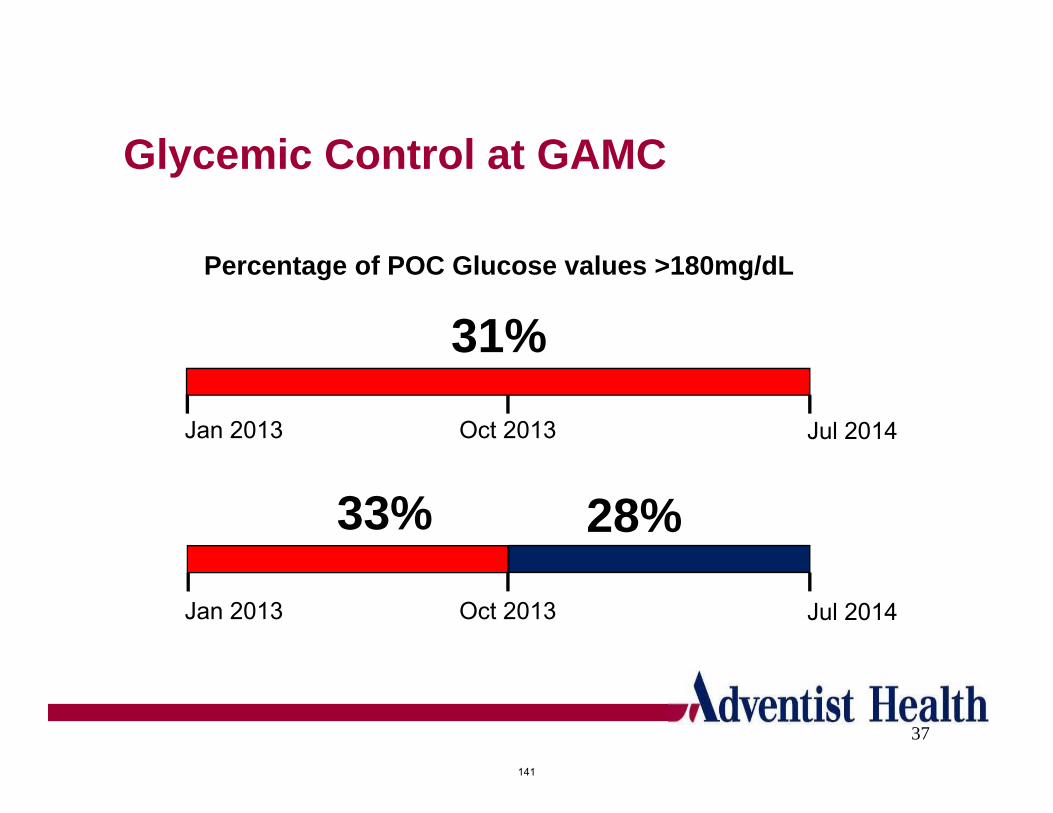
Glycemic Control at GAMC
37
Percentage of POC Glucose values >180mg/dL
Jan 2013 Jul 2014Oct 2013
31%
33% 28%
Jan 2013 Jul 2014Oct 2013
141