Globefish Seafood Highlights - fao.org · Difficult squid market 2008 was again a year of low...
34
SEAFOOD HIGHLIGHTS Feature Special Seabass Special Special Se Special Salmon Farmed Special Seabream Seabass Shrimp sector under stress During the first quarter of 2008, the shrimp sector continued to suffer from soar- ing fuel prices and from the general economic slow down. Due to the general reduction of the purchasing power in major shrimp importing countries, consumers were more reluctant to buy relatively expensive food commodities like shrimp, and also dropped the habit of going out to restaurants, the main outlet for shrimp consump- tion. Record skipjack prices Tuna for canning continued to be in short supply worldwide. The current import price in Bangkok is about US$2000/MT for fro- zen skipjack, the highest in history. The impact of increasing raw material on canned tuna is already visible with strong growth in prices everywhere. Groundfish prices go up The upward trend in Alaska pollack prices is impacting the world groundfish market. Decreasing catch quotas led to a 16% increase in prices during the first half of the year. Difficult squid market 2008 was again a year of low prices, created by heavy landings of Illex squid. Argentine traders were, similar to what happened in the previous year, unable to take advantage of good supplies, and discounted Illex prices to extremely low levels. Less fishmeal production Fishmeal production was quite disappointing in May 2008, after a good produc- tion month in April. Prices started to move up in the course of 2008. Fish oil prices sky high The current high price for vegeta- ble oil has an impact on higher prices for fish oil. Fish oil prices started to decline in June 2008, after record highs. Seabreamp prices extremely low The present situation in bass and bream markets is somewhat particular with prices for bass fairly stable at acceptable levels for producers. At the same time, bream prices are record low for this period of the year. Economic crisis impacts salmon market The major factor impacting world farmed salmon markets at present is the economic situation influencing demand and the supplies from Nor- way and Chile. Salmon volumes are holding up quite well but there still is pressure on prices. Lower Chinese tilapia production and exports The impact of the loss of tilapia production during the last cold winter becomes apparent on the world tilapia market. Prices of tilapia are increasing very strongly in all main markets. Tilapia Shrimp p. 1 Tuna p. 7 Groundfish p. 12 Cephalopods p. 16 Fishmeal p. 20 Fish Oil p. 22 Seabass/bream p. 23 Salmon p. 26 Tilapia p. 30 18/07/2008 GLOBAL TECHNICAL AND TRADE CONFERENCE O SHRIMP 6 - 9 November 2008, Guangzhou, China For further information please visit: www.infofish.org
Transcript of Globefish Seafood Highlights - fao.org · Difficult squid market 2008 was again a year of low...

SEAFOODHIGHLIGHTS
HIGHLIGHTS 27-05-2003 13:30 Page 1
1GLOBEFISH Seafood Highlights 2003 1
18/04/2008
Feature
Special Seabass
Special
Bivalves
Special Se
SpecialSalmon
Farmed
Special
Seabream
Seabass
Shrimp sector under stress
During the first quarter of 2008,
the shrimp sector continued to suffer from soar-
ing fuel prices and from the general economic
slow down. Due to the general reduction of the
purchasing power in major shrimp importing
countries, consumers were more reluctant to buy
relatively expensive food commodities like shrimp,
and also dropped the habit of going out to
restaurants, the main outlet for shrimp consump-
tion.
Record skipjack prices
Tuna for canning continued to
be in short supply worldwide. The current import
price in Bangkok is about US$2000/MT for fro-
zen skipjack, the highest in history. The impact
of increasing raw material on canned tuna is
already visible with strong growth in prices
everywhere.
Groundfish prices go up
The upward trend in Alaska
pollack prices is impacting the world groundfish
market. Decreasing catch quotas led to a 16%
increase in prices during the first half of the
year.
Difficult squid market
2008 was again a year of low prices, created by
heavy landings of Illex squid. Argentine traders
were, similar to what happened in the previous
year, unable to take advantage of good supplies,
and discounted Illex prices to extremely low
levels.
Less fishmeal production
Fishmeal production was quite
disappointing in May 2008, after a good produc-
tion month in April. Prices started to move up in
the course of 2008.
Fish oil prices sky high
The current high price for vegeta-
ble oil has an impact on higher prices for fish oil.
Fish oil prices started to decline in June 2008, after
record highs.
Seabreampprices
extremely low
The present situation in bass and bream markets
is somewhat particular with prices for bass fairly
stable at acceptable levels for producers. At the
same time, bream prices are record low for this
period of the year.
Economic crisis impacts
salmon market
The major factor impacting world farmed salmon
markets at present is the economic situation
influencing demand and the supplies from Nor-
way and Chile. Salmon volumes are holding up
quite well but there still is pressure on prices.
Lower Chinese tilapia
production and exports
The impact of the loss of tilapia production
during the last cold winter becomes apparent on
the world tilapia market. Prices of tilapia are
increasing very strongly in all main markets.
Tilapia
Shrimp p. 1
Tuna p. 7
Groundfish p. 12
Cephalopods p. 16
Fishmeal p. 20
Fish Oil p. 22
Seabass/bream p. 23
Salmon p. 26
Tilapia p. 30
18/07/2008
GLOBAL TECHNICAL AND TRADE CONFERENCE O SHRIMP6 - 9 November 2008, Guangzhou, China
For further information please visit: www.infofish.org

About GLOBEFISH
GLOBEFISH forms part of the Fish Utilization and Marketing Service of the FAO Fisheries Department and is part of the FISH INFOnetwork (see below). It collects information from the main market areas in developed countries. Part of its services is an electronic databank and the distribution of information through the GLOBEFISH European Fish Price Report, the GLOBEFISH Seafood Highlights , the GLOBEFISH Research Programme and the GLOBEFISH Commodity Updates . The GLOBEFISH Seafood Highlights are based on information available in the databank, supplemented by market information from six regional services which form the FISH INFOnetwork: INFOFISH (Asia and the Pacifi c), INFOPESCA (Latin America and the Caribbean), INFOPECHE (Africa), INFOSAMAK (Arab countries), EUROFISH (Eastern Europe) and INFOYU (China). GLOBEFISH Seafood Highlights are distributed to the subscribers of: INFOFISH Trade News, INFOPESCA Noticias Comerciales, INFOPECHE Nouvelles Commerciales, through EUROFISH and INFOYU. GLOBEFISH Seafood Highlights are also available in electronic form. Authors: Karine Boisset (shrimp), Paola Sabatini and Javier Lopez (groundfish), Nicki Holmyard (small pelagics), Helga Josupeit (tuna, cephalopods, tilapia, .fishmeal and oil), Audun Lem (salmon, seabass and seabream). The statistics were put together by Paola Sabatini , Karine Boisset, and Javier Lopez.
For subscription details please contact: GLOBEFISH, FIIU/FAO Tel: (39-06) 5705 6313
Viale delle Terme di Caracalla Fax: (39-06) 5705 5188 00100 Rome, Italy Email: [email protected]
Web: www.globefish.org All rights reserved. No part of FAO/GLOBEFISH Highlights may be reproduced, stored in a retrieval system, or transmitted in any form or by any means (electronic, mechanical, photocopying or otherwise), without the prior permission of FAO. Requests for use of this material (including purpose and extent) should be addressed to the Director, Publications Division, Food and Agriculture Organization of the United Nations, Viale delle Terme di Caracalla, 00100 Rome, Italy.
Bibliographic reference: FAO/GLOBEFISH Seafood Highlights. A quarterly up-date based 2008 on the GLOBEFISH FAO/GLOBEFISH Seafood Highlights, Databank (2/2008): p. 32

1GLOBEFISH Seafood Highlights 2/2008 1
SHRIMP
ImportsShrimp (frozen raw): Japan______________________________________________________
Jan- Jan- ...................Jan-Dec................... March March
2004 2005 2006 2007 2007 2008(1000 tonnes)
Viet Nam 55.5 54.6 51.1 40.0 5.3 7.3Indonesia 48.6 45.6 43.7 37.1 8.1 8.4India 31.6 26.3 28.5 27.0 4.8 5.0China 22.6 24.1 22.8 24.0 4.8 4.0Thailand 17.2 18.4 20.1 26.4 4.1 4.4Russia 8.9 10.4 9.5 8.9 2.3 2.7Canada 8.5 8.1 8.7 7.6 1.6 1.2Greenland 7.7 7.5 6.8 5.4 1.1 1.0Philippines 6.3 6.2 5.3 4.3 0.8 0.6Argentina 2.4 0.6 3.4 1.9 0.3 0.2Australia 3.6 3.6 3.2 1.9 0.2 0.2Malaysia 3.2 3.1 3.1 4.2 0.7 0.9Others 25.3 23.9 23.8 18.6 4.7 3.8_____________________________________________________
Total 241.4 232.4 230.0 207.3 38.8 39.7_____________________________________________________Source: GLOBEFISH AN 10127
Wholesale pricesShrimp*: Japan
21
19
17
15
13
11
9
7
5
Jan Jul Jan Jul Jan Jul Jan Jul Jan Jul Jan Jul 03 04 05 06 07 08
*Black tiger, headless, shell-on, origin: IndonesiaSource: INFOFISH Trade News; GLOBEFISH AN 10226
US$/kg
31/40
16/20
Shrimp sector under stress
During the first quarter of 2008, the shrimp sector continued to suffer from soaring fuel pricesand from the general economic slow down in the main importing countries. On the one hand,production and transport costs increased further and availability from major shrimp suppliersdeclined. On the other hand, due to the general reduction of the purchasing power in major shrimpimporting countries, consumers were more reluctant to buy relatively expensive food commoditieslike shrimp, and also to go to restaurants, the main outlet for shrimp consumption in the mainconsuming areas.
Situation of workers in shrimp industry underreview
The shrimp sector was also shaken by a new reportwhich points the finger at human rights abuse and environ-mental disasters linked to shrimp production and process-ing. The report which was issued by the Solidarity Center(an organization of America’s Union Movement), andmainly blamed Thailand and Bangladesh, was object todebate and scepticism. Shrimp farming and processing isa sector which has developed very rapidly in recent yearsand has generated income in many countries but has alsobeen cause of concern with respect to environmental andsocial issues. In this context, FAO with NACA/UNEP/WB/WWF developed the “International Principles forResponsible Shrimp Farming” in 2006 in order to providea basis for a more sustainable development of shrimp
farming. There have been clear improvements in this area inrecent years but one should always be on the lookout toprevent possible abuses but also to make sure that allega-tions are justified since they jeopardize work in poor coun-tries.
Japanese market stable
Japanese demand is expected to increase in July, whenthe mid year salary bonus will reach many households. It isinteresting to note, that the price margin of black tiger versusvannamei shrimp is shrinking in Japan probably as a reactionto more black tiger reaching the market. Indications for wildcaught shrimp, both warm and coldwater species, are stabledespite the continuing upward trend in fuel prices which islikely to maintain demand for higher prices in this category.Overall, there is not much margin for the expected priceincreases.

GLOBEFISH Seafood Highlights 2/20082
Wholesale pricesShrimp*: USA, Japan
10
9
8
7
6
5
4
Jan Jul Jan Jul Jan Jul Jan Jul Jan Jul Jan Jul Jan 03 04 05 06 07 08
*Frozen, headless, shell-on, 16-20 countSource: INFOFISH Trade News, GLOBEFISH AN 10205,10206
SHRIMP
US$/lb
Gulf brown, New York
Indian white, Tokyo
ImportsShrimp: USA__________________________________
...................Jan-March........................2003 2004 2005 2006 2007 2008
(1000 tonnes)
Thailand 22.9 49.1 31.6 34.1 39.7 35.0Indonesia 4.5 6.6 12.8 17.1 12.5 20.7Ecuador 8.1 11.5 12.0 15.9 17.2 15.7China 9.5 25.6 9.9 12.8 17.7 12.9Viet Nam 10.1 14.2 10.5 8.3 5.9 8.6Malaysia 0.4 0.3 2.9 4.4 4.6 7.1Mexico 4.2 4.4 4.9 4.9 6.9 6.5India 11.3 15.2 8.0 7.3 4.1 2.9Bangladesh 0.8 1.1 2.0 3.4 3.1 2.8Guyana 3.5 2.7 2.0 2.4 2.6 2.5Venezuela 2.9 4.4 3.9 2.6 3.0 2.1Peru 0.5 0.6 1.0 1.1 1.5 1.7Others 15.9 13.6 10.8 10.3 7.3 5.3___________________________________________________TOTAL 94.5 149.3 112.4 124.6 126.2 123.8
Source: NMFS
For the first time in many years, Japanese imports ofraw frozen shrimp showed a growth, although minimal,corresponding to the first quarter of the year. Backed by thestrong and stable yen, imports increased from most of themajor sources: from Indonesia to Bangladesh, with theexception of China. Considering the species farmed inthese countries, it appears obvious that imports of blacktiger shrimp also increased during this period, particularlyfrom India, Myanmar, Bangladesh but also from Vietnamand Indonesia; however vannamei were also imported fromthe last two sources.
Upward price trend for vannamei has created strongerdemand for black tiger shrimp. For this year’s Golden Weekfestival, Japanese supermarkets launched promotional cam-paigns for black tiger shrimp along with vannamei.
Low US shrimp demand
A survey based on a representative sample of 5 000US households indicates that consumer confidencedropped sharply in June, to a level which is the fifth-lowestever. But, how much this is effectively affecting shrimpconsumption, is not very clear. Traditionally, shrimp isconsidered an upper-end product, and economic crisis inthe USA have always resulted in lower shrimp consump-tion. However, some recent reports indicate that shrimpmight be less affected by the present crisis than other foodproducts.
US imports of shrimp in the first quarter of 2008 totaled123 800 tonnes worth US$ 862 million. These figures showa 2% reduction in quantity and a 0.7% increase in value,compared to the same period in 2007. Monthly shrimpimports in the USA are generally slow until May, after whichthey start to recover, just before the offset of summer.
ImportsShrimp (by product forms): USA__________________________________
.........................Jan-March................................2007 2008
Tonnes 1000 US$ Tonnes 1000 US$
Peeled frozen 36 199.3 274 661.4 39 985.5 286 311.9Other frozen 25 912.5 175 206.4 19 257.3 139 498.4Breaded 12 828.6 63 481.3 10 538.2 49 613.4Other pre. 269.7 1 595.1 328.9 1 632.9Headless shell-on frozen All sizes
49 740.9 330 699.2 52 287.3 373 230.7< 15 5 858.6 70 533.6 5 708.1 72 061.9> 70 3 732.9 15 135.2 2 229.8 9 293.115/20 3 547.6 32 468.4 3 908.3 39 571.821/25 4 354.1 36 407.9 6 011.5 52 851.826/30 5 167.6 36 861.8 7 964.5 56 330.331/40 8 735.5 51 488.2 8 967.1 53 734.841/50 6 093.8 30 318.5 7 190.8 38 849.851/60 8 094.6 39 669.8 6 476.1 32 770.061/70 4 156.1 17 815.8 3 831.1 17 767.3Other prod 1 204.5 10 496.7 1 402.1 11 631.1___________________________________________________TOTAL 126 155.5 856 140.2 123 799.3 861 918.3Source: NMFS
3GLOBEFISH Seafood Highlights 2/2008 3
ImportsShrimp: Spain______________________________________________________
.......................Jan/Mar.................................2003 2004 2005 2006 2007 2008
China 0.3 0.3 4.3 6.9 7.8 6.6Ecuador 0.8 1.5 1.5 3.3 4.5 4.2Morocco 1.5 1.6 2.0 1.5 1.6 1.7Argentina 2.6 4.1 0.8 1.1 3.8 1.6Colombia 0.9 0.9 1.2 1.0 1.2 1.1Belgium 0.4 0.6 0.7 0.6 1.0 0.8Senegal 0.6 0.9 1.1 0.6 0.9 0.8Cuba 0.2 0.2 0.2 0.9 1.1 0.8Nicaragua 0.1 0.4 0.5 1.0 1.0 0.7Netherlands 0.8 0.9 1.1 1.0 1.1 0.7Venezuela 0.2 0.6 0.7 1.0 0.9 0.6Others 11.7 15.3 10.1 10.8 9.4 6.4__________________________________________________Grand Total 19.9 27.3 24.0 29.7 34.3 26.0Source: GLOBEFISH AN 010150
SHRIMP
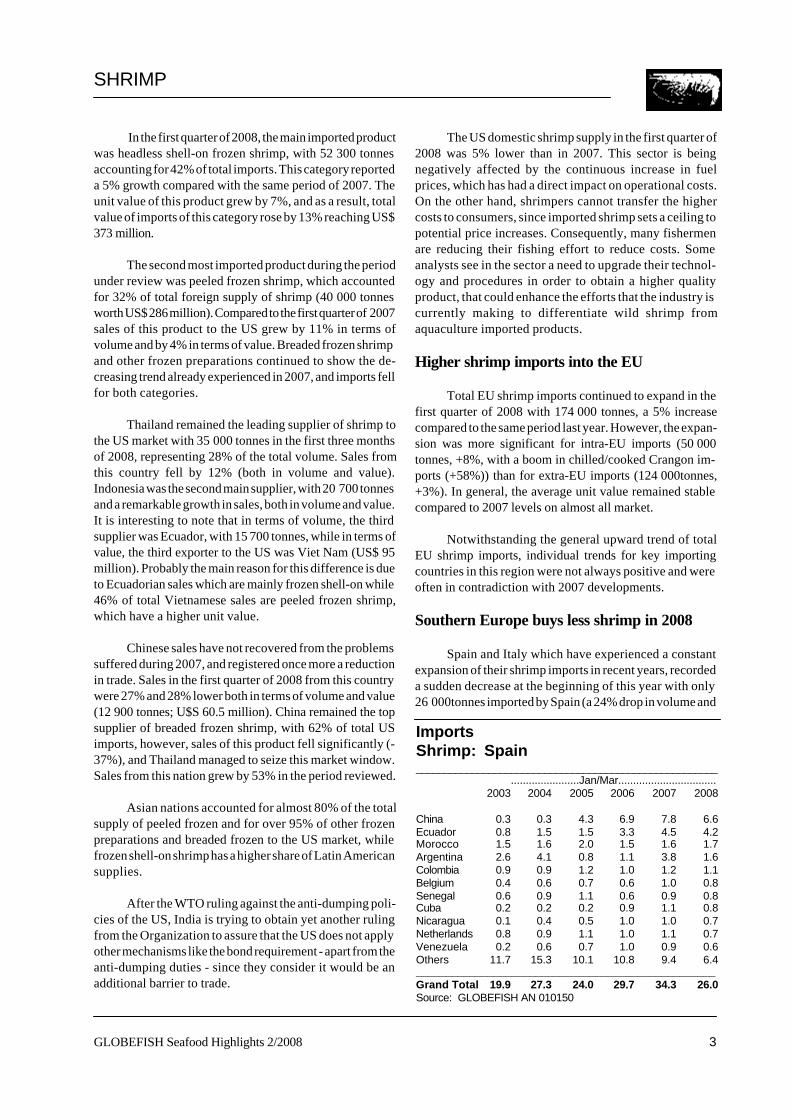
In the first quarter of 2008, the main imported productwas headless shell-on frozen shrimp, with 52 300 tonnesaccounting for 42% of total imports. This category reporteda 5% growth compared with the same period of 2007. Theunit value of this product grew by 7%, and as a result, totalvalue of imports of this category rose by 13% reaching US$373 million.
The second most imported product during the periodunder review was peeled frozen shrimp, which accountedfor 32% of total foreign supply of shrimp (40 000 tonnesworth US$ 286 million). Compared to the first quarter of 2007sales of this product to the US grew by 11% in terms ofvolume and by 4% in terms of value. Breaded frozen shrimpand other frozen preparations continued to show the de-creasing trend already experienced in 2007, and imports fellfor both categories.
Thailand remained the leading supplier of shrimp tothe US market with 35 000 tonnes in the first three monthsof 2008, representing 28% of the total volume. Sales fromthis country fell by 12% (both in volume and value).Indonesia was the second main supplier, with 20 700 tonnesand a remarkable growth in sales, both in volume and value.It is interesting to note that in terms of volume, the thirdsupplier was Ecuador, with 15 700 tonnes, while in terms ofvalue, the third exporter to the US was Viet Nam (US$ 95million). Probably the main reason for this difference is dueto Ecuadorian sales which are mainly frozen shell-on while46% of total Vietnamese sales are peeled frozen shrimp,which have a higher unit value.
Chinese sales have not recovered from the problemssuffered during 2007, and registered once more a reductionin trade. Sales in the first quarter of 2008 from this countrywere 27% and 28% lower both in terms of volume and value(12 900 tonnes; U$S 60.5 million). China remained the topsupplier of breaded frozen shrimp, with 62% of total USimports, however, sales of this product fell significantly (-37%), and Thailand managed to seize this market window.Sales from this nation grew by 53% in the period reviewed.
Asian nations accounted for almost 80% of the totalsupply of peeled frozen and for over 95% of other frozenpreparations and breaded frozen to the US market, whilefrozen shell-on shrimp has a higher share of Latin Americansupplies.
After the WTO ruling against the anti-dumping poli-cies of the US, India is trying to obtain yet another rulingfrom the Organization to assure that the US does not applyother mechanisms like the bond requirement - apart from theanti-dumping duties - since they consider it would be anadditional barrier to trade.
The US domestic shrimp supply in the first quarter of2008 was 5% lower than in 2007. This sector is beingnegatively affected by the continuous increase in fuelprices, which has had a direct impact on operational costs.On the other hand, shrimpers cannot transfer the highercosts to consumers, since imported shrimp sets a ceiling topotential price increases. Consequently, many fishermenare reducing their fishing effort to reduce costs. Someanalysts see in the sector a need to upgrade their technol-ogy and procedures in order to obtain a higher qualityproduct, that could enhance the efforts that the industry iscurrently making to differentiate wild shrimp fromaquaculture imported products.
Higher shrimp imports into the EU
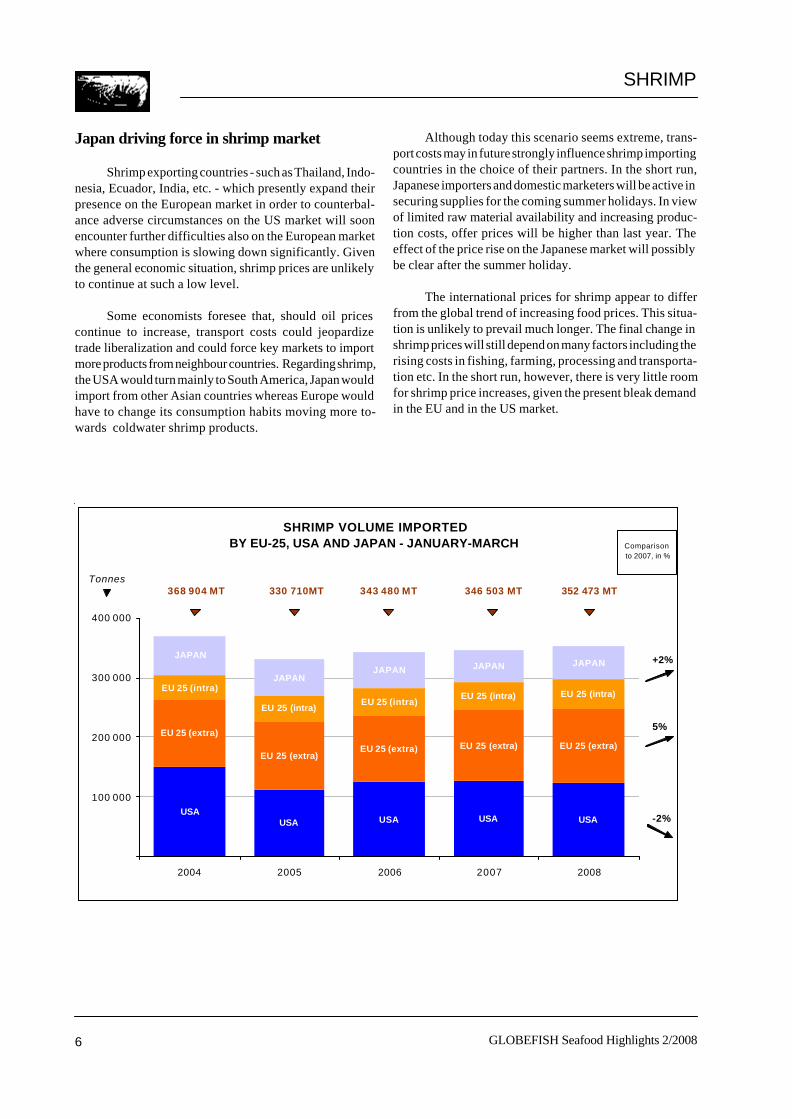
Total EU shrimp imports continued to expand in thefirst quarter of 2008 with 174 000 tonnes, a 5% increasecompared to the same period last year. However, the expan-sion was more significant for intra-EU imports (50 000tonnes, +8%, with a boom in chilled/cooked Crangon im-ports (+58%)) than for extra-EU imports (124 000tonnes,+3%). In general, the average unit value remained stablecompared to 2007 levels on almost all market.
Notwithstanding the general upward trend of totalEU shrimp imports, individual trends for key importingcountries in this region were not always positive and wereoften in contradiction with 2007 developments.
Southern Europe buys less shrimp in 2008
Spain and Italy which have experienced a constantexpansion of their shrimp imports in recent years, recordeda sudden decrease at the beginning of this year with only26 000tonnes imported by Spain (a 24% drop in volume and
GLOBEFISH Seafood Highlights 2/20084
SHRIMP
ImportsShrimp: Italy______________________________________________________
....................Jan/March..........................2005 2006 2007 2008
Ecuador 2.5 3.5 4.5 3.9India 1.0 1.0 1.0 1.3Denmark 1.2 1.2 1.4 1.2Spain 0.5 0.7 1.0 0.9Argentina 0.2 0.4 0.7 0.5Netherlands 0.5 0.6 0.6 0.5Malaysia 0.8 0.6 0.7 0.4UK 0.5 0.6 0.4 0.4China 0.4 0.4 0.9 0.4Others 5.1 3.9 3.7 3.3__________________________________________________Total 12.7 12.9 14.9 12.8_____________________________________________________Source: GLOBEFISH AN 010148
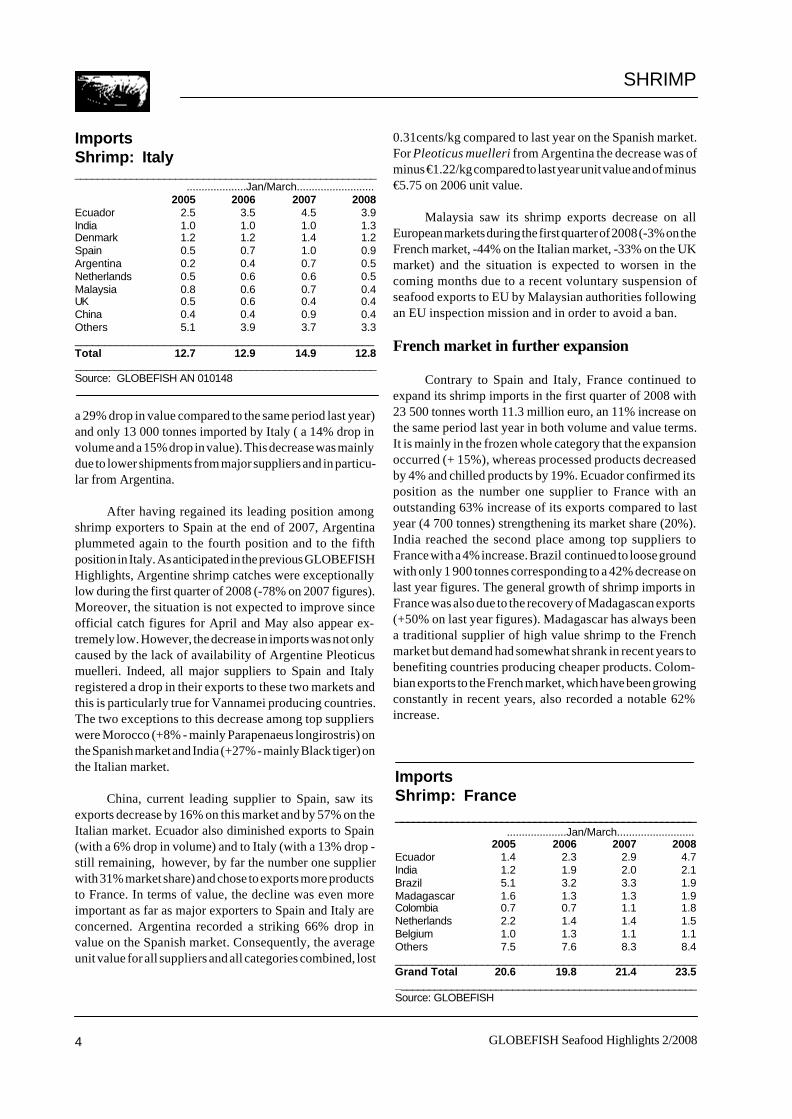
a 29% drop in value compared to the same period last year)and only 13 000 tonnes imported by Italy ( a 14% drop involume and a 15% drop in value). This decrease was mainlydue to lower shipments from major suppliers and in particu-lar from Argentina.
After having regained its leading position amongshrimp exporters to Spain at the end of 2007, Argentinaplummeted again to the fourth position and to the fifthposition in Italy. As anticipated in the previous GLOBEFISHHighlights, Argentine shrimp catches were exceptionallylow during the first quarter of 2008 (-78% on 2007 figures).Moreover, the situation is not expected to improve sinceofficial catch figures for April and May also appear ex-tremely low. However, the decrease in imports was not onlycaused by the lack of availability of Argentine Pleoticusmuelleri. Indeed, all major suppliers to Spain and Italyregistered a drop in their exports to these two markets andthis is particularly true for Vannamei producing countries.The two exceptions to this decrease among top supplierswere Morocco (+8% - mainly Parapenaeus longirostris) onthe Spanish market and India (+27% - mainly Black tiger) onthe Italian market.
China, current leading supplier to Spain, saw itsexports decrease by 16% on this market and by 57% on theItalian market. Ecuador also diminished exports to Spain(with a 6% drop in volume) and to Italy (with a 13% drop -still remaining, however, by far the number one supplierwith 31% market share) and chose to exports more productsto France. In terms of value, the decline was even moreimportant as far as major exporters to Spain and Italy areconcerned. Argentina recorded a striking 66% drop invalue on the Spanish market. Consequently, the averageunit value for all suppliers and all categories combined, lost
0.31cents/kg compared to last year on the Spanish market.For Pleoticus muelleri from Argentina the decrease was ofminus €1.22/kg compared to last year unit value and of minus€5.75 on 2006 unit value.
Malaysia saw its shrimp exports decrease on allEuropean markets during the first quarter of 2008 (-3% on theFrench market, -44% on the Italian market, -33% on the UKmarket) and the situation is expected to worsen in thecoming months due to a recent voluntary suspension ofseafood exports to EU by Malaysian authorities followingan EU inspection mission and in order to avoid a ban.
French market in further expansion
Contrary to Spain and Italy, France continued toexpand its shrimp imports in the first quarter of 2008 with23 500 tonnes worth 11.3 million euro, an 11% increase onthe same period last year in both volume and value terms.It is mainly in the frozen whole category that the expansionoccurred (+ 15%), whereas processed products decreasedby 4% and chilled products by 19%. Ecuador confirmed itsposition as the number one supplier to France with anoutstanding 63% increase of its exports compared to lastyear (4 700 tonnes) strengthening its market share (20%).India reached the second place among top suppliers toFrance with a 4% increase. Brazil continued to loose groundwith only 1 900 tonnes corresponding to a 42% decrease onlast year figures. The general growth of shrimp imports inFrance was also due to the recovery of Madagascan exports(+50% on last year figures). Madagascar has always beena traditional supplier of high value shrimp to the Frenchmarket but demand had somewhat shrank in recent years tobenefiting countries producing cheaper products. Colom-bian exports to the French market, which have been growingconstantly in recent years, also recorded a notable 62%increase.
ImportsShrimp: France______________________________________________________
....................Jan/March..........................2005 2006 2007 2008
Ecuador 1.4 2.3 2.9 4.7India 1.2 1.9 2.0 2.1Brazil 5.1 3.2 3.3 1.9Madagascar 1.6 1.3 1.3 1.9Colombia 0.7 0.7 1.1 1.8Netherlands 2.2 1.4 1.4 1.5Belgium 1.0 1.3 1.1 1.1Others 7.5 7.6 8.3 8.4____________________________________________________Grand Total 20.6 19.8 21.4 23.5______________________________________________________Source: GLOBEFISH

5GLOBEFISH Seafood Highlights 2/2008 5
ImportsShrimp: UK______________________________________________________
Jan- Jan- ...................Jan-Dec................... March March
2004 2005 2006 2007 2007 2008(1000 tonnes)
Shell-on ColdwaterDenmark 2.0 2.6 2.8 2.4 0.6 0.8Others 2.4 1.3 1.8 2.4 0.3 0.3Total 4.4 3.9 4.6 4.8 0.9 1.1
Shell-on WarmwaterIndia 10.8 10.8 11.3 10.5 2.7 1.6Indonesia 4.8 6.1 5.2 6.3 1.0 1.6Bangladesh 8.2 9.0 6.2 5.7 1.0 1.0Thailand 0.4 0.6 1.2 4.1 0.5 1.1Ecuador 3.0 2.6 3.3 3.3 0.4 0.6Honduras * * 1.2 1.3 0.2 0.2China 0.1 0.8 1.2 1.1 0.2 0.1France 0.9 1.1 1.0 1.0 0.1 0.2Others 9.9 8.4 7.4 5.4 0.0 0.0Total 38.1 39.4 38.0 38.7 7.6 8.1
Cooked & PeeledIceland 20.8 17.7 16.9 15.3 0.9 0.8Denmark 4.9 5.4 6.6 6.9 1.2 1.2Thailand 2.1 2.6 3.9 5.2 0.8 0.6Canada 4.7 4.9 4.5 3.9 0.3 0.2Norway 5.6 4.5 3.5 2.7 0.3 0.6Indonesia 1.3 2.4 3.1 2.6 0.6 0.5Malaysia 2.3 2.3 1.9 1.5 0.3 0.3Viet Nam 0.9 1.5 1.5 1.2 0.2 0.3Others 8.7 5.3 4.7 4.7 0.0 0.0Total 51.3 46.6 46.6 44.0 7.1 3.9______________________________________________________Grand Total 93.8 89.9 89.2 87.5 15.6 15.9___________________________________________________Source: GLOBEFISH AN 010141
SHRIMP
Limited coldwater shrimp supply to UK market
Since 2003,UK shrimp imports have continuouslyshown a negative trend. At the beginning of 2008 thesituation changed with a slight increase in total shrimpimports: +3% in volume and +9% in value. In volume terms,this expansion concerned the frozen-whole category only(+8%) while the processed category registered a 3% de-crease. In value terms, the situation was more positiveparticularly for the prepared and preserved sector whereproducts entered the UK market at a higher unit value (+32cents/kg). Traditional suppliers to the USA continued toincrease their market shares in UK due to the unfavourablesituation in the US market. Indonesia took the lead amongwarmwater shrimp suppliers with a 13% market share (+19%on last year figures).
Thailand continued to strengthen its position in theUK and increased the volume of its exports to this countryby 45%. The increase was also due to growing volumes ofshrimp imports from Vietnam and Ecuador. On the opposite,
Indian exports to the UK shrunk (-40% on last year figures),mainly due to high prices of black tiger (main speciesproduced in India) compared to Vannamei.
The proportion of coldwater shrimp imports in the UKcontinued to be much lower than in the past, but, despitethe decrease experienced, UK remained the only significantmarket for coldwater shrimp in Europe with 5 800 tonnesimported in the first three months of 2008. In this sector,Icelandic exports continued to decline and lost a further10% at the beginning of 2008 compared to last year figures.Danish shrimp exports to the UK remained roughly stableand amounted to 1 841 tonnes. Norway doubled its exportsin 2008, but exports to the UK were much lower than in theyears prior to 2007. During the first months of 2008, pricesfor Norwegian peeled Pandalus borealis on the UK marketshowed an upward trend. On average, prices in June 2008increased by almost 20% compared to last year.
Slow down of German imports
The first quarter of 2008 put an end to the outstandingboom in German shrimp imports. Far from the 22% growthof 2007, shrimp imports during the first three months of 2008increased by only 2% in volume and by 3% in value.
Thailand continued to gain ground on the Germanymarket, with a 18% market share and it remained the numberone supplier to this country. Viet Nam also expanded on theGerman market both for frozen and processed products. Inthe frozen category, Vietnam increased its exports by 58%on last year figures. India lost ground in Germany andregistered a 22% decrease in its exports.
ImportsShrimp: Germany______________________________________________________
Jan- Jan- ...................Jan-Dec................... March March
2004 2005 2006 2007 2007 2008(1000 tonnes)
Thailand 2.2 3.5 4.0 8.9 1.3 2.0Viet Nam 1.5 3.3 4.0 5.7 1.0 1.5India 3.7 4.2 5.3 6.4 1.8 1.3Netherlands 3.0 3.6 4.1 5.7 1.7 1.3Bangladesh 2.1 2.7 3.0 3.1 0.4 0.6Belgium 2.5 2.5 2.8 2.6 0.7 0.7Denmark 1.8 2.1 1.5 2.6 0.3 0.8UK 2.4 3.0 3.1 2.5 0.8 0.5Others 10.8 10.2 12.1 11.4 2.7 2.2_____________________________________________________Total 30.0 35.1 39.9 48.8 10.7 10.9_____________________________________________________Source: GLOBEFISH AN 010146
GLOBEFISH Seafood Highlights 2/20086
SHRIMP VOLUME IMPORTED BY EU-25, USA AND JAPAN - JANUARY-MARCH
USAUSA USA USA USA
EU 25 (extra)
EU 25 (extra)EU 25 (extra) EU 25 (extra) EU 25 (extra)
EU 25 (intra)
EU 25 (intra)EU 25 (intra) EU 25 (intra)
JAPAN
JAPANJAPAN JAPAN JAPAN
EU 25 (intra)
100 000
200 000
300 000
400 000
2004 2005 2006 2007 2008
Tonnes
Comparison to 2007, in %
346 503 MT
5%
+2%
343 480 MT330 710MT368 904 MT
-2%
352 473 MT
Japan driving force in shrimp market
Shrimp exporting countries - such as Thailand, Indo-nesia, Ecuador, India, etc. - which presently expand theirpresence on the European market in order to counterbal-ance adverse circumstances on the US market will soonencounter further difficulties also on the European marketwhere consumption is slowing down significantly. Giventhe general economic situation, shrimp prices are unlikelyto continue at such a low level.
Some economists foresee that, should oil pricescontinue to increase, transport costs could jeopardizetrade liberalization and could force key markets to importmore products from neighbour countries. Regarding shrimp,the USA would turn mainly to South America, Japan wouldimport from other Asian countries whereas Europe wouldhave to change its consumption habits moving more to-wards coldwater shrimp products.
Although today this scenario seems extreme, trans-port costs may in future strongly influence shrimp importingcountries in the choice of their partners. In the short run,Japanese importers and domestic marketers will be active insecuring supplies for the coming summer holidays. In viewof limited raw material availability and increasing produc-tion costs, offer prices will be higher than last year. Theeffect of the price rise on the Japanese market will possiblybe clear after the summer holiday.
The international prices for shrimp appear to differfrom the global trend of increasing food prices. This situa-tion is unlikely to prevail much longer. The final change inshrimp prices will still depend on many factors including therising costs in fishing, farming, processing and transporta-tion etc. In the short run, however, there is very little roomfor shrimp price increases, given the present bleak demandin the EU and in the US market.
SHRIMP
7GLOBEFISH Seafood Highlights 2/2008 7
Frozen tuna: Japan______________________________________________________
Jan- Jan- ...................Jan-Dec................... March March
2004 2005 2006 2007 2007 2008(1000 tonnes)
Yellowfin 109.2 123.5 90.3 58.7 12.9 12.1Bigeye 116.3 101.9 86.3 86.8 21.5 20.8Skipjack 81.2 52.0 50.5 31.3 6.8 7.0S. bluefin 8.2 7.2 7.9 8.4 0.1 0.3Albacore 6.5 6.1 6.2 6.0 0.5 0.6N. Bluefin 6.6 4.2 5.1 6.3 4.0 3.4_____________________________________________________________Total 328.0 295.0 246.3 197.5 45.8 44.2___________________________________________________Source: INFOFISH
Imports
TUNA
Fresh/chilled tuna: Japan______________________________________________________
Jan- Jan- ...................Jan-Dec................... March March
2004 2005 2006 2007 2007 2008(1000 tonnes)
Yellowfin 24.1 21.4 19.0 16.9 4.7 4.2Bigeye 18.9 16.8 15.8 14.5 3.8 3.9Bluefin 10.0 9.9 7.4 5.1 1.8 1.2S. bluefin 3.1 2.5 1.8 1.2 0 0Albacore 0.4 0.2 0.3 0.3 0 0Skipjack 0.1 0.0 0.0 0.1 0 0___________________________________________________Total 56.5 50.9 44.3 38.1 10.3 9.2___________________________________________________
Imports
Source: National Statistics
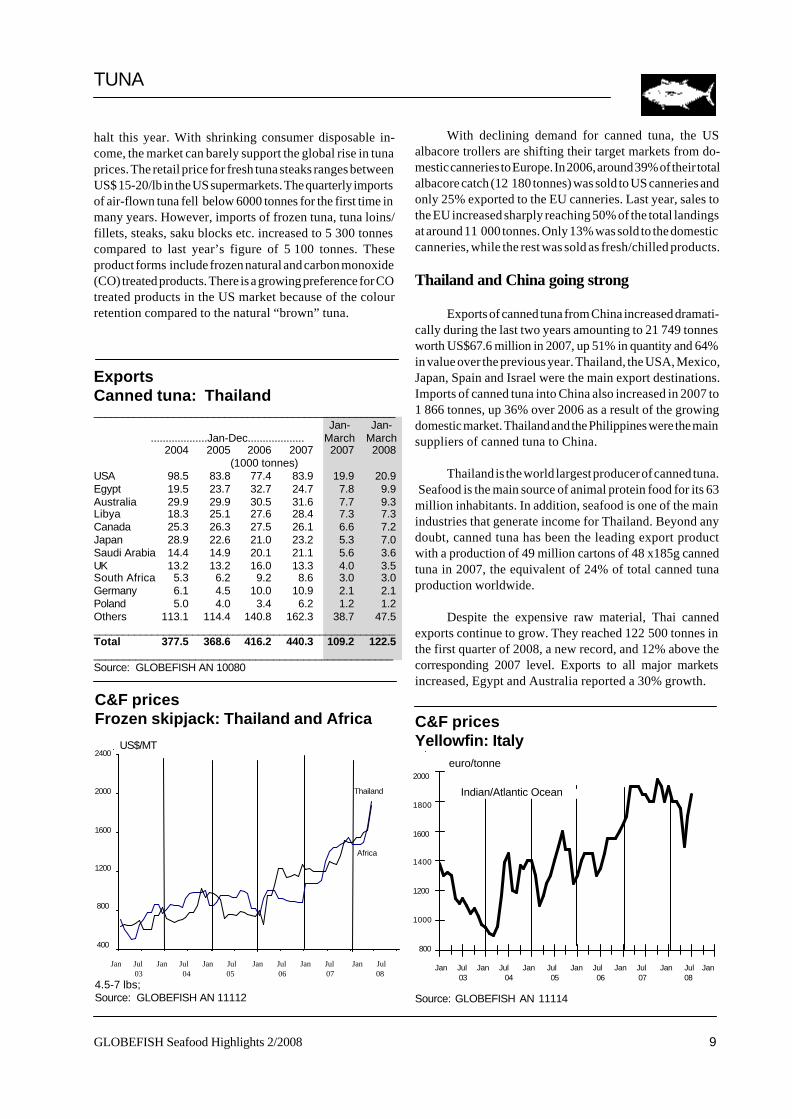
Record skipjack prices
Tuna for canning continued to be in short supply worldwide. The current import price in Bangkokis about US$2000/MT for frozen skipjack, the highest in history. Fishing efforts in the IndianOcean have switched to skipjack with only small amounts of yellowfin being caught; catches ofskipjack are not strong either. In the Eastern Tropical Pacific, landings of yellowfin are slightlybetter and skipjack catches are fair at best. Consequently a reduction in prices is unlikely, on thecontrary further price hikes are expected. The impact of increasing raw material price on cannedtuna is already visible with strong growth in prices everywhere.
Tuna catch under stress
The IATTC failed to agree on management measuresfor tuna fishing in the Eastern Tropical Pacific for calendaryear 2008 and 2009. This failure created major concern bothin the tuna industry and among non governmental organi-zations. There is some hope that Ecuador and possiblyother countries will unilaterally adopt fishing restrictionsto demonstrate cautious and responsible managementbehaviour. On the other hand, this lowered expectations ofa steep price hike driven by a forced fishing ban. Instead,canneries in Latin America expect that fishing operationsand therefore fish supply will not be interrupted dramati-cally in the second half of 2008.
Tuna fishing boat operators’ organizations in Japan,China, Republic of Korea and Taiwan Province of Chinaagreed, in late June 2008, to suspend operations for severalmonths in the face of soaring fuel costs. The economicconditions made it difficult for tuna fishermen to make endsmeet; this measure will have a positive effect on thedeclining tuna population in world's oceans. The suspen-sion is expected to result in higher prices for bigeye andyellowfin tuna, which are mainly consumed as raw fish orprocessed into canned food. Japan’s national tuna andbonito fishermen’s group is in the process of preparingabout 20% of its more than 2 000 fishing vessels to suspendoperations for a couple of months beginning in July 2008.These measures will have an enormous impact on the worldtuna market, not only the sashimi market.
Demand for high grade tuna lethargicin Japan
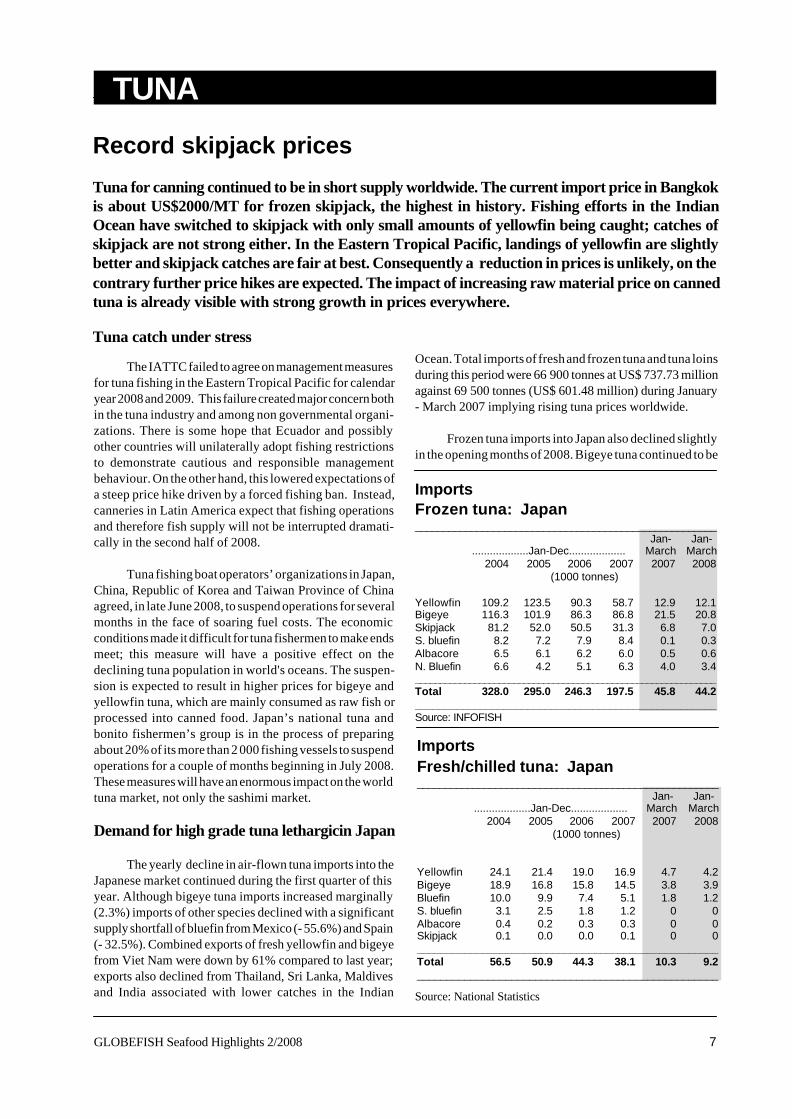
The yearly decline in air-flown tuna imports into theJapanese market continued during the first quarter of thisyear. Although bigeye tuna imports increased marginally(2.3%) imports of other species declined with a significantsupply shortfall of bluefin from Mexico (- 55.6%) and Spain(- 32.5%). Combined exports of fresh yellowfin and bigeyefrom Viet Nam were down by 61% compared to last year;exports also declined from Thailand, Sri Lanka, Maldivesand India associated with lower catches in the Indian
Ocean. Total imports of fresh and frozen tuna and tuna loinsduring this period were 66 900 tonnes at US$ 737.73 millionagainst 69 500 tonnes (US$ 601.48 million) during January- March 2007 implying rising tuna prices worldwide.
Frozen tuna imports into Japan also declined slightlyin the opening months of 2008. Bigeye tuna continued to be
GLOBEFISH Seafood Highlights 2/20088
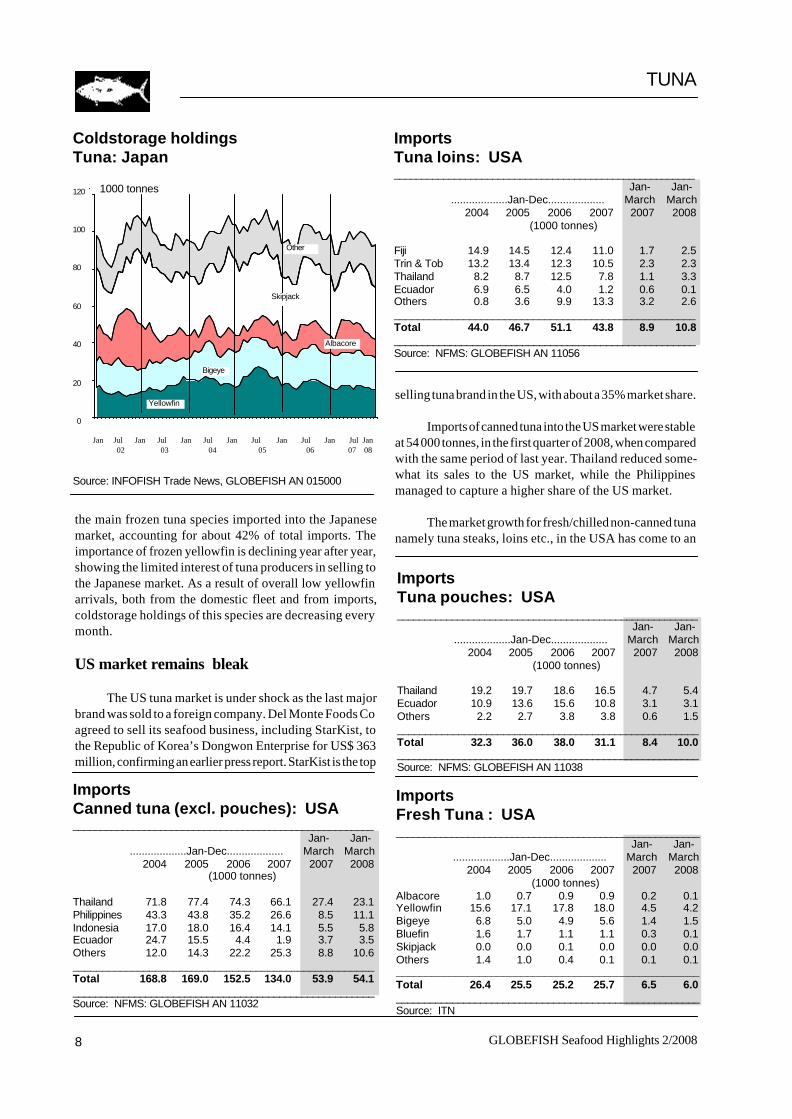
Coldstorage holdingsTuna: Japan
120
100
80
60
40
20
0
Jan Jul Jan Jul Jan Jul Jan Jul Jan Jul Jan Jul Jan 02 03 04 05 06 07 08
Source: INFOFISH Trade News, GLOBEFISH AN 015000
1000 tonnes
Yellowfin
Bigeye
Albacore
Other
Skipjack
the main frozen tuna species imported into the Japanesemarket, accounting for about 42% of total imports. Theimportance of frozen yellowfin is declining year after year,showing the limited interest of tuna producers in selling tothe Japanese market. As a result of overall low yellowfinarrivals, both from the domestic fleet and from imports,coldstorage holdings of this species are decreasing everymonth.
US market remains bleak
The US tuna market is under shock as the last majorbrand was sold to a foreign company. Del Monte Foods Coagreed to sell its seafood business, including StarKist, tothe Republic of Korea’s Dongwon Enterprise for US$ 363million, confirming an earlier press report. StarKist is the top
ImportsTuna pouches: USA_______________________________________________________
Jan- Jan- ...................Jan-Dec................... March March
2004 2005 2006 2007 2007 2008(1000 tonnes)
Thailand 19.2 19.7 18.6 16.5 4.7 5.4Ecuador 10.9 13.6 15.6 10.8 3.1 3.1Others 2.2 2.7 3.8 3.8 0.6 1.5______________________________________________________Total 32.3 36.0 38.0 31.1 8.4 10.0______________________________________________________Source: NFMS: GLOBEFISH AN 11038
ImportsFresh Tuna : USA_______________________________________________________
Jan- Jan- ...................Jan-Dec................... March March
2004 2005 2006 2007 2007 2008(1000 tonnes)
Albacore 1.0 0.7 0.9 0.9 0.2 0.1Yellowfin 15.6 17.1 17.8 18.0 4.5 4.2Bigeye 6.8 5.0 4.9 5.6 1.4 1.5Bluefin 1.6 1.7 1.1 1.1 0.3 0.1Skipjack 0.0 0.0 0.1 0.0 0.0 0.0Others 1.4 1.0 0.4 0.1 0.1 0.1___________________________________________________Total 26.4 25.5 25.2 25.7 6.5 6.0______________________________________________________Source: ITN
selling tuna brand in the US, with about a 35% market share.
Imports of canned tuna into the US market were stableat 54 000 tonnes, in the first quarter of 2008, when comparedwith the same period of last year. Thailand reduced some-what its sales to the US market, while the Philippinesmanaged to capture a higher share of the US market.
The market growth for fresh/chilled non-canned tunanamely tuna steaks, loins etc., in the USA has come to an
ImportsCanned tuna (excl. pouches): USA_______________________________________________________
Jan- Jan- ...................Jan-Dec................... March March
2004 2005 2006 2007 2007 2008(1000 tonnes)
Thailand 71.8 77.4 74.3 66.1 27.4 23.1Philippines 43.3 43.8 35.2 26.6 8.5 11.1Indonesia 17.0 18.0 16.4 14.1 5.5 5.8Ecuador 24.7 15.5 4.4 1.9 3.7 3.5Others 12.0 14.3 22.2 25.3 8.8 10.6___________________________________________________Total 168.8 169.0 152.5 134.0 53.9 54.1______________________________________________________Source: NFMS: GLOBEFISH AN 11032
ImportsTuna loins: USA_______________________________________________________
Jan- Jan- ...................Jan-Dec................... March March
2004 2005 2006 2007 2007 2008(1000 tonnes)
Fiji 14.9 14.5 12.4 11.0 1.7 2.5Trin & Tob 13.2 13.4 12.3 10.5 2.3 2.3Thailand 8.2 8.7 12.5 7.8 1.1 3.3Ecuador 6.9 6.5 4.0 1.2 0.6 0.1Others 0.8 3.6 9.9 13.3 3.2 2.6____________________________________________________Total 44.0 46.7 51.1 43.8 8.9 10.8______________________________________________________Source: NFMS: GLOBEFISH AN 11056
TUNA
9GLOBEFISH Seafood Highlights 2/2008 9
halt this year. With shrinking consumer disposable in-come, the market can barely support the global rise in tunaprices. The retail price for fresh tuna steaks ranges betweenUS$ 15-20/lb in the US supermarkets. The quarterly importsof air-flown tuna fell below 6000 tonnes for the first time inmany years. However, imports of frozen tuna, tuna loins/fillets, steaks, saku blocks etc. increased to 5 300 tonnescompared to last year’s figure of 5 100 tonnes. Theseproduct forms include frozen natural and carbon monoxide(CO) treated products. There is a growing preference for COtreated products in the US market because of the colourretention compared to the natural “brown” tuna.
ExportsCanned tuna: Thailand_____________________________________________________
Jan- Jan- ...................Jan-Dec................... March March
2004 2005 2006 2007 2007 2008(1000 tonnes)
USA 98.5 83.8 77.4 83.9 19.9 20.9Egypt 19.5 23.7 32.7 24.7 7.8 9.9Australia 29.9 29.9 30.5 31.6 7.7 9.3Libya 18.3 25.1 27.6 28.4 7.3 7.3Canada 25.3 26.3 27.5 26.1 6.6 7.2Japan 28.9 22.6 21.0 23.2 5.3 7.0Saudi Arabia 14.4 14.9 20.1 21.1 5.6 3.6UK 13.2 13.2 16.0 13.3 4.0 3.5South Africa 5.3 6.2 9.2 8.6 3.0 3.0Germany 6.1 4.5 10.0 10.9 2.1 2.1Poland 5.0 4.0 3.4 6.2 1.2 1.2Others 113.1 114.4 140.8 162.3 38.7 47.5____________________________________________________Total 377.5 368.6 416.2 440.3 109.2 122.5__________________________________________________Source: GLOBEFISH AN 10080
C&F pricesFrozen skipjack: Thailand and Africa
2400
2000
1600
1200
800
400
Jan Jul Jan Jul Jan Jul Jan Jul Jan Jul Jan Jul 03 04 05 06 07 084.5-7 lbs;Source: GLOBEFISH AN 11112
US$/MT
Africa
Thailand
With declining demand for canned tuna, the USalbacore trollers are shifting their target markets from do-mestic canneries to Europe. In 2006, around 39% of their totalalbacore catch (12 180 tonnes) was sold to US canneries andonly 25% exported to the EU canneries. Last year, sales tothe EU increased sharply reaching 50% of the total landingsat around 11 000 tonnes. Only 13% was sold to the domesticcanneries, while the rest was sold as fresh/chilled products.
Thailand and China going strong
Exports of canned tuna from China increased dramati-cally during the last two years amounting to 21 749 tonnesworth US$67.6 million in 2007, up 51% in quantity and 64%in value over the previous year. Thailand, the USA, Mexico,Japan, Spain and Israel were the main export destinations.Imports of canned tuna into China also increased in 2007 to1 866 tonnes, up 36% over 2006 as a result of the growingdomestic market. Thailand and the Philippines were the mainsuppliers of canned tuna to China.
Thailand is the world largest producer of canned tuna. Seafood is the main source of animal protein food for its 63million inhabitants. In addition, seafood is one of the mainindustries that generate income for Thailand. Beyond anydoubt, canned tuna has been the leading export productwith a production of 49 million cartons of 48 x185g cannedtuna in 2007, the equivalent of 24% of total canned tunaproduction worldwide.
Despite the expensive raw material, Thai cannedexports continue to grow. They reached 122 500 tonnes inthe first quarter of 2008, a new record, and 12% above thecorresponding 2007 level. Exports to all major marketsincreased, Egypt and Australia reported a 30% growth.
2000
1800
1600
1400
1200
1000
800
Jan Jul Jan Jul Jan Jul Jan Jul Jan Jul Jan Jul Jan 03 04 05 06 07 08
Source: GLOBEFISH AN 11114
C&F pricesYellowfin: Italy
euro/tonne
Indian/Atlantic Ocean
TUNA
GLOBEFISH Seafood Highlights 2/200810
ImportsCanned tuna: Germany_____________________________________________________
Jan- Jan- ...................Jan-Dec................... March March
2004 2005 2006 2007 2007 2008(1000 tonnes)
Philippines 28.5 29.4 19.1 20.3 23.4 24.1Ecuador 4.1 4.8 13.7 14.6 15.8 21.2Thailand 9.3 9.6 5.6 11.5 18.1 11.9Papua NG 5.2 8.7 10.7 9.6 4.4 5.7Indonesia 2.1 2.7 3.5 7.0 6.0 8.1Seychelles 8.2 10.6 5.4 6.6 6.7 2.1France 16.8 13.7 7.3 5.7 2.2 1.1Others 11.5 12.2 15.9 8.5 10.2 10.9_____________________________________________________Total 85.7 91.7 81.2 83.8 86.8 85.1__________________________________________________Source: GLOBEFISH
5500
5000
4500
4000
3500
3000
2500
2000
1500
Jan Jul Jan Jul Jan Jul Jan Jul Jan Jul Jan Jul Jan 03 04 05 06 07 08
Source: GLOBEFISH AN 11114
C&F pricesLoins: Italy
Skipjack
ImportsCanned tuna: France______________________________________________________
Jan- Jan- ...................Jan-Dec................... March March
2004 2005 2006 2007 2007 2008(1000 tonnes)
Côte d’Ivoire 33.7 21.6 23.1 27.0 7.8 7.7Spain 18.6 21.8 22.0 19.9 4.8 3.7Madagascar 12.9 14.7 15.4 10.9 3.1 2.6Seychelles 14.7 11.3 14.7 13.6 2.8 2.4Italy 7.3 8.0 8.9 3.5 0.7 0.9Senegal 4.9 4.3 1.1 1.7 0.7 0.3Others 15.0 28.9 35.2 29.7 6.9 6.2
_____________________________________________________Total 107.1 110.6 120.4 106.3 26.8 23.8_____________________________________________________Source: GLOBEFISH AN 11030
ImportsCanned tuna: UK_____________________________________________________
Jan- Jan- ...................Jan-Dec................... March March
2004 2005 2006 2007 2007 2008(1000 tonnes)
Mauritius 29.5 24.9 25.9 27.8 6.8 5.6Seychelles 29.5 28.8 32.0 23.9 6.6 3.2Thailand 13.1 15.9 16.9 14.9 4.1 3.3Philippines 6.2 9.7 10.0 13.0 3.1 4.1Maldives 4.1 4.6 1.9 2.2 1.3 0.4Indonesia 3.1 2.8 0.9 1.7 0.6 0.4Others 46.7 45.9 41.0 47.0 11.5 12.5_____________________________________________________Total 132.2 132.6 128.6 130.5 34.0 29.5_________________________________________________Source: GLOBEFISH AN 11050
euro/tonne
Yellowfin
Countries in the Arab world were the most interestingmarkets for Thai canned tuna exports, and this part of theworld nowadays accounting for over 20% of total Thaiexports. The main importers among Arab countries areEgypt, Libya and Saudi Arabia, with imports exceeding20 000 tonnes per year.
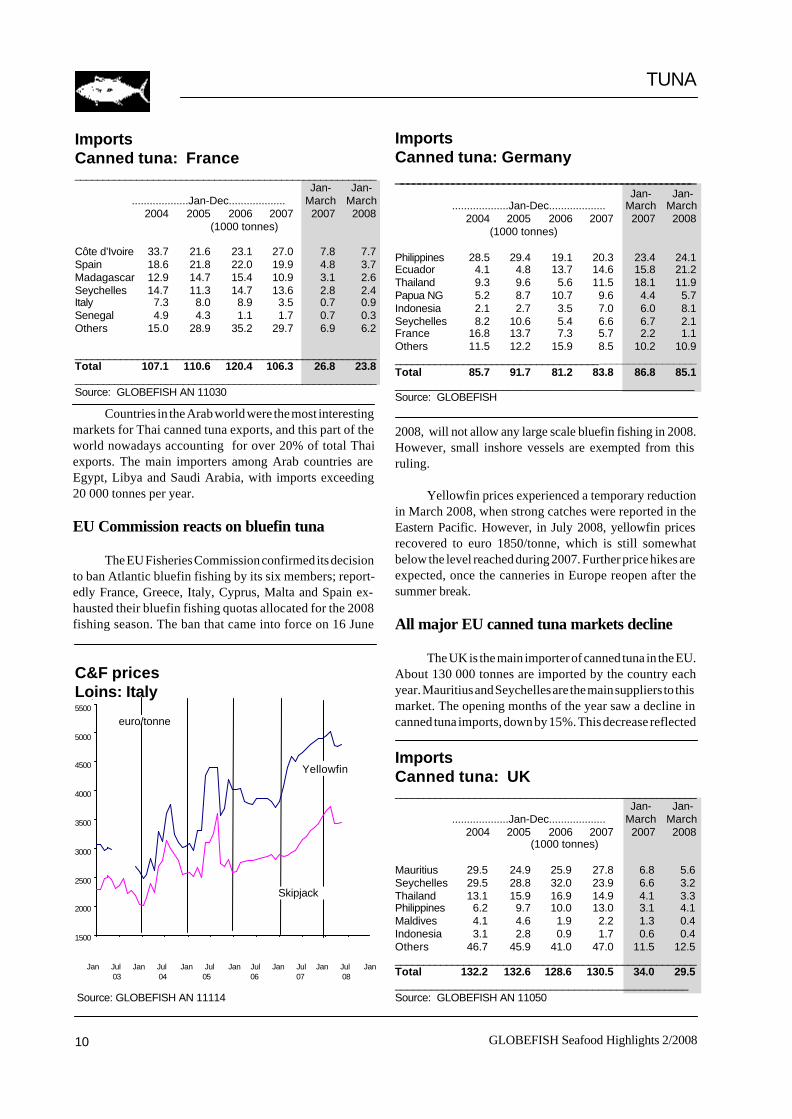
EU Commission reacts on bluefin tuna
The EU Fisheries Commission confirmed its decisionto ban Atlantic bluefin fishing by its six members; report-edly France, Greece, Italy, Cyprus, Malta and Spain ex-hausted their bluefin fishing quotas allocated for the 2008fishing season. The ban that came into force on 16 June
2008, will not allow any large scale bluefin fishing in 2008.However, small inshore vessels are exempted from thisruling.
Yellowfin prices experienced a temporary reductionin March 2008, when strong catches were reported in theEastern Pacific. However, in July 2008, yellowfin pricesrecovered to euro 1850/tonne, which is still somewhatbelow the level reached during 2007. Further price hikes areexpected, once the canneries in Europe reopen after thesummer break.
All major EU canned tuna markets decline
The UK is the main importer of canned tuna in the EU.About 130 000 tonnes are imported by the country eachyear. Mauritius and Seychelles are the main suppliers to thismarket. The opening months of the year saw a decline incanned tuna imports, down by 15%. This decrease reflected
TUNA
11GLOBEFISH Seafood Highlights 2/2008 11
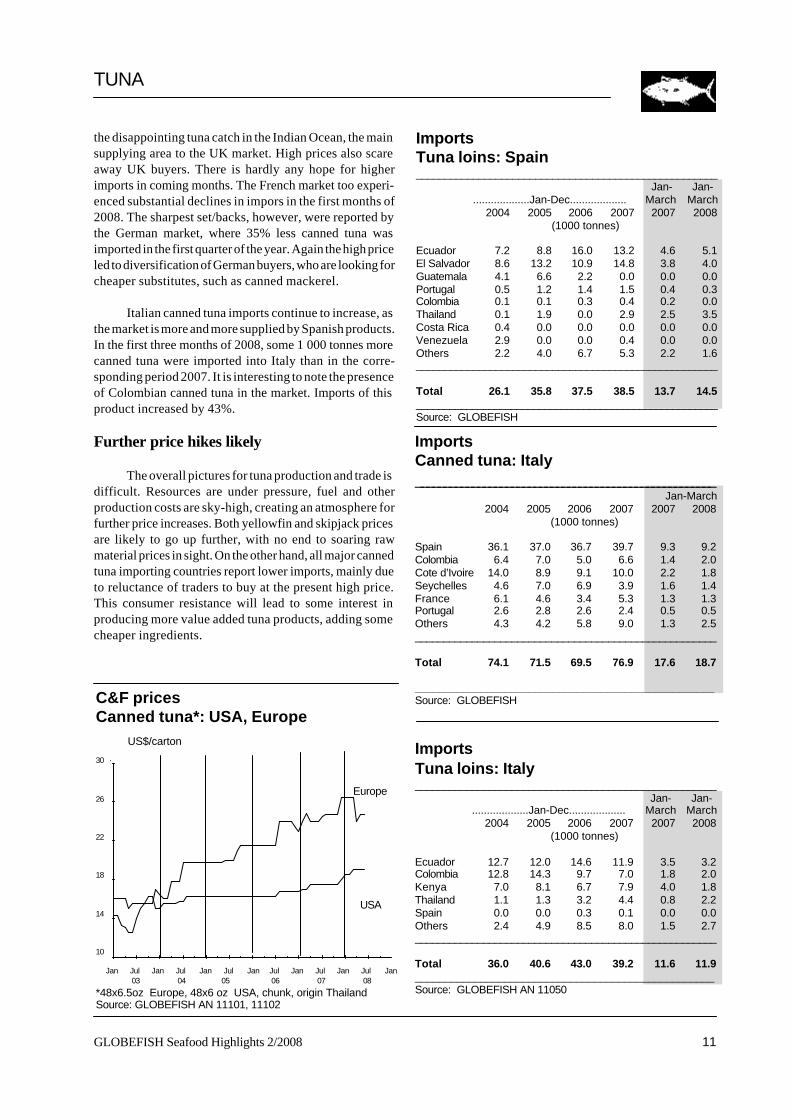
C&F pricesCanned tuna*: USA, Europe
30
26
22
18
14
10
Jan Jul Jan Jul Jan Jul Jan Jul Jan Jul Jan Jul Jan 03 04 05 06 07 08
*48x6.5oz Europe, 48x6 oz USA, chunk, origin ThailandSource: GLOBEFISH AN 11101, 11102
ImportsCanned tuna: Italy_____________________________________________________
Jan-March2004 2005 2006 2007 2007 2008
(1000 tonnes)
Spain 36.1 37.0 36.7 39.7 9.3 9.2Colombia 6.4 7.0 5.0 6.6 1.4 2.0Cote d’Ivoire 14.0 8.9 9.1 10.0 2.2 1.8Seychelles 4.6 7.0 6.9 3.9 1.6 1.4France 6.1 4.6 3.4 5.3 1.3 1.3Portugal 2.6 2.8 2.6 2.4 0.5 0.5Others 4.3 4.2 5.8 9.0 1.3 2.5_____________________________________________________
Total 74.1 71.5 69.5 76.9 17.6 18.7
__________________________________________________Source: GLOBEFISH
Europe
US$/carton
USA
the disappointing tuna catch in the Indian Ocean, the mainsupplying area to the UK market. High prices also scareaway UK buyers. There is hardly any hope for higherimports in coming months. The French market too experi-enced substantial declines in impors in the first months of2008. The sharpest set/backs, however, were reported bythe German market, where 35% less canned tuna wasimported in the first quarter of the year. Again the high priceled to diversification of German buyers, who are looking forcheaper substitutes, such as canned mackerel.
Italian canned tuna imports continue to increase, asthe market is more and more supplied by Spanish products.In the first three months of 2008, some 1 000 tonnes morecanned tuna were imported into Italy than in the corre-sponding period 2007. It is interesting to note the presenceof Colombian canned tuna in the market. Imports of thisproduct increased by 43%.
Further price hikes likely
The overall pictures for tuna production and trade isdifficult. Resources are under pressure, fuel and otherproduction costs are sky-high, creating an atmosphere forfurther price increases. Both yellowfin and skipjack pricesare likely to go up further, with no end to soaring rawmaterial prices in sight. On the other hand, all major cannedtuna importing countries report lower imports, mainly dueto reluctance of traders to buy at the present high price.This consumer resistance will lead to some interest inproducing more value added tuna products, adding somecheaper ingredients.
ImportsTuna loins: Spain_____________________________________________________
Jan- Jan- ...................Jan-Dec................... March March
2004 2005 2006 2007 2007 2008(1000 tonnes)
Ecuador 7.2 8.8 16.0 13.2 4.6 5.1El Salvador 8.6 13.2 10.9 14.8 3.8 4.0Guatemala 4.1 6.6 2.2 0.0 0.0 0.0Portugal 0.5 1.2 1.4 1.5 0.4 0.3Colombia 0.1 0.1 0.3 0.4 0.2 0.0Thailand 0.1 1.9 0.0 2.9 2.5 3.5Costa Rica 0.4 0.0 0.0 0.0 0.0 0.0Venezuela 2.9 0.0 0.0 0.4 0.0 0.0Others 2.2 4.0 6.7 5.3 2.2 1.6_____________________________________________________
Total 26.1 35.8 37.5 38.5 13.7 14.5______________________________________________________Source: GLOBEFISH
ImportsTuna loins: Italy_____________________________________________________
Jan- Jan- ...................Jan-Dec................... March March
2004 2005 2006 2007 2007 2008(1000 tonnes)
Ecuador 12.7 12.0 14.6 11.9 3.5 3.2Colombia 12.8 14.3 9.7 7.0 1.8 2.0Kenya 7.0 8.1 6.7 7.9 4.0 1.8Thailand 1.1 1.3 3.2 4.4 0.8 2.2Spain 0.0 0.0 0.3 0.1 0.0 0.0Others 2.4 4.9 8.5 8.0 1.5 2.7_____________________________________________________
Total 36.0 40.6 43.0 39.2 11.6 11.9__________________________________________________Source: GLOBEFISH AN 11050
TUNA
GLOBEFISH Seafood Highlights 2/200812
C&F pricesGroundfish blocks: USA
3
2.5
2
1.5
1
0.5
0 Jan Jul Jan Jul Jan Jul Jan Jul Jan Jul Jan Jul 03 04 05 06 07 08
Source: GLOBEFISH AN 010805, 10806, 10834
GROUNDFISH
US$/lb
Cod
Hake
Alaska pollack
ImportsCod-like groundfish: USA_____________________________________________________
Jan- Jan- ...................Jan-Dec................... March March
2004 2005 2006 2007 2007 2008(1000 tonnes)
FilletsChina 73.4 89.8 91.3 74.5 20.2 18.8Iceland 20.4 16.5 16.0 11.1 4.1 2.6Canada 10.3 6.7 9.7 5.5 1.1 1.1Norway 2.4 1.2 2.1 0.2 0.4 0.2Others 9.5 8.9 9.0 6.4 1.0 1.5Total 116.0 123.1 128.1 97.7 26.8 24.2
Blocks/SlabsChina 33.2 32.2 25.4 41.7 14.2 12.6Argentina 3.9 2.9 2.9 2.0 0.9 0.8Iceland 3.2 1.9 0.6 0.8 0.2 0.1Norway 1.2 1.4 0.5 0.1 0.0 0.0Russian Fed. 1.6 1.1 0.5 0.8 0.1 0.2Canada 8.2 0.6 0.5 2.1 0.7 0.8Korea Rep. 0.1 0.0 0.0 0.0 0.0 0.0Others 10.0 2.6 2.0 1.7 1.0 1.1Total 61.4 42.7 32.4 49.2 17.1 15.6______________________________________________________Gr. Total 177.4 165.8 160.5 146.9 43.9 39.8
_____________________________________________________Source: NMFS
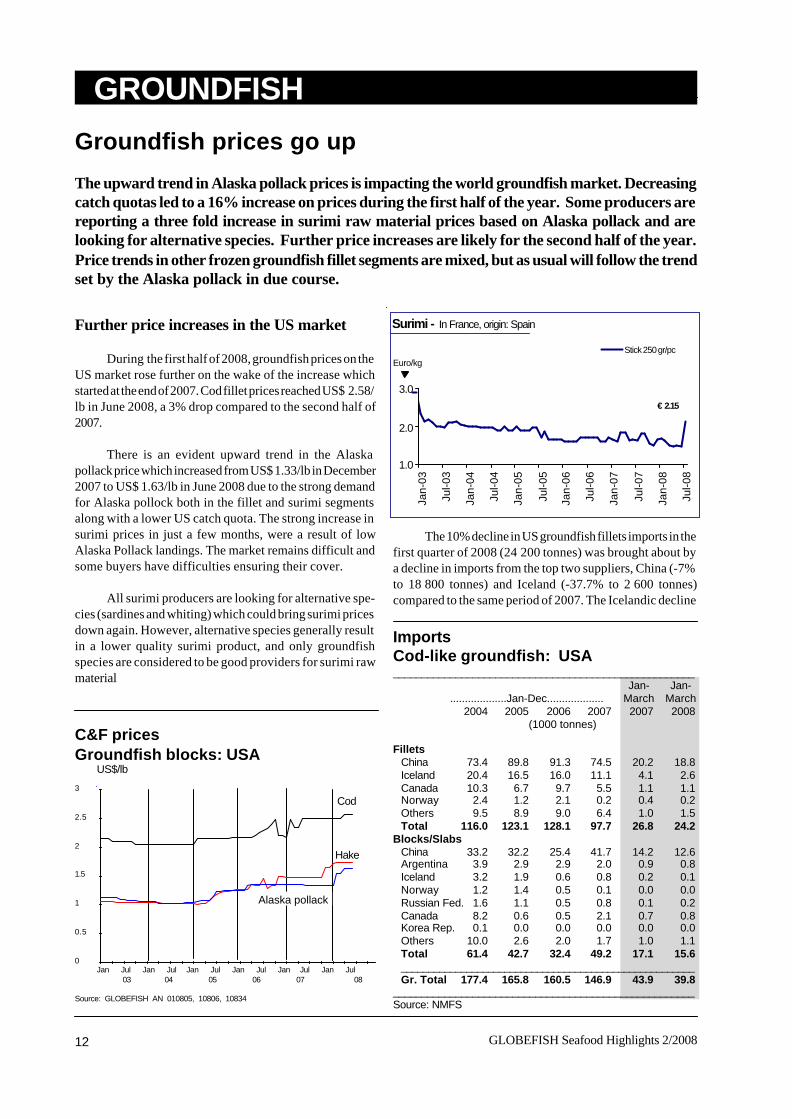
Groundfish prices go up
The upward trend in Alaska pollack prices is impacting the world groundfish market. Decreasingcatch quotas led to a 16% increase on prices during the first half of the year. Some producers arereporting a three fold increase in surimi raw material prices based on Alaska pollack and arelooking for alternative species. Further price increases are likely for the second half of the year.Price trends in other frozen groundfish fillet segments are mixed, but as usual will follow the trendset by the Alaska pollack in due course.
Further price increases in the US market
During the first half of 2008, groundfish prices on theUS market rose further on the wake of the increase whichstarted at the end of 2007. Cod fillet prices reached US$ 2.58/lb in June 2008, a 3% drop compared to the second half of2007.
There is an evident upward trend in the Alaskapollack price which increased from US$ 1.33/lb in December2007 to US$ 1.63/lb in June 2008 due to the strong demandfor Alaska pollock both in the fillet and surimi segmentsalong with a lower US catch quota. The strong increase insurimi prices in just a few months, were a result of lowAlaska Pollack landings. The market remains difficult andsome buyers have difficulties ensuring their cover.
All surimi producers are looking for alternative spe-cies (sardines and whiting) which could bring surimi pricesdown again. However, alternative species generally resultin a lower quality surimi product, and only groundfishspecies are considered to be good providers for surimi rawmaterial
The 10% decline in US groundfish fillets imports in thefirst quarter of 2008 (24 200 tonnes) was brought about bya decline in imports from the top two suppliers, China (-7%to 18 800 tonnes) and Iceland (-37.7% to 2 600 tonnes)compared to the same period of 2007. The Icelandic decline
Surimi - In France, origin: Spain
1.0
2.0
3.0
Jan-
03
Jul-0
3
Jan-
04
Jul-0
4
Jan-
05
Jul-0
5
Jan-
06
Jul-0
6
Jan-
07
Jul-0
7
Jan-
08
Jul-0
8
Stick 250 gr/pcEuro/kg
€ 2.15
13GLOBEFISH Seafood Highlights 2/2008 13
GROUNDFISH
_____________________________________________________Jan- Jan-
...................Jan-Dec................... March March2004 2005 2006 2007 2007 2008
(1000 tonnes)China 16.1 14.3 18.6 18.6 4.7 5.7USA 12.8 12.5 10.8 10.3 2.5 2.3Germany 6.0 5.8 6.3 4.4 1.2 1.1Russian Fed. 4.6 2.1 4.3 4.0 1.6 1.5Others 1.9 1.4 0.6 0.7 0.1 0.1____________________________________________________Total 41.4 36.1 40.8 38.0 10.1 10.7______________________________________________________Source: National Trade Statistics
ImportsFrozen Alaska pollock fillets: France
_____________________________________________________Jan- Jan-
...................Jan-Dec................... March March2004 2005 2006 2007 2007 2008
(1000 tonnes)
China 59.2 58.1 88.0 78.5 19.7 20.8USA 51.2 47.0 39.4 55.2 15.4 17.8Russia 22.0 15.5 27.6 25.4 7.3 4.9Others 4.2 3.0 6.1 5.3 2.0 0.9____________________________________________________Total 136.6 123.6 161.1 164.4 44.4 44.4______________________________________________________Source: Statistisches Bundesamt
ImportsFrozen Alaska pollock fillets: Germany
___________________________________________________Jan- Jan-
...................Jan-Dec................... March March2004 2005 2006 2007 2007 2008
(1000 tonnes)
Russia 28.8 36.9 13.0 4.1 0.8 0.1Denmark 17.6 16.7 16.9 12.4 4.9 2.1China 15.0 16.5 23.2 21.9 8.2 6.3Iceland 16.9 14.8 16.1 18.0 6.2 4.0Norway 8.8 9.0 14.0 11.4 3.2 3.9Faroe Is. 7.0 4.9 6.5 4.4 0.1 0.9Germany 3.0 1.3 1.9 4.5 0.7 0.3Poland 1.6 1.3 6.5 3.6 1.0 0.9Others 4.5 7.3 8.2 6.0 1.9 0.2___________________________________________________Total 103.2 108.5 106.3 86.3 27.0 18.7_______________________________________________________Source: Seafish/national trade statistics
ImportsFrozen cod: UK
was mainly caused by the sharply reduced cod catchquotas for 2008. An analogous drop in imports was regis-tered by groundfish blocks (-9%) when the first threemonths of this year are compared to the correspondingperiod of 2007. China, the main supplier of groundfishblocks to the USA, reduced its shipments to this market by11% compared to last year and whereas other countrieshave kept their export levels stable.
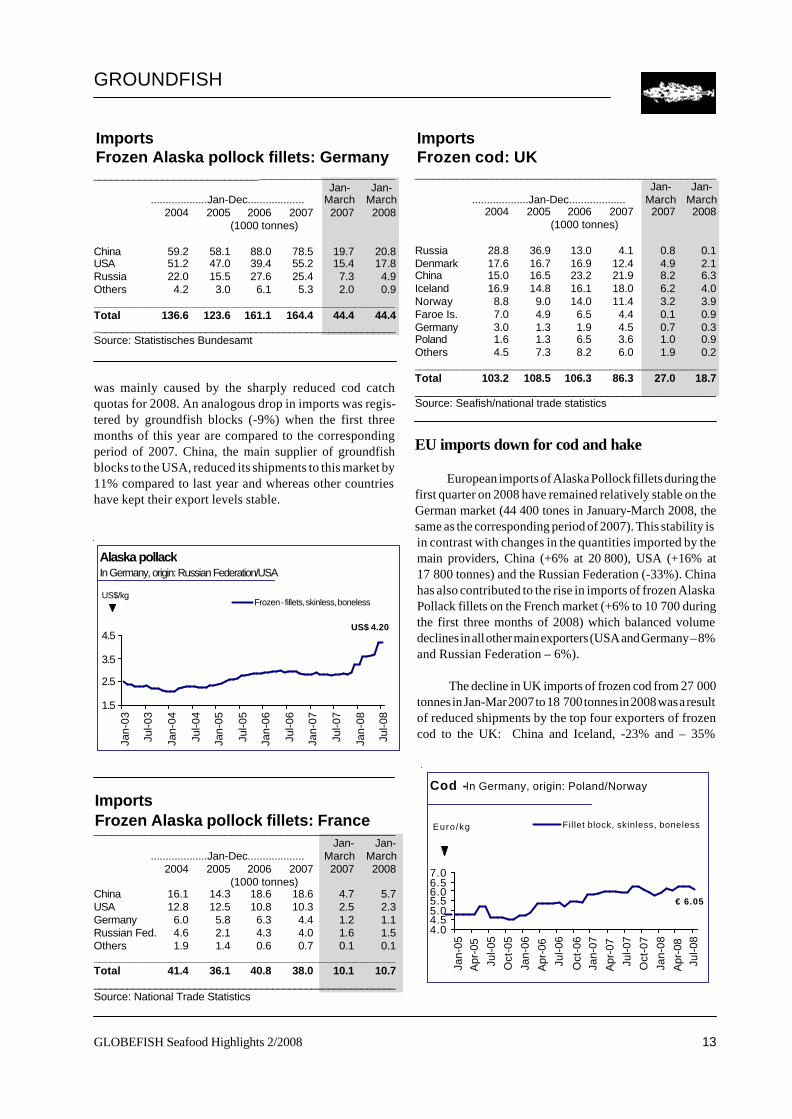
EU imports down for cod and hake
European imports of Alaska Pollock fillets during thefirst quarter on 2008 have remained relatively stable on theGerman market (44 400 tones in January-March 2008, thesame as the corresponding period of 2007). This stability isin contrast with changes in the quantities imported by themain providers, China (+6% at 20 800), USA (+16% at17 800 tonnes) and the Russian Federation (-33%). Chinahas also contributed to the rise in imports of frozen AlaskaPollack fillets on the French market (+6% to 10 700 duringthe first three months of 2008) which balanced volumedeclines in all other main exporters (USA and Germany – 8%and Russian Federation – 6%).
The decline in UK imports of frozen cod from 27 000tonnes in Jan-Mar 2007 to 18 700 tonnes in 2008 was a resultof reduced shipments by the top four exporters of frozencod to the UK: China and Iceland, -23% and – 35%
Alaska pollack In Germany, origin: Russian Federation/USA
1.5
2.5
3.5
4.5
Jan-
03
Jul-0
3
Jan-
04
Jul-0
4
Jan-
05
Jul-0
5
Jan-
06
Jul-0
6
Jan-
07
Jul-0
7
Jan-
08
Jul-0
8
Frozen - fillets, skinless, bonelessUS$/kg
US$ 4.20
Cod -In Germany, origin: Poland/Norway
4.04.55.05.56.06.57.0
Jan-
05A
pr-0
5
Jul-0
5
Oct
-05
Jan-
06
Apr
-06
Jul-0
6
Oct
-06
Jan-
07
Apr
-07
Jul-0
7
Oct
-07
Jan-
08
Apr
-08
Jul-0
8
Fillet block, skinless, bonelessEuro/kg
€ 6.05

GLOBEFISH Seafood Highlights 2/200814
GROUNDFISH
_____________________________________________________Jan- Jan-
...................Jan-Dec................... March March2004 2005 2006 2007 2007 2008
(1000 tonnes)
China 4.7 8.3 8.1 12.2 3.0 3.8Russia 1.5 1.1 2.4 1.1 0.5 0.5Poland 4.4 2.1 1.4 3.8 1.5 0.6Denmark 1.0 1.4 1.2 1.5 0.3 0.7Norway 1.4 1.9 0.6 0.6 0.1 0.1Iceland 0.8 1.0 0.5 0.3 0.0 0.1Others 3.0 1.4 1.8 2.7 0.6 0.3____________________________________________________Total 16.8 17.2 16.0 22.2 6.0 6.1_______________________________________________________Source: Statistisches Bundesamt
ImportsFrozen cod fillets: Germany
respectively during the first quarter of this year comparedto Jan-Mar 2007.
The German cod fillet market does not appear asdynamic as the UK one despite the important increase involume in 2007 compared to 2006 as a consequence ofincreased Chinese supplies. Comparing the frozen cod filletimports by Germany of first quarter of 2008 with the samemonths of 2007 no evident change can be noted since therise in Chinese cod fillet exports to Germany (+27%) werecounterbalanced by reduced shipments from Poland (-60%).
_____________________________________________________Jan- Jan-
...................Jan-Dec................... March March2004 2005 2006 2007 2007 2008
(1000 tonnes)Argentina 4.8 5.8 6.9 6.1 1.5 0.8USA 2.5 3.6 4.4 6.1 2.2 2.0Peru 2.1 4.1 4.1 4.1 1.1 1.5Chile. 3.6 2.0 2.2 1.0 0.7 0.3Russian Fed. * 6.2 0.2 0.0 0.0 0.0Others 9.0 7.1 6.6 4.5 1.8 1.0______________________________________________________Total 22.0 28.8 24.4 21.8 7.3 5.6__________________________________________________Source: Statistisches Bundesamt
ImportsFrozen hake fillets: Germany
1.2% down on the same period in 2007. Lower landings ofcommon and southern hake were balanced by higher land-ings of hoki. The latter species accounted for 39% oflandings in the period under review, and grew 12% com-pared to the figures of the previous years. The other twospecies showed a reduction in landings, -7% for commonhake, and -11% for southern hake. The evolution of landingsbetween January and April for the last three years can beobserved in the following graph.
Between January and March 2008, Spain and the USAremained the main buyers of Chilean hake in terms of value(US$ 18.3 million and US$ 1.8 million respectively), as wellas in terms of volume (4 396 tonnes and 730 tonnes respec-tively). The Spanish share in total exports, was higher in thecurrent period (55% and 76% respectively in terms ofquantity and value). The third market in importance wasPortugal (300 tonnes worth US$ 1.5 million, followed byGermany and France. Venezuela again is placed as one of themain markets for Chilean hake in terms of value with thehighest unit value (although lower than the level for 2007 ofUS$ 8.1/kg).
Between January and May 2008, landings of hake inArgentina were 167 000 tonnes which represents a declineof 11%, compared to the same period in 2007. Hubbsi hakehad a 69% share in total landings, followed by hoki with 30%.Landings were lower for all species with hoki showing themost significant drop at -19%. As a consequence of thedeterioration of the state of the resource, the Agriculture,Livestock, Fishing and Food Secretary (SAGPyA) cut thetotal allowable catch (TAC) of hubbsi hake by 20% for 2008,from 340 000 tonnes in 2007 to 270 000 tonnes. That TACwas set also for the next five years. On the other hand,according to several reports of the National Institute ofFisheries Research and Development (INIDEP), the stocksare formed mainly by juveniles, which implies special meas-ures to preserve them. The effects of the lower quotas anda raw material shortage are starting to show.
Further price hikes likely
Groundfish resources continue to be under stress inalmost all fishing areas. Demand for whitefish productsstays strong, which leads to higher offer prices in allmarkets. In addition to the traditional markets – EU andUSA – new markets are emerging, mainly Brazil and Russia.Difficult supply situation for hake
Difficult supply situation for hake
In the first quarter of 2008 hake imports into Italy andGermany experienced a decline (-3% and -23% respec-tively) as a result of lower arrivals from Argentina comparedto the January-March 2007 period. This country remainsthe top supplier to the Italian marked but has lost its leadingposition to the USA on the German market. Spanish frozenhake exports to Italy dropped by 24% during the sameperiod.
During the first four months of 2008, Chilean land-ings of hake (including hoki) amounted to 33 500 tonnes,
15GLOBEFISH Seafood Highlights 2/2008 15
GROUNDFISH
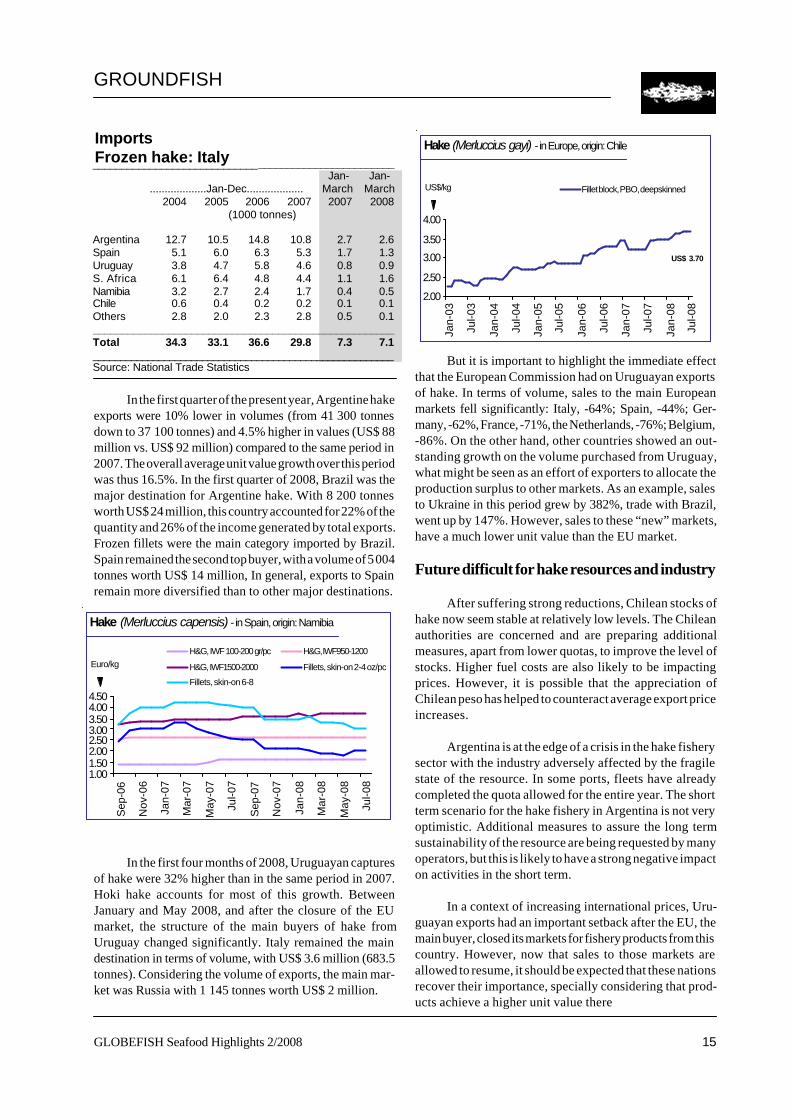
In the first quarter of the present year, Argentine hakeexports were 10% lower in volumes (from 41 300 tonnesdown to 37 100 tonnes) and 4.5% higher in values (US$ 88million vs. US$ 92 million) compared to the same period in2007. The overall average unit value growth over this periodwas thus 16.5%. In the first quarter of 2008, Brazil was themajor destination for Argentine hake. With 8 200 tonnesworth US$ 24 million, this country accounted for 22% of thequantity and 26% of the income generated by total exports.Frozen fillets were the main category imported by Brazil.Spain remained the second top buyer, with a volume of 5 004tonnes worth US$ 14 million, In general, exports to Spainremain more diversified than to other major destinations.
In the first four months of 2008, Uruguayan capturesof hake were 32% higher than in the same period in 2007.Hoki hake accounts for most of this growth. BetweenJanuary and May 2008, and after the closure of the EUmarket, the structure of the main buyers of hake fromUruguay changed significantly. Italy remained the maindestination in terms of volume, with US$ 3.6 million (683.5tonnes). Considering the volume of exports, the main mar-ket was Russia with 1 145 tonnes worth US$ 2 million.
But it is important to highlight the immediate effectthat the European Commission had on Uruguayan exportsof hake. In terms of volume, sales to the main Europeanmarkets fell significantly: Italy, -64%; Spain, -44%; Ger-many, -62%, France, -71%, the Netherlands, -76%; Belgium,-86%. On the other hand, other countries showed an out-standing growth on the volume purchased from Uruguay,what might be seen as an effort of exporters to allocate theproduction surplus to other markets. As an example, salesto Ukraine in this period grew by 382%, trade with Brazil,went up by 147%. However, sales to these “new” markets,have a much lower unit value than the EU market.
Future difficult for hake resources and industry
After suffering strong reductions, Chilean stocks ofhake now seem stable at relatively low levels. The Chileanauthorities are concerned and are preparing additionalmeasures, apart from lower quotas, to improve the level ofstocks. Higher fuel costs are also likely to be impactingprices. However, it is possible that the appreciation ofChilean peso has helped to counteract average export priceincreases.
Argentina is at the edge of a crisis in the hake fisherysector with the industry adversely affected by the fragilestate of the resource. In some ports, fleets have alreadycompleted the quota allowed for the entire year. The shortterm scenario for the hake fishery in Argentina is not veryoptimistic. Additional measures to assure the long termsustainability of the resource are being requested by manyoperators, but this is likely to have a strong negative impacton activities in the short term.
In a context of increasing international prices, Uru-guayan exports had an important setback after the EU, themain buyer, closed its markets for fishery products from thiscountry. However, now that sales to those markets areallowed to resume, it should be expected that these nationsrecover their importance, specially considering that prod-ucts achieve a higher unit value there
1.001.502.002.503.003.504.004.50
Sep
-06
Nov
-06
Jan-
07
Mar
-07
May
-07
Jul-0
7
Sep
-07
Nov
-07
Jan-
08
Mar
-08
May
-08
Jul-0
8
H&G, IWF 100-200 gr/pc H&G, IWF950-1200
H&G, IWF1500-2000 Fillets, skin-on 2-4 oz/pc
Fillets, skin-on 6-8
Euro/kg
Hake (Merluccius capensis) - in Spain, origin: Namibia
_____________________________________________________Jan- Jan-
...................Jan-Dec................... March March2004 2005 2006 2007 2007 2008
(1000 tonnes)
Argentina 12.7 10.5 14.8 10.8 2.7 2.6Spain 5.1 6.0 6.3 5.3 1.7 1.3Uruguay 3.8 4.7 5.8 4.6 0.8 0.9S. Africa 6.1 6.4 4.8 4.4 1.1 1.6Namibia 3.2 2.7 2.4 1.7 0.4 0.5Chile 0.6 0.4 0.2 0.2 0.1 0.1Others 2.8 2.0 2.3 2.8 0.5 0.1____________________________________________________Total 34.3 33.1 36.6 29.8 7.3 7.1_______________________________________________________Source: National Trade Statistics
ImportsFrozen hake: Italy
2.00
2.50
3.00
3.50
4.00
Jan-
03
Jul-0
3
Jan-
04
Jul-0
4
Jan-
05
Jul-0
5
Jan-
06
Jul-0
6
Jan-
07
Jul-0
7
Jan-
08
Jul-0
8
Fillet block, PBO, deepskinnedUS$/kg
US$ 3.70
Hake (Merluccius gayi) - in Europe, origin: Chile
GLOBEFISH Seafood Highlights 2/200816
Wholesale pricesOctopus: Japan
14
13
12
11
10
9
8
7
6
5
4
3
2
1
0
Jan Jul Jan Jul Jan Jul Jan Jul Jan Jul Jan Jul Jan 03 04 05 06 07 08
Source: INFOFISH Trade News, GLOBEFISH AN 10507
CEPHALOPODS
ImportsOctopus: Japan_____________________________________________________
Jan- Jan- ...................Jan-Dec................... March March
2004 2005 2006 2007 2007 2008(1000 tonnes)
Mauritania 14.5 19.5 16.6 14.0 3.8 4.0China 13.1 9.9 8.2 7.2 1.3 2.3Spain 5.9 6.2 4.0 1.8 0.5 1.2Viet Nam 5.9 5.6 5.5 4.8 1.1 0.8Morocco 5.2 8.7 8.7 10.3 1.6 0.5Thailand 1.8 3.0 1.9 1.8 0.5 0.3Others 6.9 2.6 3.5 6.9 0.5 2.3_____________________________________________________Total 53.3 55.5 48.4 46.8 9.3 11.4_____________________________________________________Source: GLOBEFISH AN 10438
US$/kg 2.0-3.0 kg/pc
0.3-0.5 kg/pc
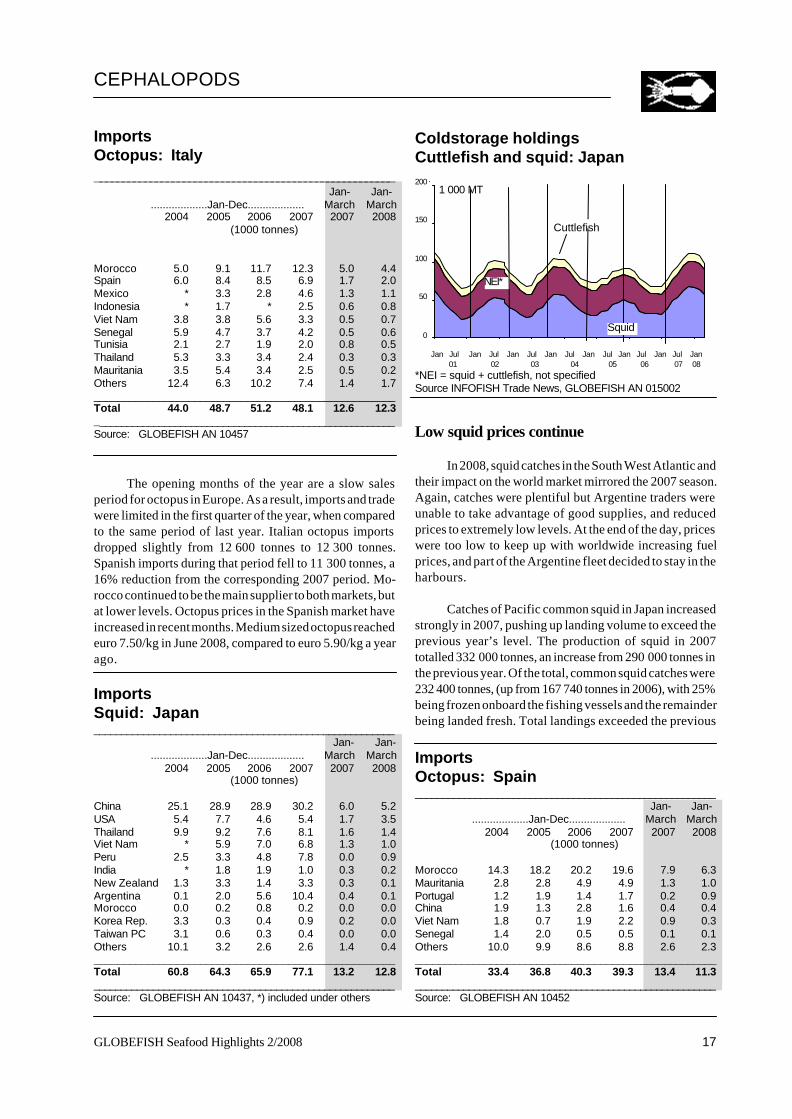
Difficult squid market
2008 was once more a year of low prices, created by heavy landings of Illex squid. Argentinetraders were again, like last year, unable to take advantage of the good supplies, and discountedIllex prices to extremely low levels. For this reason, prices became too low to keep up withworldwide increasing fuel prices, thus part of the Argentine fleet decided to stay in the harbours,as catching activities had become uneconomical. On the other hand, octopus trade is managedbetter by the African countries, especially Morocco, being the owners of this resource. Slightdiscounts on octopus are likely to materialize in the near future, but overall, the market is wellbalanced.
More octopus in the market
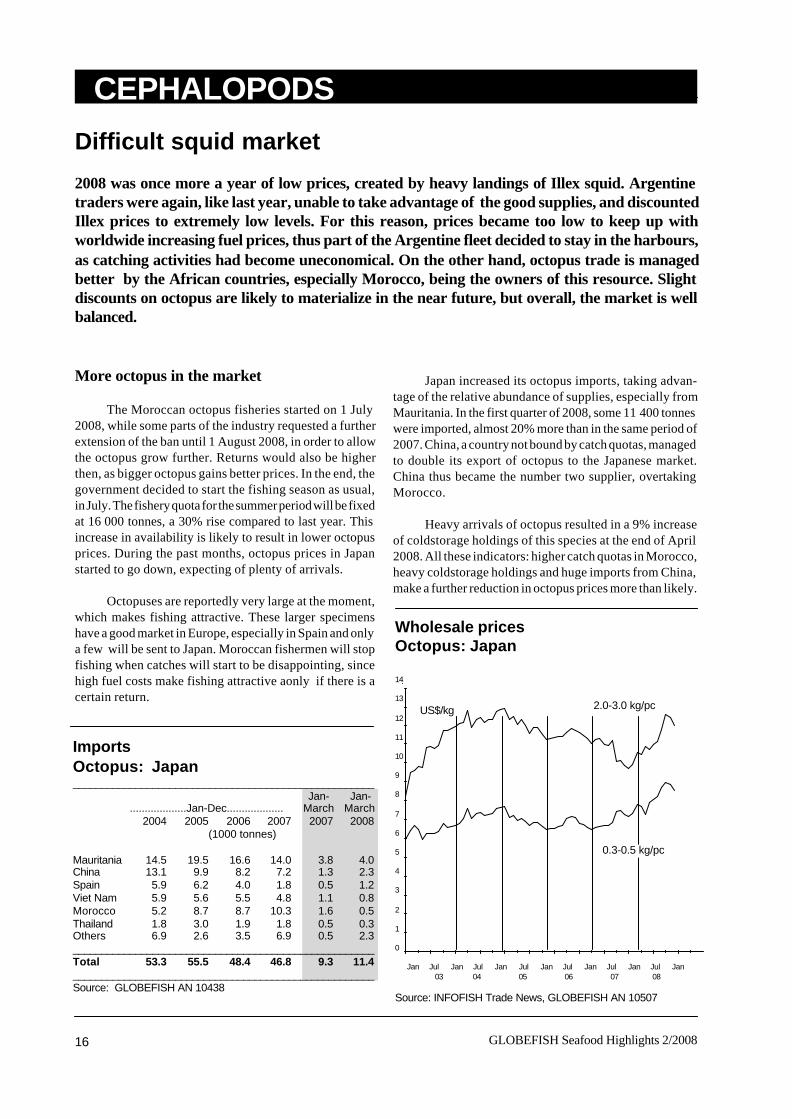
The Moroccan octopus fisheries started on 1 July2008, while some parts of the industry requested a furtherextension of the ban until 1 August 2008, in order to allowthe octopus grow further. Returns would also be higherthen, as bigger octopus gains better prices. In the end, thegovernment decided to start the fishing season as usual,in July. The fishery quota for the summer period will be fixedat 16 000 tonnes, a 30% rise compared to last year. Thisincrease in availability is likely to result in lower octopusprices. During the past months, octopus prices in Japanstarted to go down, expecting of plenty of arrivals.
Octopuses are reportedly very large at the moment,which makes fishing attractive. These larger specimenshave a good market in Europe, especially in Spain and onlya few will be sent to Japan. Moroccan fishermen will stopfishing when catches will start to be disappointing, sincehigh fuel costs make fishing attractive aonly if there is acertain return.
Japan increased its octopus imports, taking advan-tage of the relative abundance of supplies, especially fromMauritania. In the first quarter of 2008, some 11 400 tonneswere imported, almost 20% more than in the same period of2007. China, a country not bound by catch quotas, managedto double its export of octopus to the Japanese market.China thus became the number two supplier, overtakingMorocco.
Heavy arrivals of octopus resulted in a 9% increaseof coldstorage holdings of this species at the end of April2008. All these indicators: higher catch quotas in Morocco,heavy coldstorage holdings and huge imports from China,make a further reduction in octopus prices more than likely.
17GLOBEFISH Seafood Highlights 2/2008 17
Coldstorage holdingsCuttlefish and squid: Japan200
150
100
50
0
Jan Jul Jan Jul Jan Jul Jan Jul Jan Jul Jan Jul Jan Jul Jan 01 02 03 04 05 06 07 08*NEI = squid + cuttlefish, not specifiedSource INFOFISH Trade News, GLOBEFISH AN 015002
ImportsSquid: Japan_______________________________________________________
Jan- Jan- ...................Jan-Dec................... March March
2004 2005 2006 2007 2007 2008(1000 tonnes)
China 25.1 28.9 28.9 30.2 6.0 5.2USA 5.4 7.7 4.6 5.4 1.7 3.5Thailand 9.9 9.2 7.6 8.1 1.6 1.4Viet Nam * 5.9 7.0 6.8 1.3 1.0Peru 2.5 3.3 4.8 7.8 0.0 0.9India * 1.8 1.9 1.0 0.3 0.2New Zealand 1.3 3.3 1.4 3.3 0.3 0.1Argentina 0.1 2.0 5.6 10.4 0.4 0.1Morocco 0.0 0.2 0.8 0.2 0.0 0.0Korea Rep. 3.3 0.3 0.4 0.9 0.2 0.0Taiwan PC 3.1 0.6 0.3 0.4 0.0 0.0Others 10.1 3.2 2.6 2.6 1.4 0.4___________________________________________________Total 60.8 64.3 65.9 77.1 13.2 12.8________________________________________________________Source: GLOBEFISH AN 10437, *) included under others
CEPHALOPODS
ImportsOctopus: Italy______________________________________________________
Jan- Jan- ...................Jan-Dec................... March March
2004 2005 2006 2007 2007 2008(1000 tonnes)
Morocco 5.0 9.1 11.7 12.3 5.0 4.4Spain 6.0 8.4 8.5 6.9 1.7 2.0Mexico * 3.3 2.8 4.6 1.3 1.1Indonesia * 1.7 * 2.5 0.6 0.8Viet Nam 3.8 3.8 5.6 3.3 0.5 0.7Senegal 5.9 4.7 3.7 4.2 0.5 0.6Tunisia 2.1 2.7 1.9 2.0 0.8 0.5Thailand 5.3 3.3 3.4 2.4 0.3 0.3Mauritania 3.5 5.4 3.4 2.5 0.5 0.2Others 12.4 6.3 10.2 7.4 1.4 1.7___________________________________________________Total 44.0 48.7 51.2 48.1 12.6 12.3________________________________________________________Source: GLOBEFISH AN 10457
NEI*
1 000 MT
Cuttlefish
Squid
The opening months of the year are a slow salesperiod for octopus in Europe. As a result, imports and tradewere limited in the first quarter of the year, when comparedto the same period of last year. Italian octopus importsdropped slightly from 12 600 tonnes to 12 300 tonnes.Spanish imports during that period fell to 11 300 tonnes, a16% reduction from the corresponding 2007 period. Mo-rocco continued to be the main supplier to both markets, butat lower levels. Octopus prices in the Spanish market haveincreased in recent months. Medium sized octopus reachedeuro 7.50/kg in June 2008, compared to euro 5.90/kg a yearago.
Low squid prices continue
In 2008, squid catches in the South West Atlantic andtheir impact on the world market mirrored the 2007 season.Again, catches were plentiful but Argentine traders wereunable to take advantage of good supplies, and reducedprices to extremely low levels. At the end of the day, priceswere too low to keep up with worldwide increasing fuelprices, and part of the Argentine fleet decided to stay in theharbours.
Catches of Pacific common squid in Japan increasedstrongly in 2007, pushing up landing volume to exceed theprevious year’s level. The production of squid in 2007totalled 332 000 tonnes, an increase from 290 000 tonnes inthe previous year. Of the total, common squid catches were232 400 tonnes, (up from 167 740 tonnes in 2006), with 25%being frozen onboard the fishing vessels and the remainderbeing landed fresh. Total landings exceeded the previous
ImportsOctopus: Spain_______________________________________________________
Jan- Jan- ...................Jan-Dec................... March March
2004 2005 2006 2007 2007 2008(1000 tonnes)
Morocco 14.3 18.2 20.2 19.6 7.9 6.3Mauritania 2.8 2.8 4.9 4.9 1.3 1.0Portugal 1.2 1.9 1.4 1.7 0.2 0.9China 1.9 1.3 2.8 1.6 0.4 0.4Viet Nam 1.8 0.7 1.9 2.2 0.9 0.3Senegal 1.4 2.0 0.5 0.5 0.1 0.1Others 10.0 9.9 8.6 8.8 2.6 2.3____________________________________________________Total 33.4 36.8 40.3 39.3 13.4 11.3________________________________________________________Source: GLOBEFISH AN 10452
GLOBEFISH Seafood Highlights 2/200818
ImportsSquid: Spain_______________________________________________________
Jan- Jan- ...................Jan-Dec................... March March
2004 2005 2006 2007 2007 2008(1000 tonnes)
Argentina 30.2 46.6 83.6 61.3 8.0 4.2Falkland/Malv. 28.4 48.0 42.4 40.3 7.0 3.5India 16.4 20.1 18.2 12.8 3.1 2.3China 12.5 7.0 8.1 6.4 1.8 1.9Morocco 2.6 3.7 4.5 1.4 0.4 0.6South Africa 6.8 5.0 4.0 3.5 1.0 1.2USA 5.8 3.6 3.9 1.7 0.6 1.0Korea Rep. 2.8 4.8 2.5 2.0 0.6 1.0Peru 9.8 3.7 1.8 4.5 1.1 0.3New Zealand 15.0 0.1 0.0 0.1 0.0 0.0Others 15.5 13.1 12.2 11.8 1.7 4.1___________________________________________________Total 145.8 155.7 181.2 145.8 25.3 20.1________________________________________________________Source: GLOBEFISH AN 10450
CEPHALOPODS
Wholesale pricesCuttlefish, squid: Japan
8
7
6
5
4
3
2
1
Jan Jul Jan Jul Jan Jul Jan Jul Jan Jul Jan Jul Jan 03 04 05 06 07 08*whole 10 kg/block, 0.4-0.6 kg/pc; **whole 7.5 kg/block,21-25 pc/kg;Source: INFOFISH Trade News, GLOBEFISH AN 10501, 09
US$/kg
Squid**
Cuttlefish*
ImportsSquid: Italy_______________________________________________________
Jan- Jan- ...................Jan-Dec................... March March
2004 2005 2006 2007 2007 2008(1000 tonnes)
Spain 26.4 28.8 30.3 25.2 7.6 6.3Thailand 19.5 20.5 21.2 22.8 4.6 5.5Argentina 5.6 7.6 8.9 10.7 0.7 0.6Peru 6.0 6.4 3.4 3.4 0.6 0.1S. Africa 6.3 5.4 5.0 3.7 1.4 0.7India 3.5 3.3 3.8 2.9 0.7 0.6New Zealand 2.4 1.6 2.3 0.1 0.0 0.0Others 17.6 21.5 22.7 32.8 5.2 6.0___________________________________________________Total 87.3 95.1 97.7 101.6 20.8 19.8________________________________________________________Source: GLOBEFISH AN 10455
ImportsSquid: USA_______________________________________________________
Jan- Jan- ...................Jan-Dec................... March March
2004 2005 2006 2007 2007 2008(1000 tonnes)
China 21.3 25.6 32.9 28.8 7.2 5.3Thailand 6.8 7.1 7.4 7.2 1.6 2.8India 6.5 6.1 8.2 4.5 1.2 0.9Taiwan PC 6.1 4.7 5.6 5.9 0.9 1.4New Zealand 2.5 3.8 2.2 2.5 0.4 0.3Rep. Korea 2.4 3.0 2.8 3.1 0.6 0.9Peru 1.6 1.7 1.7 0.1 0.6 0.4Others 5.9 6.0 8.4 10.3 1.7 1.2___________________________________________________Total 53.1 58.0 69.2 62.4 14.2 13.2________________________________________________________Source: GLOBEFISH AN 10459
year’s level by about 65 000 tonnes mainly due to theincrease in fresh landings.
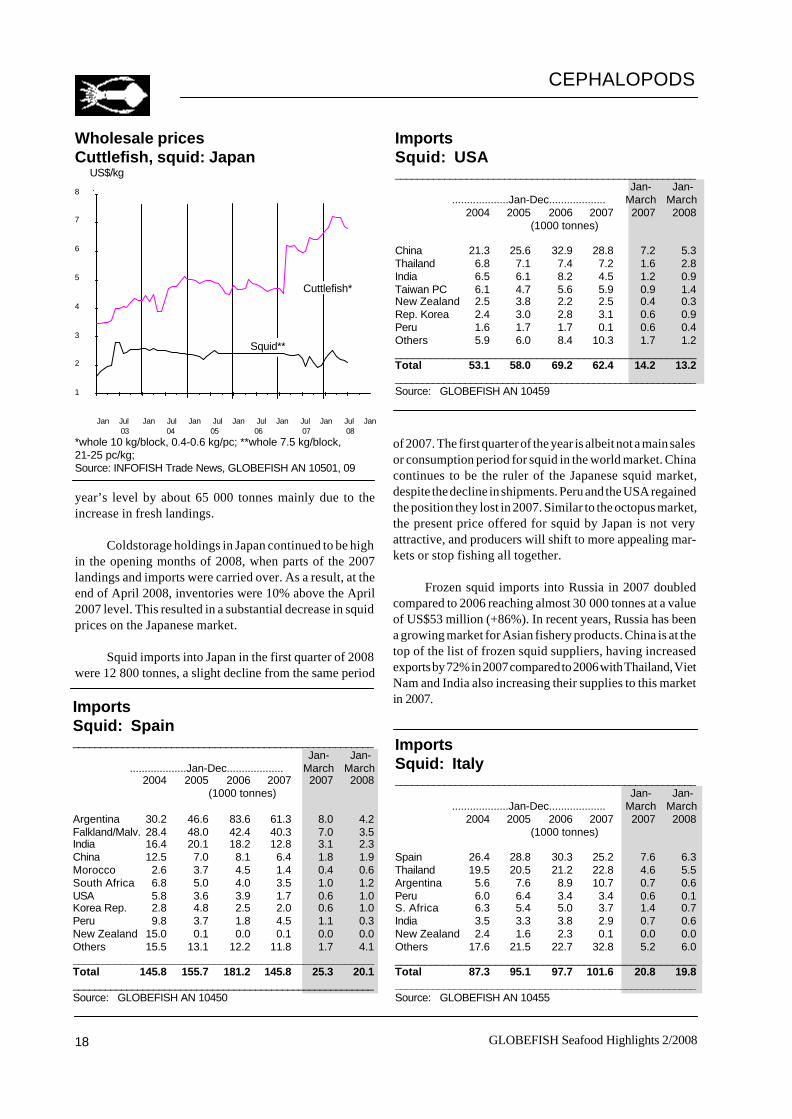
Coldstorage holdings in Japan continued to be highin the opening months of 2008, when parts of the 2007landings and imports were carried over. As a result, at theend of April 2008, inventories were 10% above the April2007 level. This resulted in a substantial decrease in squidprices on the Japanese market.
Squid imports into Japan in the first quarter of 2008were 12 800 tonnes, a slight decline from the same period
of 2007. The first quarter of the year is albeit not a main salesor consumption period for squid in the world market. Chinacontinues to be the ruler of the Japanese squid market,despite the decline in shipments. Peru and the USA regainedthe position they lost in 2007. Similar to the octopus market,the present price offered for squid by Japan is not veryattractive, and producers will shift to more appealing mar-kets or stop fishing all together.
Frozen squid imports into Russia in 2007 doubledcompared to 2006 reaching almost 30 000 tonnes at a valueof US$53 million (+86%). In recent years, Russia has beena growing market for Asian fishery products. China is at thetop of the list of frozen squid suppliers, having increasedexports by 72% in 2007 compared to 2006 with Thailand, VietNam and India also increasing their supplies to this marketin 2007.

19GLOBEFISH Seafood Highlights 2/2008 19
ImportsCuttlefish: Italy___________________________________________________
Jan- Jan- ...................Jan-Dec................... March March
2004 2005 2006 2007 2007 2008(1000 tonnes)
France 8.5 7.0 5.9 6.7 1.1 1.7Spain 5.0 5.2 4.8 3.7 0.8 1.0Tunisia 1.9 2.7 3.1 5.1 1.3 1.2India 4.3 5.8 2.9 0.9 0.3 0.2Senegal 3.7 3.0 2.2 2.4 0.5 0.5Viet Nam 4.3 5.0 1.7 0.8 0.3 0.2Thailand 5.9 4.9 1.6 0.3 0.0 0.1Morocco 0.4 0.7 1.1 0.8 0.1 0.1China 1.0 0.8 0.5 0.1 0.0 0.1Others 14.3 15.5 9.1 5.9 1.4 1.1___________________________________________________Total 49.3 50.6 32.9 26.7 5.8 6.2___________________________________________________Source: GLOBEFISH AN 10439
CEPHALOPODS
ImportsCuttlefish: Japan___________________________________________________
Jan- Jan- ...................Jan-Dec................... March March
2004 2005 2006 2007 2007 2008(1000 tonnes)
Thailand 16.5 14.8 12.5 11.5 2.7 1.8Viet Nam 3.9 5.0 4.7 5.1 1.3 0.9Morocco 2.8 4.3 3.5 3.9 0.6 0.3Malaysia 2.2 1.9 2.2 1.6 0.4 0.3China 1.7 1.9 1.5 0.4 0.1 0.0Ghana 0.6 0.5 0.2 0.5 0.0 0.0Korea Rep. 0.6 0.3 0.4 0.3 0.2 0.1Mauritania 0.6 0.2 0.0 0.1 0.0 0.0Others 3.4 3.1 3.1 2.6 0.7 0.6___________________________________________________Total 32.3 32.0 28.1 26.0 6.0 4.0______________________________________________________ Source: GLOBEFISH AN 10439
ImportsCuttlefish: Spain___________________________________________________
Jan- Jan- ...................Jan-Dec................... March March
2004 2005 2006 2007 2007 2008(1000 tonnes)
India 17.9 17.1 19.8 18.1 3.3 2.7Morocco 5.9 6.3 11.3 10.1 2.3 2.4China 6.3 7.3 8.0 5.1 0.7 0.8France 8.3 5.4 5.1 6.7 1.4 1.1Mauritania 3.8 3.2 3.2 3.6 1.2 0.8Ghana 2.2 2.2 2.3 2.0 0.6 0.4Others 13.3 11.7 14.2 12.2 3.1 2.2___________________________________________________Total 57.7 53.2 63.9 57.8 12.6 10.4______________________________________________________ Source: GLOBEFISH AN 10457
Squid imports into the Spanish market went down inthe opening months of 2008. However, this is not a veryindicative period of the whole years’ performance. Importsfrom the South West Atlantic were 7 700 tonnes, down fromthe 15 000 tonnes imported in the same period of 2007. Thiswas merely an indication of a late start of the season, ratherthan a real problem with squid supplies to the Spanishmarket. Italian squid imports remained stable, with moreproducts arriving from Thailand. South African exports tothis market declined sharply, due to limited production.
Key European squid markets such as Spain remainedweak in recent weeks, influenced by strong supplies of Illexsquid of Argentine origin. Price reductions of between 10and 17% in just one month are reported for South Africanseafrozen whole Loligo squid and of 11% for Peruvian giantsquid tubes in just one month. Prices were more stable in theItalian market, as Loligo, the preferred species in Italy, is notinfluenced by the glut of Illex squid. .
Cuttlefish keeps its niche market position
Cuttlefish is a niche market, despite the decline inproduction and trade experienced during the past years.The main consuming country is Japan, but imports anddomestic landings are weakening every year. In the firstquarter of 2008, this trend continued, with a 33% drop inimports.
Spain and Italy together reported a decline in imports,especially when considering arrivals from outside the EU.India is the main supplier to the EU cuttlefish market, butexports in the first quarter of the year declined by 11%.Cuttlefish prices generally are going up in the world market,as consumers prefer the tender cuttlefish to the other
cephalopods, and are willing to pay premium prices for thisspecies.
Octopus prices likely to come down
Now that the fishing ban in Moroccan waters is overand an increased quota is allocated to the local fleet, somedeclines in octopus prices are likely. Japanese traders willdefinitively try to lower offer prices. In the European market,octopus prices have increased by almost 40% recently, butthey are likely to head downward soon.
The squid market is likely to stay oversupplied in thecoming months, with further price discounts expected. Thelow price levels are, however, reported to be discouragingfishing in Argentina which should influence negativelyfuture supplies to European markets.

GLOBEFISH Seafood Highlights 2/200820
1400
1200
1000
800
600
400
200
0
Jan Jul Jan Jul Jan Jul Jan Jul Jan Jul Jan Jul Jan 03 04 05 06 07 08
*all origins, 64 - 65% cif Hamburg; **44% cif RotterdamSource: Oil World, GLOBEFISH AN 11702, 11706
FISHMEAL
Fishmeal and soymealPrices
ProductionFishmeal: 5 major producers______________________________________________________
Jan- Jan- ...................Jan-Dec................... March March
2004 2005 2006 2007 2007 2008(1000 tonnes)
Peru 1983 2126 1456 1420 106 97Chile 935 815 776 700 224 197Denmark 259 222 213 162 67 46Norway 212 154 176 155 81 63Iceland 204 179 162 135 30 11____________________________________________________
Total 3593 3496 2783 2717 583 502____________________________________________________Source: GLOBEFISH * excluding solubles** estimates
US$/tonne
ImportsFishmeal: UK______________________________________________________
Jan- Jan- ...................Jan-Dec................... March March
2004 2005 2006 2007 2007 2008(1000 tonnes)
Peru 19.4 23.2 37.6 19.3 5.0 3.1Germany 8.2 15.7 30.8 13.5 0.0 3.8Denmark 24.7 16.1 25.3 12.9 3.1 1.1Ireland 15.1 11.6 6.0 11.4 1.7 3.7Norway 9.5 3.7 7.9 9.8 4.1 1.7Chile 6.5 12.6 10.9 5.0 3.7 0.0Iceland 42.5 33.3 13.6 3.8 0.2 2.3Faroe Is. 11.5 10.9 2.3 3.4 0.0 3.2Others 5.1 9.8 5.0 8.3 1.2 1.0______________________________________________________Total 142.5 136.9 139.4 87.4 19.0 19.9______________________________________________________Source: GLOBEFISH AN 11632, (*) included under others
Soymeal**
Fishmeal*
Less fishmeal production in 2008
Fishmeal production was low in May 2008, after a good production month in April. Overall somedeclines in production are forecast for the whole of 2008. Scandinavian countries all reportedlower fishmeal outputs, and Chile recorded disappointing production. Peru is the only countrywhere some increase in production is possible, but the optimistic start of 2008 seems not to fullymaterialize at the end.
New quota system in Peru
The Peruvian Government issued on 28 June 2008 thelaw establishing the Individual Quota System for the fish-ing of anchovy. The system would be applied for the North-Central area as a start, but allows the Ministry to implementin the future the system also in the South with no need fora new law. The Government is expected to enactregulationsunder the law by the end of the year.
Total Peruvian fishmeal production in the first fivemonths of the year reached 585 000 tonnes, 10 000 tonnesmore than in the same period of 2008. Exports exceededproduction in 2008, as Peru started to sell inventoriesaccumulated during 2007, a period when the Chinese mar-ket was reluctant to purchase. Some 700 000 tonnes offishmeal were exported by Peru during the January – May2008 period, 28% more than in the same period of 2007. Invalue terms, exports expanded much less, by only 7% to
reach US$ 600 million. These figures show that prices offishmeal in the first part of 2008 were still substantially belowthose of the same period of 2007, and that these relativelylower prices have prompted Chinese buying interest.
China is the main importer of fishmeal from Peru,taking over half of total exports (55%). In the first fivemonths of 2008, China imported 390 000 tonnes of Peruvianfishmeal. Germany was a distant second with 76 000 tonnes,followed by Japan with 57 000 tonnes.
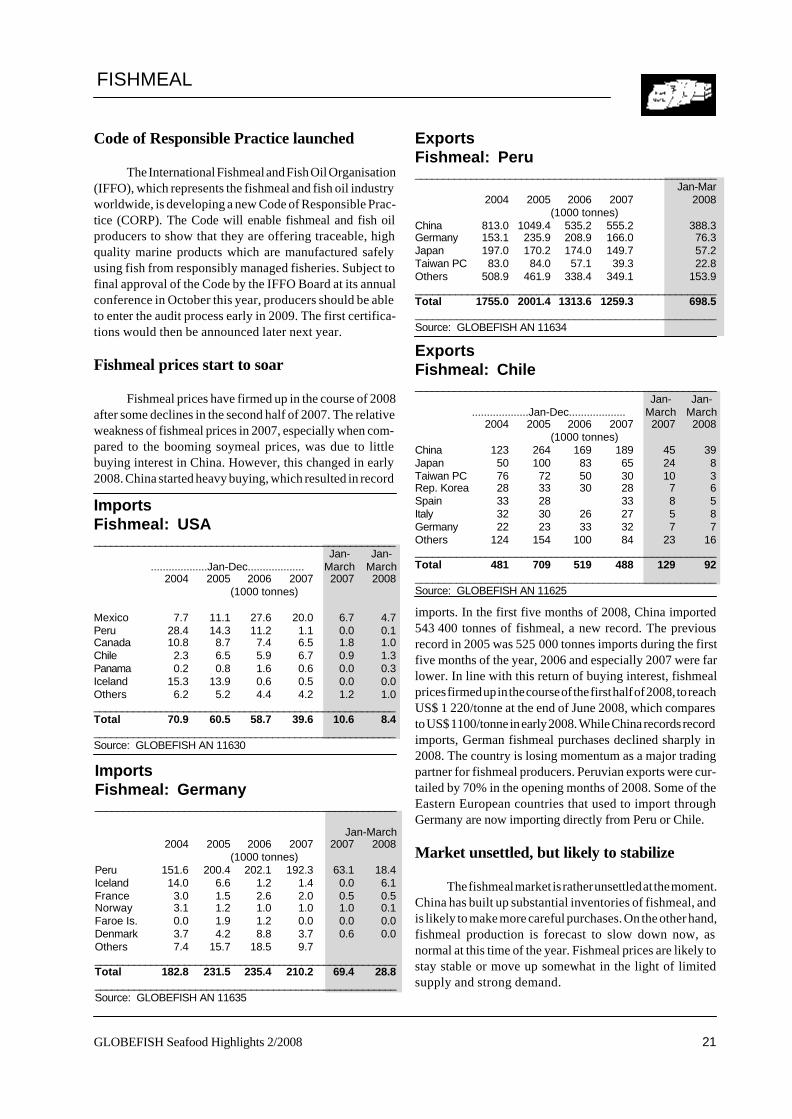
21GLOBEFISH Seafood Highlights 2/2008 21
ImportsFishmeal: Germany______________________________________________________
Jan-March2004 2005 2006 2007 2007 2008
(1000 tonnes)Peru 151.6 200.4 202.1 192.3 63.1 18.4Iceland 14.0 6.6 1.2 1.4 0.0 6.1France 3.0 1.5 2.6 2.0 0.5 0.5Norway 3.1 1.2 1.0 1.0 1.0 0.1Faroe Is. 0.0 1.9 1.2 0.0 0.0 0.0Denmark 3.7 4.2 8.8 3.7 0.6 0.0Others 7.4 15.7 18.5 9.7______________________________________________________Total 182.8 231.5 235.4 210.2 69.4 28.8______________________________________________________Source: GLOBEFISH AN 11635
ImportsFishmeal: USA______________________________________________________
Jan- Jan- ...................Jan-Dec................... March March
2004 2005 2006 2007 2007 2008(1000 tonnes)
Mexico 7.7 11.1 27.6 20.0 6.7 4.7Peru 28.4 14.3 11.2 1.1 0.0 0.1Canada 10.8 8.7 7.4 6.5 1.8 1.0Chile 2.3 6.5 5.9 6.7 0.9 1.3Panama 0.2 0.8 1.6 0.6 0.0 0.3Iceland 15.3 13.9 0.6 0.5 0.0 0.0Others 6.2 5.2 4.4 4.2 1.2 1.0______________________________________________________Total 70.9 60.5 58.7 39.6 10.6 8.4______________________________________________________Source: GLOBEFISH AN 11630
ExportsFishmeal: Peru______________________________________________________
Jan-Mar2004 2005 2006 2007 2008
(1000 tonnes)China 813.0 1049.4 535.2 555.2 388.3Germany 153.1 235.9 208.9 166.0 76.3Japan 197.0 170.2 174.0 149.7 57.2Taiwan PC 83.0 84.0 57.1 39.3 22.8Others 508.9 461.9 338.4 349.1 153.9____________________________________________________Total 1755.0 2001.4 1313.6 1259.3 698.5___________________________________________________Source: GLOBEFISH AN 11634
ExportsFishmeal: Chile______________________________________________________
Jan- Jan- ...................Jan-Dec................... March March
2004 2005 2006 2007 2007 2008(1000 tonnes)
China 123 264 169 189 45 39Japan 50 100 83 65 24 8Taiwan PC 76 72 50 30 10 3Rep. Korea 28 33 30 28 7 6Spain 33 28 33 8 5Italy 32 30 26 27 5 8Germany 22 23 33 32 7 7Others 124 154 100 84 23 16___________________________________________________Total 481 709 519 488 129 92___________________________________________________Source: GLOBEFISH AN 11625
FISHMEAL
Code of Responsible Practice launched
The International Fishmeal and Fish Oil Organisation(IFFO), which represents the fishmeal and fish oil industryworldwide, is developing a new Code of Responsible Prac-tice (CORP). The Code will enable fishmeal and fish oilproducers to show that they are offering traceable, highquality marine products which are manufactured safelyusing fish from responsibly managed fisheries. Subject tofinal approval of the Code by the IFFO Board at its annualconference in October this year, producers should be ableto enter the audit process early in 2009. The first certifica-tions would then be announced later next year.
Fishmeal prices start to soar
Fishmeal prices have firmed up in the course of 2008after some declines in the second half of 2007. The relativeweakness of fishmeal prices in 2007, especially when com-pared to the booming soymeal prices, was due to littlebuying interest in China. However, this changed in early2008. China started heavy buying, which resulted in record
imports. In the first five months of 2008, China imported543 400 tonnes of fishmeal, a new record. The previousrecord in 2005 was 525 000 tonnes imports during the firstfive months of the year, 2006 and especially 2007 were farlower. In line with this return of buying interest, fishmealprices firmed up in the course of the first half of 2008, to reachUS$ 1 220/tonne at the end of June 2008, which comparesto US$ 1100/tonne in early 2008. While China records recordimports, German fishmeal purchases declined sharply in2008. The country is losing momentum as a major tradingpartner for fishmeal producers. Peruvian exports were cur-tailed by 70% in the opening months of 2008. Some of theEastern European countries that used to import throughGermany are now importing directly from Peru or Chile.
Market unsettled, but likely to stabilize
The fishmeal market is rather unsettled at the moment.China has built up substantial inventories of fishmeal, andis likely to make more careful purchases. On the other hand,fishmeal production is forecast to slow down now, asnormal at this time of the year. Fishmeal prices are likely tostay stable or move up somewhat in the light of limitedsupply and strong demand.
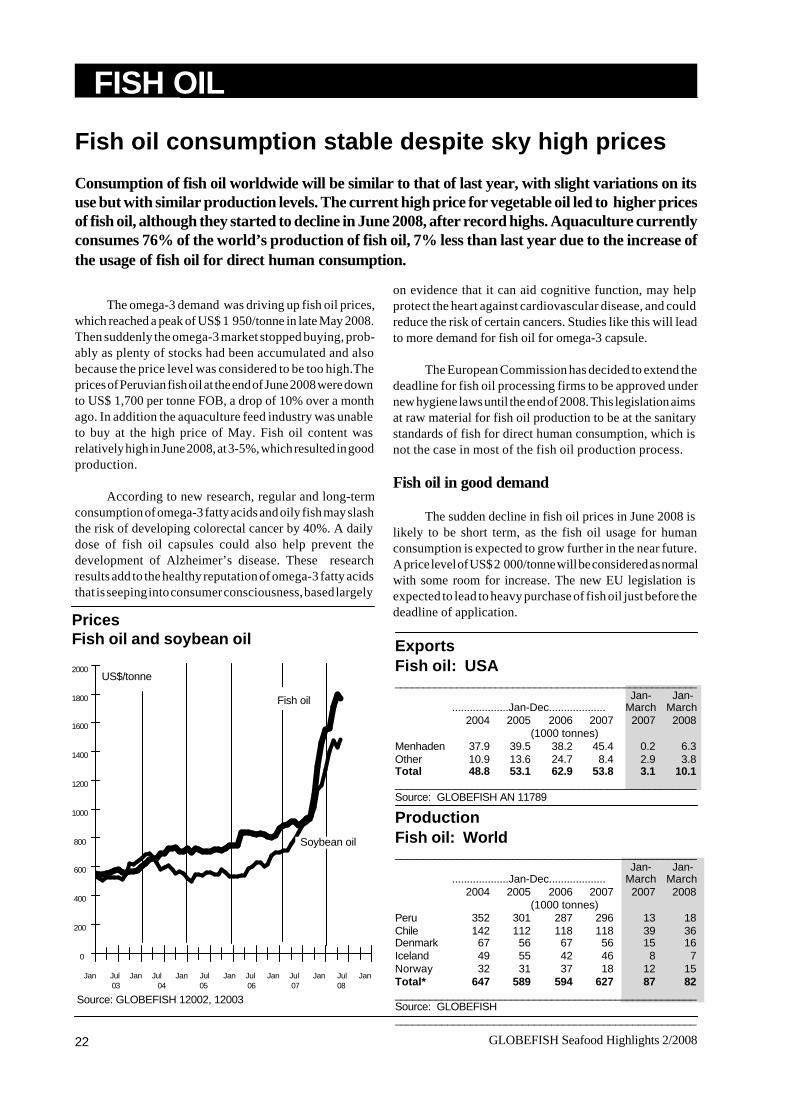
GLOBEFISH Seafood Highlights 2/200822
PricesFish oil and soybean oil
2000
1800
1600
1400
1200
1000
800
600
400
200
0
Jan Jul Jan Jul Jan Jul Jan Jul Jan Jul Jan Jul Jan 03 04 05 06 07 08
US$/tonne
Source: GLOBEFISH 12002, 12003
Soybean oil
Fish oil
ProductionFish oil: World______________________________________________________
Jan- Jan- ...................Jan-Dec................... March March
2004 2005 2006 2007 2007 2008(1000 tonnes)
Peru 352 301 287 296 13 18Chile 142 112 118 118 39 36Denmark 67 56 67 56 15 16Iceland 49 55 42 46 8 7Norway 32 31 37 18 12 15Total* 647 589 594 627 87 82____________________________________________________Source: GLOBEFISH____________________________________________________
ExportsFish oil: USA______________________________________________________
Jan- Jan- ...................Jan-Dec................... March March
2004 2005 2006 2007 2007 2008(1000 tonnes)
Menhaden 37.9 39.5 38.2 45.4 0.2 6.3Other 10.9 13.6 24.7 8.4 2.9 3.8Total 48.8 53.1 62.9 53.8 3.1 10.1___________________________________________________Source: GLOBEFISH AN 11789
FISH OIL
Fish oil consumption stable despite sky high prices
Consumption of fish oil worldwide will be similar to that of last year, with slight variations on itsuse but with similar production levels. The current high price for vegetable oil led to higher pricesof fish oil, although they started to decline in June 2008, after record highs. Aquaculture currentlyconsumes 76% of the world’s production of fish oil, 7% less than last year due to the increase ofthe usage of fish oil for direct human consumption.
The omega-3 demand was driving up fish oil prices,which reached a peak of US$ 1 950/tonne in late May 2008.Then suddenly the omega-3 market stopped buying, prob-ably as plenty of stocks had been accumulated and alsobecause the price level was considered to be too high.Theprices of Peruvian fish oil at the end of June 2008 were downto US$ 1,700 per tonne FOB, a drop of 10% over a monthago. In addition the aquaculture feed industry was unableto buy at the high price of May. Fish oil content wasrelatively high in June 2008, at 3-5%, which resulted in goodproduction.
According to new research, regular and long-termconsumption of omega-3 fatty acids and oily fish may slashthe risk of developing colorectal cancer by 40%. A dailydose of fish oil capsules could also help prevent thedevelopment of Alzheimer’s disease. These researchresults add to the healthy reputation of omega-3 fatty acidsthat is seeping into consumer consciousness, based largely
on evidence that it can aid cognitive function, may helpprotect the heart against cardiovascular disease, and couldreduce the risk of certain cancers. Studies like this will leadto more demand for fish oil for omega-3 capsule.
The European Commission has decided to extend thedeadline for fish oil processing firms to be approved undernew hygiene laws until the end of 2008. This legislation aimsat raw material for fish oil production to be at the sanitarystandards of fish for direct human consumption, which isnot the case in most of the fish oil production process.
Fish oil in good demand
The sudden decline in fish oil prices in June 2008 islikely to be short term, as the fish oil usage for humanconsumption is expected to grow further in the near future.A price level of US$ 2 000/tonne will be considered as normalwith some room for increase. The new EU legislation isexpected to lead to heavy purchase of fish oil just before thedeadline of application.
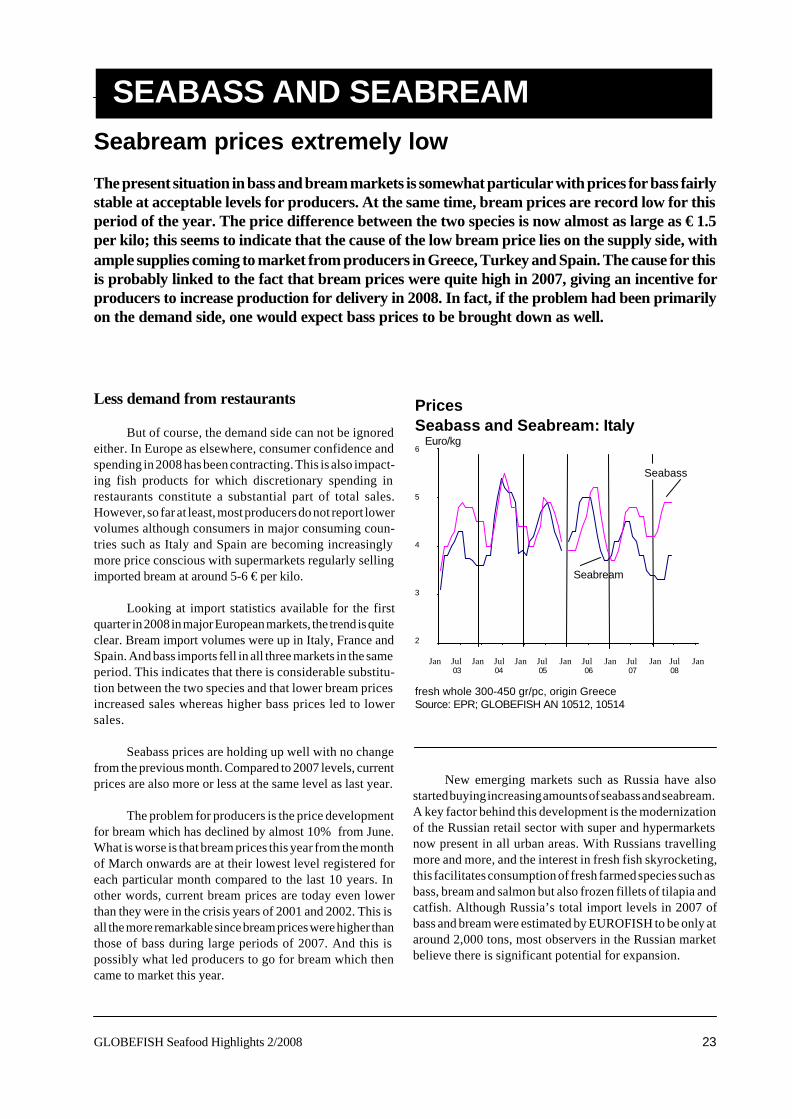
23GLOBEFISH Seafood Highlights 2/2008 23
PricesSeabass and Seabream: Italy6
5
4
3
2
Jan Jul Jan Jul Jan Jul Jan Jul Jan Jul Jan Jul Jan 03 04 05 06 07 08
fresh whole 300-450 gr/pc, origin GreeceSource: EPR; GLOBEFISH AN 10512, 10514
SEABASS AND SEABREAM
Seabream
Seabream prices extremely low
The present situation in bass and bream markets is somewhat particular with prices for bass fairlystable at acceptable levels for producers. At the same time, bream prices are record low for thisperiod of the year. The price difference between the two species is now almost as large as € 1.5per kilo; this seems to indicate that the cause of the low bream price lies on the supply side, withample supplies coming to market from producers in Greece, Turkey and Spain. The cause for thisis probably linked to the fact that bream prices were quite high in 2007, giving an incentive forproducers to increase production for delivery in 2008. In fact, if the problem had been primarilyon the demand side, one would expect bass prices to be brought down as well.
Less demand from restaurants
But of course, the demand side can not be ignoredeither. In Europe as elsewhere, consumer confidence andspending in 2008 has been contracting. This is also impact-ing fish products for which discretionary spending inrestaurants constitute a substantial part of total sales.However, so far at least, most producers do not report lowervolumes although consumers in major consuming coun-tries such as Italy and Spain are becoming increasinglymore price conscious with supermarkets regularly sellingimported bream at around 5-6 € per kilo.
Looking at import statistics available for the firstquarter in 2008 in major European markets, the trend is quiteclear. Bream import volumes were up in Italy, France andSpain. And bass imports fell in all three markets in the sameperiod. This indicates that there is considerable substitu-tion between the two species and that lower bream pricesincreased sales whereas higher bass prices led to lowersales.
Seabass prices are holding up well with no changefrom the previous month. Compared to 2007 levels, currentprices are also more or less at the same level as last year.
The problem for producers is the price developmentfor bream which has declined by almost 10% from June.What is worse is that bream prices this year from the monthof March onwards are at their lowest level registered foreach particular month compared to the last 10 years. Inother words, current bream prices are today even lowerthan they were in the crisis years of 2001 and 2002. This isall the more remarkable since bream prices were higher thanthose of bass during large periods of 2007. And this ispossibly what led producers to go for bream which thencame to market this year.
New emerging markets such as Russia have alsostarted buying increasing amounts of seabass and seabream.A key factor behind this development is the modernizationof the Russian retail sector with super and hypermarketsnow present in all urban areas. With Russians travellingmore and more, and the interest in fresh fish skyrocketing,this facilitates consumption of fresh farmed species such asbass, bream and salmon but also frozen fillets of tilapia andcatfish. Although Russia’s total import levels in 2007 ofbass and bream were estimated by EUROFISH to be only ataround 2,000 tons, most observers in the Russian marketbelieve there is significant potential for expansion.
Seabass
Euro/kg
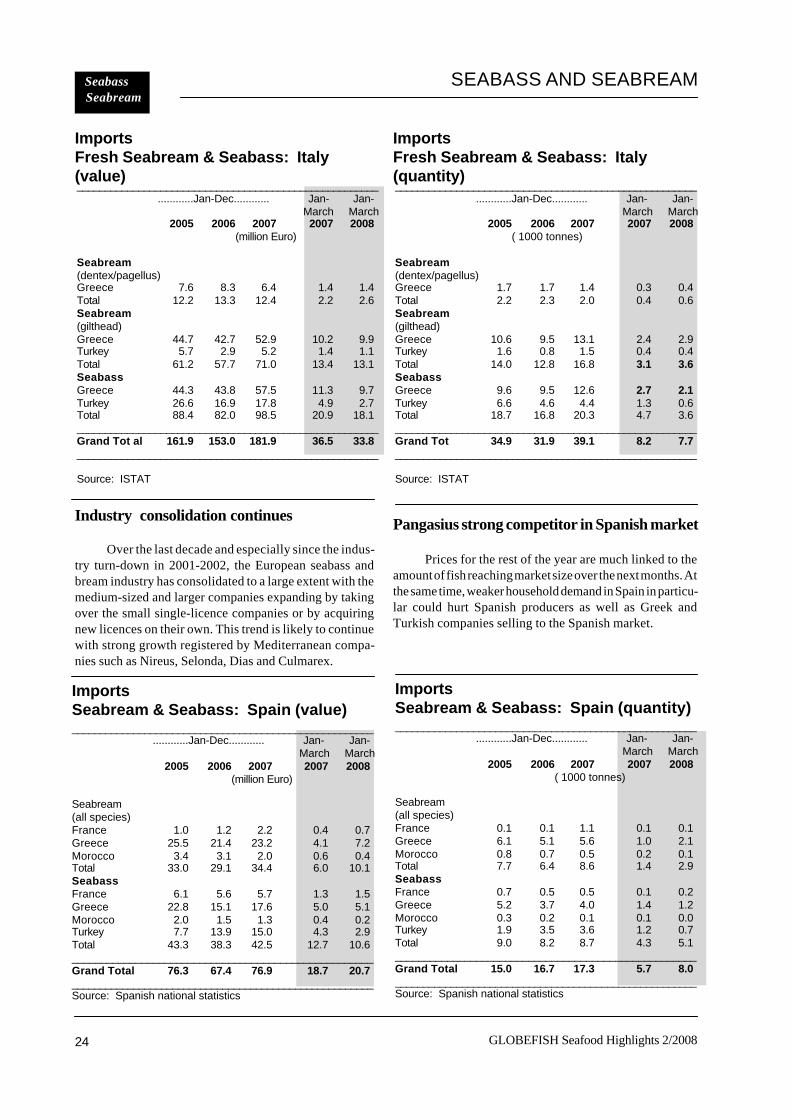
GLOBEFISH Seafood Highlights 2/200824
______________________________________________________ ............Jan-Dec............ Jan- Jan-
March March2005 2006 2007 2007 2008
( 1000 tonnes)
Seabream(dentex/pagellus)Greece 1.7 1.7 1.4 0.3 0.4Total 2.2 2.3 2.0 0.4 0.6Seabream(gilthead)Greece 10.6 9.5 13.1 2.4 2.9Turkey 1.6 0.8 1.5 0.4 0.4Total 14.0 12.8 16.8 3.1 3.6SeabassGreece 9.6 9.5 12.6 2.7 2.1Turkey 6.6 4.6 4.4 1.3 0.6Total 18.7 16.8 20.3 4.7 3.6______________________________________________________Grand Tot 34.9 31.9 39.1 8.2 7.7______________________________________________________
Source: ISTAT
SEABASS AND SEABREAM SpecialSeabream Seabass
ImportsFresh Seabream & Seabass: Italy(quantity)
______________________________________________________ ............Jan-Dec............ Jan- Jan-
March March2005 2006 2007 2007 2008
( 1000 tonnes)
Seabream(all species)France 0.1 0.1 1.1 0.1 0.1Greece 6.1 5.1 5.6 1.0 2.1Morocco 0.8 0.7 0.5 0.2 0.1Total 7.7 6.4 8.6 1.4 2.9SeabassFrance 0.7 0.5 0.5 0.1 0.2Greece 5.2 3.7 4.0 1.4 1.2Morocco 0.3 0.2 0.1 0.1 0.0Turkey 1.9 3.5 3.6 1.2 0.7Total 9.0 8.2 8.7 4.3 5.1____________________________________________________Grand Total 15.0 16.7 17.3 5.7 8.0______________________________________________________Source: Spanish national statistics
ImportsSeabream & Seabass: Spain (quantity)
______________________________________________________ ............Jan-Dec............ Jan- Jan-
March March2005 2006 2007 2007 2008
(million Euro)
Seabream(all species)France 1.0 1.2 2.2 0.4 0.7Greece 25.5 21.4 23.2 4.1 7.2Morocco 3.4 3.1 2.0 0.6 0.4Total 33.0 29.1 34.4 6.0 10.1SeabassFrance 6.1 5.6 5.7 1.3 1.5Greece 22.8 15.1 17.6 5.0 5.1Morocco 2.0 1.5 1.3 0.4 0.2Turkey 7.7 13.9 15.0 4.3 2.9Total 43.3 38.3 42.5 12.7 10.6____________________________________________________Grand Total 76.3 67.4 76.9 18.7 20.7______________________________________________________Source: Spanish national statistics
ImportsSeabream & Seabass: Spain (value)
______________________________________________________ ............Jan-Dec............ Jan- Jan-
March March2005 2006 2007 2007 2008
(million Euro)
Seabream(dentex/pagellus)Greece 7.6 8.3 6.4 1.4 1.4Total 12.2 13.3 12.4 2.2 2.6Seabream(gilthead)Greece 44.7 42.7 52.9 10.2 9.9Turkey 5.7 2.9 5.2 1.4 1.1Total 61.2 57.7 71.0 13.4 13.1SeabassGreece 44.3 43.8 57.5 11.3 9.7Turkey 26.6 16.9 17.8 4.9 2.7Total 88.4 82.0 98.5 20.9 18.1______________________________________________________Grand Tot al 161.9 153.0 181.9 36.5 33.8______________________________________________________
Source: ISTAT
ImportsFresh Seabream & Seabass: Italy(value)
Industry consolidation continues
Over the last decade and especially since the indus-try turn-down in 2001-2002, the European seabass andbream industry has consolidated to a large extent with themedium-sized and larger companies expanding by takingover the small single-licence companies or by acquiringnew licences on their own. This trend is likely to continuewith strong growth registered by Mediterranean compa-nies such as Nireus, Selonda, Dias and Culmarex.
Pangasius strong competitor in Spanish market
Prices for the rest of the year are much linked to theamount of fish reaching market size over the next months. Atthe same time, weaker household demand in Spain in particu-lar could hurt Spanish producers as well as Greek andTurkish companies selling to the Spanish market.
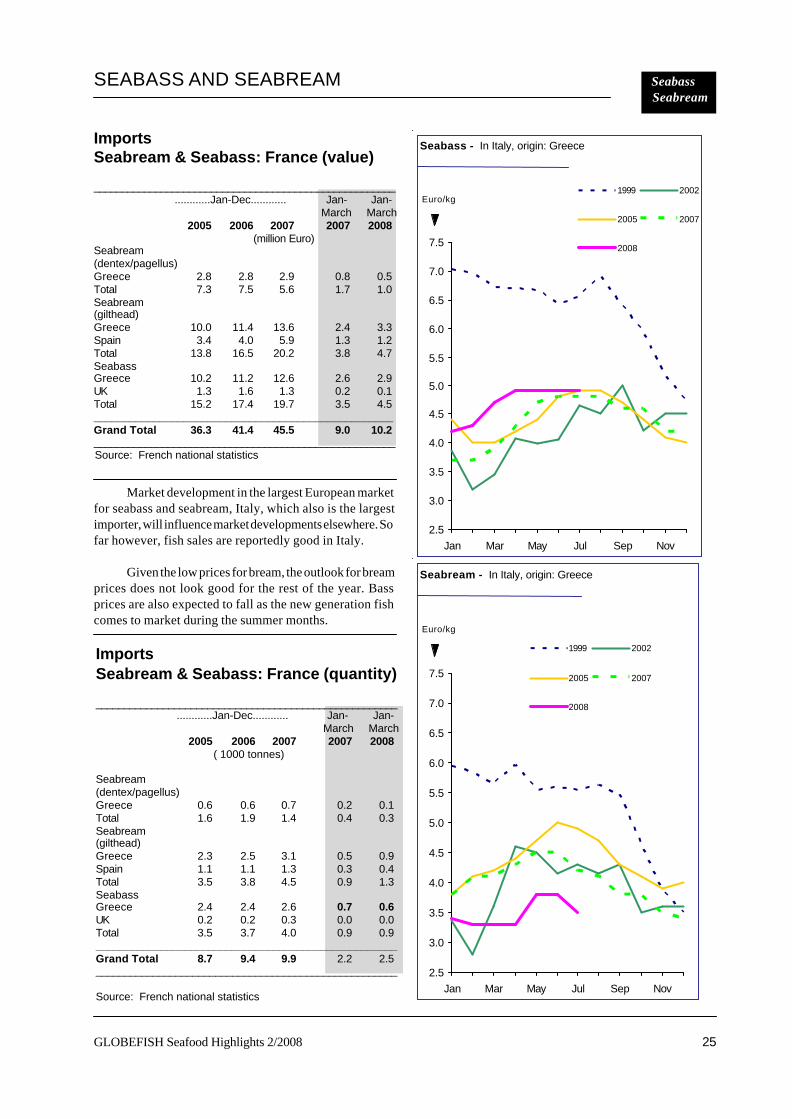
25GLOBEFISH Seafood Highlights 2/2008 25
______________________________________________________ ............Jan-Dec............ Jan- Jan-
March March2005 2006 2007 2007 2008
( 1000 tonnes)
Seabream(dentex/pagellus)Greece 0.6 0.6 0.7 0.2 0.1Total 1.6 1.9 1.4 0.4 0.3Seabream(gilthead)Greece 2.3 2.5 3.1 0.5 0.9Spain 1.1 1.1 1.3 0.3 0.4Total 3.5 3.8 4.5 0.9 1.3SeabassGreece 2.4 2.4 2.6 0.7 0.6UK 0.2 0.2 0.3 0.0 0.0Total 3.5 3.7 4.0 0.9 0.9___________________________________________________Grand Total 8.7 9.4 9.9 2.2 2.5_____________________________________________________
Source: French national statistics
______________________________________________________ ............Jan-Dec............ Jan- Jan-
March March2005 2006 2007 2007 2008
(million Euro)Seabream(dentex/pagellus)Greece 2.8 2.8 2.9 0.8 0.5Total 7.3 7.5 5.6 1.7 1.0Seabream(gilthead)Greece 10.0 11.4 13.6 2.4 3.3Spain 3.4 4.0 5.9 1.3 1.2Total 13.8 16.5 20.2 3.8 4.7SeabassGreece 10.2 11.2 12.6 2.6 2.9UK 1.3 1.6 1.3 0.2 0.1Total 15.2 17.4 19.7 3.5 4.5__________________________________________________Grand Total 36.3 41.4 45.5 9.0 10.2_____________________________________________________Source: French national statistics
ImportsSeabream & Seabass: France (value)
SEABASS AND SEABREAM SpecialSeabream Seabass
ImportsSeabream & Seabass: France (quantity)
Seabass - In Italy, origin: Greece
2.5
3.0
3.5
4.0
4.5
5.0
5.5
6.0
6.5
7.0
7.5
Jan Mar May Jul Sep Nov
1999 2002
2005 2007
2008
Euro/kg
Seabream - In Italy, origin: Greece
2.5
3.0
3.5
4.0
4.5
5.0
5.5
6.0
6.5
7.0
7.5
Jan Mar May Jul Sep Nov
1999 2002
2005 2007
2008
Euro/kg
Market development in the largest European marketfor seabass and seabream, Italy, which also is the largestimporter, will influence market developments elsewhere. Sofar however, fish sales are reportedly good in Italy.
Given the low prices for bream, the outlook for breamprices does not look good for the rest of the year. Bassprices are also expected to fall as the new generation fishcomes to market during the summer months.
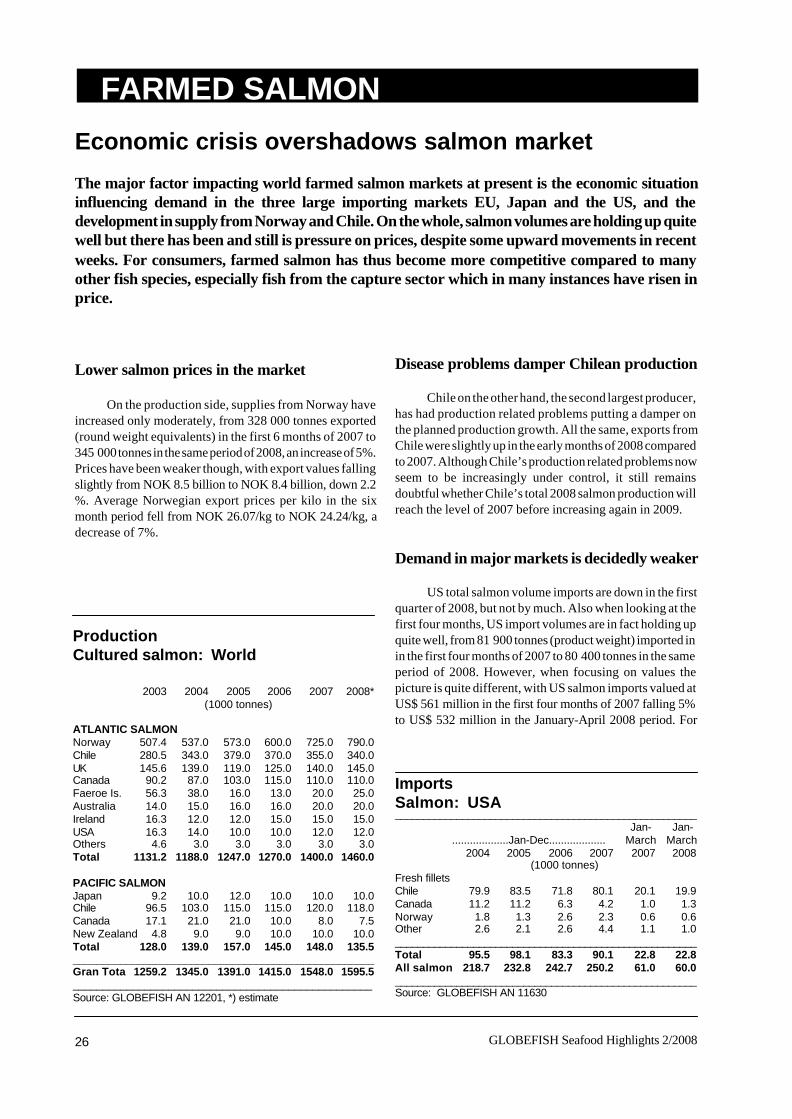
GLOBEFISH Seafood Highlights 2/200826
Feature Special
FARMED SALMON
ProductionCultured salmon: World
2003 2004 2005 2006 2007 2008*(1000 tonnes)
ATLANTIC SALMONNorway 507.4 537.0 573.0 600.0 725.0 790.0Chile 280.5 343.0 379.0 370.0 355.0 340.0UK 145.6 139.0 119.0 125.0 140.0 145.0Canada 90.2 87.0 103.0 115.0 110.0 110.0Faeroe Is. 56.3 38.0 16.0 13.0 20.0 25.0Australia 14.0 15.0 16.0 16.0 20.0 20.0Ireland 16.3 12.0 12.0 15.0 15.0 15.0USA 16.3 14.0 10.0 10.0 12.0 12.0Others 4.6 3.0 3.0 3.0 3.0 3.0Total 1131.2 1188.0 1247.0 1270.0 1400.0 1460.0
PACIFIC SALMONJapan 9.2 10.0 12.0 10.0 10.0 10.0Chile 96.5 103.0 115.0 115.0 120.0 118.0Canada 17.1 21.0 21.0 10.0 8.0 7.5New Zealand 4.8 9.0 9.0 10.0 10.0 10.0Total 128.0 139.0 157.0 145.0 148.0 135.5___________________________________________________Gran Tota 1259.2 1345.0 1391.0 1415.0 1548.0 1595.5__________________________________________________Source: GLOBEFISH AN 12201, *) estimate
Economic crisis overshadows salmon market
The major factor impacting world farmed salmon markets at present is the economic situationinfluencing demand in the three large importing markets EU, Japan and the US, and thedevelopment in supply from Norway and Chile. On the whole, salmon volumes are holding up quitewell but there has been and still is pressure on prices, despite some upward movements in recentweeks. For consumers, farmed salmon has thus become more competitive compared to manyother fish species, especially fish from the capture sector which in many instances have risen inprice.
Lower salmon prices in the market
On the production side, supplies from Norway haveincreased only moderately, from 328 000 tonnes exported(round weight equivalents) in the first 6 months of 2007 to345 000 tonnes in the same period of 2008, an increase of 5%.Prices have been weaker though, with export values fallingslightly from NOK 8.5 billion to NOK 8.4 billion, down 2.2%. Average Norwegian export prices per kilo in the sixmonth period fell from NOK 26.07/kg to NOK 24.24/kg, adecrease of 7%.
Disease problems damper Chilean production
Chile on the other hand, the second largest producer,has had production related problems putting a damper onthe planned production growth. All the same, exports fromChile were slightly up in the early months of 2008 comparedto 2007. Although Chile’s production related problems nowseem to be increasingly under control, it still remainsdoubtful whether Chile’s total 2008 salmon production willreach the level of 2007 before increasing again in 2009.
Demand in major markets is decidedly weaker
US total salmon volume imports are down in the firstquarter of 2008, but not by much. Also when looking at thefirst four months, US import volumes are in fact holding upquite well, from 81 900 tonnes (product weight) imported inin the first four months of 2007 to 80 400 tonnes in the sameperiod of 2008. However, when focusing on values thepicture is quite different, with US salmon imports valued atUS$ 561 million in the first four months of 2007 falling 5%to US$ 532 million in the January-April 2008 period. For
ImportsSalmon: USA______________________________________________________
Jan- Jan- ...................Jan-Dec................... March March
2004 2005 2006 2007 2007 2008(1000 tonnes)
Fresh filletsChile 79.9 83.5 71.8 80.1 20.1 19.9Canada 11.2 11.2 6.3 4.2 1.0 1.3Norway 1.8 1.3 2.6 2.3 0.6 0.6Other 2.6 2.1 2.6 4.4 1.1 1.0______________________________________________________Total 95.5 98.1 83.3 90.1 22.8 22.8All salmon 218.7 232.8 242.7 250.2 61.0 60.0______________________________________________________Source: GLOBEFISH AN 11630
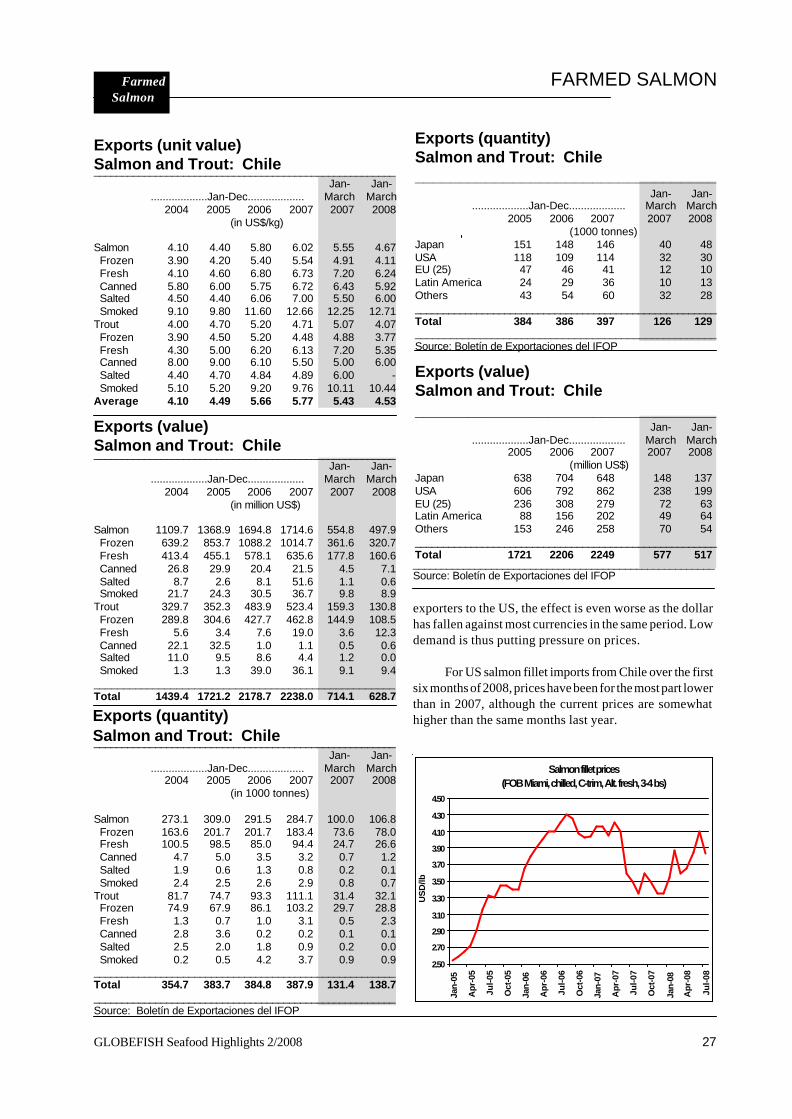
27GLOBEFISH Seafood Highlights 2/2008 27
______________________________________________________Jan- Jan-
...................Jan-Dec................... March March2004 2005 2006 2007 2007 2008
(in million US$)
Salmon 1109.7 1368.9 1694.8 1714.6 554.8 497.9 Frozen 639.2 853.7 1088.2 1014.7 361.6 320.7 Fresh 413.4 455.1 578.1 635.6 177.8 160.6 Canned 26.8 29.9 20.4 21.5 4.5 7.1 Salted 8.7 2.6 8.1 51.6 1.1 0.6 Smoked 21.7 24.3 30.5 36.7 9.8 8.9Trout 329.7 352.3 483.9 523.4 159.3 130.8 Frozen 289.8 304.6 427.7 462.8 144.9 108.5 Fresh 5.6 3.4 7.6 19.0 3.6 12.3 Canned 22.1 32.5 1.0 1.1 0.5 0.6 Salted 11.0 9.5 8.6 4.4 1.2 0.0 Smoked 1.3 1.3 39.0 36.1 9.1 9.4___________________________________________________Total 1439.4 1721.2 2178.7 2238.0 714.1 628.7
Exports (value)Salmon and Trout: Chile
______________________________________________________Jan- Jan-
...................Jan-Dec................... March March2004 2005 2006 2007 2007 2008
(in US$/kg)
Salmon 4.10 4.40 5.80 6.02 5.55 4.67 Frozen 3.90 4.20 5.40 5.54 4.91 4.11 Fresh 4.10 4.60 6.80 6.73 7.20 6.24 Canned 5.80 6.00 5.75 6.72 6.43 5.92 Salted 4.50 4.40 6.06 7.00 5.50 6.00 Smoked 9.10 9.80 11.60 12.66 12.25 12.71Trout 4.00 4.70 5.20 4.71 5.07 4.07 Frozen 3.90 4.50 5.20 4.48 4.88 3.77 Fresh 4.30 5.00 6.20 6.13 7.20 5.35 Canned 8.00 9.00 6.10 5.50 5.00 6.00 Salted 4.40 4.70 4.84 4.89 6.00 - Smoked 5.10 5.20 9.20 9.76 10.11 10.44Average 4.10 4.49 5.66 5.77 5.43 4.53
Exports (unit value)Salmon and Trout: Chile
______________________________________________________Jan- Jan-
...................Jan-Dec................... March March2004 2005 2006 2007 2007 2008
(in 1000 tonnes)
Salmon 273.1 309.0 291.5 284.7 100.0 106.8 Frozen 163.6 201.7 201.7 183.4 73.6 78.0 Fresh 100.5 98.5 85.0 94.4 24.7 26.6 Canned 4.7 5.0 3.5 3.2 0.7 1.2 Salted 1.9 0.6 1.3 0.8 0.2 0.1 Smoked 2.4 2.5 2.6 2.9 0.8 0.7Trout 81.7 74.7 93.3 111.1 31.4 32.1 Frozen 74.9 67.9 86.1 103.2 29.7 28.8 Fresh 1.3 0.7 1.0 3.1 0.5 2.3 Canned 2.8 3.6 0.2 0.2 0.1 0.1 Salted 2.5 2.0 1.8 0.9 0.2 0.0 Smoked 0.2 0.5 4.2 3.7 0.9 0.9______________________________________________________Total 354.7 383.7 384.8 387.9 131.4 138.7______________________________________________________Source: Boletín de Exportaciones del IFOP
Exports (quantity)Salmon and Trout: Chile
Exports (value)Salmon and Trout: Chile__________________________________
Jan- Jan- ...................Jan-Dec................... March March
2005 2006 2007 2007 2008 (million US$)
Japan 638 704 648 148 137USA 606 792 862 238 199EU (25) 236 308 279 72 63Latin America 88 156 202 49 64Others 153 246 258 70 54______________________________________________________Total 1721 2206 2249 577 517______________________________________________________Source: Boletín de Exportaciones del IFOP
Exports (quantity)Salmon and Trout: Chile__________________________________
Jan- Jan- ...................Jan-Dec................... March March
2005 2006 2007 2007 2008(1000 tonnes)
Japan 151 148 146 40 48USA 118 109 114 32 30EU (25) 47 46 41 12 10Latin America 24 29 36 10 13Others 43 54 60 32 28______________________________________________________Total 384 386 397 126 129___________________________________________________Source: Boletín de Exportaciones del IFOP
exporters to the US, the effect is even worse as the dollarhas fallen against most currencies in the same period. Lowdemand is thus putting pressure on prices.
For US salmon fillet imports from Chile over the firstsix months of 2008, prices have been for the most part lowerthan in 2007, although the current prices are somewhathigher than the same months last year.
Salmon fillet prices (FOB Miami, chilled, C-trim, Alt. fresh, 3-4 bs)
2.50
2.70
2.90
3.10
3.30
3.50
3.70
3.90
4.10
4.30
4.50
Jan-
05
Apr
-05
Jul-0
5
Oct
-05
Jan-
06
Apr
-06
Jul-0
6
Oct
-06
Jan-
07
Apr
-07
Jul-0
7
Oct
-07
Jan-
08
Apr
-08
Jul-0
8
US
D/lb
FARMED SALMON Special Salmon
Farmed
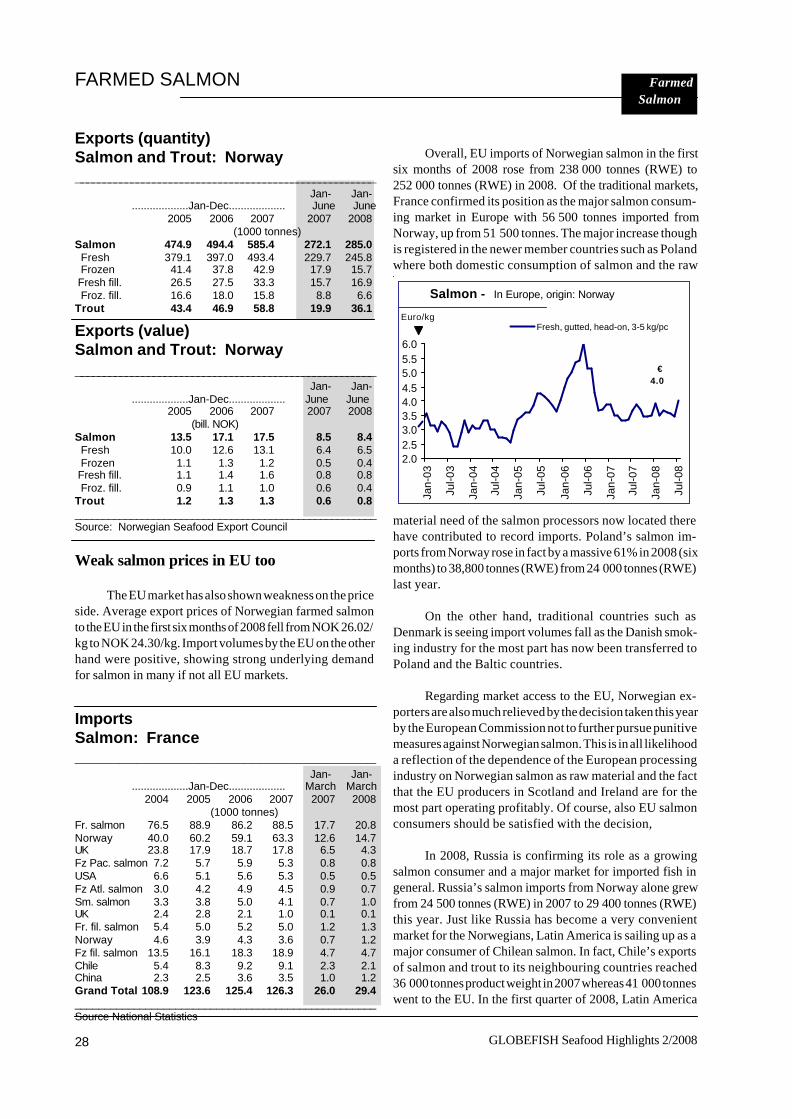
GLOBEFISH Seafood Highlights 2/200828
Exports (quantity)Salmon and Trout: Norway______________________________________________________
Jan- Jan- ...................Jan-Dec................... June June
2005 2006 2007 2007 2008(1000 tonnes)
Salmon 474.9 494.4 585.4 272.1 285.0 Fresh 379.1 397.0 493.4 229.7 245.8 Frozen 41.4 37.8 42.9 17.9 15.7 Fresh fill. 26.5 27.5 33.3 15.7 16.9 Froz. fill. 16.6 18.0 15.8 8.8 6.6Trout 43.4 46.9 58.8 19.9 36.1
FARMED SALMON Special Salmon Farmed
Overall, EU imports of Norwegian salmon in the firstsix months of 2008 rose from 238 000 tonnes (RWE) to252 000 tonnes (RWE) in 2008. Of the traditional markets,France confirmed its position as the major salmon consum-ing market in Europe with 56 500 tonnes imported fromNorway, up from 51 500 tonnes. The major increase thoughis registered in the newer member countries such as Polandwhere both domestic consumption of salmon and the raw
material need of the salmon processors now located therehave contributed to record imports. Poland’s salmon im-ports from Norway rose in fact by a massive 61% in 2008 (sixmonths) to 38,800 tonnes (RWE) from 24 000 tonnes (RWE)last year.
On the other hand, traditional countries such asDenmark is seeing import volumes fall as the Danish smok-ing industry for the most part has now been transferred toPoland and the Baltic countries.
Regarding market access to the EU, Norwegian ex-porters are also much relieved by the decision taken this yearby the European Commission not to further pursue punitivemeasures against Norwegian salmon. This is in all likelihooda reflection of the dependence of the European processingindustry on Norwegian salmon as raw material and the factthat the EU producers in Scotland and Ireland are for themost part operating profitably. Of course, also EU salmonconsumers should be satisfied with the decision,
In 2008, Russia is confirming its role as a growingsalmon consumer and a major market for imported fish ingeneral. Russia’s salmon imports from Norway alone grewfrom 24 500 tonnes (RWE) in 2007 to 29 400 tonnes (RWE)this year. Just like Russia has become a very convenientmarket for the Norwegians, Latin America is sailing up as amajor consumer of Chilean salmon. In fact, Chile’s exportsof salmon and trout to its neighbouring countries reached36 000 tonnes product weight in 2007 whereas 41 000 tonneswent to the EU. In the first quarter of 2008, Latin America
Salmon - In Europe, origin: Norway
2.02.53.03.54.04.55.05.56.0
Jan-
03
Jul-0
3
Jan-
04
Jul-0
4
Jan-
05
Jul-0
5
Jan-
06
Jul-0
6
Jan-
07
Jul-0
7
Jan-
08
Jul-0
8
Fresh, gutted, head-on, 3-5 kg/pcEuro/kg
€ 4.0
ImportsSalmon: France__________________________________
Jan- Jan- ...................Jan-Dec................... March March
2004 2005 2006 2007 2007 2008(1000 tonnes)
Fr. salmon 76.5 88.9 86.2 88.5 17.7 20.8Norway 40.0 60.2 59.1 63.3 12.6 14.7UK 23.8 17.9 18.7 17.8 6.5 4.3Fz Pac. salmon 7.2 5.7 5.9 5.3 0.8 0.8USA 6.6 5.1 5.6 5.3 0.5 0.5Fz Atl. salmon 3.0 4.2 4.9 4.5 0.9 0.7Sm. salmon 3.3 3.8 5.0 4.1 0.7 1.0UK 2.4 2.8 2.1 1.0 0.1 0.1Fr. fil. salmon 5.4 5.0 5.2 5.0 1.2 1.3Norway 4.6 3.9 4.3 3.6 0.7 1.2Fz fil. salmon 13.5 16.1 18.3 18.9 4.7 4.7Chile 5.4 8.3 9.2 9.1 2.3 2.1China 2.3 2.5 3.6 3.5 1.0 1.2Grand Total 108.9 123.6 125.4 126.3 26.0 29.4___________________________________________________Source National Statistics
Exports (value)Salmon and Trout: Norway______________________________________________________
Jan- Jan- ...................Jan-Dec................... June June
2005 2006 2007 2007 2008(bill. NOK)
Salmon 13.5 17.1 17.5 8.5 8.4 Fresh 10.0 12.6 13.1 6.4 6.5 Frozen 1.1 1.3 1.2 0.5 0.4 Fresh fill. 1.1 1.4 1.6 0.8 0.8 Froz. fill. 0.9 1.1 1.0 0.6 0.4Trout 1.2 1.3 1.3 0.6 0.8______________________________________________________Source: Norwegian Seafood Export Council
Weak salmon prices in EU too
The EU market has also shown weakness on the priceside. Average export prices of Norwegian farmed salmonto the EU in the first six months of 2008 fell from NOK 26.02/kg to NOK 24.30/kg. Import volumes by the EU on the otherhand were positive, showing strong underlying demandfor salmon in many if not all EU markets.

29GLOBEFISH Seafood Highlights 2/2008 29
ImportsSalmon: Germany (by product)__________________________________
Jan- Jan- ...................Jan-Dec................... March March
2004 2005 2006 2007 2007 2008(1000 tonnes)
Fresh 50.4 56.1 47.9 47.0 13.3 8.9Frozen 5.2 5.3 7.2 4.7 0.5 0.5Smoked 6.4 15.7 16.4 18.0 4.4 6.7Fresh fillets 6.2 6.8 6.5 6.2 1.5 1.6Frozen fillets 22.3 26.6 33.5 34.5 9.3 8.5Salted salmon 0 0 0 0 3.4 0.0___________________________________________________Total 90.5 110.5 111.5 110.3 29.3 26.4Source: Statistisches Bundesamt
ImportsSalmon: Germany (by origin)__________________________________
Jan- Jan- ...................Jan-Dec................... March March
2004 2005 2006 2007 2007 2008(1000 tonnes)
Norway 42.7 54.4 48.9 48.9 13.8 9.8Chile 7.4 14.6 15.7 14.5 4.9 3.0Poland 1.1 12.3 13.7 15.5 4.0 6.1China 3.6 4.8 8.6 10.9 2.7 3.0Denmark 20.7 9.6 8.5 8.5 1.2 2.1Others 15.1 14.8 16.2 12.0 2.7 2.4
surpassed the EU in both volume and value as a market forChilean salmon and trout.
The third among the three major markets, Japan, hasbeen difficult for years with declining consumption ofmany product categories in general, including fish. Norwe-gian salmon exports to Japan in the first six months of 2008fell back slightly from 15 000 tonnes last year to 12 700tonnes this year (round weight equivalents = RWE). Troutexports from Norway to Japan increased slightly in thesame period of 2008, from 3 900 tonnes to 4 800 tonnes(RWE). Chile’s exports of salmon and trout to Japan in thefirst quarter increased somewhat in volume from 2007,although values were down.
frozen categories are in decline. Of the first six months of2008, both fresh whole salmon and fresh salmon filletsincreased in volume, by 7 and 8 % respectively. Fresh troutexports also increased from Norway, up a massive 95% overthe same six month period in 2007 to reach 18 500 tonnes(product weight). Again it is the Russian market which hasbecome the driving factor with an almost 100% increase inits trout imports from Norway over the first six month periodof 2008.
UK, the third largest salmon producer continues tosell most of its output domestically with Continental Europeand the US as the other main markets. Production in 2008 isexpected to increase only slightly over 2007.
New markets will show the way
Total supply from Norway, Chile and the UK in 2008will rise somewhat over 2007. Given the long-term increasein world salmon demand with new emerging markets open-ing up in Russia, the Middle East, South East Asia and LatinAmerica, the increase in supply should in it self representno particular problem. The big unknown is however thedemand side with a weak economy in both Japan and the USand in many EU countries as well. This could place pricesand margins under pressure. However, there will always bea market for fish and if Atlantic salmon can remain a competi-tive alternative in relation to other fish species, demandshould not suffer too much.
ImportsSalmon: Japan
Jan- Jan- ...................Jan-Dec................... March March
2005 2006 2007 2007 2008(1000 tonnes)
FreshAtlantic 24.8 21.9 21.6 5.2 5.1 Norway 19.9 16.7 18.4 4.6 4.1 UK 1 0.8 1.4 0.1 0.1 Australia 1 0.6 1.2 0.3 0.3Pacific 1.4 1.1 0.9 0.2 0.2Total 26.2 23 22.5 5.4 5.3FrozenAtlantic 5.6 2.9 2.4 0.6 0.5 Norway 1.2 1 1 0.3 0.3Pacific 141 127.7 123.6 0.6 0.3 Canada 4.3 2.4 1 0.1 0.1 USA 32.3 19.2 20.2 0 0 New Zeal. 1 1.8 0.5 0.1 0.2 Chile 71 73.1 73.1 0.1 0 Russia 31.7 30.9 28.9 0.2 0Total 146.6 130.6 126 1.2 0.8Grand Total 172.8 153.6 148.5 6.6 6.1Source: Japanese national import statistics
Supply slightly up in 2008
Both Norway and Chile have been increasing pro-duction and exports in early 2008 but not by much. Espe-cially Chile has had problems related to disease which hasbeen costly for the industry in terms of loss of fish and loweryields. On the other hand, the effect on prices has definitelybeen positive as less fish has come to market than whatproducers had planned for. Based on recent informationChile, the problems related to ISA have been much con-tained with the number farms affected reduced by 50%.This could lead to much higher volumes coming out of Chilefor the rest of 2008 than hitherto expected, although itremains to be seen whether Chile’s salmon production andexports for the whole year will reach those of 2007.
Regarding Norway’s exports it is interesting to notethe tendency towards more fresh exports whereas most
FARMED SALMON Special Salmon
Farmed
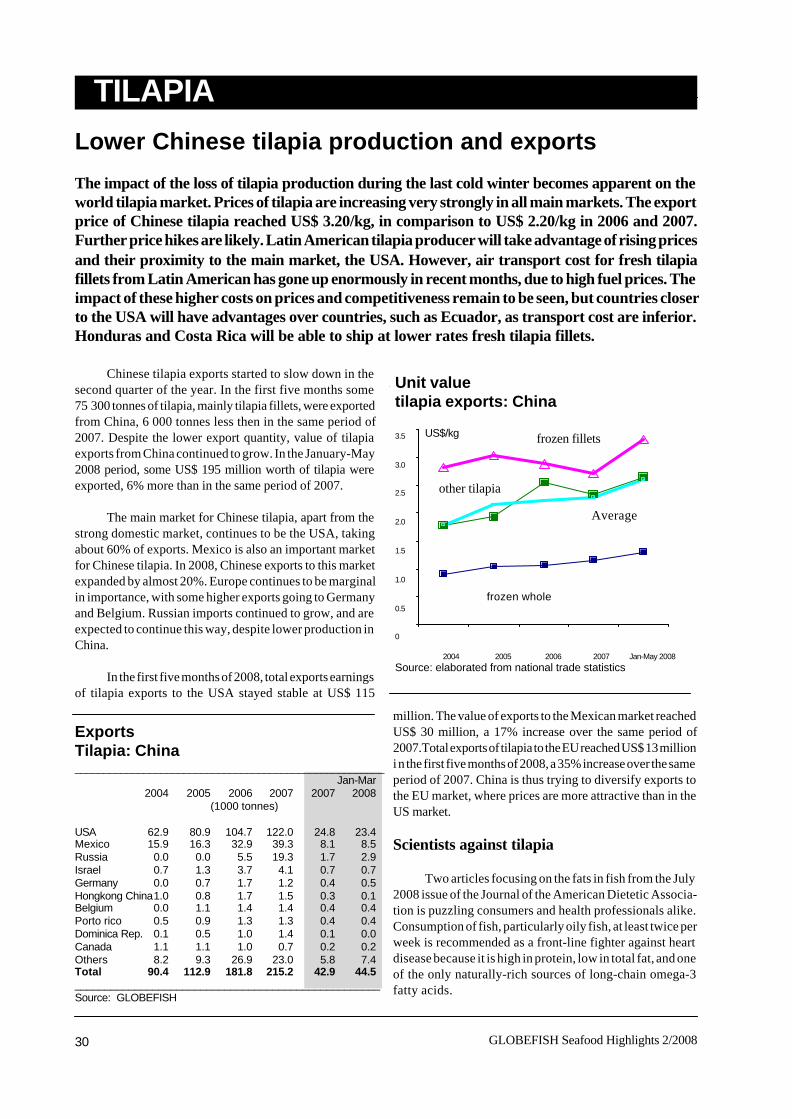
GLOBEFISH Seafood Highlights 2/200830
Feature
TILAPIA
ExportsTilapia: China______________________________________________________
Jan-Mar2004 2005 2006 2007 2007 2008
(1000 tonnes)
USA 62.9 80.9 104.7 122.0 24.8 23.4Mexico 15.9 16.3 32.9 39.3 8.1 8.5Russia 0.0 0.0 5.5 19.3 1.7 2.9Israel 0.7 1.3 3.7 4.1 0.7 0.7Germany 0.0 0.7 1.7 1.2 0.4 0.5Hongkong China1.0 0.8 1.7 1.5 0.3 0.1Belgium 0.0 1.1 1.4 1.4 0.4 0.4Porto rico 0.5 0.9 1.3 1.3 0.4 0.4Dominica Rep. 0.1 0.5 1.0 1.4 0.1 0.0Canada 1.1 1.1 1.0 0.7 0.2 0.2Others 8.2 9.3 26.9 23.0 5.8 7.4Total 90.4 112.9 181.8 215.2 42.9 44.5___________________________________________________Source: GLOBEFISH
Unit valuetilapia exports: China
3.5
3.0
2.5
2.0
1.5
1.0
0.5
0
2004 2005 2006 2007 Jan-May 2008Source: elaborated from national trade statistics
US$/kg
frozen whole
frozen fillets
other tilapia
Average
Lower Chinese tilapia production and exports
The impact of the loss of tilapia production during the last cold winter becomes apparent on theworld tilapia market. Prices of tilapia are increasing very strongly in all main markets. The exportprice of Chinese tilapia reached US$ 3.20/kg, in comparison to US$ 2.20/kg in 2006 and 2007.Further price hikes are likely. Latin American tilapia producer will take advantage of rising pricesand their proximity to the main market, the USA. However, air transport cost for fresh tilapiafillets from Latin American has gone up enormously in recent months, due to high fuel prices. Theimpact of these higher costs on prices and competitiveness remain to be seen, but countries closerto the USA will have advantages over countries, such as Ecuador, as transport cost are inferior.Honduras and Costa Rica will be able to ship at lower rates fresh tilapia fillets.
Chinese tilapia exports started to slow down in thesecond quarter of the year. In the first five months some75 300 tonnes of tilapia, mainly tilapia fillets, were exportedfrom China, 6 000 tonnes less then in the same period of2007. Despite the lower export quantity, value of tilapiaexports from China continued to grow. In the January-May2008 period, some US$ 195 million worth of tilapia wereexported, 6% more than in the same period of 2007.
The main market for Chinese tilapia, apart from thestrong domestic market, continues to be the USA, takingabout 60% of exports. Mexico is also an important marketfor Chinese tilapia. In 2008, Chinese exports to this marketexpanded by almost 20%. Europe continues to be marginalin importance, with some higher exports going to Germanyand Belgium. Russian imports continued to grow, and areexpected to continue this way, despite lower production inChina.
In the first five months of 2008, total exports earningsof tilapia exports to the USA stayed stable at US$ 115
million. The value of exports to the Mexican market reachedUS$ 30 million, a 17% increase over the same period of2007.Total exports of tilapia to the EU reached US$ 13 millioni n the first five months of 2008, a 35% increase over the sameperiod of 2007. China is thus trying to diversify exports tothe EU market, where prices are more attractive than in theUS market.
Scientists against tilapia
Two articles focusing on the fats in fish from the July2008 issue of the Journal of the American Dietetic Associa-tion is puzzling consumers and health professionals alike.Consumption of fish, particularly oily fish, at least twice perweek is recommended as a front-line fighter against heartdisease because it is high in protein, low in total fat, and oneof the only naturally-rich sources of long-chain omega-3fatty acids.
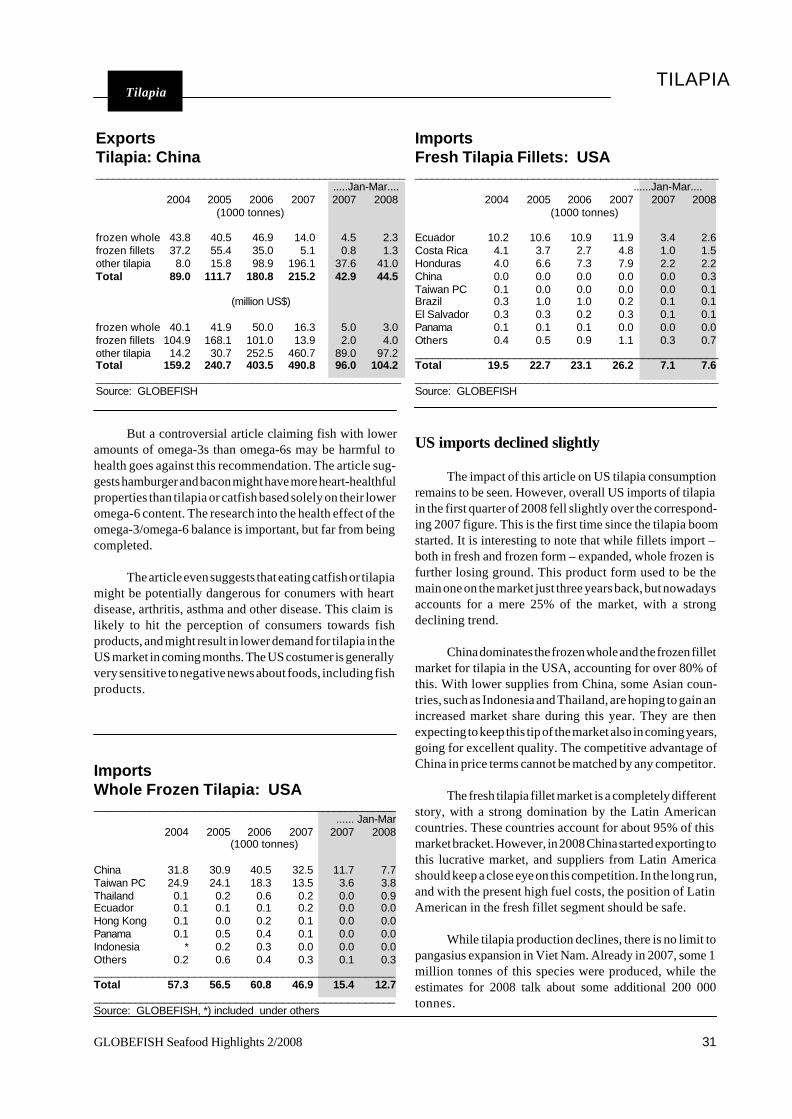
31GLOBEFISH Seafood Highlights 2/2008 31
TILAPIA Special Tilapia
ImportsFresh Tilapia Fillets: USA______________________________________________________
......Jan-Mar....2004 2005 2006 2007 2007 2008
(1000 tonnes)
Ecuador 10.2 10.6 10.9 11.9 3.4 2.6Costa Rica 4.1 3.7 2.7 4.8 1.0 1.5Honduras 4.0 6.6 7.3 7.9 2.2 2.2China 0.0 0.0 0.0 0.0 0.0 0.3Taiwan PC 0.1 0.0 0.0 0.0 0.0 0.1Brazil 0.3 1.0 1.0 0.2 0.1 0.1El Salvador 0.3 0.3 0.2 0.3 0.1 0.1Panama 0.1 0.1 0.1 0.0 0.0 0.0Others 0.4 0.5 0.9 1.1 0.3 0.7____________________________________________________Total 19.5 22.7 23.1 26.2 7.1 7.6____________________________________________________Source: GLOBEFISH
ImportsWhole Frozen Tilapia: USA______________________________________________________
...... Jan-Mar2004 2005 2006 2007 2007 2008
(1000 tonnes)
China 31.8 30.9 40.5 32.5 11.7 7.7Taiwan PC 24.9 24.1 18.3 13.5 3.6 3.8Thailand 0.1 0.2 0.6 0.2 0.0 0.9Ecuador 0.1 0.1 0.1 0.2 0.0 0.0Hong Kong 0.1 0.0 0.2 0.1 0.0 0.0Panama 0.1 0.5 0.4 0.1 0.0 0.0Indonesia * 0.2 0.3 0.0 0.0 0.0Others 0.2 0.6 0.4 0.3 0.1 0.3___________________________________________________Total 57.3 56.5 60.8 46.9 15.4 12.7___________________________________________________Source: GLOBEFISH, *) included under others
But a controversial article claiming fish with loweramounts of omega-3s than omega-6s may be harmful tohealth goes against this recommendation. The article sug-gests hamburger and bacon might have more heart-healthfulproperties than tilapia or catfish based solely on their loweromega-6 content. The research into the health effect of theomega-3/omega-6 balance is important, but far from beingcompleted.
The article even suggests that eating catfish or tilapiamight be potentially dangerous for conumers with heartdisease, arthritis, asthma and other disease. This claim islikely to hit the perception of consumers towards fishproducts, and might result in lower demand for tilapia in theUS market in coming months. The US costumer is generallyvery sensitive to negative news about foods, including fishproducts.
US imports declined slightly
The impact of this article on US tilapia consumptionremains to be seen. However, overall US imports of tilapiain the first quarter of 2008 fell slightly over the correspond-ing 2007 figure. This is the first time since the tilapia boomstarted. It is interesting to note that while fillets import –both in fresh and frozen form – expanded, whole frozen isfurther losing ground. This product form used to be themain one on the market just three years back, but nowadaysaccounts for a mere 25% of the market, with a strongdeclining trend.
China dominates the frozen whole and the frozen filletmarket for tilapia in the USA, accounting for over 80% ofthis. With lower supplies from China, some Asian coun-tries, such as Indonesia and Thailand, are hoping to gain anincreased market share during this year. They are thenexpecting to keep this tip of the market also in coming years,going for excellent quality. The competitive advantage ofChina in price terms cannot be matched by any competitor.
The fresh tilapia fillet market is a completely differentstory, with a strong domination by the Latin Americancountries. These countries account for about 95% of thismarket bracket. However, in 2008 China started exporting tothis lucrative market, and suppliers from Latin Americashould keep a close eye on this competition. In the long run,and with the present high fuel costs, the position of LatinAmerican in the fresh fillet segment should be safe.
While tilapia production declines, there is no limit topangasius expansion in Viet Nam. Already in 2007, some 1million tonnes of this species were produced, while theestimates for 2008 talk about some additional 200 000tonnes.
ExportsTilapia: China______________________________________________________
.....Jan-Mar....2004 2005 2006 2007 2007 2008
(1000 tonnes)
frozen whole 43.8 40.5 46.9 14.0 4.5 2.3frozen fillets 37.2 55.4 35.0 5.1 0.8 1.3other tilapia 8.0 15.8 98.9 196.1 37.6 41.0Total 89.0 111.7 180.8 215.2 42.9 44.5
(million US$)
frozen whole 40.1 41.9 50.0 16.3 5.0 3.0frozen fillets 104.9 168.1 101.0 13.9 2.0 4.0other tilapia 14.2 30.7 252.5 460.7 89.0 97.2Total 159.2 240.7 403.5 490.8 96.0 104.2___________________________________________________Source: GLOBEFISH
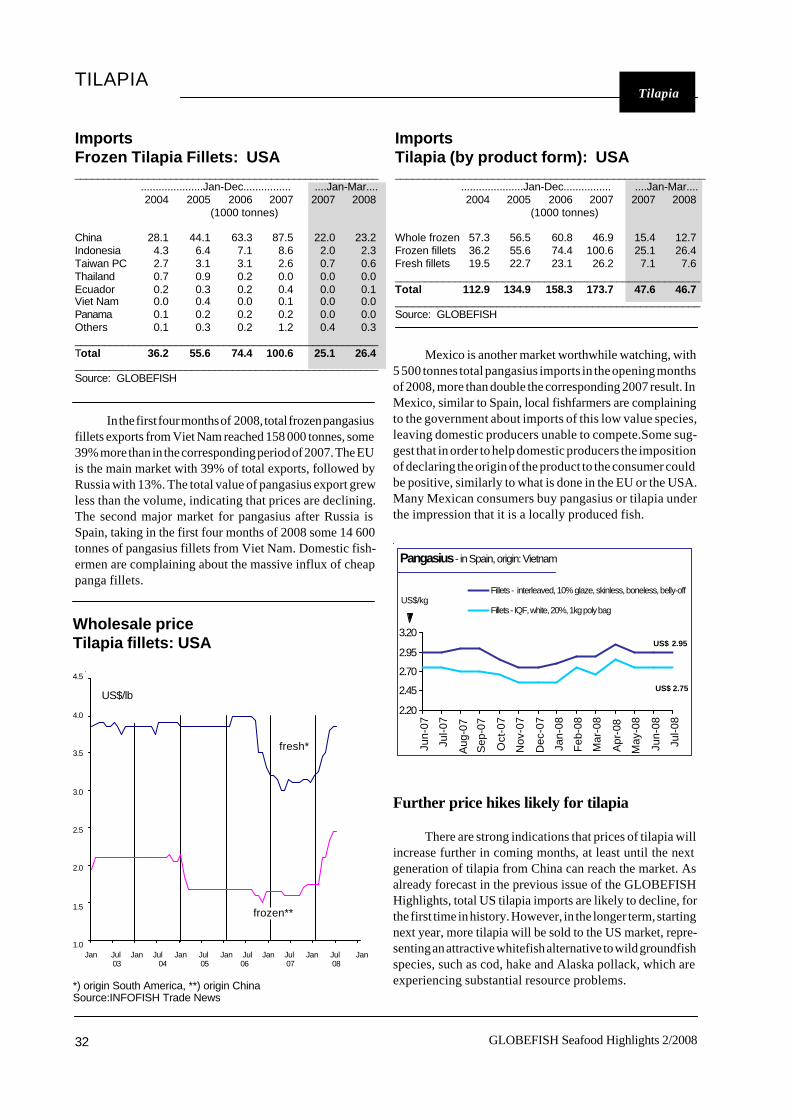
GLOBEFISH Seafood Highlights 2/200832
Wholesale priceTilapia fillets: USA
4.5
4.0
3.5
3.0
2.5
2.0
1.5
1.0 Jan Jul Jan Jul Jan Jul Jan Jul Jan Jul Jan Jul Jan 03 04 05 06 07 08
*) origin South America, **) origin ChinaSource:INFOFISH Trade News
US$/lb
ImportsFrozen Tilapia Fillets: USA______________________________________________________ .....................Jan-Dec................ ....Jan-Mar....
2004 2005 2006 2007 2007 2008(1000 tonnes)
China 28.1 44.1 63.3 87.5 22.0 23.2Indonesia 4.3 6.4 7.1 8.6 2.0 2.3Taiwan PC 2.7 3.1 3.1 2.6 0.7 0.6Thailand 0.7 0.9 0.2 0.0 0.0 0.0Ecuador 0.2 0.3 0.2 0.4 0.0 0.1Viet Nam 0.0 0.4 0.0 0.1 0.0 0.0Panama 0.1 0.2 0.2 0.2 0.0 0.0Others 0.1 0.3 0.2 1.2 0.4 0.3___________________________________________________Total 36.2 55.6 74.4 100.6 25.1 26.4____________________________________________________Source: GLOBEFISH
ImportsTilapia (by product form): USA______________________________________________________ .....................Jan-Dec................ ....Jan-Mar....
2004 2005 2006 2007 2007 2008(1000 tonnes)
Whole frozen 57.3 56.5 60.8 46.9 15.4 12.7Frozen fillets 36.2 55.6 74.4 100.6 25.1 26.4Fresh fillets 19.5 22.7 23.1 26.2 7.1 7.6___________________________________________________Total 112.9 134.9 158.3 173.7 47.6 46.7___________________________________________________Source: GLOBEFISH
fresh*
frozen**
TILAPIA Special Tilapia
In the first four months of 2008, total frozen pangasiusfillets exports from Viet Nam reached 158 000 tonnes, some39% more than in the corresponding period of 2007. The EUis the main market with 39% of total exports, followed byRussia with 13%. The total value of pangasius export grewless than the volume, indicating that prices are declining.The second major market for pangasius after Russia isSpain, taking in the first four months of 2008 some 14 600tonnes of pangasius fillets from Viet Nam. Domestic fish-ermen are complaining about the massive influx of cheappanga fillets.
Mexico is another market worthwhile watching, with5 500 tonnes total pangasius imports in the opening monthsof 2008, more than double the corresponding 2007 result. InMexico, similar to Spain, local fishfarmers are complainingto the government about imports of this low value species,leaving domestic producers unable to compete.Some sug-gest that in order to help domestic producers the impositionof declaring the origin of the product to the consumer couldbe positive, similarly to what is done in the EU or the USA.Many Mexican consumers buy pangasius or tilapia underthe impression that it is a locally produced fish.
Further price hikes likely for tilapia
There are strong indications that prices of tilapia willincrease further in coming months, at least until the nextgeneration of tilapia from China can reach the market. Asalready forecast in the previous issue of the GLOBEFISHHighlights, total US tilapia imports are likely to decline, forthe first time in history. However, in the longer term, startingnext year, more tilapia will be sold to the US market, repre-senting an attractive whitefish alternative to wild groundfishspecies, such as cod, hake and Alaska pollack, which areexperiencing substantial resource problems.
2.20
2.45
2.70
2.95
3.20
Jun-
07
Jul-0
7
Aug
-07
Sep
-07
Oct
-07
Nov
-07
Dec
-07
Jan-
08
Feb
-08
Mar
-08
Apr
-08
May
-08
Jun-
08
Jul-0
8
Fillets - interleaved, 10% glaze, skinless, boneless, belly-off
Fillets - IQF, white, 20%, 1kg poly bagUS$/kg
US$ 2.75
Pangasius - in Spain, origin: Vietnam
US$ 2.95