Surfing the Waves of Globalization: Asia and Financial Globalization

1
Globalization and its Impact:Globalization and its Impact:East Asia and VietnamEast Asia and Vietnam
Prepared for a Training of Trainers course on Trade Policy and WTO Accession, Hanoi, Vietnam, May 8-16, 2006
Yan Wang
The World Bank

2
Content•• Trends in Globalization / Trade /factor movementTrends in Globalization / Trade /factor movement
–– Goods, capital and laborGoods, capital and labor•• Underlying drivers /factors for GlobalizationUnderlying drivers /factors for Globalization
–– Theoretically, benefit of tradeTheoretically, benefit of trade–– Realistically, mixed results, why?Realistically, mixed results, why?
•• Trade integration in East AsiaTrade integration in East Asia
•• VietnamVietnam’’s trade and compositions trade and composition
•• SummarySummary

3
I. What is globalization?
• Global movements of goods, services and factors –capital, labor and ideas
• Global allocation of resources• Global sourcing /purchasing• Deeper division of labor / vertical and
horizontal / location flexible• More fierce competition /entry and exit
/Learning and Innovation crucial

4
TRADE:
• GOODS
• SERVICES
FACTOR MOBILITY:
Capital Human capital Labor
Substitutes:• labor• human capital
Complements or substitutes:• physical capital
Quest for diversification
Incomedifferentials
• Rising WTO power• Free-trade agreements
Technical change
Harmonization of values and rules
A Framework of Globalization: trade and factor mobility
Lower transport/telecom costs, internet
Lower trade barriers
Convergentconsumertastes
5
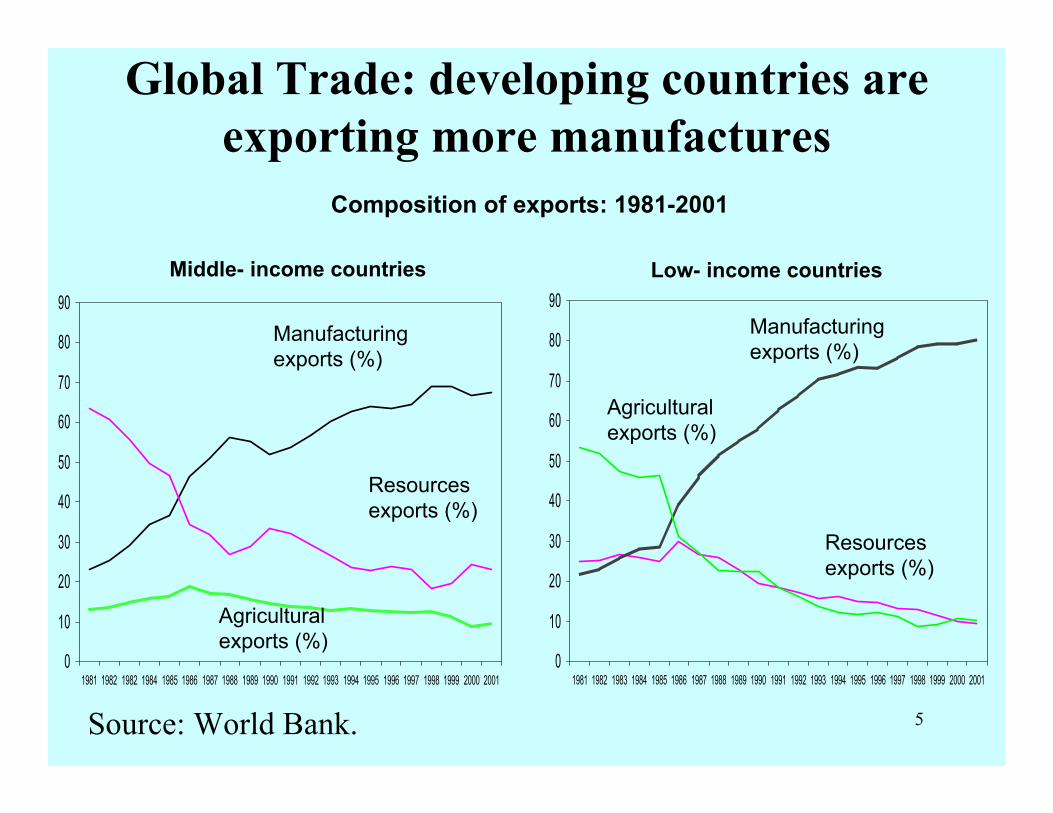
Global Trade: developing countries are exporting more manufactures
0
10
20
30
40
50
60
70
80
90
1981 1982 1982 1984 1985 1986 1987 1988 1989 1990 1991 1992 1993 1994 1995 1996 1997 1998 1999 2000 2001
Manufacturing exports (%)
Resources exports (%)
Agricultural exports (%)
Composition of exports: 1981-2001
Middle- income countries
0
10
20
30
40
50
60
70
80
90
1981 1982 1983 1984 1985 1986 1987 1988 1989 1990 1991 1992 1993 1994 1995 1996 1997 1998 1999 2000 2001
Low- income countries
Resources exports (%)
Agricultural exports (%)
Manufacturing exports (%)
Source: World Bank.

6
Significant trade reforms in the last two decades
0
5
10
15
20
25
30
35
40
SAS SSA LAC EAP MNA ECA OECD
Late 1980s
2004
Av. Tariffs %
Overall Trade Restrictiveness Index (OTRI), 2002
Source: World Bank.
7
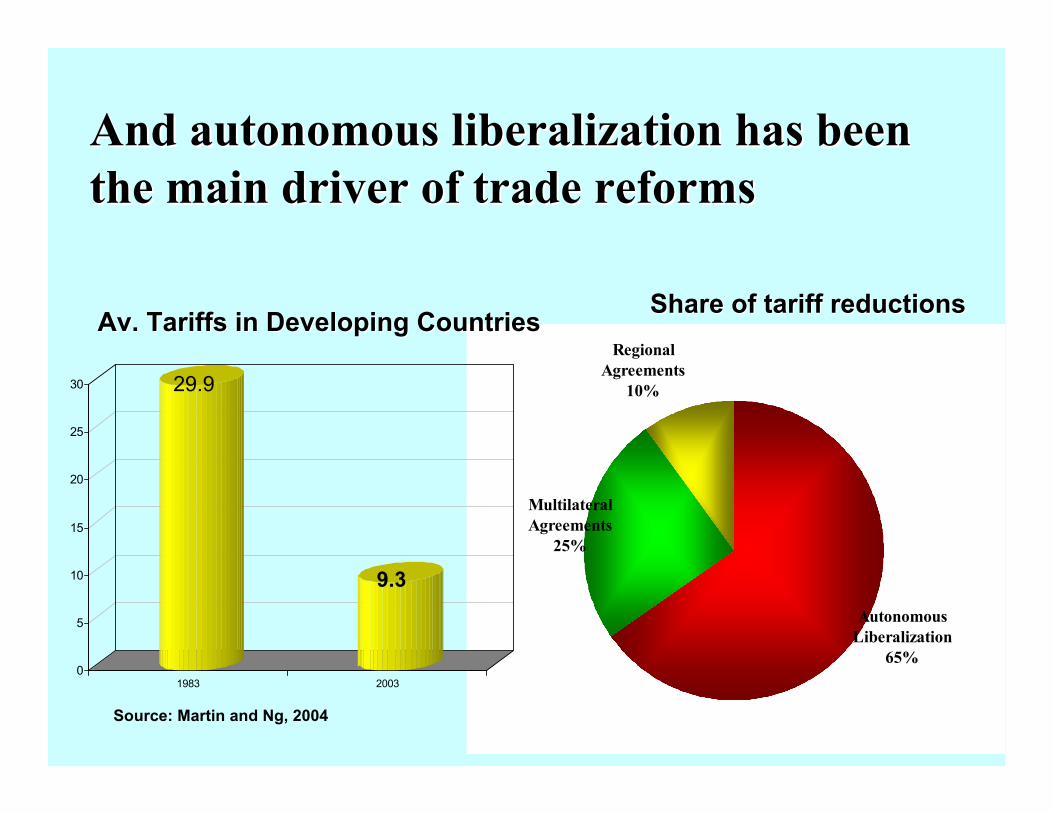
And autonomous liberalization has been And autonomous liberalization has been the main driver of trade reformsthe main driver of trade reforms
Regional Agreements
10%
Multilateral Agreements
25%
Autonomous Liberalization
65%
Share of tariff reductionsShare of tariff reductions
Source: Martin and Ng, 2004
0
5
10
15
20
25
30
1983 2003
Av. Tariffs in Developing CountriesAv. Tariffs in Developing Countries
29.9
9.3

8
–200
–100
0
100
200
300
82-892 90-942 1995 1996 1997 1998 1999 2000 2001 2002 2003 2004 2005
Total net private capital flowsNet direct investment Net private portfolio flows Other net private capital flows
1 In billions of US dollars. 2 Annual average.
Source: IMF, World Economic Outlook, September 2005.
Capital flows in emerging markets1
Int’l Capital Flows to Developing Countries

9
Labor Migration-- remittances are growing faster than Aid
020406080
100120140160180
Remittances FDI Private debt& equity
ODA
1995
2004

10
II. Underlying drivers /factors: - Pursuit of efficiency and growth- Lower trade barriers- Technical Progress --lower cost of transport- Pressure of international competition
• 1. Ricardo’s model is based on relative marginal cost
• 2. Heckscher-Ohlin model of comparative advantage is based on differences in factor endowments:– In each country the factor which is relatively abundant
will be relatively cheaper, and then the good which uses this factor relatively more intensively in its production will be relatively cheaper too. Therefore we expect a country to have its comparative advantage in goods relative intensive in the use of those factors which are in relatively abundant supply there.

11
Technological Advances has led to reduction in cost of transportation and ICT World transportation and insurance costs as a percentage of product value, 1950-93
Source : IMF, International Financial Statistics Yearbook

12
Global Local
Basic R&D
ComponentManufacturing
Product design
Marketing
Assembly
Global Allocation /Sourcing is possible:Local vs. global along the value chain

13
Theoretically under assumptions: Trade should benefit everyone
via factor price equalization• The third proposition of trade theory• 3. If trade is due to the existence of differences in
relative cost then free trade should eliminate such differences.
• In the case where comparative ad derives from differences in factor endowments, one expects that differences in domestic factor prices to be eliminated by trade.
• However, this depends on many assumptions including identical technology across countries.
• What is happening in reality?

14
Impact of globalization /trade reforms• Freer trade has led to rapid growth and poverty reduction in
some countries (East Asia, China, India, etc), but progress has been uneven:
• Some countries with solid export growth have not translated that into significant poverty reduction.
• There is growing anxiety in OECD countries with respect to the effects of globalization (high unemployment?);
• Developing countries could have done better if protection had been lower (particularly in agriculture).
• Roughly one-third of developing countries have not benefited significantly from trade expansion, some due to external factors such as domestic instability or civil wars.
• And many developing countries face significant supply constraints and infrastructure bottlenecks that hamper their integration into the world economy.

15
Skill Premium has been rising:Skilled/unskilled wage ratio, 1961-93
Sources: Sachs and Shatz (1995), Feenstra and Hanson (1995); Burtless (1995b)

16
Abundant in unskilled labor, scarce in capital
If protect Capital-Intensive Sectorstradeopens
K-intensive output expands, Labor-intensive output contracts,
Excess supply of unskilled labor
Unskilled wage is depressed
Both sectors becomemore intensive in unskilled labor
Full-employmentis preserved and poverty falls
If unskilled wage fixed, get unemployment
If abolish protection,Unemployment falls
The Stolper-Samuelson theorem: Relevant for Vietnam?
or
or

17
Employment and Real Wages (1970 = 100)
Source : OECD (1994), Part8, p.64 - Note : Real wages are total compensation per employee deflated by the GDP deflator.

18
Recent Studies reinforce effects of openness
• New endogenous growth model stress vertical innovations generated by research (Aghion and Howitt 1992) See also Melitz2003.
• New entrants with better products /services drive the old firms out--good for productivity.
• Frankel & Romer; Frankel and Rose; Noguer and Siscart (2005)– remove the effects of income from the export measure to confirm
implications of exports for growth• Findings corroborated by studies at firm level• Recent studies highlight importance of complementary policies
– Especially labor market flexibility to allow adjustment• Conclusion: Protection seems harmful for growth

19
III. Increased regional integration in EA
17.0%
9.0%
4.0% 3.0%
1.0%3.0%
0%2%4%6%8%
10%12%14%16%18%
Intra-regional trade as a share of GDP, 2003
Source: IMF DOT and WB WDI
East AsiaEast Asia Europe &Europe &Central AsiaCentral Asia
Latin Latin AmericaAmerica
Middle East Middle East & N. Africa& N. Africa
SouthSouthAsiaAsia
SubSub--Saharan Saharan AfricaAfrica

20
Trade Expansion in EAP (Export)(EAP, China, Japan and Korea)
EAP(not including Japan, Korea)
China
Japan
Korea, Rep.
0
200
400
600
800
1000
1200
1990 1991 1992 1993 1994 1995 1996 1997 1998 1999 2000 2001 2002 2003 2004
Expo
rt o
f Goo
ds &
Ser
vice
s(C
onst
ant 2
000
Bill
ion
US$
)
Source: World Development Indicators (April 2004)
21
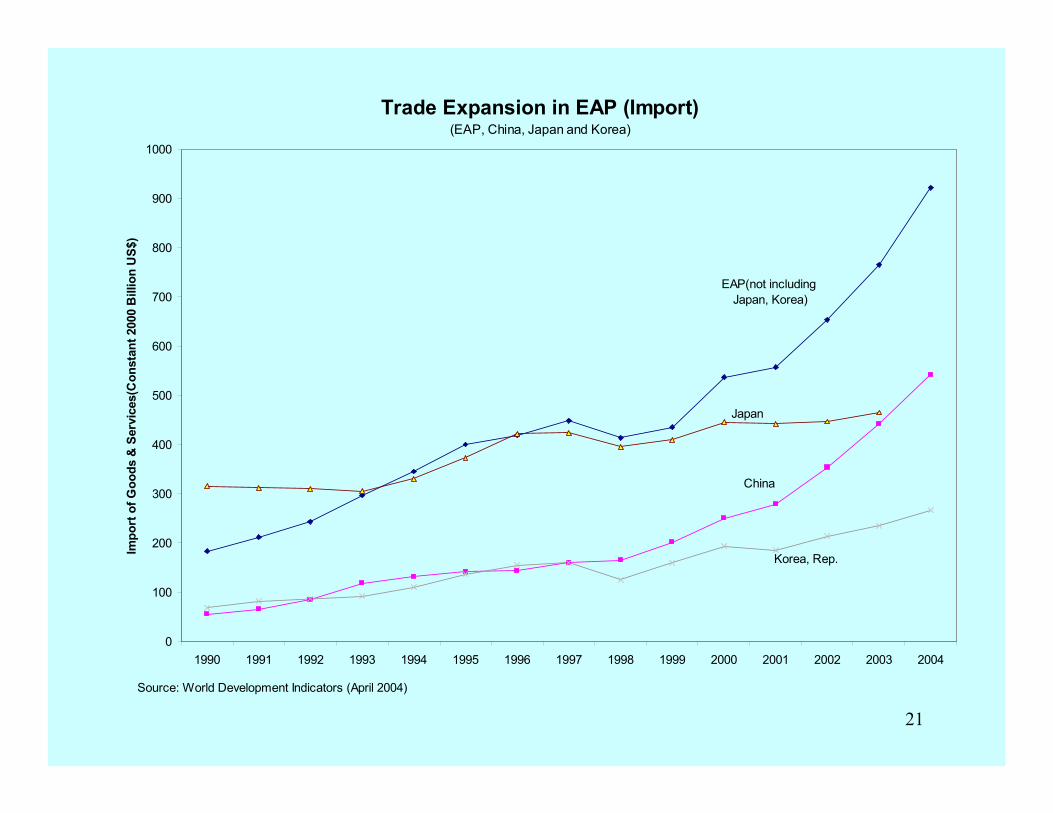
Trade Expansion in EAP (Import)(EAP, China, Japan and Korea)
EAP(not including Japan, Korea)
China
Japan
Korea, Rep.
0
100
200
300
400
500
600
700
800
900
1000
1990 1991 1992 1993 1994 1995 1996 1997 1998 1999 2000 2001 2002 2003 2004
Impo
rt o
f Goo
ds &
Ser
vice
s(C
onst
ant 2
000
Bill
ion
US$
)
Source: World Development Indicators (April 2004)

22
Trade Expansion in EAP (Export)(Cambodia, Indonesia, Mongolia, Philippines, Thailand, Vietnam)
Vietnam
Indonesia
Thailand
Philippines
MongoliaCambodia
0
10
20
30
40
50
60
70
80
90
100
1990 1991 1992 1993 1994 1995 1996 1997 1998 1999 2000 2001 2002 2003 2004
Expo
rt of
Goo
ds &
Ser
vice
s (C
onst
ant 2
000
Billi
on U
S$)
Source: World Development Indicators (April 2006)
IV. Vietnam’s Trade Expansion, Export

23
Trade Expansion in EAP (Import)(Cambodia, Indonesia, Mongolia, Philippines, Thailand, Vietnam)
Vietnam
Indonesia
Thailand
Philippines
MongoliaCambodia0
10
20
30
40
50
60
70
80
90
100
1990 1991 1992 1993 1994 1995 1996 1997 1998 1999 2000 2001 2002 2003 2004
Impo
rt of
Goo
ds &
Ser
vice
s (C
onst
ant 2
000
Bill
ion
US
$),
Source: World Development Indicators (April 2006).
Vietnam’s Trade Expansion: Import

24
Vietnam: Composition of Trade, 2000 and 2003
Food and live animals Beverages and tobaccoCrude materials, inedible, except f Mineral fuels, lubricants and relatAnimal and vegetable oils and fats ChemicalsManufact goods classif ied chiefly b Machinery and transport equipmentMiscellaneous manufactured articles Commod. & transacts. not class. acc
Export 2000
9%
0.1%
26%
3%
24%28%
6%
3%
1%0.4%
Import 2000
1%29%
6%
23%
15%
14%
4%4%3%
1%
Export 2003
21%
21%
3%
35%
1%
0.1%2%
7%9%
1%
Import 2003
1%
1%
14%
11%
4%5%5%0.1%
31%
28%

25
Vietnam: Direction of Trade--15 Biggest Trading Partners (1998-2003)Million US$
1998 1999 2000 2001 2002 2003Export
Japan 505 Japan 1786 Japan 2575 Japan 2510 USA 2453 USA 3939Korea Rep 479 Singapore 876 China 1536 China 1417 Japan 2437 Japan 2909USA 466 Australia 815 Australia 1272 USA 1066 China 1518 China 1883Thailand 381 China 746 Singapore 886 Singapore 1044 Australia 1328 Australia 1421Ukraine 360 Taiwan,China 682 Taiwan,China 757 Australia 1042 Singapore 961 Singapore 1025Free Zones 337 Germany 654 USA 733 Taiwan,China 806 Taiwan,China 818 Germany 855New Zealand 327 USA 504 Germany 730 Germany 722 Germany 729 UK 755UAE 323 UK 421 UK 479 UK 512 UK 572 Taiwan,China 749HK, China 319 Free Zones 420 Philippines 478 France 469 Korea, Rep. 473 France 494Myanmar 301 Philippines 393 Malaysia 414 Korea, Rep. 411 Iraq 440 Netherlands 493Lao PDR 252 France 354 Netherlands 391 Iraq 405 France 439 Korea, Rep. 492Singapore 250 Netherlands 343 France 382 Philippines 368 Netherlands 407 Indonesia 467Austria 241 Korea, Rep. 320 Thailand 372 Netherlands 367 Malaysia 348 Malaysia 454Canada 221 Thailand 313 Korea, Rep. 354 Belgium 341 HK, China 340 Belgium 391Taiwan,China 213 Belgium 307 Iraq 322 Malaysia 337 Belgium 337 HK, China 369
ImportKorea, Rep. 1155 Singapore 1878 Singapore 2694 Singapore 2478 Singapore 2533 China 3139Thailand 620 Japan 1618 Japan 2301 Japan 2183 Taiwan,China 2525 Japan 2979Germany 594 Taiwan,China 1566 Taiwan,China 1880 Taiwan, China 2009 Japan 2503 Taiwan,China 2915Netherlands 537 Korea, Rep. 1486 Korea, Rep. 1754 Korea, Rep. 1887 Korea, Rep. 2279 Singapore 2875Norway 473 China 673 China 1401 China 1606 China 2159 Korea, Rep. 2623Australia 469 Thailand 562 Thailand 811 Thailand 792 Thailand 955 Thailand 1282HK, China 393 HK, China 505 HK, China 597 HK, China 538 HK, China 803 United States 1141UK 376 USA 323 Malaysia 389 Malaysia 464 Malaysia 683 HK, China 974USA 374 Malaysia 305 USA 364 USA 411 Germany 558 Malaysia 925Taiwan,China 308 France 305 Indonesia 345 Germany 397 Russia 501 Germany 615Russia 303 Free Zones 287 France 331 Russia 376 USA 456 Indonesia 551New Zealand 303 Germany 269 Germany 295 France 300 Indonesia 363 Russia 492Japan 286 Russia 246 Australia 293 Indonesia 289 India 325 India 457Singapore 285 Australia 216 Russian Fede 240 Australia 266 France 294 France 405France 282 Lao PDR 197 India 178 India 228 Australia 286 Italy 374Source: World Integrated Trade Solution.

26
Conclusion• Globalization is inevitable, like it or not• Trade integration, int’l movements of goods, services
and factors are good for growth and poverty reduction [especially considering the new models of creative destruction]
• In reality, the full potential of trade and globalization has not been reached because of many distortions: protectionism, limitations on factor mobility, and domestic supply-side constraints, etc
• Therefore, complementary policies are needed to support the rural poor and vulnerable groups
• Vietnam has great potentials to compete in international market thanks to its comparative advantages, commitment to integrate, reform strategies that facilitate learning by doing.