Global value chains in a changing world - World Trade Organization
436
Global value chains in a changing world Edited by Deborah K. Elms and Patrick Low
Transcript of Global value chains in a changing world - World Trade Organization

Global value chains in a changing world
WTO
– FGI – TFC
TNG
lob
al va
lue ch
ain
s in a
cha
ng
ing
wo
rldE
lms a
nd
Low
(eds)
Edited by Deborah K. Elms and Patrick LowGlobal value chains (GVC) are a major driving force of globalisation. They are an inevitable outgrowth of the application of transformative information and transport technologies, combined with new business models and largely open borders. The GVC phenomenon promotes integration on multiple levels. Today’s international production systems confound traditional ways of looking at investment, production, finance, information systems and technology. These can no longer be seen as separate, meriting distinct attention and discrete policy treatment. The international fragmentation of production has generated the opposite of fragmentation – a complex networked system of production and consumption with innumerable moving, interactive parts.
Efforts to understand the dimensions of GVCs have spread across disciplines. This volume is the product of a dialogue with policy makers in the Asian region, where economists, political scientists, management specialists, development thinkers and business executives joined together in an exploration of the multiple dimensions of supply chains, what drives them, how they operate, how they adapt in a rapidly changing world, and what they mean for development and for policy.
Global value chains in a changing world
WTO ISBN 978-92-870-3882-1
DGVC cover-Mar13 AWfin.indd 1 12/06/2013 11:09
Global value chains in a changing worldEdited by Deborah K. Elms and Patrick Low
© Fung Global Institute (FGI), Nanyang Technological University (NTU), and World Trade Organization (WTO), 2013
Reproduction of material contained in this document may be made only with the written permission of the WTO Publications Manager.
ISBN: 978-92-870-3882-1
WTO PublicationsWorld Trade Organization154 rue de LausanneCH-1211 Geneva 21SwitzerlandTel: + 41 22 739 52 08Fax: + 41 22 739 54 58Email: [email protected] site: www.wto.orgOnline WTO bookshop: http://onlinebookshop.wto.org
Printing by WTO Secretariat, Switzerland, 2013
Disclaimer
Opinions expressed in this publication and any errors or omissions therein are the responsibility of the authors concerned, and not of the editors. Opinions expressed by the authors and the editors are their own personal opinions and should not in any way be attributed to the institutions with which they are associated. The designations employed and the presentation of the material in this publication do not imply the expression of any opinion on the part of the NTU, FGI and WTO concerning the legal status of any country, territory, city or area or of its authorities, or concerning the delimitation of its frontiers or boundaries. Mention of specific companies or products does not imply that they are endorsed or recommended by NTU or FGI or WTO or preferred to others that are not mentioned. The names of proprietary products are distinguished by initial capital letters. All reasonable precautions have been taken by NTU, FGI and WTO to verify the information contained in this publication. However, this published material is distributed without warranty of any kind, either expressed or implied. Responsibility for the interpretation and use of the material lies with the reader. Under no circumstances will NTU or FGI or WTO be liable for damages arising from its use.
iii
Table of contents
Acknowledgements vList of contributors viiIllustrations ixForeword by Pascal Lamy, Director-General of the WTO xvPreface by Victor K. Fung, Chairman of the Fung Global Institute xix
Introduction 1 Deborah K. Elms and Patrick Low
Part I Changing features of global value chains 11
1 Global supply chains: why they emerged, why they matter, and where they are going 13
Richard Baldwin
2 The role of services 61 Patrick Low
Part II Why and how we measure trade in value-added terms 83
3 Estimating trade in value-added: why and how? 85 Nadim Ahamad
4 The implications of using value-added trade data for applied trade policy analysis 109
Robert. B. Koopman, Marinos Tsigas, David Riker, and William Powers
5 Geometry of global value chains in East Asia: the role of industrial networks and trade policies 135
Hubert Escaith and Satoshi Inomata
Part III Some issues for supply chain managers 159
6 Views of GVC operators 161 Deborah K. Elms
Global value chains in a changing world
iv
7 The dynamics of global supply chains: the imperatives for success in a new market ecology 171
Henry Birdseye Weil
8 Uncertainty and risk in global supply chains 195 Donald Lessard
9 The influence of customer buying behaviour on product flow patterns between trading countries, and the implications for regulatory policy 221
John Gattorna
10 Supply chain connectivity and trade in Asia 245 Mark Goh
Part IV Plugging into supply chains: designing policy for a changing world 261
11 Policies to improve the supply chain: what needs to be done? 263 Michael J. Ferrantino
12 Can SMEs participate in global networks? evidence from ASEAN firms 279
Ganeshan Wignaraja
13 The globalization of supply chains: policy challenges for developing countries 313
Ujal Singh Bhatia
14 Global value chains and industrial policy: the role of emerging economies 329
Gary Gereffi and Timothy Sturgeon
15 How have production networks changed development strategies in Asia? 361
Fukinari Kimura
16 Expansion of global value chains in Asian developing countries: automotive case study in the Mekong sub-region 385
Masato Abe

v
Acknowledgements
We would like to thank the Temasek Foundation for the generous financial support that allowed us to hold a policy dialogue event in Singapore in November 2012 that brought together many of the chapter authors from this volume together with trade officials from across ASEAN countries. The contributions of the speakers and participants at this dialogue contributed significantly to the quality of the final book chapters. We should also like to thank the Fung Global Institute for funding a number of the papers included in the volume and certain costs involved in producing this volume. We thank the WTO for its support in preparing the conference and for covering part of the costs of publishing the volume.
Several staff members from the Temasek Foundation Centre for Trade & Negotiations (TFCTN) were critical to the workshop. Special thanks to Swee Seng Quak, Adeline Lim and Juliana Binte Abdul Jaffar. Rupali Sarkhel Desai put in many, many hours in transcribing participant comments from the event and drawing up a set of summaries for each speaker. Lyn Ng and Esther Tsui of the Fung Global Institute also helped with various organizational aspects of preparing for and running the conference, for which we are very grateful. Special thanks are due to staff from the WTO: Paulette Planchette for her outstanding editing and proofing work, Veronique Bernard for work on the bibliography, and Serge Marin-Pache for taking care of the publication of the volume.

vii
List of contributors
Masato AbeUnited Nations Economic and Social Commission for Asia and the Pacific (UNESCAP), Bangkok, Thailand
Nadim AhmadOrganisation for Economic Co-operation and Development (OECD), Paris, France
Richard BaldwinGraduate Institute, Geneva, SwitzerlandOxford University, Oxford, United Kingdom
Ujal Singh BhatiaMember, Appellate Body, WTO, Geneva, Switzerland
Henry Birdseye WeilMassachusetts Institute of Technology (MIT), Sloan School of Management, Cambridge, MA, United States
Deborah K. ElmsTemasek Foundation Centre for Trade and Negotiations, RSIS, NTU Singapore
Hubert EscaithWorld Trade Organization (WTO), Geneva, Switzerland
Michael J. FerrantinoUnited States International Trade Commission (USITC), Washington DC, United States
Victor K. FungChairmanFung Global Institute, Hong Kong; Hong Kong, China
John GattornaUniversity of Technology Sydney (UTS), Sydney, Australia
Gary GereffiDuke University, Durham, NC, United States
Global value chains in a changing world
viii
Mark GohNational University of Singapore, NUS Business School, Singapore
Satoshi InomataInstitute of Developing Economies, JETRO (IDE-JETRO), Tokyo, Japan
Fukunari KimuraFaculty of Economics, Keio University, Tokyo, JapanEconomic Research Institute for ASEAN and East Asia (ERIA), Jakarta, Indonesia
Robert B. KoopmanUnited States International Trade Commission (USITC), Washington DC, United States
Pascal LamyDirector-General World Trade Organization (WTO), Geneva, Switzerland
Donald LessardMassachusetts Institute of Technology (MIT), Sloan School of Management, Cambridge, MA, United States
Patrick LowWorld Trade Organization (WTO), Geneva, Switzerland
William PowersUnited States International Trade Commission (USITC), Washington DC, United States
David RikerUnited States International Trade Commission (USITC), Washington DC, United States
Timothy SturgeonMassachusetts Institute of Technology (MIT), Industrial Performance Center (IPC), Cambridge, MA, United States
Marinos TsigasUnited States International Trade Commission (USITC), Washington DC, United States
Ganeshan WignarajaAsian Development Bank Institute, Tokyo, Japan
ix
Illustrations
Tables
1.1 Per capita industrialization levels, 1750–1913 (United Kingdom in 1900 = 100) 14
1.2 Backward linkage matrix for major supply chain traders, 2007 21 1.3 Selected deeper than GATT provision in RTAs 42 2.1 Services necessary to the Sandvik Tools supply chain 67 3.1 OECD input-output industry classification 101 4.1 Regions and sectors in the GVC CGE model 113 4.2 Estimates of exchange rate pass-through and the substitution
elasticity 125 4.3 Numerical examples from the electrical and optical equipment
sector in 2009 127 4.4 Average trade elasticity for each exporting country 128 4.5 Estimated trade elasticity for US imports from China 129 5.1 Nominal protection and effective protection rates in East Asia
and the Pacific, 1995–2005 (percentage, ad valorem) 147 5.2 Sectoral average propagation length in East Asia, 2005
(selected cases) 150 8.1 Incidence of supply chain risks relative to capacity to absorb 21110.1 Logistics requirements of key industry requirements 24910.2 Supply chain infrastructure and location and criticality 25110.3 Supply chain connectivity effort by APEC 25712.1 Description of variables 28712.2 Sample characteristics 28912.3 Role of SMEs and large firms in production networks 29012.4 T-test on key variables for SMEs in production networks versus
SMEs outside production networks 29412.5 Probit estimates 29612.6 Perceived major or severe obstacles to conducting business,
SME firms (per cent of SME firms) 300
Global value chains in a changing world
x
12.7 SME firms’ perception of business and support services 30312.8 Selected studies on determinants of decision to export and
participation in production networks in ASEAN 31012.9 Correlation Matrix 31214.1 Seven selected emerging economies in comparative
perspective, 2011 33414.2 Export profile percentages of total exports: 2011 33614.3 Overview of industrial policies in emerging economies 34014.4 Brazilian electronics exports, imports and production, 2007–2010
growth rates 34614.5 Brazil’s electronics-related industrial policies 34814.6 Top global EMS and ODM contract manufacturers in 2011 34915.1 Research and development expenditure (% of GDP) in ASEAN
and other East Asian countries 37215.2 Policies for a new development strategy 37515.3 Changes in domestic operations in the period 1998–2002 and
2002–2006 by the type of firms, based on the two-year- balanced panel data 377
16.1 List of regional trade agreements including the Mekong subregion 38916.2 Tariff schedules for automobiles and auto parts in the
Mekong subregion 39016.3 Automotive industry in the Mekong subregion 39116.4 Obstacles to the development of global automotive value
chains in the Mekong subregion 40016.5 Sharing responsibility to strengthen automotive value
chains in the Mekong subregion 403
Figures
1.1 Global trade flows and estimated trade costs, 1870–1975 15 1.2 Schematic illustration of coordination costs and the second unbundling 17 1.3 Regional measures of 21st century trade, 1967–2007 18 1.4 Sector measures of 21st century trade, 1967–2005 19 1.5 Reversal of the big divergence 22 1.6 Reversal of industrialization/de-industrialization trend 23 1.7 Unilateral tariff cutting by developing nations, 1988–2009 25 1.8 Indicators of FDI and 21st century trade disciplines, 1957–2009 26
Illustrations
xi
1.9 Tasks, occupations, stages and product – the TOSP framework 281.10 Supply chain unbundling: coordination versus information technology 301.11 Wage differences in Factory Asia, Factory North American
and Factory Europe, 2008 311.12 Education and R&D: ASEANs, China, Republic of Korea,
United States, Japan and Canada, 2005 321.13 Circular causality and agglomeration forces 331.14 Equilibrium location balances agglomeration and dispersion forces 341.15 Schematic illustration of function and location unbundling interactions 351.16 The smile curve: good and bad stages in the value chain 371.17 Breakdown of the phone’s EUR 546 pre-tax retail price circa 2007 381.18 Future of international supply chains 441.19 Schematic illustration of computer integrated manufacturing 461.20 Indicator of supply chain trade North-North versus. North-South 491.21 How backward, forward and total supply-chain trade vary with income 511.22 Manufacturing GDP and incomes levels – nations below the
turning point 521.23 Historical and forecast oil prices 54 2.1 Sectoral contribution to total trade, gross and value-added
measures, 2008 62 2.2 A suit made in China and sold in the United States 65 2.3 Stan Shih’s Smile Curve 73 3.1 Trade in value-added 86 3.2 Domestic content of exports (domestic value-added exports,
per cent of total gross exports), 2009 91 3.3 Domestic content of exports (domestic value-added exports,
per cent of total gross exports), 2005–09 92 3.4 Transport equipment, gross exports decomposed by source,
US$ billion, 2009 92 3.5 Electronic equipment, gross exports decomposed by source,
US$ billion, 2009 93 3.6 Intermediate imports embodied in exports, per cent of total
intermediate imports, 2009 94 3.7 Services value-added – per cent of total exports, 2009 95 3.8 Services value-added – per cent of total exports of goods, 2009 96 3.9 Domestic content of imports – per cent of total intermediate
imports, 2009 97
Global value chains in a changing world
xii
3.10 Difference between China’s value-added and gross trade balances, US$ billion, 2009 97
4.1 Linkages between processing trade in China, the rest of China, and Japan in the GVC Model 114
4.2 Sourcing of imported goods in the GTAP model 115 4.3 Sourcing of imported goods in the GVC model 116 4.4 Per cent change in GDP volume 117 4.5 US imports of electronics 118 4.6 Chinese imports of electronics 120 4.7 Chinese imports of steel 121 5.1 An image of demand propagation (automobile industry) 137 5.2 Calculation of average propagation length 138 5.3 Evolution of regional supply chains in East Asia: 1985–2005 141 5.4 Change of relative positions in the regional supply chains, 1985–2005 143 5.5 Trade, logistics and transportation – East Asia in perspective 149 7.1 A typology of enterprise architectures 172 7.2 Evolution of business ecosystems 173 7.3 A typical supply chain 174 7.4 Assessing strategic value 175 7.5 Dynamics of the value system 181 7.6 Destruction of the existing value chain 183 7.7 A model of relationship value 184 7.8 A typology of supply chains 190 8.1 Sources of risk for global supply chains 198 8.2 Sources of risk from inside to outside 199 8.3 Sources of risk and their supply chain impacts 201 8.4 Risk magnification via the “bull whip” 202 8.5 The reputational risk system 203 8.6 Global production sharing 205 8.7 Risk specialization in the value chain profit curve 2078.8A Impact capacity to absorb for specific disruption 2108.8B Impact capacity to absorb for a general disruption 210 8.9 Sources of global supply chain issues 2128.10 Issue preparedness 214 9.1 The four most commonly observed dominant buying behaviors 224 9.2 Flow types and matching supply chain configurations 229 9.3 The new business model at Cash Services Australia 231
Illustrations
xiii
9.4 The new business model is needed to manage demand and capacity in multi-user supply chains 232
9.5 Elements of the ‘dynamic alignment’ framework 233 9.6 Multiple supply chain alignment on the customer side 234 9.7 From static to dynamic configurations 238 9.8 Bilateral Import/Export Trade Flows (by key major
product/service category) 24010.1 Value of trade as per cent of GDP 24810.2 Value chain side of a business 25012.1 Share of SME and large firm exports in total exports 29112.2 Share of top 25 per cent SME exporters 29215.1 The fragmentation theory: production blocks and service links 36315.2 Shares of machinery in total manufactured exports/imports to/from
the world, 1994 36515.3 Shares of machinery in total manufactured exports/imports to/from
the world, 2007 36615.4 Location of manufacturing sub-sectors, 2005 36715.5 Cross-border production sharing and production “networks” 36915.6 Two-dimensional fragmentation 37015.7 Industrial agglomeration in Bangkok Metropolitan Area 37316.1 Mekong subregion 38616.2 Share of automotive goods trade, Mekong subregion, 2000–11 39216.3 Growth in intra-automotive industry trade 2000–11 39316.4 Major motives of FDI for the automotive industry in the
Mekong subregion 39416.5 FDI inflows to the automotive industry in the Mekong subregion 39516.6 A simplified global automotive value chain 398

xv
Foreword
Any discussion today of international trade and investment policy that fails to acknowledge the centrality of global value chains (GVCs) would be considered outmoded and of questionable relevance. The idiom might vary – referring to trade in value-added, production sharing, supply chains, outsourcing, offshoring, vertical integration, or fragmented production instead of GVCs – but the core notion of internationally joined-up production is the same. Every international agency dealing with economic affairs as well as many governments are working on various aspects of GVCs in order to understand better their various dimensions. The central concern from this quarter, of course, is what GVCs mean for trade policy and for international cooperation in trade-related matters.
While the business, management, economics, and development literature on GVCs goes back at least two decades, attention from the international policy community is much more recent. It is interesting to consider the process through which GVCs became more mainstream in policy thinking. A major initial influence came from the arcane world of statistics and measurement. Certain international and national agencies and academic institutions started to worry that by measuring trade in terms of gross values we were distorting the picture of bilateral trade balances, double counting trade flows, attributing production to the wrong geographical locations, incorrectly specifying the technological content of exports at the national level, and misunderstanding the true relationship between imports and exports. In short, we were simply failing to capture the true nature of economic relations among countries and the resulting policy implications.
Why, the argument went, should we measure and report international trade any differently from the way we measure and report domestic production? By measuring trade in gross terms, we were effectively saying that the entire value of an export could be accounted for by the last country on the supply chain. We needed instead to attribute value correctly, ensuring that the factors of production and other inputs contributed by each national location were allocated accordingly. No doubt one reason why progress towards measuring trade in value-added has been so slow is that the
Global value chains in a changing world
xvi
data requirements of this approach are far greater than simply recording the gross value of trade flows.
Not surprisingly, considering the pattern of its economic growth experience over a number of decades in the second half of the twentieth century, Japan was a pioneer in this field. The Institute of Developing Economies-Japan External Trade Organization (IDE-JETRO) was one of the earliest agencies to develop international input-output matrices that reflected inter-industrial trade linkages. IDE-JETRO subsequently teamed up with the World Trade Organization (WTO) to develop this work further and measure value-added trade. The WTO launched its “Made-in-the-World” initiative aimed at raising public awareness and deepening analysis of the implications of GVCs. The OECD and WTO have also worked together to derive a comprehensive set of trade in value-added indicators from the OECD’s global input-output table. This cooperation led to the TiVA (Trade in Value-Added) initiative.
Another important initiative resulting in a matrix of international value-added trade comes from WIOD (World Input-Output Database), a grouping of European universities and other policy institutions, along with the Organisation for Economic Co-operation and Development (OECD), funded by European Union (EU) Commission. Other work contributing to international value-added measurement efforts has been undertaken by the United States International Trade Commission, the World Bank and the International Monetary Fund working with the Global Trade Analysis Project (GTAP) database. More recently, the United Nations Conference on Trade and Development (UNCTAD) derived trade in value-added indicators from EORA (another academic database initiative).
Much remains to be done on the statistical front, and this work will implicate a growing number of agencies, particularly at the national level. Further efforts and resource commitments are needed to refine the baseline for this kind of data analysis, improve and standardize measurement methodologies, and ensure regular updating. We have some way to go before trade can be routinely reported in value-added as well as in gross terms, but this should be the objective.
While statistics have been an important entry point for the international community to think about GVCs, the process of integrating these insights into policy is still at a fledgling stage. Some might argue that the GVC phenomenon is nothing more than turbo-charged international trade and that we have been concerned with trade and trade policy for centuries. But this “nothing really new” posture is
Foreword
xvii
reductionist and misses the point that as technology has pushed out the frontiers of trade and intensified the degree of global interdependency, we need to rethink the very nature of cooperation among nations and what this means for policy. The “them and us” of much old thinking about trade has increasingly been shunted aside by an “us” focus. The politics have yet to catch up as policy strives to master the implications of GVCs.
Several policy-related insights in need of further analysis that will increasingly be factored into the decision-making process are particularly worthy of mention. First, intensified interdependency in international production relationships through GVCs inevitably implies greater mutual policy dependency. Because supply chains are integrated networks of production operations and not just a series of across-the-border transactions, they implicate multiple policy areas. These include the full spectrum of traditional trade policy concerns, investment policy, and a broad range of public policy-driven non-tariff measures affecting both goods and services. An adequate policy framework for cooperation must take an integrative view of policy and break down the compartments into which we still tend to separate different policy realms.
Second, the way supply chains are configured and supplied makes it less relevant than it ever was to think of individual markets as independent of one another. Markets are complementary and whatever affects supply and demand in one market will have ripple effects in other markets. Because trade and investment are increasingly interconnected, those relationships tend also to be of a long term nature, where stability and transparency are important attributes. This is another dimension of policy interdependency that must be taken into account. Third, the internationally joined-up nature of GVCs means that the impact of an upstream policy applied by one country on the supply chain will be multiplicative as goods and services cross successive jurisdictions downstream. This is an important dynamic implication of policy interdependency.
A fourth aspect of GVC-dominated production that has suffered from inadequate attention in a policy context is the role of services. Analysis of value-added trade has shown that services account for almost half of world trade – considerably more than traditionally estimated. The issue is not just quantitative. The nature of the contribution of services is also important. It goes beyond providing the glue that holds supply chains together. Services are often produced in conjunction with goods and represent crucial production components and potential sources of innovation and value-added.
Global value chains in a changing world
xviii
We need an analytical framework that adequately embraces and measures the contribution of services to production.
Finally, a preoccupation of many governments is how to acquire as big a part of international value-added as possible along GVCs. This is a basic development challenge and is not only about the percentage share of value-added on any given supply chain. It is also about the quality of participation in terms of the capacity and opportunity to diversify into other activities. Much also depends on whether production located in a developing country is still owned and controlled by a lead firm, or whether it is contracted out to a domestic firm. What all this means for human skills development, income-earning opportunities, employment, and accumulation more generally is a key dimension for public policy makers. Many factors are crucial here, particularly on the supply side, as well as in terms of policy choices that governments might opt for to encourage development through engagement with GVCs. More than ever, public-private partnership is the backbone of any successful policy, as the nature and characteristics of global value chains is constantly evolving and flexibility and reactivity are key ingredients to efficient decision making. This partnership should extend beyond national borders, as global challenges call for international coordination from multiple stakeholders.
In sum, we face a wide array of challenges in adapting policy to GVC realities and using policy to shape those realities. As I have already suggested, policy is not devoid of politics and we need to work on the politics as well. Both policy and politics are rendered more complex by the speed of change today, fuelled by a continuing stream of new technologies and evolving market conditions. I welcome this volume for its contribution to deepening our understanding of the issues, and particularly for the richness of its eclectic and multi-disciplinary approach, involving supply chain practitioners, business and management specialists, economists, and policy analysts. I also welcome the institutional cooperation that made this project possible, involving the Fung Global Institute, the Temasek Foundation Centre for Trade & Negotiations, and the World Trade Organization.
Pascal LamyDirector-General of the World Trade Organization
xix
Preface
Governance through partnership in a changing world
Victor K. Fung1
The evolution of global value chains
In the last three to four decades, government and business have been part of a far-reaching economic transformation, made possible by remarkable advances in information, communication and transport technologies. The proliferation of internationally joined-up production arrangements – that is, global supply chains – has changed our economic and political landscape in fundamental ways.
Advances in technology and an enabling policy environment have allowed businesses to internationalize their operations across multiple locations in order to increase efficiency, lower costs and speed up production. Businesses today look to add value in production where it makes most sense to do so; indeed this has become a key element of corporate competitiveness. For their part, some governments – though not all – recognize that participating in global value chains will bring value and opportunities to their workers and economies; they have thus sought to foster friendly policy frameworks.
For many economies today especially in Asia, imports are increasingly a key complement of local production and exports. Our trade figures in East Asia bear this out: intermediate goods have comprised over 50 per cent of exports and over 60 per cent of imports in Asia, since the year 2000. That is also why it is important to measure trade in value-added terms, rather than just looking at the gross figures. We need to know what each economy contributes to production at each stage of the supply chain.
Global value chains in a changing world
xx
When we measure exports in terms of their import content – we can understand domestic value-added. It becomes clear that so many products today comprise inputs from a number of countries. The reality which is not seen in gross trade statistics is that products today are “made in the world”, rather than made in a single country.
These production relationships embody the interdependence among nations that characterizes our world today. But when we look around us, it is not difficult to conclude that we should be managing our interdependency better.
Global value chains in a changing world
The predominance of supply chains in the economies of many countries calls for a careful consideration of where we are headed as a global community. We should be thinking about how to influence developments positively where we can, and adapt to them where we cannot. In the decades I have spent in business, I have learned that nothing stands still for very long. If anything, change today happens faster than ever.
What are some of these changes? Not so long ago it was common to assume that production took place in the East for consumption in the West. With the growth of the middle class in Asia and more policies to support domestic demand, however, the momentum for consumer growth is more likely to be in Asia than in the West. Companies must adapt their strategies and supply chains as a result.
At the same time, relative efficiencies and cost structures are changing, and production is becoming more complex – changes in the location of production are underway as some new locations open up and others seem less advantageous. These shifts in the global distribution of jobs and economic opportunity carry with them many challenges for governments, business and society at large.
When we talk about supply chains, we must remember how varied they can be, depending on what they produce, how they produce and where they produce. My involvement in supply chains over the years, for example, has mainly – although not exclusively – been in mass-market consumer products. Other supply chains involve lower turnover and smaller markets, often with a stronger technological component. Others still focus on capital goods and are more producer than consumer driven. Then there are the agricultural and natural resource supply chains. And we should not forget service supply chains.
Preface
xxi
Each of these varieties of supply chain has quite different characteristics, facing different challenges, and requiring different operating and policy environments. The variety adds complexity, and needs to be taken fully into account in analytical terms. But supply chains also have much in common, especially when we try to understand how they are affected by rapid change. Some of the most fundamental aspects of the challenges facing business and government decision-makers apply across the board, although perhaps to differing degrees.
I have already mentioned how patterns of consumption and production are changing across the globe, and forcing us to rethink old assumptions about the workings of supply chains and the shape of public policy. Another driver of change arises from faster communication and the spread of knowledge and information through the internet. Today consumers can find out the location and conditions in which a good is produced, and this power of information can inform their buying decisions. As a result, consumers and civil society are placing new demands on business and governments to meet their expectations. This makes for a better world, but clearly a more challenging one.
There will be other challenges as well. Production and consumption is increasing in Asia and other parts of the world as living standards rise and populations become better off, which is certainly a good thing. However, it also places new demands on the environment and depletes natural resources. Clearly, traditional growth models and patterns of consuming natural resources may be unsuited for a changing world, particularly one which will have 9 billion people by 2050. These issues require attention from both business and government. We need to produce and consume more sustainably, and foster innovation. Solutions here lie in the design of appropriate policies, which are properly administered, and achieve essential public aims while still enabling production and value creation in the private sector.
Sustainability has another important side – that of social inclusion and distributional equity. This is essentially about fairness. In terms of global value chains, it is about ensuring that those who manufacture and assemble goods share equitably in the benefits. It is about creating an environment in which small and medium-sized enterprises can participate in supply chains, without being shut out by costly regulation, poor administration or exclusionary behaviour.
More generally, it is about addressing growing inequality within and between societies. Governments clearly have a major role in these matters, supported appropriately by business. If we are not more successful in ensuring the legitimacy of our production,
Global value chains in a changing world
xxii
growth and development models we will be threatened by much bleaker alternatives with consequences unwelcome to all.
A further challenge is how to manage a world with greater risk. As businesses, we face a number of risks relating to production models, market uncertainties and unpredictable consumer behaviour. But risk can also come from many other directions. Natural risks such as the Fukushima tragedy, the Thai floods, and other natural events need to be managed adequately through contingency planning and building redundancy into the supply chain.
Political risks such as 9/11 or terrorism call for constant vigilance. Financial risks emerge from fragile financial systems and the uncertain costs and availability of trade finance. While government or business may be in the front line in respect of one or other of these sources of risk, acting on shared responsibilities can make much difference to our capacity to prepare for and react to an uncertain environment.
Technology and technological innovation are fascinating issues, both for policy and industry. On the one hand, technology can help us deal with the global challenges we face today, such as climate change, resource scarcity or urbanization. Or the search for new technologies may simply be about finding the best ways of doing new and old things. These are all reasons why far-sighted governments and successful businesses devote attention to innovation.
But on the other hand, technological innovation can have great disruptive power. Companies’ processes, production methods, skills and markets may quickly be rendered redundant by new technological discoveries. Old jobs may disappear as a result of robotics or 3D printing. This has happened throughout history and I suspect few would disagree with the view that we are much the better for the change despite the disturbance. But disruption means adjustment, and adjustment can be painful and punishing for groups within society. Ameliorating the process of adjustment and enabling these parties to contribute value to society again, is surely in the interests of the public at large and of business.
The need for common action and shared responsibility
I have ranged quite widely over issues facing global supply chains, and the economic and socio-political contexts in which they operate. I do see a natural convergence of
Preface
xxiii
interests between smart policy, designed and executed in the public interest, and a long view taken by businesses reaching beyond next quarter’s bottom line. I believe this is a natural partnership in the quest for good governance and a better life for people everywhere.
This brings me to the subject of international cooperation. My remarks about the relationship between business and government so far have mostly been about how cooperation should work in a national context, for the common interest, between policymakers, regulators, administrators and business.
Turning to a more international perspective, it is worrying to see how little success we seem to be having these days in fostering cooperation in which governments can advance common policies. We see this, for example, in the stalled Doha negotiations at the WTO, in climate change negotiations, and in discussions over a new international financial architecture.
There are many reasons that we have yet to resolve these pressing issues. But the longer we postpone needed action in these key areas, the greater the risks are that we are missing valuable opportunities and courting deterioration in the global landscape. This is not just a matter for a single region; it is the case for the entire world. Nor is it just a matter for governments, it is also for civil society and business as well. Ours is a world where we all need to recognize our common interests. We have a shared responsibility and we need fresh leadership and fresh thinking to galvanize action.
Much of what I have spoken about here underlies the vision that prompted my brother William and I to establish the Fung Global Institute in 2011 as an Asia-based think tank dedicated to generating and disseminating innovative thinking and business-relevant research on global issues from Asian perspectives. We are grateful for the opportunity to partner with the WTO and the Temasek Foundation Centre for Trade and Negotiations in this exploration of global value chains.
Victor K. FungChairman of the Fung Global Institute
1 Adapted from the opening remarks by Dr. Victor K. Fung on the occasion of the Singapore Dialogue on Global Value Chains, 28 November 2012

1
Introduction
Deborah K. Elms and Patrick Low
Trade and production networks are not new. Firms have been producing items with components sourced from around the globe for centuries. Businesses have continuously sought out new markets for their products. What have changed, however, are the speed, scale, depth and breadth of global interactions. Increasingly, new players have become active in what have come to be called global value chains or global supply chains. This process of organization has brought entirely new issues to the table for consideration.
As this book highlights, global value chains (GVCs) have been rapidly evolving. As our knowledge and experience with different kinds of GVCs accumulates, the kinds of policy responses governments develop to encourage supply chain growth will need to change. Because GVCs come in all different shapes and types, it may not be possible or desirable to create a one-size-fits-all response. The kinds of data used to measure and assess changes in economic structures are being modified to better suit this new environment.
While governments may need to adjust policies, supply chain operators and managers are not standing still either. Firms operating in a GVC world need to remain nimble. They face a range of issues that can change rapidly, including new government policies, information technology shifts, consumer behaviour fluctuations, changes in logistics and so forth that may dramatically alter the risks that firms face.
Governments need to think about how to encourage a range of GVCs in order to improve prospects for growth and development. As GVCs have evolved, it has become easier for some smaller, less developed countries to participate in supply chains, provided that the appropriate policies are put into place. Challenges still remain for small country participation, however, as they do for small and medium-sized enterprises (SMEs). Many Asian economies have led the way in demonstrating how governments can create “hard” and “soft” infrastructure necessary for GVC
Global value chains in a changing world
2
growth. Looking at specific country experiences highlights some key lessons that can benefit both the largest and smallest firms.
Origins of the project
This volume is an outcome of a Global Value Chains Policy Dialogue that was organized in Singapore on 28–30 November 2012 by the Temasek Foundation Centre for Trade & Negotiations in cooperation with the Fung Global Institute and the World Trade Organization (WTO). Versions of all but two of the chapters included in the volume were presented at the dialogue.
A primary objective of the dialogue was to engage policymakers from the region in a discussion of what the prominence of global value chains in the Asian region means for national economies and for national and international policymaking. A further objective was to traverse traditional barriers among disciplines in order to provide as comprehensive a perspective as possible on the nature and workings of GVCs, issues confronting them, the opportunities and challenges of participating in them, the interface between GVCs and policies, and future challenges. It was with this objective in mind that the resource persons participating in the conference included business operators, policymakers, economists, academic management and business specialists, political scientists and policy analysts. The varied nature of the perspectives brought to the dialogue by these different groups enriched the discussion and illustrated the multi-faceted complexity of the GVC phenomenon.
While some of the 16 chapters in the volume are not specific to the Asian region, a number of them are and this distinction has a bearing on how far individual contributions contain insights of relevance beyond the Asian region. The four parts of the volume look respectively at: (I) changing features of GVCs; (II) the measurement of trade in terms of value-added: (III) issues faced by supply chain managers: and (IV) aspects of policy design relevant to supply chains.
Volume summary
The summary of individual chapters that follows cannot possibly do justice to the contents and quality of the individual contributions. There is no substitute for reading the chapters. But this set of summaries will give the reader an overview of this broad based and wide ranging set of chapters.
Introduction
3
In Part I, Richard Baldwin presents a long-term view of what has driven globalization over three centuries and what this means for global supply chains. The historical picture is dominated by what Baldwin refers to as the two “unbundlings.” The first of these was driven by the steam revolution and the second by the revolution in information and communications technology (ICT). The first unbundling was characterized by industrialization and rapid growth in today’s developed economies, a widening of the income divide between North and South, booming trade and migration, and local production agglomeration. Key features of the second unbundling included a surge towards industrialization in the emerging economies and the reduction in income dispersion between these economies and the industrialized ones. GVCs also emerged in the second unbundling, with all the complexities involved in networked trade, investment, services and innovation. For countries with the necessary infrastructure and policy framework, the emergence of supply chains in the second unbundling offers a richer menu of options for diversification, industrialization, growth and development.
The second chapter in Part I, by Patrick Low, addresses the role of services in GVCs. Low argues that the role of services in production and trade has been under-estimated for a variety of reasons, and this has become a greater problem with the growing prominence of GVCs. A range of identification challenges help to explain the analytical deficit afflicting services activities compared to goods. The picture is complicated by the existence of market complementarities, modularized supply arrangements and the growth of service-intensive networks involving different technologies, entrepreneurship, and producer-consumer relationships that innovate and create value. Developing countries could use services as a means to upgrade their involvement in supply chain production. The chapter concludes by considering some specific issues related to data problems for services in GVCs.
Understanding the rapid changes taking place in GVCs requires good data. However, the statistics used so far to measure trade are problematic. The chapters in Part II of this volume consider the challenges of measuring trade differently using value-added methods.
Nadim Ahmad discusses how trade measured in gross terms has been unable to reflect modern trade patterns characterized by increased international fragmentation of production. Fragmentation is driven by technology, costs, access to resources and markets, and by policy reform. Ahmad discusses the micro and macro approaches to understanding trade in value-added terms. The former can only work at a product level, and has the limitation that it is difficult to go beyond the contribution of first-tier
Global value chains in a changing world
4
suppliers, although it illustrates well the pitfalls of relying on gross measures of trade. Recent joint work by the OECD and the WTO has attempted to mainstream statistics on trade in value-added through their Trade in Value-Added (TiVA) initiative. This perspective helps to improve understanding of what underlies trade, growth and development, and to identify the true sources of value addition in production and trade. It also establishes a basis for exploring links between trade and the macro-economy; trade and employment; and trade and the environment. The chapter goes on to explore and draw lessons from early results from the OECD-WTO work.
Robert Koopman, Marinos Tsigas, David Riker and William Powers use a global trade in value-added database in conjunction with USITC data to undertake two simulation scenarios – one of a US tariff placed on imports from China designed to offset a low exchange rate and another that approximates a renminbi appreciation by a similar amount as the US tariff. These results are compared using value-added data and traditional measures of trade. A second application of value-added data involves an estimation of the degree to which changes in exchange rates and other prices are passed through to domestic prices rather than being absorbed. Again, these results are compared with outcomes using gross trade data. In all cases there are significant differences in results, with analysis based on value-added data telling a more convincing story both statistically and intuitively than analysis based on gross data.
Hubert Escaith and Satoshi Inomata focus specifically on East Asian trade. Using input-output data to measure value-added, Escaith and Inomata examine the contribution of production networks to industrial development. They document the role of policy in fostering regional integration and show how reductions in variance among tariffs diluted a bias against exports that typically accompanies inwardly-focused industrialization strategies based on domestic markets. They also looked at how improved logistics and administrative procedures reduced trade costs and facilitated the operation of production networks. A key message in this chapter concerns the centrality of policy in shaping industrial development based on trade.
Part III contains five chapters that examine various issues of relevance to supply chain managers. Deborah K. Elms summarizes the main points made by various representatives of the private sector who did not contribute their own chapters but were active in the discussions during the policy dialogue held in Singapore in November 2012. The points they focused on are a useful barometer of business sentiment about what matters, including issues like inventory management. The
Introduction
5
discussion demonstrated the specificities associated with different kinds of supply chains. Several factors, including government policy, are important in determining how efficiently firms are able to manage this aspect of their operations. A recurrent theme was the degree of dependency firms had on trade and the importance of the conditions under which trade occurs. Government policy was a key factor. The supply chain operators highlighted some examples of improved policy environments, while others noted obstacles associated with regulations, standards and other barriers to trade.
The chapter by Henry Birdseye Weil covers a range of issues facing supply chains, stressing particularly the need for a dynamic focus of analysis. Changes in the landscape facing business that Weil stresses are related to the role of information technology, including widely available inexpensive broadband, innovations associated with e-commerce, and greater and speedier access to knowledge. Other pressures arise from the threat of disintermediation, wage and other cost pressures in a time of slackening demand and new market configurations (particularly in the case of China). Weil also stresses the importance of trust and brand loyalty in the evolving dynamics of supply chains. The author also goes through a range of decision points that inevitably confront supply chain operators and makes suggestions for how to manage rapid change in an uncertain environment.
Donald Lessard focuses on the effects of uncertainty and risk on supply chains. After considering different analytical perspectives on uncertainty and risk, Lessard identifies several types of risk: natural disruptions, man-made disruptions, government policy, innovations, external macroeconomic conditions, changes in demand, and risks internal to supply chains. He concludes that counteracting risk factors associated with diversification and the multiplicative impact of disruptions preclude any prior conclusion regarding the association between risk and the length of supply chains. Risk management involves processes of identification, analysis and risk mitigation strategies. The types of effective responses logically available for managing risk will change the probability of disruption, lessen the impact of disruption, or spread (diversify) risk. The chapter also makes distinctions among supply chain stakeholders in terms of their capacity to absorb risk.
John Gattorna examines the influence of consumer behaviour on supply chains, arguing that adequate responses to the wide array of challenges facing supply chains must take account of the particularities of human behaviour. Economic and business model analyses are not enough. Gattorna spells out a range of observed
Global value chains in a changing world
6
patterns of consumer behaviour. These include the existence of a finite number of consumer behaviour patterns in any given market, the fact that the dominant behaviour pattern can change temporarily in response to external pressures, more permanent changes in consumer behaviour are internal to the consumer, and more than one kind of customer behaviour can be observed within single corporate structures. All these observations clearly carry implications for supply chain configurations. The chapter goes on to identify four kinds of buying behaviour: collaborative, transactional, dynamic and innovative. The author suggests different approaches to identifying consumer behaviour and ways that it may change, and also breaks down different supply chain categories in order to facilitate this task.
The final chapter in Part III, by Mark Goh, considers the role of logistics in supply chain management. Key ingredients of effective logistics include low cost-to-value and time-to-value ratios for goods and services along supply chains. Flow efficiency, security in the transfer of goods and services, and reliability in delivery are also important ingredients of good connectivity. Good connectivity also relies on high quality physical and soft infrastructure, which can sometimes be most efficiently ensured through public-private partnerships. The regulatory environment is also crucial. The chapter reviews different priorities in terms of good connectivity according to industry categories. It also discusses the challenges facing Asia Pacific Economic Cooperation (APEC) countries in the Asian region, as well as a range of initiatives taken to improve connectivity.
Papers in Part IV look at how enterprises and countries supported by governments can plug into supply chains and discuss a range of challenges involved. Michael Ferrantino is concerned with what is required on the policy front to improve the operation of supply chains. Ferrantino reviews a wide range of policy areas that matter, including infrastructure, transportation, administrative interventions affecting logistics, and product standards. He distinguishes between policy areas where reform can be costly and will take time, such as improving physical infrastructure, and changes that yield rapid results and often cost less. Among the latter are customs reform, transport deregulation and market access improvements in such areas as logistics, express delivery, telecommunications and retailing. The author emphasizes that reforms focusing on “hard” and “soft” areas of action should, as far as possible, be undertaken in parallel and not sequentially, notwithstanding differences in cost and the speed of results. Some of the most effective changes in terms of costs and effectiveness may arise from “soft” options such as customs reform. He also emphasizes that while overall a country gains from reducing the costs of trade, entrenched vested interests may well seek to impede the reform process.
Introduction
7
Ganeshan Wignaraja presents evidence from firm-level data collected in the Association of Southeast Asian Nations (ASEAN) region of the extent to which small and medium sized enterprises (SMEs) participate in international production networks. This issue is important because SMEs account for the majority of firms and half the employment in the ASEAN region. The contribution of SMEs to supply chains is likely to be underestimated by the exclusion of indirect exports in some of the few studies that do exist. Wignaraja’s chapter uses two different methodologies – econometric analysis and more qualitatively oriented survey analysis of perceptions among SMEs of the difficulties they face. The chapter finds that a minority of SMEs in the ASEAN region participate in production networks, and that they are generally minor players compared to larger firms, but there are important differences among countries. Those SMEs that do participate tend to be larger than those that do not, to have higher foreign equity participation, are staffed or owned by individuals with higher education attainment levels, and are (on average) newer firms. The perception data suggest that impediments to participation, especially competitors in the informal sector, smuggling and price fixing are important. A trust deficit was found to influence the degree of SME participation in production networks. Other prominent constraints include access to finance, poor infrastructure, skill bottlenecks and corruption. The author concludes that both the econometric and perception data analyses provide useful clues for the directions that policy reforms should take.
Ujal Bhatia Singh analyzes challenges for developing countries in participating in GVCs, illustrated with the experiences of the South Asian apparel and Indian automotive industries. He emphasizes the need for a holistic appreciation of the policy framework that helps to determine participation possibilities and stresses the need for strong domestic market integration. Regional value chains and an emphasis on services may provide a bridge for more global participation in the future. But risk management is a significant challenge. Policies are sometimes crafted to give advantage to large countries and dominant lead firms. The policy challenge for developing countries is often compounded by the absence of multilaterally-based policy coherence and the continuing proliferation of overlapping regional arrangements. Governments are clearly interested in the developmental potential of GVCs and in finding ways of upgrading along supply chains and ensuring adequate income levels and employment opportunities. Meeting these challenges requires adequate preparedness on the supply side based on well-integrated domestic markets, but external impediments can frustrate these efforts and need to be negotiated.
Global value chains in a changing world
8
Gary Gereffi and Timothy Sturgeon look at the scope for industrial policy linked to GVC participation in emerging economies. Gereffi and Sturgeon argue that the classic debate on the role of governments in developing and diversifying their domestic economies through industrial policy pre-dated the adoption of GVCs as an organizing framework for understanding industrial development. The main difference between the early debate and the world of GVCs is that the focus today is more upon vertical specialization and the possibility of moving into higher-value niches, rather than nurturing national champions. The interface between global and local actors intrinsic to GVC realities means that lead foreign firms are less receptive to government policies aimed at involving local suppliers in GVC production. Large economies have greater scope for leverage than small ones, which gives the emerging economies a distinct advantage. The authors distinguish between horizontal and selective policy interventions, the factors that drive these, and what makes them more or less feasible. A case study of consumer electronics in Brazil is used to illustrate the scope for GVC participation by an emerging economy and the associated challenges. The authors argue for a balanced approach to GVC-oriented industrial policies, and argue that although some features of GVC-related policies may – on the face of it – look like old-fashioned import substitution there are important differences relating to the targets and objectives of intervention.
Fukunari Kimura analyzes how production networks have changed East Asian development strategies. Kimura argues that the advanced stage of production network development in East Asia has resulted in a situation where, under the Baldwin-defined ICT-driven second unbundling, production fragmentation and industrial agglomeration are occurring simultaneously. The author discusses how fragmentation characteristics of production networks allow countries to jump-start industrialization. Countries that have successfully achieved this and attained middle-income status in East Asia and aspire to industrial country status can promote this objective through the formation of industrial agglomerations. This development contrasts with continued reliance on fragmented arrangements in production networks between Mexico and the United States, and between Eastern and Western Europe. Kimura explains how the development of agglomerations facilitates the participation of local firms in production networks. Agglomerations are more stable than fragmented networks and, as long as local firms can compete, they are likely to enjoy more opportunities to engage. Technology spillovers may also be greater. The author also discusses the different policy options available to foster participation in situations of both fragmentation and agglomeration. He goes on to discuss options open to developed economies to slow down de-industrialization. The chapter concludes with a discussion of risks associated with macro shocks transmitted through production networks.
Introduction
9
The final chapter in the volume, by Masato Abe, presents the results of firm surveys on the automotive sector in the Mekong Subregion. The chapter analyzes the key drivers of GVCs in developing and least developed countries, the role of sectoral characteristics in facilitating engagement, and the contribution of policy. Surveys indicate the intention of firms to expand their operations in countries such as Cambodia, Lao PDR and Myanmar. Apart from access to labour, the attraction of these countries for lead firms in GVCs is partly influenced by progress made in policy areas such as trade opening, trade facilitation, a friendly regulatory environment, and the development of logistics. However, the surveys also identified long lists of policy improvements that firms would like to see in order to improve the situation. These lists are organized in the chapter under the headings of trade liberalization, trade facilitations and logistics, infrastructure, policy and regulatory framework, labour market, and business strategies. The author concludes that reforms in these areas would be facilitated through collective action among governments in the region and public-private partnerships, with support from international agencies.
Concluding observation
The chapters in this volume showcase some of the cutting-edge thinking and research on GVCs from a variety of different perspectives. Our understanding of what makes supply chains work better and more efficiently undoubtedly lags developments on the ground. Operators in dynamic regions of the world like Asia are busily creating, revising, destroying and rebuilding chains on a daily basis. Sometimes they do so with the helpful and active support of government policies. Often, they are forced to work around policy challenges. It remains our hope that this volume will contribute to a more nuanced discussion of GVCs and the policy dimensions necessary to encourage their growth in the future.


Part I
Changing features of global value chains

13
1 Global supply chains: why they emerged, why they matter, and where they are going
Richard Baldwin1
1.1. Introduction
Global supply chains have transformed the world. They revolutionized development options facing poor nations; now they can join supply chains rather than having to invest decades in building their own. The offshoring of labour-intensive manufacturing stages and the attendant international mobility of technology launched era-defining growth in emerging markets, a change that fosters and is fostered by domestic policy reform (Cattaneo et al., 2010 and Baldwin, 2011b). This reversal of fortunes constitutes perhaps the most momentous global economic change in the last 100 years.
Global supply chains, however, are themselves rapidly evolving. The change is in part due to their own impact (income and wage convergence) and in part due to rapid technological innovations in communication technology, computer integrated manufacturing and 3D printing.
This paper looks at why global supply chains (GSCs) matter, the economics of their unbundling and their implications for policy. It finishes with a discussion of factors affecting the future of global supply chains. The paper begins by putting global supply chains into historical perspective.
1.2. Three centuries of globalization: GSCs in perspective
Globalization is often viewed as driven by the gradual lowering of natural and man-made trade costs. This is a serious misunderstanding.
Global value chains in a changing world
14
Advances have driven globalization in two very different types of “connective” technologies: transportation and transmission. These have dramatically different implications, but understanding why requires some background.
First unbundling: steam made it possible, scale economies made it profitable
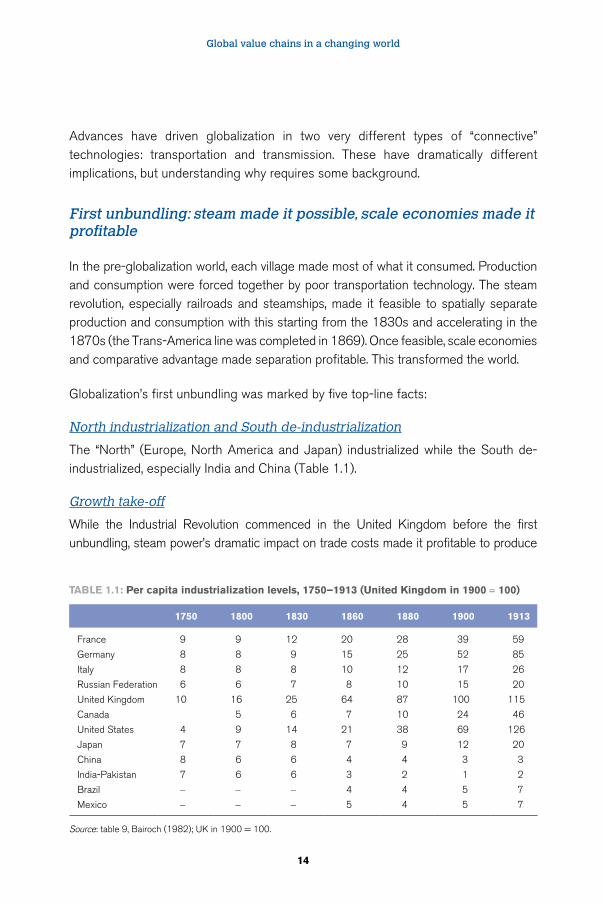
In the pre-globalization world, each village made most of what it consumed. Production and consumption were forced together by poor transportation technology. The steam revolution, especially railroads and steamships, made it feasible to spatially separate production and consumption with this starting from the 1830s and accelerating in the 1870s (the Trans-America line was completed in 1869). Once feasible, scale economies and comparative advantage made separation profitable. This transformed the world.
Globalization’s first unbundling was marked by five top-line facts:
North industrialization and South de-industrialization
The “North” (Europe, North America and Japan) industrialized while the South de-industrialized, especially India and China (Table 1.1).
Growth take-off
While the Industrial Revolution commenced in the United Kingdom before the first unbundling, steam power’s dramatic impact on trade costs made it profitable to produce
Table 1.1: Per capita industrialization levels, 1750–1913 (United Kingdom in 1900 = 100)
1750 1800 1830 1860 1880 1900 1913
France 9 9 12 20 28 39 59
Germany 8 8 9 15 25 52 85
Italy 8 8 8 10 12 17 26
Russian Federation 6 6 7 8 10 15 20
United Kingdom 10 16 25 64 87 100 115
Canada 5 6 7 10 24 46
United States 4 9 14 21 38 69 126
Japan 7 7 8 7 9 12 20
China 8 6 6 4 4 3 3
India-Pakistan 7 6 6 3 2 1 2
Brazil - - - 4 4 5 7
Mexico - - - 5 4 5 7
Source: table 9, Bairoch (1982); UK in 1900 = 100.
Global supply chains: why they emerged, why they matter, and where they are going
15
at vast scales. This triggered modern growth, characterized by a self-sustaining cycle of production, innovation and income gains that made further innovation profitable. This spread to continental Europe and the United States around the middle of the 19th century.2
“Big time” international income divergence/convergence
The first unbundling saw the North’s and South’s incomes diverge massively. Innovation, scale and specialization gave Northern industry a powerful cost-advantage over industry in the South. In addition to favouring the location of more manufacturing in the North, the shift also destroyed incentives for innovation in the South. The higher Northern growth – which persisted up till the early 1990s – produced what Pritchett (1997) calls income divergence “big time”.3
International trade and labour migration boomed
International trade in goods and labour migration exploded during the first unbundling. After being shut down by two world wars, a surge of protectionism and the Great Depression, trade returned, by 1951, to Victorian levels; trade costs (including protection) returned to pre-WWI levels by 1974. Mass international migration never resumed.
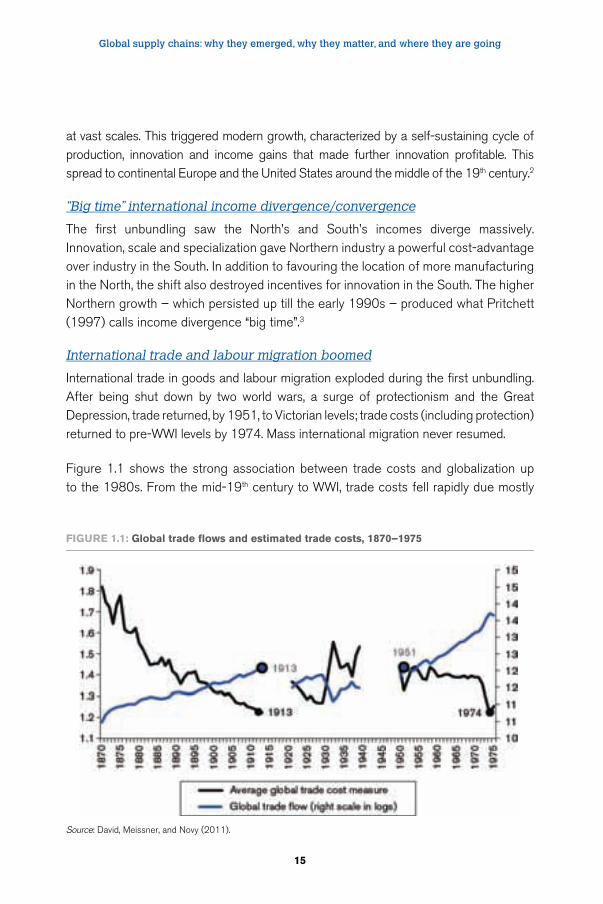
Figure 1.1 shows the strong association between trade costs and globalization up to the 1980s. From the mid-19th century to WWI, trade costs fell rapidly due mostly
FigUre 1.1: global trade flows and estimated trade costs, 1870–1975
Source: David, Meissner, and Novy (2011).
Global value chains in a changing world
16
to lower transportation costs. From 1914 to 1950, trade costs rose erratically but substantially due mostly to man-made trade barriers such as the Smoot-Hawley tariff and the retaliation it provoked. Finally, during the post-war period, trade costs have fallen steadily due mainly to tariff liberalization and better organization of transportation (such as containerization).
Production clustered locally as it dispersed globally
The first unbundling did not make the world flat. Indeed, it produced the first globalization paradox: freer trade led production to cluster locally in factories and industrial districts. The world’s economic geography went from homogenous (subsistence agriculture everywhere but a few cities) to “spiky” (Florida, 2005). The flat-world musings of economists-without-economics-training, like Thomas Friedman and William Greider, are about as wrong as can be.
Globalization’s paradox is resolved with three points: i) cheap transport favours large-scale production, ii) such production is complex; and iii) extreme proximity lowers the cost of coordinating the complexity. By removing one constraint (transport costs), the first unbundling brought forward another – coordination costs. Proximity became more important in many ways, not fewer.
Second unbundling: ICT made it possible, wage differences made it profitable
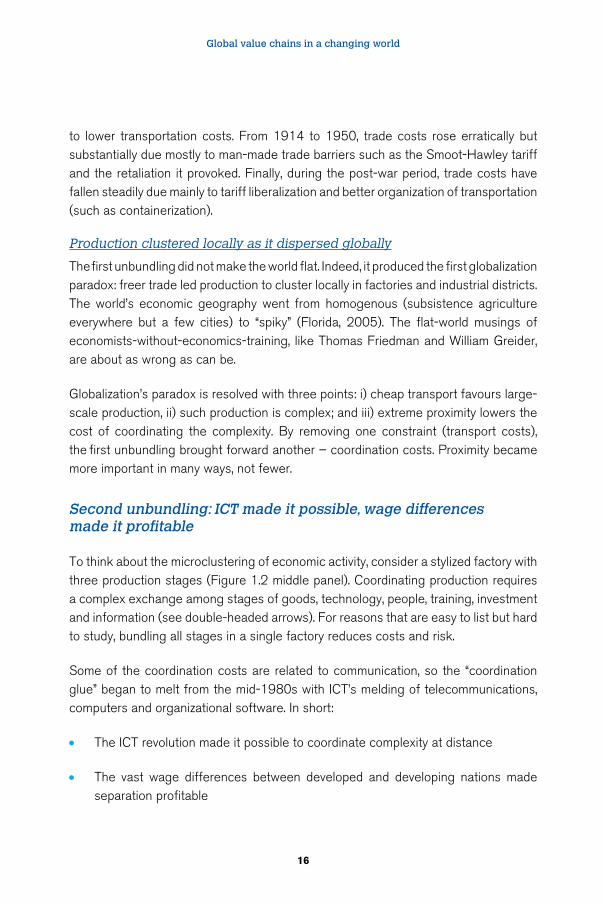
To think about the microclustering of economic activity, consider a stylized factory with three production stages (Figure 1.2 middle panel). Coordinating production requires a complex exchange among stages of goods, technology, people, training, investment and information (see double-headed arrows). For reasons that are easy to list but hard to study, bundling all stages in a single factory reduces costs and risk.
Some of the coordination costs are related to communication, so the “coordination glue” began to melt from the mid-1980s with ICT’s melding of telecommunications, computers and organizational software. In short:
• The ICT revolution made it possible to coordinate complexity at distance
• The vast wage differences between developed and developing nations made separation profitable
Global supply chains: why they emerged, why they matter, and where they are going
17
This was globalization’s second unbundling – some production stages previously performed in close proximity were dispersed geographically (Figure 1.2 right panel).
Importantly, most technology is firm specific, so internationalizing supply chains often involves offshoring know-how. While technology transfer is an ancient story (gunpowder), ICT facilitated control that reduced the costs and risks of combining developed-economy technology with developing-nation labour.4 For this reason, technology became more internationally mobile.
FigUre 1.2: Schematic illustration of coordination costs and the second unbundling
Source: Derived from Baldwin (2011a).
Indicators of global supply chains
Directly measuring the “nexus” or the rise of 21st century trade is difficult; existing statistical categories were designed to quantify the first unbundling.
One measure of supply chain internationalization focuses on products where nations are exporting and importing an extraordinary amount. This makes little sense from a first unbundling perspective; nations seem to have both a comparative advantage (extraordinarily large exports relative to other nations) and a comparative disadvantage (extraordinarily large imports relative to other nations). From a second unbundling perspective, the extent of such overlapping comparative advantage and disadvantage provides a proxy for global supply chains.
Global value chains in a changing world
18
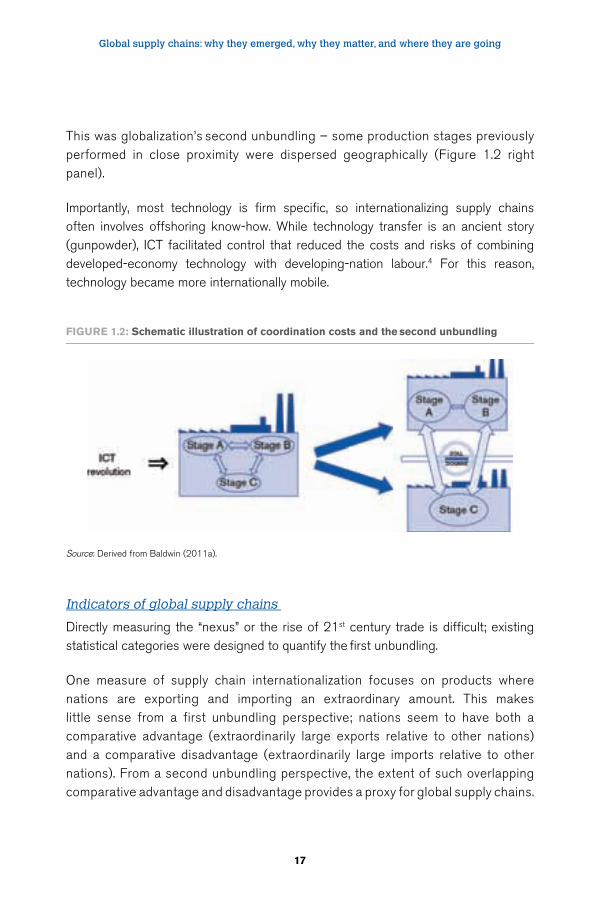
Thus the sum of such overlapping trade as a fraction of world manufacturing trade provides a conservative measure of supply chain trade (Amador and Cabral, 2009). The evolution of this measure by region and by sector is shown in Figure 1.3 and Figure 1.4.
These charts show that there is nothing new about supply chain trade. However, before the ICT revolution, most of the international sourcing was done among mature economies, such as the United States and Canada in the auto industry or as in intra-EU trade in machinery. Figure 1.4 shows that starting in the late 1970s, Asia’s participation in GSCs started to boom, with a sudden take-off timed with the ICT revolution around 1990. By the late 1990s, Asia had surpassed the North Atlantic economies.
FigUre 1.3: regional measures of 21st century trade, 1967–2007
Source: Author.
Global supply chains: why they emerged, why they matter, and where they are going
19
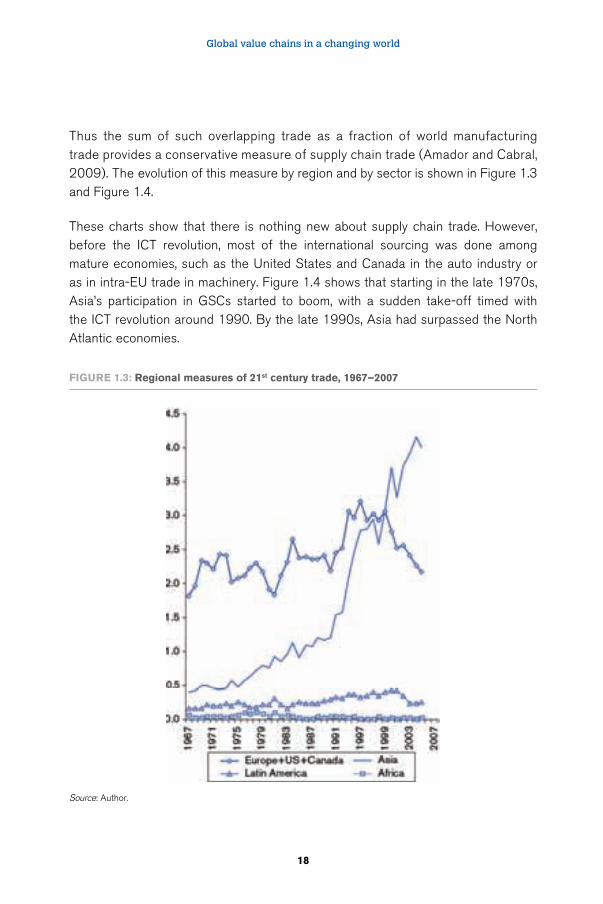
As it turns out, 21st century trade is concentrated in relatively few sectors (Figure 1.4). Electrical machinery and electronics take the lion’s share of the level and the growth in the 1990s.
A different measure of global supply chain activity uses nations’ input-output matrices to identify which goods are inputs into which industries. This family of measures uses this information to identify which imports are used as intermediate inputs and sums them up to get a measure of supply chain trade.5 Lopez-González (2012) uses this method to estimate the share of a nation’s exports made up of value added from intermediate inputs from its trade partners. For example, about 37 per cent of the gross value of Mexican exports consists of US intermediate inputs, while only two per cent of US exports consist of Mexican intermediate inputs.
FigUre 1.4: Sector measures of 21st century trade, 1967–2005
Source: Author.
Global value chains in a changing world
20
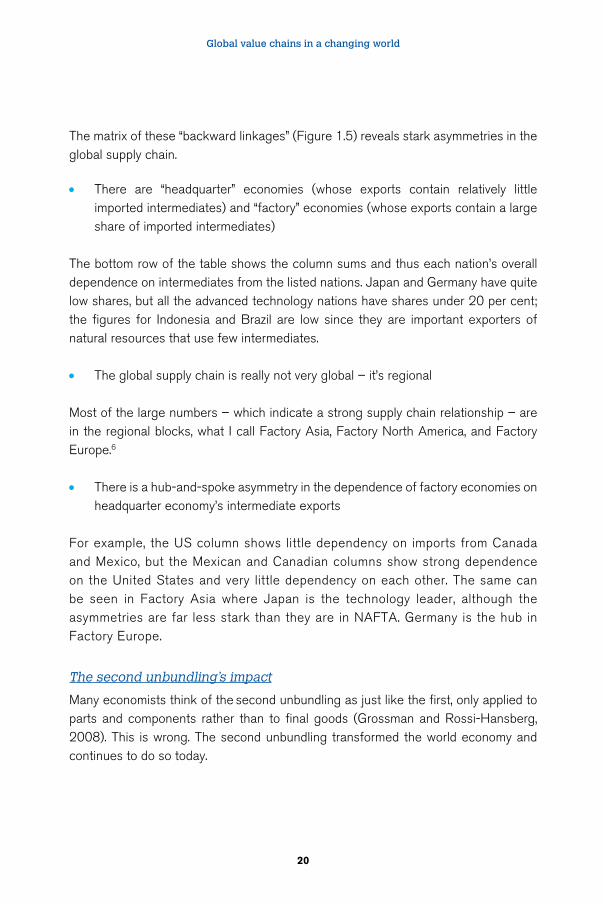
The matrix of these “backward linkages” (Figure 1.5) reveals stark asymmetries in the global supply chain.
• There are “headquarter” economies (whose exports contain relatively little imported intermediates) and “factory” economies (whose exports contain a large share of imported intermediates)
The bottom row of the table shows the column sums and thus each nation’s overall dependence on intermediates from the listed nations. Japan and Germany have quite low shares, but all the advanced technology nations have shares under 20 per cent; the figures for Indonesia and Brazil are low since they are important exporters of natural resources that use few intermediates.
• The global supply chain is really not very global – it’s regional
Most of the large numbers – which indicate a strong supply chain relationship – are in the regional blocks, what I call Factory Asia, Factory North America, and Factory Europe.6
• There is a hub-and-spoke asymmetry in the dependence of factory economies on headquarter economy’s intermediate exports
For example, the US column shows little dependency on imports from Canada and Mexico, but the Mexican and Canadian columns show strong dependence on the United States and very little dependency on each other. The same can be seen in Factory Asia where Japan is the technology leader, although the asymmetries are far less stark than they are in NAFTA. Germany is the hub in Factory Europe.
The second unbundling’s impact
Many economists think of the second unbundling as just like the first, only applied to parts and components rather than to final goods (Grossman and Rossi-Hansberg, 2008). This is wrong. The second unbundling transformed the world economy and continues to do so today.
Global supply chains: why they emerged, why they matter, and where they are going
21
Tab
le 1
.2: b
ack
ward
lin
kag
e m
atr
ix f
or
majo
r su
pp
ly c
hain
tra
ders
, 200
7
rep
ort
er
Part
ner
United States
Canada
Mexico
Japan
China
india
indonesia
Korea, rep. of
germany
United Kingdom
italy
France
Spain
Poland
Portugal
brazil
US
18
%3
7%
1%
2%
2%
3%
3%
1%
2%
1%
2%
2%
1%
1%
5%
Can
ada
4%
2%
0%
0%
0%
0%
0%
0%
0%
0%
0%
0%
0%
0%
0%
Mex
ico
2%
1%
0%
0%
0%
0%
0%
0%
0%
0%
0%
1%
0%
0%
1%
Japa
n1
%1
%5
%5
%1
%5
%6
%1
%1
%0
%1
%1
%1
%1
%1
%
Chi
na3
%3
%9
%2
%5
%6
%7
%2
%2
%2
%2
%3
%3
%1
%3
%
Indi
a0
%0
%0
%0
%1
%1
%1
%0
%0
%0
%0
%0
%0
%0
%1
%
Indo
nesi
a0
%0
%0
%2
%1
%1
%1
%0
%0
%0
%0
%0
%0
%0
%0
%
Kor
ea, R
ep. o
f1
%0
%4
%1
%4
%1
%2
%
0%
0%
0%
0%
1%
1%
0%
1%
Ger
man
y1
%1
%3
%0
%1
%2
%2
%1
%
4%
5%
5%
7%
12
%7
%2
%
UK
1%
1%
1%
0%
0%
1%
0%
0%
2%
1%
2%
2%
1%
2%
1%
Italy
0%
0%
1%
0%
0%
1%
1%
0%
1%
1%
3%
4%
3%
3%
1%
Fran
ce0
%0
%1
%0
%0
%0
%1
%0
%2
%2
%3
%5
%2
%4
%1
%
Spa
in0
%0
%1
%0
%0
%0
%0
%0
%1
%1
%1
%2
%1
%1
5%
0%
Pol
and
0%
0%
0%
0%
0%
0%
0%
0%
1%
0%
0%
0%
0%
0%
0%
Por
tuga
l0
%0
%0
%0
%0
%0
%0
%0
%0
%0
%0
%0
%1
%0
%
0%
Bra
zil
0%
0%
1%
0%
1%
0%
0%
0%
0%
0%
0%
0%
0%
0%
1%
Tota
l1
5%
27
%6
5%
8%
16
%1
6%
20
%2
1%
11
%1
3%
16
%1
7%
29
%2
6%
35
%1
6%
Sou
rce:
Aut
hor’s
man
ipul
atio
n of
Lop
ez-G
onzá
lez
(20
12
) da
ta.
Not
e: T
he c
olum
ns s
how
the
inte
rmed
iate
inpu
ts in
tens
ity f
rom
eac
h ro
w n
atio
n, e
.g.,
five
per
cent
of
the
gros
s va
lue
of C
hina
’s e
xpor
ts c
onsi
sts
of in
term
edia
tes
boug
ht f
rom
Jap
an,
whi
le tw
o pe
r ce
nt o
f Ja
pan’
s gr
oss
expo
rts
cons
ist o
f in
term
edia
tes
boug
ht f
rom
Chi
na.
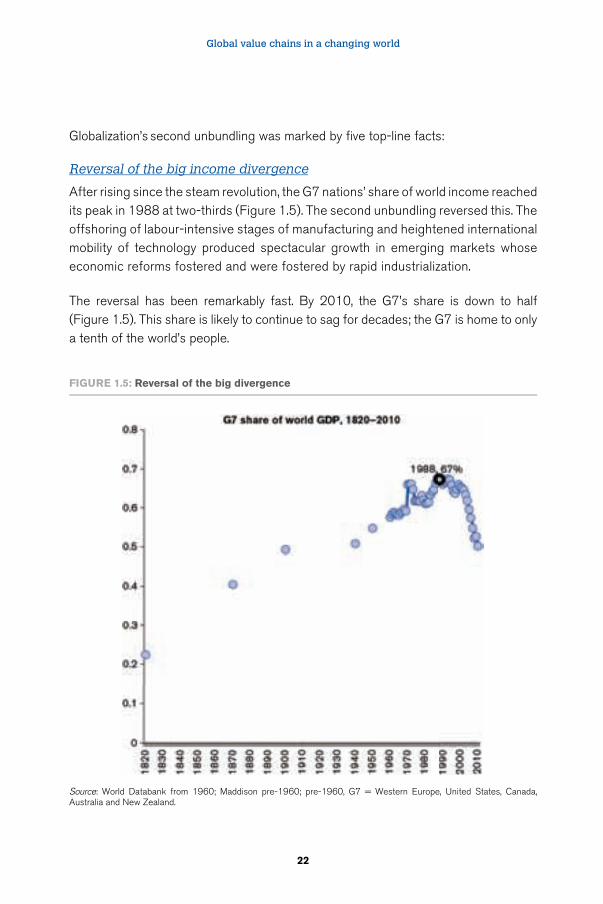
Global value chains in a changing world
22
Globalization’s second unbundling was marked by five top-line facts:
Reversal of the big income divergence
After rising since the steam revolution, the G7 nations’ share of world income reached its peak in 1988 at two-thirds (Figure 1.5). The second unbundling reversed this. The offshoring of labour-intensive stages of manufacturing and heightened international mobility of technology produced spectacular growth in emerging markets whose economic reforms fostered and were fostered by rapid industrialization.
The reversal has been remarkably fast. By 2010, the G7’s share is down to half (Figure 1.5). This share is likely to continue to sag for decades; the G7 is home to only a tenth of the world’s people.
FigUre 1.5: reversal of the big divergence
Source: World Databank from 1960; Maddison pre-1960; pre-1960, G7 = Western Europe, United States, Canada, Australia and New Zealand.
Global supply chains: why they emerged, why they matter, and where they are going
23
This reversal of fortunes is perhaps the most momentous change in the last one hundred years. It is reshaping every aspect of international relations. The “rocket engine” is the rapid industrialization in emerging economies.
South industrialization and North de-industrialization
The second unbundling reversed the 19th and 20th century industrialization/ de-industrialization trend. Since the early 1970s, with a significant pick up in the 1990s, the North has de-industrialized and the South industrialized (Figure 1.6).
De-industrialization is a pervasive trend among developed nations but the South’s rapid industrialization has been driven by the excellent performance of just a dozen nations – all of them heavily involved in international supply chains and most of them in Asia. The performance of Chinese manufacturing alone accounts for much of the reversal.
FigUre 1.6: reversal of industrialization/de-industrialization trend
Source: Author.
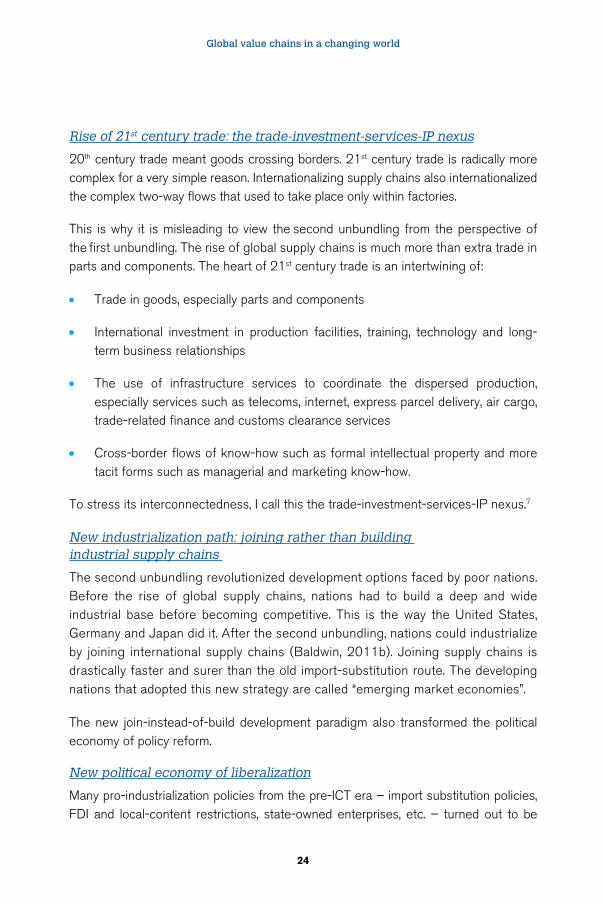
Global value chains in a changing world
24
Rise of 21st century trade: the trade-investment-services-IP nexus
20th century trade meant goods crossing borders. 21st century trade is radically more complex for a very simple reason. Internationalizing supply chains also internationalized the complex two-way flows that used to take place only within factories.
This is why it is misleading to view the second unbundling from the perspective of the first unbundling. The rise of global supply chains is much more than extra trade in parts and components. The heart of 21st century trade is an intertwining of:
• Trade in goods, especially parts and components
• International investment in production facilities, training, technology and long-term business relationships
• The use of infrastructure services to coordinate the dispersed production, especially services such as telecoms, internet, express parcel delivery, air cargo, trade-related finance and customs clearance services
• Cross-border flows of know-how such as formal intellectual property and more tacit forms such as managerial and marketing know-how.
To stress its interconnectedness, I call this the trade-investment-services-IP nexus.7
New industrialization path: joining rather than building industrial supply chains
The second unbundling revolutionized development options faced by poor nations. Before the rise of global supply chains, nations had to build a deep and wide industrial base before becoming competitive. This is the way the United States, Germany and Japan did it. After the second unbundling, nations could industrialize by joining international supply chains (Baldwin, 2011b). Joining supply chains is drastically faster and surer than the old import-substitution route. The developing nations that adopted this new strategy are called “emerging market economies”.
The new join-instead-of-build development paradigm also transformed the political economy of policy reform.
New political economy of liberalization
Many pro-industrialization policies from the pre-ICT era – import substitution policies, FDI and local-content restrictions, state-owned enterprises, etc. – turned out to be
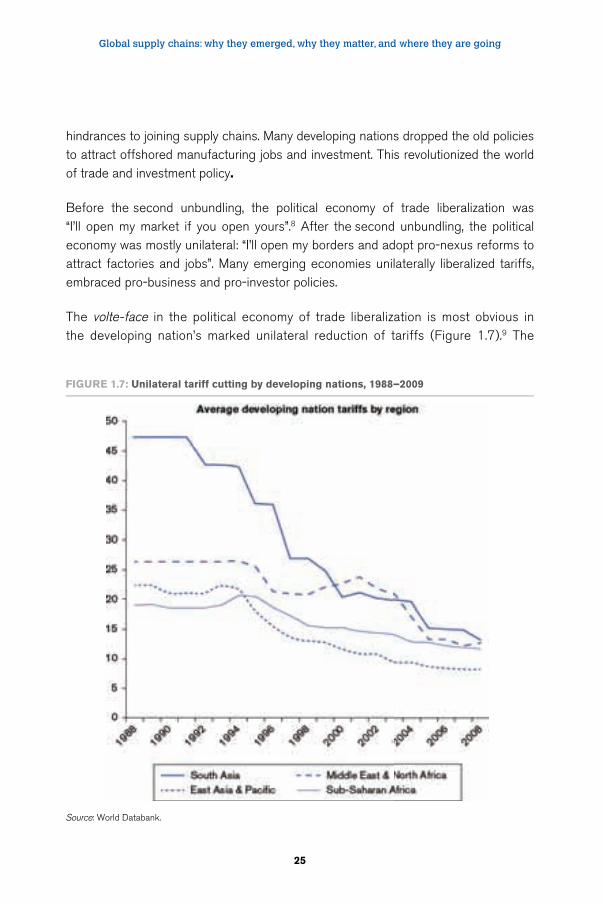
Global supply chains: why they emerged, why they matter, and where they are going
25
hindrances to joining supply chains. Many developing nations dropped the old policies to attract offshored manufacturing jobs and investment. This revolutionized the world of trade and investment policy.
Before the second unbundling, the political economy of trade liberalization was “I’ll open my market if you open yours”.8 After the second unbundling, the political economy was mostly unilateral: “I’ll open my borders and adopt pro-nexus reforms to attract factories and jobs”. Many emerging economies unilaterally liberalized tariffs, embraced pro-business and pro-investor policies.
The volte-face in the political economy of trade liberalization is most obvious in the developing nation’s marked unilateral reduction of tariffs (Figure 1.7).9 The
FigUre 1.7: Unilateral tariff cutting by developing nations, 1988–2009
Source: World Databank.
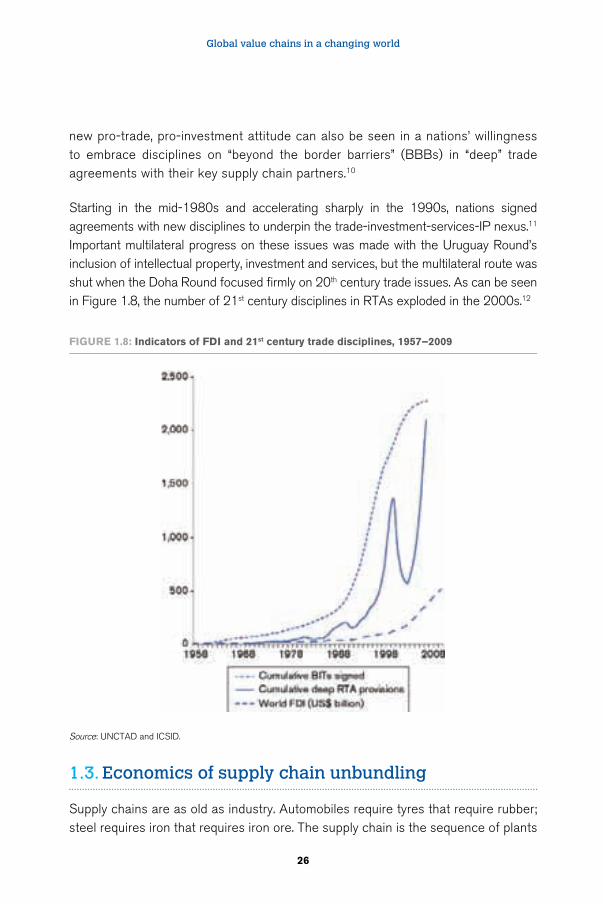
Global value chains in a changing world
26
new pro-trade, pro-investment attitude can also be seen in a nations’ willingness to embrace disciplines on “beyond the border barriers” (BBBs) in “deep” trade agreements with their key supply chain partners.10
Starting in the mid-1980s and accelerating sharply in the 1990s, nations signed agreements with new disciplines to underpin the trade-investment-services-IP nexus.11 Important multilateral progress on these issues was made with the Uruguay Round’s inclusion of intellectual property, investment and services, but the multilateral route was shut when the Doha Round focused firmly on 20th century trade issues. As can be seen in Figure 1.8, the number of 21st century disciplines in RTAs exploded in the 2000s.12
FigUre 1.8: indicators of FDi and 21st century trade disciplines, 1957–2009
Source: UNCTAD and ICSID.
1.3. Economics of supply chain unbundling
Supply chains are as old as industry. Automobiles require tyres that require rubber; steel requires iron that requires iron ore. The supply chain is the sequence of plants
Global supply chains: why they emerged, why they matter, and where they are going
27
that provide these inputs. The value chain is a broader concept popularized by Michael Porter.
Porter thought that firms spent too much time and money performing stages and support activities where they had no competitive advantage (Porter, 1985). This is why Porter squeezed the supply chain into a single stage, “operations”, while breaking out pre- and post-fabrication stages, and support activities. Porter’s main thought was to apply the Ricardian principle of comparative advantage to firm’s value chains. He told firms to focus on what they do best and to outsource for the rest. Porter is not the right framework for thinking about value chains in 2012 – largely because most firms followed Porter’s advice.
Globalization’s second unbundling shifted the locus of globalization from sectors to stages of production. This requires an analytic focus on supply chains. The economics of this change is best looked at by decomposing it into two phenomena: fractionalization and dispersion.
• Fractionalization concerns the unbundling of supply of chains into finer stages of production
• Dispersion concerns the geographic unbundling of stages
Supply chain unbundling: the functional dimension
To consider why ICT improvements lead to the unbundling of production, it is useful to view the supply chain at four levels of aggregation: products, stages, occupations, and tasks (Figure 1.9). At the bottom is the product, which is conceived of as including after sales services. At the top are tasks – the full list of everything that must be done to get the product into consumers’ hands and provide them with associated after-sales services.
One natural intermediate aggregation is “occupation” – the group of tasks performed by an individual worker. Stages – defined as a collection of occupations that are performed in close proximity due to the need for face-to-face interaction and the fragility of the partially processed goods – are the critical level of aggregation since supply chain internationalization typically involves the offshoring of stages rather than individual occupations or individual tasks.
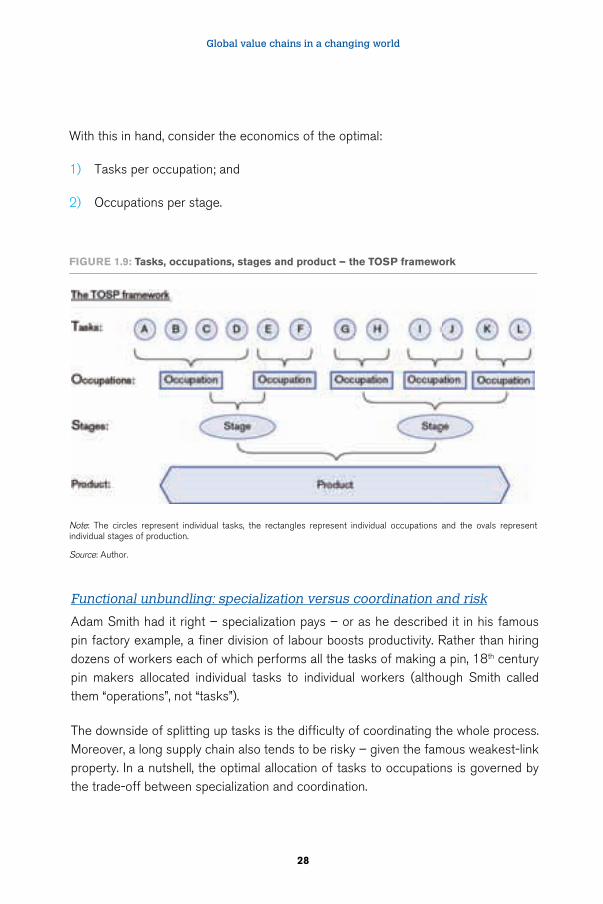
Global value chains in a changing world
28
FigUre 1.9: Tasks, occupations, stages and product – the TOSP framework
Note: The circles represent individual tasks, the rectangles represent individual occupations and the ovals represent individual stages of production.
Source: Author.
With this in hand, consider the economics of the optimal:
1) Tasks per occupation; and
2) Occupations per stage.
Functional unbundling: specialization versus coordination and risk
Adam Smith had it right – specialization pays – or as he described it in his famous pin factory example, a finer division of labour boosts productivity. Rather than hiring dozens of workers each of which performs all the tasks of making a pin, 18th century pin makers allocated individual tasks to individual workers (although Smith called them “operations”, not “tasks”).
The downside of splitting up tasks is the difficulty of coordinating the whole process. Moreover, a long supply chain also tends to be risky – given the famous weakest-link property. In a nutshell, the optimal allocation of tasks to occupations is governed by the trade-off between specialization and coordination.
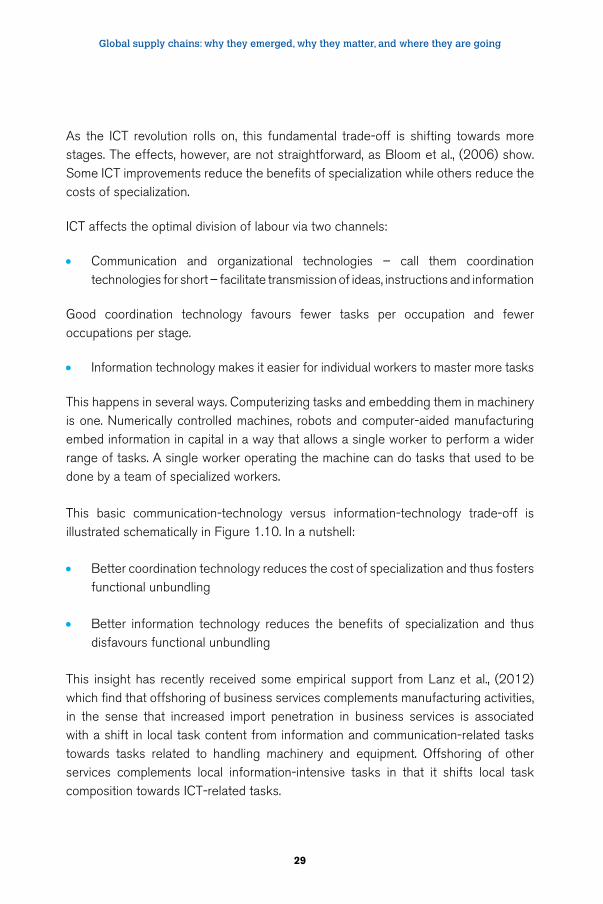
Global supply chains: why they emerged, why they matter, and where they are going
29
As the ICT revolution rolls on, this fundamental trade-off is shifting towards more stages. The effects, however, are not straightforward, as Bloom et al., (2006) show. Some ICT improvements reduce the benefits of specialization while others reduce the costs of specialization.
ICT affects the optimal division of labour via two channels:
• Communication and organizational technologies – call them coordination technologies for short – facilitate transmission of ideas, instructions and information
Good coordination technology favours fewer tasks per occupation and fewer occupations per stage.
• Information technology makes it easier for individual workers to master more tasks
This happens in several ways. Computerizing tasks and embedding them in machinery is one. Numerically controlled machines, robots and computer-aided manufacturing embed information in capital in a way that allows a single worker to perform a wider range of tasks. A single worker operating the machine can do tasks that used to be done by a team of specialized workers.
This basic communication-technology versus information-technology trade-off is illustrated schematically in Figure 1.10. In a nutshell:
• Better coordination technology reduces the cost of specialization and thus fosters functional unbundling
• Better information technology reduces the benefits of specialization and thus disfavours functional unbundling
This insight has recently received some empirical support from Lanz et al., (2012) which find that offshoring of business services complements manufacturing activities, in the sense that increased import penetration in business services is associated with a shift in local task content from information and communication-related tasks towards tasks related to handling machinery and equipment. Offshoring of other services complements local information-intensive tasks in that it shifts local task composition towards ICT-related tasks.
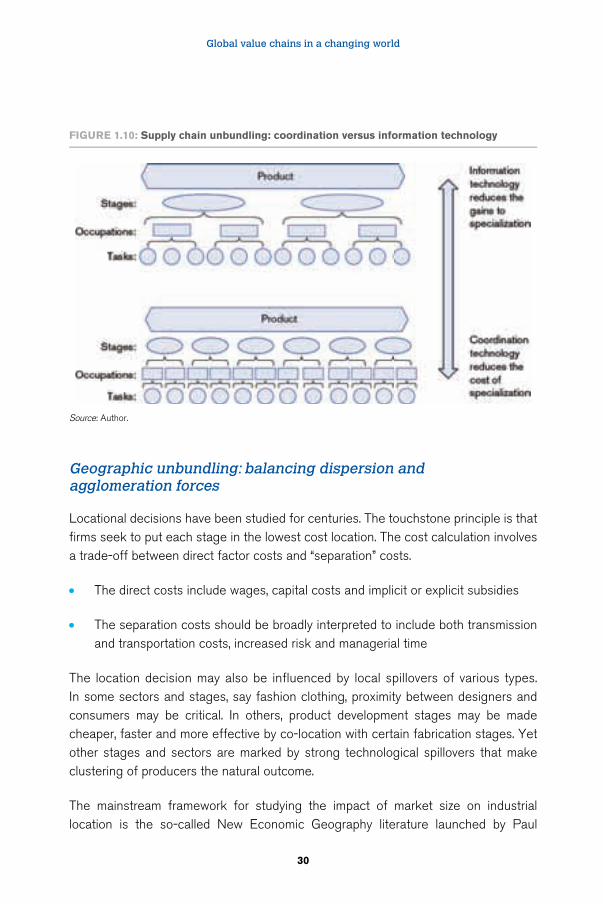
Global value chains in a changing world
30
Geographic unbundling: balancing dispersion and agglomeration forces
Locational decisions have been studied for centuries. The touchstone principle is that firms seek to put each stage in the lowest cost location. The cost calculation involves a trade-off between direct factor costs and “separation” costs.
• The direct costs include wages, capital costs and implicit or explicit subsidies
• The separation costs should be broadly interpreted to include both transmission and transportation costs, increased risk and managerial time
The location decision may also be influenced by local spillovers of various types. In some sectors and stages, say fashion clothing, proximity between designers and consumers may be critical. In others, product development stages may be made cheaper, faster and more effective by co-location with certain fabrication stages. Yet other stages and sectors are marked by strong technological spillovers that make clustering of producers the natural outcome.
The mainstream framework for studying the impact of market size on industrial location is the so-called New Economic Geography literature launched by Paul
FigUre 1.10: Supply chain unbundling: coordination versus information technology
Source: Author.
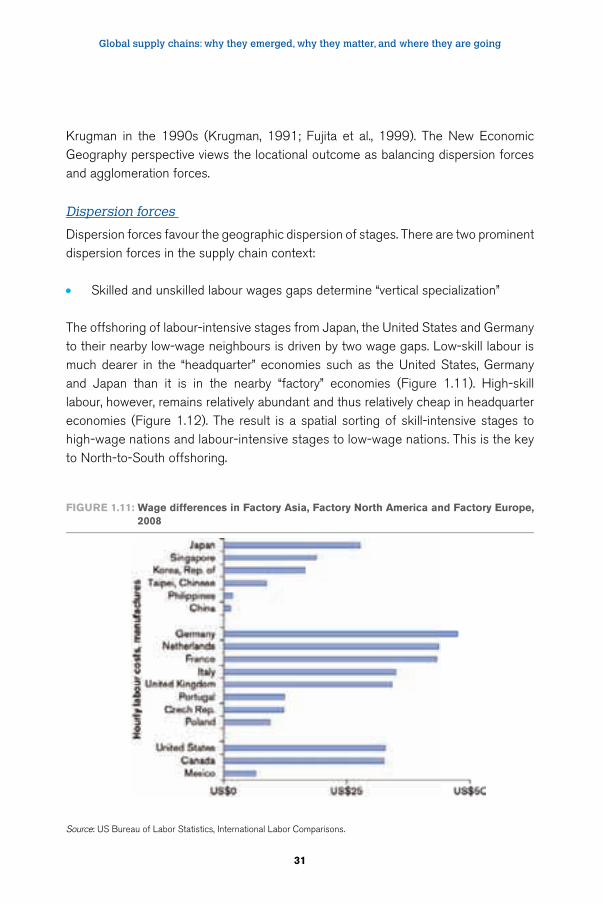
Global supply chains: why they emerged, why they matter, and where they are going
31
Krugman in the 1990s (Krugman, 1991; Fujita et al., 1999). The New Economic Geography perspective views the locational outcome as balancing dispersion forces and agglomeration forces.
Dispersion forces
Dispersion forces favour the geographic dispersion of stages. There are two prominent dispersion forces in the supply chain context:
• Skilled and unskilled labour wages gaps determine “vertical specialization”
The offshoring of labour-intensive stages from Japan, the United States and Germany to their nearby low-wage neighbours is driven by two wage gaps. Low-skill labour is much dearer in the “headquarter” economies such as the United States, Germany and Japan than it is in the nearby “factory” economies (Figure 1.11). High-skill labour, however, remains relatively abundant and thus relatively cheap in headquarter economies (Figure 1.12). The result is a spatial sorting of skill-intensive stages to high-wage nations and labour-intensive stages to low-wage nations. This is the key to North-to-South offshoring.
FigUre 1.11: Wage differences in Factory asia, Factory North america and Factory europe, 2008
Source: US Bureau of Labor Statistics, International Labor Comparisons.
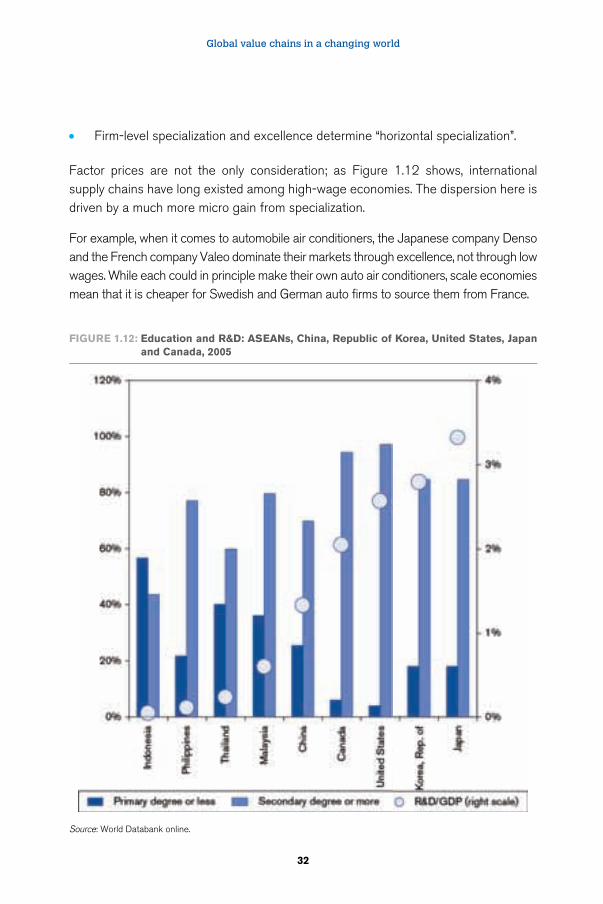
Global value chains in a changing world
32
• Firm-level specialization and excellence determine “horizontal specialization”.
Factor prices are not the only consideration; as Figure 1.12 shows, international supply chains have long existed among high-wage economies. The dispersion here is driven by a much more micro gain from specialization.
For example, when it comes to automobile air conditioners, the Japanese company Denso and the French company Valeo dominate their markets through excellence, not through low wages. While each could in principle make their own auto air conditioners, scale economies mean that it is cheaper for Swedish and German auto firms to source them from France.
FigUre 1.12: education and r&D: aSeaNs, China, republic of Korea, United States, Japan and Canada, 2005
Source: World Databank online.
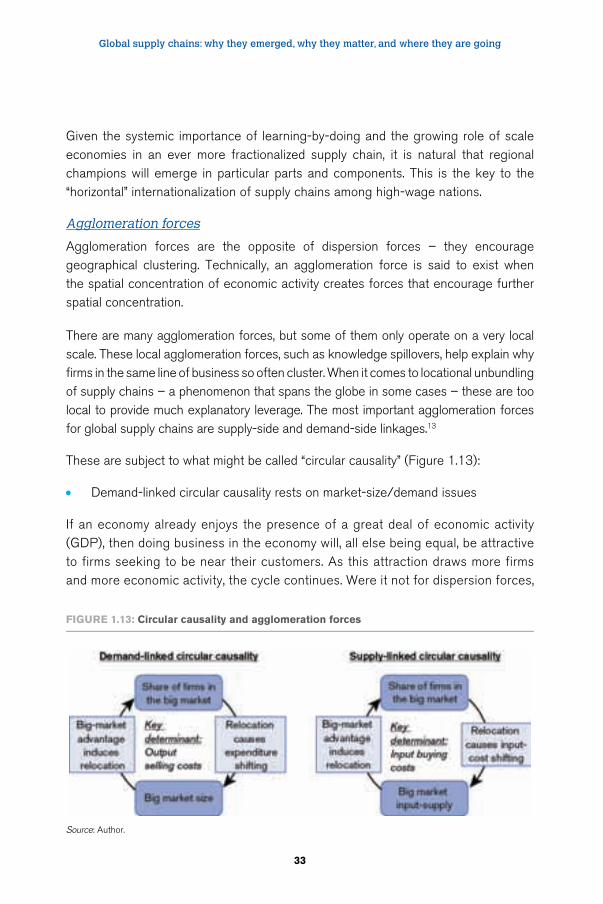
Global supply chains: why they emerged, why they matter, and where they are going
33
Given the systemic importance of learning-by-doing and the growing role of scale economies in an ever more fractionalized supply chain, it is natural that regional champions will emerge in particular parts and components. This is the key to the “horizontal” internationalization of supply chains among high-wage nations.
Agglomeration forces
Agglomeration forces are the opposite of dispersion forces – they encourage geographical clustering. Technically, an agglomeration force is said to exist when the spatial concentration of economic activity creates forces that encourage further spatial concentration.
There are many agglomeration forces, but some of them only operate on a very local scale. These local agglomeration forces, such as knowledge spillovers, help explain why firms in the same line of business so often cluster. When it comes to locational unbundling of supply chains – a phenomenon that spans the globe in some cases – these are too local to provide much explanatory leverage. The most important agglomeration forces for global supply chains are supply-side and demand-side linkages.13
These are subject to what might be called “circular causality” (Figure 1.13):
• Demand-linked circular causality rests on market-size/demand issues
If an economy already enjoys the presence of a great deal of economic activity (GDP), then doing business in the economy will, all else being equal, be attractive to firms seeking to be near their customers. As this attraction draws more firms and more economic activity, the cycle continues. Were it not for dispersion forces,
FigUre 1.13: Circular causality and agglomeration forces
Source: Author.
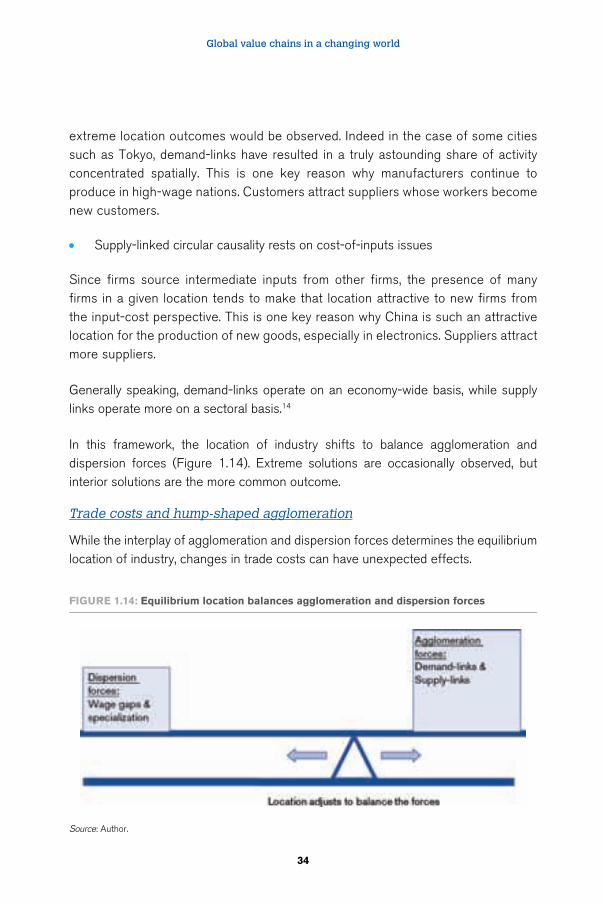
Global value chains in a changing world
34
extreme location outcomes would be observed. Indeed in the case of some cities such as Tokyo, demand-links have resulted in a truly astounding share of activity concentrated spatially. This is one key reason why manufacturers continue to produce in high-wage nations. Customers attract suppliers whose workers become new customers.
• Supply-linked circular causality rests on cost-of-inputs issues
Since firms source intermediate inputs from other firms, the presence of many firms in a given location tends to make that location attractive to new firms from the input-cost perspective. This is one key reason why China is such an attractive location for the production of new goods, especially in electronics. Suppliers attract more suppliers.
Generally speaking, demand-links operate on an economy-wide basis, while supply links operate more on a sectoral basis.14
In this framework, the location of industry shifts to balance agglomeration and dispersion forces (Figure 1.14). Extreme solutions are occasionally observed, but interior solutions are the more common outcome.
Trade costs and hump-shaped agglomeration
While the interplay of agglomeration and dispersion forces determines the equilibrium location of industry, changes in trade costs can have unexpected effects.
FigUre 1.14: equilibrium location balances agglomeration and dispersion forces
Source: Author.
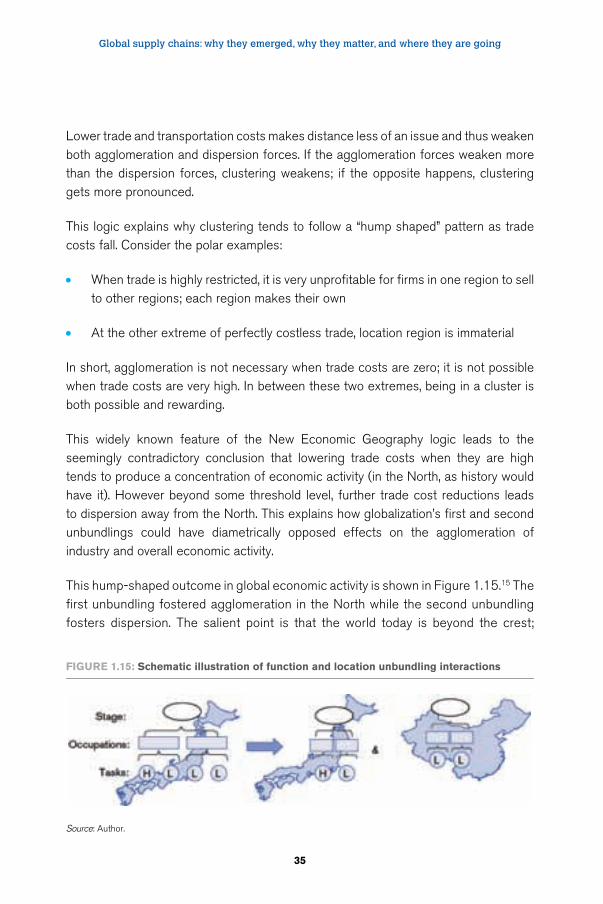
Global supply chains: why they emerged, why they matter, and where they are going
35
Lower trade and transportation costs makes distance less of an issue and thus weaken both agglomeration and dispersion forces. If the agglomeration forces weaken more than the dispersion forces, clustering weakens; if the opposite happens, clustering gets more pronounced.
This logic explains why clustering tends to follow a “hump shaped” pattern as trade costs fall. Consider the polar examples:
• When trade is highly restricted, it is very unprofitable for firms in one region to sell to other regions; each region makes their own
• At the other extreme of perfectly costless trade, location region is immaterial
In short, agglomeration is not necessary when trade costs are zero; it is not possible when trade costs are very high. In between these two extremes, being in a cluster is both possible and rewarding.
This widely known feature of the New Economic Geography logic leads to the seemingly contradictory conclusion that lowering trade costs when they are high tends to produce a concentration of economic activity (in the North, as history would have it). However beyond some threshold level, further trade cost reductions leads to dispersion away from the North. This explains how globalization’s first and second unbundlings could have diametrically opposed effects on the agglomeration of industry and overall economic activity.
This hump-shaped outcome in global economic activity is shown in Figure 1.15.15 The first unbundling fostered agglomeration in the North while the second unbundling fosters dispersion. The salient point is that the world today is beyond the crest;
FigUre 1.15: Schematic illustration of function and location unbundling interactions
Source: Author.
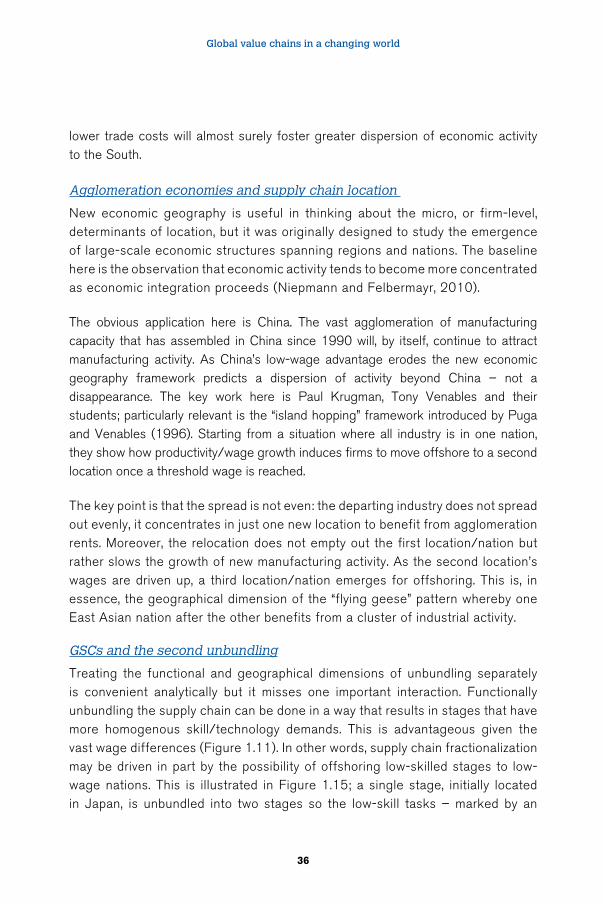
Global value chains in a changing world
36
lower trade costs will almost surely foster greater dispersion of economic activity to the South.
Agglomeration economies and supply chain location
New economic geography is useful in thinking about the micro, or firm-level, determinants of location, but it was originally designed to study the emergence of large-scale economic structures spanning regions and nations. The baseline here is the observation that economic activity tends to become more concentrated as economic integration proceeds (Niepmann and Felbermayr, 2010).
The obvious application here is China. The vast agglomeration of manufacturing capacity that has assembled in China since 1990 will, by itself, continue to attract manufacturing activity. As China’s low-wage advantage erodes the new economic geography framework predicts a dispersion of activity beyond China – not a disappearance. The key work here is Paul Krugman, Tony Venables and their students; particularly relevant is the “island hopping” framework introduced by Puga and Venables (1996). Starting from a situation where all industry is in one nation, they show how productivity/wage growth induces firms to move offshore to a second location once a threshold wage is reached.
The key point is that the spread is not even: the departing industry does not spread out evenly, it concentrates in just one new location to benefit from agglomeration rents. Moreover, the relocation does not empty out the first location/nation but rather slows the growth of new manufacturing activity. As the second location’s wages are driven up, a third location/nation emerges for offshoring. This is, in essence, the geographical dimension of the “flying geese” pattern whereby one East Asian nation after the other benefits from a cluster of industrial activity.
GSCs and the second unbundling
Treating the functional and geographical dimensions of unbundling separately is convenient analytically but it misses one important interaction. Functionally unbundling the supply chain can be done in a way that results in stages that have more homogenous skill/technology demands. This is advantageous given the vast wage differences (Figure 1.11). In other words, supply chain fractionalization may be driven in part by the possibility of offshoring low-skilled stages to low-wage nations. This is illustrated in Figure 1.15; a single stage, initially located in Japan, is unbundled into two stages so the low-skill tasks – marked by an
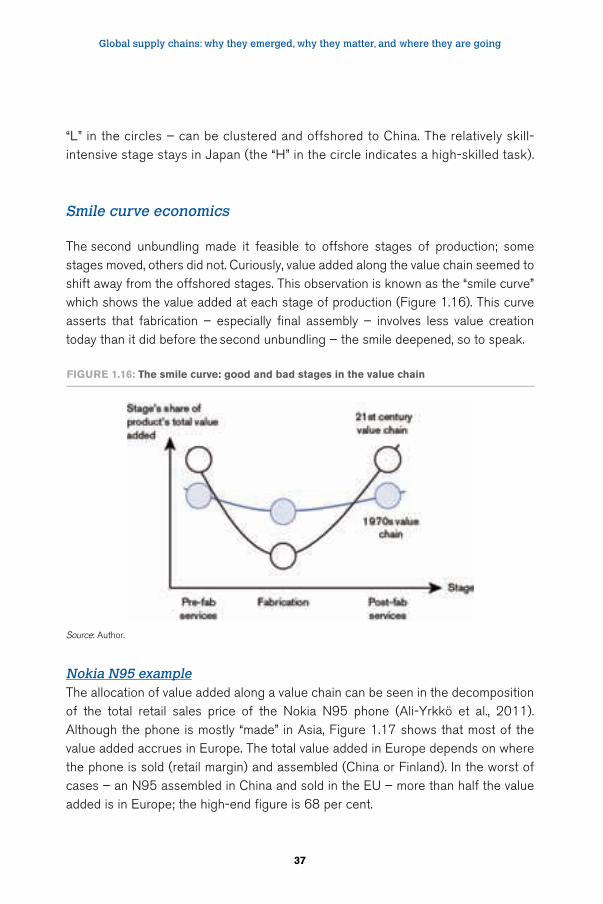
Global supply chains: why they emerged, why they matter, and where they are going
37
“L” in the circles – can be clustered and offshored to China. The relatively skill-intensive stage stays in Japan (the “H” in the circle indicates a high-skilled task).
Smile curve economics
The second unbundling made it feasible to offshore stages of production; some stages moved, others did not. Curiously, value added along the value chain seemed to shift away from the offshored stages. This observation is known as the “smile curve” which shows the value added at each stage of production (Figure 1.16). This curve asserts that fabrication – especially final assembly – involves less value creation today than it did before the second unbundling – the smile deepened, so to speak.
Nokia N95 exampleThe allocation of value added along a value chain can be seen in the decomposition of the total retail sales price of the Nokia N95 phone (Ali-Yrkkö et al., 2011). Although the phone is mostly “made” in Asia, Figure 1.17 shows that most of the value added accrues in Europe. The total value added in Europe depends on where the phone is sold (retail margin) and assembled (China or Finland). In the worst of cases – an N95 assembled in China and sold in the EU – more than half the value added is in Europe; the high-end figure is 68 per cent.
FigUre 1.16: The smile curve: good and bad stages in the value chain
Source: Author.
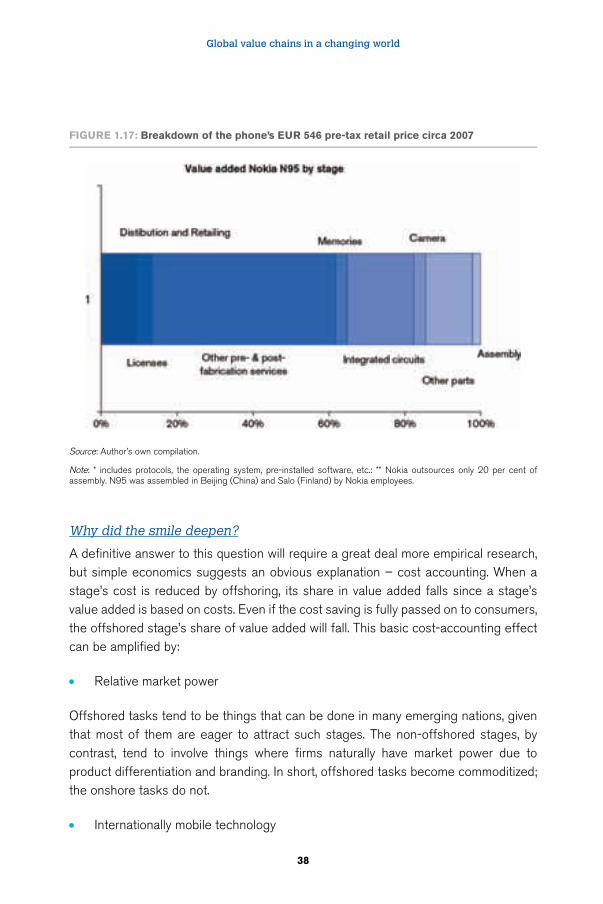
Global value chains in a changing world
38
Why did the smile deepen?
A definitive answer to this question will require a great deal more empirical research, but simple economics suggests an obvious explanation – cost accounting. When a stage’s cost is reduced by offshoring, its share in value added falls since a stage’s value added is based on costs. Even if the cost saving is fully passed on to consumers, the offshored stage’s share of value added will fall. This basic cost-accounting effect can be amplified by:
• Relative market power
Offshored tasks tend to be things that can be done in many emerging nations, given that most of them are eager to attract such stages. The non-offshored stages, by contrast, tend to involve things where firms naturally have market power due to product differentiation and branding. In short, offshored tasks become commoditized; the onshore tasks do not.
• Internationally mobile technology
FigUre 1.17: breakdown of the phone’s eUr 546 pre-tax retail price circa 2007
Source: Author’s own compilation.
Note: * includes protocols, the operating system, pre-installed software, etc.: ** Nokia outsources only 20 per cent of assembly. N95 was assembled in Beijing (China) and Salo (Finland) by Nokia employees.
Global supply chains: why they emerged, why they matter, and where they are going
39
If the offshoring firm moves its advanced technology to the offshore location, it drives down the cost of the offshored task even more. As before, this automatically shifts value to the non-offshored tasks.
Smiles and good jobs
Smile curve economics suggests that the fabrication stages in manufacturing may not be the development panacea as they once were. Global supply chains made industrialization faster and easier (the supply chain made industry less lumpy). Industrialization became less meaningful for the same reasons. For example, that the Republic of Korea could export domestically designed car engines was testimony to its rich-nation status. Now, exporting sophisticated manufactured goods is no longer the hallmark of having arrived. It may simply reflect a nation’s position in a global supply chain.
This observation calls for a good deal more thinking on the role of manufacturing in development strategies (Baldwin, 2011b). After all, the originator of the smile-curve concept used it to argue for a need to diversify away from fabrication.
As far as the evolution of GSCs is concerned, it is important to note that the pre- and post-fabrication stages consist primarily of services rather than goods. As such, shifting the location of such stages will have a first-order impact on the pattern of transmission, not transportation. Of course a second order impact (location of fabrication influenced by location of design) is likely, but determinants of comparative advantage in pre- and post-fabrication service are quite different from fabrication, and the cost of transmitting these services is quite low. This suggests that shifts in the pre- and post-fabrication stages will not have a major impact on supply chain trade patterns when it comes to goods.
1.4. What it means for policy
As mentioned above, 21st century trade – or more precisely 21st century international commerce – is a richer, more complex, more interconnected set of cross-border flows of goods, investment, technology, services, technicians, managers and capital. This transformed policy making globally, first by creating new supply and new demand for deeper disciplines, and second by creating a bond among various strands of policymaking, some of which were always viewed as international but many are traditionally viewed as domestic policy issues.
Global value chains in a changing world
40
This section considers the implications of global supply chains for global economic policy; it draws on Baldwin (2012) and Gereffi et al., (2005).
The nexus: more interconnected policy
The quantum leap in complexity and interconnectedness has had momentous implications for world trade governance – shifting it sharply towards regionalism and eroding WTO centrality. Before turning to these points, it is worth pointing out that there is nothing really new here. The basic challenge of supply chain trade and the basic response of deeper, regional disciplines has been a feature of global governance for a half century.
Before the second unbundling really got going in the late 1980s, most trade was simple. It could be governed by simple regulations like the GATT 1947 (less than 100 pages long). The GATT rules, however, were not sufficient for the cross-border relations where supply chains were an issue in the 1960s and 1970s. As Figure 1.13 shows, some trade relations back then were marked by supply chain trade and so was the need for deeper-than-GATT disciplines. In response, North Atlantic nations set up deeper disciplines. Since the trade was regional rather than multilateral, the deeper disciplines were placed in regional trade agreements. The 1965 US-Canada Auto Pact, which regulated trade and investment in the auto sector, is a classic example.
The Auto Pact was a clear violation of GATT rules (Article XXIV) but US officials argued that the Pact “was designed to promote trade and economic efficiency within this single industry by bringing about such reallocation of production between the two countries as would permit Canada to achieve substantial economies of scale on some components and some models, while abandoning others.”16 It is hard to think of a clearer statement of the goals of the North-North trade-investment nexus.
The European Economic Community, as the EU was known at the time, simi-larly sought much deeper disciplines. This, however, was not aimed at underpin-ning existing, complex cross-border activity. It was aimed at creating it. The Euro-pean founders viewed an ever-closer economic integration as the only sure-fire means of avoiding another European war.17 As Figure 1.15 shows, it worked.
The history lesson here is simple. Complex cross-border flows demand complex rules. Since most complex trade is regional, there is a strong tendency to establish
Global supply chains: why they emerged, why they matter, and where they are going
41
the necessary complex rules at a regional rather than multilateral level. Multilateral rules would almost surely have been more efficient, but negotiating them in the GATT would have been too cumbersome and slow; most GATT members were not involved in this type of international commerce.
Which new disciplines are needed?
The trade-investment-services-IP nexus creates a need for two new types of disciplines. These correspond to the two new elements of the associated international commerce.
• First, supply chain trade often involves producing abroad, either directly or via long-term relationships with independent suppliers
This is basically the investment and intellectual property part – setting up business abroad is an essential part of 21st century trade. This means that barriers to doing business abroad are now trade barriers. Likewise, much of the internationalization of supply chains involves overseas application of a firm’s advanced know-how. A lack of intellectual property (IP) protection therefore becomes a barrier to trade.
• Second, production among the facilities must be coordinated and this involves the two-way flow of goods, services, people, capital, and training
Barriers to these flows are now barriers to trade. Note that traditional trade barriers are part of this, but the list is much longer as the cross-border flows are more complex (express mail, air cargo, trade financing and insurance, business mobility).
One good source of the necessary disciplines is the deep regional trade agreements that have been signed among nations where the trade-investment-services-IP nexus trade is important. Following a procedure established by Horn et al., (2009), the WTO recently created a database of deeper disciplines in all the RTAs announced to the WTO by 2010. While the data covers over 50 measures, few of these occur frequently enough to be important. Table 1.3 shows a selection of deeper-than-GATT disciplines that appear frequently in modern trade agreements. The term “WTO-plus” applies to issues that are covered by WTO discipline but where the RTA involves commitments that go further. The “WTO-X” term applies to disciplines that are not mentioned in WTO agreements, so the RTA provisions are creating new rules rather than extending or deepening existing disciplines.
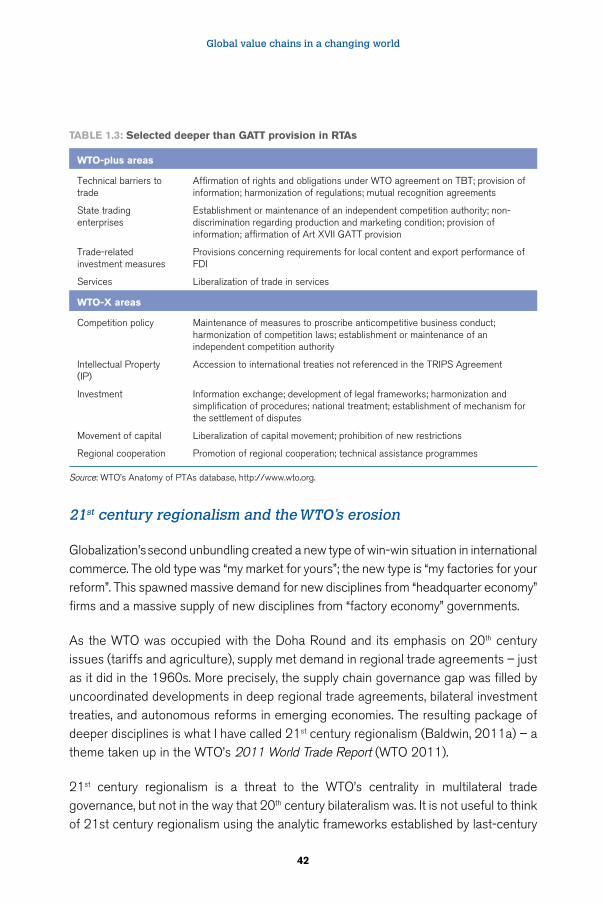
Global value chains in a changing world
42
21st century regionalism and the WTO’s erosion
Globalization’s second unbundling created a new type of win-win situation in international commerce. The old type was “my market for yours”; the new type is “my factories for your reform”. This spawned massive demand for new disciplines from “headquarter economy” firms and a massive supply of new disciplines from “factory economy” governments.
As the WTO was occupied with the Doha Round and its emphasis on 20th century issues (tariffs and agriculture), supply met demand in regional trade agreements – just as it did in the 1960s. More precisely, the supply chain governance gap was filled by uncoordinated developments in deep regional trade agreements, bilateral investment treaties, and autonomous reforms in emerging economies. The resulting package of deeper disciplines is what I have called 21st century regionalism (Baldwin, 2011a) – a theme taken up in the WTO’s 2011 World Trade Report (WTO 2011).
21st century regionalism is a threat to the WTO’s centrality in multilateral trade governance, but not in the way that 20th century bilateralism was. It is not useful to think of 21st century regionalism using the analytic frameworks established by last-century
Table 1.3: Selected deeper than gaTT provision in rTas
WTO-plus areas
Technical barriers to trade
Affirmation of rights and obligations under WTO agreement on TBT; provision of information; harmonization of regulations; mutual recognition agreements
State trading enterprises
Establishment or maintenance of an independent competition authority; non-discrimination regarding production and marketing condition; provision of information; affirmation of Art XVII GATT provision
Trade-related investment measures
Provisions concerning requirements for local content and export performance of FDI
Services Liberalization of trade in services
WTO-X areas
Competition policy Maintenance of measures to proscribe anticompetitive business conduct; harmonization of competition laws; establishment or maintenance of an independent competition authority
Intellectual Property (IP)
Accession to international treaties not referenced in the TRIPS Agreement
Investment Information exchange; development of legal frameworks; harmonization and simplification of procedures; national treatment; establishment of mechanism for the settlement of disputes
Movement of capital Liberalization of capital movement; prohibition of new restrictions
Regional cooperation Promotion of regional cooperation; technical assistance programmes
Source: WTO’s Anatomy of PTAs database, http://www.wto.org.
Global supply chains: why they emerged, why they matter, and where they are going
43
thinkers like Jagdish Bhagwati when regionalism was mostly about tariff preferences. In fact, 21st century regionalism is not primarily about preferential market access as WTO (2011 Chapter B) demonstrates convincingly. Instead, 21st century regionalism is about disciplines that underpin the trade-investment-service-IP nexus. Because of this, 21st century regionalism is a threat to the WTO’s role as a rule writer, not as a tariff cutter.
Stepping from “what is” towards “what should be”, it is absolutely clear that the optimal governance solution for global supply chains would be global, not regional. Indeed the firms conducting much of this 21st century trade find themselves faced with a spaghetti bowl of disciplines – although this is tamed by the fact that the United States, Japan and the EU have established a system of hub-and-spoke bilateral agreements that tends to reduce conflicts for firms located in a hub. The real problem concerns the spokes such as Mexico that have deep agreements with the EU, Japan and the United States.
1.5. Future of GSCs
The future of global supply chains will be moulded by the answers to three questions:
• Will supply chains become more fractionalized?
• Will stages of production become more polarized in terms of skill, capital and technology intensity?
• Will stages of production be further dispersed and interconnected internationally?
Fractionalization of the supply chain is determined by the interplay between the gains from specialization and cost of coordination and risk (see Section 1.3). The specialization gains come from scale economies and learning-by-doing as well as from a heightened ability to place each stage in a nation with the most appropriate wage structure. Coordination and risk costs come from the extra difficulty and expense of managing spatially distributed stages. Unbundling along the functional dimension will be directed by changes in these costs and benefits of fractionalization.
Polarization of stages is determined by the costs and benefits of computerization and robotization of manufacturing. Broad advances in information technology will largely govern the future course on this issue.
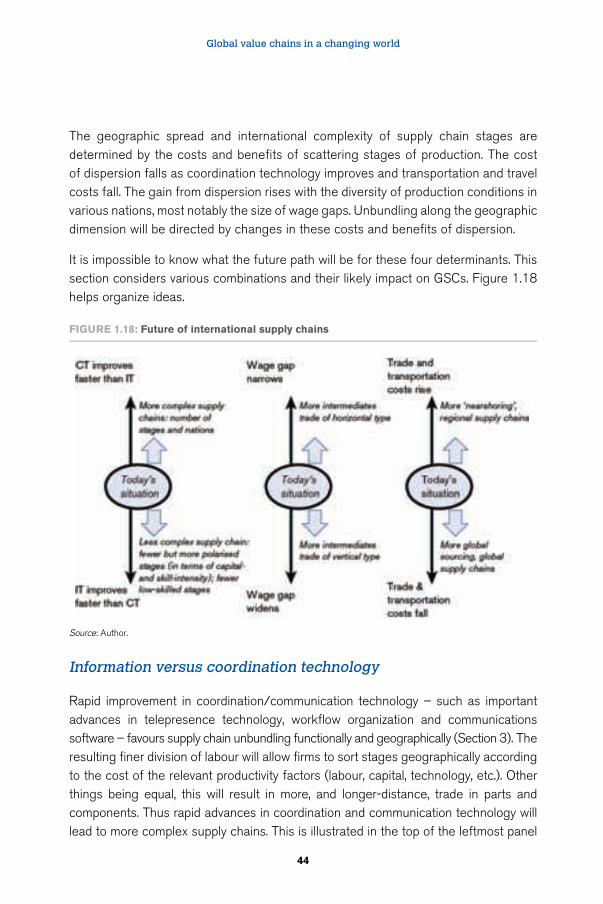
Global value chains in a changing world
44
The geographic spread and international complexity of supply chain stages are determined by the costs and benefits of scattering stages of production. The cost of dispersion falls as coordination technology improves and transportation and travel costs fall. The gain from dispersion rises with the diversity of production conditions in various nations, most notably the size of wage gaps. Unbundling along the geographic dimension will be directed by changes in these costs and benefits of dispersion.
It is impossible to know what the future path will be for these four determinants. This section considers various combinations and their likely impact on GSCs. Figure 1.18 helps organize ideas.
Information versus coordination technology
Rapid improvement in coordination/communication technology – such as important advances in telepresence technology, workflow organization and communications software – favours supply chain unbundling functionally and geographically (Section 3). The resulting finer division of labour will allow firms to sort stages geographically according to the cost of the relevant productivity factors (labour, capital, technology, etc.). Other things being equal, this will result in more, and longer-distance, trade in parts and components. Thus rapid advances in coordination and communication technology will lead to more complex supply chains. This is illustrated in the top of the leftmost panel
FigUre 1.18: Future of international supply chains
Source: Author.
Global supply chains: why they emerged, why they matter, and where they are going
45
of Figure 1.18. Box 1.1 discusses a number of radical technological breakthroughs that might have important implications for the future of global supply chains.
Better information technology, by contrast, favours the bundling of many tasks into the ambit of individual workers. This will typically result in broader occupations and few separate stages of production. Other things being equal, this would tend to reduce international trade in parts and components.
Better information technology also tends to polarize stages of production. As routine, low-skill, and repetitive tasks are easier to computerize and robotize, the information-technology-led bundling will typically eliminate occupations that involve such tasks. At the same time, the more intensive use of sophisticated production machines will make the remaining jobs more skill-, capital- and technology-intensive. This leads to a polarization of stages in terms of skill-content. Routine low-skill tasks are bundled into high-skill occupations while the remaining low-skill tasks will typically be highly labour-intensive but less routine. The resulting, broader stages will involve more capital-intensive, more technology-intensive and more skill-intensive processes. This tends to favour production in high-wage nations (see the bottom of the leftmost panel in the figure).
box 1.1: extreme CT: telepresence, remote surgery and the death of meetings
Another revolutionary development would radically reduce the need for technicians and managers to travel to remote factories. Products such as Cisco’s Telepresence already reduce the need for face-to-face meetings in the service sector. If such technology were combined with human controlled robots of the type used today in operating rooms (e.g., Intuitive Surgical’s da Vinci Surgical System), technicians could conduct inspections or undertake repairs from remote locations.
This is not science fiction. The US military already operates many of its drone aircraft in West Asia from bases in the United States. A company called Remote Presences does underwater survey, inspection and recovery using Remotely Operated Vehicles. And some US hospitals are using remote presence robots to leverage the time of doctors across hospitals (see video http://www.youtube.com/watch?v=qRx7CdseGsQ).
The implications of this would be to de-regionalize supply chains, at least to the extent that the time-cost of travel was a significant consideration in offshoring locations.

Global value chains in a changing world
46
Box 1.2 discusses some futuristic IT developments that might have a large impact on supply chains.
box 1.2: extreme iT: “compufacturing” or taking the man out of manufacturing
When thinking about the future of global supply chains, it is worth speculating on truly revolutionary technological developments. One such possible development concerns Computer Integrated Manufacturing (CIM). This has already produced a tectonic shift in manufacturing in high-wage nations – moving from a situation where machines helped workers make things to a situation where workers help machines make things. Perhaps manufacturing will be called “compufacturing” in the future.
The integration and automation of tasks, however, does not stop at the factory gate. Many design, engineering, and management tasks have been computerised (Alavudeen and Venkateshwaran, 2010). Computers have greatly boosted the productivity and speed of product design as well as greatly reduced the need for prototyping. Once designed, the production process
FigUre 1.19: Schematic illustration of computer integrated manufacturing
Source: Author.
Global supply chains: why they emerged, why they matter, and where they are going
47
can be outlined using computer-aided process planning systems and design programmes can create instructions for numerical-control machines. Models of the manufacturing system can be simulated before they are built. The basic manufacturing functions – machining, forming, joining, assembly and inspection – are supported and integrated by computer-aided manufacturing systems and automated materials-handling systems. Inventory control is automated, tracking inventory movement, forecasting requirements and even initiating procurement orders.
The key economic effects of CIM are:
• A radical reduction in the fixed cost and time delays associated with new models and new products
• A shift away from mass production of identical goods to mass production of customized goods
• A heightened possibility for spatial unbundling of certain segments of the value chain as digitized information makes coordination at distance less complicated
• A bundling of many tasks previously undertaken by individual workers of varying skill levels into advanced machinery and computers
• A polarization of the shop floor
The polarization, as Autor et al., (2003) pointed out, stemmed from the fact that computers were substitutes for some workers but complements for others. Demand for routine, low-skill tasks declined as they were easy to computerize and robotize. By contrast, computers boosted labour productivity in tasks demanding flexibility, creativity, generalized problem-solving capabilities, and complex communications. Cheaper computers and robots lowered demand for low-skill labour and raised demand for high-skill workers.18
A special report by the Economist magazine extrapolates these trends even further. It notes that manufacturing may be going through a new industrial revolution due to the advent of “3D printing” or additive manufacturing. This bundles virtually all stages of manufacturing into a single machine. Combined with the virtual designing made possible by computer-aided design systems, this would take manufacturing very close to the Star Trek replicators.
Global value chains in a changing world
48
Wage gap convergence may increase supply chain trade
One of the most remarkable trends in recent years has been a narrowing of wage differences between developed and developing nations. The implications for this trend are illustrated in the middle panel of Figure 1.18. This trend is having, and will continue to have, two distinct effects on international supply chains.
• First, wage convergence changes the nature of trade between the converging nations
Specifically, developing nations such as China are producing sophisticated intermediate goods that previously were imported.
• Second, as wages rise in China, Mexico, Poland and other countries, the geographical extent of supply chains widens to include new low-wage nations like Viet Nam.
The view that global supply chains are driven mainly by large wage gaps is highly misleading. The perfect illustration is the US auto industry where there is more US offshoring to high-wage Canada than there is to low-wage Mexico.
As Figure 1.4 shows, supply chain trade was prevalent among nearby high-wage nations like Canada and the United States and within Western Europe even before the
second unbundling and it is still very high today. This is the “horizontal” specialization type discussed above – specialization that is based on firm-level excellence rather than wage gaps. As such specialization is not generally subject to local clustering effects, the result is massive two-way flows in similar goods.
Supply chain unbundling is driven by a fundamental trade-off between the gains from specialization and the costs of dispersal. This would be seriously undermined by radical advances in the direction of mass customization and 3D printing by sophisticated machines. Whether these machines end up in high-wage, high-skill nations, or they are distributed to be near every large customer base, the impact would be a very substantial reduction in supply chain trade.
To put it sharply, transmission of data would substitute for transportation of goods.
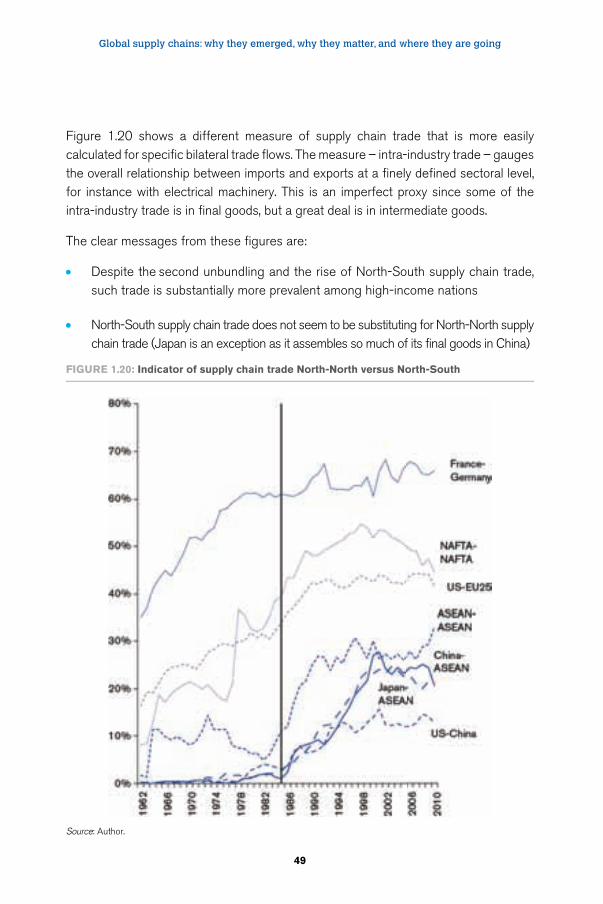
Global supply chains: why they emerged, why they matter, and where they are going
49
Figure 1.20 shows a different measure of supply chain trade that is more easily calculated for specific bilateral trade flows. The measure – intra-industry trade – gauges the overall relationship between imports and exports at a finely defined sectoral level, for instance with electrical machinery. This is an imperfect proxy since some of the intra-industry trade is in final goods, but a great deal is in intermediate goods.
The clear messages from these figures are:
• Despite the second unbundling and the rise of North-South supply chain trade, such trade is substantially more prevalent among high-income nations
• North-South supply chain trade does not seem to be substituting for North-North supply chain trade (Japan is an exception as it assembles so much of its final goods in China)
FigUre 1.20: indicator of supply chain trade North-North versus North-South
Source: Author.
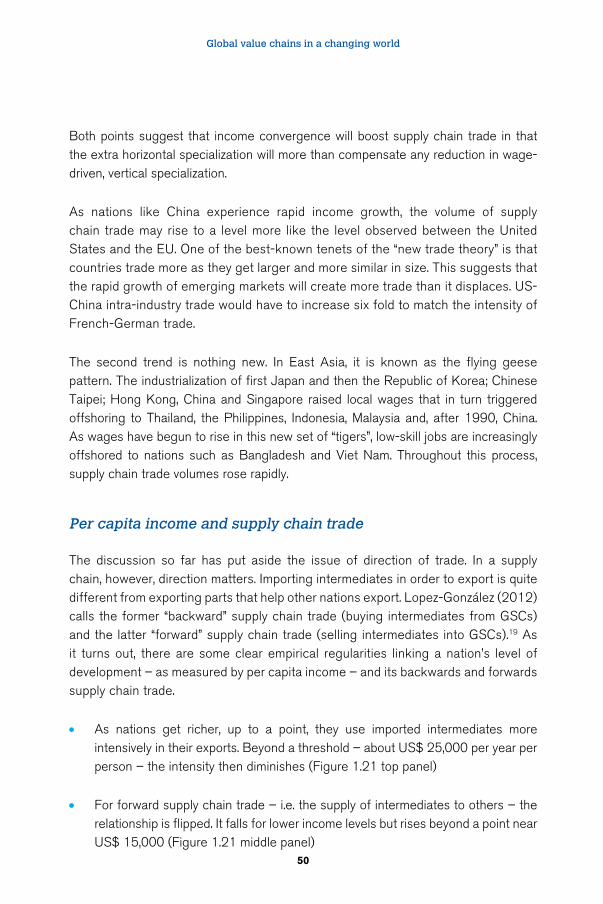
Global value chains in a changing world
50
Both points suggest that income convergence will boost supply chain trade in that the extra horizontal specialization will more than compensate any reduction in wage-driven, vertical specialization.
As nations like China experience rapid income growth, the volume of supply chain trade may rise to a level more like the level observed between the United States and the EU. One of the best-known tenets of the “new trade theory” is that countries trade more as they get larger and more similar in size. This suggests that the rapid growth of emerging markets will create more trade than it displaces. US-China intra-industry trade would have to increase six fold to match the intensity of French-German trade.
The second trend is nothing new. In East Asia, it is known as the flying geese pattern. The industrialization of first Japan and then the Republic of Korea; Chinese Taipei; Hong Kong, China and Singapore raised local wages that in turn triggered offshoring to Thailand, the Philippines, Indonesia, Malaysia and, after 1990, China. As wages have begun to rise in this new set of “tigers”, low-skill jobs are increasingly offshored to nations such as Bangladesh and Viet Nam. Throughout this process, supply chain trade volumes rose rapidly.
Per capita income and supply chain trade
The discussion so far has put aside the issue of direction of trade. In a supply chain, however, direction matters. Importing intermediates in order to export is quite different from exporting parts that help other nations export. Lopez-González (2012) calls the former “backward” supply chain trade (buying intermediates from GSCs) and the latter “forward” supply chain trade (selling intermediates into GSCs).19 As it turns out, there are some clear empirical regularities linking a nation’s level of development – as measured by per capita income – and its backwards and forwards supply chain trade.
• As nations get richer, up to a point, they use imported intermediates more intensively in their exports. Beyond a threshold – about US$ 25,000 per year per person – the intensity then diminishes (Figure 1.21 top panel)
• For forward supply chain trade – i.e. the supply of intermediates to others – the relationship is flipped. It falls for lower income levels but rises beyond a point near US$ 15,000 (Figure 1.21 middle panel)
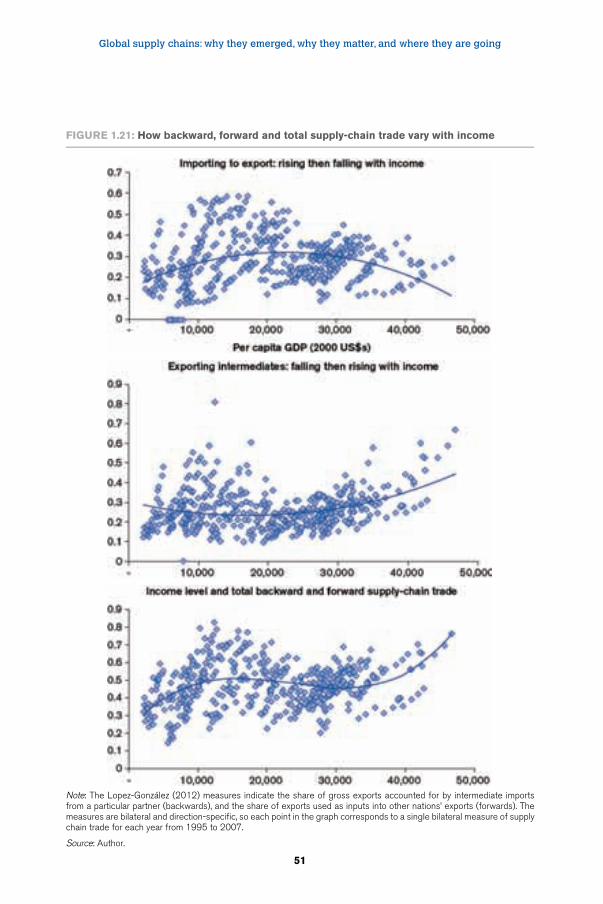
Global supply chains: why they emerged, why they matter, and where they are going
51
FigUre 1.21: How backward, forward and total supply-chain trade vary with income
Note: The Lopez-González (2012) measures indicate the share of gross exports accounted for by intermediate imports from a particular partner (backwards), and the share of exports used as inputs into other nations’ exports (forwards). The measures are bilateral and direction-specific, so each point in the graph corresponds to a single bilateral measure of supply chain trade for each year from 1995 to 2007.
Source: Author.
Global value chains in a changing world
52
Combining the two measures, we get a nation’s total involvement in the supply chain (Figure 1.21 bottom panel)
While this research is very recent and thus not yet part of economists’ received wisdom, the top-line message is very much in line with the general view presented above. As China moved up from textiles and apparel to assembling electronics and machinery, the import content of its exports rose. At the other extreme, a nation like Finland has all but exited from the fabrication end of manufacturing, so the domestic value-added content of its exports tends to be higher. In some ways the top panel of Figure 1.21 can be thought of as a shadow of the smile curve.
Likewise, it is commonly known that advanced technology nations such as Japan and Germany are increasingly focusing on sophisticated components that are exported for assembly elsewhere – an observation that is consistent with the middle panel of Figure 1.21.
Taking the fitted curves at face value gives an idea of how global supply chain trade will develop as emerging market incomes rise. Figure 1.22 shows, for the nations
FigUre 1.22: Manufacturing gDP and incomes levels – nations below the turning point
Source: Author.
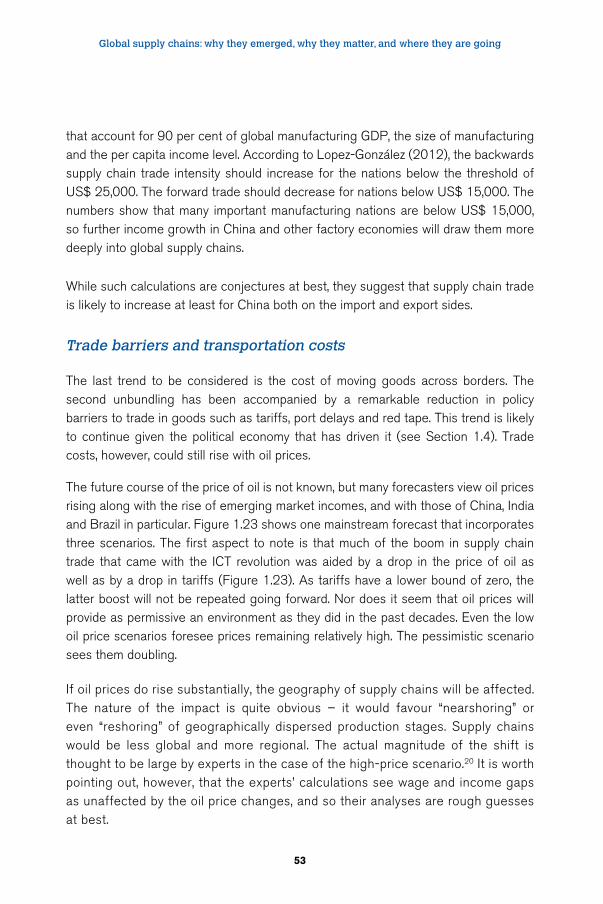
Global supply chains: why they emerged, why they matter, and where they are going
53
that account for 90 per cent of global manufacturing GDP, the size of manufacturing and the per capita income level. According to Lopez-González (2012), the backwards supply chain trade intensity should increase for the nations below the threshold of US$ 25,000. The forward trade should decrease for nations below US$ 15,000. The numbers show that many important manufacturing nations are below US$ 15,000, so further income growth in China and other factory economies will draw them more deeply into global supply chains.
While such calculations are conjectures at best, they suggest that supply chain trade is likely to increase at least for China both on the import and export sides.
Trade barriers and transportation costs
The last trend to be considered is the cost of moving goods across borders. The
second unbundling has been accompanied by a remarkable reduction in policy barriers to trade in goods such as tariffs, port delays and red tape. This trend is likely to continue given the political economy that has driven it (see Section 1.4). Trade costs, however, could still rise with oil prices.
The future course of the price of oil is not known, but many forecasters view oil prices rising along with the rise of emerging market incomes, and with those of China, India and Brazil in particular. Figure 1.23 shows one mainstream forecast that incorporates three scenarios. The first aspect to note is that much of the boom in supply chain trade that came with the ICT revolution was aided by a drop in the price of oil as well as by a drop in tariffs (Figure 1.23). As tariffs have a lower bound of zero, the latter boost will not be repeated going forward. Nor does it seem that oil prices will provide as permissive an environment as they did in the past decades. Even the low oil price scenarios foresee prices remaining relatively high. The pessimistic scenario sees them doubling.
If oil prices do rise substantially, the geography of supply chains will be affected. The nature of the impact is quite obvious – it would favour “nearshoring” or even “reshoring” of geographically dispersed production stages. Supply chains would be less global and more regional. The actual magnitude of the shift is thought to be large by experts in the case of the high-price scenario.20 It is worth pointing out, however, that the experts’ calculations see wage and income gaps as unaffected by the oil price changes, and so their analyses are rough guesses at best.
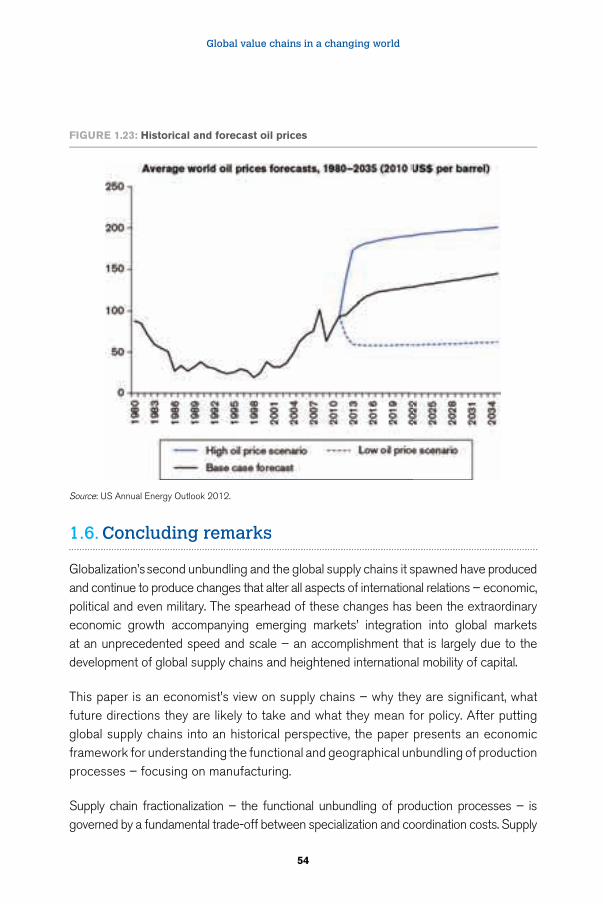
Global value chains in a changing world
54
1.6. Concluding remarks
Globalization’s second unbundling and the global supply chains it spawned have produced and continue to produce changes that alter all aspects of international relations – economic, political and even military. The spearhead of these changes has been the extraordinary economic growth accompanying emerging markets’ integration into global markets at an unprecedented speed and scale – an accomplishment that is largely due to the development of global supply chains and heightened international mobility of capital.
This paper is an economist’s view on supply chains – why they are significant, what future directions they are likely to take and what they mean for policy. After putting global supply chains into an historical perspective, the paper presents an economic framework for understanding the functional and geographical unbundling of production processes – focusing on manufacturing.
Supply chain fractionalization – the functional unbundling of production processes – is governed by a fundamental trade-off between specialization and coordination costs. Supply
FigUre 1.23: Historical and forecast oil prices
Source: US Annual Energy Outlook 2012.
Global supply chains: why they emerged, why they matter, and where they are going
55
chain dispersion – the geographical unbundling of stages of production – is governed by a balance between dispersion forces and agglomeration forces. Agglomeration forces create attraction to clusters that discourages offshoring – mostly the tendency to co-locate with customers and intermediate good supplies. The dispersion forces that encourage geographic unbundling include wage gaps (fostering North-South offshoring) and firm-level excellence (fostering North-North and South-South offshoring).
The policy implications stem from the second unbundling’s transformation of international commerce. The internationalization of production stages has internationalized the complex flows of goods, information, investment, training, technology and people that used to occur inside individual factories. The heightened complexity of cross-border flows demands deeper disciplines. As the WTO has been occupied with 20th century trade issues since its inception in the 1990s, the new disciplines have arisen outside the multilateral system. This development threatens the WTO’s centrality, but not on the tariff-cutting front as suggested by 20th century thinking on regionalism by Jagdish Bhagwati and others. Rather, 21st
century regionalism threatens to undermine the WTO’s role as the world’s rule writer and rule keeper.
The future of global supply chains will be influenced by four key determinants: 1) improvements in coordination technology that lower the cost of functional and geographical unbundling; 2) improvements in computer integrated manufacturing that lower the benefits of specialization and shifts stages toward greater skill-, capital-, and technology-intensity; 3) narrowing of wage gaps that reduces the benefit of North-South offshoring to nations like China; and 4) the price of oil that raises the cost of unbundling.
Two key messages emerge from the analysis. First, convergent wages and income level between “factory economies” and “headquarter economies” need not reduce the extent of supply chain trade among them. Indeed, the intensity of such trade among developed nations exceeds that between developed and emerging nations since the gains from specialization driven by firm-level excellence is even more important than the gains from specialization due to large wage gaps. A foundational tenet of trade theory is that nations trade more – not less – as their economies become larger and more similar. Second, narrowing wage gaps between China and developed nations are likely to produce a continuation of the old “flying geese” pattern whereby early developers move up the value chain and thereby encourage the next low-wage nation to step on to the development ladder.
Global value chains in a changing world
56
Endnotes
1 I thank João Amador , Robert Johnson, Javier Gonzalez-Lopez, and Nadia Rocha for assistance with data from their excellent papers on related topics. I thank Gary Gereffi, Tim Sturgeon, Patrick Low and Simon Evenett for excellent discussion, advice and analysis, and Alen Mulabdic for research assistance. This paper was first prepared in July 2012 for the Fung Global Institute’s Global Supply Chain Initiative.
2 The dates suggested by Rostow (1960) are UK 1783–1802, France 1830–60, Belgium 1833–60, US 1843–60, Germany 1850–73, Sweden 1868–90, Japan 1878–1900, Russia 1890–1914 and Canada 1896–1914.
3 On the theory connecting agglomeration, innovation, growth and income divergence, see Baldwin et al., (2001).
4 This is not the “technology transfer’ of yesteryear. Firms make elaborate efforts to avoid such transfers.
5 See Hummels et al., (1999); Johnson and Noguera (2011); Koopman et al., (2008), and González (2012).
6 See Baldwin (2008) for an analysis of Factory Asia.
7 See Baldwin (2011a) for details.
8 It was a game played mostly by rich nations. Developing nations were not required to reciprocate under the GATT’s “Special and Differential Treatment” principle.
9 See Baldwin (2010) for analysis of unilateral tariff liberalization.
10 Asymmetric in the sense that the agreements required the developing nation to change large swaths of laws and regulation but require almost no regulatory reform of the developed nation partner.
11 These include provisions on investment, capital flows, intellectual property protection, competition policy, services trade, and industrial standards and regulations; see WTO (2011) for detailed analysis.
12 See Baldwin (2011a) and WTO (2011) for an in depth analyses of 21st century regionalism.
13 Called, respectively, forward and backward linkages by 20th century writers such as Albert Hirschman.
14 The reason is that a clustering of firms means a clustering of workers and thus a clustering of purchasing power. However, the purchasing power tends to get spent on the whole range of goods.
Global supply chains: why they emerged, why they matter, and where they are going
57
15 This data, from the economic historian Angus Maddison, differs in the peak year from the more modern data series used in Figure 1.7.
16 Patterson (1966), page 356.
17 See Chapter 1 of Baldwin and Wyplosz (2012).
18 Of course, this is not the first time automation has polarized the factory jobs. In the 19th century, mechanized looms replaced medium-skilled textile workers with low-skilled, low-wage workers. A process immortalized by the machine-wrecking tactics of Luddites.
19 His actual terminology is “vertical specialization” following a long tradition in this literature.
20 See Simchi-Levi (2010) and Simchi-Levi et al., (2011).
References
Alavudeen, A.; Venkateshwaran, N. 2010. “Computer Integrated Manufacturing”, (New Delhi, India, PHI Learning).
Ali-Yrkkö, J.; Rouvinen, P.; Seppälä, T.; Ylä-Anttila, P. 2011. “Who Captures Value in Global Supply Chains? Case Nokia N95 Smartphone” in Journal of Industry, Competition and Trade, 11(3): 263–278.
Amador, J.; Cabral, S. 2009. “Vertical Specialization Across the World: A Relative Measure”, in The North American Journal of Economics and Finance, Volume 20, Issue 3, December: 267–280.
Autor, D.H.; Levy, F.; Murnane, R.J. 2003. “The Skill Content of Recent Technological Change: An Empirical Exploration” in Quarterly Journal of Economics, 118(4): 1279–333.
Baldwin, R.E.; Martin, P.; Ottaviano, G.I.P. 2001. “Global Income Divergence, Trade, and Industrialization: The Geography of Growth Take-Offs,” in Journal of Economic Growth, Springer, 6(1): 5-37.
Baldwin, R. 2008. “Managing the Noodle Bowl: The Fragility of East Asian Regionalism”, in Singapore Economic Review, 53:(3): 449-478.
Baldwin, R. 2010. “Unilateral Tariff Liberalisation,” NBER Working Paper 16600 (Cambridge MA, National Bureau of Economic Research).
Baldwin, R. 2011a. “21st Century Regionalism: Filling the Gap between 21st Century Trade and 20th Century Trade Rules”, CEPR Policy Insight No. 56 (London, UK, Center for Economic Policy Research).
Global value chains in a changing world
58
Baldwin, R. 2011b. “Trade and Industrialization after Globalization’s 2nd Unbundling: How Building and Joining a Supply Chain are Different and Why it Matters”, NBER Working Paper 17716 (Cambridge MA, National Bureau of Economic Research).
Baldwin, R. 2012. “WTO 2.0: Global Governance of Supply-Chain Trade”, in CEPR Policy Insight No.64, December (London, UK, Centre for Economic Policy Research).
Baldwin, R.; Wyplosz, C. 2012. “The Economics of European Integration, 4th Edition”, (London, UK, McGraw-Hill).
Bloom, N.; Garicano, L.; Sadun, R.; van Reenen, J.M. 2009. “The Distinct Effects of Information Technology and Communication Technology on Firm Organization”, NBER Working Paper No. 14975 (Cambridge, MA, National Bureau of Economic Research).
Brülhart, M. 2001. “Evolving Geographical Concentration of European Manufacturing Industries”, in Weltwirtschaftliches Archiv, 137(2): 215–243.
Cattaneo, O.; Gereffi, G.; Staritz, C. 2010. “Global Value Chains in a Post-crisis World: A Development Perspective” (Washington, DC, World Bank)
Economist, The. 2012 “A third industrial revolution”, Economist Magazine Special Report, 21 April 2012. Available at: http://www.economist.com/node/21552901
Florida, R. 2005. “The World is Spiky” in The Atlantic Monthly, 296 (3):48–51
Fujita, M.; Krugman, P.; Venables, A. J. 1999 “The Spatial Economy: Cities, Regions and International Trade” (Cambridge MA, MIT Press).
Gereffi, G.; Humphrey, J.; Timothy Sturgeon, T. 2005. “The Governance of Global Value Chains”, in Review of International Political Economy, 12: 1.
Horn, H.; Mavroidis, P. C.; Sapir, A. 2009. “Beyond the WTO? An Anatomy of EU and US Preferential Trade Agreements”, CEPR Discussion Paper No. DP7317 (London, UK, Center for Economic Policy Research).
Hummels, D.; Ishii, J.; and Yi K-M. 1999. "The Nature and Growth of Vertical Specialization in World Trade", Staff Reports 72, Federal Reserve Bank of New York. Available at: http://ideas.repec.org/p/fip/fednsr/72.html
Johnson, R.C.; Noguera, G. 2011. “Accounting for Intermediates: Production Sharing and Trade in Value Added”, in Journal of International Economics, forthcoming.
Johnson, R. C.; Nogueraz, G. 2012. “Fragmentation and Trade in Value Added over Four Decades”. Available at: www.colorado.edu/Economics/seminars/johnson.pdf
Global supply chains: why they emerged, why they matter, and where they are going
59
Koopman, R.; Wang, Z.; Wei, S-J. 2008 “Give Credit where Credit is Due: Tracing Value Added in Global Production Chains”, NBER Working Paper 16426 (Cambridge MA, National Bureau of Economic Research).
Krugman, P. 1991 “Increasing Returns and Economic Geography”, in Journal of Political Economy, 99: 483–99.
Lanz, R.; Miroudot, S; Nordås, H.K. 2012. “Does Fragmentation of Production Imply Fragmentation of Jobs?”, OECD Trade and Agriculture Directorate working paper. Available at: https://www.gtap.agecon.purdue.edu/resources/download/5841.pdf
Lopez-González, J. 2012. “Vertical Specialisation and New Regionalism”, Thesis PhD, University of Sussex, April.
Niepmann, F.; Felbermayr, G. 2010. “Globalization and the Spatial Concentration of Production”, in World Economy, 33(5): 680–709.
Patterson, G. 1966. “Discrimination in international trade: The policy issues 1945–1965” (Princeton NJ, Princeton University Press).
Porter, M.E. 1985. “Competitive Advantage” (New York, Free Press).
Pritchett, L. 1997. “Divergence, Big Time”, in Journal of Economic Perspectives, 11: 3.
Puga, D.; Venables, A.J. 1996. “The Spread of Industry: Spatial Agglomeration in Economic Development”, in Journal of the Japanese and International Economies. 10(4): 440–464.
Simchi-Levi, D. 2010. “Impact of Crude Oil Volatility on Network Design”, online powerpoint. Available at: www.scdigest.com/assets/reps/Impact_Oil_Prices_on_Supply_Chain_Network_Design.pdf
Simchi-Levi, D.; Peruvankal, J.P.; Mulani, N.; Read, B.; Ferreira, J. 2011. “Made in America: Rethinking the Future of US Manufacturing”, Available at: www.accenture.com/SiteCollectionDocuments/PDF/Accenture-Made-in-America.pdf.
Spitz, A. 2004. “Are Skill Requirements in the Workplace Rising? Stylized Facts and Evidence on Skill-Biased Technological Change”, ZEW Discussion Paper 04-33. Available at: ftp://ftp.zew.de/pub/zew-docs/dp/dp0433.pdf
WTO. 2011. “The WTO and Reciprocal Preferential Trading Agreements”, World Trade Report 2011 (Geneva, Switzerland, World Trade Organization).

61
2 The role of services in global value chains
Patrick Low1
2.1. Introduction
The intangibility of services makes them analytically and statistically elusive. Systematic efforts to deepen our understanding of the economic role played by services – particularly at the international level – have only occurred in the last thirty years. These efforts have intensified recently with the increased presence of global value chains, where services fulfill a vital and complex role.
Services have occupied a dominant place in most economies for a long time. According to the World Bank’s World Development Indicators (2012), the share of services value-added in world gross domestic product (GDP) was 70 per cent in 2010, rising fairly steadily from 53 per cent in 1970, 57 per cent in 1990 and 68 per cent in 2000. Besides reflecting the shift towards service economies in advanced countries, the growth in these shares over time will almost certainly have been influenced by improvements in statistical methods and techniques. The services share has also risen as a result of structural changes in economies that have led to greater segmentation and more arms-length transactions, allowing the separate identification of services transactions. Notwithstanding national variations in the shares of GDP attributable to services, manufacturing, agriculture and mining, in most economies the services share is greater than that of the other three components of economic activity combined.
The story of the share of services in international trade is even more interesting, reflecting data limitations that the international community has only just begun to address. For many years we have been estimating the share of cross-border services transactions in international trade at just over one-fifth of total trade (WTO International Trade Statistics, 2012). The recent OECD/WTO work on measuring trade in terms of the value added to products by different countries along supply chains, rather than
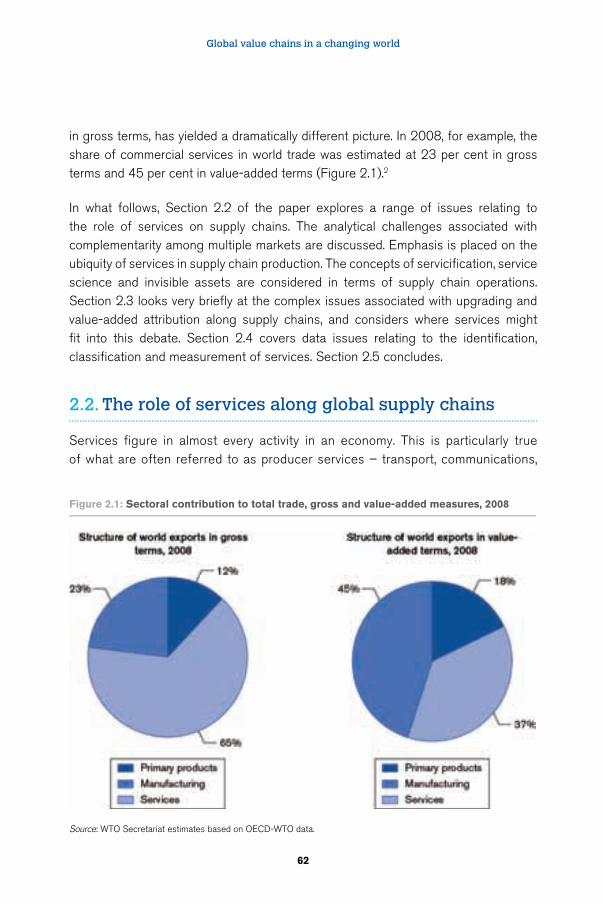
Global value chains in a changing world
62
in gross terms, has yielded a dramatically different picture. In 2008, for example, the share of commercial services in world trade was estimated at 23 per cent in gross terms and 45 per cent in value-added terms (Figure 2.1).2
In what follows, Section 2.2 of the paper explores a range of issues relating to the role of services on supply chains. The analytical challenges associated with complementarity among multiple markets are discussed. Emphasis is placed on the ubiquity of services in supply chain production. The concepts of servicification, service science and invisible assets are considered in terms of supply chain operations. Section 2.3 looks very briefly at the complex issues associated with upgrading and value-added attribution along supply chains, and considers where services might fit into this debate. Section 2.4 covers data issues relating to the identification, classification and measurement of services. Section 2.5 concludes.
2.2. The role of services along global supply chains
Services figure in almost every activity in an economy. This is particularly true of what are often referred to as producer services – transport, communications,
Figure 2.1: Sectoral contribution to total trade, gross and value-added measures, 2008
Source: WTO Secretariat estimates based on OECD-WTO data.
The role of services in global value chains
63
finance, distribution and business services. This pervasiveness makes services key determinants of competitiveness and the productivity of capital and labour. But this is only part of the picture, since numerous other services are involved in the production and sale of products, whether the final product is a good or a service.
Services have sometimes been referred to as the glue that holds supply chains together and ensures that they function in a fluid manner. This is only one aspect of what services do. They are also part of many production and sales processes, as we will see below. Modern communication and transport technologies have enhanced the tradability of services. This has facilitated their incorporation in supply chain production as traded inputs. In addition, what business literature calls “modularization”3 has led to the incorporation or bundling of services into composite products. This phenomenon is not unlike what the economics literature refers to as trade in tasks4, where inputs do not break down readily into the product classification and nomenclature systems with which we are more familiar. A typical example of this would be “business functions”.
While in the past productivity growth has been greater in manufacturing than in services, emerging literature on the extent of unidentified service activities in production raises questions about the accuracy of relative productivity measures. Even if the data reflect reality, services may be a growing source of competitiveness. This conclusion follows from a new appreciation of how the service economy works and of different ways of producing and delivering services as elements of aggregated value propositions.
As discussed below, much of the analysis does not necessarily refer directly to services, but rather to invisibles. However, since invisibles are intangible, and the one defining feature distinguishing services from goods is intangibility, there is no doubt that invisibles include services.
The consequences of complementary markets
In terms of their operation, supply chains can be thought of as a series of linked markets for goods and services. These markets are interdependent in the sense that something happening in one market affects many other markets. This complementarity, sometimes referred to as joint demand or derived demand, is associated with negative cross-elasticities of demand. This means that if the price of product A increases in
Global value chains in a changing world
64
one market, the demand for product B in another will fall. The result is that demand for both A and B falls.
This complementarity links goods and services markets with no distinction in terms of economic effects as to whether the products in question are tangible or intangible.5 Under these multiple-market relationships, changes in conditions in one market – including because of a policy intervention – provoke ripple effects in others along the whole supply chain, both upstream and downstream. The same logic holds in situations where there is modularization or bundling, and inputs are composites of at least two products that in principle could be supplied separately.
While the complementary nature of markets is intuitively obvious and doubtless taken into account in many decisions of market agents, this reality does not always seem to be fully factored into the expectations of policy-makers in terms of the consequences of their actions. A possible explanation for this could be myopia, given that until very recently adequate data were unavailable. Policy interventions will affect relative prices across different interdependent markets, possibly with unintended consequences.6 This suggests that policy-making should be an integrated process.
There are two aspects to this, at the level of measures and policies. When governments take measures pursuant upon a policy, they should take into account market complementarities and knock-on effects in the particular market situation at hand. The impact of such reverberations can be particularly pronounced where policies affecting components (goods or services inputs) have a multiplicative or magnification effect as they cross more than one frontier along the supply chain.7
At the policy level, this is about the design of different policies with varying objectives and contexts, which in the end come together to affect outcomes beyond the initial focus of attention and the objectives of individual policies. Outcome linkages and spill-overs call for a holistic approach to policy formulation. Policies formulated internationally that also aim to shape outcomes in areas like trade in goods, trade in services, investment, intellectual property protection, and competition will affect many activities in many markets. Getting policy right in each of these areas is therefore essential to the effective overall operation of supply chains. The current approach that relies on “silo” agreements in these different areas is short on appreciation of the consequences of complementarity. The pattern observed internationally is a reflection of how policy is made domestically, suggesting that any new approach must begin at home.
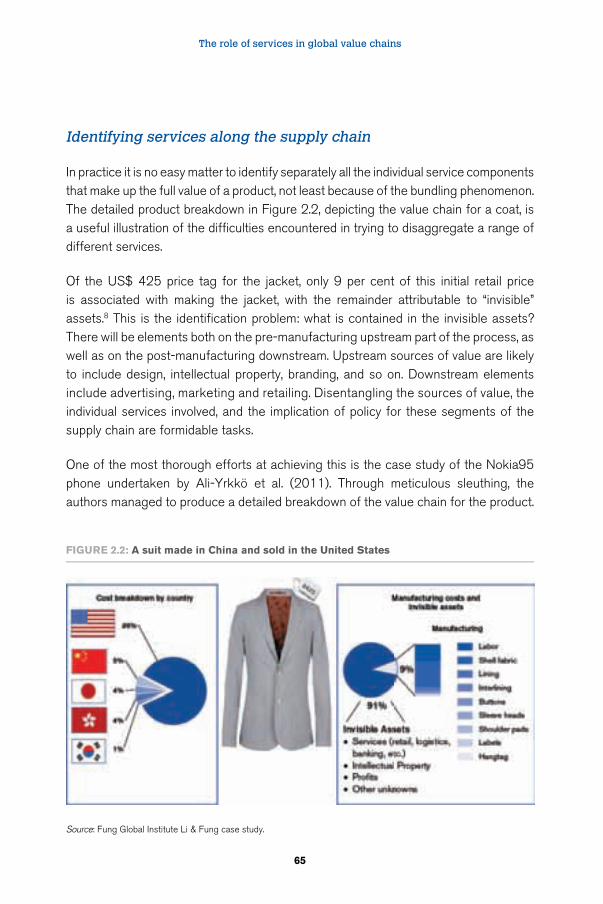
The role of services in global value chains
65
Identifying services along the supply chain
In practice it is no easy matter to identify separately all the individual service components that make up the full value of a product, not least because of the bundling phenomenon. The detailed product breakdown in Figure 2.2, depicting the value chain for a coat, is a useful illustration of the difficulties encountered in trying to disaggregate a range of different services.
Of the US$ 425 price tag for the jacket, only 9 per cent of this initial retail price is associated with making the jacket, with the remainder attributable to “invisible” assets.8 This is the identification problem: what is contained in the invisible assets? There will be elements both on the pre-manufacturing upstream part of the process, as well as on the post-manufacturing downstream. Upstream sources of value are likely to include design, intellectual property, branding, and so on. Downstream elements include advertising, marketing and retailing. Disentangling the sources of value, the individual services involved, and the implication of policy for these segments of the supply chain are formidable tasks.
One of the most thorough efforts at achieving this is the case study of the Nokia95 phone undertaken by Ali-Yrkkö et al. (2011). Through meticulous sleuthing, the authors managed to produce a detailed breakdown of the value chain for the product.
Figure 2.2: A suit made in China and sold in the united States
Source: Fung Global Institute Li & Fung case study.
Global value chains in a changing world
66
The parts (including processors, memories, integrated circuits, display and camera) accounted for 33 per cent of the product. Assembly only accounted for 2 per cent. The remaining two-thirds of the product was accounted for by Nokia’s internal support services (31 per cent), licenses (4 per cent), distribution (4 per cent), retailing (11 per cent) and operating profit (16 per cent). Despite the relatively fine detail of the breakdown of invisibles in this case study, a good deal is still missing in terms of the different services that went into production. The missing services problem also applies in the case of the manufacturing part of the operation, notwithstanding its small share.
The notion of “servicification”
The Swedish National Board of Trade has undertaken some useful work in a number of studies in recent years on the servicification of the Swedish economy and of Swedish firms operating internationally (Kommerskollegium, 2010a, 2010b, 2012). Related work based on the same idea of servicification makes reference to servicizing (Reisken et al., 2000) and the “manuservice” economy (Bryson and Daniels, 2010). As discussed in Ryu et al. (2012), the term servitization was first used by Vandermerwe and Rada (1988). The definition of servification and similar derivatives of the word service used to denote the same phenomenon is not very precise but they capture important ideas about how the role of services has evolved in recent years. Essentially, servicification refers to the increased use of services in manufacturing, both in terms of production processes and sales. This phenomenon may in part reflect the separation of services functions in manufacturing from core production functions. In Sweden’s case (and no doubt elsewhere) this is linked to the development of enterprise groups, where manufacturing enterprises comprise different firms, some of which are dedicated to service production. Higher productivity growth in manufacturing than services and shifting demand and production patterns underlie the decline in the share of manufacturing and the rise of services in economies like that of Sweden (Kommerskollegium, 2010a).
A significant feature of servicification is the opportunity it offers for strategic firm behaviour designed to move up the value chain. While some of the bundling or modularization occurring along supply chains as a result of servicification may be occasioned by the exigencies of locational dispersion in production and consumption, or by regulatory requirements, these tendencies are also likely to be fed by strategic motivations internal to firms (Sundin et al., 2009; Kommerskollegium, 2012). Firms may seek to customize their offerings so as to differentiate them in the marketplace and earn higher returns or to spread risk by diversifying the output mix.
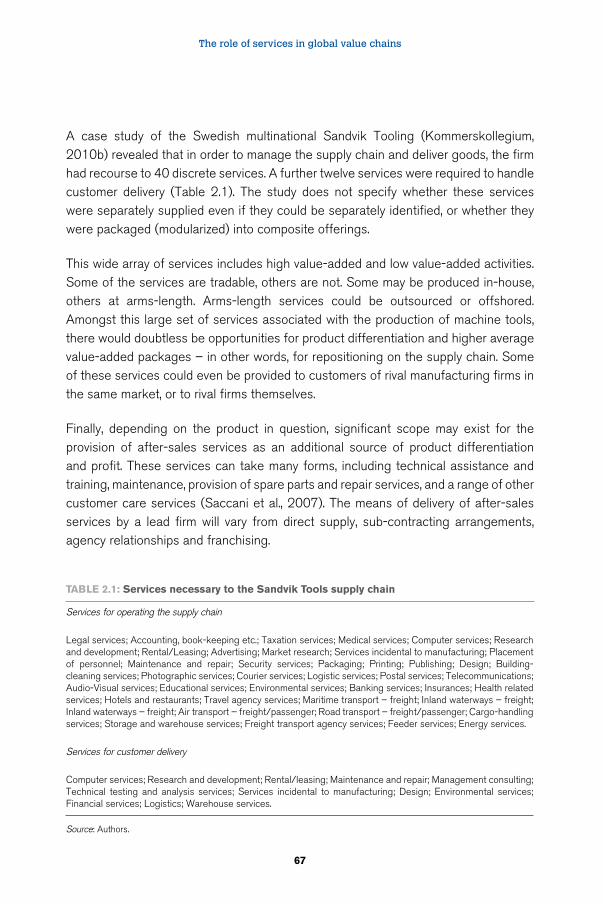
The role of services in global value chains
67
A case study of the Swedish multinational Sandvik Tooling (Kommerskollegium, 2010b) revealed that in order to manage the supply chain and deliver goods, the firm had recourse to 40 discrete services. A further twelve services were required to handle customer delivery (Table 2.1). The study does not specify whether these services were separately supplied even if they could be separately identified, or whether they were packaged (modularized) into composite offerings.
This wide array of services includes high value-added and low value-added activities. Some of the services are tradable, others are not. Some may be produced in-house, others at arms-length. Arms-length services could be outsourced or offshored. Amongst this large set of services associated with the production of machine tools, there would doubtless be opportunities for product differentiation and higher average value-added packages – in other words, for repositioning on the supply chain. Some of these services could even be provided to customers of rival manufacturing firms in the same market, or to rival firms themselves.
Finally, depending on the product in question, significant scope may exist for the provision of after-sales services as an additional source of product differentiation and profit. These services can take many forms, including technical assistance and training, maintenance, provision of spare parts and repair services, and a range of other customer care services (Saccani et al., 2007). The means of delivery of after-sales services by a lead firm will vary from direct supply, sub-contracting arrangements, agency relationships and franchising.
TAble 2.1: Services necessary to the Sandvik Tools supply chain
Services for operating the supply chain
Legal services; Accounting, book-keeping etc.; Taxation services; Medical services; Computer services; Research and development; Rental/Leasing; Advertising; Market research; Services incidental to manufacturing; Placement of personnel; Maintenance and repair; Security services; Packaging; Printing; Publishing; Design; Building-cleaning services; Photographic services; Courier services; Logistic services; Postal services; Telecommunications; Audio-Visual services; Educational services; Environmental services; Banking services; Insurances; Health related services; Hotels and restaurants; Travel agency services; Maritime transport – freight; Inland waterways – freight; Inland waterways – freight; Air transport – freight/passenger; Road transport – freight/passenger; Cargo-handling services; Storage and warehouse services; Freight transport agency services; Feeder services; Energy services.
Services for customer delivery
Computer services; Research and development; Rental/leasing; Maintenance and repair; Management consulting; Technical testing and analysis services; Services incidental to manufacturing; Design; Environmental services; Financial services; Logistics; Warehouse services.
Source: Authors.
Global value chains in a changing world
68
Services, networks and value analysis
In a similar vein to the analysis of complementary markets, joint production and trade in tasks discussed above, a new literature is emerging that goes under the broad rubric of “service science”. The literature is yet to become mainstream but it strives to explain how networks, technology, entrepreneurship and consumers interact to generate innovation and create value. The recently published volumes by Maglio et al., (2010) and Demirkan et al., (2011) are examples of a burgeoning literature around service science.
A “service-dominant” logic of value creation and exchange (Vargo and Lusch, 2004) underpins much of the analysis, which focuses on service systems. Production is seen more as a dynamic and collaborative interactive process among people than as the combination of readily definable fixed and variable inputs of capital, labour and components into units of output. The analysis that goes under the name of service science bears a resemblance to the notion of innovation systems.
Service science aspires to a high degree of inter-disciplinary or even trans-disciplinary thinking. Spohrer (2009) has argued for “an integrated approach that spans not only existing discipline-based silos within academic organizations (i.e. marketing, operations, and human resource management within a business school) but also across academic organizations (i.e. business, engineering and liberal arts).”9 Ng et al., (2011) suggest that service science should combine what they describe as a prevailing reductionist analytical perspective with a systems perspective as a means of establishing a disciplinary base for service science.
A useful bridge between service science and more conventional analytical approaches is provided by Allee (2008) who examines the relationship between value and tangible and intangible assets. Intangible assets may be unpriced in the market and non-contractual, but nevertheless embody value. Such intangibles could include human knowledge, internal structures, working methods, reputation, business relationships, trust, social citizenship, environmental responsibility, and business values. These intangibles can sometimes command explicit value in the market, such as through consultancy contracts or explicit price premia. Allee (2008) argues, however, that trying to price these assets in terms of units of input is a fool’s errand. Some idea of the worth of the assets can be gleaned from the difference between the value of a firm’s assets and its sale value.
The role of services in global value chains
69
An imperfect and approximate indicator of this value could be captured by the goodwill recorded on a firm’s balance sheet. Some of the value emerges as barter relationships among parties to transactions. For the rest, the argument seems to be that value analysis requires an understanding of how roles and relationships create value. Even unpriced assets can be rendered into negotiable value and a systematic analysis of roles, transactions and deliverables must be undertaken in value creation analysis.
The OECD new sources of growth project
If the Allee (2008) analysis assists in bridging the gap between service science and more traditional analytical approaches to understanding markets, the OECD’s work (OECD, 2011, 2012) on intangible assets as new sources of growth is a further contribution in this direction. The OECD refers to a three-fold definitional distinction among the components of invisible assets. These include computerized information (software and data), innovation property (R&D, intellectual property), and economic competencies (brand equity, human capital specific to firms, networks joining people and institutions, organizational know-how, and advertising and marketing strategies).
The economic competencies category is strikingly similar to the essential focus of service science. The OECD’s use of terminology has varied over time. Earlier references were to intellectual assets, knowledge assets and intellectual capital, while in later work the term used has been knowledge-based capital (KBC). All these terms refer to invisibles, which are to be contrasted with tangible assets such as plant, machinery and buildings. The OECD argues that countries investing proportionately more in KBC are doing better via enhanced productivity than those investing proportionately less.
A further useful addition to the OECD’s work in this field is an analysis of the implications of policy on investment in, and production of, KBC. Relevant policies include tax and regulatory regimes, intellectual property, competition policy, investment policy, protection of data, data privacy and policies affecting corporate governance. This discussion reinforces the growing conviction that the segregation of policies into separately constructed regimes is inimical to coherence at the interface of policy and supply chain operations. An integrated approach to policy appears increasingly necessary.
Global value chains in a changing world
70
2.3. Services and progression up the value chain
The emphasis so far has been upon understanding both the ubiquity of services in supply chain production and the interdependent nature of markets across the goods and services spectrum. This focus calls for a brief consideration of a current issue for many governments – namely, how to build a more diversified, prosperous and dynamic economy through participating in supply chains. In practical terms this amounts to the separate but connected questions of how to position a country in terms of supply chain participation, and how to acquire higher value-added segments of supply chains in which a country is involved or broaden the scope of participation. The paper by Gereffi and Sturgeon (2013) in this volume addresses these issues in more detail, particularly in relation to emerging economies. While emerging economies with large and dynamic domestic markets may have more degrees of freedom in terms of their policy options, this matter is no less pressing for other developing countries.
The core emphasis here is on the scope for thinking about invisibles as a vehicle for new entry and upgrading. This requires firms to look beyond their core competencies to other, less less visible competencies such as networks with suppliers and the capability to perform specific tasks that can be replicated. An extensive listing of services that might be supplied to a lead firm on a supply chain has been undertaken by Gereffi and Fernadez-Stark (2010). The authors have divided services into information technology, knowledge processes and business processes. Each of these categories is further divided into multiple activities similar to the breakdown laid out above in the case of the Sandvik Tools supply chain (Kommerskollegium, 2010b). In addition, they have approximately ranked the services in terms of value-added, with knowledge processes and some information technology services embodying high value-added, and business processes tending to involve lower value-added content.
The analysis by Gereffi and Fernandez-Stark (2010) is in fact based on a discussion of off-shored services. This suggests the option of plugging into a supply chain with activities located elsewhere, relying on cost and skill advantages that allow participation in relatively high value-added activities from a distant location. But the provision of such services does not have to be on an off-shored basis. They could also have been outsourced domestically. Moreover, we often tend to think of off-shored and outsourced services being supplied at arms-length by independent entities. This is not necessarily the case. Such services could be provided on an
The role of services in global value chains
71
in-house basis by the lead firm itself. In both cases the key point is location, as what we are interested in here is progression up the value chain from a national perspective.
The process of upgrading
A wide literature has developed over the last decade or so on the ingredients of successful upgrading by firms.10 The essence of successful upgrading resides in the capacity to segment markets. It means establishing a competitive position with an offering that cannot be replicated, at least in the short-term. This is clearly easier for a lead firm to achieve than a secondary supplier. The sources of this market advantage could be a technology, a technique, a bottleneck of some description or a modularized product.
Kaplinsky and Morris (2001) distinguish among four kinds of upgrading – process, product, functional and chain. Process upgrading involves efficiency gains that allow the capture of a part of the chain unreachable at lower levels of competence. Product upgrading involves the acquisition of technological capability that permits the introduction of a new product or improving an existing one. Functional upgrading occurs when a producer manages to move to a different segment of the supply chain with higher value-added characteristics. Finally, chain upgrading means participating on a different, higher value-added supply chain.
The extent to which service provision can benefit from upgrading within this framework depends in part on how the service is supplied. If services are supplied as individual products, the changes in the product itself or its production processes will be the sole source of any upgrading gains. If, on the other hand, services are provided as part of a modularized task embodying more than one product as inputs, then the services components of such a task may play a greater or lesser role in the shift to higher value-added activities.
The role of policy in upgrading: relationships between firms and governments
Part of the upgrading literature is particularly concerned with the question of what role governments should play in fostering upgrading.11 The interest of governments in this is essentially about social upgrading, which means improving workers’ conditions and environmental standards. Industrial upgrading is the
Global value chains in a changing world
72
proximate consequence of this objective. The discussion is rooted in the post-war industrialization debate. From the earliest versions of industrial development policy in developing countries, including import substitution and export-oriented industrialization, the debate has moved on to consider the kind of industrial policy needed to participate in supply chain operations in a manner that will serve national development priorities. The role of the domestic market for final output is attenuated for large economies and non-existent for small ones where successful participation in a supply chain relies on transforming domestic and imported inputs into further elaborated inputs or final goods for export markets. The picture is a little different if the supply chain ends in the domestic market. The requisite policy mix will be conditioned by the nature of involvement and the source of competitiveness, including in the context of upgrading.
A broad distinction can be made between those policies that aim to create the right economy-wide environment for competitiveness and those that seek directly to alter the structure of production through sector-specific interventions. The first of these approaches focuses on such matters as infrastructure, connectivity, a business-friendly and cost-minimizing operating environment, access to credit, innovation and macroeconomic stability. The more directed, sector- or activity-specific interventions generally involve tariffs, other trade restrictions, fiscal incentives and other subsidies, a range of possible regulations such as local content or export performance requirements, and exchange restrictions.
Views differ as to the relative merits of narrow- versus broad-based approaches, although they are not mutually exclusive. Much depends on the specific circumstances, including the nature of the supply chain, the quality of governance, and various aspects of domestic supply conditions. Where do services fit into this picture? The relative neglect that services tend to receive in both policy and analysis would suggest that this is an obvious place to look for possible upgrading opportunities. As illustrated in Gereffi and Fernandez-Stark (2010), scope for participating remotely in supply chains exists in a range of services. What is significant about services in this context is that the physical infrastructure requirements are less onerous than those required for participation in the goods sector, allowing economies and firms to do some leapfrogging. On the other hand, good telecommunication connectivity is essential. Finally, there is also the question of the role of services in upgrading through modularization or servicification/servitization, and how policy can facilitate such opportunities.
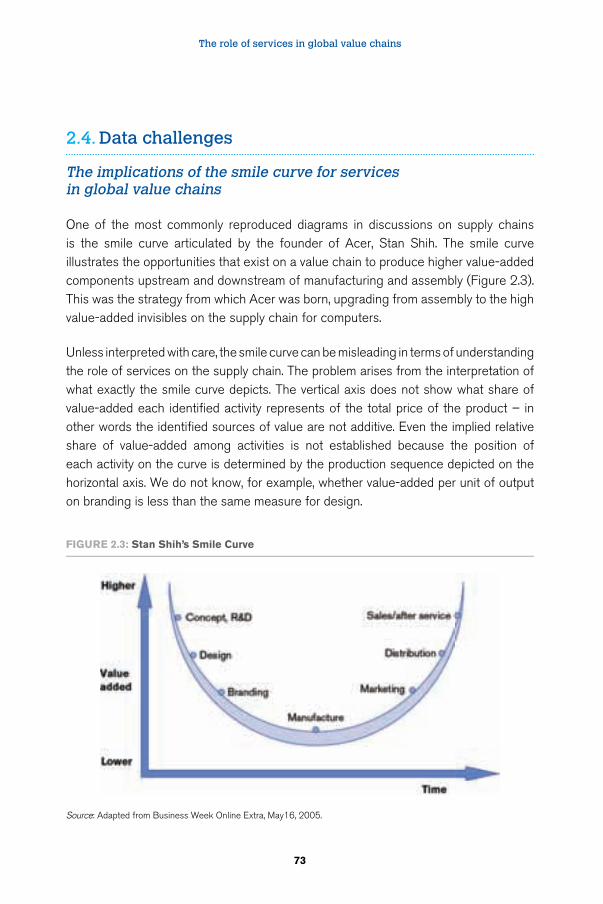
The role of services in global value chains
73
2.4. Data challenges
The implications of the smile curve for services in global value chains
One of the most commonly reproduced diagrams in discussions on supply chains is the smile curve articulated by the founder of Acer, Stan Shih. The smile curve illustrates the opportunities that exist on a value chain to produce higher value-added components upstream and downstream of manufacturing and assembly (Figure 2.3). This was the strategy from which Acer was born, upgrading from assembly to the high value-added invisibles on the supply chain for computers.
Unless interpreted with care, the smile curve can be misleading in terms of understanding the role of services on the supply chain. The problem arises from the interpretation of what exactly the smile curve depicts. The vertical axis does not show what share of value-added each identified activity represents of the total price of the product – in other words the identified sources of value are not additive. Even the implied relative share of value-added among activities is not established because the position of each activity on the curve is determined by the production sequence depicted on the horizontal axis. We do not know, for example, whether value-added per unit of output on branding is less than the same measure for design.
Figure 2.3: Stan Shih’s Smile Curve
Source: Adapted from Business Week Online Extra, May16, 2005.
Global value chains in a changing world
74
Another interpretative pitfall relates to whether we think of the smile curve as a product, a sector, or an entire economy. This can become particularly troublesome if the assumption is made that manufacturing is where the jobs are, in contrast to the high-return, capital intensive segments of the production process. If taken to represent the whole economy, it is easy to assume there is an inevitable trade-off between jobs and higher value-added – in other words that reliance on services destroys jobs. In fact, some parts of the upstream or downstream value chain may be labour-intensive (such as retailing). Be that as it may, assuming greater capital-intensity in higher value-added activities does not necessarily mean a job shortage for the economy because the composition of available jobs for the production of a single good is not the same as the job requirements for the economy as a whole. The job consequences of upgrading depend on the structure of the entire economy. It may well be that moving to higher value-added segments on a supply chain implies fewer employment opportunities on that chain. But many other factors, such as skill levels in the workforce and the functioning of the labour market, will determine the employment consequences of upgrading on the economy as a whole.
The imperfect statistical identification of services on supply chains
The only decisive difference between services and goods is tangibility. The intangibility of services makes them harder to identify and measure. The difficulty is compounded by the heterogeneous (customized) nature of many services transactions and the lack of a properly developed and generally accepted nomenclature for services. Other challenges arise for the reasons discussed above – services may not be supplied separately from one another, or from goods, and they may not even be contracted for and priced.
From a statistical point of view, it also matters whether transactions are arms-length. On a supply chain producing goods, any services produced “in-house” – without any recorded arms-length transaction – may well appear as goods in both output and trade data.12 While this creates no discrepancy between output and trade data, it still misrepresents services as goods.13 The degree to which this occurs depends on the structure of the economy. As firms grow, and agglomeration effects create external economies of scale, the outsourcing or offshoring services previously produced internally is likely to increase. This will lessen the degree of statistical confusion between goods and services.
The role of services in global value chains
75
Another classification issue, however, further militates against precision and predictability in distinguishing between goods and services in production. This results from reliance on ownership as a criterion for determining whether output counts as goods or services. Contract manufacturing arrangements result in manufactured output being classified as services output. This is the treatment prescribed by the 6th revision of balance of payments statistics and the 2008 revision of the system of national accounts. As Adlung and Zhang (2012) point out, this is not only an accounting matter. In a world where policies applying to goods and services are not uniform, different policy treatment can affect investment and ownership decisions in the real economy. This means that policy can inadvertently distort economic structures.
Definitional redundancy further complicates analysis
The concepts of “embodied” and “embedded” services have been widely used to describe the role of services in production.14 Embodied services are generally defined as a service whose product constitutes an input into the manufacture of a good. Examples of embodied services include transport, telecommunications, financial services and business services. Embedded services are those that constitute an input into the sale of a good, such as retail, after-sales support, and inventory management.
One problem with the distinction is that it creates a discrete definitional break in processes along a supply chain that does not seem to serve any useful analytical purpose. From a policy perspective the distinction is not precise enough – the relevant policy mix is likely to be very different among services categorized within each group. Moreover, the distinction cuts across key service sectors and does not match fully with certain kinds of services such as management, administration and back-office functions or information technology systems, which might be embodied or embedded. The categories therefore overlap.
Perhaps the most serious drawback is that these categories do not distinguish clearly between arms-length and non-arms-length transactions. It is this distinction that determines whether services are incorporated in goods (and vice-versa) for statistical purposes. The two categories do not, therefore, help us distinguish between statistical (informational) shortcomings and structural/organizational factors, both of which are associated with identification challenges relating to the contribution of services to supply chain production and trade. In short, the key issue for statistical recording is the contractual nature of the supply relationship, not embodiment or embedment.
Global value chains in a changing world
76
2.5. Summary and conclusions
Services matter more than one might judge from the paucity of analytical attention they have received. They dominate many national economies in terms of their share of GDP. They are also a prominent and increasingly important component of international trade. They play a crucial role in value chains – a role that is often underestimated and poorly understood.
Part of the challenge of acquiring a clear understanding of services on value chains relates to the intangible nature of services, their heterogeneity (even within narrowly defined service categories) and the absence of a fully developed and commonly agreed product nomenclature. Case study work has revealed how numerous and multi-faceted service inputs can be on product-specific supply chains. Case study work has also shown how difficult it is in practice to identify the true content of the frequently significant share of total value to be accounted for between manufacturing costs and the final price of a product. This margin contains upstream and downstream inputs along the supply chain, typically of the kind identified by the smile curve analysis (plus profits). Another area of complexity relates to post-sales services in the case of certain kinds of supply chains.
Complementarity relationships among markets along supply chains, involving both goods and services, also complicate analysis. This is particularly relevant when thinking about policy, since the traditional tendency to think about policies and regulate markets in unconnected silos can lead to unintended and undesirable results. In addition to the complementary nature of discrete markets, in many cases goods and services may be bundled or modularized into composite offerings. Reasons for this vary, and may include considerations of technical efficiency, responses to the regulatory environment, strategic market segmentation, or a policy of upgrading to acquire a larger share of value-added. Whatever the motivation, disentangling the outcomes with precision is a challenge.
Recent work, some of it under the rubric of “service science”, seeks to understand services networks and the importance of these networks for generating value along supply chains. They combine production, technology, entrepreneurship, and consumers into a virtuous circle of innovation. Outcomes are complex, and the resulting creation of value is not always fully captured in explicit market transactions or prices. This branch of analysis is relatively new and in some respects still under development.
The role of services in global value chains
77
It is linked to the OECD-driven work on knowledge-based capital, which seeks to understand opportunities for generating value through invisible assets.
This paper contains a very brief discussion of upgrading aspirations – often articulated at the national or regional level – that aim to acquire a larger share of value-added along supply chains. The emphasis in this paper is on where services might fit in this context. The capture of value-added may take the form of breaking into supply chains that begin and end elsewhere, or of building a greater source of domestic value on commodity-based chains that begin at home. The policy mix pursued for this purpose is a subject of debate, and depends on questions such as the size of the domestic market, the state of domestic infrastructure, and the quality of governance.
A key distinction in thinking about policy is whether the focus is on enabling competitive production at greater levels of sophistication or seeking to alter the economic structure by applying policies more narrowly to particular sectors or activities. Broadly, the first approach is akin to a horizontal orientation, while the latter is industrial policy proper. They are not mutually exclusive. Opportunities for upgrading through services have arguably been neglected. They include the possibility of limiting the need for infrastructure to good information and communications networks, and a range of possibilities through modularization.
In light of the nature and potential complexity of engaging in supply chain production through services, not to mention the challenges of mastering the intrinsically elusive nature of services, it is unsurprising that complete services data are difficult to acquire. Important issues are how services are counted in terms of ownership relationships and whether transactions are arms-length. Where services are clustered or modularized into composite offerings, measurement complications also arise. The paper argues that from a statistical and conceptual perspective, one should be careful about how the smile curve is interpreted. It was also argued that the notions of embodied and embedded services, as frequently used in the literature, are not very helpful in analytical terms.
In sum, the paper has attempted to identify some of the major issues and challenges confronting efforts to understand the role of services in supply chains. An obvious take-away is that more research is required in order to understand the nature of services that form part of supply chains, and to forge optimal policies accordingly. A less obvious one is that armed with an adequate appreciation of the realities, pragmatic ways should be found for dealing with them, rather than exerting efforts in pursuit of spurious precision that will ultimately be subject to challenge.
Global value chains in a changing world
78
Endnotes
1 The author is a member of the staff of the WTO Secretariat, a Senior Fellow at the Fung Global Institute and an Adjunct Professor at the Graduate Institute of International and Development Studies. The views expressed in this paper are those of the author and should not be attributed in any way to the institutions with which he is associated or to the membership of the WTO. The author is grateful for comments from Hubert Escaith, Gaurav Nayyar, Albert Park, Julia Tijaja and Rocky Tung on an earlier draft. None of them bear responsibility for any remaining errors.
2 See also Francois and Manchin (2011) for calculations of the services value-added content of trade.
3 Modularization arises from arrangements whereby the offering of a value chain supplier is a packaged combination of products, be they goods and/or services. Such offerings may reflect cost minimization considerations or they may be strategically put together as a means of market segmentation (customization) that provides higher returns for the supplier.
4 For the seminal economics paper on this that brings together a previous literature on offshoring and the workings of supply chains, see Grossman and Rossi-Hansburg (2008).
5 In practice, however, the fact that goods, unlike services, are storable and can be held as inventory may influence the complementarity relationships between goods and services.
6 The possibly apocryphal tale of Victorian rat catchers who raised more rats than they killed in order to increase their incomes as rat exterminators is a simple example of how policies taken in isolation of any thought of their knock-on effects can have unintended consequences.
7 See, for example, Ferrantino (2012) for an explanation of how this works. The magnification effect is not unlike the bullwhip effect discussed in the business literature on supply chains.
8 Since this is a product from the fashion industry, it is likely that the initial retail price would be discounted in order to avoid the problem of managing inventories in an industry where fashions change quickly. Nevertheless, the invisible assets still represent a major part of the product’s value.
9 Cited in Ng et al. (2011). P.15
10 Among the major early contributions to this literature are Gereffi and Kaplinsky (2001), Kaplinsky and Morris (2001) and Gereffi (2002).
11 The main lines of argument in this debate is summarized in Gereffi and Sturgeon (2013). Another recent contribution is Milberg et al. (2013).
12 Modern national accounting survey techniques attempt to adjust for this.
13 The same can happen with respect to goods on a services supply chain, but probably occurs less frequently.
14 See, for example, Drake-Brockman and Stephenson (2012).
The role of services in global value chains
79
References
Adlung, R.; Zhang, W. 2012. “Trade disciplines with a trapdoor: contract manufacturing”, WTO Working Paper, ERSD-2012-11. Electronic access: http://www.wto.org/english/res_e/reser_e/ersd201211_e.pdf
Ali-Yrkkö, J., Rouvinen, P., Seppälä, T.; Ylä-Anttila, P. 2011. “Who Captures Value in Global Supply Chains? Case Nokia N95 Smartphone”, in Journal of Industry, Competition and Trade, September, Volume 11:3, 263–278.
Allee, V. 2008 “Value Network Analysis and value conversion of tangible and intangible assets”, Journal of Intellectual Capital, 9(1): 5–24.
Bryson, J.R.,; Daniels, P. W. 2010. “Service Worlds: The ‘Services Duality’ and the Rise of the ‘Manuservice’ Economy” in Maglio, P.P., Kieliszewski, C. A. and Spohrer, J.C. (eds.) Handbook of Service Science, Springer, New York.
Demirkan, H.; Spohrer, J.C.; Krishna, V. (eds). 2011. The Science of Service Systems, Springer, New York.
Drake-Brockman, J.; Stephenson, S. 2012. “Implications for 21st Century Trade and Development of the Emergence of Services Value Chains”, Electronic access: http://ictsd.org/downloads/2012/11/implications-for-21st-century-trade-and-development-of-the-emergence-of-services-value-chains.pdf
Ferrantino, M. J. 2102. “Using Supply Chain Analysis to Examine the Costs of Non-Tariff Measures (NTMs) and the Benefits of Trade Facilitation”, WTO Working Paper, ERSD-2012-02. Electronic access: http://www.wto.org/english/res_e/reser_e/ersd201202_e.pdf
Francois, J.; Manchin, M. 2011. “Services Linkages and the Value Added Content of Trade”. Electronic access: http://siteresources.worldbank.org/INTRANETTRADE/Resources/Internal- Training/287823-1256848879189/6526508-1283456658475/7370147-1308070299728/ 7997263-1308070314933/PAPER_7_Francois_Manchin.pdf
Gereffi, G.; Kaplinsky, R. (eds.). 2001. “The Value of Value Chains: Spreading the Gains from Globalisation”, IDS Bulletin 32(3).
Gereffi, G. (ed). 2002. Who Gets Ahead in the Global Economy? Industrial Upgrading, Theory and Practice, New York: Johns Hopkins Press.
Gereffi,G; Fernadez-Stark, K. 2010. “The Offshore Services Global Value Chain”, Mimeo, (Center on Globalization, Governance and Competitiveness, Duke University).
Global value chains in a changing world
80
Gereffi, G.; Sturgeon, T. 2013. “Global Value Chain-Oriented Industrial Policy: The Role of Emerging Economies”, in D. Elms and P. Low (eds): Global Value Chains in a Changing World (Geneva, World Trade Organization).
Grossman, G. M. and Rossi-Hansburg, E. (2008) “Trading Tasks: A Simple Theory of Offshoring”, in American Economic Review, 98(5): 1978–1997.
Kaplinsky, R.; Morris, M. 2001. A Handbook for Value Chain Research. Electronic access: http://www.srp-guinee.org/download/valuechain-handbook.pdf
Kommerskollegium 2010a. Servicification of Swedish Manufacturing, Stockholm.
Kommerskollegium. 2010b. At Your Service: The Importance of Services for Manufacturing Companies and Possible Trade Policy Implications, Stockholm.
Kommerskollegium. 2012. Everybody is in Services – The Impact of Servicification in Manufacturing on Trade and Trade Policy, Stockholm.
Maglio, P.P.; Kieliszewski, C. A.; Spohrer, J.C. (eds): 2010. Handbook of Service Science, Springer, New York.
Milberg, W.; Xiao, J,; Gereffi, G. 2013. “Industrial Policy in the Era of Vertically Specialized Industrialization”, Mimeo.
Ng, I.; Maull, R.; Smith, L. 2011. “Embedding the New Discipline of Service Science” in Demirkan, H., Spohrer, J.C. and Krishna, V. (eds.) The Science of Service Systems, Springer, New York.
OECD. 2011. “New sources of growth: intangible assets”. Electronic access: http://www.oecd.org/sti/inno/46349020.pdf
OECD. 2012. “New Sources of Growth: Knowledge-Based Capital Driving Investment and Productivity in the 21st Century”, Interim Project Findings. Electronic access: http://www.oecd.org/sti/50498841.pdf
Reisken, E.D.; Johnson, J.K.; Votta, T. J. 2000. “Servicizing the Chemical Supply Chain”, Journal of Industrial Ecology, 3(2) & 3(3): 19–3.
Ryu, J,; Hosun, R,; Park, K,; Kim, H. 2012. “A Framework for Servitization of Manufacturing Companies” in Mangal, V,; Karmakar, U. (eds.) 2012. The UCLA Anderson Business and Information Technologies (BIT) Project: A Global Study of Business Practice, Singapore: World Scientific Publishing Company.
Saccani, N.; Johansson, P.; Perona, M. (2007) “Configuring the after-sales service supply chain: A multiple case study”, International Journal of Production Economics, 110: 52–69.
The role of services in global value chains
81
Spohrer, J. C. 2009. “Welcome to our declaration of interdependence”, Service Science, IBM.
Sundin, E., Lindahl, M., Comstock, M., Sakao,, T,; Shimomura, Y. 2009. “Achieving mass customization through servicification”, Journal of Internet Manufacturing and Services, 2: 56–75.
Vandermerwe, S.; Rada, J. 1988. “Servitization of Business: Adding Value by Adding Services”, in European Management Journal 6(4): 314–324.
Vargo, S. L.; Lusch, R. L. 2004. “Evolving to a new dominant logic for marketing”, Journal of Marketing, 68: 1–17.
World Bank. 2012. World Development Indicators, (Washington DC, World Bank).
WTO 2012. International Trade Statistics, (Geneva, World Trade Organization).


Part II
Why and how we measure trade in value-added terms

85
3 Estimating trade in value-added: why and how?
Nadim Ahmad
3.1. Introduction
Global value chains (GVCs) have become a dominant feature of today’s global economy. This growing process of international fragmentation of production, driven by technological progress, cost, access to resources and markets and trade policy reforms has challenged our conventional wisdom on how we look at and interpret trade and, in particular, the policies that we develop around it. Indeed, traditional measures of trade that record gross flows of goods and services each and every time they cross borders, alone, may lead to misguided decisions being taken.
In practice, two main approaches (micro and macro) have been used to shed light on this issue. The former is perhaps best characterized by the well known Apple iPod example (Dedrick et al., 2010), which showed that of the US$ 144 (Chinese) factory-gate price of an iPod, less than ten per cent contributed to Chinese value-added, with the bulk of the components (about US$ 100) being imported from Japan and much of the rest coming from the United States and the Republic of Korea.
This stylized approach, however, can generally only be conducted for specific products and, even then, only reveals part of the story related to who benefits from trade and how global value chains work as it is typically unable to reveal how the intermediate parts are created. For example, the message would be significantly different if, for sake of argument, the imported parts from Japan used to make the iPod required significant Chinese content. To deal with the bigger picture and also to capture all of the upstream effects, a number of studies have adopted a macro approach based on the construction of inter-country or world input-output (I-O) tables (Hummels et al., 2001; Daudin et al., 2006; 2009), Johnson and Noguera, 2011 and Koopman et al., 2011). A number of pioneering initiatives, such as those of GTAP, the WTO with IDE-JETRO and the WIOD (World Input-Output Database),
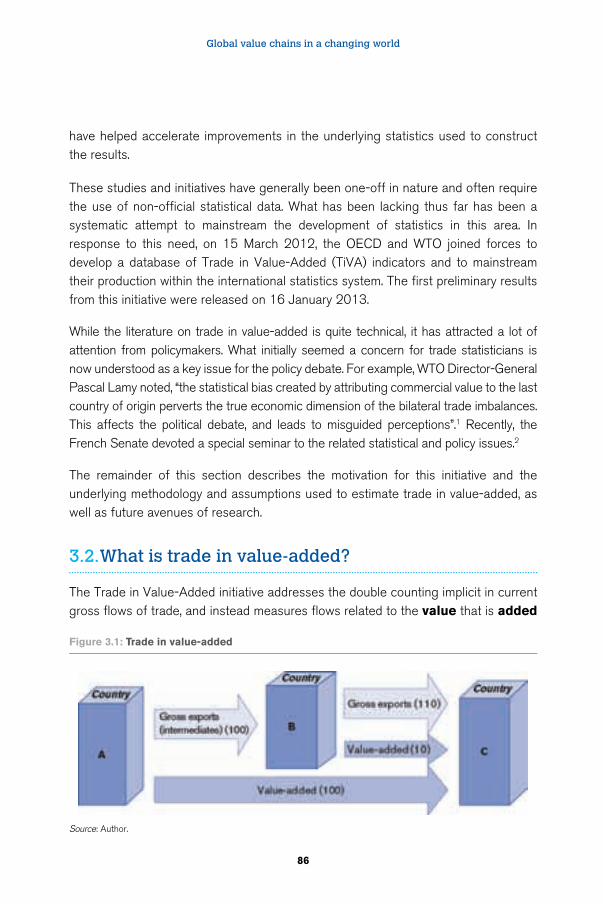
Global value chains in a changing world
86
have helped accelerate improvements in the underlying statistics used to construct the results.
These studies and initiatives have generally been one-off in nature and often require the use of non-official statistical data. What has been lacking thus far has been a systematic attempt to mainstream the development of statistics in this area. In response to this need, on 15 March 2012, the OECD and WTO joined forces to develop a database of Trade in Value-Added (TiVA) indicators and to mainstream their production within the international statistics system. The first preliminary results from this initiative were released on 16 January 2013.
While the literature on trade in value-added is quite technical, it has attracted a lot of attention from policymakers. What initially seemed a concern for trade statisticians is now understood as a key issue for the policy debate. For example, WTO Director-General Pascal Lamy noted, “the statistical bias created by attributing commercial value to the last country of origin perverts the true economic dimension of the bilateral trade imbalances. This affects the political debate, and leads to misguided perceptions”.1 Recently, the French Senate devoted a special seminar to the related statistical and policy issues.2
The remainder of this section describes the motivation for this initiative and the underlying methodology and assumptions used to estimate trade in value-added, as well as future avenues of research.
3.2. What is trade in value-added?
The Trade in Value-Added initiative addresses the double counting implicit in current gross flows of trade, and instead measures flows related to the value that is added
Figure 3.1: Trade in value-added
Source: Author.
Estimating trade in value-added: why and how?
87
(labour compensation, other taxes on production and operating surplus or profits) by a country in the production of any good or service that is exported.
A simple example illustrates this. Country A exports US$ 100 of goods, produced entirely within A, to country B that further processes them before exporting them to C where they are consumed. Country B adds value of US$ 10 to the goods and so exports US$ 110 to C. Conventional measures of trade show total global exports and imports of US$ 210 but only US$ 110 of value-added has been generated in their production. Conventional measures also show that country C has a trade deficit of US$ 110 with B and no trade at all with A, despite the fact that A is the chief beneficiary of C’s consumption.
If instead we track flows in value-added, one can recalculate country C’s trade deficit with country B on the basis of the value-added it “purchases” from B as final demand, which reduces its deficit on this basis, to US$ 10, and then apply the same approach to A’s value-added to show C running a deficit of US$ 100 with A. Note that country C’s overall trade deficit with the world remains at US$ 110. All that has changed are its bilateral positions. This simple illustration reveals how output in one country can be affected by consumers in another and by how much (for example country C’s consumers driving A’s output) but it can also reveal many other important insights into global value chains. For example, it shows that country B’s exports depend significantly on intermediate imports from A and so reveals that protectionist measures on imports from A could harm its own exporters and hence competitiveness. Indeed, by providing information at the level of specific industries, it is possible to provide insights in other areas too, such as the contribution of the service sector to international trade.
3.3. Motivation – why?
There are a number of areas where measuring trade in value-added terms brings a new perspective and is likely to impact on policies:
• Trade, growth and competitiveness: better understanding how much domestic value-added is generated by the export of a good or service in a country is crucial for development strategies and industrial policies. Some countries have capitalized on global value chains by developing comparative advantages in specific parts of the value chain. For example in China, much of its exports reflect assembly work where the foreign content is high. Access to efficient imports therefore matters as much in a world of international fragmentation as does
Global value chains in a changing world
88
access to markets. Conventional gross trade statistics, however, are not able to reveal the foreign content of exports and so there is a risk that policies to protect industries where gross statistics reveal a comparative advantage may decrease the competitiveness of those very same domestic industries, and so mercantilist-styled “beggar-thy-neighbour” strategies can turn out to be “beggar thyself” miscalculations.
• In addition, domestic value-added is not only found in exports but also in imports: goods and services produced in one domestic industry are intermediates shipped abroad whose value comes back to the domestic economy embodied in the imports of other, and often the same, industries. As a consequence tariffs, non-tariff barriers and trade measures – such as anti-dumping rights – can also impact on the competitiveness of domestic upstream producers (as well as the competitiveness of downstream producers as mentioned above) in addition to foreign producers. For example, a study of the Swedish National Board of Trade on the European shoe industry highlights that shoes “manufactured in Asia” incorporate between 50 per cent and 80 per cent of European Union value-added. In 2006, the European Commission introduced anti-dumping rights on shoes imported from China and Viet Nam. An analysis in value-added terms would have revealed that EU value-added was in fact subject to the anti-dumping rights.3
• Looking at trade from a value-added perspective is also able to better reveal how upstream domestic industries contribute to exports, even if those same industries have little direct international exposure. Gross trade statistics, for example, reveal that less than one-quarter of total global trade is in services, but in value-added terms the share is significantly higher. Goods industries require significant intermediate inputs of services (both from foreign and domestic suppliers). Looking at trade in value-added terms therefore can reveal that policies to encourage services trade liberalization and more foreign direct investment, and so policies designed to improve access to more efficient services, can improve the export competitiveness of goods industries.
• Global imbalances: accounting for trade in value-added (specifically accounting for trade in intermediate parts and components) and taking into account “trade in tasks” does not change the overall trade balance of a country with the rest of the world – it redistributes the surpluses and deficits across partner countries. When bilateral trade balances are measured in gross terms, the deficit with final goods producers (or the surplus of exporters of final products) is exaggerated
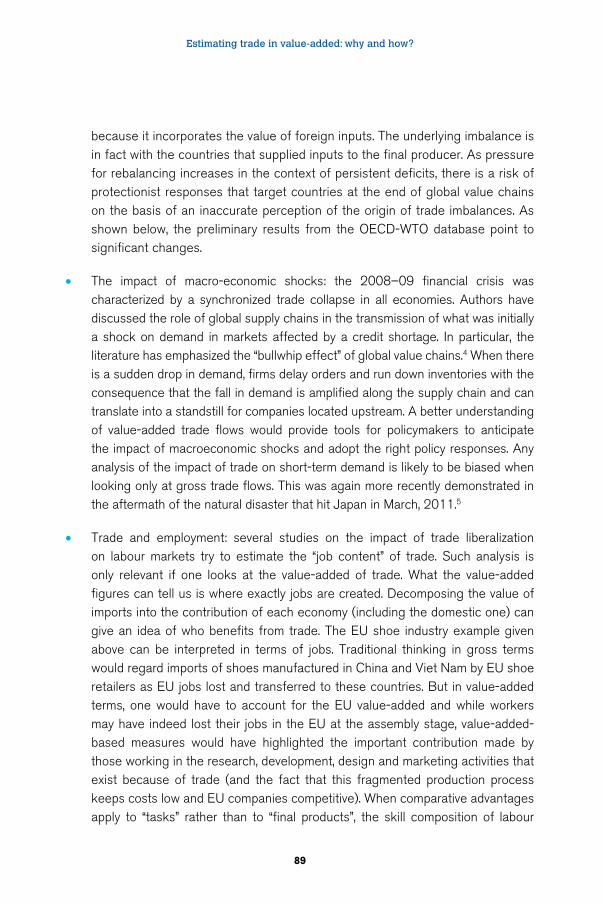
Estimating trade in value-added: why and how?
89
because it incorporates the value of foreign inputs. The underlying imbalance is in fact with the countries that supplied inputs to the final producer. As pressure for rebalancing increases in the context of persistent deficits, there is a risk of protectionist responses that target countries at the end of global value chains on the basis of an inaccurate perception of the origin of trade imbalances. As shown below, the preliminary results from the OECD-WTO database point to significant changes.
• The impact of macro-economic shocks: the 2008–09 financial crisis was characterized by a synchronized trade collapse in all economies. Authors have discussed the role of global supply chains in the transmission of what was initially a shock on demand in markets affected by a credit shortage. In particular, the literature has emphasized the “bullwhip effect” of global value chains.4 When there is a sudden drop in demand, firms delay orders and run down inventories with the consequence that the fall in demand is amplified along the supply chain and can translate into a standstill for companies located upstream. A better understanding of value-added trade flows would provide tools for policymakers to anticipate the impact of macroeconomic shocks and adopt the right policy responses. Any analysis of the impact of trade on short-term demand is likely to be biased when looking only at gross trade flows. This was again more recently demonstrated in the aftermath of the natural disaster that hit Japan in March, 2011.5
• Trade and employment: several studies on the impact of trade liberalization on labour markets try to estimate the “job content” of trade. Such analysis is only relevant if one looks at the value-added of trade. What the value-added figures can tell us is where exactly jobs are created. Decomposing the value of imports into the contribution of each economy (including the domestic one) can give an idea of who benefits from trade. The EU shoe industry example given above can be interpreted in terms of jobs. Traditional thinking in gross terms would regard imports of shoes manufactured in China and Viet Nam by EU shoe retailers as EU jobs lost and transferred to these countries. But in value-added terms, one would have to account for the EU value-added and while workers may have indeed lost their jobs in the EU at the assembly stage, value-added-based measures would have highlighted the important contribution made by those working in the research, development, design and marketing activities that exist because of trade (and the fact that this fragmented production process keeps costs low and EU companies competitive). When comparative advantages apply to “tasks” rather than to “final products”, the skill composition of labour
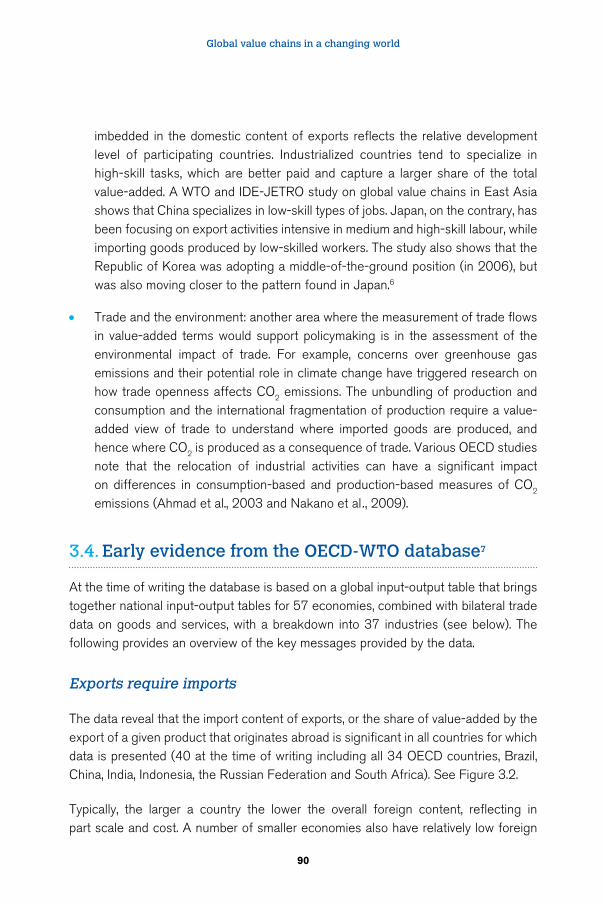
Global value chains in a changing world
90
imbedded in the domestic content of exports reflects the relative development level of participating countries. Industrialized countries tend to specialize in high-skill tasks, which are better paid and capture a larger share of the total value-added. A WTO and IDE-JETRO study on global value chains in East Asia shows that China specializes in low-skill types of jobs. Japan, on the contrary, has been focusing on export activities intensive in medium and high-skill labour, while importing goods produced by low-skilled workers. The study also shows that the Republic of Korea was adopting a middle-of-the-ground position (in 2006), but was also moving closer to the pattern found in Japan.6
• Trade and the environment: another area where the measurement of trade flows in value-added terms would support policymaking is in the assessment of the environmental impact of trade. For example, concerns over greenhouse gas emissions and their potential role in climate change have triggered research on how trade openness affects CO2 emissions. The unbundling of production and consumption and the international fragmentation of production require a value-added view of trade to understand where imported goods are produced, and hence where CO2 is produced as a consequence of trade. Various OECD studies note that the relocation of industrial activities can have a significant impact on differences in consumption-based and production-based measures of CO2 emissions (Ahmad et al., 2003 and Nakano et al., 2009).
3.4. Early evidence from the OECD-WTO database7
At the time of writing the database is based on a global input-output table that brings together national input-output tables for 57 economies, combined with bilateral trade data on goods and services, with a breakdown into 37 industries (see below). The following provides an overview of the key messages provided by the data.
Exports require imports
The data reveal that the import content of exports, or the share of value-added by the export of a given product that originates abroad is significant in all countries for which data is presented (40 at the time of writing including all 34 OECD countries, Brazil, China, India, Indonesia, the Russian Federation and South Africa). See Figure 3.2.
Typically, the larger a country the lower the overall foreign content, reflecting in part scale and cost. A number of smaller economies also have relatively low foreign
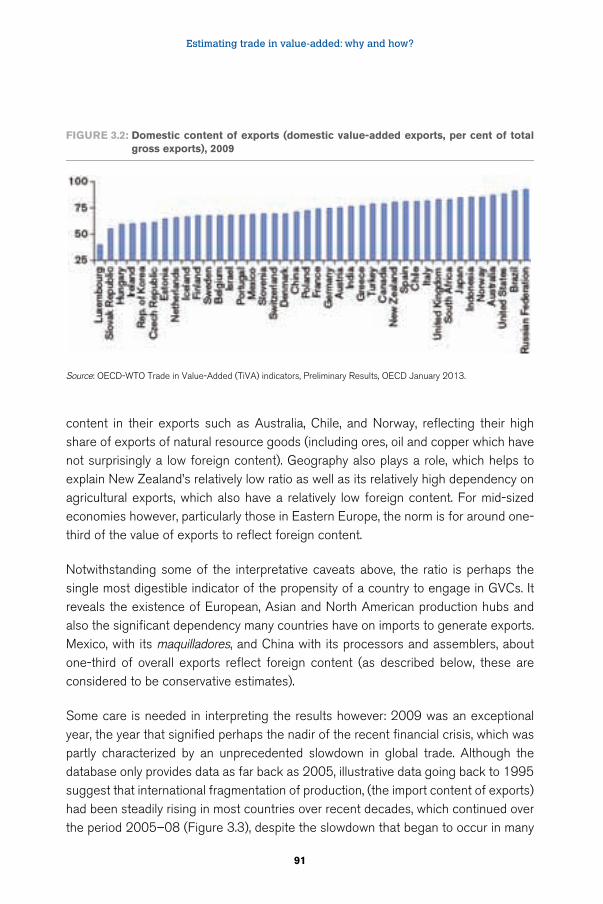
Estimating trade in value-added: why and how?
91
content in their exports such as Australia, Chile, and Norway, reflecting their high share of exports of natural resource goods (including ores, oil and copper which have not surprisingly a low foreign content). Geography also plays a role, which helps to explain New Zealand’s relatively low ratio as well as its relatively high dependency on agricultural exports, which also have a relatively low foreign content. For mid-sized economies however, particularly those in Eastern Europe, the norm is for around one-third of the value of exports to reflect foreign content.
Notwithstanding some of the interpretative caveats above, the ratio is perhaps the single most digestible indicator of the propensity of a country to engage in GVCs. It reveals the existence of European, Asian and North American production hubs and also the significant dependency many countries have on imports to generate exports. Mexico, with its maquilladores, and China with its processors and assemblers, about one-third of overall exports reflect foreign content (as described below, these are considered to be conservative estimates).
Some care is needed in interpreting the results however: 2009 was an exceptional year, the year that signified perhaps the nadir of the recent financial crisis, which was partly characterized by an unprecedented slowdown in global trade. Although the database only provides data as far back as 2005, illustrative data going back to 1995 suggest that international fragmentation of production, (the import content of exports) had been steadily rising in most countries over recent decades, which continued over the period 2005–08 (Figure 3.3), despite the slowdown that began to occur in many
Figure 3.2: Domestic content of exports (domestic value-added exports, per cent of total gross exports), 2009
Source: OECD-WTO Trade in Value-Added (TiVA) indicators, Preliminary Results, OECD January 2013.
Global value chains in a changing world
92
countries in 2008. But 2009 saw falls in the import content of exports, suggesting that the greater the fragmentation of a good or service, the more likely it was to be affected by the synchronized slowdown in trade. In most countries, therefore, the import content of overall exports in 2009 returned to around the ratios seen in 2005, but in China the data point to a steady rise over the period, suggesting developments that saw China begin to move up the value-added chain.
Tangible evidence of the scale of global value chains emerges more clearly when considering specific sectors. For example, between one-third to half of the total value
Figure 3.3: Domestic content of exports (domestic value-added exports, per cent of total gross exports), 2005–09
Source: OECD-WTO Trade in Value-Added (TiVA) indicators, Preliminary Results, OECD January 2013.
Figure 3.4: Transport equipment, gross exports decomposed by source, uS$ billion, 2009
Source: OECD-WTO Trade in Value-Added (TiVA) indicators, Preliminary Results, OECD January 2013.
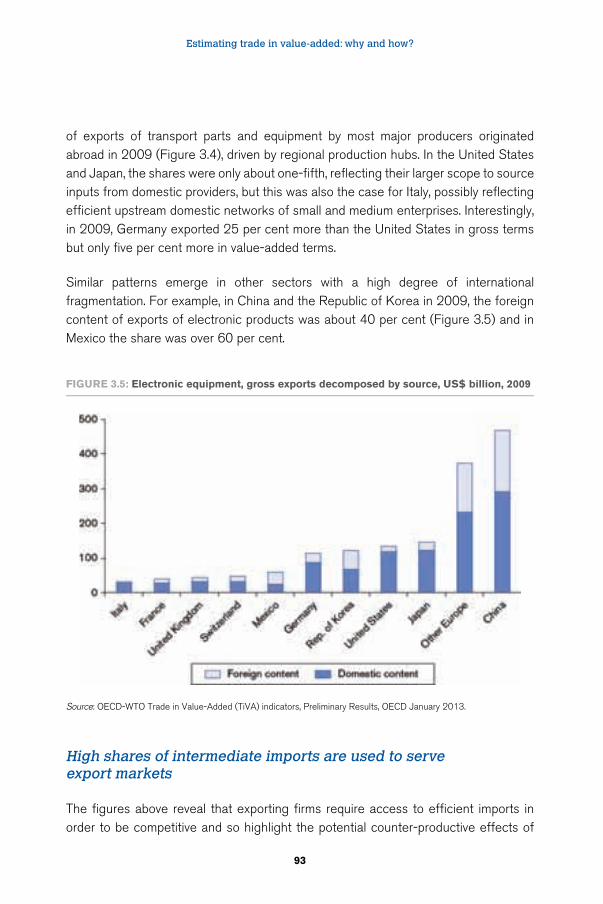
Estimating trade in value-added: why and how?
93
of exports of transport parts and equipment by most major producers originated abroad in 2009 (Figure 3.4), driven by regional production hubs. In the United States and Japan, the shares were only about one-fifth, reflecting their larger scope to source inputs from domestic providers, but this was also the case for Italy, possibly reflecting efficient upstream domestic networks of small and medium enterprises. Interestingly, in 2009, Germany exported 25 per cent more than the United States in gross terms but only five per cent more in value-added terms.
Similar patterns emerge in other sectors with a high degree of international fragmentation. For example, in China and the Republic of Korea in 2009, the foreign content of exports of electronic products was about 40 per cent (Figure 3.5) and in Mexico the share was over 60 per cent.
Figure 3.5: electronic equipment, gross exports decomposed by source, uS$ billion, 2009
Source: OECD-WTO Trade in Value-Added (TiVA) indicators, Preliminary Results, OECD January 2013.
High shares of intermediate imports are used to serve export markets
The figures above reveal that exporting firms require access to efficient imports in order to be competitive and so highlight the potential counter-productive effects of
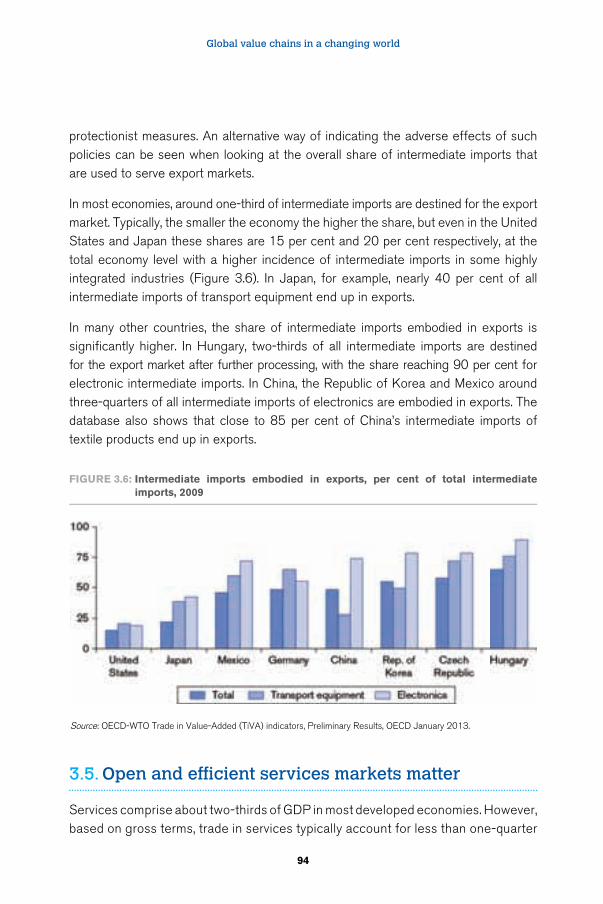
Global value chains in a changing world
94
protectionist measures. An alternative way of indicating the adverse effects of such policies can be seen when looking at the overall share of intermediate imports that are used to serve export markets.
In most economies, around one-third of intermediate imports are destined for the export market. Typically, the smaller the economy the higher the share, but even in the United States and Japan these shares are 15 per cent and 20 per cent respectively, at the total economy level with a higher incidence of intermediate imports in some highly integrated industries (Figure 3.6). In Japan, for example, nearly 40 per cent of all intermediate imports of transport equipment end up in exports.
In many other countries, the share of intermediate imports embodied in exports is significantly higher. In Hungary, two-thirds of all intermediate imports are destined for the export market after further processing, with the share reaching 90 per cent for electronic intermediate imports. In China, the Republic of Korea and Mexico around three-quarters of all intermediate imports of electronics are embodied in exports. The database also shows that close to 85 per cent of China’s intermediate imports of textile products end up in exports.
Figure 3.6: intermediate imports embodied in exports, per cent of total intermediate imports, 2009
Source: OECD-WTO Trade in Value-Added (TiVA) indicators, Preliminary Results, OECD January 2013.
3.5. Open and efficient services markets matter
Services comprise about two-thirds of GDP in most developed economies. However, based on gross terms, trade in services typically account for less than one-quarter
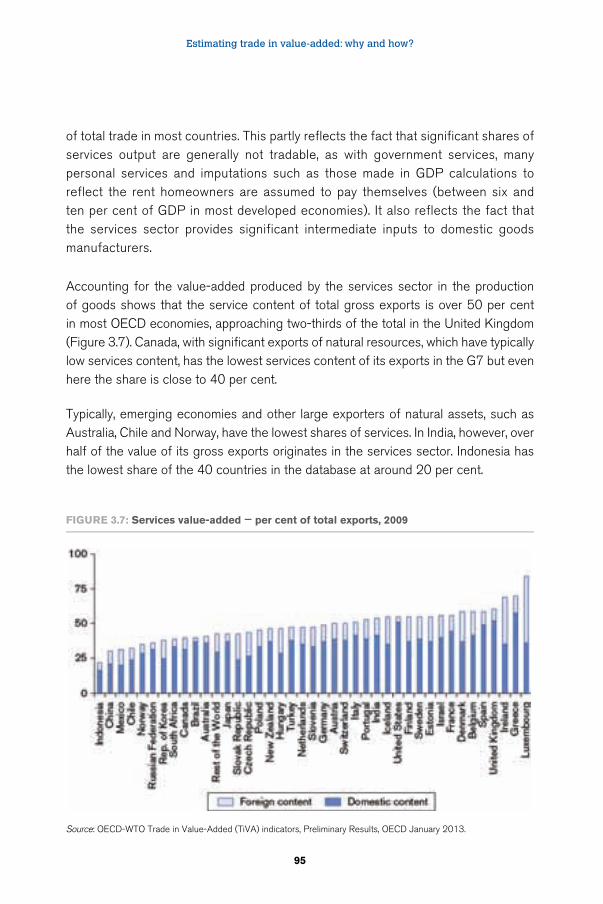
Estimating trade in value-added: why and how?
95
of total trade in most countries. This partly reflects the fact that significant shares of services output are generally not tradable, as with government services, many personal services and imputations such as those made in GDP calculations to reflect the rent homeowners are assumed to pay themselves (between six and ten per cent of GDP in most developed economies). It also reflects the fact that the services sector provides significant intermediate inputs to domestic goods manufacturers.
Accounting for the value-added produced by the services sector in the production of goods shows that the service content of total gross exports is over 50 per cent in most OECD economies, approaching two-thirds of the total in the United Kingdom (Figure 3.7). Canada, with significant exports of natural resources, which have typically low services content, has the lowest services content of its exports in the G7 but even here the share is close to 40 per cent.
Typically, emerging economies and other large exporters of natural assets, such as Australia, Chile and Norway, have the lowest shares of services. In India, however, over half of the value of its gross exports originates in the services sector. Indonesia has the lowest share of the 40 countries in the database at around 20 per cent.
Figure 3.7: Services value-added – per cent of total exports, 2009
Source: OECD-WTO Trade in Value-Added (TiVA) indicators, Preliminary Results, OECD January 2013.
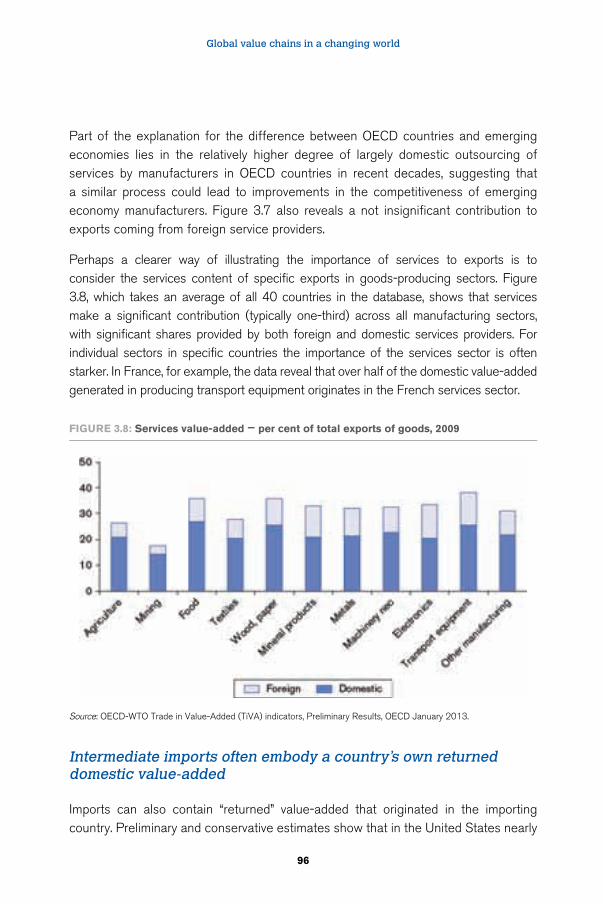
Global value chains in a changing world
96
Part of the explanation for the difference between OECD countries and emerging economies lies in the relatively higher degree of largely domestic outsourcing of services by manufacturers in OECD countries in recent decades, suggesting that a similar process could lead to improvements in the competitiveness of emerging economy manufacturers. Figure 3.7 also reveals a not insignificant contribution to exports coming from foreign service providers.
Perhaps a clearer way of illustrating the importance of services to exports is to consider the services content of specific exports in goods-producing sectors. Figure 3.8, which takes an average of all 40 countries in the database, shows that services make a significant contribution (typically one-third) across all manufacturing sectors, with significant shares provided by both foreign and domestic services providers. For individual sectors in specific countries the importance of the services sector is often starker. In France, for example, the data reveal that over half of the domestic value-added generated in producing transport equipment originates in the French services sector.
Figure 3.8: Services value-added – per cent of total exports of goods, 2009
Source: OECD-WTO Trade in Value-Added (TiVA) indicators, Preliminary Results, OECD January 2013.
Intermediate imports often embody a country' s own returned domestic value-added
Imports can also contain “returned” value-added that originated in the importing country. Preliminary and conservative estimates show that in the United States nearly
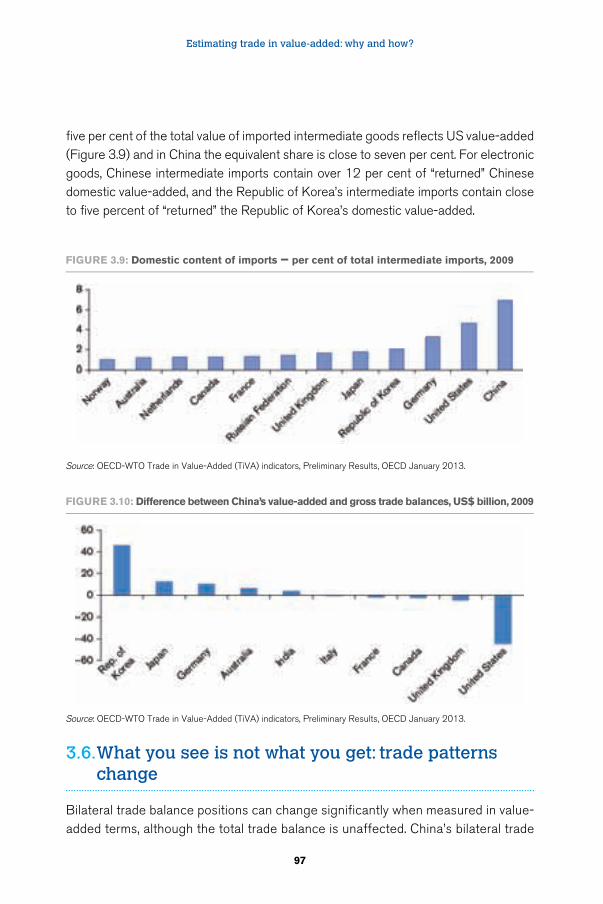
Estimating trade in value-added: why and how?
97
five per cent of the total value of imported intermediate goods reflects US value-added (Figure 3.9) and in China the equivalent share is close to seven per cent. For electronic goods, Chinese intermediate imports contain over 12 per cent of “returned” Chinese domestic value-added, and the Republic of Korea’s intermediate imports contain close to five percent of “returned” the Republic of Korea’s domestic value-added.
Figure 3.9: Domestic content of imports – per cent of total intermediate imports, 2009
Source: OECD-WTO Trade in Value-Added (TiVA) indicators, Preliminary Results, OECD January 2013.
Figure 3.10: Difference between China’s value-added and gross trade balances, uS$ billion, 2009
Source: OECD-WTO Trade in Value-Added (TiVA) indicators, Preliminary Results, OECD January 2013.
3.6. What you see is not what you get: trade patterns change
Bilateral trade balance positions can change significantly when measured in value-added terms, although the total trade balance is unaffected. China’s bilateral trade
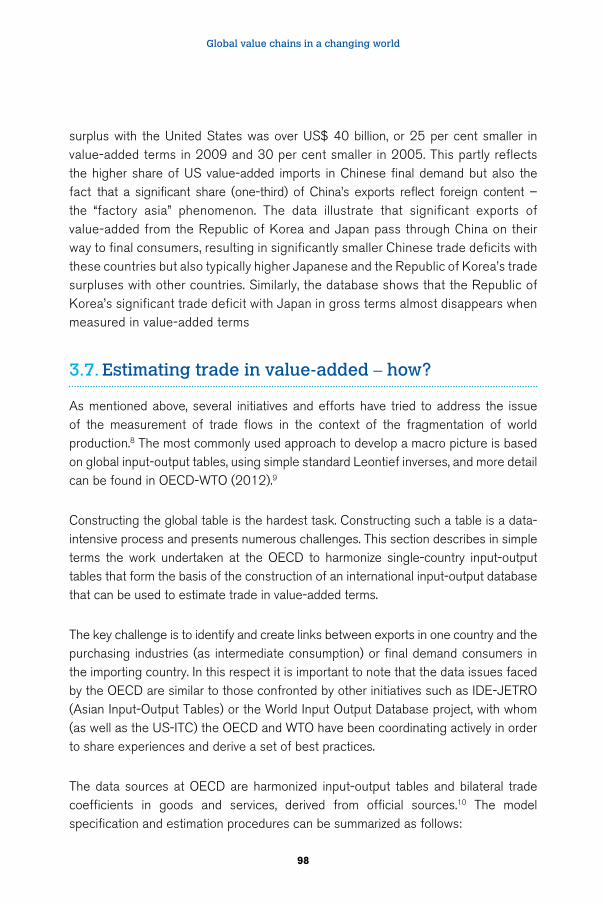
Global value chains in a changing world
98
surplus with the United States was over US$ 40 billion, or 25 per cent smaller in value-added terms in 2009 and 30 per cent smaller in 2005. This partly reflects the higher share of US value-added imports in Chinese final demand but also the fact that a significant share (one-third) of China’s exports reflect foreign content – the “factory asia” phenomenon. The data illustrate that significant exports of value-added from the Republic of Korea and Japan pass through China on their way to final consumers, resulting in significantly smaller Chinese trade deficits with these countries but also typically higher Japanese and the Republic of Korea’s trade surpluses with other countries. Similarly, the database shows that the Republic of Korea’s significant trade deficit with Japan in gross terms almost disappears when measured in value-added terms
3.7. Estimating trade in value-added – how?
As mentioned above, several initiatives and efforts have tried to address the issue of the measurement of trade flows in the context of the fragmentation of world production.8 The most commonly used approach to develop a macro picture is based on global input-output tables, using simple standard Leontief inverses, and more detail can be found in OECD-WTO (2012).9
Constructing the global table is the hardest task. Constructing such a table is a data-intensive process and presents numerous challenges. This section describes in simple terms the work undertaken at the OECD to harmonize single-country input-output tables that form the basis of the construction of an international input-output database that can be used to estimate trade in value-added terms.
The key challenge is to identify and create links between exports in one country and the purchasing industries (as intermediate consumption) or final demand consumers in the importing country. In this respect it is important to note that the data issues faced by the OECD are similar to those confronted by other initiatives such as IDE-JETRO (Asian Input-Output Tables) or the World Input Output Database project, with whom (as well as the US-ITC) the OECD and WTO have been coordinating actively in order to share experiences and derive a set of best practices.
The data sources at OECD are harmonized input-output tables and bilateral trade coefficients in goods and services, derived from official sources.10 The model specification and estimation procedures can be summarized as follows:
Estimating trade in value-added: why and how?
99
• Preparation of I-O tables for reference years using the latest published data sources such as supply and use tables (SUTs), national accounts and trade statistics
• Preparation of bilateral merchandise data by end-use categories for reference years. The published trade statistics are adjusted for analytical purposes, such as confidential flows, re-exports, waste and scrap products and valuables. Trade coefficients of utility services are estimated based on cross-border energy transfers. Other trade coefficients of services sectors are based on OECD trade in services and UN service trade statistics. However, many missing flows are currently estimated using econometric model estimates
• Conversion of c.i.f. price-based import figures to f.o.b. price-based imports to reduce the inconsistency issues of mirror trade (because of asymmetry in reporting exports and imports in national trade statistics, imports of country A from B often differ significantly from the exports reported from B to A). In an international I-O system, trade flows need to be perfectly symmetric (the bilateral trade flows should be consistent at the highest relevant level of disaggregation) and consistent with the supply-utilization tables trade data
• Creation of import matrices
• Total adjustment (as per missing sectors and trade with rest of the world) and minimization of discrepancy columns using bi-proportional methods
The OECD has been updating and maintaining harmonized I-O tables, splitting intermediate flows into tables of domestic origin and imports, since the mid-1990s – usually following the rhythm of national releases of benchmark I-O tables. The first edition of the OECD I-O database dates back to 1995 and covered ten OECD countries with I-O tables spanning the period from the early 1970s to the early 1990s. The first updated edition of this database, released in 2002, increased the country coverage to 18 OECD countries, China and Brazil and introduced harmonized tables for the mid-1990s. The database now includes national I-O tables for 57 economies:11 Australia, Austria, Belgium, Canada, Chile, Czech Republic, Denmark, Estonia, Finland, France, Germany, Greece, Hungary, Iceland, Ireland, Israel, Italy, Japan, Republic of Korea, Luxembourg, Mexico, Netherlands, New Zealand, Norway, Poland, Portugal, Slovak Republic, Slovenia, Spain, Sweden, Switzerland, Turkey, United Kingdom, United States, Argentina, Brazil, China, Chinese Taipei, Cyprus, India, Indonesia, Latvia, Lithuania, Malaysia, Malta, Romania, Russian Federation, Singapore, South Africa, Thailand and Viet Nam.
Global value chains in a changing world
100
The I-O tables show transactions between domestic industries, but supplementary tables, which break down total imports by user (industry and category of final demand), are included. Some countries provide these import tables in conjunction with their I-O tables, but in some cases they are derived by the OECD.
The main assumption used in creating these import matrices is the “proportionality” assumption, which assumes that the share of imports in any product consumed directly as intermediate consumption or final demand (except exports) is the same for all users. Indeed, this is also an assumption that is widely used by national statistics offices in constructing tables. This hypothesis is acceptable for industrialized countries, where there is little product differentiation between what is produced for export and what is produced for the domestic market.12 It is less convincing, however, for developing countries as the import content of exports is usually higher (and much higher for processing) than the import content of products destined for domestic consumption. Improving the way that imports are allocated to users will form a central part of the future work of the OECD and WTO as well as the international statistical system, as stated in the Global Forum on Trade Statistics, in Geneva in February 2011.13 Indeed, the tables included for China capture this heterogeneity by breaking each industry into three categories: firms that provide goods and services for domestic markets only, processing firms and other exporters.
Measuring trade in value-added relates to industries' activity rather than to products, as in conventional trade statistics. The OECD's input-output tables are based on an industry-by-industry basis reflecting the fact that the underlying source data measures the activities and production of industries, which means that the relationships between value-added and industrial output are unaffected by statistical manipulations that will be required to build product-by-product-based input-output tables. The industry classification used in the current version of the OECD’s I-O database is based on ISIC Rev.3 (Table 3.1), meaning that it is compatible with other industry-based analytical data sets and in particular with the OECD bilateral trade in goods by industry dataset which is derived from merchandise trade statistics via standard harmonized system to ISIC conversion keys. The system, by necessity (to maximize cross country comparability), is relatively aggregated. Differentiating between types of companies within a given sector is essential, however, to improve the quality of trade in value-added results (particularly in the context of exporting and non-exporting companies). Thus, part of future work will be to explore ways, using microdata, which could improve the quality of results. See Ahmad and Araujo (2011) and below.
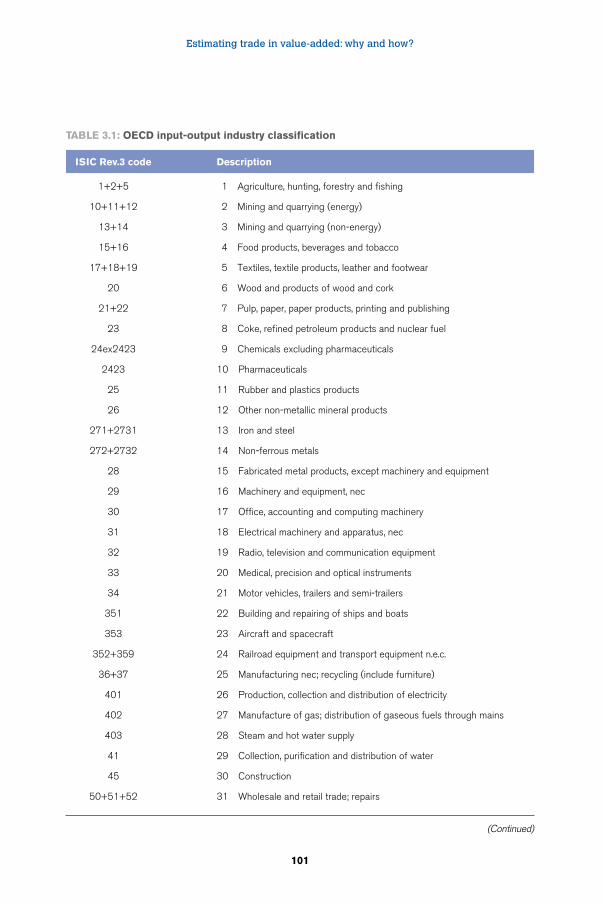
Estimating trade in value-added: why and how?
101
Table 3.1: OeCD input-output industry classification
iSiC rev.3 code Description
1+2+5 1 Agriculture, hunting, forestry and fishing
10+11+12 2 Mining and quarrying (energy)
13+14 3 Mining and quarrying (non-energy)
15+16 4 Food products, beverages and tobacco
17+18+19 5 Textiles, textile products, leather and footwear
20 6 Wood and products of wood and cork
21+22 7 Pulp, paper, paper products, printing and publishing
23 8 Coke, refined petroleum products and nuclear fuel
24ex2423 9 Chemicals excluding pharmaceuticals
2423 10 Pharmaceuticals
25 11 Rubber and plastics products
26 12 Other non-metallic mineral products
271+2731 13 Iron and steel
272+2732 14 Non-ferrous metals
28 15 Fabricated metal products, except machinery and equipment
29 16 Machinery and equipment, nec
30 17 Office, accounting and computing machinery
31 18 Electrical machinery and apparatus, nec
32 19 Radio, television and communication equipment
33 20 Medical, precision and optical instruments
34 21 Motor vehicles, trailers and semi-trailers
351 22 Building and repairing of ships and boats
353 23 Aircraft and spacecraft
352+359 24 Railroad equipment and transport equipment n.e.c.
36+37 25 Manufacturing nec; recycling (include furniture)
401 26 Production, collection and distribution of electricity
402 27 Manufacture of gas; distribution of gaseous fuels through mains
403 28 Steam and hot water supply
41 29 Collection, purification and distribution of water
45 30 Construction
50+51+52 31 Wholesale and retail trade; repairs
(Continued)
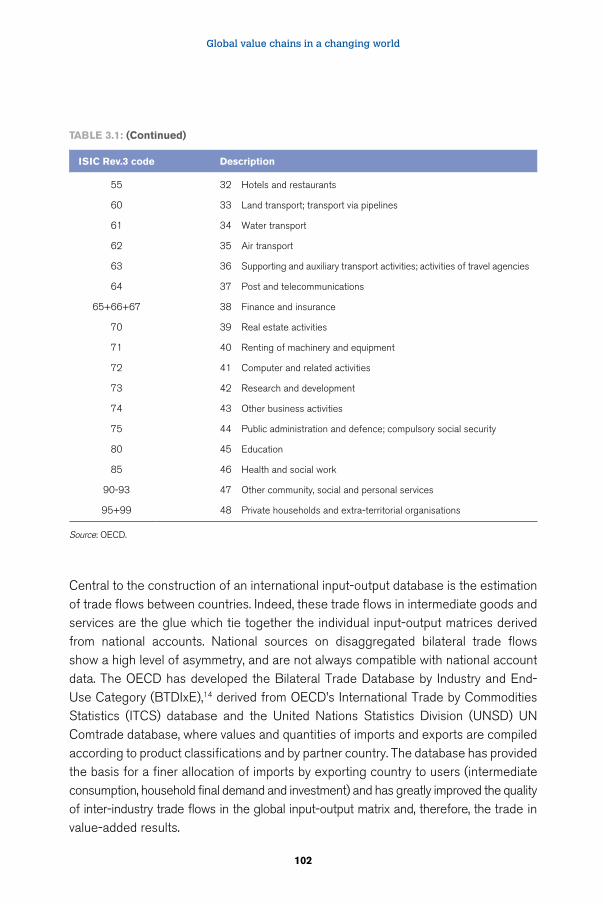
Global value chains in a changing world
102
iSiC rev.3 code Description
55 32 Hotels and restaurants
60 33 Land transport; transport via pipelines
61 34 Water transport
62 35 Air transport
63 36 Supporting and auxiliary transport activities; activities of travel agencies
64 37 Post and telecommunications
65+66+67 38 Finance and insurance
70 39 Real estate activities
71 40 Renting of machinery and equipment
72 41 Computer and related activities
73 42 Research and development
74 43 Other business activities
75 44 Public administration and defence; compulsory social security
80 45 Education
85 46 Health and social work
90-93 47 Other community, social and personal services
95+99 48 Private households and extra-territorial organisations
Source: OECD.
Table 3.1: (Continued)
Central to the construction of an international input-output database is the estimation of trade flows between countries. Indeed, these trade flows in intermediate goods and services are the glue which tie together the individual input-output matrices derived from national accounts. National sources on disaggregated bilateral trade flows show a high level of asymmetry, and are not always compatible with national account data. The OECD has developed the Bilateral Trade Database by Industry and End-Use Category (BTDIxE),14 derived from OECD’s International Trade by Commodities Statistics (ITCS) database and the United Nations Statistics Division (UNSD) UN Comtrade database, where values and quantities of imports and exports are compiled according to product classifications and by partner country. The database has provided the basis for a finer allocation of imports by exporting country to users (intermediate consumption, household final demand and investment) and has greatly improved the quality of inter-industry trade flows in the global input-output matrix and, therefore, the trade in value-added results.
Estimating trade in value-added: why and how?
103
It is important to stress that the indicators shown in the database are estimates. Official gross statistics on international trade produced by national statistics institutions result in inconsistent figures for total global exports and total global imports – inconsistencies which are magnified when bilateral partner country positions are considered. The global input-output tables from which trade in value-added indicators are derived, necessarily eliminate these inconsistencies such as those that reflect different national treatments of re-exports and transit trade (as through hubs such as the Netherlands and Hong Kong, China) to achieve a coherent picture of global trade. For the countries for which data is presented, total exports and imports are consistent with official national accounts estimates. But bilateral trade positions presented in the database (based on gross flows) and those published by national statistics institutions may differ. Work is ongoing within the international statistics community to achieve coherence in international trade flows, particularly in the area of trade in services, where significant differences exist when comparing national statistics. In addition, it is useful to put the two key underlying assumptions used to derive indicators into a broader content:
• Production assumption – indicators created via input-output techniques are limited by the degree of industry disaggregation provided by the tables. As shown above, the national input-output tables used by the OECD are based on a harmonized set of 37 industries. Any given indicator, therefore, assumes that all consumers of a given industry’s output purchase exactly the same shares of products produced by all of the firms allocated to that industry. This boils down in practice (but is not the same thing) to assuming that there exists only one single production technique for all of the firms and all of the products in the industry grouping. We know that this is not true and that different firms, even those producing the same products, will have different production techniques and technical coefficients, and we also know that different firms produce different products and that these products will be destined for different types of consumers and markets. A chief concern in this respect is the evidence that points to exports having very different coefficients to goods and services produced for domestic markets, particularly when the exports (typically intermediate) are produced by foreign-owned affiliates in a global value chain. Because exporting firms are generally more integrated into value-added chains, they will typically have higher foreign content ratios, particularly when they are foreign owned. As such, the estimates provided in this version should be considered as prudent. Generally, they will point to lower shares of foreign content than might be recorded if more detailed input-output tables were available with consequences for all other indicators presented. One important innovation in the indicators presented here is to use specially constructed input-output tables
Global value chains in a changing world
104
for China that differentiate between processing firms, other exporting firms and those that produce goods and services only for domestic consumption. Because of China’s importance to trade this significantly improves the quality of the results.
• Proportionality assumption: on its own, this assumption is not expected to have a significant impact on total economy estimates but it will affect the import content of various industries and, by extension, bilateral trade estimates of trade in value-added. The results, however, are not expected to be biased in any particular direction.
3.8. Concluding remarks: challenges ahead
The OECD and the WTO have been closely cooperating with other stakeholders involved or interested in the issue of producing estimates of trade in value-added. However, as shown above, many statistical issues remain to be resolved. More generally, best practices need to be established when trade and national accounts divergences cannot be resolved simply and diverging sources need to be arbitraged. Given the importance of the subject, the OECD and the WTO will be looking to engage more closely with their networks of official statistics institutes and other international organizations in the coming years in order to attempt to mainstream the production of trade in value-added statistics, such that their quality can be considered in the same light as other official statistics.
Clearly, the key technical challenges in the immediate future concern the quality of trade statistics and the assumptions made to allocate imports to users, be they industries or consumers. In addition, there are a number of issues that arise from the recent revision to the System of National Accounts (2008 SNA) and Balance of Payments Manual (BPM6) which provide the underlying basis for international trade transactions and indeed those recorded in input-output tables. Chief among these concerns are changes made to the recording of “goods sent abroad for processing” and “merchanting”. Other important changes have been made, such as the recognition that research and development expenditures should be recorded as investment, which directly changes value-added. Indeed, the recognition of R&D as investment shines a spotlight on other intellectual property products and on the importance of flows of income as opposed to only value-added.
Additionally, work will begin on looking at a corollary to trade in value-added, namely trade in jobs. Other areas include the contribution made by capital more generally. Because of the way capital (gross fixed capital formation) is recorded in the accounting system, the goods content of services is generally low but in theory this
Estimating trade in value-added: why and how?
105
value is captured in the services sector’s operating surplus. Capturing these flows is also important, particularly for those countries with high exports of capital goods. Work will also begin to look at the benefits to the wholesale and retail sector of selling imported goods to final consumers. Again, the institutional networks of the OECD and its partner organizations in the international statistics community are well placed to provide an umbrella for these issues to be further developed.
Endnotes
1 Financial Times, 24 January 2011.
2 WTO and Commission des Finances du Sénat, (2011).
3 “Adding value to the European Economy. How anti-dumping can damage the supply of globalised European companies. Five case studies from the shoe industry”, Kommerskollegium, National Board of Trade, Stockholm, 2007.
4 See Escaith et al., (2010) and Lee et al., (1997).
5 See an application of international IO on “Japan’s earthquake and tsunami: International trade and global supply chain impacts”, VoxEU, April 2011. Available at: http://www.voxeu.org/index.php?q=node/6430
6 See WTO and IDE-JETRO (2011).
7 For more information on the database see www.oecd.org/trade/valueadded.
8 An OECD-World Bank workshop, “new metrics for global value chains”, was organized on 21 September 2010. WTO hosted a Global Forum on Trade Statistics on 2–4 February 2011, in collaboration with Eurostat, UNSD and UNCTAD.
9 OECD-WTO, 2012.
10 Some research-oriented initiatives have been using the GTAP data base for international input-output data. This is not however based on official sources of statistics.
11 For more details, see also www.oecd.org/sti/inputoutput.
12 The results of parallel projects at the OECD and EUROSTAT on micro-data bases linking trade statistics and business registers will help characterizing better the profile of export-oriented firms.
13 Global Forum “Measuring Global Trade — Do we have the right numbers?” 2–4 February 2011, jointly organized by the United Nations Statistics Division (UNSD), the Statistical Office of the European Communities (Eurostat) with the World Trade Organization (WTO) and the United Nations Conference on Trade and Development (UNCTAD).
14 For more details, see www.oecd.org/sti/btd.
Global value chains in a changing world
106
References
Ahmad, N.; Wyckoff, A. 2003. “Carbon Dioxide Emissions Embodied in International Trade of Goods”, OECD Science, Technology and Industry Working Papers 2003/15 (Paris, France, Organization for Economic Co-operation and Development).
Ahmad, N; Araujo, S. 2011. “Measuring Trade in Value-Added and Income using Firm-Level data”. Available at: http://siteresources.worldbank.org/INTRANETTRADE/Resources/Internal- Training/287823-1256848879189/6526508-1283456658475/7370147-1308070299 728/7997263-1308070314933/PAPER_8_Ahmad_Araujo.pdf
Ali-Yrkkö, J.; Rouvinen, P.; Seppälä, T.; Ylä-Anttila, P. 2011. “Who Captures Value in Global Supply
Daudin, G.; Monperrus-Veroni, P.; Rifflart, C.; Schweisguth, D. 2006. “Le commerce extérieur en valeur ajoutée” Revue de l’OFCE, 98:129–165.
Daudin, G.; Rifflart, C.; Schweisguth, D. 2009. “Who produces for Whom in the World Economy?”,
Dedrick, J.; Kraemer, K.L.; Linden, G. 2010. “Who Profits from Innovation in Global Value Chains?: A Study of the iPod and notebook PCs”, in Industrial and Corporate Change 19(1), 81–116.
Escaith, H. 2008. “Nouvelle économie industrielle, commerce international et valeur ajoutée: implications statistiques et comptables”, Actes du 12e colloque de l’Association de comptabilité nationale in INSEE-Méthodes, 225-251.
Escaith, H.; Lindenberg, N.; Miroudot, S. 2010. “International Supply Chains and Trade Elasticity in Time of Global Crisis”, WTO Staff Working Paper ERSD-2010-08 (Geneva, Switzerland, World Trade Organization).
Escaith, H.; Keck, A.; Nee, C.; Teh, R. 2011. «Japan’s Earthquake and Tsunami: International Trade and Global Supply Chain Impacts», in VoxEU, 28 April. Available at: http://www.voxeu.org/article/japans-earthquake-and-tsunami-global-supply-chain-impacts
Hummels, D.; Ishii, J.; Kei-Mu, Y. 2001. “The nature and growth of vertical specialization in world trade,” in Journal of International Economics, 54(1): 75–96.
Johnson, R.C.; Noguera, G. 2011. “Accounting for Intermediates: Production Sharing and Trade in Value-Added” in Journal of International Economics, forthcoming.
Jones, R.; Kierzkowski, H. 2001. “A Framework for Fragmentation”, in S. Arndt and H. Kierzkowski (eds):
Estimating trade in value-added: why and how?
107
Hayakawa, K. 2007. “Growth of Intermediate Goods Trade in East Asia” in Pacific Economic Review 12(4), 511–523.
Koopman, R.; Wang, Z.; Wei, S.-J. 2008. “How Much Chinese Exports is Really Made in China – Assessing Foreign and Domestic Value-Added in Gross Exports”, NBER Working Paper No. 14109 (Cambridge MA, National Bureau of Economic Research).
Koopman, R.; Powers, W.; Wang, Z.; Wei, S.-J. 2011. “Give Credit to Where Credit is Due: Tracing Value Added in Global Production Chains”, NBER Working Paper No. 16426, September 2010, revised September 2011 (Cambridge MA, National Bureau of Economic Research).
Lanz, R.; Miroudot, S.; Ragoussis, A. 2009. “Trade in Intermediate Goods and Services”, OECD Trade Policy Working Paper No. 93 (Paris, France, Organization for Economic Co-operation and Development).
Lee, H.L.; Padmanabhan, V.; Whang, S. 1997. “The Bullwhip Effect in Supply Chains” in Sloan Management Review, 38(3), 93–102.
Leontief, W.; Strout, A. 1963. “Multiregional Input-Output Analysis”, in: T. Barna (ed.): Structural Interdependence and Economic Development, (New York, St-Martin’s Press), 119–150.
Linden, G.; Kraemer, K. L.; Dedrick, J. 2009. “Who Captures Value in a Global Innovation Network? The Case of Apple’s iPod”, in Communications of the ACM 52(3), 140–144.
Linden, G.; Kraemer, K. L.; Dedrick, J. 2011. “Who Captures Value in the Apple iPad?”, in mimeo, March.
Maurer, A.; Degain, C. 2010. “Globalization and Trade Flows: What You See is not What You Get!”, WTO, Staff Working Paper N° ERSD-2010-12 (Geneva, Switzerland, World Trade Organization).
Meng, B.; Yamano, N.; Webb, C. 2010. “Application of Factor Decomposition Techniques to Vertical Specialisation Measurements”, IDE-JETRO Discussion Paper No. 276 (Tokyo, Japan, Institute for Developing Economies-Japan External Trade Organization).
Nakano, S.; Okamura, A.; Sakurai, N.; Suzuki, M.; Tojo, T.; Yamano, N. 2009. “The Measurement of CO2 Embodiments in International Trade. Evidence from Harmonised Input-Output and Bilateral Trade Database”, OECD Science, Technology and Industry Working Papers 2009/3 (Paris, France, Organization for Economic Co-operation and Development).
OECD. 2012. “New Sources of Growth: Knowledge-Based Capital Driving Investment and Productivity in the 21st Century”, Interim Project Findings. Electronic access: http://www.oecd.org/sti/50498841.pdf.
Global value chains in a changing world
108
Parikh, A. 1979. “Forecasts of Input-Output Tables using the RAS Method”, in Review of Economics and Statistics 61 (3), 477–481.
Sanyal, K.; Jones, R. 1982. “The Theory of Trade in Middle Products”, in American Economic Review 72(1), 16–31.
Walmsley, T. L.; Lakatos, C. 2008. “Regional Input-Output Data”, in B. Narayanan and T.L. Walmsley (eds): Global Trade, Assistance, and Production: The GTAP 7 Data Base, (West Lafayette, IN, Center for Global Trade Analysis, Purdue University).
WTO; Senate Finance Commission. 2011. Conference Proceedings “Globalization of Industrial Production Chains and Measurement of Trade in Value Added” (Geneva). Available at: http://www.ceibs.edu/knowledge/papers/images/20060317/2847. pdf
WTO; IDE-JETRO. 2011. “Trade Patterns and Global Value Chains in East Asia: from Trade in Goods to Trade in Tasks” (Geneva, Switzerland, World Trade Organization and Tokyo, Japan, Institute for Developing Economies-Japan External Trade Organization).
Xing, Y.; Detert, N. 2010. “How the iPhone Widens the United States Trade Deficit with the People’s Republic of China”, ADBI Working Paper Series No. 257 (Tokyo, Japan, Asian Development Bank Institute).
109
4 The implications of using value-added trade data for applied trade policy analysis1
Robert B. Koopman, Marinos Tsigas, David Riker and William Powers
4.1. Introduction
Recent efforts to examine trade data from a value-added perspective, and linking that work to global value and supply chains, has largely been driven by the recognition that traditional data on imports and exports may be masking the increasingly cross-border nature of global production networks. In this paper we examine how using new data sets on value-added trade in two traditional empirical models, a trade-based computable general equilibrium model and an econometric estimation of exchange rate pass through, generate new and useful insights. Our results suggest that the new data sets could improve empirical information used to support policy making.
The two empirical exercises we undertake aim to capture features of the increasing fragmentation of production in international trade. Early efforts to explain and measure this fragmentation include papers such as Feenstra (1998; 2000) and Hummels et al., (1999), which focused largely on factor content and/or vertical specialization measures. Later papers by Koopman et al., (2010), Koopman et al., (2012b) and Johnson and Noguera (2012) extended this work in country specific and global settings by explicitly focusing on value-added in trade and aimed to explain and measure the links between standard trade data measured in gross terms and trade measured in value-added terms. Papers by Grossman and Rossi-Hansberg (2008) and Baldwin (2011) are among those that develop conceptual explanations as to why fragmentation in trade occurs.
The growing body of work on measuring trade in value-added is largely aimed at providing empirical estimates of trade data that are consistent with measures of gross
Global value chains in a changing world
110
domestic product (GDP), purging double counting of intermediates and tracing the global value chain more precisely through countries’ domestic production, exports and imports (see, for example, Timmer, 2012 regarding the World Input Output Database (WIOD), OECD/WTO, 2013, USITC, 2011).2 These new databases tell a rich and consistent story of how production in many countries is dependent on imports, and that imports are often further transformed and exported. Thus we now have global databases of value-added trade at the broad sectoral level, consistent with global macro variables for GDP that also clearly capture empirically the stories widely circulated about value chains in specific products such as the iPod, iPad, iPhone, notebook computers and Barbie Dolls.3 One of the iPhone calculations illustrates that a US$ 179 import from China contains approximately US$ 7 of Chinese value-added, and that the iPhone imported from China probably contains more US value-added than Chinese value-added.4
These databases are important because they provide a more accurate and nuanced understanding of trade flows that are often masked by the traditional trade data. For instance, policy debates around the US–China bilateral trade imbalance often propose policies to offset what are described as the artificially low renminbi–dollar exchange rate, unfair subsidies and trading practices of the Chinese Government and the inability to compete with exceptionally low Chinese wages. Policy prescriptions typically call for the Chinese to substantially appreciate the renminbi or for the US to place a tariff on imports from China to offset the perceived undervaluation. The value-added trade databases illustrate clearly at a more macro level the iPhone story. The WTO/OECD value-added estimates of the US-China merchandise trade balance for 2010 is US$ 131 billion, compared to the traditional trade data’s balance of US$ 176 billion, while US deficits with Japan, the Republic of Korea and other Asian countries grow.5 Koopman et al., (2010) show that Chinese value-added by sector varies widely, with electronic products and many other products produced in Chinese export processing zones containing relatively low levels of Chinese value-added, while products such as steel, textiles and clothing contain relatively high levels of Chinese value-added. Thus policy responses to concerns over gross trade imbalances are likely to have unexpected and unintended consequences that are specific to the policy response. A unilateral appreciation of the renminbi will have a bigger impact on the importing country prices of goods produced by Chinese sectors containing substantial Chinese value-added, such as steel and textiles. However, unilateral renminbi appreciation is likely to have smaller impacts on the importing country prices for those products exported from China using substantial amounts of imported components, such as those produced in export processing zones, for example electronic goods.6 These effects suggest that
The implications of using value-added trade data for applied trade policy analysis
111
standard, bilateral macro level comparisons of exchange rate effects on a country’s exports could be very misleading.
Obviously China is not the only country affected by such factors. De La Cruz et al., (2010) illustrate that Mexican exports to the US have less domestic value-added than Chinese exports to the US. The efforts to create global databases such as (1) WIOD, (2) Global Trade Analysis Project (GTAP) based databases (used by Koopman et al., and Johnson and Noguera, among others), and (3) the WTO-OECD database demonstrate clearly that all countries participate in global value chains and the extent and depth to which they participate can be masked when using databases based on traditional gross trade statistics. These new databases suggest that traditional economic models that use databases built using simplifying assumptions about import uses in consumption, investment and export production in the domestic economy may not accurately capture the value chain impacts across countries.7
In the remainder of this paper we examine the effect of using the new value-added trade databases on two important empirical applications. First, we build a version of the now standard computable general equilibrium (CGE) trade model, using a GTAP based database and a model that uses information derived from the USITC global value chains work instead of traditional trade data and examine the impact of two scenarios – a US tariff placed on Chinese imports aimed at offsetting a low exchange rate and a second scenario approximating an appreciation of the renminbi by a similar amount as the US tariff. We then compare the results of this global value chains (GVC) based model with results from a model based on traditional data and find that the GVC trade model has quite important differences that more clearly illustrate how global value and supply chains work through the global economy, and how they can cause some unexpected and unintended effects within and across economies.
The second application is to use the WIOD value-added trade database to empirically estimate exchange rate and other price change pass-through, and compare the results of those estimations from the same data but using gross trade data instead of value-added trade. There is a broad literature, which we describe later in this paper, that examines a long-running question on why exchange rates and other global price changes have less than perfect pass through to domestic prices. Again we find substantial differences between the estimates, with the value-added-based estimates providing a statistically superior fit and intuitively more appealing results than those based on the literature.
Global value chains in a changing world
112
4.2. Value-added trade data and CGE experiments of two hypothetical US-Asia rebalancing scenarios8
In this section we examine the potential effects of two US-Asia rebalancing scenarios using two different CGE models and databases. We compare selected results from the GTAP global trade CGE model (Hertel, 1997; Narayanan et al., 2012) with results from a CGE global trade model based on the global value chain (GVC) data discussed thus far (this model is discussed in detail in Koopman et al., 2013). The economic theory of the GVC model is similar to the theory of the GTAP model except for two differences that are discussed below.
We run two hypothetical comparative-static experiments to illustrate two alternative mechanisms that could result in a rebalancing in US-Asia trade flows using the GTAP model and the GVC model. The first hypothetical scenario is a decline in real savings in China by about 17 per cent. The second hypothetical scenario is the US applies additional duties on imports from China at the rate of 27.5 per cent. These two experiments are not calibrated to produce the same effect for any particular variable; thus differences in a particular effect across the two experiments do not imply that one change is more effective than the other change.
4.3. CGE models and data
The data sets for both the GTAP model and the GVC model have essentially the same regions and sectors. Both data sets focus on the United States and China as well as their top trade partners. Table 4.1 shows the 26 regions and 41 production sectors in each region that are specified to represent the world economy. The first difference between the GTAP and the GVC model is that in the GVC model China and Mexico have export processing zones and these zones are modelled as separate economies. Thus the total number of economies in the GVC model is 28. Figure 4.1 illustrates the GVC model linkages between the processing trade economy in China, the rest of China and a third economy, Japan. Figure 4.1 shows that there is two-way trade between Japan and the two Chinese economies; Japanese products enter the Chinese processing zone duty free; the rest of the Chinese economy exports products to its processing zone but does not import any products from it; finally, it is assumed that labour and capital can move freely between the Chinese export processing zone and the rest of the economy in China. The same linkages apply to Mexico and its processing zone in the GVC model. In the standard GTAP model trade is only specified
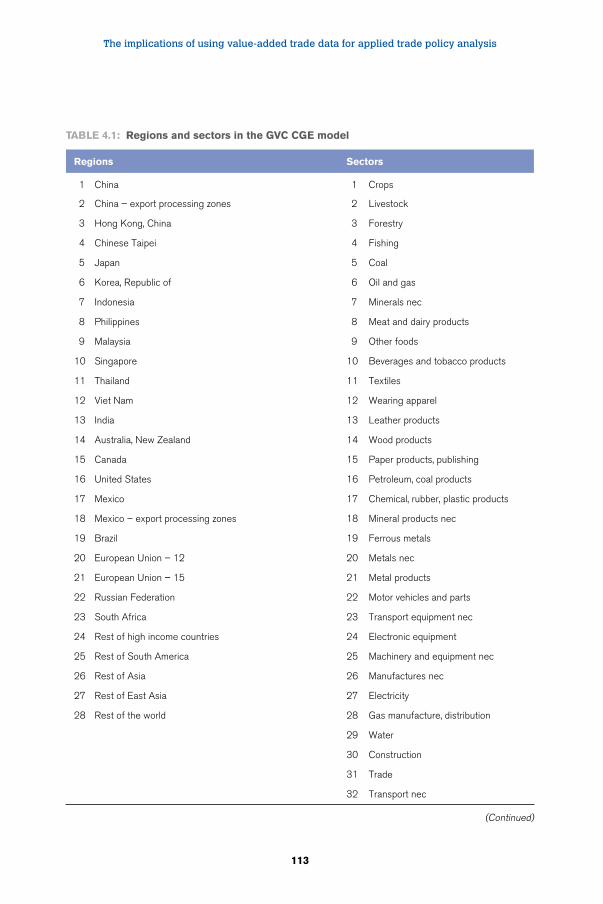
The implications of using value-added trade data for applied trade policy analysis
113
Table 4.1: Regions and sectors in the GVC CGe model
Regions Sectors
1 China 1 Crops
2 China – export processing zones 2 Livestock
3 Hong Kong, China 3 Forestry
4 Chinese Taipei 4 Fishing
5 Japan 5 Coal
6 Korea, Republic of 6 Oil and gas
7 Indonesia 7 Minerals nec
8 Philippines 8 Meat and dairy products
9 Malaysia 9 Other foods
10 Singapore 10 Beverages and tobacco products
11 Thailand 11 Textiles
12 Viet Nam 12 Wearing apparel
13 India 13 Leather products
14 Australia, New Zealand 14 Wood products
15 Canada 15 Paper products, publishing
16 United States 16 Petroleum, coal products
17 Mexico 17 Chemical, rubber, plastic products
18 Mexico – export processing zones 18 Mineral products nec
19 Brazil 19 Ferrous metals
20 European Union – 12 20 Metals nec
21 European Union – 15 21 Metal products
22 Russian Federation 22 Motor vehicles and parts
23 South Africa 23 Transport equipment nec
24 Rest of high income countries 24 Electronic equipment
25 Rest of South America 25 Machinery and equipment nec
26 Rest of Asia 26 Manufactures nec
27 Rest of East Asia 27 Electricity
28 Rest of the world 28 Gas manufacture, distribution
29 Water
30 Construction
31 Trade
32 Transport nec
(Continued)
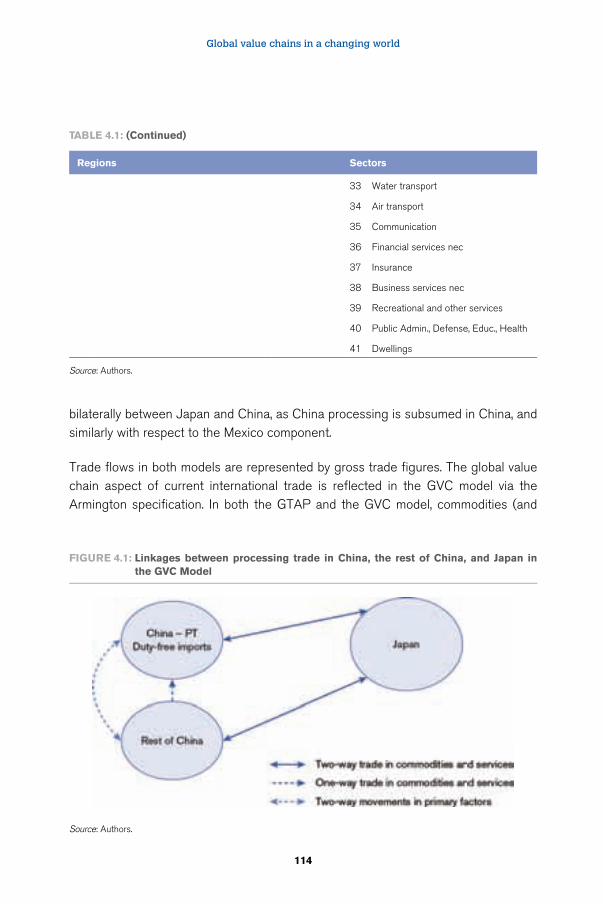
Global value chains in a changing world
114
FiGuRe 4.1: linkages between processing trade in China, the rest of China, and Japan in the GVC Model
Source: Authors.
Regions Sectors
33 Water transport
34 Air transport
35 Communication
36 Financial services nec
37 Insurance
38 Business services nec
39 Recreational and other services
40 Public Admin., Defense, Educ., Health
41 Dwellings
Source: Authors.
Table 4.1: (Continued)
bilaterally between Japan and China, as China processing is subsumed in China, and similarly with respect to the Mexico component.
Trade flows in both models are represented by gross trade figures. The global value chain aspect of current international trade is reflected in the GVC model via the Armington specification. In both the GTAP and the GVC model, commodities (and
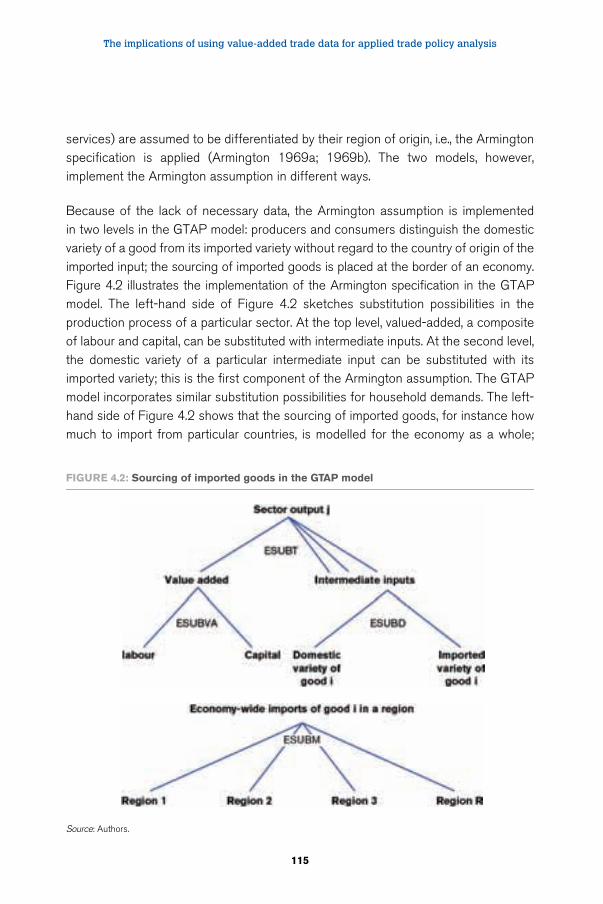
The implications of using value-added trade data for applied trade policy analysis
115
services) are assumed to be differentiated by their region of origin, i.e., the Armington specification is applied (Armington 1969a; 1969b). The two models, however, implement the Armington assumption in different ways.
Because of the lack of necessary data, the Armington assumption is implemented in two levels in the GTAP model: producers and consumers distinguish the domestic variety of a good from its imported variety without regard to the country of origin of the imported input; the sourcing of imported goods is placed at the border of an economy. Figure 4.2 illustrates the implementation of the Armington specification in the GTAP model. The left-hand side of Figure 4.2 sketches substitution possibilities in the production process of a particular sector. At the top level, valued-added, a composite of labour and capital, can be substituted with intermediate inputs. At the second level, the domestic variety of a particular intermediate input can be substituted with its imported variety; this is the first component of the Armington assumption. The GTAP model incorporates similar substitution possibilities for household demands. The left-hand side of Figure 4.2 shows that the sourcing of imported goods, for instance how much to import from particular countries, is modelled for the economy as a whole;
FiGuRe 4.2: Sourcing of imported goods in the GTaP model
Source: Authors.
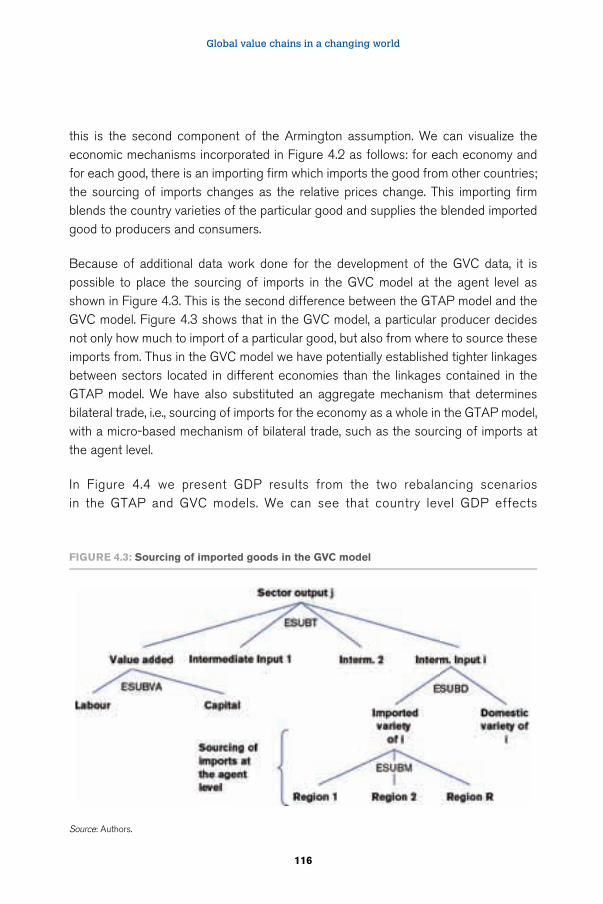
Global value chains in a changing world
116
this is the second component of the Armington assumption. We can visualize the economic mechanisms incorporated in Figure 4.2 as follows: for each economy and for each good, there is an importing firm which imports the good from other countries; the sourcing of imports changes as the relative prices change. This importing firm blends the country varieties of the particular good and supplies the blended imported good to producers and consumers.
Because of additional data work done for the development of the GVC data, it is possible to place the sourcing of imports in the GVC model at the agent level as shown in Figure 4.3. This is the second difference between the GTAP model and the GVC model. Figure 4.3 shows that in the GVC model, a particular producer decides not only how much to import of a particular good, but also from where to source these imports from. Thus in the GVC model we have potentially established tighter linkages between sectors located in different economies than the linkages contained in the GTAP model. We have also substituted an aggregate mechanism that determines bilateral trade, i.e., sourcing of imports for the economy as a whole in the GTAP model, with a micro-based mechanism of bilateral trade, such as the sourcing of imports at the agent level.
In Figure 4.4 we present GDP results from the two rebalancing scenarios in the GTAP and GVC models. We can see that country level GDP effects
FiGuRe 4.3: Sourcing of imported goods in the GVC model
Source: Authors.
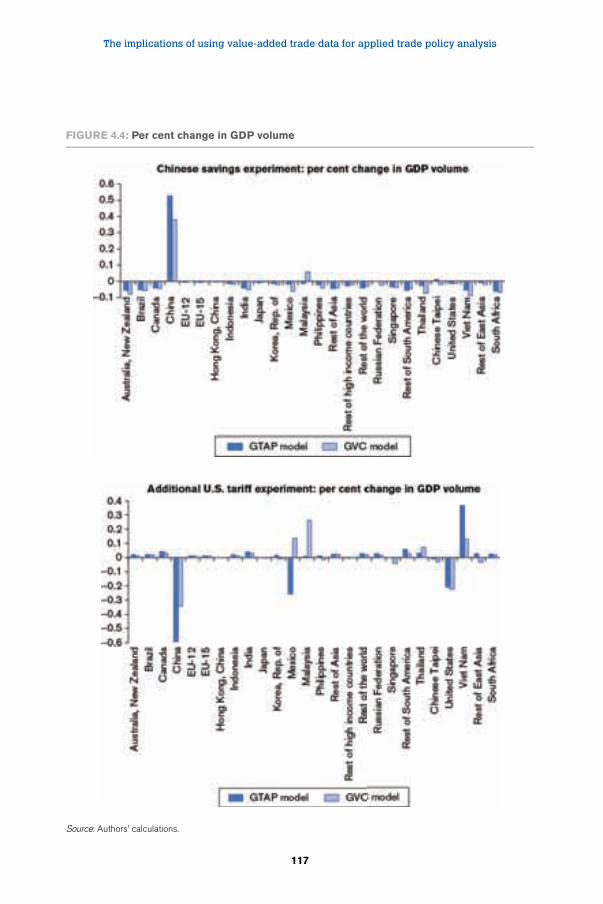
The implications of using value-added trade data for applied trade policy analysis
117
FiGuRe 4.4: Per cent change in GDP volume
Source: Authors’ calculations.
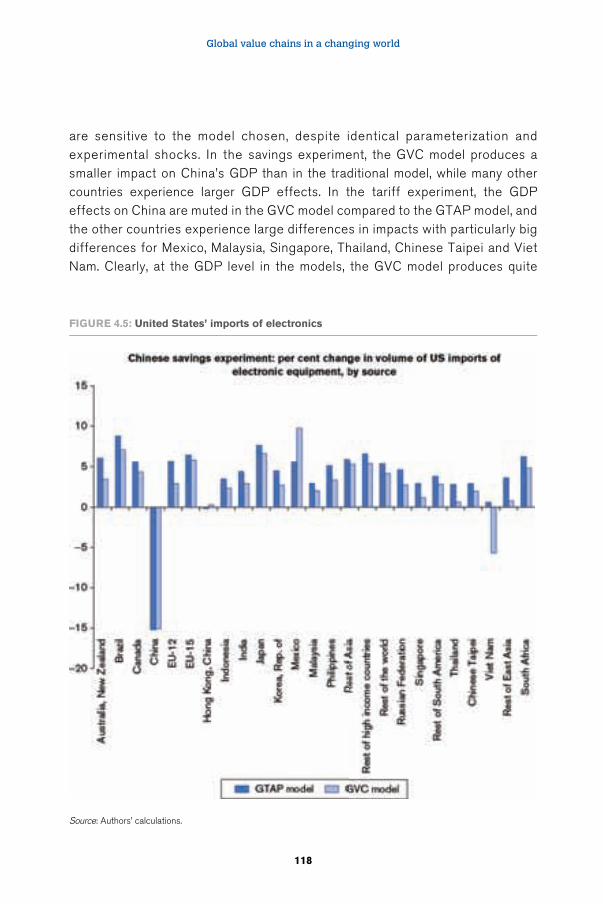
Global value chains in a changing world
118
are sensitive to the model chosen, despite identical parameterization and experimental shocks. In the savings experiment, the GVC model produces a smaller impact on China’s GDP than in the traditional model, while many other countries experience larger GDP effects. In the tariff experiment, the GDP effects on China are muted in the GVC model compared to the GTAP model, and the other countries experience large differences in impacts with particularly big differences for Mexico, Malaysia, Singapore, Thailand, Chinese Taipei and Viet Nam. Clearly, at the GDP level in the models, the GVC model produces quite
FiGuRe 4.5: united States’ imports of electronics
Source: Authors’ calculations.
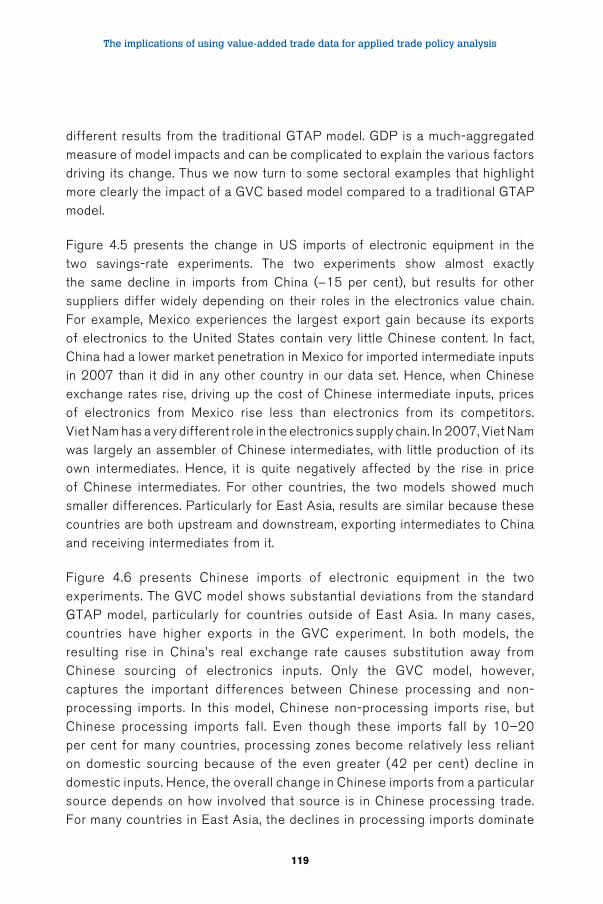
The implications of using value-added trade data for applied trade policy analysis
119
different results from the traditional GTAP model. GDP is a much-aggregated measure of model impacts and can be complicated to explain the various factors driving its change. Thus we now turn to some sectoral examples that highlight more clearly the impact of a GVC based model compared to a traditional GTAP model.
Figure 4.5 presents the change in US imports of electronic equipment in the two savings-rate experiments. The two experiments show almost exactly the same decline in imports from China (-15 per cent), but results for other suppliers differ widely depending on their roles in the electronics value chain. For example, Mexico experiences the largest export gain because its exports of electronics to the United States contain very little Chinese content. In fact, China had a lower market penetration in Mexico for imported intermediate inputs in 2007 than it did in any other country in our data set. Hence, when Chinese exchange rates rise, driving up the cost of Chinese intermediate inputs, prices of electronics from Mexico rise less than electronics from its competitors. Viet Nam has a very different role in the electronics supply chain. In 2007, Viet Nam was largely an assembler of Chinese intermediates, with little production of its own intermediates. Hence, it is quite negatively affected by the rise in price of Chinese intermediates. For other countries, the two models showed much smaller differences. Particularly for East Asia, results are similar because these countries are both upstream and downstream, exporting intermediates to China and receiving intermediates from it.
Figure 4.6 presents Chinese imports of electronic equipment in the two experiments. The GVC model shows substantial deviations from the standard GTAP model, particularly for countries outside of East Asia. In many cases, countries have higher exports in the GVC experiment. In both models, the resulting rise in China’s real exchange rate causes substitution away from Chinese sourcing of electronics inputs. Only the GVC model, however, captures the important differences between Chinese processing and non-processing imports. In this model, Chinese non-processing imports rise, but Chinese processing imports fall. Even though these imports fall by 10–20 per cent for many countries, processing zones become relatively less reliant on domestic sourcing because of the even greater (42 per cent) decline in domestic inputs. Hence, the overall change in Chinese imports from a particular source depends on how involved that source is in Chinese processing trade. For many countries in East Asia, the declines in processing imports dominate
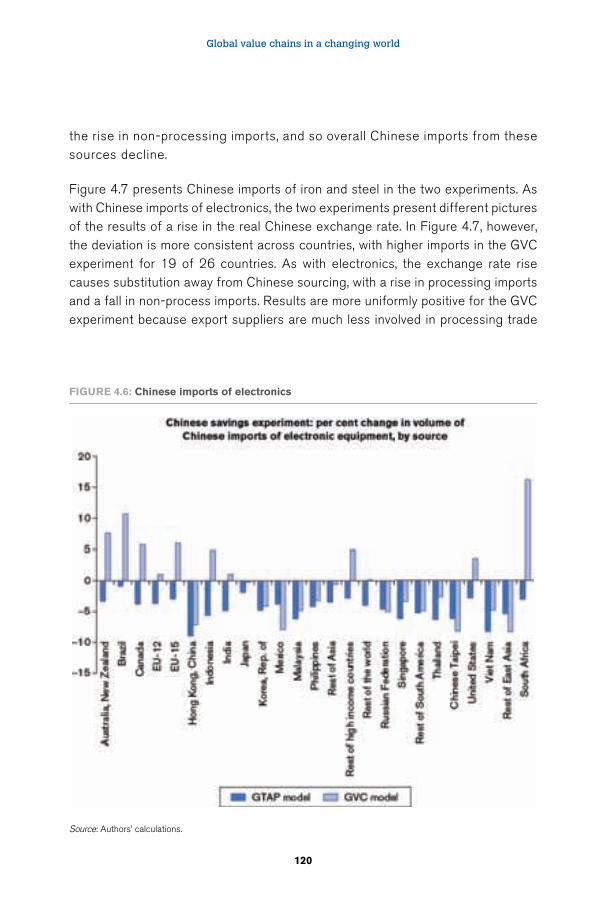
Global value chains in a changing world
120
the rise in non-processing imports, and so overall Chinese imports from these sources decline.
Figure 4.7 presents Chinese imports of iron and steel in the two experiments. As with Chinese imports of electronics, the two experiments present different pictures of the results of a rise in the real Chinese exchange rate. In Figure 4.7, however, the deviation is more consistent across countries, with higher imports in the GVC experiment for 19 of 26 countries. As with electronics, the exchange rate rise causes substitution away from Chinese sourcing, with a rise in processing imports and a fall in non-process imports. Results are more uniformly positive for the GVC experiment because export suppliers are much less involved in processing trade
FiGuRe 4.6: Chinese imports of electronics
Source: Authors’ calculations.
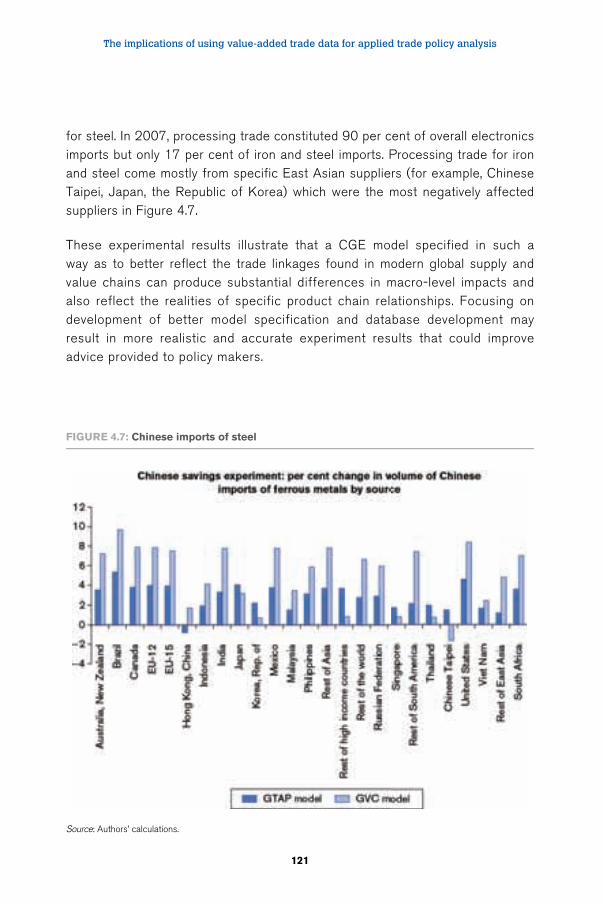
The implications of using value-added trade data for applied trade policy analysis
121
for steel. In 2007, processing trade constituted 90 per cent of overall electronics imports but only 17 per cent of iron and steel imports. Processing trade for iron and steel come mostly from specific East Asian suppliers (for example, Chinese Taipei, Japan, the Republic of Korea) which were the most negatively affected suppliers in Figure 4.7.
These experimental results illustrate that a CGE model specified in such a way as to better reflect the trade linkages found in modern global supply and value chains can produce substantial differences in macro-level impacts and also reflect the realities of specific product chain relationships. Focusing on development of better model specification and database development may result in more realistic and accurate experiment results that could improve advice provided to policy makers.
FiGuRe 4.7: Chinese imports of steel
Source: Authors’ calculations.
Global value chains in a changing world
122
4.4. Value-added trade data and estimation of exchange rate and price pass through effects9
We now examine the impact of using value-added trade data compared to traditional gross trade data to examine exchange rate pass-through. Fluctuations in exchange rates can have significant effects on the competitiveness of foreign producers who export to the US market. As long as there are rigidities in nominal wages and prices, reductions in the nominal value of an exporter’s currency will lower its relative costs of production and the relative price of its exports. The magnitude of the resulting change in the demand for US imports will depend on the substitutability of imports from other countries and on the currency denomination of the costs of these international competitors.
There is a sizeable empirical and theoretical literature that investigates the pass-through of nominal exchange rate fluctuations into import prices and the resulting change in international trade flows. Goldberg and Knetter (1997) provide a broad review of the literature on exchange rate pass-through. Marazzi et al., (2005) and Brun-Aguerre et al., (2012) are important recent contributions. A common assumption in empirical studies of exchange rate pass through is that each exporter’s entire marginal cost of product is denominated in the exporter’s domestic currency. However, if some of the exporter’s intermediate inputs are imported, and these costs are not denominated in the exporter’s domestic currency, then the exporter’s marginal costs of production will only be partly exposed to fluctuations in the value of its currency. In this more realistic case, the effect of the exchange rate changes will depend on the share of domestic value-added in marginal costs.
This limitation — the unrealistic representation of the currency exposure of production costs — is often recognized in the literature as a caveat, but it is difficult to resolve because there is often only limited information on costs of production. More realistic modelling of costs requires information about value-added shares in the exporting country, but it also requires information about the currency denomination of the marginal costs of all of the other countries that compete in the same destination market. For example, an appreciation of the renminbi will affect the marginal costs (and prices) of exporters from China, according to the domestic share of the value-added in their exports, but it will also affect the marginal costs (and prices) of any exporters in Mexico or other countries whose products include value-added from China. Thus the recent developments in the estimation of value-added trade flows provide the needed information in a form that is easy to use and
The implications of using value-added trade data for applied trade policy analysis
123
we can then compare empirical results using this new data with results estimated using traditional trade data.10
To examine the effect of the alternative data sets we estimate a set of econometric models of exchange rate pass through and the link between exchange rates and trade flows using data on the value-added content of trade. Our analysis focuses on trade in non-petroleum manufactured goods for final use over the last decade, as recorded in WIOD. We translate our parameter estimates into pass-through rates and Armington elasticities, and then ultimately into trade elasticities (defined here as the change in export value resulting from a change in the nominal exchange rate). We find evidence that value-added trade data can significantly improve estimates of exchange rate pass-through rates and trade elasticities by more fully accounting for the effects of a reduction in the value of an exporter’s currency on its own costs and the costs of its international competitors.
Two important differences between our methodology and other recent studies of exchange rate pass through are the level of product aggregation and the use of trade values rather than price data. Recent contributions to the exchange rate pass through literature often use price data for narrow products and estimate a correlation between import prices and nominal exchange rates. In contrast, we use the fairly aggregated WIOD sectors and estimate a correlation between the value of trade flows and nominal exchange rates. Our method is constrained by the level of aggregation in the WIOD data and by the absence of prices in the WIOD data. Despite these limitations, our methodology makes two important contributions. First, it utilizes the value-added shares to calculate a more realistic measure of the currency denomination of the exporters’ costs. Second, it generates estimates of trade elasticities in addition to pass through rates.
4.5. Econometric estimates
Our econometric analysis is derived from an import demand specification for goods. Its theoretical underpinnings are similar to those of the gravity model of international trade.11 All variables in the model are derived and estimated as a percentage change over time. For each sector, the model examines the determinants of the percentage change over time in the value of bilateral exports from exporter i to importer j.12 It explains the export value change in terms of an export price change measured using the information on the global sources of value-added in goods exported by country i.13 For each country adding value to this flow, the country’s value-added share is
Global value chains in a changing world
124
combined with information on price changes in that country and nominal exchange rate changes that the country had with the importing country j. Thus, rather than explaining the change in export values with only the final exporter i ’s price and exchange rate information, the model uses the price and exchange rate changes of all countries adding value to i ’s exports, weighted by the share of value each of these countries contributes. Appendix A specifies the estimating equation and shows how the exchange-rate pass-through (λ) and elasticity of substitution (σ) are calculated from the regression coefficients.
For our econometric estimation we use data from WIOD.14 The estimate of value-added shares relies on a transformation from the direct input-output table provided by WIOD into the Leontief inverse matrix, which describes all inputs, direct and indirect, used in the provision of final goods.15 For our estimates, the WIOD database provides the required data on sectoral trade, domestic expenditure, and, after transformation, the value-added shares. We estimate the model using OLS and a panel of log-first-differences from 2000 to 2009 for 13 non-petroleum manufacturing sectors in 28 of the largest countries in the WIOD dataset.
Table 4.2 presents the estimates of the exchange rate pass-through rate (λ) and the substitution elasticity (σ) for each sector. Overall, the estimated pass-through rates are sensible and precisely estimated in our preferred specification (the first three columns of the table). In eight of the 13 sectors, estimates are bounded between zero and one at the 95 per cent significance level, and only two sectors (transportation equipment and food, beverages and tobacco) have point estimates outside this range. Thus for most sectors, we can strongly reject the hypothesis that there is complete pass through of nominal exchange rate fluctuations. The median pass-through estimate is 0.44. Estimated pass-through rates of this magnitude are consistent with the finding of incomplete pass-through in the prior studies cited above. The estimates for substitution elasticity for our preferred specification in table 4.1 are also precisely estimated. The point estimates are all greater than one and significantly different from one in nine sectors at the 95 per cent significance level. The median elasticity is 1.84. For comparison, we are not aware of any estimates employing the current methodology or WIOD data, but elasticities in the GTAP model may be the closest available estimates at a similar level of aggregation. The median elasticity in the 15 non-food, non-petroleum manufacturing sectors in the GTAP model is 3.75, twice the median estimate in this study.
Table 4.2 also presents estimates employing an alternative specification that assumes that exports contain 100 per cent domestic content (a constraint on the value-added
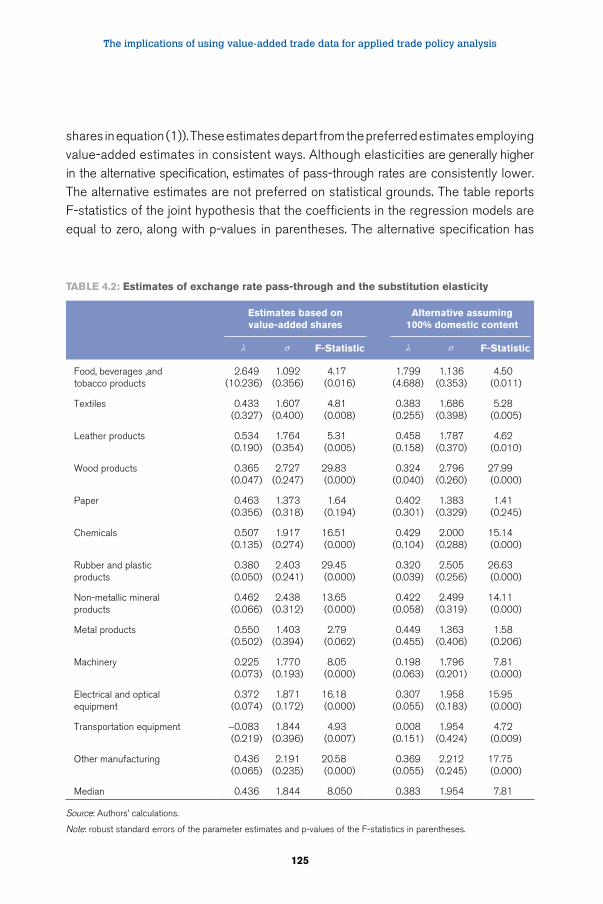
The implications of using value-added trade data for applied trade policy analysis
125
shares in equation (1)). These estimates depart from the preferred estimates employing value-added estimates in consistent ways. Although elasticities are generally higher in the alternative specification, estimates of pass-through rates are consistently lower. The alternative estimates are not preferred on statistical grounds. The table reports F-statistics of the joint hypothesis that the coefficients in the regression models are equal to zero, along with p-values in parentheses. The alternative specification has
Table 4.2: estimates of exchange rate pass-through and the substitution elasticity
estimates based on value-added shares
alternative assuming 100% domestic content
F-Statistic F-Statistic
Food, beverages ,andtobacco products
2.649(10.236)
1.092(0.356)
4.17(0.016)
1.799(4.688)
1.136(0.353)
4.50(0.011)
Textiles 0.433(0.327)
1.607(0.400)
4.81(0.008)
0.383(0.255)
1.686(0.398)
5.28(0.005)
Leather products 0.534(0.190)
1.764(0.354)
5.31(0.005)
0.458(0.158)
1.787(0.370)
4.62(0.010)
Wood products 0.365(0.047)
2.727(0.247)
29.83(0.000)
0.324(0.040)
2.796(0.260)
27.99(0.000)
Paper 0.463(0.356)
1.373(0.318)
1.64(0.194)
0.402(0.301)
1.383(0.329)
1.41(0.245)
Chemicals 0.507(0.135)
1.917(0.274)
16.51(0.000)
0.429(0.104)
2.000(0.288)
15.14(0.000)
Rubber and plasticproducts
0.380(0.050)
2.403(0.241)
29.45(0.000)
0.320(0.039)
2.505(0.256)
26.63(0.000)
Non-metallic mineralproducts
0.462(0.066)
2.438(0.312)
13.65(0.000)
0.422(0.058)
2.499(0.319)
14.11(0.000)
Metal products 0.550(0.502)
1.403(0.394)
2.79(0.062)
0.449(0.455)
1.363(0.406)
1.58(0.206)
Machinery 0.225(0.073)
1.770(0.193)
8.05(0.000)
0.198(0.063)
1.796(0.201)
7.81(0.000)
Electrical and optical equipment
0.372(0.074)
1.871(0.172)
16.18(0.000)
0.307(0.055)
1.958(0.183)
15.95(0.000)
Transportation equipment -0.083(0.219)
1.844(0.396)
4.93(0.007)
0.008(0.151)
1.954(0.424)
4.72(0.009)
Other manufacturing 0.436(0.065)
2.191(0.235)
20.58(0.000)
0.369(0.055)
2.212(0.245)
17.75(0.000)
Median 0.436 1.844 8.050 0.383 1.954 7.81
Source: Authors’ calculations.
Note: robust standard errors of the parameter estimates and p-values of the F-statistics in parentheses.
Global value chains in a changing world
126
a lower F-statistic in 10 of the 13 sectors than the preferred specification. Thus the model based on value-added shares performs better than the simpler model that ignores this information.
4.6. Trade elasticities
The trade elasticity TEijtis defined as the percentage change in the value of exports from country i to country j for every one percent increase in the value of the exporter’s currency.16
The trade elasticity consists of two parts: an own-price effect and a price-index effect. For country i, the own-price effect is determined by the share of i ’s value-added in its own exports, while the price-index effect depends on the share of i ’s value-added used by all competing exporters. Appendix A gives the expression for the trade elasticity based on value-added shares, export shares and the pass-through and elasticity of substitution values given in Table 4.2.
To illustrate the model, we have calculated trade elasticity estimates for exports to the United States in 2009. We use WIOD data for all countries in 2009 to calculate the value-added shares and US expenditure shares of exports from 27 countries in 13 manufacturing sectors.17 We also use our econometric estimates of λ and σ from Table 4.2. Table 4.3 provides specific examples for exports of electrical and optical equipment in 2009 from three different countries to the United States. The table reports the two sets of trade elasticity estimates, and it reports the value-added shares measures that underlie the differences in the estimates across the four countries. For example, the China column indicates that a 10 per cent increase in the renminbi price of a US dollar (a 10 per cent renminbi depreciation relative to the US dollar) will increase the value of China’s exports to the US in this sector by 2.039 per cent (if the value-added trade data are not used in the estimate) or by 1.373 per cent (in our preferred specification using value-added trade data). The latter is almost a third lower. The trade elasticity that uses the value-added trade data is a combination of a positive 2.156 per cent own-price effect and a negative 0.783 percent price-index effect that offsets some of the own price effect.
The trade elasticity estimates for exports from Brazil are much larger than their counterparts for China, reflecting Brazil’s relatively small share of US imports, its
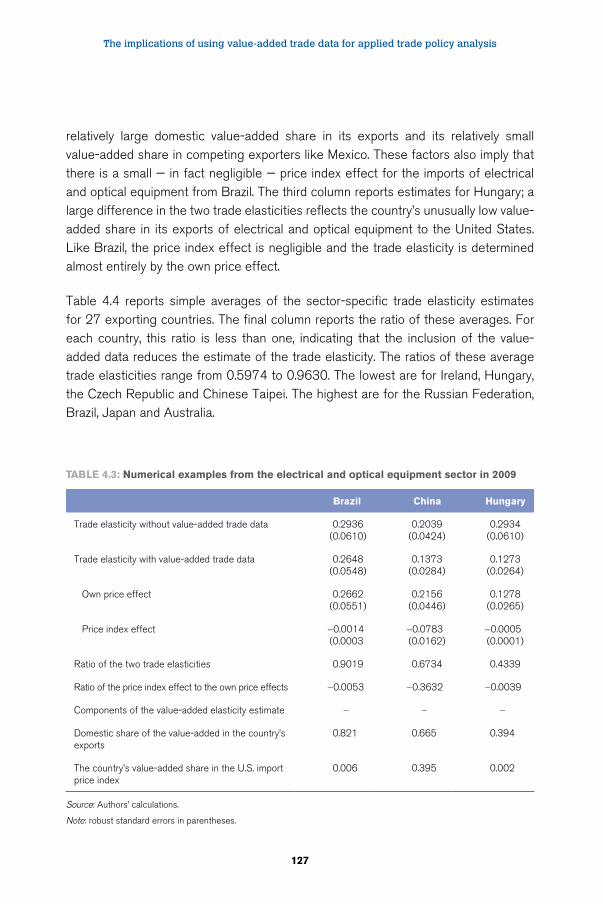
The implications of using value-added trade data for applied trade policy analysis
127
relatively large domestic value-added share in its exports and its relatively small value-added share in competing exporters like Mexico. These factors also imply that there is a small — in fact negligible — price index effect for the imports of electrical and optical equipment from Brazil. The third column reports estimates for Hungary; a large difference in the two trade elasticities reflects the country’s unusually low value-added share in its exports of electrical and optical equipment to the United States. Like Brazil, the price index effect is negligible and the trade elasticity is determined almost entirely by the own price effect.
Table 4.4 reports simple averages of the sector-specific trade elasticity estimates for 27 exporting countries. The final column reports the ratio of these averages. For each country, this ratio is less than one, indicating that the inclusion of the value-added data reduces the estimate of the trade elasticity. The ratios of these average trade elasticities range from 0.5974 to 0.9630. The lowest are for Ireland, Hungary, the Czech Republic and Chinese Taipei. The highest are for the Russian Federation, Brazil, Japan and Australia.
Table 4.3: Numerical examples from the electrical and optical equipment sector in 2009
brazil China Hungary
Trade elasticity without value-added trade data 0.2936(0.0610)
0.2039(0.0424)
0.2934(0.0610)
Trade elasticity with value-added trade data 0.2648(0.0548)
0.1373(0.0284)
0.1273(0.0264)
Own price effect 0.2662(0.0551)
0.2156(0.0446)
0.1278(0.0265)
Price index effect -0.0014(0.0003
-0.0783(0.0162)
-0.0005(0.0001)
Ratio of the two trade elasticities 0.9019 0.6734 0.4339
Ratio of the price index effect to the own price effects -0.0053 -0.3632 -0.0039
Components of the value-added elasticity estimate - - -
Domestic share of the value-added in the country’s exports
0.821 0.665 0.394
The country’s value-added share in the U.S. import price index
0.006 0.395 0.002
Source: Authors’ calculations.
Note: robust standard errors in parentheses.
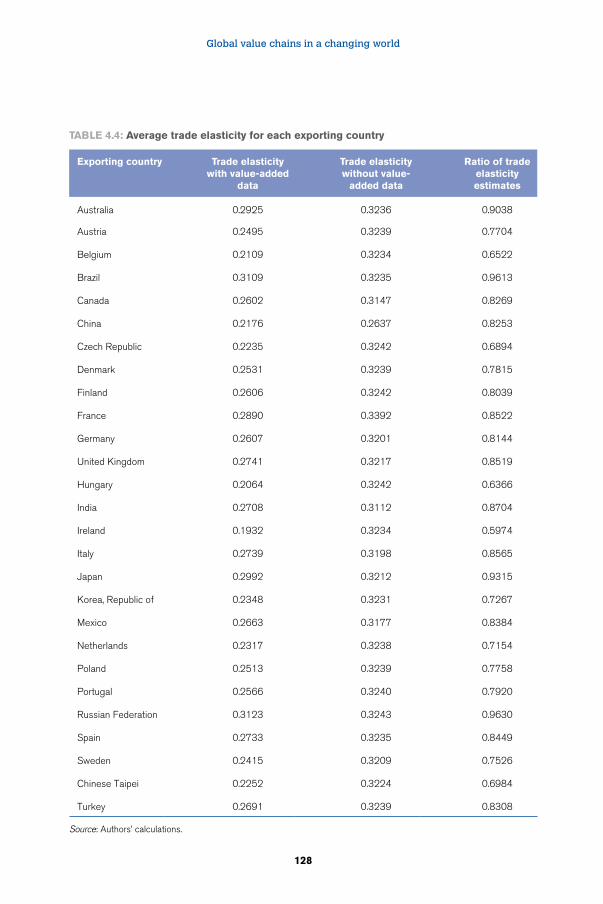
Global value chains in a changing world
128
Table 4.4: average trade elasticity for each exporting country
exporting country Trade elasticity with value-added
data
Trade elasticity without value-
added data
Ratio of trade elasticity estimates
Australia 0.2925 0.3236 0.9038
Austria 0.2495 0.3239 0.7704
Belgium 0.2109 0.3234 0.6522
Brazil 0.3109 0.3235 0.9613
Canada 0.2602 0.3147 0.8269
China 0.2176 0.2637 0.8253
Czech Republic 0.2235 0.3242 0.6894
Denmark 0.2531 0.3239 0.7815
Finland 0.2606 0.3242 0.8039
France 0.2890 0.3392 0.8522
Germany 0.2607 0.3201 0.8144
United Kingdom 0.2741 0.3217 0.8519
Hungary 0.2064 0.3242 0.6366
India 0.2708 0.3112 0.8704
Ireland 0.1932 0.3234 0.5974
Italy 0.2739 0.3198 0.8565
Japan 0.2992 0.3212 0.9315
Korea, Republic of 0.2348 0.3231 0.7267
Mexico 0.2663 0.3177 0.8384
Netherlands 0.2317 0.3238 0.7154
Poland 0.2513 0.3239 0.7758
Portugal 0.2566 0.3240 0.7920
Russian Federation 0.3123 0.3243 0.9630
Spain 0.2733 0.3235 0.8449
Sweden 0.2415 0.3209 0.7526
Chinese Taipei 0.2252 0.3224 0.6984
Turkey 0.2691 0.3239 0.8308
Source: Authors’ calculations.
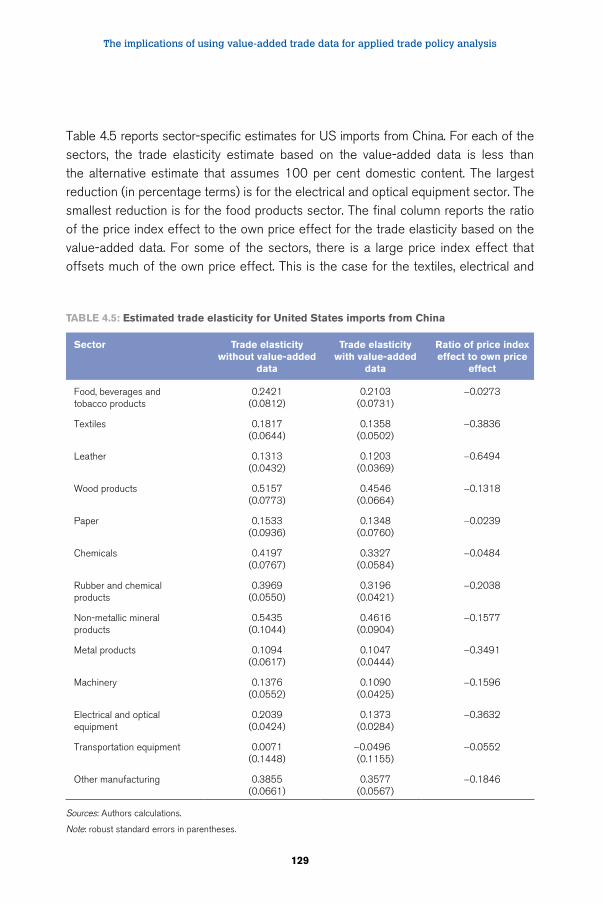
The implications of using value-added trade data for applied trade policy analysis
129
Table 4.5 reports sector-specific estimates for US imports from China. For each of the sectors, the trade elasticity estimate based on the value-added data is less than the alternative estimate that assumes 100 per cent domestic content. The largest reduction (in percentage terms) is for the electrical and optical equipment sector. The smallest reduction is for the food products sector. The final column reports the ratio of the price index effect to the own price effect for the trade elasticity based on the value-added data. For some of the sectors, there is a large price index effect that offsets much of the own price effect. This is the case for the textiles, electrical and
Table 4.5: estimated trade elasticity for united States imports from China
Sector Trade elasticity without value-added
data
Trade elasticity with value-added
data
Ratio of price index effect to own price
effect
Food, beverages andtobacco products
0.2421(0.0812)
0.2103(0.0731)
-0.0273
Textiles 0.1817(0.0644)
0.1358(0.0502)
-0.3836
Leather 0.1313(0.0432)
0.1203(0.0369)
-0.6494
Wood products 0.5157(0.0773)
0.4546(0.0664)
-0.1318
Paper 0.1533(0.0936)
0.1348(0.0760)
-0.0239
Chemicals 0.4197(0.0767)
0.3327(0.0584)
-0.0484
Rubber and chemical products
0.3969(0.0550)
0.3196(0.0421)
-0.2038
Non-metallic mineral products
0.5435(0.1044)
0.4616(0.0904)
-0.1577
Metal products 0.1094(0.0617)
0.1047(0.0444)
-0.3491
Machinery 0.1376(0.0552)
0.1090(0.0425)
-0.1596
Electrical and optical equipment
0.2039(0.0424)
0.1373(0.0284)
-0.3632
Transportation equipment 0.0071(0.1448)
-0.0496(0.1155)
-0.0552
Other manufacturing 0.3855(0.0661)
0.3577(0.0567)
-0.1846
Sources: Authors calculations.
Note: robust standard errors in parentheses.
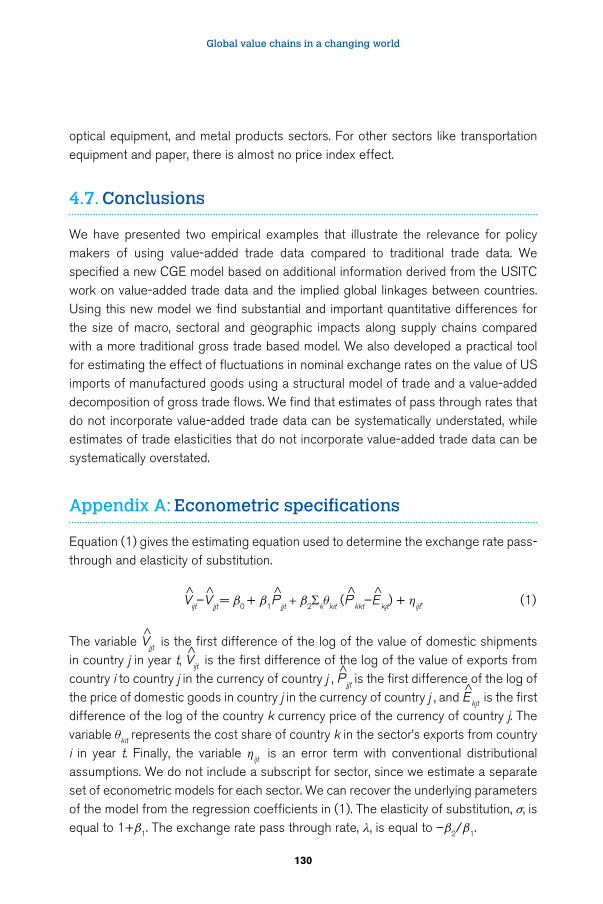
Global value chains in a changing world
130
optical equipment, and metal products sectors. For other sectors like transportation equipment and paper, there is almost no price index effect.
4.7. Conclusions
We have presented two empirical examples that illustrate the relevance for policy makers of using value-added trade data compared to traditional trade data. We specified a new CGE model based on additional information derived from the USITC work on value-added trade data and the implied global linkages between countries. Using this new model we find substantial and important quantitative differences for the size of macro, sectoral and geographic impacts along supply chains compared with a more traditional gross trade based model. We also developed a practical tool for estimating the effect of fluctuations in nominal exchange rates on the value of US imports of manufactured goods using a structural model of trade and a value-added decomposition of gross trade flows. We find that estimates of pass through rates that do not incorporate value-added trade data can be systematically understated, while estimates of trade elasticities that do not incorporate value-added trade data can be systematically overstated.
Appendix A: Econometric specifications
Equation (1) gives the estimating equation used to determine the exchange rate pass-through and elasticity of substitution.
V^
ijt–V^
jjt = β0 + β1P^
jjt + β2Σkθkit (P^
kkt–E^
kjt) + ηijt. (1)
The variable V^
jjt is the first difference of the log of the value of domestic shipments in country j in year t, V
^ijt is the first difference of the log of the value of exports from
country i to country j in the currency of country j , P^
jjt is the first difference of the log of the price of domestic goods in country j in the currency of country j , and E
^kjt is the first
difference of the log of the country k currency price of the currency of country j. The variable θkit represents the cost share of country k in the sector’s exports from country i in year t. Finally, the variable ηijt is an error term with conventional distributional assumptions. We do not include a subscript for sector, since we estimate a separate set of econometric models for each sector. We can recover the underlying parameters of the model from the regression coefficients in (1). The elasticity of substitution, σ, is equal to 1+β1. The exchange rate pass through rate, λ, is equal to –β2/β1.
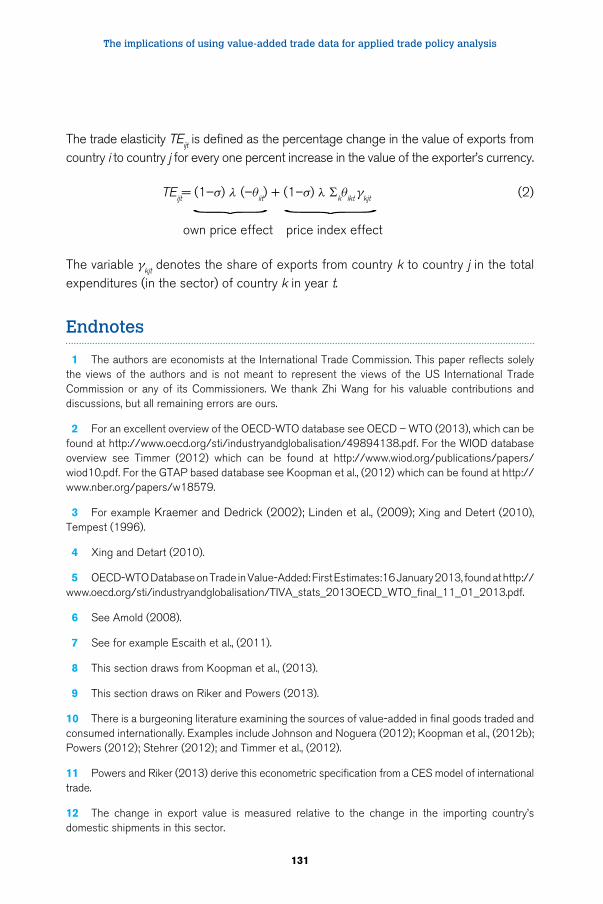
The implications of using value-added trade data for applied trade policy analysis
131
The trade elasticity TEijt is defined as the percentage change in the value of exports from country i to country j for every one percent increase in the value of the exporter’s currency.
TEijt= (1–σ) λ (–θiit) + (1–σ) λ Σkθikt γkjt (2) } }
own price effect price index effect
The variable γkjt denotes the share of exports from country k to country j in the total expenditures (in the sector) of country k in year t.
Endnotes
1 The authors are economists at the International Trade Commission. This paper reflects solely the views of the authors and is not meant to represent the views of the US International Trade Commission or any of its Commissioners. We thank Zhi Wang for his valuable contributions and discussions, but all remaining errors are ours.
2 For an excellent overview of the OECD-WTO database see OECD – WTO (2013), which can be found at http://www.oecd.org/sti/industryandglobalisation/49894138.pdf. For the WIOD database overview see Timmer (2012) which can be found at http://www.wiod.org/publications/papers/wiod10.pdf. For the GTAP based database see Koopman et al., (2012) which can be found at http://www.nber.org/papers/w18579.
3 For example Kraemer and Dedrick (2002); Linden et al., (2009); Xing and Detert (2010), Tempest (1996).
4 Xing and Detart (2010).
5 OECD-WTO Database on Trade in Value-Added: First Estimates:16 January 2013, found at http://www.oecd.org/sti/industryandglobalisation/TIVA_stats_2013OECD_WTO_final_11_01_2013.pdf.
6 See Amold (2008).
7 See for example Escaith et al., (2011).
8 This section draws from Koopman et al., (2013).
9 This section draws on Riker and Powers (2013).
10 There is a burgeoning literature examining the sources of value-added in final goods traded and consumed internationally. Examples include Johnson and Noguera (2012); Koopman et al., (2012b); Powers (2012); Stehrer (2012); and Timmer et al., (2012).
11 Powers and Riker (2013) derive this econometric specification from a CES model of international trade.
12 The change in export value is measured relative to the change in the importing country’s domestic shipments in this sector.
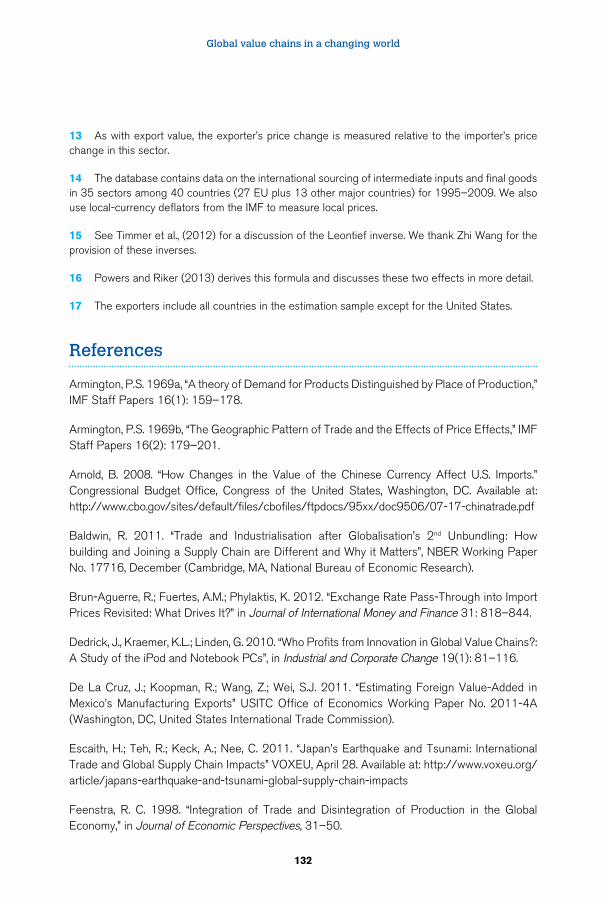
Global value chains in a changing world
132
13 As with export value, the exporter’s price change is measured relative to the importer’s price change in this sector.
14 The database contains data on the international sourcing of intermediate inputs and final goods in 35 sectors among 40 countries (27 EU plus 13 other major countries) for 1995–2009. We also use local-currency deflators from the IMF to measure local prices.
15 See Timmer et al., (2012) for a discussion of the Leontief inverse. We thank Zhi Wang for the provision of these inverses.
16 Powers and Riker (2013) derives this formula and discusses these two effects in more detail.
17 The exporters include all countries in the estimation sample except for the United States.
References
Armington, P.S. 1969a, “A theory of Demand for Products Distinguished by Place of Production,” IMF Staff Papers 16(1): 159–178.
Armington, P.S. 1969b, “The Geographic Pattern of Trade and the Effects of Price Effects,” IMF Staff Papers 16(2): 179–201.
Arnold, B. 2008. “How Changes in the Value of the Chinese Currency Affect U.S. Imports.” Congressional Budget Office, Congress of the United States, Washington, DC. Available at: http://www.cbo.gov/sites/default/files/cbofiles/ftpdocs/95xx/doc9506/07-17-chinatrade.pdf
Baldwin, R. 2011. “Trade and Industrialisation after Globalisation’s 2nd Unbundling: How building and Joining a Supply Chain are Different and Why it Matters”, NBER Working Paper No. 17716, December (Cambridge, MA, National Bureau of Economic Research).
Brun-Aguerre, R.; Fuertes, A.M.; Phylaktis, K. 2012. “Exchange Rate Pass-Through into Import Prices Revisited: What Drives It?” in Journal of International Money and Finance 31: 818–844.
Dedrick, J., Kraemer, K.L.; Linden, G. 2010. “Who Profits from Innovation in Global Value Chains?: A Study of the iPod and Notebook PCs”, in Industrial and Corporate Change 19(1): 81–116.
De La Cruz, J.; Koopman, R.; Wang, Z.; Wei, S.J. 2011. “Estimating Foreign Value-Added in Mexico’s Manufacturing Exports” USITC Office of Economics Working Paper No. 2011-4A (Washington, DC, United States International Trade Commission).
Escaith, H.; Teh, R.; Keck, A.; Nee, C. 2011. “Japan’s Earthquake and Tsunami: International Trade and Global Supply Chain Impacts” VOXEU, April 28. Available at: http://www.voxeu.org/article/japans-earthquake-and-tsunami-global-supply-chain-impacts
Feenstra, R. C. 1998. “Integration of Trade and Disintegration of Production in the Global Economy,” in Journal of Economic Perspectives, 31–50.
The implications of using value-added trade data for applied trade policy analysis
133
Feenstra, R. C.; Hanson, G. H. 2000. “Aggregation Bias in the Factor Content of Trade: Evidence from U.S. Manufacturing,” in American Economic Review, Papers and Proceedings, 90(2): 155–160.
Goldberg, P. K.; Knetter, M. M. 1997. “Goods Prices and Exchange Rates: What Have We Learned?” in Journal of Economic Literature 35: 1243–1272.
Grossman G. M.; Rossi-Hansberg, E. 2008. “Trading Tasks: A Simple Theory of Offshoring,” in American Economic Review, American Economic Association, December, 98(5): 1978–97.
Hertel, T. 1997. “Global Trade Analysis: Modeling and Applications”, (Cambridge, UK, Cambridge University Press).
Hummels, D., Ishii, J.; Yi K-M. 1999. “The Nature and Growth of Vertical Specialization in World Trade,” Staff Reports No. 72, (New York, NY, Federal Reserve Bank of New York).
Johnson, R. C.; Noguera, G. 2012. “Accounting for Intermediates: Production Sharing and Trade in Value-Added,” in Journal of International Economics 86(2): 224–236.
Koopman, R,;Powers, W.M.;Wang, Z.; Wei, S.J. 2010. “Give Credit where Credit is Due: Tracing Value-Added in Global Productions Networks”, NBER Working Paper No. W16426 (Cambridge, MA, National Bureau of Economic Research).
Koopman, R.; Wang, Z.; Wei, S-J. 2012a. “Gross Exports Accounting and Global Value Chain” PowerPoint presentation at MOFCOM-WTO-UNCTAD-OECD joint conference on “Global Value Chain in the 21st Century: Policy Implications on Trade, Investment, Statistics and Developing Countries” September 19–20.
Koopman, R.; Wang, Z.; Wei, S-J. 2012b. “Tracing Value-added and Double Counting in Gross Exports.” NBER Working Paper No. 18579 (Cambridge, MA, National Bureau of Economic Research).
Koopman, R., Tsigas, M.; Wang, Z.; Li, X. 2012. “U.S.-Asia Trade: Dynamic General Equilibrium Linkages,” USITC Working Paper 2013-01-X (Washington, DC, United States International Trade Commission).
Koopman, R.; Tsigas, M.; Wang, Z. 2013. “Potential Rebalancing of U.S.-Asia Trade: Dynamic General Equilibrium Linkages and the Implications of Global Value Chains”, USITC Unpublished Manuscript (Washington, DC, United States International Trade Commission).
Kraemer, K.; Dedrick, J. 2002. “Dell Computer: Organization of a Global Production Network”, Unpublished Manuscript, (Irvine, CA, Personal Computing Industry Center, University of California Irvine).
Linden, G.; Kraemer, K.; Dedrick, J. 2009. “Who Captures Value in a Global Innovation Network?” The Case of Apple’s iPod, Communications of the ACM, 52(3): 140-144.
Global value chains in a changing world
134
Marazzi, M.; Sheets, N.; Vigfusson, R.; Faust, J.; Gagnon, J.; Marquez, J.; Martin, R.; Reeve, T. Rogers, J. 2005. “Exchange Rate Pass-through to U.S. Import Prices: Some New Evidence.” Board of Governors of the Federal Reserve System, International Finance Discussion Paper 833. Available at: http://www.federalreserve.gov/pubs/ifdp/2005/833/ifdp833.pdf
Narayanan, B.; Aguiar, A.; McDougall, R. 2012. “Global Trade, Assistance, and Production: The GTAP 8 Data Base”, Center for Global Trade Analysis, Purdue University. Available at: https://www.gtap.agecon.purdue.edu/resources/res_display.asp?RecordID=3772.
OECD-WTO. 2013. “Trade in Value-Added: Concepts, Methodologies and Challenges”. Joint OECD-WTO Note, January. Available at: http://www.oecd.org/sti/industryandglobalisation/49894138.pdf.
Powers, W. 2012. “The Value of Value-Added: Measuring Global Engagement with Gross and Value-Added Trade” in World Economics 13(4): 19–38.
Powers, W. Riker, D. 2013. “Value-Added Trade and Exchange Rate Analysis” USITC, Office of Economics, Working Paper 2013-01-X (Washington, DC, U.S. International Trade Commission).
Stehrer, R. 2012. “Trade in Value-Added and the Value-Added in Trade” WIOD Working Paper 8. World Input-Output Database, April. Available at: http://www.wiod.org/publications/papers/wiod8.pdf
Tempest, R. 1996. “Barbie and the World Economy”, Los Angeles Times, 22 September. Available at: http://articles.latimes.com/1996-09-22/news/mn-46610_1_hong-kong
Timmer, M. P.; Los, B.; Stehrer, R.; de Vries, G. 2012. “Fragmentation, Incomes and Jobs: An Analysis of European Competitiveness” WIOD Working Paper 9. World Input-Output Database, November. Available at: http://www.wiod.org/publications/papers/wiod9.pdf
Timmer, M. 2012. “The World Input-Output Database (WIOD): Contents, Sources and Methods.” April 2012, Version 0.9. Available at: http://www.wiod.org/publications/source_docs/WIOD_sources.pdf.
United States International Trade Commission (USITC). 2011. “The Economic Effects of Significant U.S. Import Restraints: Seventh Update”, Investigation No.332-325, USITC Publication 4253, August. (Washington, DC, U.S. International Trade Commission).
WTO; IDE-JETRO. 2011. “Trade Patterns and Global Value Chains in East Asia: From Trade in Goods to Trade in Tasks” (Geneva, Switzerland, World Trade Organization and Tokyo, Japan, Institute for Developing Economies Economies-Japan External Trade Organization).
Xing, Y.; Detert, R. 2010. “How the iPhone Widens the United States Trade Deficit with the People’s Republic of China”, ADBI Working Paper No. 257 (Tokyo, Japan, Asian Development Bank Institute). Available: http://www.adbi.org/working-paper/2010/12/14/4236.iphone.widens.us.trade.deficit.prc/
135
5 Geometry of global value chains in East Asia: the role of industrial networks and trade policies
Hubert Escaith and Satoshi Inomata
5.1. Introduction
East Asia is one of the best-known examples of a regional economic integration process that was initially driven by deepening industrial relations, rather than by political agreements, among countries of the region. The institutional or legal aspects of regional integration came only afterwards, in a typical “bottom-up” way. The situation differs from what has occurred in North America, where the ratification of the North America Free Trade Agreement (NAFTA) was a catalyst for the build-up of the US-Mexico economic ties.
What is important about East Asian integration, however, is that the deepening economic interdependency was not just a spontaneous phenomenon but it has been carefully aided and facilitated by the series of policies implemented by national governments. It is this interactive dimension of Asian integration, between industrial dynamics on the one hand and institutional development on the other, which presents the focus of this study.
In this line, the paper is structured as follows. The first part will show the evolution of regional supply chains in East Asia, using the information derived from international input-output (I-O) tables in order to map the dynamics of industrial linkages. The second part will demonstrate how trade and trade facilitation policies reduced the cost of doing business in the region and opened the way for further economic integration. The third part will conclude the discussion.
Global value chains in a changing world
136
5.2. Evolution of regional supply chains in East Asia
In the modern production system, goods and services are processed through the progressive commitment of various industries in which a product of one industry is used as an intermediate input of others.
Input-output models and supply chains analyses
The conventional input-output approach to supply chains generally focuses on measuring interconnectedness, or “strength” of linkages among industries, based on the traditional demand-pull or cost-push impact models. Now, in addition to the strength of linkages, the increasing complexity of production networks due to the participation of the variety of industries requires measuring the “length” of linkages for mapping the geometry of supply chains. The strength of an input-output table, and what makes it special, is indeed its information of production linkages that are derived from supply-use relations between industries, which is totally absent in other types of data such as industrial statistics or foreign trade statistics.
Suppose that there is an increase in the demand for cars by JPY 10 billion (Figure 5.1). The output expansion of cars brings about the secondary repercussion on the production of other products. Apparently, it increases the demand for car parts and accessories such as chassis, engines, front glass and tyres. The increase in production of these goods, however, further induces the demand for, and hence the supply of, their sub-parts and materials such as steel, paints and rubber. A change that occurs in one industry (say, an increase in demand for cars) will be amplified through the complex production networks and bring about a larger and wider impact on the rest of the economy.
The length is estimated using the concept of average propagation length (APL) developed in Dietzenbacher et al., (2005). As an illustrative example, consider the following hypothetical supply chains in Figure 5.2. If we want to measure the length of supply chains between Industry A and Industry E, we should look at the number of production stages of every branch of the supply chains. In this illustrative example, there are four paths leading from Industry A to Industry E. The path on the top involves two production stages. The second one has four stages, the third has three stages and the last one at the bottom has four stages.
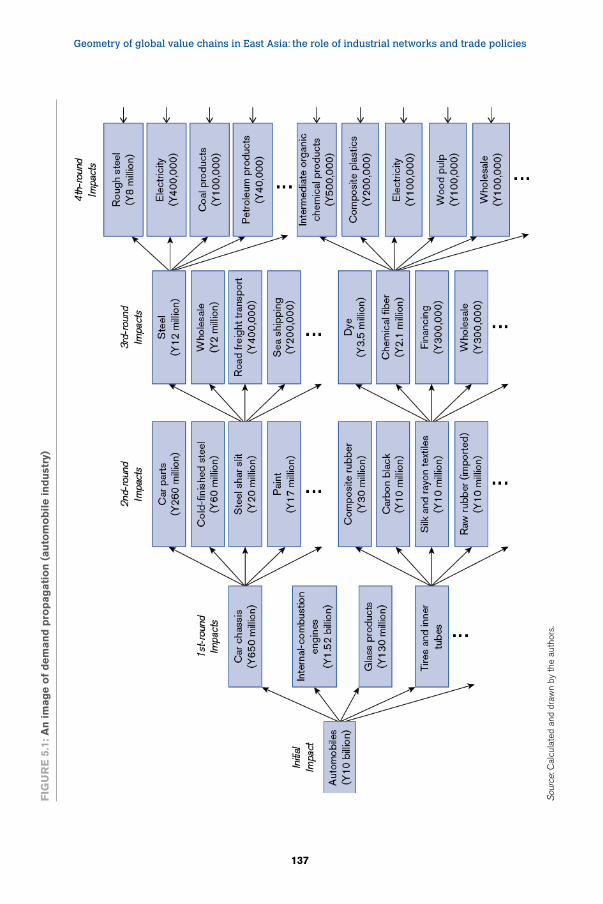
Geometry of global value chains in East Asia: the role of industrial networks and trade policies
137
Fig
ur
e 5
.1: A
n im
ag
e o
f d
em
an
d p
rop
ag
ati
on
(au
tom
ob
ile in
du
stry
)
Sou
rce:
Cal
cula
ted
and
draw
n by
the
auth
ors.
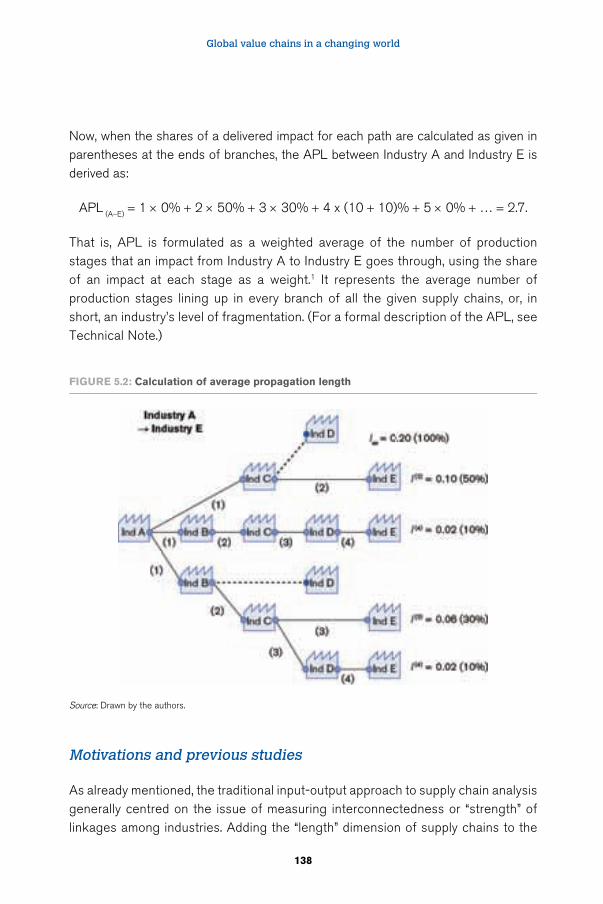
Global value chains in a changing world
138
Now, when the shares of a delivered impact for each path are calculated as given in parentheses at the ends of branches, the APL between Industry A and Industry E is derived as:
APL (A-E) = 1 × 0% + 2 × 50% + 3 × 30% + 4 x (10 + 10)% + 5 × 0% + … = 2.7.
That is, APL is formulated as a weighted average of the number of production stages that an impact from Industry A to Industry E goes through, using the share of an impact at each stage as a weight.1 It represents the average number of production stages lining up in every branch of all the given supply chains, or, in short, an industry’s level of fragmentation. (For a formal description of the APL, see Technical Note.)
Figure 5.2: Calculation of average propagation length
Source: Drawn by the authors.
Motivations and previous studies
As already mentioned, the traditional input-output approach to supply chain analysis generally centred on the issue of measuring interconnectedness or “strength” of linkages among industries. Adding the “length” dimension of supply chains to the
Geometry of global value chains in East Asia: the role of industrial networks and trade policies
139
analysis of international production sharing basically responds to the following three motivations.
(1) As has just been demonstrated, it measures the degree of technological fragmentation and sophistication of particular supply chains.
(2) APL can be measured both in forward-looking and backward-looking ways. So, by comparing the lengths between the two for cross-national supply chains, we can identify the relative position of a country in the global production networks.
(3) If the production process is fragmented and shared among different countries, it increases the impact of trade policies on the volume and direction of international trade.
The relevance of the APL model to the issue of fragmentation was already suggested in the seminal paper of Dietzenbacher et al., (2005), although the paper did not explicitly used the term.2 The APL model was applied at the international level in Dietzenbacher and Romero (2007), in which international linkage was analysed for major European economies using the international input-output table of 1985. The paper also employed the hypothetical extraction method to evaluate the influence of a single country on the APL of the chosen regional system, with the result of Germany being most influential. The international application of the APL model was brought into the Asian context by Inomata (2008a) with an extension to a time-series analysis using the Asian International Input-Output Table of 1990, 1995 and 2000. In particular, the paper proposed an index of geographical fragmentation based on the APL and compared its relative strength and weakness vis-à-vis the traditional measurements such as trade shares of intermediate products or the index of vertical specialization.
For the second motivation, Inomata (2008b) calculated the values of country’s APL, again using the Asian International Input-Output Tables, in both forward and backward directions and by comparing these two values over time it elucidated the change in the relative positions of East Asian countries within the regional value chains. The idea was later extended in De Backer and Miroudot (2012) in a slightly different framework using the model of Fally (2011), which developed an index of “distance to final demand” based on the OECD’s global input-output database covering 56 countries for the years 1995, 2000 and 2005.
The third point, the implication of the APL model for trade policies, was discussed in Diakantoni and Escaith (2012). As the production process is fragmented and shared
Global value chains in a changing world
140
by more countries, the intermediate products cross national borders more frequently, and hence the volume of traded products become more sensitive to the change in a country’s trade policies. The detrimental effect of protectionist measures in an international production network becomes much larger than when the production process was relatively simple and taking place in a limited number of countries.
Analytical results
The diagram in Figure 5.3 traces the evolution of production networks in the Asia-US region over the last two decades. The visualization of the calculation results is based on the method presented in Dietzenbacher et al., (2005) with some graphical elaboration developed in Inomata (2008b). Arrows represent selected supply chains among the countries of the region with the direction of the arrows corresponding to the flow of intermediate products. Each arrow has two features: thickness and length. The thickness indicates the strength of linkages between industries, while the length, as measured against the ripple in the background, is given by APL. The number of rings that an arrow crosses represents the rounded value of APL, the average number of production stages, and thus indicates the level of technological fragmentation and sophistication of that particular supply chain.3
The analysis uses the Asian International Input-Output Tables for the reference years of 1985, 1990, 1995, 2000 and 2005, constructed by the Institute of Developing Economies, JETRO.4 While conventional input-output analysis is usually concerned by a single country, the treatment is similar for international matrices. The table combines the national I-O tables of ten economies: China(C), Indonesia (I), Japan (J), Republic of Korea (K), Malaysia (M), Philippines (P), Singapore (S), Thailand (T), Chinese Taipei (N) and United States (U).
In 1985, there were only four key players in the region: Indonesia (I), Japan (J), Malaysia (M) and Singapore (S). The basic structure of the production network was that Japan built up supply chains from resource-rich countries like Indonesia and Malaysia. In this initial phase of regional development, Japan drew on a substantial amount of productive resources and natural resources from neighbouring countries to feed to its domestic industries.
By 1990 the number of key players had increased. In addition to the four countries already mentioned, Japan had extended its supply chains of intermediate products to the Republic of Korea (K), Chinese Taipei (N) and Thailand (T). While still relying
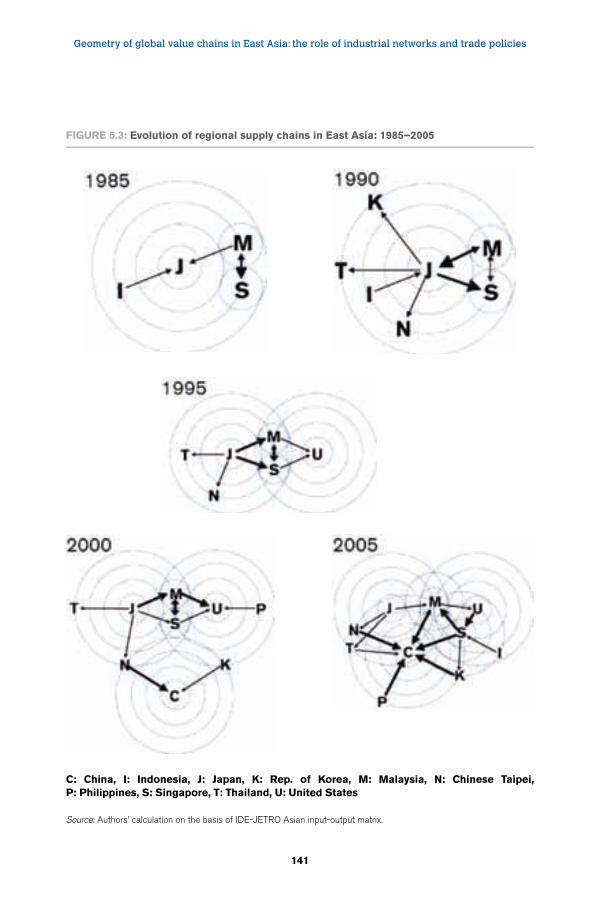
Geometry of global value chains in East Asia: the role of industrial networks and trade policies
141
Figure 5.3: evolution of regional supply chains in east Asia: 1985–2005
C: China, I: Indonesia, J: Japan, K: Rep. of Korea, M: Malaysia, N: Chinese Taipei, P: Philippines, S: Singapore, T: Thailand, U: United States
Source: Authors’ calculation on the basis of IDE-JETRO Asian input-output matrix.
Global value chains in a changing world
142
on the productive resources of Indonesia and Malaysia, Japan also started to supply products to other East Asian economies, especially to the group known as the Newly Industrialized Economies (NIEs). This is the phase when the relocation of Japanese production bases to neighbouring countries was accelerating, triggered by the Plaza Accord in 1985. It saw the building of strong linkages between core parts’ suppliers in Japan and their foreign subsidiaries.
Then in 1995, the United States (U) came into the picture. It drew on two key supply chains originating in Japan, one via Malaysia and the other via Singapore. These two countries came to bridge the supply chains between East Asia and the United States. Also to be noted is the length of the arrows between Malaysia and Singapore. Compared to others, their shortness indicates that the supply chains involve fewer production stages, suggesting that the degree of processing is relatively low. It is considered that the product flows between these countries are distributional rather than value-adding.
In the year 2000, on the eve of its accession to the WTO, China began to emerge as the third regional giant. The country entered the arena with strong production linkages to the Republic of Korea and Chinese Taipei. It then gained access to Japanese supply chains through the latter. The United States also brought a new supply chain from Philippines (P). So the basic structure of the tri-polar production network in the Asia-US region was thus completed.
The regional production networks thereafter showed dramatic development. By 2005, the centre of the network had completely shifted to China, pushing the United States and Japan to the periphery. China became the core market for the products of the region from which final consumption goods were produced for export to the US and European markets. Also of note is the nature of the supply chains that China developed with others. The notable length of the arrows surrounding China indicates that the supply chains towards China are characterized by a high degree of fragmentation and sophistication, incorporating substantial amounts of value added from each country involved in the production networks. The competitiveness of Chinese exports, therefore, is not only attributable to its cheap labour force but also to the sophisticated intermediate products that the country receives from other East Asian economies, as embedded in goods labelled “Made in China”.
The APL method can be used to measure separately the upstream and downstream length of average production linkages. Updating the methodology proposed by Inomata (2008b), Figure 5.4 presents the changes between 1985 and 2005 in the relative position of countries in Eastern Asia supply chains with respect to forward and backward APL.

Geometry of global value chains in East Asia: the role of industrial networks and trade policies
143
The southwest-northeast diagonal presents the average length of supply chains that each country participates in. Most economies have moved towards the northeast corner, which means that they increased the length of supply chain linkages between 1985 and 2005. The exceptions to this trend are the United States and Chinese Taipei, while, Japan almost did not change; on the contrary, China demonstrates an outstanding increase in the length of supply chains. It is considered that inter-linking of its domestic supply chains with overseas production networks was accelerated by the country’s accession to the WTO in 2001, as suggested by the big leap of the value from 1985 to 2005.
The northwest-southeast diagonal draws the relative position of each economy within the regional supply chains, as determined by the ratio of forward and backward APL. The United States and Japan, the most advanced economies in the region, are located
Figure 5.4: Change of relative positions in the regional supply chains, 1985–2005
Source: Based on Inomata (2008b) methodology and IDE-JETRO Asian input-output matrix.
Global value chains in a changing world
144
in the upstream position, though the United States moved downwards during the period and swapped its position with the Republic of Korea. China stays in the downstream segment of the regional supply chains, which reflects the country’s position as a “final assembler” of the regional products. The other economies more or less remain in the middle range spectrum, though the notable change is that Thailand went downstream to a large extent, and Chinese Taipei moved up into the middle cluster.
5.3. Tariffs, transport and trade facilitation
As shown above, international input-output matrices can be useful in revealing the topological characteristics of inter-industrial networks and their evolution. The present section aims at underlining some empirical characteristics of the bilateral trade “distance” that have a particular relevance from a network perspective. To quote Waldo Tobler: “everything is related to everything else, but near things are more related than distant things” (De Benedictis and Taglioni, 2011).
Understanding what defines the associativity between industrial sectors from a network perspective (or, symmetrically, the “distance” that lessens the possibility of interactions) would imply taking into consideration not only the bilateral relationship, but also associate it with the rest of the cluster of industries and countries that conforms the supply chain (Abbate et al., 2012). In the traditional trade perspective, transaction costs, including border costs and the cost of transporting goods from producers to users affects the volume, direction and pattern of trade. In a global value chain perspective, trade costs are part of the competitiveness of firms and determine in part their ability to participate in production networks.
More fundamentally, when trade takes place within a production network, the traditional bilateral approach to the role of transaction costs has to be abandoned to adopt a holistic method, where the intensity of bilateral trade depends also of the strength of the “trade-investment” nexus with all other network participants.5 Connectedness with other trade partners becomes a central feature for explaining bilateral trade from a network perspective: bilateral “trade in tasks” depends not only, from the positive side, on the traditional attractors of industrial supply and demand between two countries, but also on the number of partners they have in common. At the extreme, no physical flow may appear between two closely-interconnected partners, A and B, because all trade in value-added transits through a third country, C, playing the role of a hub in the network.
Geometry of global value chains in East Asia: the role of industrial networks and trade policies
145
Cascading transaction costs in production networks
The limited evidence available highlights very marked non-linearity in the way in which transaction costs negatively affect trade-flows in a trade in task perspective, where goods have to travel through several nodes before reaching their final destination. Yi (2003) shows that a small decrease in tariffs can induce a tipping point at which vertical specialization (trade in tasks) kicks in, while it was previously non-existent. When tariffs decrease below this threshold, there is a large and non-linear increase in international trade. The cascading and non-linear impact of tariff duties when countries are vertically integrated can be extended to other components of the transaction cost. When supply chains require that semi-finished goods cross international borders more than once, the effect of a marginal variation in trade costs everywhere in the supply chain is much larger than would be the case if there were a single international transaction.
Ferrantino (2012) shows that, when trade costs apply in proportion to the value of the good, the total cost of delivering the product to the final consumer increases exponentially with the number of production stages.6 For example, if the average ad valorem transaction cost is ten per cent, accumulated transaction costs in a five-stage supply chain lead to an ad valorem tariff equivalent of 34 per cent. Doubling the number of stages by slicing up the supply chain more than doubles the total delivery costs, as the tariff equivalent is 75 per cent. All this indicates the critical role of low transaction costs including tariff duties and non-tariff measures in facilitating trade in a “trade in tasks” perspective.
Moreover, as we shall see, some features of these transaction costs such as tariff schedule escalating in function of the processing stage may be particularly harmful to trade in tasks. It is therefore necessary for a supply chain strategy to be successful, as was the case in East Asia, so that these transaction costs both physical and government-induced be minimized.7 Reducing these costs from a regional perspective is particularly important, as many supply chains are regionally-based, as is observed in North America, Europe or in East Asia. The following sections will review how they have changed across time in order to accommodate and facilitate the development of regional production networks.
Tariff duties and effective rate of protection
Among all cross-border transaction costs, nominal tariffs are certainly the most visible. Tariff duties increase the domestic price of tradable goods by adding a tax
Global value chains in a changing world
146
to their international, or free market price. From a “trade in tasks” perspective, not only the value of nominal tariffs, but also their distribution between unprocessed and processed goods – a feature of nominal schedules known as tariff escalation – have a particular importance. By increasing the domestic prices of finished goods more than intermediary ones, tariff escalation creates a significant anti-export bias when value-added is the traded “commodity”, as is made clear when looking at effective protection rates (EPRs).
Effective protection compares the nominal protection received on one unit of output produced by an industry and sold on the domestic market (at a price higher than the free market because of the duty charged on competitive imports) with the additional production cost the producer had to pay because of the tariff charged on the importable inputs required for producing this unit of output. Note that the value of one unit of output minus the value of the intermediate inputs required is equal to the rate of value added at domestic prices.
Tariff duties do influence the domestic price of all inputs, including domestically produced ones. Domestic suppliers of tradable goods will be able to raise their own prices up to the level of the international price plus the tariff duty, without running the risk of being displaced by imports. If the tariff schedule is flat (all tariffs are equal), the effective protection on the value added is equal to the nominal protection. In the presence of tariff escalation, downstream industries producing final goods will benefit from a higher effective protection. Upstream industries producing inputs will have, on the contrary, a lower protection and possibly a negative one if the sum of duty taxes paid on the inputs is higher than the taxes collected on the output.
As shown in Appendix 5.2, EPR is a ratio comparing the value added per unit of output at domestic prices – tariffs applying on both output and inputs – with the value added the industry would have gained if operating at international prices (without tariff duties). It has been known for years that high EPRs discourage benefiting firms from exporting their output. This anti-export bias is even more relevant when analysing trade policy from a “trade in value added” perspective (Diakantoni and Escaith, 2012).
One option chosen by countries suffering from high and differentiated tariff schedules has been to establish duty-free export processing zones (EPZs). Another option is to implement draw-back schemes where domestic firms can have the duty taxes paid on inputs reimbursed when they export their products. Nevertheless, as
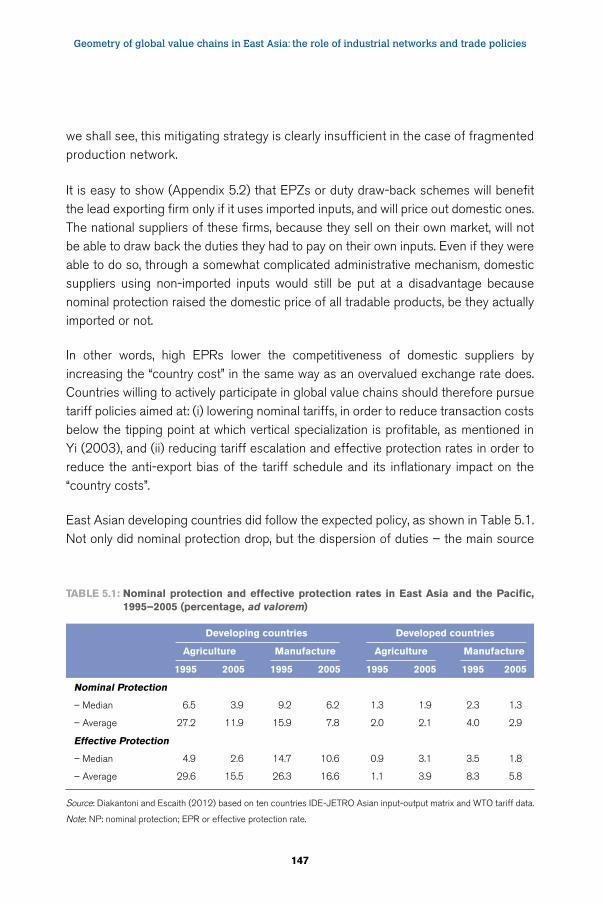
Geometry of global value chains in East Asia: the role of industrial networks and trade policies
147
we shall see, this mitigating strategy is clearly insufficient in the case of fragmented production network.
It is easy to show (Appendix 5.2) that EPZs or duty draw-back schemes will benefit the lead exporting firm only if it uses imported inputs, and will price out domestic ones. The national suppliers of these firms, because they sell on their own market, will not be able to draw back the duties they had to pay on their own inputs. Even if they were able to do so, through a somewhat complicated administrative mechanism, domestic suppliers using non-imported inputs would still be put at a disadvantage because nominal protection raised the domestic price of all tradable products, be they actually imported or not.
In other words, high EPRs lower the competitiveness of domestic suppliers by increasing the “country cost” in the same way as an overvalued exchange rate does. Countries willing to actively participate in global value chains should therefore pursue tariff policies aimed at: (i) lowering nominal tariffs, in order to reduce transaction costs below the tipping point at which vertical specialization is profitable, as mentioned in Yi (2003), and (ii) reducing tariff escalation and effective protection rates in order to reduce the anti-export bias of the tariff schedule and its inflationary impact on the “country costs”.
East Asian developing countries did follow the expected policy, as shown in Table 5.1. Not only did nominal protection drop, but the dispersion of duties – the main source
TAble 5.1: Nominal protection and effective protection rates in east Asia and the Pacific, 1995–2005 (percentage, ad valorem)
Developing countries Developed countries
Agriculture Manufacture Agriculture Manufacture
1995 2005 1995 2005 1995 2005 1995 2005
Nominal Protection
– Median 6.5 3.9 9.2 6.2 1.3 1.9 2.3 1.3
– Average 27.2 11.9 15.9 7.8 2.0 2.1 4.0 2.9
effective Protection
– Median 4.9 2.6 14.7 10.6 0.9 3.1 3.5 1.8
– Average 29.6 15.5 26.3 16.6 1.1 3.9 8.3 5.8
Source: Diakantoni and Escaith (2012) based on ten countries IDE-JETRO Asian input-output matrix and WTO tariff data.
Note: NP: nominal protection; EPR or effective protection rate.
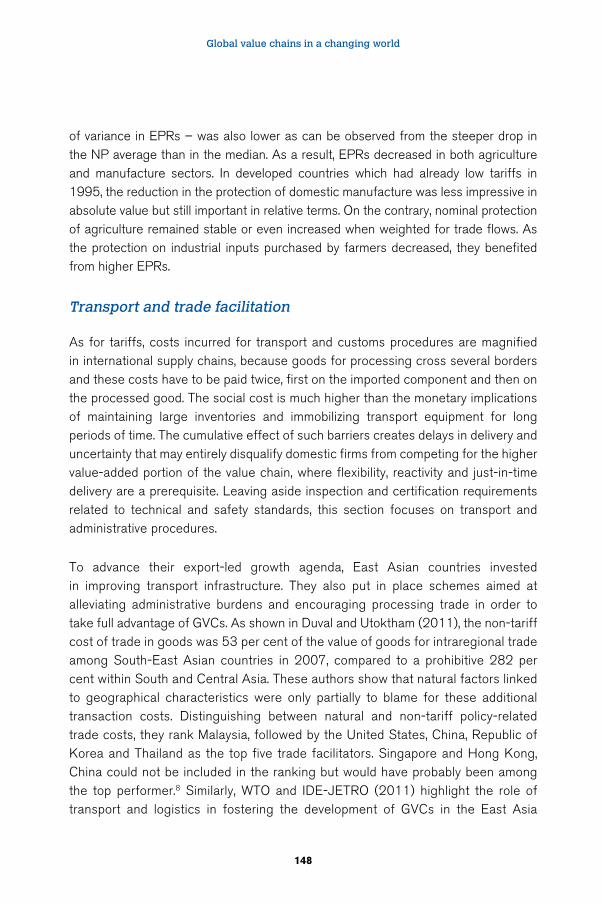
Global value chains in a changing world
148
of variance in EPRs – was also lower as can be observed from the steeper drop in the NP average than in the median. As a result, EPRs decreased in both agriculture and manufacture sectors. In developed countries which had already low tariffs in 1995, the reduction in the protection of domestic manufacture was less impressive in absolute value but still important in relative terms. On the contrary, nominal protection of agriculture remained stable or even increased when weighted for trade flows. As the protection on industrial inputs purchased by farmers decreased, they benefited from higher EPRs.
Transport and trade facilitation
As for tariffs, costs incurred for transport and customs procedures are magnified in international supply chains, because goods for processing cross several borders and these costs have to be paid twice, first on the imported component and then on the processed good. The social cost is much higher than the monetary implications of maintaining large inventories and immobilizing transport equipment for long periods of time. The cumulative effect of such barriers creates delays in delivery and uncertainty that may entirely disqualify domestic firms from competing for the higher value-added portion of the value chain, where flexibility, reactivity and just-in-time delivery are a prerequisite. Leaving aside inspection and certification requirements related to technical and safety standards, this section focuses on transport and administrative procedures.
To advance their export-led growth agenda, East Asian countries invested in improving transport infrastructure. They also put in place schemes aimed at alleviating administrative burdens and encouraging processing trade in order to take full advantage of GVCs. As shown in Duval and Utoktham (2011), the non-tariff cost of trade in goods was 53 per cent of the value of goods for intraregional trade among South-East Asian countries in 2007, compared to a prohibitive 282 per cent within South and Central Asia. These authors show that natural factors linked to geographical characteristics were only partially to blame for these additional transaction costs. Distinguishing between natural and non-tariff policy-related trade costs, they rank Malaysia, followed by the United States, China, Republic of Korea and Thailand as the top five trade facilitators. Singapore and Hong Kong, China could not be included in the ranking but would have probably been among the top performer.8 Similarly, WTO and IDE-JETRO (2011) highlight the role of transport and logistics in fostering the development of GVCs in the East Asia
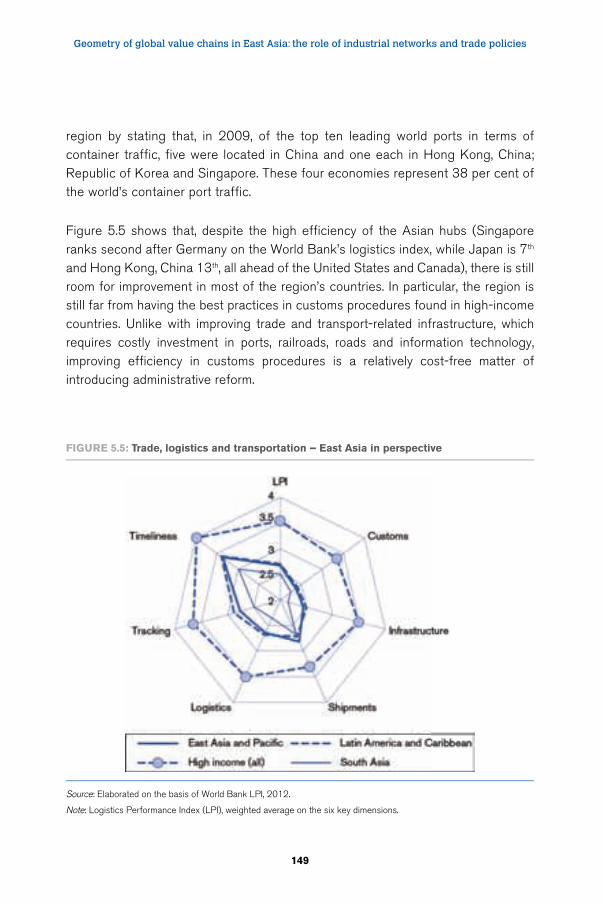
Geometry of global value chains in East Asia: the role of industrial networks and trade policies
149
region by stating that, in 2009, of the top ten leading world ports in terms of container traffic, five were located in China and one each in Hong Kong, China; Republic of Korea and Singapore. These four economies represent 38 per cent of the world’s container port traffic.
Figure 5.5 shows that, despite the high efficiency of the Asian hubs (Singapore ranks second after Germany on the World Bank’s logistics index, while Japan is 7th and Hong Kong, China 13th, all ahead of the United States and Canada), there is still room for improvement in most of the region’s countries. In particular, the region is still far from having the best practices in customs procedures found in high-income countries. Unlike with improving trade and transport-related infrastructure, which requires costly investment in ports, railroads, roads and information technology, improving efficiency in customs procedures is a relatively cost-free matter of introducing administrative reform.
Figure 5.5: Trade, logistics and transportation – east Asia in perspective
Source: Elaborated on the basis of World Bank LPI, 2012.
Note: Logistics Performance Index (LPI), weighted average on the six key dimensions.
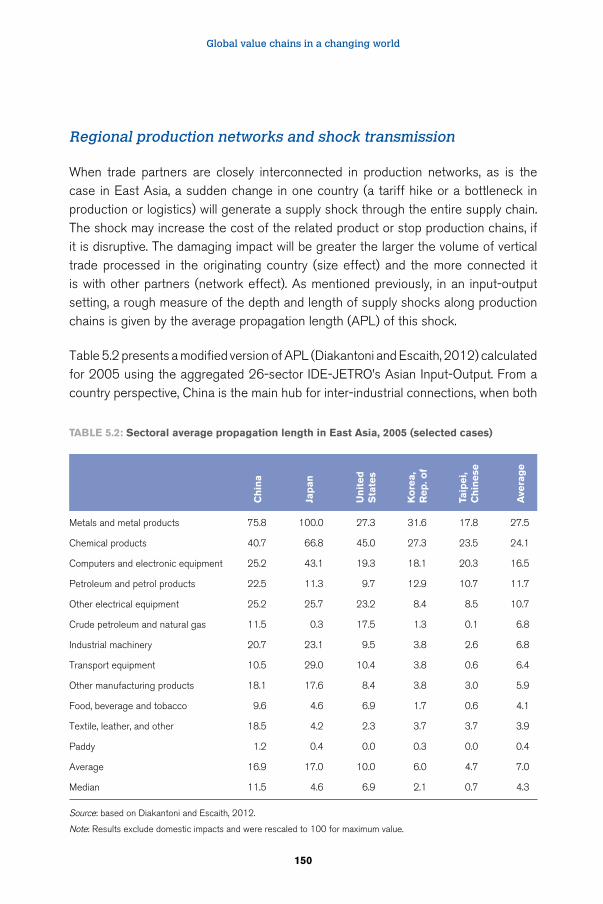
Global value chains in a changing world
150
Regional production networks and shock transmission
When trade partners are closely interconnected in production networks, as is the case in East Asia, a sudden change in one country (a tariff hike or a bottleneck in production or logistics) will generate a supply shock through the entire supply chain. The shock may increase the cost of the related product or stop production chains, if it is disruptive. The damaging impact will be greater the larger the volume of vertical trade processed in the originating country (size effect) and the more connected it is with other partners (network effect). As mentioned previously, in an input-output setting, a rough measure of the depth and length of supply shocks along production chains is given by the average propagation length (APL) of this shock.
Table 5.2 presents a modified version of APL (Diakantoni and Escaith, 2012) calculated for 2005 using the aggregated 26-sector IDE-JETRO’s Asian Input-Output. From a country perspective, China is the main hub for inter-industrial connections, when both
Ch
ina
Jap
an
un
ited
S
tate
s
Ko
rea,
rep
. of
Taip
ei,
Ch
inese
Ave
rag
eMetals and metal products 75.8 100.0 27.3 31.6 17.8 27.5
Chemical products 40.7 66.8 45.0 27.3 23.5 24.1
Computers and electronic equipment 25.2 43.1 19.3 18.1 20.3 16.5
Petroleum and petrol products 22.5 11.3 9.7 12.9 10.7 11.7
Other electrical equipment 25.2 25.7 23.2 8.4 8.5 10.7
Crude petroleum and natural gas 11.5 0.3 17.5 1.3 0.1 6.8
Industrial machinery 20.7 23.1 9.5 3.8 2.6 6.8
Transport equipment 10.5 29.0 10.4 3.8 0.6 6.4
Other manufacturing products 18.1 17.6 8.4 3.8 3.0 5.9
Food, beverage and tobacco 9.6 4.6 6.9 1.7 0.6 4.1
Textile, leather, and other 18.5 4.2 2.3 3.7 3.7 3.9
Paddy 1.2 0.4 0.0 0.3 0.0 0.4
Average 16.9 17.0 10.0 6.0 4.7 7.0
Median 11.5 4.6 6.9 2.1 0.7 4.3
Source: based on Diakantoni and Escaith, 2012.
Note: Results exclude domestic impacts and were rescaled to 100 for maximum value.
TAble 5.2: Sectoral average propagation length in east Asia, 2005 (selected cases)
Geometry of global value chains in East Asia: the role of industrial networks and trade policies
151
intensity and length are pondered. Japan comes a close second in terms of average APL indexes due to the high value of some sectors (metals, chemical products and computers). The United States comes in third. From a sectoral perspective, chemical products and metals and metal products are by far the sectors generating most of the depth in inter-industrial connections, Computers and electronic equipment are also highly interconnected.
5.4. Conclusions
Understanding trade in the global value chain perspective is greatly enhanced by adapting analytical tools derived from network economics and the study of inter-industry or inter-country relationships. Analysing the bilateral relationship between two nodes of a production network requires understanding the complementarity between them as well as with other partners in the network, as well as the factors that may explain the strength of the edges between them. International input-output (IIO) matrices are an effective way of describing and modelling the development of inter-industrial relationships in such a transnational context.
Thanks to a close relationship between input-output analysis and graph theory, diachronic IIOs serve also to map and visualize the evolution of productive networks and identify their main clusters. Applying these topological properties to the East Asian and Pacific context, we show that the inter-industry network moved from a simple hub and spokes cluster, centered on Japan in 1995, to a much more complex structure in 2005 with the emergence of China but also the specialization of several countries, such as Singapore or Malaysia, as secondary pivots.
The rise of “factory Asia” and its present topology were determined by specific policies. The densification of production networks in East Asia resulted from the coincidence of business strategies, linked to the widespread adoption of international supply chain management by lead firms in Japan and the United States, with the promotion of export-led growth strategies from developing East Asian countries. These countries applied a series of trade facilitation policies that lowered not only tariff duties, but also reduced other transaction costs.
We show that tariff escalation was greatly reduced in developing East Asia between 1995 and 2005, reducing the dissuasive anti-export bias attached to high effective protection rates and improving in the process the competitiveness of second-tier national suppliers. The other axis of trade facilitation focused on improving logistics
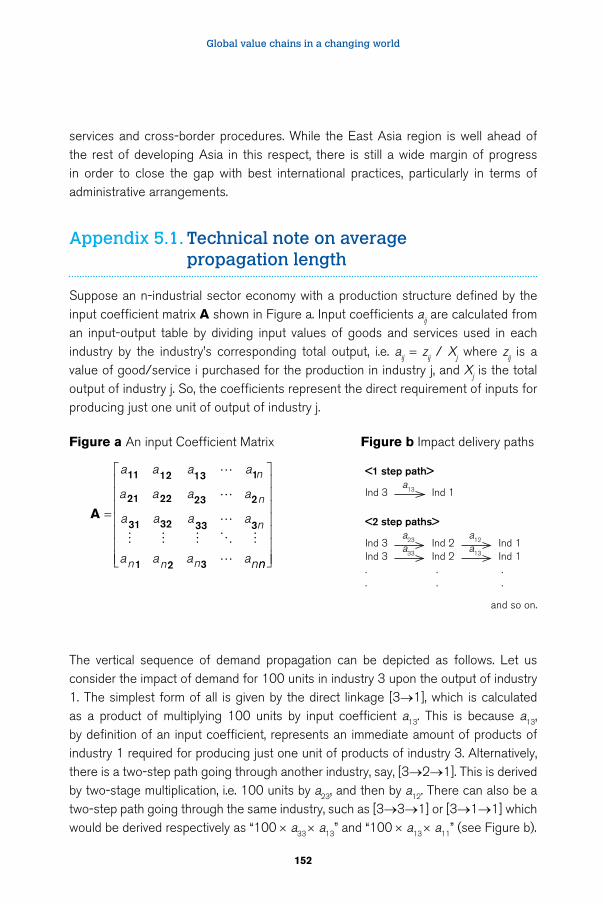
Global value chains in a changing world
152
services and cross-border procedures. While the East Asia region is well ahead of the rest of developing Asia in this respect, there is still a wide margin of progress in order to close the gap with best international practices, particularly in terms of administrative arrangements.
Appendix 5.1. Technical note on average propagation length
Suppose an n-industrial sector economy with a production structure defined by the input coefficient matrix A shown in Figure a. Input coefficients aij are calculated from an input-output table by dividing input values of goods and services used in each industry by the industry’s corresponding total output, i.e. aij = zij / Xj where zij is a value of good/service i purchased for the production in industry j, and Xj is the total output of industry j. So, the coefficients represent the direct requirement of inputs for producing just one unit of output of industry j.
Figure a An input Coefficient Matrix Figure b Impact delivery paths
A =
a a a a
a a a a
a a a a
a a a an
n
n
n
n n n
11 12 13 1
21 22 23 2
31 32 33 3
1 2 3
�
�
�� � � � �
� nn
<1 step path>
Ind 3 a13 Ind 1
<2 step paths>
Ind 3 a23 Ind 2
a12 Ind 1Ind 3
a33 Ind 2 a13 Ind 1
. . .
. . .
and so on.
The vertical sequence of demand propagation can be depicted as follows. Let us consider the impact of demand for 100 units in industry 3 upon the output of industry 1. The simplest form of all is given by the direct linkage [3→1], which is calculated as a product of multiplying 100 units by input coefficient a13. This is because a13, by definition of an input coefficient, represents an immediate amount of products of industry 1 required for producing just one unit of products of industry 3. Alternatively, there is a two-step path going through another industry, say, [3→2→1]. This is derived by two-stage multiplication, i.e. 100 units by a23, and then by a12. There can also be a two-step path going through the same industry, such as [3→3→1] or [3→1→1] which would be derived respectively as “100 × a33 × a13” and “100 × a13 × a11” (see Figure b).
Geometry of global value chains in East Asia: the role of industrial networks and trade policies
153
The exercise reveals that the impact of any two-step path, whatever the sequence of industries, can be given by feeding back a set of direct impacts, A, into the input coefficient matrix, i.e. A × A = A2. Similarly, the impact of three-step paths is given by A × A2 = A3, that of four-step paths by A × A3 = A4 and so on, which is evident from [A2]ij=Σkaikakh, [A
3]ij=ΣkΣhaikakhahj, etc. The amount of impacts shown in each layer of Aks (k=1, 2, 3,...,) is a result of the initial demand injection passing through all k-step paths. It captures the effect of every direct and indirect linkage that undergoes exactly the k-round steps/stages of the production process.
Meanwhile, it is mathematically known that the Leontief inverse matrix l, which shows the total amount of goods and services required for the production of one unit of output, can be expanded as an arithmetic series, i.e. l = (i – A)–1 = i + A + A2 + A3 + A4 + ..., where i is an identity matrix (with “1” in diagonal elements and “0” elsewhere). From what we saw above, it is immediately clear that the equation represents the decomposition of the total impact on output into its constituent layers according to the number of production stages involved. Matrix i corresponds to an initial (unit) demand injection and the following Aks are regarded as progressive impacts of the initial demand when supply chains are sliced at the kth stage of the production process.
With this preliminary understanding, Average Propagation Lengths are specified as:
APL(j-i) = 1*aij / (lij – δij)+ 2*[A2]ij / (lij – δij) + 3*[A3]ij / (lij – δij)+ ...
=
∑
∑
==k k
ij
k
ijkkA A
11
∞∞ [2]
where A is an input coefficient matrix, aij is its elements, lij is Leontief inverse coefficients, δij is a Kronecker delta which is δij=1 if i=j and δij=0 otherwise, and k is a number of production stages along the path. We also define APL(j-i)=0 when (lij – δij) =0.
The first term in the right-hand side of the upper equation shows that the impact delivered through one-step paths (k=1), i.e. direct impact, amounts to aij / (lij – δij) share of the total impact given by the Leontief inverse coefficients (less unity for diagonal elements). Similarly, two-step paths (k=2) contribute [A2]ij / (lij – δij) share, and three-step paths (k=3) give [A3]ij/ (lij – δij) share of the total impact. This is evident from l = i + A + A2 + A3 + ... which is rearranged as l – i = A + A2 + A3 + ..., and hence (l – i)ij = (lij – δij) = Aij+ [A2]ij+ [A3]ij+ ....
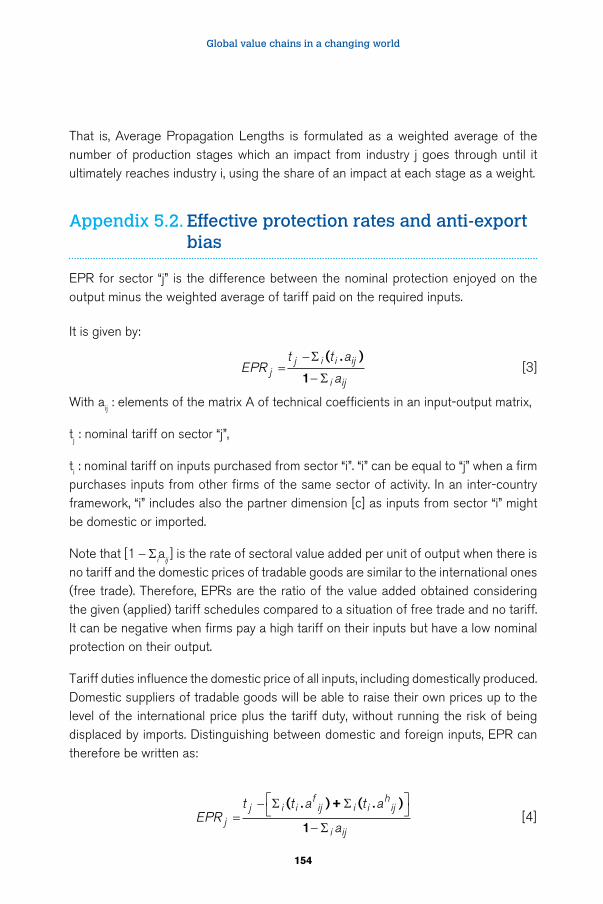
Global value chains in a changing world
154
That is, Average Propagation Lengths is formulated as a weighted average of the number of production stages which an impact from industry j goes through until it ultimately reaches industry i, using the share of an impact at each stage as a weight.
Appendix 5.2. Effective protection rates and anti-export bias
EPR for sector “j” is the difference between the nominal protection enjoyed on the output minus the weighted average of tariff paid on the required inputs.
It is given by:
EPRt t a
ajj i i ij
i ij=
−
−
Σ
Σ
( )
1
. [3]
With aij : elements of the matrix A of technical coefficients in an input-output matrix,
tj : nominal tariff on sector “j”,
ti : nominal tariff on inputs purchased from sector “i”. “i” can be equal to “j” when a firm purchases inputs from other firms of the same sector of activity. In an inter-country framework, “i” includes also the partner dimension [c] as inputs from sector “i” might be domestic or imported.
Note that [1 - Σiaij ] is the rate of sectoral value added per unit of output when there is no tariff and the domestic prices of tradable goods are similar to the international ones (free trade). Therefore, EPRs are the ratio of the value added obtained considering the given (applied) tariff schedules compared to a situation of free trade and no tariff. It can be negative when firms pay a high tariff on their inputs but have a low nominal protection on their output.
Tariff duties influence the domestic price of all inputs, including domestically produced. Domestic suppliers of tradable goods will be able to raise their own prices up to the level of the international price plus the tariff duty, without running the risk of being displaced by imports. Distinguishing between domestic and foreign inputs, EPR can therefore be written as:
EPRt t a t a
ajj i i
fij i i
hij
i ij=
−
−
Σ Σ
Σ
( )+ ( )
1
. . [4]
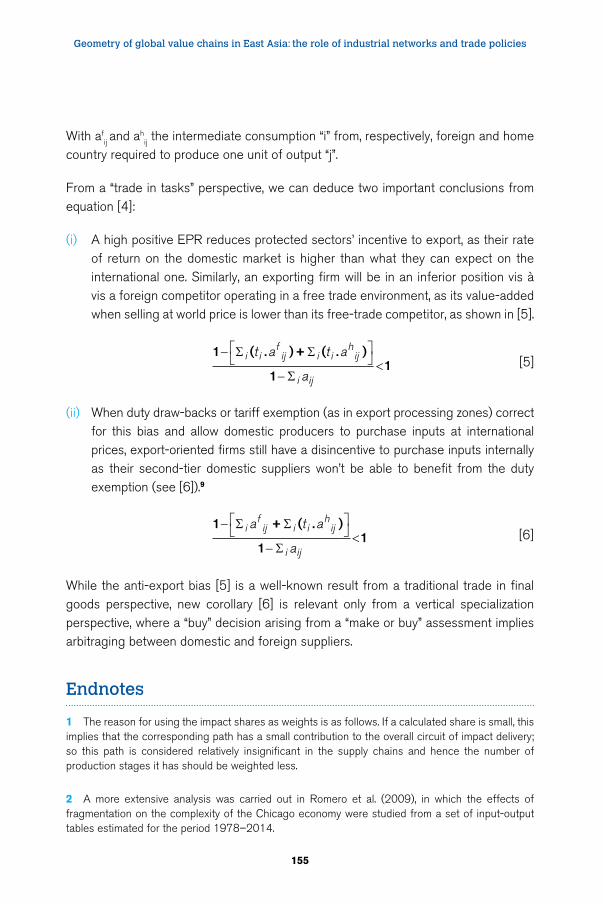
Geometry of global value chains in East Asia: the role of industrial networks and trade policies
155
With afij and ah
ij the intermediate consumption “i” from, respectively, foreign and home country required to produce one unit of output “j”.
From a “trade in tasks” perspective, we can deduce two important conclusions from equation [4]:
(i) A high positive EPR reduces protected sectors’ incentive to export, as their rate of return on the domestic market is higher than what they can expect on the international one. Similarly, an exporting firm will be in an inferior position vis à vis a foreign competitor operating in a free trade environment, as its value-added when selling at world price is lower than its free-trade competitor, as shown in [5].
1 ( )+ ( )
11
. .−
−<
Σ Σ
Σ
i ifij i i
hij
i ij
t a t a
a [5]
(ii) When duty draw-backs or tariff exemption (as in export processing zones) correct for this bias and allow domestic producers to purchase inputs at international prices, export-oriented firms still have a disincentive to purchase inputs internally as their second-tier domestic suppliers won’t be able to benefit from the duty exemption (see [6]).9
1 + ( )
11
.−
−<
Σ Σ
Σ
ifij i i
hij
i ij
a t a
a [6]
While the anti-export bias [5] is a well-known result from a traditional trade in final goods perspective, new corollary [6] is relevant only from a vertical specialization perspective, where a “buy” decision arising from a “make or buy” assessment implies arbitraging between domestic and foreign suppliers.
Endnotes
1 The reason for using the impact shares as weights is as follows. If a calculated share is small, this implies that the corresponding path has a small contribution to the overall circuit of impact delivery; so this path is considered relatively insignificant in the supply chains and hence the number of production stages it has should be weighted less.
2 A more extensive analysis was carried out in Romero et al. (2009), in which the effects of fragmentation on the complexity of the Chicago economy were studied from a set of input-output tables estimated for the period 1978–2014.
Global value chains in a changing world
156
3 For a detailed explanation of the visualization method, see Annex of WTO – IDE JETRO (2011).
4 The 2005 table is a preliminary table.
5 In a gravity model, bilateral trade is proportional to the size of the attractors – supply and demand – and inversely related to their economic distance (transaction and transportation costs). The influence of the ‘distance’ to other trade partners – or multilateral resistance – has been acknowledged in traditional trade analysis, but mainly as a statistical issue when estimating gravity model. Analysing complex interdependence in trade relations is still in its infancy. For a review, see Abbate et al (2012) and Noguera (2012) for an application to the case of trade in value-added.
6 More formally, the total cost of delivering the product to the final consumer after (n) production
stage is: C( )1
(1 )1nn
tin i= +=Σ where C(n) : total cost of delivering the product as a proportion of the
production cost, t : ad valorem transaction cost at each stage, N: number of stages in the supply chain.
7 Transaction costs – besides tariff duties and non-tariff measures – are usually defined as function of the geographical features of the respective countries, infrastructure and transportation services (including their regulatory regime and competition policies), custom procedures and other cross-border formalities, technological innovations and fuel costs.
8 Bilateral “natural” trade costs between trade partners are found to account for nearly one third of non-tariff trade costs explained by the authors. While significant, this incompressible share leaves a lot of space for transport and trade facilitation policies.
9 Unless firms substitute high-tariff domestic inputs for lower ones (negative correlation between changes in ti and a
hij) but Diakantoni and Escaith (2012) show that almost no substitution took place
in East Asia.
Bibliography
Abbate, A.; De Benedictis, L.; Fagiolo, G.; Tajoli, L. 2012. “The International Trade Network in Space and Time”, LEM Working Paper Series 2012/17 (Pisa, Italy, Laboratory of Economics and Management).
De Backer, K.; Miroudot, S. 2012. “Mapping Global Value Chains”, World Input Output Database (WIOD) Conference Paper, available at: http://www.wiod.org/conferences/ .
De Benedictis L.; Taglioni, D. 2011. “The Gravity Model in International Trade”, in L. De Benedictis and L. Salvatici (eds): The Trade Impact of European Union Preferential Policies (Berlin, Germany, Springer-Verlag).
Diakantoni, A.; Escaith, H. 2012. “Reassessing Effective Protection Rates in a Trade in Tasks Perspective: Evolution of trade policy in Factory Asia”. WTO Staff Working Paper ERSD-2012–11 (Geneva, Switzerland, World Trade Organization).
Geometry of global value chains in East Asia: the role of industrial networks and trade policies
157
Dietzenbacher, E.; Romero, I. 2007. “Production Chains in an Interregional Framework: Identification by Means of Average Propagation Lengths”, in International Regional Science Review, 30: 362.
Dietzenbacher, E.; Romero, I.; Bosma, N.S. 2005. “Using Average Propagation Lengths to Identify Production Chains in the Andalusian Economy”, in Estudios de Economia Aplicada 23: 405–422.
Duval, Y.; Utoktham, C. 2011. “Trade Facilitation in Asia and the Pacific: Which Policies and Measures affect Trade Costs the Most?”. Asia-Pacific ARTNeT Working Paper No. 94 (Bangkok, Thailand, Asia-Pacific Research Training Network on Trade).
Fally, T. 2011. “On the Fragmentation of Production in the US”, presentation (Boulder, CO, University of Colorado-Boulder, July).
Ferrantino, M. 2012. “Using Supply Chain Analysis to Examine the Costs of Non-Tariff Measures (NTMs) and the Benefits of Trade Facilitation”. WTO Staff Working Paper ERSD-2012-02 (Geneva, Switzerland, World Trade Organization).
Inomata, S. 2008a. “A New Measurement for International Fragmentation of the Production Process: An International Input-Output Approach”. IDE Discussion Paper No. 175 (Tokyo, Japan, Institute of Developing Economies, JETRO).
Inomata, S. 2008b. “Average Propagation Lengths: A New Concept of the “Distance” between industries, with an Application to the Asia-Pacific Region”. in Sangyo-Renkan Vol.16–1 (in Japanese), (Japan, Pan-Pacific Association of Input-Output Studies).
Noguera, G. 2012. “Trade Costs and Gravity for Gross and Value Added Trade”, (Berkeley, CA, UC Berkeley and New York, NY, Columbia University.).
Romero, I.; Dietzenbacher, E.; Hewings, G. 2009. “Fragmentation and Complexity: Analysing Structural Change in the Chicago Regional Economy”, in Revista de Economía Mundial 23: 263–282
WTO; IDE-JETRO. 2011. “Trade patterns and global value chains in East Asia: From Trade in Goods to Trade in Tasks” (Geneva, Switzerland, World Trade Organization and Tokyo, Japan, IDE-JETRO).
Yi, K-M. 2003. “Can Vertical Specialization Explain the Growth in World Trade?” in Journal of Political Economy 111: 52–102.


Part III
Some issues for supply chain managers

161
6 Views of GVC operators
Deborah K. Elms
The chapters in this volume discuss different types and configurations of global value chains (GVCs). Authors have covered issues of scale and scope, risk, size and proliferation of supply chains — particularly in Asia. Many of these broader concerns look quite different viewed up close to business leaders operating in the thick of specific GVCs. This chapter, by contrast, focuses attention on some key points of interest in supply chains as seen from the perspective of business.1
This chapter highlights the key roles of imports, managing inventory, moving products across borders, and outsourcing. It considers the pressures within the supply chain industry for consolidation and future innovation. Finally, it concludes by highlighting some government policies that are especially harmful for the development of global value chains from the viewpoint of supply chain operators and lead business firms.
6.1. Different types of chains
Not every supply chain is the same, of course. Nor is every company involved in supply chains active across the same sets of activities. For example, Li & Fung manages 15,000 suppliers across a wide range of industries in over 40 countries. YCH Group handles not only manufacturing components, but also spare parts for ATM networks in India. Savant Infocomm runs cold storage supply chains for perishable items in India alongside a traditional system that does not require refrigeration and such careful attention to temperature details. All of these diverse tasks require different sets of skills and management activities.
What unites big players, however, is expertise in managing systems, making investments in the individuals who operate these systems, and building up the capacity to explore new options and opportunities for expansion.
Global value chains in a changing world
162
6.2. Managing inventory
One of the most important roles for many manufacturing supply chain operators is managing inventory. Because lead companies are increasingly pressing their vendors to manage inventory, this task now falls to suppliers or to the last rungs of the value chain. Keeping inventory low and located at different levels of the chain dramatically increases the flexibility and agility of the supply chain. It also lowers the costs because carrying inventory no longer appears on the company’s bottom line. Supply chain operators help by managing inventory flow to ensure that the goods arrive at the right place at exactly the right time.
As an example, YCH Group produces computer kits for assembly into Dell Computers. Approximately 50 different suppliers produce the components that all need to be put together for the production line. When they began this task, it took the company eight hours to pull the stock and put the kits together. However, the time soon fell to four hours. Now, when an order is received, YCH can deliver the kit components to the line for assembly by Dell in just 45 minutes.
However, this requires very precise timing. If any one of the 50 suppliers is late on a delivery, the entire line comes to a halt. Because most of the components are coming from different countries, it requires very close coordination across multiple countries and tight communication with customs officials to be able to deliver on time.
It also requires YCH to provide help in setting up resilience for the supply chain network to ensure that companies have more than one source for critical supplies. This means that if some disaster knocks out a part of the chain, the rest of the network of distribution facilities can take over from elsewhere in the region.
Managing inventory requires a delicate balance between carrying just enough expensive stock to avoid running out, but not too much to burden the balance sheet. There is one other aspect to carrying low inventory, however, that is important to note — it quickly uncovers problems elsewhere in the system. Any internal inefficiency that could be disguised under conditions of high inventory is rapidly exposed with low stocks. If orders are being received late, for instance, it might not be too noticeable when ample items are already sitting on the shelves. If the cupboard is bare, a late order will be glaringly obvious.
Views of GVC operators
163
6.3. Shifting products across borders
Globally competitive firms like Dow Chemical literally use the world as their platform. They source raw materials from everywhere. Imported components — nearly 70 per cent of their total inventory — are vital to creating the final products. Of the remaining 30 per cent of products that are produced domestically, many also include some imported components or raw materials as well. Without imports, it is not possible to create products for the domestic market or to manufacture exports.
Wind energy provides an excellent example of this kind of globally sourced product. To create huge wind blades, one of Dow’s customers requires a specialty product created by Dow. The supply chain for this chemical starts with an oil well somewhere in the North Sea, which is shipped to a refinery in Amsterdam. From there the raw material is shipped to the Dow manufacturing facility in Germany. Afterwards, some is shipped to the Republic of Korea where they do a relatively high distillation process. Then this product is sent to China for formulation where it is packed into small drums and sent to the customer for manufacture into wind blades.
In fact, a major manufacturer like Dow now spends more money on logistics and services than on manufacturing. This is particularly true considering that costs in logistics are not simply the costs of the tankers and trucks, but also the inventory costs, service costs, government requirements, reporting requirements, import duty tariffs, and issues like labeling, materials safety, managing inventory, and so forth.
As a result, a huge payoff for business comes from standardization and optimization in logistics. How can the cycle be shortened? How can inventory be pushed around better and faster? For businesses, it is easier to shift products from one location to another through various operations and touch points while maintaining consistency and standardization in terms of reporting in terms of values, duty, tariffs and so forth. Anything that can be done to reduce costs and improve efficiency in transferring goods across borders would be extremely helpful and welcome.
6.4. The role of outsourcing
One risk for supply chain operators is disintermediation — the possibility that lead firms might decide to cut out the middle man and do things themselves at some point. For instance, Dell Computer could opt to bundle their own computer kits and not rely on
Global value chains in a changing world
164
YCH any longer. However, this does already happen in some cases. Carter’s, a children’s clothing company, does not outsource the entire production of OshKosh B’Gosh clothing to Li & Fung. Instead, only certain aspects of logistics are handed over to Li & Fung.
What pushes a firm to decide when to outsource and when to hang on to production internally? In part it comes down to core competencies. If there is some aspect of the job that is either viewed as a critical competency for the firm to handle in-house or, if the firm believes it can do this aspect better and more cost effectively internally, it will not outsource. If, however, neither condition holds, the task can be handed off to another firm.
The same thing is true for the supply chain operators themselves. If they do not have a core competency for a task, they should also outsource the task to some other firm with better, lower cost options for completing it. It is, after all, just as important for supply chain operators and big manufacturers to be nimble and keep their own costs down. Their shareholders and Wall Street analysts are seeking high returns on investment, which requires them to avoid diverting company performance by insisting on performing non-key tasks in-house.
One aspect that bigger supply chain operators bring to the task, however, is specialized knowledge of markets. For example, Li & Fung work with suppliers not only in well-known parts of China, but increasingly in more distant places. Building up knowledge requires a commitment on the part of the firm to form relationships with firms, local government officials, regional actors and other stakeholders. Such an investment may not be something that lead firms want to make, but rather to outsource to their supply chain operators instead.
6.5. Pressures for consolidation
Building these relationships can be costly and time consuming. As a result, it can be hard for smaller players to invest in such resources. Even within supply chain and logistics operators, there is an increasing push towards consolidation into larger firms.
Not everyone can handle the pressure for lower margins, higher costs and higher demands for service. Many have gone out of business. Li & Fung bought one company every three weeks in 2011, on average, because they found so many opportunities for expansion.
These pressures are also magnified by the needs of some of the largest lead firms. Since it is difficult and costly for them to constantly search for the best firms to work
Views of GVC operators
165
with on each contract, they prefer to go into partnership with a few large firms that can handle all aspects of their business. Such a strategic partner has incentives to make future investments in making sure both parties are at the forefront of technology and industry. A reliable partner is also more likely to know and understand the needs of the lead firm and to create solutions.
Even with strong partnerships, some of the largest lead firms will struggle to stay competitive. Global competition can be brutal, with significant turnover among firms. New players are emerging all the time, especially now from developing countries.
The pressures for expansion and consolidation throughout the supply chain industry, though, are also being offset to some extent by the entrance of larger numbers of e-commerce players. The barriers to entry in e-commerce are quite low and the industry is set to grow strongly in the future.
6.6. The role of transportation
Global business relies on efficient means of transportation. The exact method of transport depends on the business model. Many of the leading companies use multiple methods — air, rail, road and ships.
For some companies, such as Zara, nearly all shipments are via air. This includes sourcing some products from Asia, shipping via air back to Spain, then returning finished goods via air back to Asia for consumers. Despite expensive shipping costs, Zara remains one of the most profitable clothing retailers in the world. Why do they use air freight every day? Because their business model is all about limited fashion. The time of conceptualization to appearance in the retail store is about six weeks and such a compressed schedule requires products to move via air. For this company though, their obsolescence is nearly zero given their quick response and the fact that they carry almost no inventory costs at all.
If, however, another company were to try to follow a similar model and air freight all their goods without being properly geared up for that, they would be bound to fail. Their logistics costs will be sky high. So, it is important to pick the right transport model for the overall business model.
Express delivery by air freight is frequently used for fast-moving consumer electronics, medical devices and pharmaceutical products, and precision instruments. It is also used
Global value chains in a changing world
166
for critical replacement and repair parts, and for samples and late orders. In addition to speed, firms are increasingly using express companies because they can rely on door-to-door delivery systems with careful tracking and monitoring of packages along the way.
However, one challenge that some companies and logistics firms face in using multiple transportation modes is that the management of transportation within government falls to different agencies. As a result, the rules regarding use of road, rail, ship, and air for freight are complex, fragmented, and vary tremendously across different countries.
For example, the World Bank Logistics Index 2012 notes that lead time for imports in Asia alone can vary from 1–4 days, time processing at the border similarly varies from 1–4 days, and physical inspection rates for cargo shipments could be as little as one per cent manual inspection to as high as 35 per cent in India and 31 per cent in Indonesia.
For exports, the same report notes 1–3 days lead time for processing a 40 foot container from point of origin to port of loading. The costs, including agents fees, port, airport or other charges, range from US$ 178 in Singapore to US$ 310 in Viet Nam to US$ 918 in India.
For companies like UPS, managing these differences can be challenging.2 The daily delivery volume for the company is 16.3 million documents and packages, with 2012 revenue of US$ 54.1 billion. More than two per cent of global GDP moves around the world in UPS trucks and planes and, if it were independent, the company would have the world’s 9th largest airline.
6.7. Innovation
Supply chain operators are grappling with labour challenges. Getting sufficient workers with the right set of skills is proving to be difficult. As a result, more of the process is being automated with a higher reliance on information technology.
Singapore is trying to create something new in a “supply chain city.” This is a dedicated, highly automated facility designed by YCH Group for up to 10,000 supply chain experts, professionals and practitioners. It has been designed from the beginning to allow for very flexible operations. For example, it allows firms to manufacture on the spot, change designs, test products, and prepare to scale up if things go well. It also includes a huge automated storage and retrieval system for inventory. The facility encourages the clustering of suppliers in one place. Singapore’s Economic Development Board has strongly backed the project.
Views of GVC operators
167
UPS is also moving into offering supply chain solutions where UPS employees increasingly perform warehousing and manufacturing operations for global companies. As an example, in Singapore, UPS provides repair and servicing of hard disk drives as part of a client firm’s worldwide warranty operations. The facility takes advantage of the transportation links already in place for UPS to quickly and smoothly move goods in and out to customers as rapidly as possible.
6.8. Harmful government policies
All of the logistics operators spoke warmly of specific measures taken by some countries to speed up the processing of goods. One such example is bonded logistics parks (BLPs). China makes particularly good use of BLPs. Among other benefits, they allow an on-the-spot refund of taxes due for exports. (Although BLPs are different in different parts of the world — those in India are not the same as those in China.)
But some countries have implemented policies that make it difficult for companies to locate inventory domestically. To return to the example of the Dell computer assembly for a moment, although most of the components are delivered just-in-time for assembly, it can be critical to have some inventory on hand, as well as spare parts. But a variety of policies can make it impossible for Dell or YCH to locate such a facility in some domestic jurisdictions.
Equally problematic can be policies that create extra challenges to servicing equipment. In many places, domestic rules make it too costly to allow a proper third-party repair hub to operate outside the country and allow products to flow easily across borders. This means that firms must set up suboptimal domestic repair operations, resulting in higher servicing costs for consumers and firms.
Other rules can make it hard for firms to operate in value chains. For example, lead firms may start operating in a market as a joint venture. If the business is successful, the lead firm may decide to take over the business from the joint venture partner. Even if the transition is entirely amicable between firms, government regulations could turn this into a nightmare. Customs officials may now regard the company as a “non-trusted company” in the same category as a new importer and subject to 100 per cent inspections, higher guarantees, and so forth.
Other problematic rules conflict with the value chain pressures to push inventory to suppliers. Lead firms may want suppliers to hold inventory. But in many territories,
Global value chains in a changing world
168
suppliers cannot hold inventory unless they are resident companies, as there are no provisions for non-resident importers. This could require suppliers to do all sorts of contortions to satisfy the domestic requirements that are not desirable from the perspective of a global value chain.
YCH has had to develop a creative solution to this problem in India. They are now allowed to represent suppliers that do not have a physical presence in India. The company underwrites the inventory, takes part of the license, brings the shipments into the country, and transfers the product to the manufacturer on a just-in-time basis.
Global value chains have been promoted as one way that countries can pursue economic development. This is especially true since most developing countries rely heavily on small and medium enterprises (SMEs), rather than on large firms. SMEs, even from developing countries, are often seen as important actors in a global supply chain in providing parts and components, for example.
However, one particular challenge for SME participation comes from the pressures of lead firms to push inventory costs down on the suppliers. For larger firms or those with secure financing, the costs of holding inventory might be manageable. For SMEs, these costs are prohibitive.
Imagine that you are being asked to hold a US$ 1 million in inventory. This has to be held for a full month, plus the time it takes for the order to be delivered. It could also take another 60–75 days to be paid for this delivery. This leaves the company with no cash flow for several months and several million tied up in inventory. Solving this problem requires some creative thinking on the part of governments and financial institutions.
Another set of business obstacles comes from incompatible regulations and standards. Distribution centers currently need to carry two different sets of pallets — one for Europe and one standard size. If you want to ship products from Asia to the Russian Federation and on to Europe via rail, it needs to change cargos three times. Why? Because the rail width is different. Each change adds significantly to the cost and complexity of moving goods.
One bright spot is the creation of data messaging protocols for air freight. This will allow any airline transporting cargo to know exactly what data has been transmitted and ensure the quality of that data. It will also help secure the supply chain by limiting the handoffs or touch points along the chain. The buy-in for the program so far has
Views of GVC operators
169
been limited, particularly to countries that are technologically savvy. But, should the program spread in the future, the benefits could be significant.
6.9. The importance of global free trade
Not surprisingly, top supply chain and lead manufacturing firms believe passionately in the importance of maintaining free and open trade. The dream for many is to have the ability to source, ship and sell products in the most efficient locations, and to do so as seamlessly as possible. Falling transport and communications costs have made it easier than ever for companies to participate in a global economy.
Supply chain operators can be extremely creative, inventive problem solvers. They manage to bring together suppliers and lead firms from far-flung regions across the globe. Many persevere in the face of difficult obstacles, including a wide variety of policies that stand in the way of the smooth movement of goods.
One important lesson business leaders recognize is the need for continuous engagement with government policymakers. Without regular feedback and conversations with the policy community, neither side may be entirely aware of the obstacles faced by the other. Dialogues on global value chains can be one important mechanism for getting diverse groups to talk openly about key issues — and lead to better policy results.
Endnotes
1 These points were raised during the conference held in Singapore, November 28–30, 2012. The key business contributors were: Dr. Victor Fung, Chairman, Fung Global Institute; Patrick Ho, Dow Chemical; Joseph Phi, President LF Logistics; Gopinath Pillai, Executive Chairman, Savant Infocomm; and Robert Yap, Chairman and CEO, YCH Group. Additional comments were raised by other participants at the conference, sponsored by the Temasek Foundation, the World Trade Organization and the Fung Global Institute. For further information on the conference itself, see www.tfctn.org.
2 UPS information from Shiumei Lin, Director, Public Affairs, UPS Singapore, February 21, 2013.

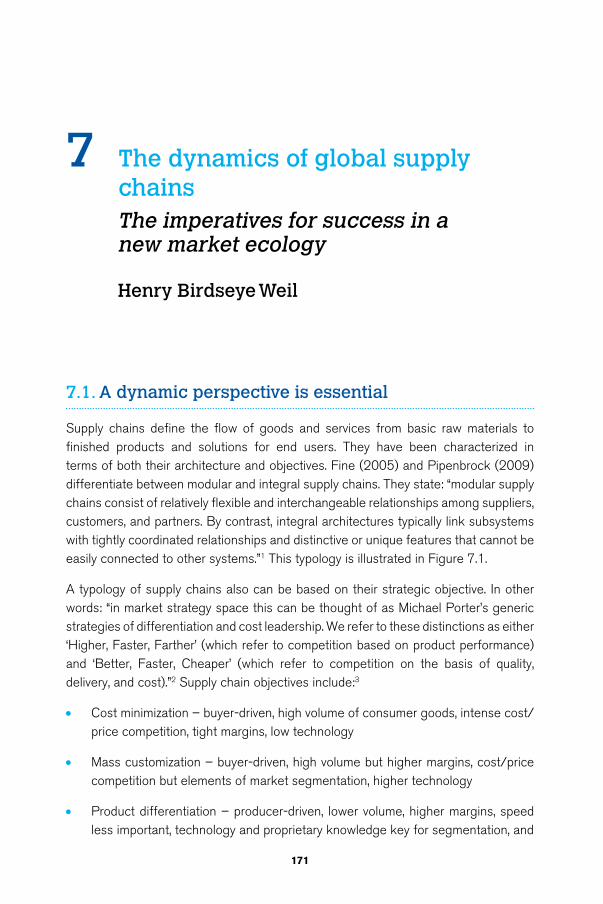
171
7 The dynamics of global supply chainsThe imperatives for success in a new market ecology
Henry Birdseye Weil
7.1. A dynamic perspective is essential
Supply chains define the flow of goods and services from basic raw materials to finished products and solutions for end users. They have been characterized in terms of both their architecture and objectives. Fine (2005) and Pipenbrock (2009) differentiate between modular and integral supply chains. They state: “modular supply chains consist of relatively flexible and interchangeable relationships among suppliers, customers, and partners. By contrast, integral architectures typically link subsystems with tightly coordinated relationships and distinctive or unique features that cannot be easily connected to other systems.”1 This typology is illustrated in Figure 7.1.
A typology of supply chains also can be based on their strategic objective. In other words: “in market strategy space this can be thought of as Michael Porter’s generic strategies of differentiation and cost leadership. We refer to these distinctions as either ‘Higher, Faster, Farther’ (which refer to competition based on product performance) and ‘Better, Faster, Cheaper’ (which refer to competition on the basis of quality, delivery, and cost).”2 Supply chain objectives include:3
• Cost minimization – buyer-driven, high volume of consumer goods, intense cost/price competition, tight margins, low technology
• Mass customization – buyer-driven, high volume but higher margins, cost/price competition but elements of market segmentation, higher technology
• Product differentiation – producer-driven, lower volume, higher margins, speed less important, technology and proprietary knowledge key for segmentation, and
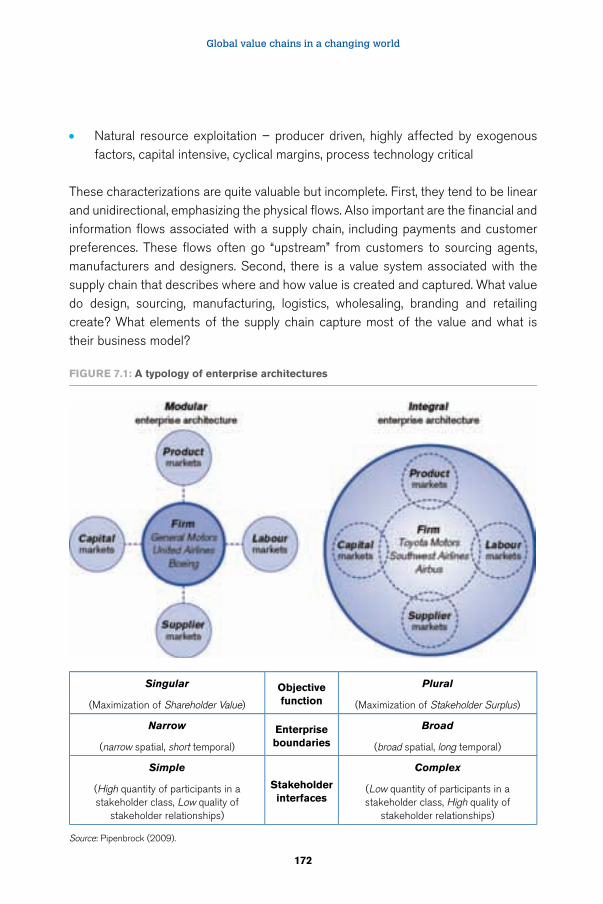
Global value chains in a changing world
172
• Natural resource exploitation – producer driven, highly affected by exogenous factors, capital intensive, cyclical margins, process technology critical
These characterizations are quite valuable but incomplete. First, they tend to be linear and unidirectional, emphasizing the physical flows. Also important are the financial and information flows associated with a supply chain, including payments and customer preferences. These flows often go “upstream” from customers to sourcing agents, manufacturers and designers. Second, there is a value system associated with the supply chain that describes where and how value is created and captured. What value do design, sourcing, manufacturing, logistics, wholesaling, branding and retailing create? What elements of the supply chain capture most of the value and what is their business model?
Figure 7.1: A typology of enterprise architectures
Singular
(Maximization of Shareholder Value)
Objective function
Plural
(Maximization of Stakeholder Surplus)
Narrow
(narrow spatial, short temporal)
Enterprise boundaries
Broad
(broad spatial, long temporal)
Simple
(High quantity of participants in a stakeholder class, Low quality of
stakeholder relationships)
Stakeholder interfaces
Complex
(Low quantity of participants in a stakeholder class, High quality of
stakeholder relationships)
Source: Pipenbrock (2009).
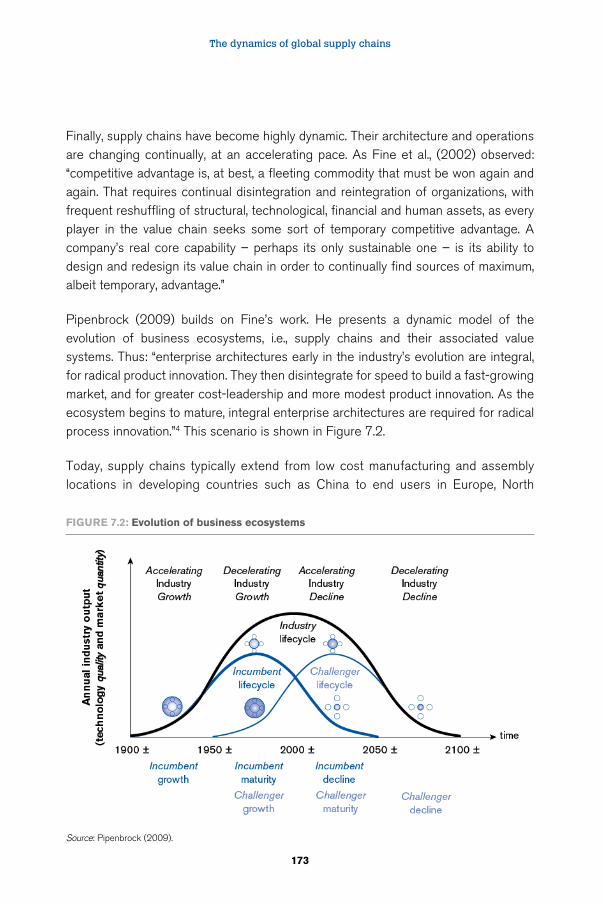
The dynamics of global supply chains
173
Finally, supply chains have become highly dynamic. Their architecture and operations are changing continually, at an accelerating pace. As Fine et al., (2002) observed: “competitive advantage is, at best, a fleeting commodity that must be won again and again. That requires continual disintegration and reintegration of organizations, with frequent reshuffling of structural, technological, financial and human assets, as every player in the value chain seeks some sort of temporary competitive advantage. A company’s real core capability – perhaps its only sustainable one – is its ability to design and redesign its value chain in order to continually find sources of maximum, albeit temporary, advantage.”
Pipenbrock (2009) builds on Fine’s work. He presents a dynamic model of the evolution of business ecosystems, i.e., supply chains and their associated value systems. Thus: “enterprise architectures early in the industry’s evolution are integral, for radical product innovation. They then disintegrate for speed to build a fast-growing market, and for greater cost-leadership and more modest product innovation. As the ecosystem begins to mature, integral enterprise architectures are required for radical process innovation.”4 This scenario is shown in Figure 7.2.
Today, supply chains typically extend from low cost manufacturing and assembly locations in developing countries such as China to end users in Europe, North
Figure 7.2: evolution of business ecosystems
Source: Pipenbrock (2009).
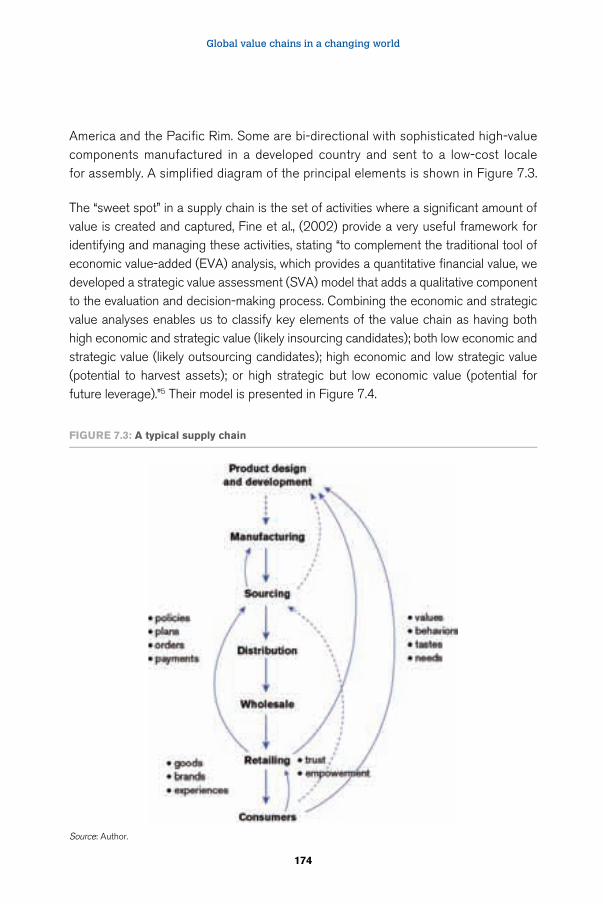
Global value chains in a changing world
174
America and the Pacific Rim. Some are bi-directional with sophisticated high-value components manufactured in a developed country and sent to a low-cost locale for assembly. A simplified diagram of the principal elements is shown in Figure 7.3.
The “sweet spot” in a supply chain is the set of activities where a significant amount of value is created and captured, Fine et al., (2002) provide a very useful framework for identifying and managing these activities, stating “to complement the traditional tool of economic value-added (EVA) analysis, which provides a quantitative financial value, we developed a strategic value assessment (SVA) model that adds a qualitative component to the evaluation and decision-making process. Combining the economic and strategic value analyses enables us to classify key elements of the value chain as having both high economic and strategic value (likely insourcing candidates); both low economic and strategic value (likely outsourcing candidates); high economic and low strategic value (potential to harvest assets); or high strategic but low economic value (potential for future leverage).”5 Their model is presented in Figure 7.4.
Figure 7.3: A typical supply chain
Source: Author.
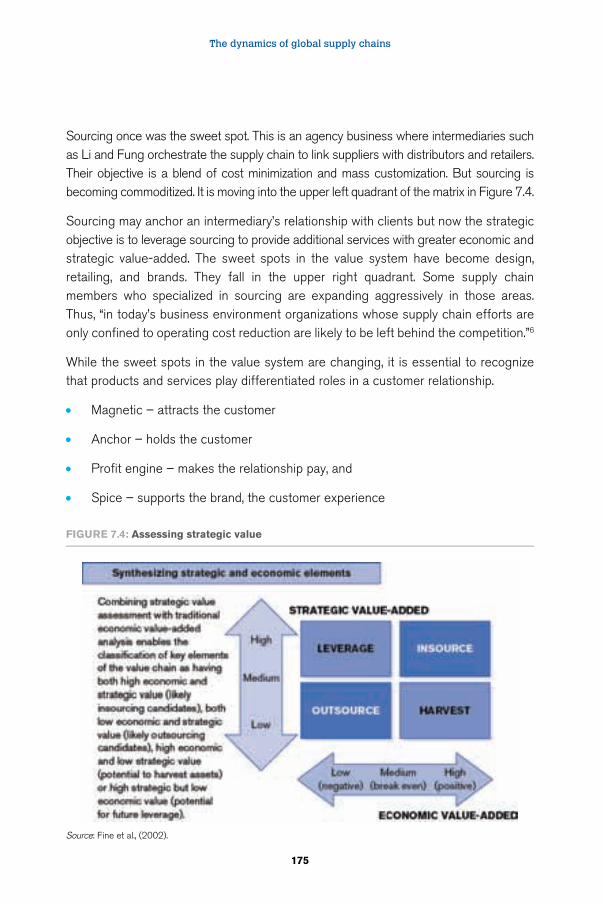
The dynamics of global supply chains
175
Sourcing once was the sweet spot. This is an agency business where intermediaries such as Li and Fung orchestrate the supply chain to link suppliers with distributors and retailers. Their objective is a blend of cost minimization and mass customization. But sourcing is becoming commoditized. It is moving into the upper left quadrant of the matrix in Figure 7.4.
Sourcing may anchor an intermediary’s relationship with clients but now the strategic objective is to leverage sourcing to provide additional services with greater economic and strategic value-added. The sweet spots in the value system have become design, retailing, and brands. They fall in the upper right quadrant. Some supply chain members who specialized in sourcing are expanding aggressively in those areas. Thus, “in today’s business environment organizations whose supply chain efforts are only confined to operating cost reduction are likely to be left behind the competition.”6
While the sweet spots in the value system are changing, it is essential to recognize that products and services play differentiated roles in a customer relationship.
• Magnetic – attracts the customer
• Anchor – holds the customer
• Profit engine – makes the relationship pay, and
• Spice – supports the brand, the customer experience
Figure 7.4: Assessing strategic value
Source: Fine et al., (2002).
Global value chains in a changing world
176
The differentiated roles can be seen in retail banking. Mortgages tend to be the magnetic product. Customers are most likely to change banks in order to get a good deal on a mortgage. The banking relationship is anchored by the current account. Unsecured lending, as with an overdraft or debit card balance, is the profit engine. Further, mobile banking supports a bank’s image as an innovator and provides opportunities for differentiation.
The same differentiated roles exist in supply chains. Often sourcing brings new clients to an intermediary and sourcing plus logistics anchor the relationship. “Onshore” services such as distribution, wholesaling and retailing have become the principal sources of value and growth, while product design and development are the spice. In the future, deep market knowledge of China and India will attract new clients. Managing supply chain sustainability and integrity is likely to be an important relationship anchor. Finance and e-commerce platforms will be key profit engines, while brands and risk management will be fertile ground for innovation.
Requiring each element of supply chain service to justify itself as a profit centre is a dangerous oversimplification. The customer relationship should be the profit centre. The services that play the key roles change over time as the relationship matures and the customer’s situation evolves. Customers, in the context of relationships, determine the value of individual services.
Dramatic changes in supply chain architectures and objectives and their associated value systems are underway. Possible future architectures include:
• Changes in the Chinese supply base, e.g., far more sophisticated and sustainable
• Manufacture in Asia to sell in Asia, e.g., China is a huge domestic market
• Nearshoring, e.g., manufacturing in Mexico for the US market
• Manufacture to order, e.g., very flexible and rapid supply chains, and
• Adding value close to customers, e.g., final assembly and finishing.
Government policies and regulations are a very significant part of the business landscape and will influence future supply chain architectures and objectives. Inconsistencies across jurisdictions incentivize regulatory arbitrage. Government policies clearly impact the magnitude and accessibility of market opportunities as through barriers to entry,
The dynamics of global supply chains
177
regulation of competition, procurement practices and the advocacy of particular technologies. Government policies affect the dynamics of product, service and business model innovation. As observed by Klepper and Graddy (1990), Lyneis (1993) and Milling (1996), governments can drive the virtuous dynamics by reducing the risks for other participants, such as through the establishment of standards, protection of intellectual property, being a lead user of innovative technology, tax incentives for risky investments and making markets more open, transparent and efficient.
There is a circular relationship between government policies and regulations and market conditions. Sometimes regulations shape the market but often they respond, e.g., to incidents regarding product or process safety, personal privacy, and environmental impact. Grösser (2011) found that building codes formalized what already was standard practice for energy efficiency.
7.2. The business landscape is changing
The business landscape is changing rapidly and, in many respects, discontinuously. Supply chains face significant disruptions in the markets where they operate and an inflection point for the sources of value and growth. Many factors are combining to reshape supply chains and their associated value systems. These dynamics are connected. They reinforce and accelerate one another. The principal drivers of change are:
• Adoption and commoditization of broadband
• Innovations in media and e-commerce
• Increased market transparency
• Deconstruction of integrated value chains
• A discontinuity in consumer aspirations and use of technology
• The Foxconn effect, and
• China becoming a vibrant domestic market
Ubiquitous, very-low-cost broadband connectivity is disrupting and reshaping how products and services are packaged, marketed, delivered and used. It changes the social dynamics of markets, creates the new economics of information, enables
Global value chains in a changing world
178
deconstruction of integrated value chains, stimulates innovation and accelerates the commoditization of many products and services. It offers exciting new opportunities to established companies while posing major threats to their strategies, business models and cultures.
The new economics of information are changing the way content is generated and distributed and the way supply chain members communicate with one another.7 Traditionally, the economics of information were based on several simple laws. The first law was the tradeoff between reach and richness. You could reach a huge audience with a simple, undifferentiated message such as a television advertisement, or you could deliver a complex, personalized message to a very small audience, as in a salesman talking one-on-one to a potential customer. The Internet eliminates this tradeoff. Rich messages can be sent in a highly personalized form to large audiences. Many small audiences are as good a one large audience, maybe better.
The second law was economies of scale in broadcasting. The larger the audience reached, the lower the cost per message. That, too, has been changed by the Internet. Now the cost per message can be constant, and very low, independent of the size of the audience reached. Thus, “...the more end-users a network has, the more valuable the network becomes to the users. Metcalf’s Law, named after the founder of 3Com and father of Ethernet, states that the potential value of a network is proportional to the square of the number of connections.”8
The third law was diminishing returns to scale. Unit costs would not decline indefinitely with size. Beyond a certain point they would become constant or even rise because of bureaucracy and complexity. In the world of digital media and e-commerce, the cost per transaction can be essentially zero. Instead of driving up costs and reducing the profitability of a relationship, today the rule has become the more transactions you have with a customer, the better. Very frequent contacts are essential for building brand value, customer satisfaction, trust and sticky relationships. The world is changing, as “...web services are breaking down barriers between disparate systems, organizations and creating webs of new relationships. Value chains are today being ‘blown to bits’ as Phil Evans of the Boston Consulting Group described in his book by that title.”9
The shift from closed proprietary networks to the Internet is a very important development. The Internet is the antithesis of walled garden systems where customers are restricted to a pre–determined range of products and services. It inevitably leads to greater customer independence. Some supply chain functions like sourcing are
The dynamics of global supply chains
179
vulnerable to disintermediation. E-commerce makes it easy for customers to deal directly with manufacturers, markets, and one another. Other functions such as retailing face intermediation by aggregators such as Google and Baidu who challenge them for the customer relationship. These developments are disrupting established patterns of influence, control, value creation, and value capture in supply chains.
The next wave of disruptive innovations includes mobile broadband, smart phones like the Apple iPhone and “web 2.0”. What is happening in media shows the future of retailing. Both markets are shifting from a traditional hub-and-spoke structure to a much more complex decentralized grid architecture. Much of the innovation is occurring in the peer-to-peer (P2P) context, as with Facebook, Groupon, Svpply, Vent Priveé and Gilt Groupe. An increasing amount of the innovative software is open source, e.g., Android. Applications and content are becoming web-based rather than residing on “fat” clients such as PCs and local servers.
This new environment must be thought of as more than a technological phenomenon. It also is a major social phenomenon characterized by an explosion of self-expression and viral content, cloud computing and large-scale piracy of intellectual property (IP). The emergence of personal media, social networks and virtual communities is especially significant. It will be increasingly difficult to maintain control over IP. Forward-thinking companies are considering where to go “open source.” The new social ecosystems have powerful network effects. They can drive the emergence of dominant standards and for next-generation platforms and supply chains.
Increasing market openness and the new economics of information create a very different ecology. It is far more transparent, competitive and unforgiving. An ever-greater number of customers will find out who has the best service, technology and prices, who treats customers well and who does not. If you are not one of the best, you will find it more and more difficult to attract and retain high-value customers. The competition will be intense and unavoidable. As they say in the US: “you can run but you can’t hide!”
7.3. The changes are disruptive
Each of the drivers of change is quite significant. The combination is highly disruptive. The situation at Foxconn put the global spotlight on workplace conditions in China and other low-cost manufacturing locations. The effect is unfolding in three waves – immediate, near term, and mid term. It already has precipitated rapid increases in unit labour costs that are spreading from China to other countries. This produced
Global value chains in a changing world
180
strong pressures to improve productivity and/or relocate factories. In the mid term, the resulting surge in disposable income and consumption will offer exciting new opportunities for retailers, brands and supply chain members.
Innovations in media and e-commerce have dramatically increased market transparency. News travels quickly through blogs, social networks and Twitter. There is no place to hide when something goes wrong. BP’s incident in the Gulf of Mexico wiped 55 per cent off its market capitalization in a matter of weeks and badly damaged its reputation. Foxconn has made sustainability a priority issue among consumers, retailers and brand owners. They, and inescapably supply chain members, face much greater reputational risk and financial liability with respect to product safety.
A holistic, end-to-end approach to supply chain sustainability is essential. It is clear that “some leading companies have already suffered reputational and brand damage when problems have been uncovered, even if they are not contracted to the offending supplier. Consumers will not understand the contractual complexities, only that a brand is associated with unethical practices.”10
Increased market transparency also intensifies competition. Innovative information aggregators like RedLaser and GoodGuide facilitate comparison shopping by both B2C and B2B buyers. Others like Panjiva make it easier for retailers to connect directly with manufacturers. The risks of disintermediation, of retailers going direct to manufacturers and manufacturers going direct to consumers, are significant. Greater transparency enables deconstruction of the value chain and entry of new competitors who attack the sweet spot and commoditize it.
The most likely result is margin squeeze for intermediaries and commoditization of traditional sourcing services based on the agency business model. Intermediaries are caught between higher product costs and customers facing weak markets who are unwilling to accept cost increases. Greater customer power, with Wal-Mart as the extreme example, amplifies this problem. The sweet spot in the value chain is shifting toward the customers to wholesale, retail and brands.
A generational discontinuity, especially in China, is reshaping the business landscape. The “under-30s” are dramatically different from their parents in their aspirations, attitudes toward consumption and use of technology. They are always connected to their friends and acquaintances through mobile phones, Twitter and Facebook. They have a voracious appetite for digital media. They are driving the explosion of social networks, media, and commerce through companies like YouTube, Groupon, Vent
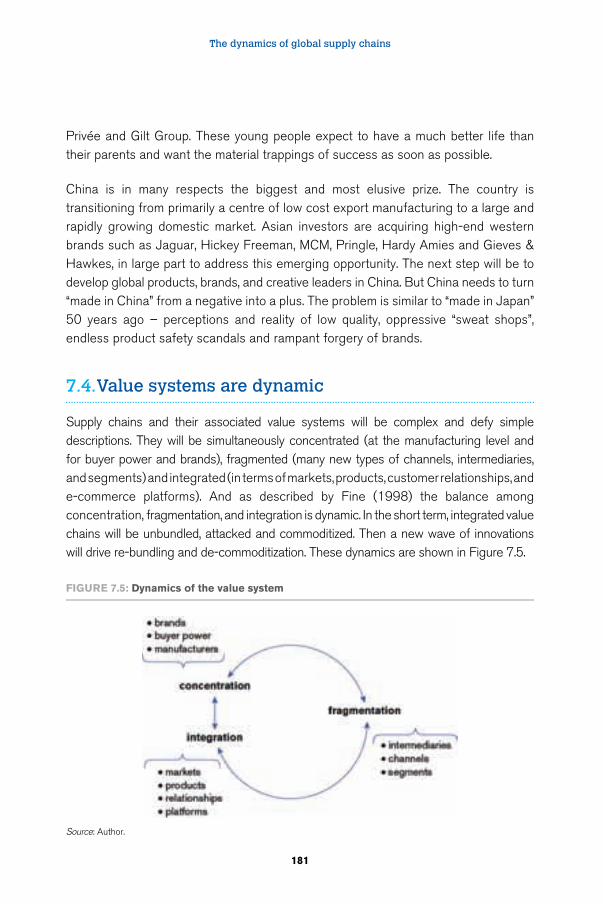
The dynamics of global supply chains
181
Privée and Gilt Group. These young people expect to have a much better life than their parents and want the material trappings of success as soon as possible.
China is in many respects the biggest and most elusive prize. The country is transitioning from primarily a centre of low cost export manufacturing to a large and rapidly growing domestic market. Asian investors are acquiring high-end western brands such as Jaguar, Hickey Freeman, MCM, Pringle, Hardy Amies and Gieves & Hawkes, in large part to address this emerging opportunity. The next step will be to develop global products, brands, and creative leaders in China. But China needs to turn “made in China” from a negative into a plus. The problem is similar to “made in Japan” 50 years ago – perceptions and reality of low quality, oppressive “sweat shops”, endless product safety scandals and rampant forgery of brands.
7.4. Value systems are dynamic
Supply chains and their associated value systems will be complex and defy simple descriptions. They will be simultaneously concentrated (at the manufacturing level and for buyer power and brands), fragmented (many new types of channels, intermediaries, and segments) and integrated (in terms of markets, products, customer relationships, and e-commerce platforms). And as described by Fine (1998) the balance among concentration, fragmentation, and integration is dynamic. In the short term, integrated value chains will be unbundled, attacked and commoditized. Then a new wave of innovations will drive re-bundling and de-commoditization. These dynamics are shown in Figure 7.5.
Figure 7.5: Dynamics of the value system
Source: Author.
Global value chains in a changing world
182
Value systems tend to cycle between vertical and horizontal integration and between concentration and fragmentation. The period of these cycles depends on the “clock speed” of change in a particular market or industry.11 Utterback (1994) and Weil and Utterback (2005) link the dynamics to the evolution of a generation of technology or business models. The entry of firms into a market and the subsequent exit of many or most competitors are central to the dynamics of innovation. In fact, “the advent of the dominant design marks a shakeout period which will see a greatly reduced number of firms and product variants. This condition will generally persist until the next technological discontinuity.”12
There are two immediate consequences of the dynamics. The most profitable elements of the value system are exposed to competitive attack and new forms of intermediation and aggregation are challenging established relationships. The most profitable elements of the value chain are being attacked in several ways. Major players in adjacent industries, including large logistics companies such as FedEx, see the opportunities and target them. New entrants like Alibaba also focus on these particularly attractive elements of the value chain. Fragmentation of the value chain stimulates new forms of intermediation and aggregation, which further decompose it and add complexity.
Consider what is happening in retailing:
• Aggregators use the buying power of a large group of customers, e.g., Groupon
• Infomediaries help customers find the best products and prices, e.g., RedLaser, GoodGuide
• Exchanges bring buyers and sellers together, e.g., eBay, Alibaba.
• Integrators link products, services, and content into a complete solution, e.g., Gilt Group, Net-a-Porter.
As shown in Figure 7.6 the combination of value system fragmentation, targeting the traditionally profitable elements, and new forms of intermediation are having profound impacts: shifting power to consumers and their agents and accelerating commoditization of the value chain.
Basic supply chain functions, and in particular sourcing and distribution, risk becoming completely commoditized. Innovative product, service and content integration, the
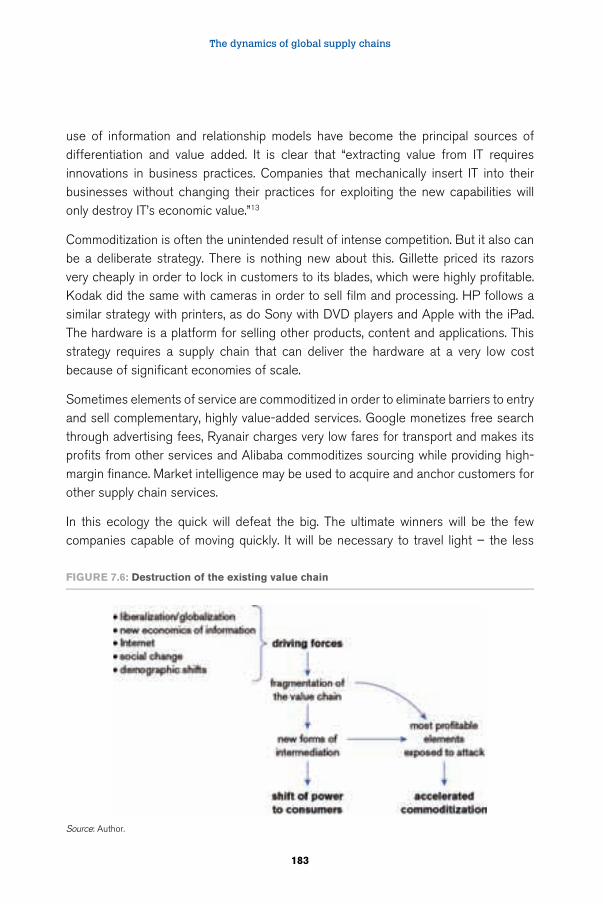
The dynamics of global supply chains
183
use of information and relationship models have become the principal sources of differentiation and value added. It is clear that “extracting value from IT requires innovations in business practices. Companies that mechanically insert IT into their businesses without changing their practices for exploiting the new capabilities will only destroy IT’s economic value.”13
Commoditization is often the unintended result of intense competition. But it also can be a deliberate strategy. There is nothing new about this. Gillette priced its razors very cheaply in order to lock in customers to its blades, which were highly profitable. Kodak did the same with cameras in order to sell film and processing. HP follows a similar strategy with printers, as do Sony with DVD players and Apple with the iPad. The hardware is a platform for selling other products, content and applications. This strategy requires a supply chain that can deliver the hardware at a very low cost because of significant economies of scale.
Sometimes elements of service are commoditized in order to eliminate barriers to entry and sell complementary, highly value-added services. Google monetizes free search through advertising fees, Ryanair charges very low fares for transport and makes its profits from other services and Alibaba commoditizes sourcing while providing high-margin finance. Market intelligence may be used to acquire and anchor customers for other supply chain services.
In this ecology the quick will defeat the big. The ultimate winners will be the few companies capable of moving quickly. It will be necessary to travel light – the less
Figure 7.6: Destruction of the existing value chain
Source: Author.

Global value chains in a changing world
184
legacy baggage, the better. Rapid decision making will be essential. There will be no time for elegant, optimal decisions. Fast but good decisions must be accepted. Thus winners will be determined by corporate culture, internal business processes and organizational structure. In other words, “every company will face a confluence of internal and external forces, often unanticipated, that will conspire to make an existing business strategy unviable.”14
7.5. Trust is central in the new ecology
Trust plays a central role in the dynamics of supply chains. It determines what you can do with information, i.e., observe, capture, analyse and use it to create value. Customer information becomes the most valuable asset, especially in commoditized markets. Trust is the essential prerequisite for the customer to reveal sensitive information, authorize use of this information and welcome the results. In the absence of sufficient trust, likely customer behaviours are deliberate deception, holding back and fending off.
Trust is built through serving customers better as with segmenting the market, personalizing relationships and customizing solutions. Customer information management drives a dynamic model of relationship value. The model involves extremely powerful self-reinforcing mechanisms, which can be either virtuous or vicious. Growing satisfaction and trust leads the customer to be more open regarding values and needs and more willing to empower the provider. As an empowered agent the provider can search, evaluate, advise and implement on behalf of the customer. This “learn more, serve better” model is shown in Figure 7.7. It is central to value creation in content markets. Trust is built over time through a series of great customer experiences.
Proactively demonstrating trustworthiness and accelerating development of trust-based relationships are top priority for a service provider. In an article on customer
Figure 7.7: A model of relationship value
Source: Author.
The dynamics of global supply chains
185
relationship management Weil and Weil (2001) argue quite emphatically that trust is the prerequisite to empowerment. Customers must empower a service provider in order for the provider to serve them better and build more value in the relationship for both parties. Being proactive accelerates the creation and realization of this value. The specifics of the journey will be different across the customer segments. The principal issues pertain to privacy and security of sensitive information.
Trust, empowerment, and “win-win” with the customer should be at the heart of a supply chain strategy. While any participant in a supply chain could take the initiative to build trust-based relationships, intermediaries are usually best placed to do so. They need to win the trust of both their customers, i.e., retailers and brand owners, and the factories that supply them. A high level of mutual trust is a key aspect of the integral supply chain architecture described above. A trusted intermediary can orchestrate a complex ecosystem of manufacturers, service providers, retailers and brand owners, but in many instances their customers define the objectives of the supply chain. Power and influence have shifted to retailers, brands and owners of IP.
It will be a challenging ecology for consumers, too. Most will have fragmented relationships with product and service providers, creating a major opportunity for intermediaries to put the pieces together into a complete picture and make sense of it. They will face new dangers of theft, fraud, misuse of personal information and invasion of privacy. Consumers will have to contend with overwhelming choice and they, not providers, will define quality, relevance and value. Trust will be essential; brand will be key.
The winners in the new ecology will manage relationships to build trust and intimacy, and use customer information to provide solutions which are relevant, welcome, valued and acted on. Sustainable competitive advantage will come from intangible factors, including customer insights, special skills and capabilities, brands, reputation, relationships with suppliers and customers, trust and the “customer experience.”15 Achieving a unified approach to and relationship with customers is essential.
The successful companies will understand how to build relationships with Internet-fluent, frustrated, cynical and mistrustful people. These companies will be trusted because the agency relationship will be unambiguous: they work for the customer. The winners will exploit their major competitors’ most vulnerable “loose bricks,” i.e., where they are behaving in insensitive, condescending, self-serving and exploitative ways – or worse. Their emotional appeal and relationship proposition will be their key differentiators.
Global value chains in a changing world
186
7.6. The need for change is imminent
Supply chain members must contend with a set of complex, interrelated strategic issues:
• Greater bi-directionality as in bringing products to developing markets, handling e-commerce returns, recycling products at the end of their lives
• Serving domestic markets as well as exports, addressing the explosive demand for goods and services in China, India, and other markets
• Major changes in where and how value is created and captured as through product design, development of powerful brands, and e-commerce
• Where innovation occurs and its character, for example: China becoming a hotbed of creativity, innovation around customer experiences and other intangibles
• Integrated versus specialist business models – anticipating cycles in supply chain architectures and their associated value system
• Off-shoring versus near-shoring as with increased importance of regional supply chains, emphasis on adding value close to customers
• Achieving and maintaining supply chain integrity such as building trust, turning “made in China” from a negative into a plus, and
• New business models including close follower to demand trends, produce to order, rapid production scale-up and integrated end-to-end solutions
The imperatives for success in this new market ecology begin with greater coordination among supply chain members. There are many opportunities to create value through collaboration and information sharing and to combine capabilities and information in ways that serve customers better. This will require relationships within supply chains to become far more “integral” as defined by Fine (2005) and Pipenbrock (2009). The culture of most supply chains is distinctly entrepreneurial. An entrepreneurial culture is inherently competitive for opportunities, resources, recognition and rewards. Entrepreneurs must be convinced that collaboration and sharing generate greater value and that they will get a fair share. The key is quick wins with clear financial payoffs.
The dynamics of global supply chains
187
A survey of chief supply chain officers explored the importance of various supply chain levers. It found: “...supply chain executives have been using multiple levers to help support value creation. Information visibility is a means for companies to coordinate their supply chain activities to increase efficiency, reduce waste, and improve response time reliability. Hence information visibility becomes the foundation for all other levers.”16
The sources of value and growth are shifting significantly. Principal businesses such as wholesaling, retailing, brands and financial services are more capital intensive than sourcing based on the agency model. With more capital at risk customer information and market intelligence have become critically important. The next stage is to develop a portfolio of third-generation value-added services for suppliers, retailers and brand owners. In addition to product design and development, these services could include market intelligence, hosted platforms and applications, managing sustainability and advice regarding best practices in manufacturing, doing business in China, sustainability and supply chain integrity, and e-commerce solutions.
These services are “third-generation” because they are significantly more dependent on technology and formal intellectual property, as with databases, software and models, than the first-generation agency services and second-generation principal businesses. The future is in value-added services and customer experiences based on innovative use of information and sophisticated analytics. This will require investments in IT platforms, intellectual property and people with new skills and capabilities.17 Supply chain members must decide when to develop these assets internally and when to buy them through acquisitions and venture investments. Roberts and Liu (2001) conclude that a company should use, in a timely and appropriate way, a broad range of business development strategies, including alliances, joint ventures, licensing, equity investments and mergers and acquisitions, in order to perform optimally over its underlying technology life cycle.
The lead time for building revenues and profits from third-generation services is significant and the successful business models are unclear, but think of retail merchandise managers using a portal for market analysis, sourcing, procurement, supply chain optimization, inventory control and multi-channel fulfilment. The immediate challenge is to start and accelerate the learning process regarding which services customers and suppliers want and need, how to demonstrate their value, the right business models to monetize them and how to defend them from commoditization.
Global value chains in a changing world
188
As noted above, managing supply chain sustainability and its associated risks have become high priority issues. Locke et al., (2009) undertook groundbreaking research into the effectiveness of compliance and commitment-based approaches to sustainability. They concluded that the compliance model rests on misguided theoretical and empirical assumptions: “In contrast, ...a more commitment-oriented approach to improving labour standards coexists and, in many of the same factories, complements the traditional compliance model. This commitment-oriented approach, based on joint problem solving, information exchange, and the diffusion of best practices, is often obscured by the debates over traditional compliance programmes but exists in myriad factories throughout the world and has led to sustained improvements in working conditions and labor rights at these workplaces.”
Plambeck et al., (2012) focus on the challenges in China in the following passage: “Given how much of the world’s manufacturing takes place in China and the damage it has wrought on that country’s environment, most analysts expect that multinational brands’ supply chains will face increasing scrutiny in the coming years.” The authors highlight the limitations and counter-productive effects of an audit and enforcement approach to health, safety, environment and labour practices. They present a series of activities for getting to know your supply chain and then acting effectively based on that knowledge. “Any sustainability effort in China must start by creating a context that facilitates identification and visibility into the supply chain,” they conclude.
Innovation is a key element of a successful response to the changing business landscape. But innovation is not easy. Large, mature companies often lack the capabilities to be successful with a disruptive product or service innovation.18 There are significant obstacles that should be reduced or eliminated. Successful innovation is a journey defined by the lessons learned from a series of quick, low-cost experiments. The willingness to experiment and ability to learn are critical success factors.19
The imperative now should be to get started quickly, simply and inexpensively. The objective of these experiments is to demonstrate an idea and its value by making the innovation tangible. Quick wins reinforce the commitment to innovation and accelerate the virtuous dynamics of learning and value creation. Research has highlighted critical success factors for innovation initiatives.
• Experiment inexpensively and often – overcome the bias toward doing things on a large scale and the aversion to anything “quick and dirty”
The dynamics of global supply chains
189
• Prototype early – expect this to be an iterative process, assume you won’t get it right the first time, and show the prototype to customers
• Empower managers two to three levels from the top to approve and fund experiments – most of the time this can be business unit leaders
• Expect failures – encourage people to try and enable them to “fail soft” without career damage
• Involve customers – listen to them, learn from them and recognize that often they are the source of innovation
• Use social networks to encourage and reward sharing – the business benefits must come first, then the personal satisfaction
• Create much more value from existing assets – make innovative use of current capabilities, information and relationships
• Establish mechanisms for internalizing new technologies – eliminate the obstacles to collaboration with smaller ventures and outside vendors, and
• Show the payoff in practical terms – measure the effect on customer satisfaction and retention, staff turnover and productivity, revenues and profits
E-commerce is developing rapidly in all markets. It is a strategic priority and major source of growth for existing customers. And the pure plays such as Amazon offer a wide range of new opportunities like private label programmes. Supply chain members need to get ahead of customers regarding e-commerce. Many still are racing to catch-up. The current lack of e-commerce understanding and capabilities and the obstacles to effective collaboration with small ventures and other sources of e-commerce technology are very serious problems. Bold action is required to deal with them.
Differences among supply chains are important for how we think about change and policy impacts. The following typology recognizes differences along four dimensions:
• Architecture – modular versus integral relationships, global versus regional, physical flows versus digital
• Objectives – cost, quality, speed, flexibility, innovation, resilience, policy benefits
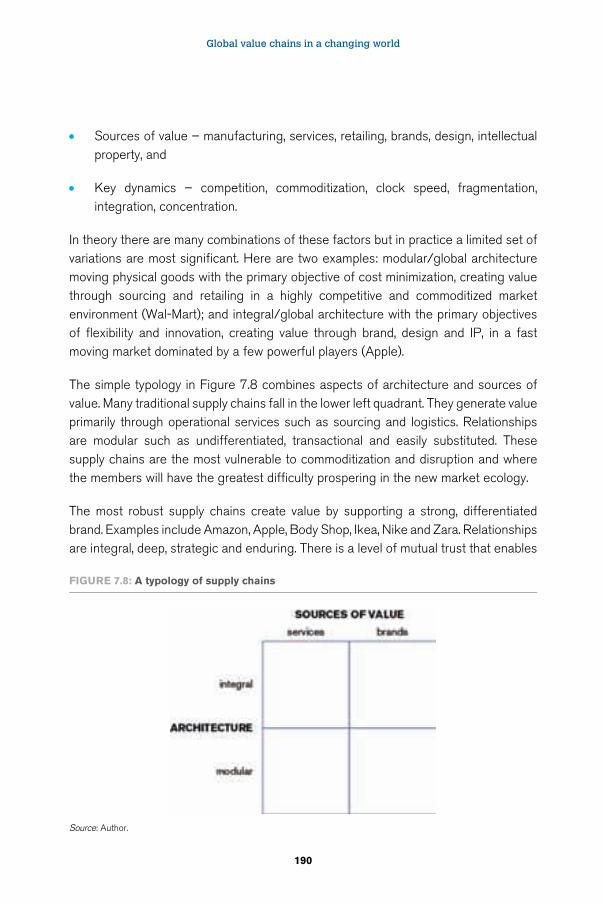
Global value chains in a changing world
190
• Sources of value – manufacturing, services, retailing, brands, design, intellectual property, and
• Key dynamics – competition, commoditization, clock speed, fragmentation, integration, concentration.
In theory there are many combinations of these factors but in practice a limited set of variations are most significant. Here are two examples: modular/global architecture moving physical goods with the primary objective of cost minimization, creating value through sourcing and retailing in a highly competitive and commoditized market environment (Wal-Mart); and integral/global architecture with the primary objectives of flexibility and innovation, creating value through brand, design and IP, in a fast moving market dominated by a few powerful players (Apple).
The simple typology in Figure 7.8 combines aspects of architecture and sources of value. Many traditional supply chains fall in the lower left quadrant. They generate value primarily through operational services such as sourcing and logistics. Relationships are modular such as undifferentiated, transactional and easily substituted. These supply chains are the most vulnerable to commoditization and disruption and where the members will have the greatest difficulty prospering in the new market ecology.
The most robust supply chains create value by supporting a strong, differentiated brand. Examples include Amazon, Apple, Body Shop, Ikea, Nike and Zara. Relationships are integral, deep, strategic and enduring. There is a level of mutual trust that enables
Figure 7.8: A typology of supply chains
Source: Author.
The dynamics of global supply chains
191
information sharing among supply chain members and thus collaborative problem solving, learning and performance improvement. These supply chains are the most flexible and adaptive.
The major challenge facing supply chain members is to prepare for a very different business landscape, sooner than most expect. Some understand the need for change and the changes that are needed, but others do not. Many are thinking incrementally and seem over-confident, even complacent. They say: “we understand what is happening and already are responding. We have plenty of time. Don’t worry, everything is under control.” These words have been heard many times before, for example, from leaders of the major telecom groups when the Internet, broadband, mobile, and wifi were turning their world upside-down. It is what Sull (1999) calls active inertia. The capabilities, culture and beliefs that made a company successful become constraints that cause insufficient and ineffective responses to market disruptions.
Our understanding of the dynamics that are reshaping global supply chains is incomplete. The influences of government extend beyond trade policies, taxation and market regulation. They can include proactive collaboration with the private sector to create enabling infrastructure and resources. How do these initiatives affect the objectives, architecture and sources of value and key dynamics of supply chains? Much of the literature on supply chains focuses on products. Services, including finance, healthcare, education, and entertainment have their supply chains, too. How do service supply chains differ from those for products? What are the implications of the digitalization and virtualization of services? These are very fertile areas for research.
Endnotes
1 Fine (2005).
2 Pipenbrock (2009).
3 Gonzales and Low (2012).
4 Pipenbrock (2009).
5 Fine et al., (2002).
6 Lee and O’Marah (2011).
Global value chains in a changing world
192
7 Evans and Wurster (2000).
8 Lee (2003).
9 Miles (2003).
10 Financial Times (2012).
11 Fine (1998).
12 Weil (2012).
13 Brown and Hagel (2003).
14 Grove (1998).
15 Pine and Gilmore (1998).
16 Lee and O’Marah (2011).
17 Gawer and Cusumano (2002).
18 Christensen and Overdorf (2000).
19 Henderson and Clark (1990); Roberts and Liu (2001); Munir and Phillips (2002); Christensen, et al., (1998).
References
Abernathy, W.; Utterback, J. M. 1978. “Patterns of Industrial Innovation,” in Technology Review, 80: 40–7.
Afuah, A. N.; Utterback, J .M. 1997. “Responding to Structural Industry Changes: A Technological Evolution Perspective,” in Industrial and Corporate Change, 6(1):183–202.
Brown, J. S.; Hagel III, J. 2003. “Letters to the Editor,” in Harvard Business Review, July-August (109–112).
Christensen, C. M.; Overdorf, M. 2000. “Meeting the Challenge of Disruptive Change,” in Harvard Business Review, March-April (66-76); reprint no. R00202.
Christensen, C. M.; Suarez, F. F.; Utterback, J. M. 1998. “Strategies for Survival in Fast-Changing Industries,” in Management Science, December 44(12): 207–S220, Part 2 of 2.
Evans, P.; Wurster, T.S. 2000. “Blown to Bits: How the New Economics of Information Transforms Strategy”, (Boston, MA, Harvard Business School Press).
Fine, C. H. 2005. “Are you Modular or Integral? Be Sure your Supply Chain Knows”, in Strategy + Business, Summer Issue 39: 1–8.
The dynamics of global supply chains
193
Fine, C. H.; Vardan, R.; Pethick, R.; El-Hout, J. 2002. “Rapid-Response Capability in Value Chain Design,” in MIT Sloan Management Review, Winter (69–75).
Fine, C. H. 1998. “Clockspeed: Winning Industry Control in the Age of Temporary Advantage”, (Reading, MA, Perseus Publishing).
Financial Times, 19 March 2012. http://www.ft.com/intl/cms/s/0/56b594be-6d23-11e1-b6ff-00144feab494.html#axzz2RGoQAjMo
Gawer, A.; Cusumano, M. 2002. “Platform Leadership: How Intel, Microsoft and Cisco Drive Industry Innovation,” (Boston, MA, Harvard Business School Press).
Gonzalez, A.; Low, P. 2012. “Trade and Value-Added: What Implications of Recent Studies for the Design of Trade Policy?”, WTO, Geneva, Switzerland, 9 March.
Grösser, S. N. 2011. “Co-Evolution of Standards: The Case of Voluntary and Legal Building Codes in the Swiss Residential Sector,” Doctoral Dissertation, USG, Graduate School of Business Administration, July (St. Gallen, Switzerland, University of St. Gallen).
Grove, A. S. 1998. “Only the Paranoid Survive” (London, UK, Profile Books).
Gutwald, P. M. 1996. “A Strategic Sourcing Model for Concurrent Product, Process and Supply-Chain Design”, Master’s Thesis, MIT Sloan School of Management (Cambridge, MA, Massachusetts Institute of Technology).
Henderson, R. M.; Clark, K. B. 1990. “Architectural Innovation: The Reconfiguration of Existing Product Technologies and the Failure of Established Firms,” in Administrative Science Quarterly, 35(1990): 9–30.
Jeanrenaud, P. 2004. “The Dynamics and Architecture of Value Networks – The Case of the Medical Imaging Industry”, Master of Science in the Management of Technology Thesis, MIT Sloan School of Management (Cambridge, MA, Massachusetts Institute of Technology).
Klepper, S.; Graddy, E. 1990. “The Evolution of New Industries and the Determinants of Market Structure,” in Rand Journal of Economics, 21(1): 27–43.
Lee, H.; O’Marah, K. 2011. “The Chief Supply Chain Officer Report 2011”, (London, UK, SCM World, a RaptureWorld Company).
Lee, W. C-L. 2003. “Clash of the Titans: Impact of Convergence and Divergence on Digital Media”, Master of Science in the Management of Technology Thesis, MIT Sloan School of Management (Cambridge, MA, Massachusetts Institute of Technology).
Locke, R.; Amengual, M.; Mangla, A. 2009. “Virtue out of Necessity? Compliance, Commitment, and the Improvement of Labor Conditions in Global Supply Chains,” in Politics & Society, 37(3): 319–351.
Lyneis, J. M. 1993. “A Dynamic Model of Technology Diffusion,” in Proceedings of the 1993 International System Dynamics Conference, System Dynamics Society (Cancún, Mexico).
Global value chains in a changing world
194
Miles, S. B. 2003. “Web Services Strategy”, Master of Science in the Management of Technology Thesis, MIT Sloan School of Management (Cambridge, MA, Massachusetts Institute of Technology).
Milling, P. M. 1996. “Modeling Innovation Processes for Decision Support and Management Simulation,” in System Dynamics Review, 12(3): 221–234, Fall.
Munir, K. A.; Phillips, N. 2002. “The Concept of Industry and the Case of Radical Technological Change,” in The Journal of High Technology Management Research, 13(2002): 279–297.
Piepenbrock, T. F. 2009. “Toward a Theory of the Evolution of Business Ecosystems: Enterprise Architectures, Competitive Dynamics, Firm Performance & Industrial Co-Evolution”, PhD Dissertation, MIT Engineering Systems Division (Cambridge, MA, Massachusetts Institute of Technology).
Pine, B. J. II; Gilmore, J. H. 1998. “Welcome to the Experience Economy,” in Harvard Business Review, July-August.
Plambeck, Erica; Lee, H. L.; Yatsko, P. 2012. “Improving Environmental Performance in Your Chinese Supply Chain,” in Sloan Management Review, 53(2): 43–51, Winter.
Roberts, E. B.; Liu, K. W. 2001. “Ally or Acquire? How Technology Leaders Decide,” in Sloan Management Review, 43(1): 26–34, Fall, reprint no. 4312.
Soh, P. H.; Roberts, E. B. 1998. “The Patterns of Inter-organizational Networks in the Development of Data Communication Technologies,” MIT Sloan School of Management Working Paper WP 4010–98 (Cambridge, MA, Massachusetts Institute of Technology).
Sull, D. N. 1999. Why good companies go bad. Harvard Bussiness Review (july – August): 42–48, 50, 52.
Utterback, J. M. 1994. “Mastering the Dynamics of Innovation”, (Cambridge, MA, Harvard Business School Press).
Weil, H. B. 2012. “Turning Innovation into Value,” in S. Grösser and R. Zeier (eds): Systemic Management for Intelligent Organizations (New York, NY, Springer-Verlag Berlin Heidelberg).
Weil, H. B.; Utterback, J. M. 2005. “The Dynamics of Innovative Industries,” in Proceedings of the 23rd International System Dynamics Conference, System Dynamics Society (Boston, MA).
Weil, H. B.; Weil, E. E. 2001. “The Road from Dependency to Empowerment: The Destination is Worth the Journey,” Sloan School of Management Working Paper No. 4102, August 1999 (Cambridge, MA, Massachusetts Institute of Technology).
195
8 Uncertainty and risk in global supply chains
Donald Lessard1
8.1. Overview
Many discussions of supply chain risk begin with graphic depictions of situations where small disruptions lead to a large impact. Sheffi (2005) describes the sequence of events beginning with a lighting strike to a Philips factory in New Mexico that led to the disruption of a generation of cell phones, with Nokia successfully overcoming the disruption through proactive management while Ericsson lost out.
Such examples serve as illustrations of today’s highly interdependent supply chains and the risks inherent in their geographic dispersion and organizational fragmentation. However, which stories are told depends on whose perspective is taken. The principal focus of the global supply chain literature is on the consequences to corporations that are supply chain owners, orchestrators or customers from variations in product demand (Lee, 2002) and potential disruptions in the supply chain (Sheffi, 2005; Simchi-Levi, 2010)
In contrast, the international labour and global production system literature2 focus on the risks to workers engaged in the global production system from factory relocations and closings, highly variable working hours and unsafe working conditions. A sampling of stories from this perspective over the last year includes Adidas closing its last Chinese plant, the Bangladesh factory fire that killed 112 workers and the Foxconn labour protests over pay and working conditions. These risks to workers also circle back to the corporations that control and use the supply chains via reputation and, perhaps, legal action, as with the suits brought against Samsung by three French rights groups. Li Qiang, head of China Labour Watch, said: “we’ve never found any Foxconn factory where overtime reaches 186 hours a month. But we found that in one of Samsung’s factories.”3
Global value chains in a changing world
196
A third focus is on the risks faced by firms and entrepreneurs who comprise the supply chains as the result of macroeconomic or product volatility and competitive dynamics. In the short run, many of these firms encounter significant swings in demand from individual customers whom they must accommodate. In the longer run, they face the uncertainty as to whether they will survive to see another day. This aspect is a central focus of the general industrial development literature focusing on “upgrading”.
Finally, the regions and nations whose workers and firms make up the supply chain are also exposed to disruptions, volatility and shifting competitiveness and their impact on local incomes, structural change and the environment.
This chapter focuses on all four of these perspectives on the risk of globalized supply, production and value chains.4 In doing so, we take a multidisciplinary perspective, combining insights from international business (economics and strategy), finance and operations.
This chapter is organized in eight parts. Part 2 defines uncertainty and risk in the supply chain and identifies the layers of risk that affect the supply chain. Part 3 examines the relationship between globalization and risk. Part 4 addresses the different forms of mitigation appropriate to different types of risk. Part 5 introduces the concept of comparative advantage in bearing risk. Part 6 assesses the incidence of supply chain risk versus the capacity to bear risk for a set of stylized supply chain stakeholders. Part 7 discusses global risk pressure points and priorities. Part 8 concludes with a brief discussion of which supply chain risks can be relatively successfully managed by individual actors versus those that require concerted efforts by groups of suppliers, by policymakers or by the two groups working together.
8.2. Defining uncertainty and risk in the supply chain
Definitions of uncertainty and risk vary by discipline as well as by perspective so that there are many, often contradictory, framings. Economists by and large use the definition introduced by Knight that uncertainty refers to situations where many outcomes are possible but specific probabilities are not assigned, while risk refers to situations where specific probabilities can be attached. Financial economists, by contrast, tend to lump together uncertainties and volatilities and define risk as the product of a distribution of state-specific outcomes and a position or exposure, as in value at risk (VAR). Supply chain specialists coming from an operations research tradition typically focus on product demand volatilities and specific events that
Uncertainty and risk in global supply chains
197
disrupt the supply chain. Juttner et al., (2003) provide a succinct definition: “In simple terms, supply chain risks refer to the possibility and effect of a mismatch between supply and demand. ‘Risk sources’ are the environmental, organizational or supply chain-related variables which cannot be predicted with certainty and which impact on the supply chain outcome variables. Risk consequences are the focused supply chain outcome variables such as costs or quality, i.e., the different forms in which the variance becomes manifest.”
In this case, the terms “risk sources” and “uncertainties” are interchangeable, whereas risk consequences are defined as “impacts on supply chain outcome variables” of particular risk events or outcomes.
In this chapter, we define sources of risk as variables whose future values are not known with certainty, either because of a lack of information regarding the underlying process, because they are the result of social, economic or political interactions that cannot be fully predicted, or both. We define risk events or outcomes as specific realizations of these uncertainties, for example a fire in a factory or a trade dispute between the United States and China. Finally, we define risk consequences as the potential impact of realizations of these variables on the value(s) of the relevant objective function(s): cost, timeliness, safety or reputation for corporations that “are supplied”; variations in working hours and wages and safety hazards for workers; variations in short- or long-run profits for suppliers; and variations in overall income as well as other economic, social and environmental impacts for regions
Risk sources
The Fung Global Institute has identified five main sources of risk affecting supply chains in today’s integrated global economy: state (national) factors, consumer dynamics, natural disruptions, man-made disruptions and innovation. I have added a sixth set, macroeconomic dynamics that overlap the state and consumer dynamics, as shown in Figure 8.1.
Each of these sources of risk has consequences for the four sets of actors we have identified: corporations that are “supplied”, workers that produce, firms that comprise a part of, and regions that embody.
I find it informative to array these sources of risk from inside to outside by the “extent” of the system in which they are generated as depicted in Figure 8.2 for the apparel supply chain.5
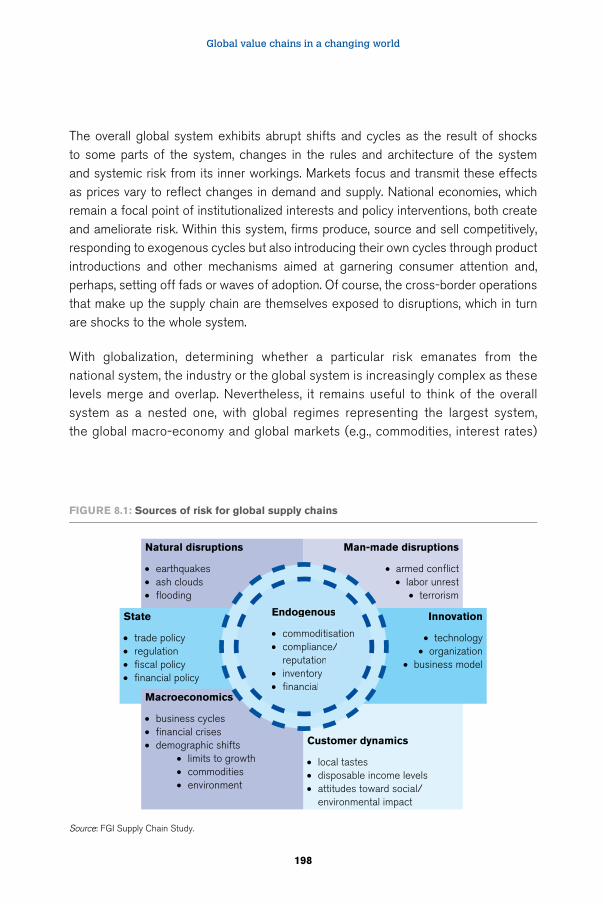
Global value chains in a changing world
198
The overall global system exhibits abrupt shifts and cycles as the result of shocks to some parts of the system, changes in the rules and architecture of the system and systemic risk from its inner workings. Markets focus and transmit these effects as prices vary to reflect changes in demand and supply. National economies, which remain a focal point of institutionalized interests and policy interventions, both create and ameliorate risk. Within this system, firms produce, source and sell competitively, responding to exogenous cycles but also introducing their own cycles through product introductions and other mechanisms aimed at garnering consumer attention and, perhaps, setting off fads or waves of adoption. Of course, the cross-border operations that make up the supply chain are themselves exposed to disruptions, which in turn are shocks to the whole system.
With globalization, determining whether a particular risk emanates from the national system, the industry or the global system is increasingly complex as these levels merge and overlap. Nevertheless, it remains useful to think of the overall system as a nested one, with global regimes representing the largest system, the global macro-economy and global markets (e.g., commodities, interest rates)
Customer dynamics
• local tastes • disposable income levels• attitudes toward social/
environmental impact
Man-made disruptions
• armed conflict• labor unrest
• terrorism
Innovation
• technology• organization
• business model
Natural disruptions
• earthquakes• ash clouds• flooding
State
• trade policy• regulation• fiscal policy• financial policy
Macroeconomics
• business cycles• financial crises• demographic shifts
• limits to growth• commodities• environment
Endogenous
• commoditisation• compliance/
reputation• inventory• financial
FIgure 8.1: Sources of risk for global supply chains
Source: FGI Supply Chain Study.
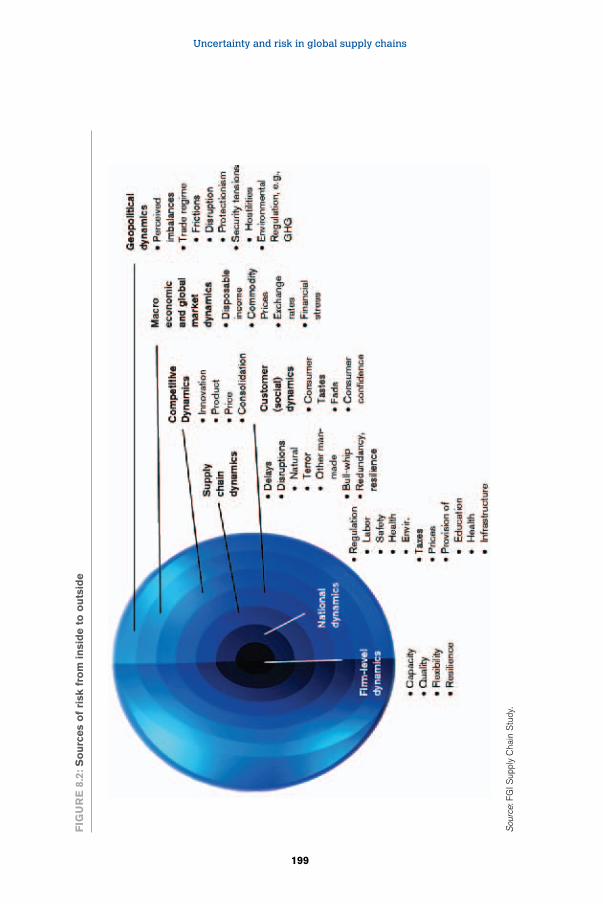
Uncertainty and risk in global supply chains
199
FIg
ur
e 8
.2: S
ou
rces
of
risk
fro
m in
sid
e t
o o
uts
ide
Sou
rce:
FG
I Sup
ply
Cha
in S
tudy
.
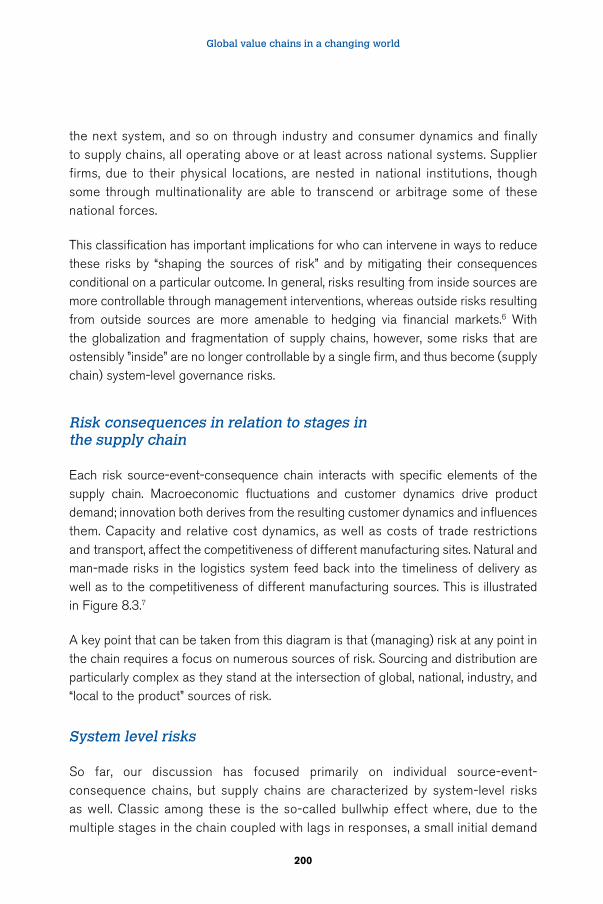
Global value chains in a changing world
200
the next system, and so on through industry and consumer dynamics and finally to supply chains, all operating above or at least across national systems. Supplier firms, due to their physical locations, are nested in national institutions, though some through multinationality are able to transcend or arbitrage some of these national forces.
This classification has important implications for who can intervene in ways to reduce these risks by “shaping the sources of risk” and by mitigating their consequences conditional on a particular outcome. In general, risks resulting from inside sources are more controllable through management interventions, whereas outside risks resulting from outside sources are more amenable to hedging via financial markets.6 With the globalization and fragmentation of supply chains, however, some risks that are ostensibly ”inside” are no longer controllable by a single firm, and thus become (supply chain) system-level governance risks.
Risk consequences in relation to stages in the supply chain
Each risk source-event-consequence chain interacts with specific elements of the supply chain. Macroeconomic fluctuations and customer dynamics drive product demand; innovation both derives from the resulting customer dynamics and influences them. Capacity and relative cost dynamics, as well as costs of trade restrictions and transport, affect the competitiveness of different manufacturing sites. Natural and man-made risks in the logistics system feed back into the timeliness of delivery as well as to the competitiveness of different manufacturing sources. This is illustrated in Figure 8.3.7
A key point that can be taken from this diagram is that (managing) risk at any point in the chain requires a focus on numerous sources of risk. Sourcing and distribution are particularly complex as they stand at the intersection of global, national, industry, and “local to the product” sources of risk.
System level risks
So far, our discussion has focused primarily on individual source-event-consequence chains, but supply chains are characterized by system-level risks as well. Classic among these is the so-called bullwhip effect where, due to the multiple stages in the chain coupled with lags in responses, a small initial demand
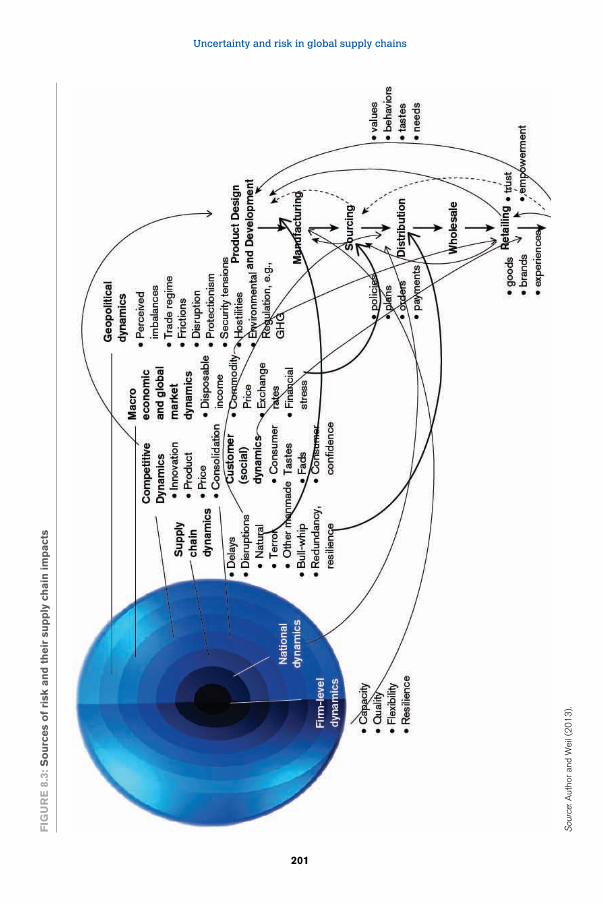
Uncertainty and risk in global supply chains
201
FIg
ur
e 8
.3: S
ou
rces
of
risk
an
d t
heir
su
pp
ly c
hain
im
pact
s
Sou
rce:
Aut
hor
and
Wei
l (2
01
3).
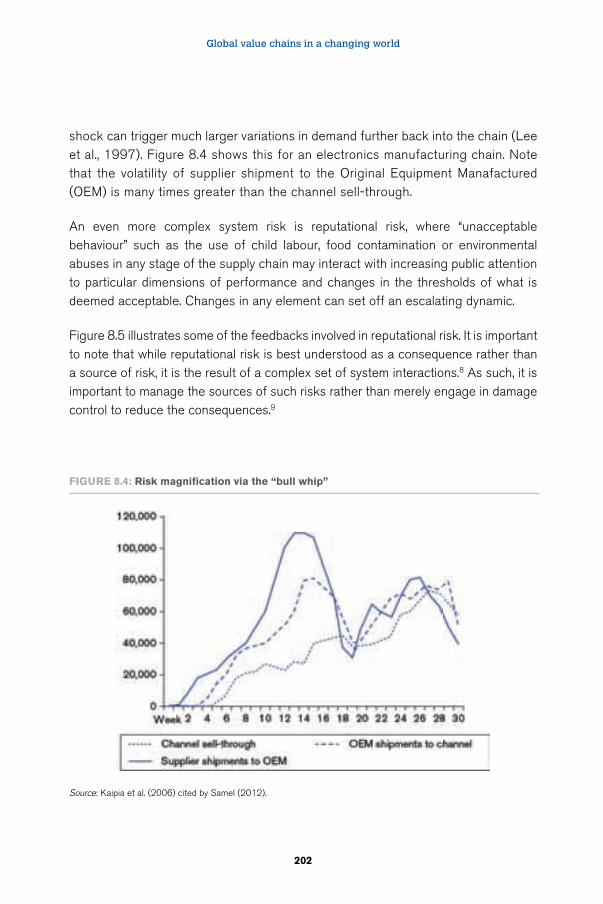
Global value chains in a changing world
202
shock can trigger much larger variations in demand further back into the chain (Lee et al., 1997). Figure 8.4 shows this for an electronics manufacturing chain. Note that the volatility of supplier shipment to the Original Equipment Manafactured (OEM) is many times greater than the channel sell-through.
An even more complex system risk is reputational risk, where “unacceptable behaviour” such as the use of child labour, food contamination or environmental abuses in any stage of the supply chain may interact with increasing public attention to particular dimensions of performance and changes in the thresholds of what is deemed acceptable. Changes in any element can set off an escalating dynamic.
Figure 8.5 illustrates some of the feedbacks involved in reputational risk. It is important to note that while reputational risk is best understood as a consequence rather than a source of risk, it is the result of a complex set of system interactions.8 As such, it is important to manage the sources of such risks rather than merely engage in damage control to reduce the consequences.9
FIgure 8.4: risk magnification via the “bull whip”
Source: Kaipia et al. (2006) cited by Samel (2012).
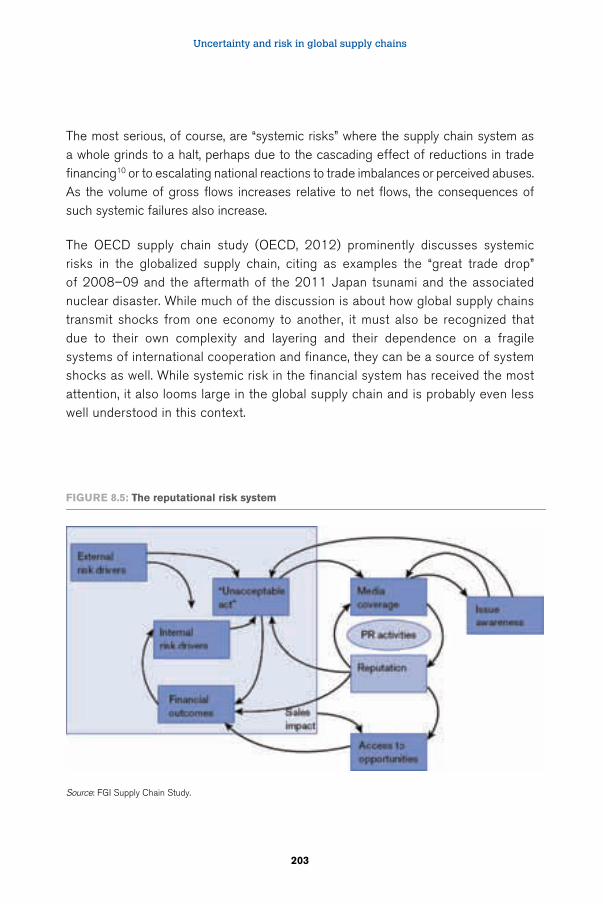
Uncertainty and risk in global supply chains
203
The most serious, of course, are “systemic risks” where the supply chain system as a whole grinds to a halt, perhaps due to the cascading effect of reductions in trade financing10 or to escalating national reactions to trade imbalances or perceived abuses. As the volume of gross flows increases relative to net flows, the consequences of such systemic failures also increase.
The OECD supply chain study (OECD, 2012) prominently discusses systemic risks in the globalized supply chain, citing as examples the “great trade drop” of 2008–09 and the aftermath of the 2011 Japan tsunami and the associated nuclear disaster. While much of the discussion is about how global supply chains transmit shocks from one economy to another, it must also be recognized that due to their own complexity and layering and their dependence on a fragile systems of international cooperation and finance, they can be a source of system shocks as well. While systemic risk in the financial system has received the most attention, it also looms large in the global supply chain and is probably even less well understood in this context.
FIgure 8.5: The reputational risk system
Source: FGI Supply Chain Study.
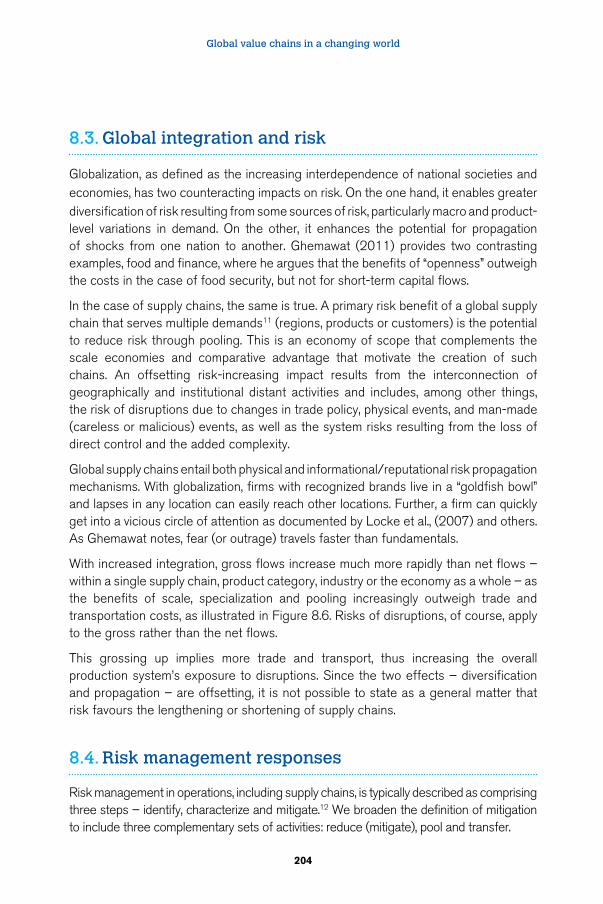
Global value chains in a changing world
204
8.3. Global integration and risk
Globalization, as defined as the increasing interdependence of national societies and economies, has two counteracting impacts on risk. On the one hand, it enables greater diversification of risk resulting from some sources of risk, particularly macro and product-level variations in demand. On the other, it enhances the potential for propagation of shocks from one nation to another. Ghemawat (2011) provides two contrasting examples, food and finance, where he argues that the benefits of “openness” outweigh the costs in the case of food security, but not for short-term capital flows.
In the case of supply chains, the same is true. A primary risk benefit of a global supply chain that serves multiple demands11 (regions, products or customers) is the potential to reduce risk through pooling. This is an economy of scope that complements the scale economies and comparative advantage that motivate the creation of such chains. An offsetting risk-increasing impact results from the interconnection of geographically and institutional distant activities and includes, among other things, the risk of disruptions due to changes in trade policy, physical events, and man-made (careless or malicious) events, as well as the system risks resulting from the loss of direct control and the added complexity.
Global supply chains entail both physical and informational/reputational risk propagation mechanisms. With globalization, firms with recognized brands live in a “goldfish bowl” and lapses in any location can easily reach other locations. Further, a firm can quickly get into a vicious circle of attention as documented by Locke et al., (2007) and others. As Ghemawat notes, fear (or outrage) travels faster than fundamentals.
With increased integration, gross flows increase much more rapidly than net flows – within a single supply chain, product category, industry or the economy as a whole – as the benefits of scale, specialization and pooling increasingly outweigh trade and transportation costs, as illustrated in Figure 8.6. Risks of disruptions, of course, apply to the gross rather than the net flows.
This grossing up implies more trade and transport, thus increasing the overall production system’s exposure to disruptions. Since the two effects – diversification and propagation – are offsetting, it is not possible to state as a general matter that risk favours the lengthening or shortening of supply chains.
8.4. Risk management responses
Risk management in operations, including supply chains, is typically described as comprising three steps – identify, characterize and mitigate.12 We broaden the definition of mitigation to include three complementary sets of activities: reduce (mitigate), pool and transfer.
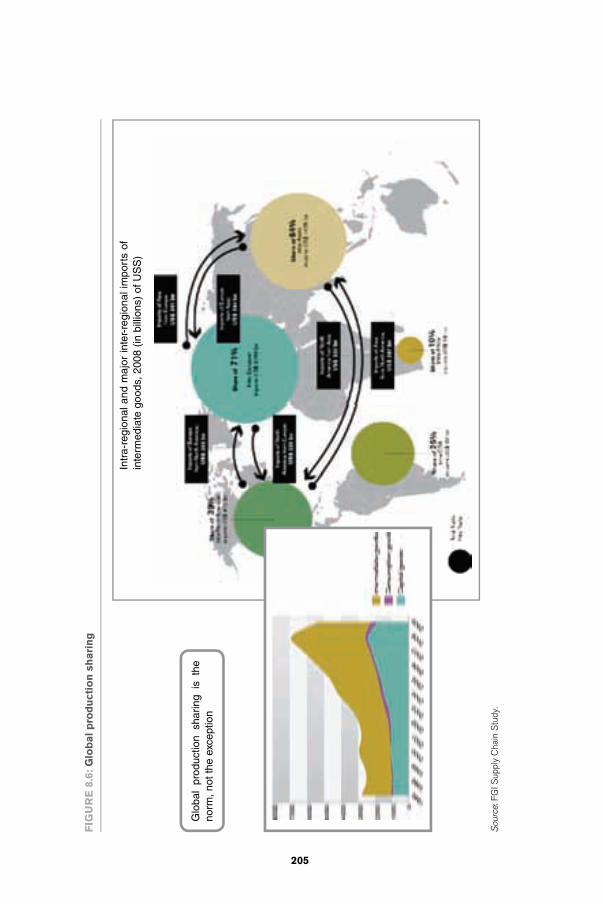
205
FIg
ur
e 8
.6: g
lob
al p
rod
uct
ion
sh
ari
ng
Sou
rce:
FG
I Sup
ply
Cha
in S
tudy
.
Glo
bal
prod
uctio
n sh
arin
g is
the
no
rm, n
ot th
e ex
cept
ion
Intr
a-re
gion
al a
nd m
ajor
inte
r-re
gion
al im
port
s of
in
term
edia
te g
oods
, 200
8 (in
bill
ions
) of
US
S)
Global value chains in a changing world
206
Regardless of the type of risk driver or consequence, there are only a small number of fundamental types of possible response, either before or after the fact. These include responses that: 1) have the potential to change the probability distribution of outcomes – what we refer to as shaping risks – and thus change the stand-alone cash flows from the operations in question; 2) those that have the potential to improve the consequences of the affected operations conditional on the realization of the risk outcome – real options and real pooling; and 3) those that redistribute risk without affecting the stand-alone distributions of outcomes and consequences – financial diversification, hedging and insurance – and thus alter the risk of portfolios of assets held by firms or investors.
Some source-outcome-consequence chains are amenable to only one type of management intervention, whereas different actors may be able to respond in multiple ways to others. In general, there is a “pecking order” of risk management responses for risks involving “things that break,” “things that vary”, and “regimes that change.”13
“Things that break” correspond to operational failures such as delays or gaps in quality or to disruption due to man-made or natural hazards. In most instances, these are “inside” risks at the supplier or supply chain level and are best addressed by building effective organizations with properly aligned incentives and commitment of its employees as well as an overlay of compliance and security. Diversification or pooling does not alter the expected losses associated with these errors, and insurance will be expensive (relative to the expected losses) due to the moral hazard involved. Multiple or flexible sourcing will mitigate the impacts of supply interruptions, but not of product quality.
“Things that vary” correspond to fluctuations in product and macro demand and to commodity and financial prices. Strategic risks associated with irreversibly committing resources in the face of cost or demand uncertainties – by firms, by workers or by regions – often can be addressed by creating options to allow a greater range of responses in line with future outcomes. These real options, though, are costly, so only some of them will add value. A variant of the real option is pooling, whereby a firm is able to employ a specific fixed capacity to serve a variety of different product or national market demands, thus enhancing the expected cash flows for this set of activities while reducing their volatility. This is different from and more effective than financial diversification that simply reduces portfolio variance by mixing different distributions without altering their expected values. On the other hand, pooling requires standardization and specialization, and it may limit the ability of firms to integrate forward or backward in the chain and is subject to diminishing returns as the number of “demands” that are pooled increases. This standardization and specialization, in turn, benefits from regional agglomeration that allows the co-specialization of firms and provides a barrier to entry benefiting relatively few locations.
When “things that vary” are traded in markets, such as exchange rates or commodity prices, it also is possible to shift these risks through hedging in financial markets.
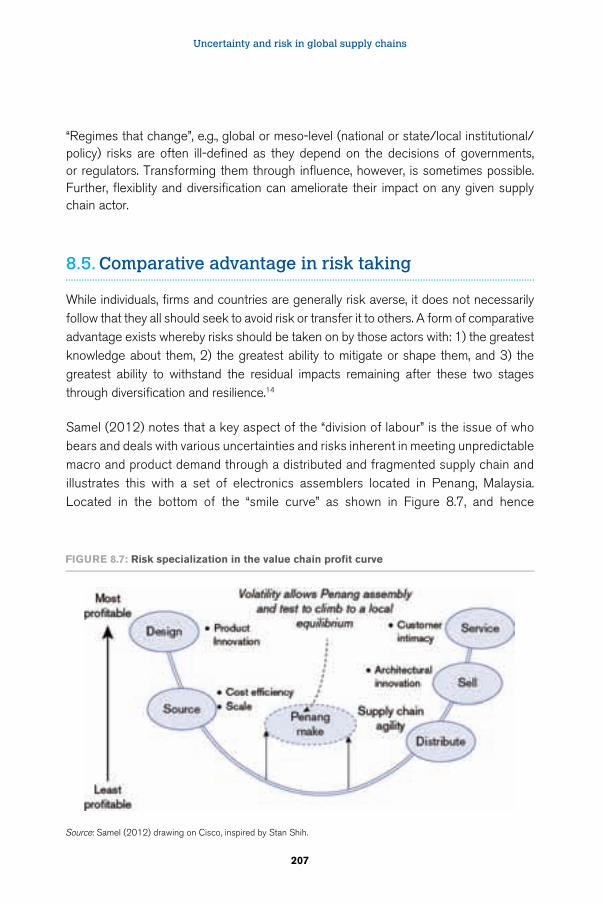
Uncertainty and risk in global supply chains
207
“Regimes that change”, e.g., global or meso-level (national or state/local institutional/policy) risks are often ill-defined as they depend on the decisions of governments, or regulators. Transforming them through influence, however, is sometimes possible. Further, flexiblity and diversification can ameliorate their impact on any given supply chain actor.
8.5. Comparative advantage in risk taking
While individuals, firms and countries are generally risk averse, it does not necessarily follow that they all should seek to avoid risk or transfer it to others. A form of comparative advantage exists whereby risks should be taken on by those actors with: 1) the greatest knowledge about them, 2) the greatest ability to mitigate or shape them, and 3) the greatest ability to withstand the residual impacts remaining after these two stages through diversification and resilience.14
Samel (2012) notes that a key aspect of the “division of labour” is the issue of who bears and deals with various uncertainties and risks inherent in meeting unpredictable macro and product demand through a distributed and fragmented supply chain and illustrates this with a set of electronics assemblers located in Penang, Malaysia. Located in the bottom of the “smile curve” as shown in Figure 8.7, and hence
FIgure 8.7: risk specialization in the value chain profit curve
Source: Samel (2012) drawing on Cisco, inspired by Stan Shih.
Global value chains in a changing world
208
presumably commoditized and earning low margins, some Penang assemblers in the electronics supply chain have succeeded in commanding both relatively high wages for their workers and relatively high margins for themselves by specializing in bearing volatility in product demand.
They do so on the basis of accommodating labour regulations and institutions (including an ample pool of immigrant labour), a broad set of relationships with design and end-product firms that allow them address extreme fluctuations in product demand, with surges in production requirements from 250 per cent to 500 per cent within a year and cut backs of up to two-thirds within the same time frame, through to the pooling of production and relatively simple technologies that can be reconfigured quickly, as in changing the number of assembly lines. The volatilities of orders for each product or relationship act as a barrier to entry, since it is costly for new entrants to match the scale and organizational and managerial capabilities required for pooling and pliability. This risk is partly transformed by pooling and partly transferred to workers through volatile hours. Samel concludes that these firms’ abilities to take on volatility limits their incentive and ability to “upgrade” technologically. I would take the argument a step further: “upgrading” should be redefined to include higher levels of production technology, greater innovation and greater ability to withstand and profit from volatility.
Hon Hai (Foxconn) also appears to gain much of its advantage from its ability to quickly scale production to meet demand. This is particularly important given the “winner take all” nature of network effect consumer electronic products that is exacerbated by the fact that product demand is “pulsed” to build a self-reinforcing wave of sales.
The inherent volatility of demand in supply chains at the macro and product level, in fact, appears to be one of the key barriers of entry to the supply chain and access to higher value added (Buckley, 2009).
8.6. Supply chain risk and the capacity to absorb risk
Supply chain stakeholders differ in their exposure to particular risks, in their capacity to absorb these impacts and in their ability to mitigate or hedge those risks. The key concern from an extended view of the supply chain that includes labour and small and medium sized enterprises (SMEs) is the extent to which different supply chain actors have greater or lesser scope to manage a particular set of risks and
Uncertainty and risk in global supply chains
209
to what extent mitigating risk requires concerted action by local, national or global communities versus individual firms, by policymakers or perhaps by coordinated action by both groups. A related issue is to determine which risks within specific supply chains can be relatively successfully managed by individual actors versus those that require concerted efforts by groups of suppliers, by policymakers or by the two groups working together
A disruption in a particular source, whether due to a natural calamity, a man-made error or a malicious act at that source or a disruption to another stage, will result in the failure of the supply chain to deliver the promised products on a timely basis. It may also entail a significant loss of income for labour and a loss in capacity utilization and income for the factory owner that will be exacerbated by any investment in raw materials or work in process that it has undertaken. The orchestrator typically will lose proportionally on its throughput, unless of course it has another source of supply. The brand owner may or may not lose depending on whether it (or its orchestrator) has an alternative source of supply and, if not, whether the ultimate product is a freestanding product or a component of a more complex system, as well as whether or not it faces close substitutes in the marketplace.
If the disruption is systemic to the supplier country or region, as with a natural disaster such as Fukushima, a transport shutdown, or a policy “embargo,” then the supplier country will suffer a similar proportional impact, or perhaps even larger, due to the social capital and infrastructure involved.
This is illustrated in Figure 8.8 for a disruption in the supply chain, in panel “A” for a disruption that is specific to a single product or facility (e.g., the lightning strike to Philips’ factory) and in panel “B” for one that applies to all activities in a particular location (e.g., Fukushima).
An SME factory owner is very exposed to specific disruptions relative to its capacity to absorb for two reasons. First, a factory typically has fairly high fixed costs and therefore the impact of disruption is “leveraged.” Second, the owners often own one or a few business assets and thus have a substantial proportion of their wealth at risk. Larger, more diversified suppliers are in a better position, which implies that a “hazardous” world is particularly so for SMEs.
Labour is highly exposed because wages depend on continuity of operations, and household income typically is even less diversified than that of the SME factory owner.
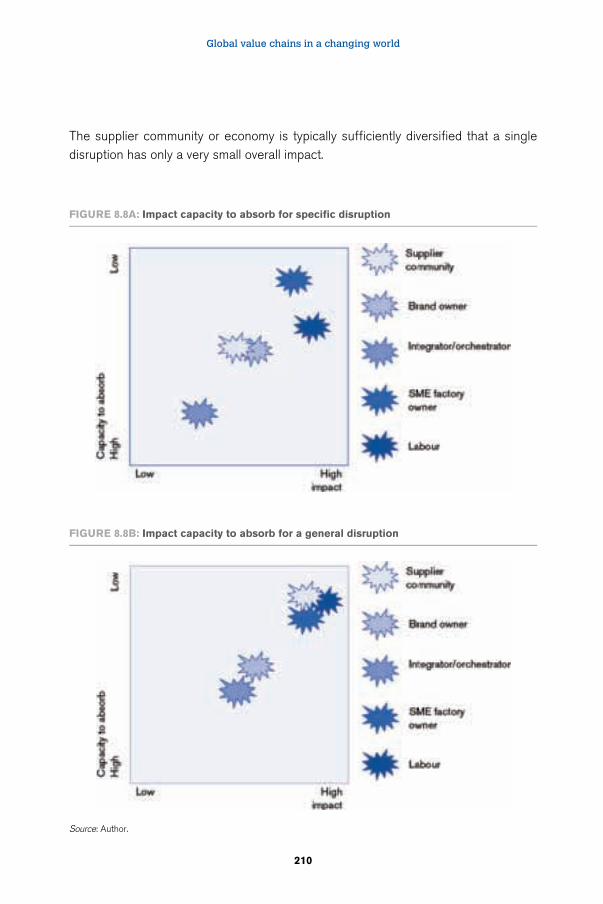
Global value chains in a changing world
210
FIgure 8.8a: Impact capacity to absorb for specific disruption
FIgure 8.8b: Impact capacity to absorb for a general disruption
The supplier community or economy is typically sufficiently diversified that a single disruption has only a very small overall impact.
Source: Author.
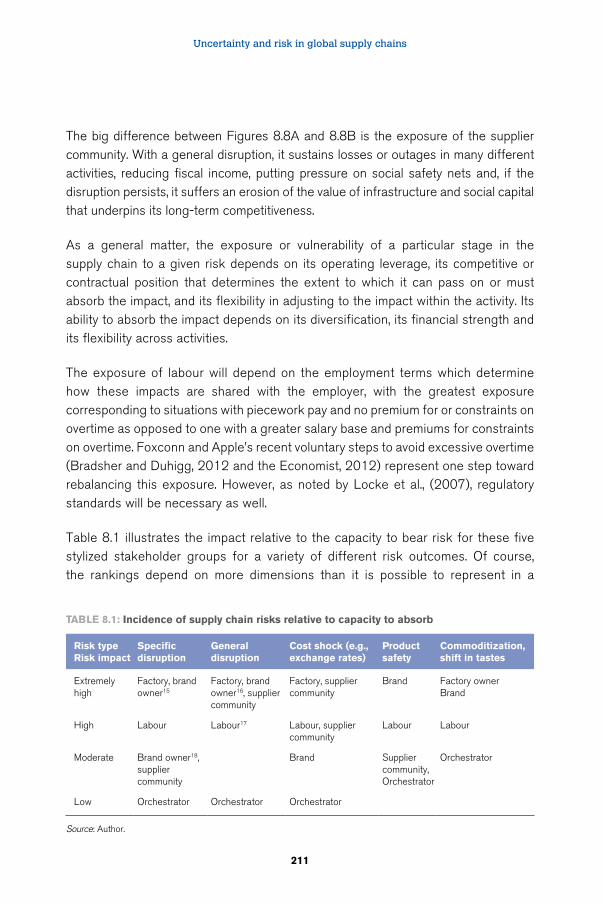
Uncertainty and risk in global supply chains
211
The big difference between Figures 8.8A and 8.8B is the exposure of the supplier community. With a general disruption, it sustains losses or outages in many different activities, reducing fiscal income, putting pressure on social safety nets and, if the disruption persists, it suffers an erosion of the value of infrastructure and social capital that underpins its long-term competitiveness.
As a general matter, the exposure or vulnerability of a particular stage in the supply chain to a given risk depends on its operating leverage, its competitive or contractual position that determines the extent to which it can pass on or must absorb the impact, and its flexibility in adjusting to the impact within the activity. Its ability to absorb the impact depends on its diversification, its financial strength and its flexibility across activities.
The exposure of labour will depend on the employment terms which determine how these impacts are shared with the employer, with the greatest exposure corresponding to situations with piecework pay and no premium for or constraints on overtime as opposed to one with a greater salary base and premiums for constraints on overtime. Foxconn and Apple’s recent voluntary steps to avoid excessive overtime (Bradsher and Duhigg, 2012 and the Economist, 2012) represent one step toward rebalancing this exposure. However, as noted by Locke et al., (2007), regulatory standards will be necessary as well.
Table 8.1 illustrates the impact relative to the capacity to bear risk for these five stylized stakeholder groups for a variety of different risk outcomes. Of course, the rankings depend on more dimensions than it is possible to represent in a
Table 8.1: Incidence of supply chain risks relative to capacity to absorb
risk type risk impact
Specific disruption
general disruption
Cost shock (e.g., exchange rates)
Product safety
Commoditization, shift in tastes
Extremely high
Factory, brand owner15
Factory, brand owner16, supplier community
Factory, supplier community
Brand Factory ownerBrand
High Labour Labour17 Labour, supplier community
Labour Labour
Moderate Brand owner18, supplier community
Brand Supplier community,Orchestrator
Orchestrator
Low Orchestrator Orchestrator Orchestrator
Source: Author.
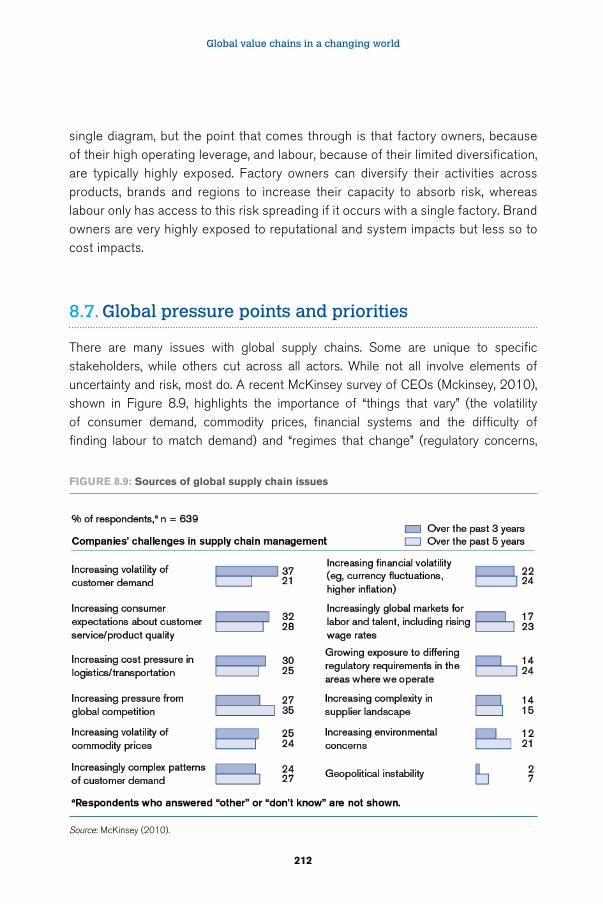
Global value chains in a changing world
212
single diagram, but the point that comes through is that factory owners, because of their high operating leverage, and labour, because of their limited diversification, are typically highly exposed. Factory owners can diversify their activities across products, brands and regions to increase their capacity to absorb risk, whereas labour only has access to this risk spreading if it occurs with a single factory. Brand owners are very highly exposed to reputational and system impacts but less so to cost impacts.
8.7. Global pressure points and priorities
There are many issues with global supply chains. Some are unique to specific stakeholders, while others cut across all actors. While not all involve elements of uncertainty and risk, most do. A recent McKinsey survey of CEOs (Mckinsey, 2010), shown in Figure 8.9, highlights the importance of “things that vary” (the volatility of consumer demand, commodity prices, financial systems and the difficulty of finding labour to match demand) and “regimes that change” (regulatory concerns,
FIgure 8.9: Sources of global supply chain issues
Source: McKinsey (2010).
Uncertainty and risk in global supply chains
213
environmental concerns). This is different from the reactions of supply chain managers that are much more focused on “things that break.”
These responses map closely to the five key pressure points identified by the Fung Global Institute Supply Chain Study. These include:
a) Changing patterns of production costs and demand resulting from higher incomes and consumption levels in emerging economies, as well as new demands and expectations from consumers (changes that reconfigure supply chains and value-added attribution);
b) Changing risk profiles (operational risks, customer and consumer dynamics, political and geo-political risks, natural and man-made disasters, policy instability);
c) New social and environmental pressures and realities;
d) New technologies and innovation (in manufacturing, services provision, IT-driven opportunities);
e) The policy scene (policy is not just a risk factor on account of changeability, but also a disruptor in its own right).
These five also match up closely with executives’ responses regarding their firms’ preparedness to address various global supply chain issues. As shown in Figure 8.10, they consider their firms quite capable of addressing competition and customer demand but not exposure to volatile exchange rates, commodity prices, regulatory requirements or geopolitical instability.
Brand owners,19 especially in food or health-sensitive chains, are concerned with their reputation as supply chains extend across firm and national boundaries. Firms whose products are integrated into sensitive systems, such as IT, Internet, electrical power or commercial aircraft and engines, are very concerned with quality as a failure in one component can have system-wide impact. The sources of risk of these potential outcomes are mostly man-made and involve both careless and malicious behaviour. Risk management is not a zero sum game among the stakeholders in a given chain, as the concern with quality makes the chain sticky and tends to align the interests of all parties in the chain.
These risks are also of concern to labour, facility owners and supplier communities since they raise the cost of “long” chains and favour “near-shoring”, other being things equal.
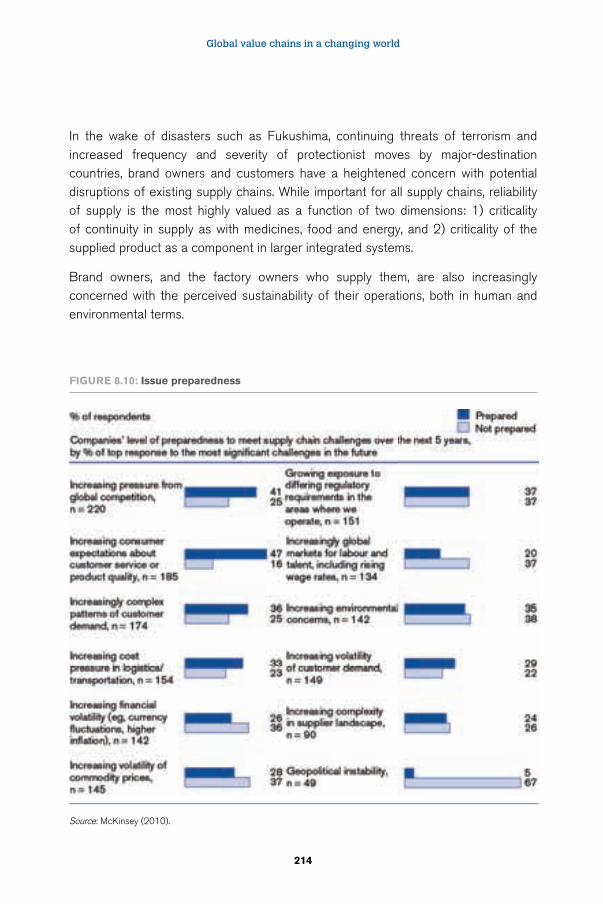
Global value chains in a changing world
214
In the wake of disasters such as Fukushima, continuing threats of terrorism and increased frequency and severity of protectionist moves by major-destination countries, brand owners and customers have a heightened concern with potential disruptions of existing supply chains. While important for all supply chains, reliability of supply is the most highly valued as a function of two dimensions: 1) criticality of continuity in supply as with medicines, food and energy, and 2) criticality of the supplied product as a component in larger integrated systems.
Brand owners, and the factory owners who supply them, are also increasingly concerned with the perceived sustainability of their operations, both in human and environmental terms.
FIgure 8.10: Issue preparedness
Source: McKinsey (2010).
Uncertainty and risk in global supply chains
215
Customer communities, including but not limited to government, are concerned with continued to access to supplies, as well as to maintaining or regaining a “fair share“ of value added.
“Near-shoring”, which is seen by many as a way to reduce supply chain risks, will reduce disruption risk and product risk in the form of stale inventories held in the supply chain, but it will increase product demand volatility in terms of employment and factory loading as it limits the spreading and pooling of this volatility across regions.
Finally, all actors have an interest in policy disruptions, but some have more than others since typically they have the greatest impact on the longest chains.
8.8. Conclusion
The globalization and fragmentation of supply chains creates risk through inter-linkages and interdependencies. However, their global scope also has the potential to reduce the impact of risk associated with macroeconomic and product volatility by allowing the pooling of diverse demands. This trade-off is central to the current discussion of “near-shoring” as a potential solution to supply chain risk. While “near-shoring” would reduce the risk of cross-border disruptions, it also would limit the ability of suppliers and workers to pool diverse demands. Further, unless matched by the creation of redundant supply and logistics links within each region, “near-shoring” would not eliminate the risks of supply chain disruptions and might even make them greater. That said, steps can be taken to reduce the risks associated with global supply chains and better distribute them among consumers, brand owners, orchestrators and providers of logistics and other supply chain services, SME and large-scale factory owners, and workers. In considering these steps, it is important to recognize the underlying sources of risk as well as the risk events themselves and the comparative advantage of different parties in affecting and absorbing various risks.
Much of this risk reduction and redistribution will result from the self-interested and self-organizing actions of the private firms that comprise global supply chains. Sophisticated firms that can successfully orchestrate complex supply chains will increase their ability to absorb volatility and work around disruptions through increased resilience, and they appear confident that they can do so. This often will require basing deep capabilities in multiple locations. Similarly, SMEs, whether by choice or evolutionary selection, will increasingly group themselves in deep clusters that provide this resilience at a systemic level.
Global value chains in a changing world
216
Risks associated with consumer safety such as food safety or counterfeit drugs, by contrast, will require concerted actions including government regulation. In the case of product contamination in the food chain, the immediate cause lies in the incentives for cutting corners by producers competing anonymously in commoditized markets. At a higher level, the issue lies in the absence of a direct connection between producers and consumers, something that could be restored to some extent by a stronger reliance on brands. However, while large, sophisticated firms can to a large extent address these risks through internal controls and branding, experience suggests that a combination of legally mandated and “brand-based” self-regulation is most effective. Further, purely “brand-based” regulation would tend to reduce the role of SMEs in these chains. Risks emanating from other forms of malicious behaviour, particularly involve similar arguments as well as the recognition that they often cross over into the realm of security that inevitably involves nations.
Risks to workers emanating from volatility and the incessant cost pressures of global supply chains are another area where some form of concerted action and regulation is necessary. In the case of excessive overtime or worker safety violations, for example, the immediate causes are choices made by factory owners and managers and often also failures in the existing compliance systems. At a deeper level, as argued by Locke and Samel (2012), the causes lie in the cost and timing demands placed on production units by the brand owner. These demands may result from volatility that is beyond their control, but they may also result from volatility that they impose as part of their business model or because of imperfect responses to external volatility. Voluntary leadership by these firms can improve things, but it is likely that some form of regulation is required, especially in highly competitive low margin segments.
Finally, risks emanating from uncertainty regarding changes in global regimes are costly to all yet lie beyond the scope of private actors in supply chains. In the case of trade frictions and the imposition of selective trade barriers, the immediate cause is the action of nation states themselves. However, at a deeper level these are driven to at least some extent by the very distorted picture of trade imbalances, especially with respect to China, provided by the current system of trade accounting.
Re-establishment of a vibrant multilateral trading regime would appear to be the ideal outcome, though it is not clear that it is feasible in the near term. A smaller step that might lead to a reduced risk would be a new set of WTO rules whereby “retaliatory” actions by one nation against another would take the form of across-the-board increases in tariffs rather than that of penalties imposed on specific products. This,
Uncertainty and risk in global supply chains
217
along with continued pressure against non-tariff barriers, would increase the fluidity of the trading system and avoid sudden sharp shifts that impose severe costs on suppliers, especially SMEs, and on workers.
In sum, risk management in the context of global supply chains involves much more than mitigating the impact of outside risks such as swings in aggregate demand or exchange rates on individual elements of the chain. It also requires systematic management of risks that are generated within each link in the chain and, more importantly, in the interfaces among links in order to limit disruptions and their propagation throughout the system. This requires risk awareness and responsibility in every activity as well as active intervention by orchestrators with a system-wide view. It also requires careful redesign and management of the soft and hard infrastructure that supports the system.
While the self-interested behaviour of individual supply chain actors can be counted on for many of these aspects of risk management, the geographic dispersion and organizational fragmentation of supply chains, and the incidence of supply chain risks on important groups beyond the corporations who are customers and orchestrators – workers, SMEs and ultimately regions and nations – also imply a need for concerted action at the industry, national and global levels. It will be necessary to create “scaffoldings” of effective product safety and workplace standards and trade and finance regimes so as to allow this distribution system to function as an effective whole. It requires a global village.
Endnotes
1 I thank Retsef Levi, Patrick Low, Albert Park, Hiram Samel, Andrew Sheng and Henry Weil for their comments. This paper was prepared for the Fung Global Institute’s Global Supply Chain Initiative.
2 See e.g., Coe et al., (2008), Gereffi and Memedovic (2003), Locke and Samel (2012), and Sturgeon (2008).
3 Mundy (2013).
4 The use of all three terms is deliberate, signalling the different perspectives of these literatures: supply chains (SC) focusing on the ability to match supply and demand, global production networks (GPN) on the division of labour and governance in the chain, and global value chains (GVC) on the roles of various actors in the chain and their ability to capture value/rents).
5 For earlier versions of this diagram, see Lessard (1996), Lessard and Lucea (2009), Lessard and Miller (2012). Christopher and Peck (2004) propose a similar three-level classification: risks
Global value chains in a changing world
218
internal to the firm, risks external to the firm but internal to the supply chain network and risks external to the supply chain network. Simchi-Levi, D. (2010). Operations Rules: Delivering Value Through Flexible Operations. Cambridge, MA, The MIT Press, ibid. presents a taxonomy that combines the “inside-out” and “known-unknown” dimensions.
6 In order for a financial market to be developed for a risk: 1) the risk must be outside of the control of any of the potential market participants (to avoid moral hazard) and 2) it must affect many economic actors with a degree of balance among positive and negative exposures.
7 While the supply chain typically is depicted as a linear flow, Li and Fung defines it as an open circle beginning and ending with the customer. We use Weil’s depiction that combines these two by explicitly incorporating information and financial flows along with physical product flows.
8 This depiction of reputational risk is based on conversations with Henry Weil and was initially sketched by him.
9 This is consistent with the distinction between commitment and compliance drawn by Locke, et al., (2007) in reference to the management of reputational risk arising from labour conditions in the supply chain.
10 Sheng (2009) traces the 1997 Asian financial crisis to just such a cascade.
11 The same argument could be applied to in-bound logistics, assembly, or distribution assets that are specific to the product or source.
12 In contrast, in finance risk management is typically viewed as characterizing risk (variances and co-variances or more complex measures of volatility), then selecting a portfolio or structure of hedges (to complement the “portfolio” inherent in the business) to best distribute those risks.
13 Referring to Figure 8.2 that depicts risks from inside to outside, things that break correspond to firm-level and supply chain level risk; things that vary to customer, competitive, and global market dynamics; and regimes that change to changes in meso-level (national, state/provincial/ local) institutions and global regimes.
14 See Lessard (1996) for the initial development of this concept.
15 If integral element of complex system
16 If integral element of complex system
17 Perhaps higher due loss of alternative employment, social safety net
18 If a free-standing product
19 The term “brand owners” is shorthand for firms that use their brand to capture (some of) the value they create through innovation, integration, and quality. These firms typically create customer solutions and experiences in contrast to just delivering products or services.
Uncertainty and risk in global supply chains
219
References
Baldwin, R. 2012. “Global Supply Chains: Why They Emerged, Why They Matter, and Where they are Going?”, The Fund Global Institute Working Paper Series FGI-2012-1 (Hong Kong, Hong Kong, China; The Fung Global Institute).
Bradsher, K.; Duhigg, C. 2012. “Signs of Changes Taking Hold in Electronics Factories in China”, in The New York Times, NY, 26 December.
Buckley, P. J. 2009. “The Impact of the Global Factory on Economic Development,” in The Journal of World Business, 44(2): 131–143.
Christopher, M.;Peck, H. 2004. “Building the Resilient Supply Chain,” in International Journal of Logistics Management, 15(2): 1–13.
Coe, N. M.; Dicken, P.; Hess, M. 2008. “Global Production Networks: Realizing the Potential,” in Journal of Economic Geography 8(1): 271–295.
Economist, The. 2012. “When Factory Workers Dream of Life Beyond the Factory Gates”, in The Economist, 405: 63–64.
Gereffi, G.; Memedovic, O. 2003. “The Global Apparel Value Chain: What Prospects for Upgrading by Developing Countries?”, (Vienna, Austria, United Nations Industrial Development Organization, UNIDO).
Ghemawat, P. 2011. “Globalization 3.0: Global Prosperity and How to Achieve It”, (Boston, MA, Harvard Business Review Press).
Juttner, U.; Peck, H.; Christopher, M. 2003. “Supply Chain Risk Management: Outlining an Agenda for Future Research,” in International Journal of Logistics: Research & Applications, 6(4): 197–210.
Lee, H. 2002. “Aligning Supply Chain Strategies with Product Uncertainties,” in California Management Review, 44(3): 105–119.
Lee, H.; Padmanabhan, V.; Whang, S. 1997. “Information Distortion in a Supply Chain: The Bullwhip Effect,” in Management Science 43: 546–558.
Lessard, D. 1996. “Incorporating Country Risk in the Valuation of Offshore Projects,” in Journal of Applied Corporate Finance, 9(3): 52–63, Fall.
Lessard, D.; Lucea, R. 2009. “Embracing Risk as a Core Competence: The Case of CEMEX,” in Journal of International Management 15: 296–305.
Global value chains in a changing world
220
Lessard, D.; Miller, R. 2013. “The Shaping of Large Engineering Projects” (Cambridge, MA, Massachusetts Institute of Technology).
Locke, R. M.; Qin, F.; Brause, A. 2007. “Does Monitoring Improve Labor Standards – Lessons from Nike,” in Industrial and Labor Relations Review 61(3).
Locke, R. M.; Samel, H. 2012. “Looking in the Wrong Places?: Labor Standards and Upstream Business Practices in the Global Electronics Industry”, MIT Political Science Department Research Paper No. 2012-18 (Cambridge, MA, Massachusetts Institute of Technology). Available at: http://ssrn.com/abstract=2102634
McKinsey. 2010. “The Challenges Ahead for Global Supply Chains” McKinsey Global Survey Results, McKinsey and Company. Available at: http://www.mckinseyquarterly.com/The_challenges_ahead_for_supply_chains_McKinsey_Global_Survey_results_2706
Mundy, S. 2013. “Samsung Code of Conduct Put to Test” in The Financial Times London.
Organization for Economic Co-operation and Development (OECD). 2012. “Global Value Chains: Managing Risks”, in Draft Synthesis Report on Global Value Chains, Chapter 7. (Paris, France, OECD, Directorate for Science, Technology and Industry, Committee on Industry, Innovation, and Entrepreneurship).
Park, A. 2012. “Note on Risk and Supply Chains”, (Hong Kong, Hong Kong, China; The Fung Global Institute).
Samel, H. 2012. “Upgrading Under Volatility in a Global Economy”, MIT Sloan School Working Paper, June 20. (Cambridge, MA, Massachusetts Institute of Technology Sloan School). Available at: http://ssrn.com/abstract=2102643
Sheffi, Y. 2005. “The Resilient Enterprise: Overcoming Vulnerability for Competitive Advantage” (Cambridge, MA, The Massachusetts Institute of Technology Press).
Sheng, A. 2009. “From Asian to Global Financial Crisis: An Asian Regulator’s View of Unfettered Finance in the 1990s and 2000s” (Cambridge UK, Cambridge University Press).
Simchi-Levi, D. 2010. “Operations Rules: Delivering Value Through Flexible Operations” (Cambridge, MA, The Massachusetts Institute of Technology Press).
Sturgeon, T. J. 2008. “From Commodity Chains to Value Chains: Interdisciplinary Theory Building in an Age of Globalization”, in J. Bair (ed.): Frontiers Of Commodity Chain Research, (Palo Alto, CA, Stanford University Press).
Weil, H. 2012. “The Dynamics of Global Supply Chains: The Imperatives for Success in A New Market Ecology.”
221
9 The influence of customer buying behaviour on product flow patterns between trading countries, and the implications for regulatory policy
John Gattorna
9.1. Introduction
This paper is designed to provide a more granular perspective than the traditional aggregate view that economists take of supply chains. In particular, I want to add a behavioural dimension, and introduce a more dynamic methodology, capable of addressing the increasingly volatile operating environments that are likely to pervade future trading conditions within and between countries, whether developed or developing.
The objective of this paper is to develop a toolbox of creative methodologies that will add insight to what we already know about supply chains and point the way towards improved navigation of the cross-border movement of trade flows.
From the outset, let us deal with some of the terminology issues. In my view, there is no difference between the terms supply chain and value chain, because supply chains done well equals value chains.
Regarding the term networks, these develop from local to regional to global, with correspondingly increasing complexity. The important thing to realize is that you should attack this growing complexity from the outside in, not from inside out as per conventional practice. Of course, the ultimate solution selected will be a combination of both.
Fundamentally, people, their respective behaviours, and the decisions they make in particular circumstances propel products and services along supply chains, so
Global value chains in a changing world
222
it is vital that human behaviour is factored into all future value chain designs. This is non-negotiable if the objective is to achieve a finer alignment between buyers and sellers and a necessary precondition if we are to take operational and financial performance to the required next level. Understanding human behaviour is the elephant in the room but, unfortunately, too many executives are in denial about its pivotal influence, presumably because they do not know how to factor it into the performance equation.
And people are spread out along supply chains, in the form of customers, intermediaries, staff and management inside suppliers and the enterprise itself. The optimal result is obtained when all parties (including outside influences such as government) along specific supply chains, approach a degree of “alignment” in the way they think and act.
Thus, looking at the operation of supply chains through the narrow prism of economics is not sufficient. Human behaviour must be factored in, just as the eminent economist, Robert J. Shiller, Professor of Economics at Yale University commented in the aftermath of the 2008 global financial crisis. He was acknowledging the human effect on the economy. See Shiller (2009).
Indeed, simply observing macro-flows of goods and services across or within country borders, hides the important detail beneath, and blunts the search for more predictive supply chain business models. In such situations, the emphasis is on reactivity, but there is a limit to reactive designs because of the premium cost attached to this modus operandi.
If we are going to work from the outside-in, we need a meaningful way of grouping customers into economically viable segments and then reverse engineering back into the enterprise from there. Most, if not all, conventional methods of segmentation used by the marketing discipline are flawed when used for the purpose of supply chain design. The only method that will adequately inform supply chain design is behavioural segmentation, grouping customers, consumers and users with similar buying values (and corresponding behaviours) according to the product and service category under consideration.
Through our empirical work in companies drawn from many industries, and across numerous geographies in the period 1989–2012, we have found discernible patterns in the way customers project their demand for products and services. These conclusions are summarized as follows. See Gattorna (2010).
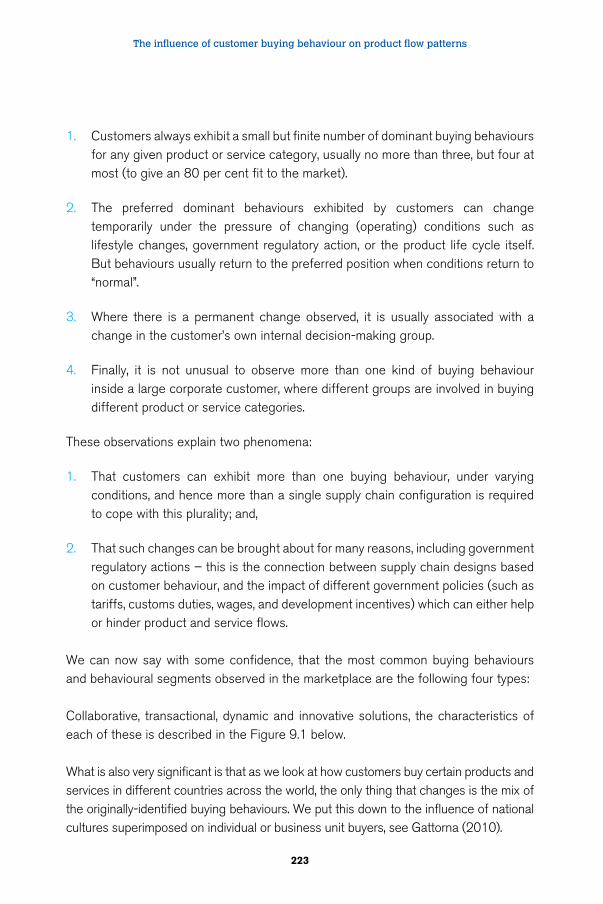
The influence of customer buying behaviour on product flow patterns
223
1. Customers always exhibit a small but finite number of dominant buying behaviours for any given product or service category, usually no more than three, but four at most (to give an 80 per cent fit to the market).
2. The preferred dominant behaviours exhibited by customers can change temporarily under the pressure of changing (operating) conditions such as lifestyle changes, government regulatory action, or the product life cycle itself. But behaviours usually return to the preferred position when conditions return to “normal”.
3. Where there is a permanent change observed, it is usually associated with a change in the customer’s own internal decision-making group.
4. Finally, it is not unusual to observe more than one kind of buying behaviour inside a large corporate customer, where different groups are involved in buying different product or service categories.
These observations explain two phenomena:
1. That customers can exhibit more than one buying behaviour, under varying conditions, and hence more than a single supply chain configuration is required to cope with this plurality; and,
2. That such changes can be brought about for many reasons, including government regulatory actions – this is the connection between supply chain designs based on customer behaviour, and the impact of different government policies (such as tariffs, customs duties, wages, and development incentives) which can either help or hinder product and service flows.
We can now say with some confidence, that the most common buying behaviours and behavioural segments observed in the marketplace are the following four types:
Collaborative, transactional, dynamic and innovative solutions, the characteristics of each of these is described in the Figure 9.1 below.
What is also very significant is that as we look at how customers buy certain products and services in different countries across the world, the only thing that changes is the mix of the originally-identified buying behaviours. We put this down to the influence of national cultures superimposed on individual or business unit buyers, see Gattorna (2010).
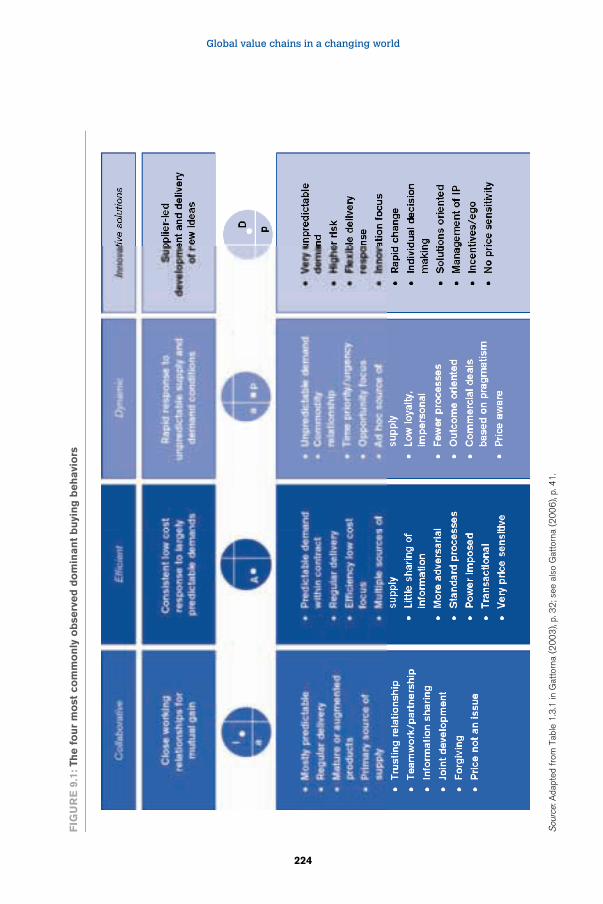
Global value chains in a changing world
224
FIG
UR
E 9
.1: Th
e f
ou
r m
ost
co
mm
on
ly o
bse
rved
do
min
an
t b
uyi
ng
beh
avi
ors
Sou
rce:
Ada
pted
fro
m T
able
1.3
.1 in
Gat
torn
a (2
00
3),
p. 3
2; s
ee a
lso
Gat
torn
a (2
00
6),
p. 4
1.
The influence of customer buying behaviour on product flow patterns
225
This is a particularly important finding because it means that we can set up the same supply chain configurations around the globe, and they will be just as relevant from one country to another. Of course, the prevailing government regulations and competitive activity could influence things in specific locations, but it is unlikely any fundamentally new segments will suddenly emerge out of nowhere. This is good news for multinational companies as they design their regional and global value chain networks. It is also good news for the future work of the WTO.
At the enterprise level, in reviewing regional and global markets, there are really only two appropriate methods open to companies to surface the underlying demand patterns. These are:
1. Using a shortened version of the well-known conjoint analysis market research technique, where a sample of customers are interviewed (qualitatively and quantitatively) face-to-face and by telephone. A draft “straw man” segmentation is prepared as a result, and this is then validated with further direct contact with customers in the field; and,
2. Of perhaps more relevance in the case of aggregate flows of product important in trade flows between countries is the demand variability analysis otherwise known as the co-efficient of variation. The methodology is as follows:
a) Profile the total demand, by-customer or source, by-year for say two to four years to understand overall patterns. Demand should be broken down by major product categories,
b) Then calculate the co-efficient of variation (CoV) by customer or product category in a few sensible time buckets, such as monthly or quarterly, over the selected period. This will give a perspective on the relative variability of different customer’s demand,
c) The CoV is a method of comparing the variability of different data sets. It is calculated by dividing the standard deviation by the mean, expressed as a percentage. By setting some business rules, it is possible to distinguish between volume flows with lower variability (base load or lean), compared with volume flows which has a higher variability (agile).
For example, we conducted this type of analysis on the demand (and export) of thermal coal from the Hunter Valley region of New South Wales, Australia, in
Global value chains in a changing world
226
the four-year period, 2003–06. Congestion was occurring at the loading Port of Newcastle, and at one stage there were 75 Cape size ore carriers in a queue out to sea, waiting to be loaded. The business rules we applied to the demand side were as follows:
1. Any one customer included in the analysis had to take at least 1 metric ton (MT) in any of the given years; and,
2. The CoV for each customer was calculated, and any customer with a CoV equal to or less than 50 per cent by month, or less than 33 per cent by quarter would be considered base-load demand, with all the implications for a lean style of supply chain configuration,
3. Anything above these numbers would be regarded as volatile, with all the implications for an agile style of supply chain configuration.
Based on our analysis in 2007, for a total demand of 100 MT per year along the coal chain and embarking port, 60 per cent of the volume was found to be base-load, and 40 per cent to be volatile, requiring two entirely different supply chain configurations or pathways, lean and agile, working in tandem, but managed separately. But if the two demand patterns are mixed together, no analysis is possible, and things degenerate into guesswork and opinion. This is very relevant to the way we look at trade flows between countries as the same problem applies.
9.2. Resolving rising complexity
The term “supply chain” was first coined by Keith Oliver at Booz Allen1 in 1982. I have long been uncomfortable with this term but have chosen instead to continually redefine its scope over time, rather than introduce new terminology, which in turn just adds to the semantic confusion.
Indeed, the more accurate term these days would be value networks, as argued in my book, Dynamic Supply Chains, see Gattorna (2010). And networks they are, spreading from local to domestic national trading environments, becoming regional as more countries are involved in strategic sourcing and/or distribution strategy, and ultimately, global. The complexity of these “networks-of-networks” increases exponentially as the geographic scope widens, and the number of links (both transport and electronic transactions) and nodes (facilities of all types and activities within) increases.
The influence of customer buying behaviour on product flow patterns
227
During the last two decades we have seen an explosion in the size and complexity of value networks as companies embraced global sourcing, offshoring of production and jobs, and dispersed manufacturing. In some cases these trends have already been reversed or are in the process of changing as conditions have changed. Indeed the reallocation of global manufacturing will become more pronounced over the next five years, especially as companies face decisions about where to add future capacity. The best companies will undertake a “product-by-product analysis of their global supply networks” taking multiple factors into account, both directly related to production cost, and others of a more indirect nature, such as cross-border inefficiencies, see Sirkin et al., (2011).
As the economics of production change because of escalating labour costs and availability (as is now the case in China), the impact of carbon footprint, and the corresponding thrust towards a more sustainable world, these value networks are again being reshaped. And this evolutionary process will continue indefinitely, spurred on by the new “Age of Digitization” that we are just entering. See Friedrich et al., (2012) and El-Darwiche et al., (2012). This digitization will facilitate different pathways for the physical product and corresponding financials and make revenue recognition for tax purposes more difficult. The same can also be said for the true country of origin on the label, as there are likely to be several involved as the product progresses towards its final form.
One thing we can say with certainty is that the increased degree of complexity posed by extensive global value networks opened up through multi-country trading activities will never be resolved by conventional means such as bilateral agreements and centrally devised and administered regulations. We need to borrow ideas from Ashby’s Law of Requisite Variety, (Ashby, 1954; 1956) and seek out fundamentally new and sophisticated solutions to this growing problem. In short, we need completely new business models to make any sort of impression on the inexorable rise in complexity.
To paraphrase, Ashby says that as systems become more complex through increased variety, then the complexity-reduction devices we deploy must necessarily become correspondingly more sophisticated to match this complexity. In effect, to manage complexity in supply chains – and supply chains are after all living organic systems – we have to absorb variety, otherwise the whole system is likely to become brittle, unstable and prone to collapse, perhaps catastrophically, see Gattorna (2010).
Unfortunately, the modern obsession with enterprise resource planning (transactional) systems has in part unwittingly contributed to the increased complexity too.
Global value chains in a changing world
228
Paradoxically, company executives, thinking that more standardization of processes and underlying systems would reduce the complexity they face, have in fact made things worse as the new [more rigid] systems installed have further reduced the degree of natural “alignment” with customers, and in so doing led to more exceptions, increased cost-to-serve, and more (rather than less) complexity. This is a good example of what happens when attempting to fix a problem from the inside out.
At the country level, complexity has arisen simply because of the rate of growth that has occurred in the process swamping existing capabilities. China is a good example of this. India is another example that is in an even worse situation because of its poor infrastructure. At least China has made giant advances in this particular area. Yet both countries lag in finding solutions to smooth the flow of trade through their inbound and outbound supply chains as evidenced by their low standing in the Ease of Doing Business Index referred to later in this paper. See Lawrence et al., (2012).
Fortunately, we now have at our disposal network optimization modelling techniques that have the potential to cut through complexity and allow us to in effect find the lowest cost pathways through nominated networks, from the supply base to customers, anywhere in the world. These mixed integer mathematical models have been available for the last few decades, but it has taken the hardware on which they run time to catch up and achieve the required higher processing speeds. The best models currently available are designed by Solvoyo (Boston) and Llamasoft (Ann Arbor).
In addition, instead of running the models against some arbitrary objective function, we can link them to the behavioural segmentation mentioned above and in the process find out what the possible pathways and corresponding cost-to-serve are for any given product-market combinations, under particular operating conditions, including government taxes or incentives, tariffs and carbon footprint. Indeed, there is practically no scenario that we cannot model these days, and the result is a whole new level of more informed decision-making by executives and government officials.
These new Decision Support Systems (DSS) are likely to provide a bright new avenue for exploring government policy options in the future, especially where constraints are placed on trading flows across borders. The core concern is to be in a position to make more informed decisions, and for confirmation of this you only have to look around the world at the winning sporting teams who benefit by making better, faster and more timely decisions than their opponents in the heat of competition.
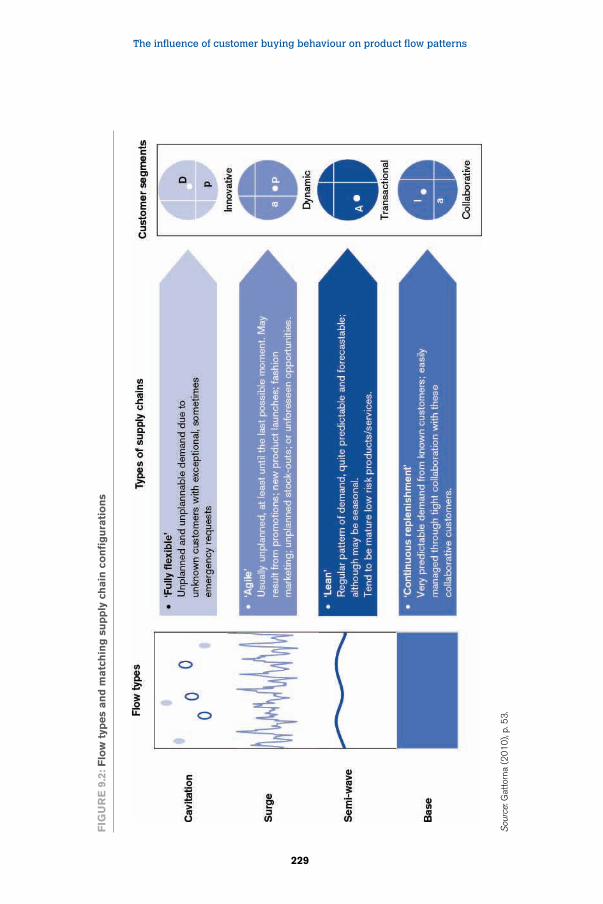
The influence of customer buying behaviour on product flow patterns
229
FIG
UR
E 9
.2: F
low
typ
es
an
d m
atc
hin
g s
up
ply
ch
ain
co
nfi
gu
rati
on
s
Sou
rce:
Gat
torn
a (2
01
0),
p. 5
3.
Global value chains in a changing world
230
Based on my work and that of colleagues inside multinational companies, I expect that we will find ways of fast-tracking certain product flows, by embedding agile processes along certain preferred pathways, albeit at a premium cost, and for the residual, less volatile flows, I expect it will be possible to design lean pathways that carry flows on a more regular, predictable basis, at lowest delivered cost.
The key is to separate the two flow-types and treat them completely differently. Once this is achieved, overall costs will fall, as will complexity, and more certainty in trade relationships will return. The trick is to eliminate both the over and under-servicing and reallocate resources to achieve a finer-grained alignment between the supply base and the corresponding target customer base.
The main supply chain flows we are interested in are depicted in Figure 9.2, and in particular the combined steady-state flow made up of lean and continuous replenishment components, which are largely predictable and have low variability.
9.3. Infomediary capability2
There is one other enhancement to the network optimization modelling approach suggested above, and that is to form an infomediary in key industries to pool and aggregate data in order to better manage trade flows. Specifically, the term refers to an organization designed to allow information to be gathered from multiple parties and used productively while protecting the confidentiality of other contributors. Prashant Yadav of MIT and the University of Michigan have already used this approach in attempting to improve the forecasting of essential medications in developing countries. See Levine et al., (2008).
Yadav conceived the idea of a global health infomediary, which collects information from funding agencies, procurement agents, national buyers and other parties who have a wealth of information available but do not necessarily share it.
My colleague, Deborah Ellis, and I found a similar business model working in Australia at Cash Services Australia (CSA). This company is jointly owned by Australia’s four biggest banks. It gathers information on the individual and joint cash requirements of these banks (both inbound and outbound), and uses this information to direct pick up and delivery of cash from and to strategic locations, spreading the physical task across several armoured car companies.3 See Gattorna (2010) and Figure 9.3 of this chapter.
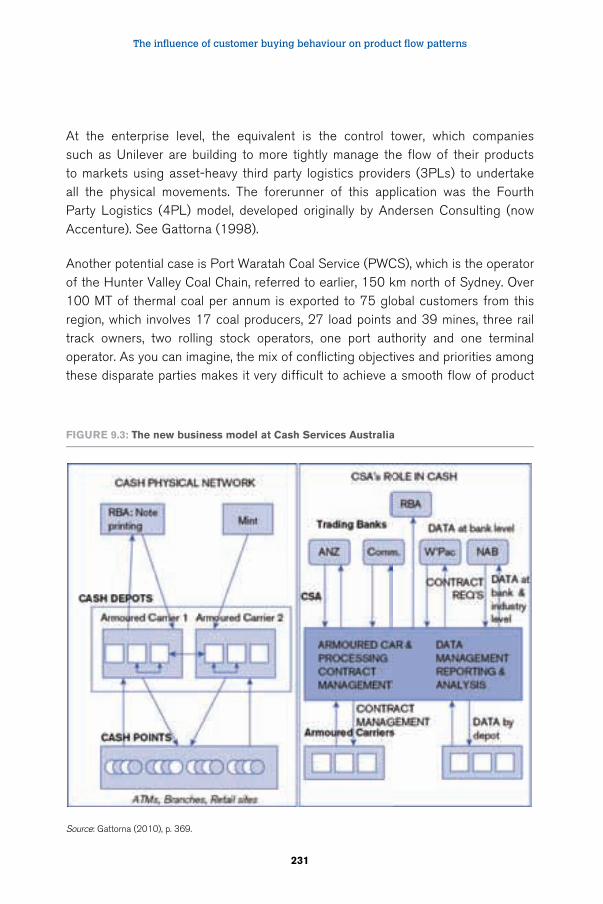
The influence of customer buying behaviour on product flow patterns
231
At the enterprise level, the equivalent is the control tower, which companies such as Unilever are building to more tightly manage the flow of their products to markets using asset-heavy third party logistics providers (3PLs) to undertake all the physical movements. The forerunner of this application was the Fourth Party Logistics (4PL) model, developed originally by Andersen Consulting (now Accenture). See Gattorna (1998).
Another potential case is Port Waratah Coal Service (PWCS), which is the operator of the Hunter Valley Coal Chain, referred to earlier, 150 km north of Sydney. Over 100 MT of thermal coal per annum is exported to 75 global customers from this region, which involves 17 coal producers, 27 load points and 39 mines, three rail track owners, two rolling stock operators, one port authority and one terminal operator. As you can imagine, the mix of conflicting objectives and priorities among these disparate parties makes it very difficult to achieve a smooth flow of product
FIGURE 9.3: The new business model at Cash Services Australia
Source: Gattorna (2010), p. 369.
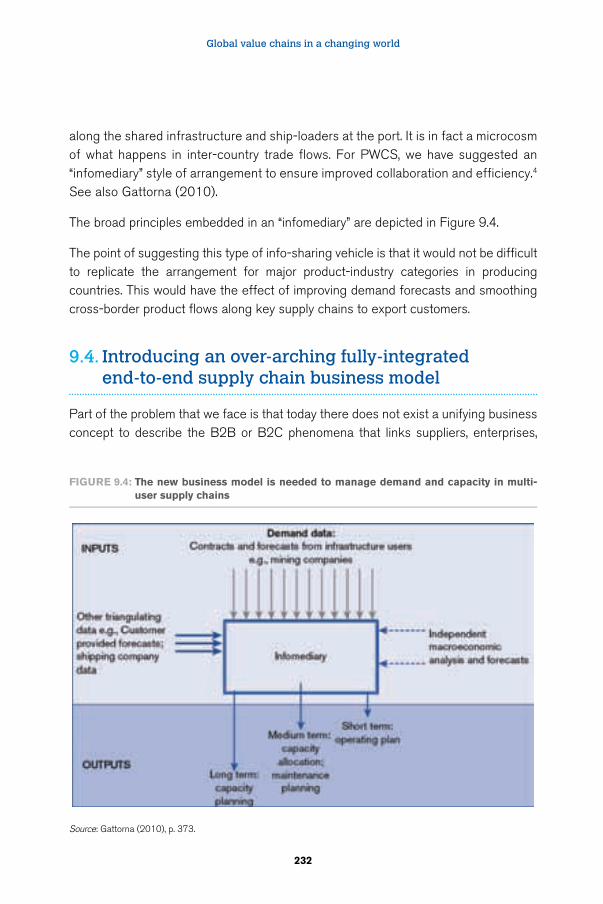
Global value chains in a changing world
232
along the shared infrastructure and ship-loaders at the port. It is in fact a microcosm of what happens in inter-country trade flows. For PWCS, we have suggested an “infomediary” style of arrangement to ensure improved collaboration and efficiency.4 See also Gattorna (2010).
The broad principles embedded in an “infomediary” are depicted in Figure 9.4.
The point of suggesting this type of info-sharing vehicle is that it would not be difficult to replicate the arrangement for major product-industry categories in producing countries. This would have the effect of improving demand forecasts and smoothing cross-border product flows along key supply chains to export customers.
9.4. Introducing an over-arching fully-integrated end-to-end supply chain business model
Part of the problem that we face is that today there does not exist a unifying business concept to describe the B2B or B2C phenomena that links suppliers, enterprises,
FIGURE 9.4: The new business model is needed to manage demand and capacity in multi-user supply chains
Source: Gattorna (2010), p. 373.
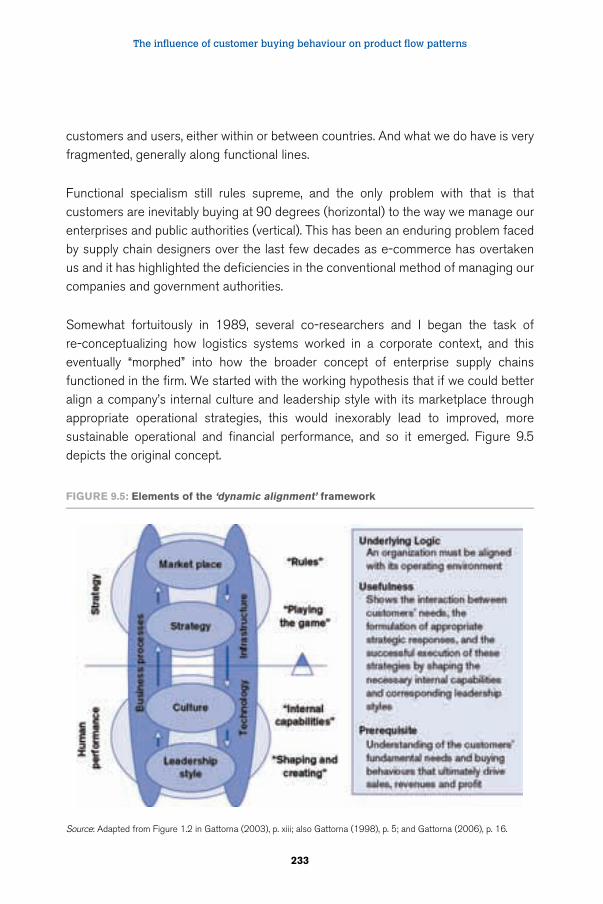
The influence of customer buying behaviour on product flow patterns
233
customers and users, either within or between countries. And what we do have is very fragmented, generally along functional lines.
Functional specialism still rules supreme, and the only problem with that is that customers are inevitably buying at 90 degrees (horizontal) to the way we manage our enterprises and public authorities (vertical). This has been an enduring problem faced by supply chain designers over the last few decades as e-commerce has overtaken us and it has highlighted the deficiencies in the conventional method of managing our companies and government authorities.
Somewhat fortuitously in 1989, several co-researchers and I began the task of re-conceptualizing how logistics systems worked in a corporate context, and this eventually “morphed” into how the broader concept of enterprise supply chains functioned in the firm. We started with the working hypothesis that if we could better align a company’s internal culture and leadership style with its marketplace through appropriate operational strategies, this would inexorably lead to improved, more sustainable operational and financial performance, and so it emerged. Figure 9.5 depicts the original concept.
FIGURE 9.5: Elements of the ‘dynamic alignment’ framework
Source: Adapted from Figure 1.2 in Gattorna (2003), p. xiii; also Gattorna (1998), p. 5; and Gattorna (2006), p. 16.
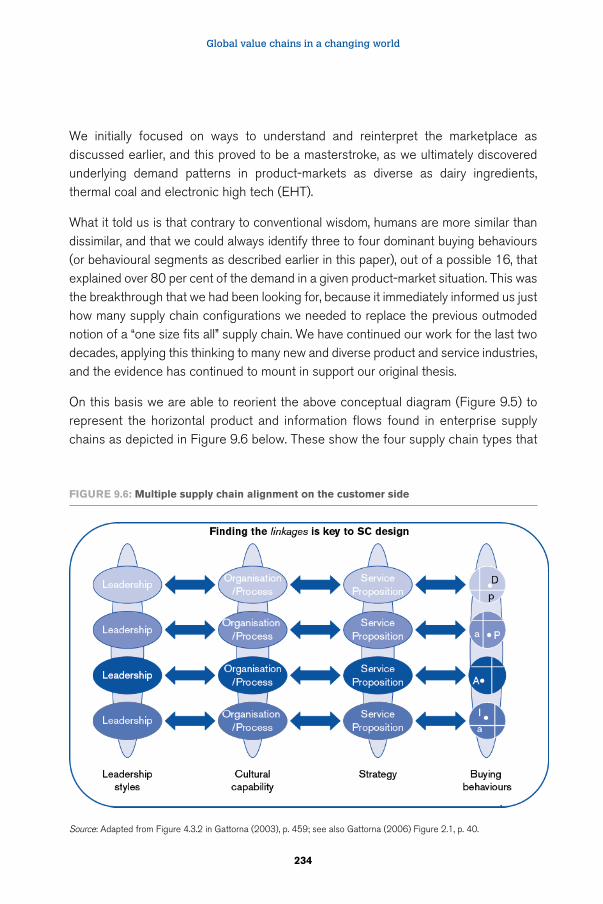
Global value chains in a changing world
234
We initially focused on ways to understand and reinterpret the marketplace as discussed earlier, and this proved to be a masterstroke, as we ultimately discovered underlying demand patterns in product-markets as diverse as dairy ingredients, thermal coal and electronic high tech (EHT).
What it told us is that contrary to conventional wisdom, humans are more similar than dissimilar, and that we could always identify three to four dominant buying behaviours (or behavioural segments as described earlier in this paper), out of a possible 16, that explained over 80 per cent of the demand in a given product-market situation. This was the breakthrough that we had been looking for, because it immediately informed us just how many supply chain configurations we needed to replace the previous outmoded notion of a “one size fits all” supply chain. We have continued our work for the last two decades, applying this thinking to many new and diverse product and service industries, and the evidence has continued to mount in support our original thesis.
On this basis we are able to reorient the above conceptual diagram (Figure 9.5) to represent the horizontal product and information flows found in enterprise supply chains as depicted in Figure 9.6 below. These show the four supply chain types that
Source: Adapted from Figure 4.3.2 in Gattorna (2003), p. 459; see also Gattorna (2006) Figure 2.1, p. 40.
FIGURE 9.6: Multiple supply chain alignment on the customer side
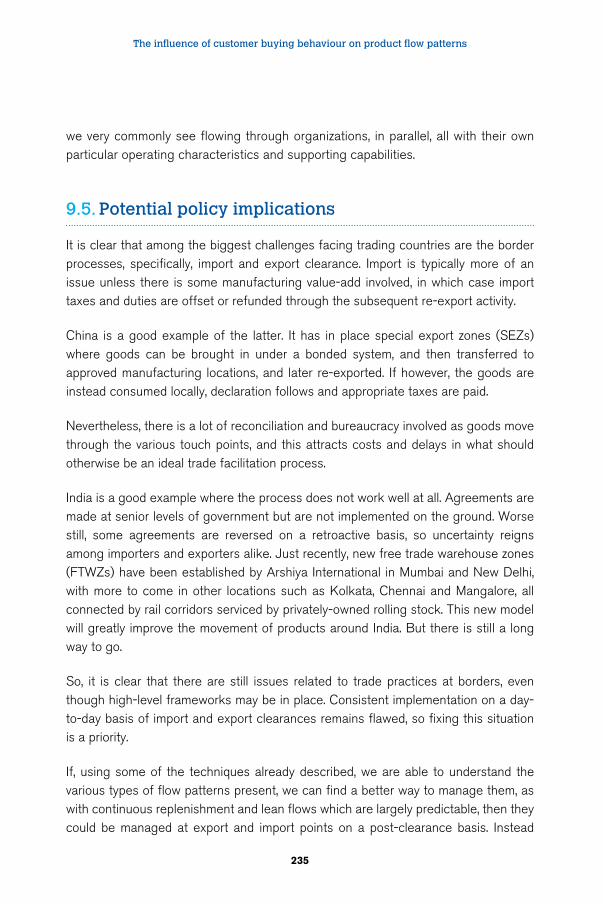
The influence of customer buying behaviour on product flow patterns
235
we very commonly see flowing through organizations, in parallel, all with their own particular operating characteristics and supporting capabilities.
9.5. Potential policy implications
It is clear that among the biggest challenges facing trading countries are the border processes, specifically, import and export clearance. Import is typically more of an issue unless there is some manufacturing value-add involved, in which case import taxes and duties are offset or refunded through the subsequent re-export activity.
China is a good example of the latter. It has in place special export zones (SEZs) where goods can be brought in under a bonded system, and then transferred to approved manufacturing locations, and later re-exported. If however, the goods are instead consumed locally, declaration follows and appropriate taxes are paid.
Nevertheless, there is a lot of reconciliation and bureaucracy involved as goods move through the various touch points, and this attracts costs and delays in what should otherwise be an ideal trade facilitation process.
India is a good example where the process does not work well at all. Agreements are made at senior levels of government but are not implemented on the ground. Worse still, some agreements are reversed on a retroactive basis, so uncertainty reigns among importers and exporters alike. Just recently, new free trade warehouse zones (FTWZs) have been established by Arshiya International in Mumbai and New Delhi, with more to come in other locations such as Kolkata, Chennai and Mangalore, all connected by rail corridors serviced by privately-owned rolling stock. This new model will greatly improve the movement of products around India. But there is still a long way to go.
So, it is clear that there are still issues related to trade practices at borders, even though high-level frameworks may be in place. Consistent implementation on a day-to-day basis of import and export clearances remains flawed, so fixing this situation is a priority.
If, using some of the techniques already described, we are able to understand the various types of flow patterns present, we can find a better way to manage them, as with continuous replenishment and lean flows which are largely predictable, then they could be managed at export and import points on a post-clearance basis. Instead
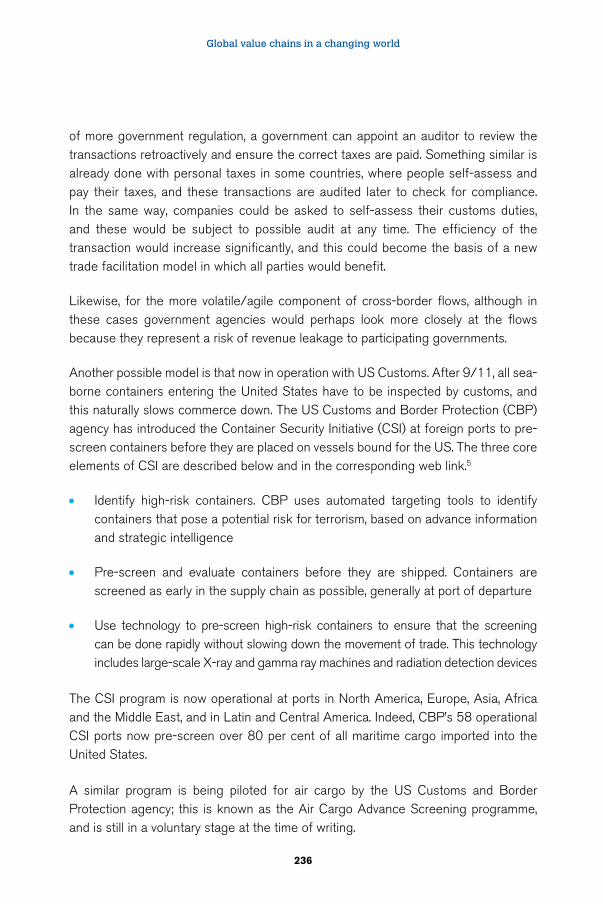
Global value chains in a changing world
236
of more government regulation, a government can appoint an auditor to review the transactions retroactively and ensure the correct taxes are paid. Something similar is already done with personal taxes in some countries, where people self-assess and pay their taxes, and these transactions are audited later to check for compliance. In the same way, companies could be asked to self-assess their customs duties, and these would be subject to possible audit at any time. The efficiency of the transaction would increase significantly, and this could become the basis of a new trade facilitation model in which all parties would benefit.
Likewise, for the more volatile/agile component of cross-border flows, although in these cases government agencies would perhaps look more closely at the flows because they represent a risk of revenue leakage to participating governments.
Another possible model is that now in operation with US Customs. After 9/11, all sea-borne containers entering the United States have to be inspected by customs, and this naturally slows commerce down. The US Customs and Border Protection (CBP) agency has introduced the Container Security Initiative (CSI) at foreign ports to pre-screen containers before they are placed on vessels bound for the US. The three core elements of CSI are described below and in the corresponding web link.5
• Identify high-risk containers. CBP uses automated targeting tools to identify containers that pose a potential risk for terrorism, based on advance information and strategic intelligence
• Pre-screen and evaluate containers before they are shipped. Containers are screened as early in the supply chain as possible, generally at port of departure
• Use technology to pre-screen high-risk containers to ensure that the screening can be done rapidly without slowing down the movement of trade. This technology includes large-scale X-ray and gamma ray machines and radiation detection devices
The CSI program is now operational at ports in North America, Europe, Asia, Africa and the Middle East, and in Latin and Central America. Indeed, CBP’s 58 operational CSI ports now pre-screen over 80 per cent of all maritime cargo imported into the United States.
A similar program is being piloted for air cargo by the US Customs and Border Protection agency; this is known as the Air Cargo Advance Screening programme, and is still in a voluntary stage at the time of writing.
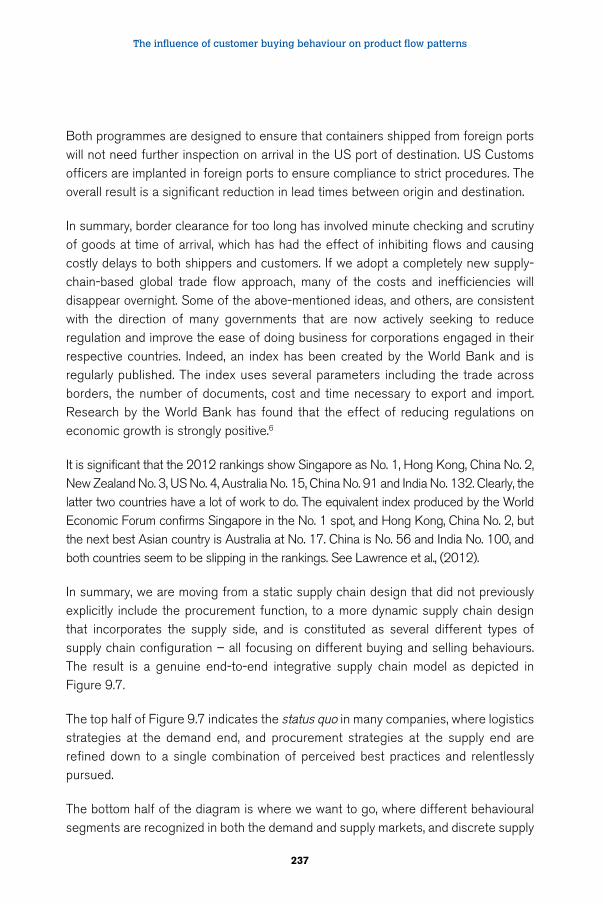
The influence of customer buying behaviour on product flow patterns
237
Both programmes are designed to ensure that containers shipped from foreign ports will not need further inspection on arrival in the US port of destination. US Customs officers are implanted in foreign ports to ensure compliance to strict procedures. The overall result is a significant reduction in lead times between origin and destination.
In summary, border clearance for too long has involved minute checking and scrutiny of goods at time of arrival, which has had the effect of inhibiting flows and causing costly delays to both shippers and customers. If we adopt a completely new supply-chain-based global trade flow approach, many of the costs and inefficiencies will disappear overnight. Some of the above-mentioned ideas, and others, are consistent with the direction of many governments that are now actively seeking to reduce regulation and improve the ease of doing business for corporations engaged in their respective countries. Indeed, an index has been created by the World Bank and is regularly published. The index uses several parameters including the trade across borders, the number of documents, cost and time necessary to export and import. Research by the World Bank has found that the effect of reducing regulations on economic growth is strongly positive.6
It is significant that the 2012 rankings show Singapore as No. 1, Hong Kong, China No. 2, New Zealand No. 3, US No. 4, Australia No. 15, China No. 91 and India No. 132. Clearly, the latter two countries have a lot of work to do. The equivalent index produced by the World Economic Forum confirms Singapore in the No. 1 spot, and Hong Kong, China No. 2, but the next best Asian country is Australia at No. 17. China is No. 56 and India No. 100, and both countries seem to be slipping in the rankings. See Lawrence et al., (2012).
In summary, we are moving from a static supply chain design that did not previously explicitly include the procurement function, to a more dynamic supply chain design that incorporates the supply side, and is constituted as several different types of supply chain configuration – all focusing on different buying and selling behaviours. The result is a genuine end-to-end integrative supply chain model as depicted in Figure 9.7.
The top half of Figure 9.7 indicates the status quo in many companies, where logistics strategies at the demand end, and procurement strategies at the supply end are refined down to a single combination of perceived best practices and relentlessly pursued.
The bottom half of the diagram is where we want to go, where different behavioural segments are recognized in both the demand and supply markets, and discrete supply
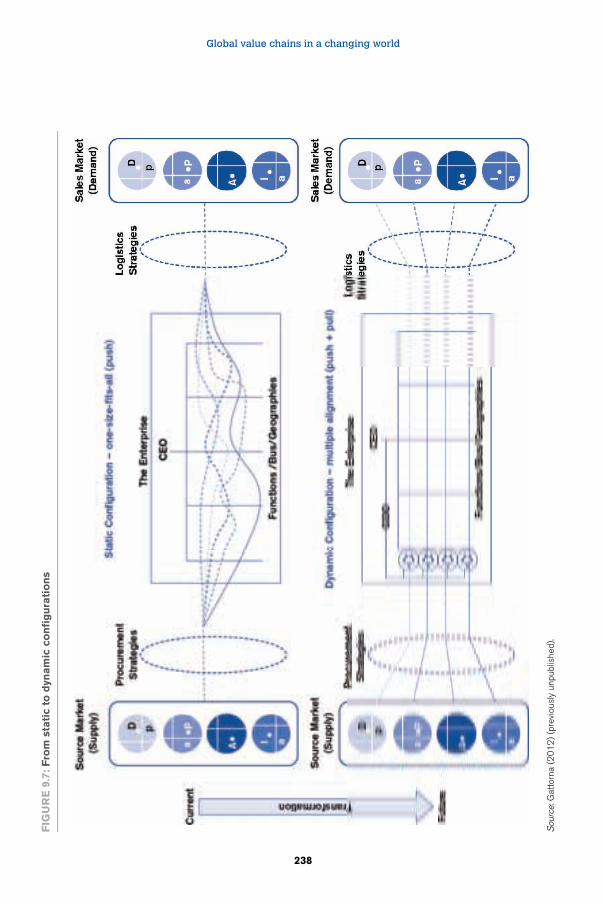
Global value chains in a changing world
238
FIG
UR
E 9
.7: F
rom
sta
tic
to d
ynam
ic c
on
fig
ura
tio
ns
Sou
rce:
Gat
torn
a (2
01
2)
(pre
viou
sly
unpu
blis
hed)
.
The influence of customer buying behaviour on product flow patterns
239
chain configurations are designed to run horizontally through the otherwise vertical organization, managed by separate clusters or teams of managers drawn from the vertical functions.
9.6. Bringing it all together in a research design
Given the various insights discussed above, it is now time to bring all the pieces together and devise a possible supplementary methodology to map and manage major trade flows between countries for a specific number of mainstream product categories. The answers from these analyses will provide pointers to appropriate policy formulation discussions with national governments. Refer to Figure 9.8 below when reading the proposed methodology:
1. Select a number of countries from whose perspective we will view trade flows: Australia, Brazil, China, France, Japan, India, Republic of Korea, Germany, Singapore and the United States.
2. Select several mainstream product categories, both in-bound and outbound from the countries nominated in 1. above: e.g., coal, apparel, EHT, automobiles, medical equipment, grains, iron ore, machinery, financial services and tourism.
3. Build a network model of the selected flows in and out of the nominated countries, and place ABC costs on all the feasible links and facilities (including labour).
4. Test a range of scenarios in each network, incorporating constraints such as capacity at certain points; different lead-times; government customs duties and tariffs; government subsidies/incentives; account for any bilateral trade agreements in existence; where certain functions are carried out along specific supply chains; impact of production/logistics clusters; carbon footprint and sustainability; and other similar considerations. Then test the same scenarios without these constraints present, and note the difference in lead-times and cost.
5. The aim is to understand what the cost/unit is along various supply chain network pathways, under varying conditions and to seek the optimal solution for the total network under review.
6. At the same time these flows of products can be analysed using coefficient of variation (CoV) techniques to reveal if there are any layers of identifiably different volatility and if so, how this impacts on the cost of each network flow under review.
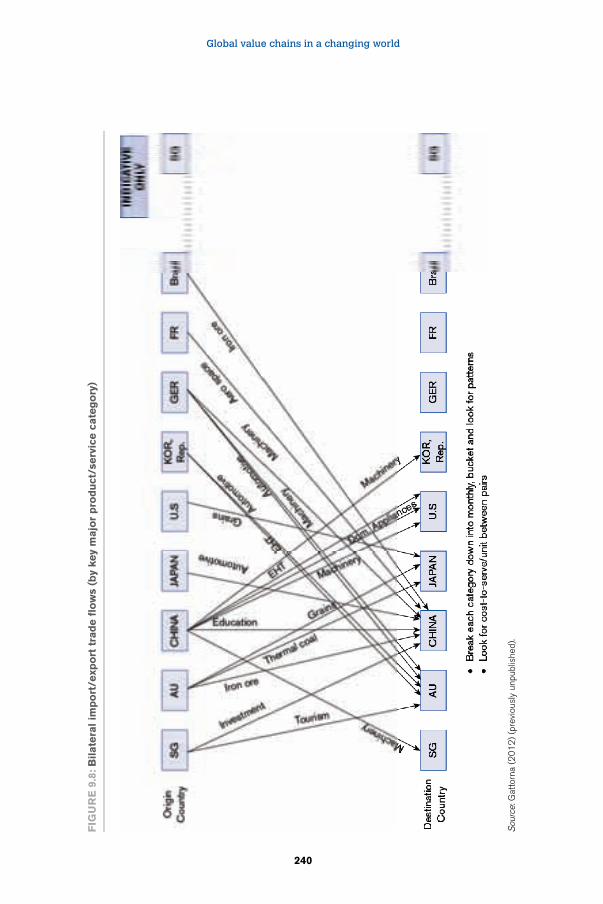
Global value chains in a changing world
240
FIG
UR
E 9
.8: B
ilate
ral im
po
rt/e
xpo
rt t
rad
e f
low
s (b
y ke
y m
ajo
r p
rod
uct
/serv
ice c
ate
go
ry)
Sou
rce:
Gat
torn
a (2
01
2)
(pre
viou
sly
unpu
blis
hed)
.
The influence of customer buying behaviour on product flow patterns
241
7. The outcomes of this research will likely reveal preferred pathways for certain product-origin-destination combinations, and using sensitivity analyses, how these are impacted by different regulatory conditions imposed by respective governments. It is suggested that the best and worst countries on the Employment Trends Index (ETI) Index are compared and contrasted.
8. Finally, taking all the above analyses into account, new business models can be devised that rely less on external regulation, and more on self-regulation combined with compliance audits.
9.7. Recommended policy changes
As a result of the above analyses, it will be possible to develop and recommend a new range of policies that the WTO can initiate among the top 20 trading countries, in the first instance and beyond as these policies are phased-in and are seen to work in a positive way to support more efficient trade flows between trading countries.
1. Recommend self-assessment or fast-track import procedures involving customs duties for those destination country-product category combinations where the flows are consistently predictable, year-by-year, eg. thermal coal from Australia to Japan; the taxes from these flows should also be quite consistent.
2. Recommend customs focus more on the “irregular” imports to ensure revenue is not lost. However, these will often involve short lead times, so additional personnel manning may be necessary to avoid delays; both 1. and 2. Will be subject to compliance audits.
3. Recommend a range of productivity initiatives to destination countries which are low-rated countries on the “ease of doing business” index, eg., China and India.
4. Recommend ways to increase and expand the United States CSI initiative beyond the 58 global ports currently participating. In particular, a similar initiative could be started between pairs of non-US ports around the world. The aim should be to smooth the passage of containers to 80 per cent of trading nations.
5. Recommend to major trading countries such as India and Brazil, and to certain African countries, exactly what priorities in terms of infrastructure investment would have the most positive impact on their respective economies.
Global value chains in a changing world
242
6. Recommend to the top 20 pairs of origin-destination trading nations to introduce a common method of measuring and taxing carbon footprint that they are individually and jointly responsible for.
7. Recommend to the laggards in the top 20 trading countries, tax reform that will speed up trade-flows across their borders and within (across state borders).
8. Recommend that the WTO undertake research at the company level aimed at influencing multinational companies to change their internal organization designs to better facilitate the horizontal flow of goods and services along the supply chains that they are part of. This recommendation is based on the contention that change must take place inside trading companies as well as countries if many of the ideas outlined in this paper are to be realized on the ground. The mantra is: “there will be no change unless there is pressure for change”, and the WTO has the means to apply such pressure.
9.8. A final word
In the end, because we now live in such an inter-connected world, the best solution to freeing up complex supply chain and trading networks around the world will likely involve a mix of new and modified regulations plus a range of completely new and innovative non-regulatory initiatives. Getting that balance right is the challenge that lies ahead for the WTO. The lessons to learn from the content of this paper are that we must break down the aggregate numbers involved in trade flows, and better understand why they are and what they are. After all, it is the decisions of personnel along enterprise supply chains that in aggregate underpin these numbers.
A finer alignment with customers and other influential stakeholders will drive productivity improvements at every point. In addition, tax revenue collection will also be more targeted and therefore more efficient, and lead times more competitive for shippers – a win-win for all parties involved in global, regional and national supply chains.
Endnotes
1 Keith Oliver, Booz & Company. He first used the term in public in an interview with Arnold Kransdorff of the Financial Times, 4 June, 1982.
2 The term ‘Infomediary’ was first coined by John Hagel and Marc Singer in their book, NetWorth, Harvard Business School Press, 1999.
The influence of customer buying behaviour on product flow patterns
243
3 For more detailed information of this unique case, refer to Gattorna (2010).
4 Further details available in Gattorna (2010).
5 http://www.cbp.gov/xp/cgov/trade/cargo security/csi/csiinbrief.xml
6 ‘Doing Business report series- World Bank Group’. Available at: www.doingbusiness.org/documents/growthpaper_03_17.pdf.
References
Ashby, W.R. 1956 “An Introduction to Cybernetics”, (London, UK, Chapman & Hall).
Ashby, W.R. 1954 “Design for a Brain”, 2nd edition, (New York, NY, John Wiley).
Friedrich, R.; Le Merle, M.; Peterson, M. 2012 “The Next Wave of the Digital Economy”, in Strategy and Business Autumn 2012. Available at: http://digitaledition.strategy-business.com/display_article.php?id=1139903
El-Darwiche, B.; Singh, M.; Ganediwalla, S. 2012, “Digitization and Prosperity”, in Strategy and Business, Autumn 2012. Available at: http://digitaledition.strategy-business.com/article/ Digitization+And+Prosperity/1139914/121556/article.html
Gattorna, J. 2010 “Dynamic Supply Chains: Delivering Value through People”, 2nd edition, (Harlow, UK, FT Prentice Hall).
Gattorna, J. 2006 “Living Supply Chains: Low to Mobilize the Enterprise Around Delivering What Your Customers Want ” (Harlow, UK, FT Prentice Hall).
Gattorna, J. (ed.) 2003 “Gower Handbook of Supply Chain Management ”, 5th edition, (Aldershot, UK, Gower Publishing).
Gattorna, J.(ed.) 1998 “Fourth Party Logistics; en route to breakthrough performance in the supply chain”, in Strategic Supply Chain Alignment: best practice in Supply chain management, 27:425–445.
Lawrence, R.; Hanouz, Z.; Drzeniek, M.; Doherty, S. (eds.) 2012 “Reducing Supply Chain Barriers”, The Global Enabling Trade Report 2012, (Geneva, Switzerland, World Economic Forum, WEF).
Levine, R.; Pickett, J.; Sekhri, N.; Prashant, Y. 2008 “Demand Forecasting for Essential Medical Technologies” in American Journal of Law & Medicine, 34:225–255. See also Section B, “Create a Global Health Infomediary”, 294–295.

Global value chains in a changing world
244
Shiller, R.J. 2009 “in an interview with Leigh Sales on ABC Lateline, 4 February, 2009” Available at: http://www.abc.net.au/lateline/content/2008/s2482535.htm
Sirkin, H.L.; Zinser, M.; Hohner, D. 2011 “Made in America, Again: Why Manufacturing will Return to the USA”, The Boston Consulting Group Report. Available at: http://www.bcg.com/expertise_impact/publications/publicationdetails.aspx?id=tcm:12–84591
245
10 Supply chain connectivity and trade in Asia
Mark Goh
10.1. Introduction
The term logistics is an ancient one. Historically, the military has been lauded as the key underpinning example for good logistics practices, given their emphasis on good movement practices and operational excellence. Good logistics practice can be taken to denote the set of activities undertaken to ensure the smooth passage of goods and services from one location to another, relying on supply liaison officers to provide the necessary connection between stakeholders in a convoy. Indeed, it is the very adept use of logistics (both hard and soft) that has provided certain military forces with superior competitive advantage, the result of which is well documented in history.
Today, the realm of logistics has been expanded well beyond the simple movement and control of a convoy. We have replaced the term “logistics” with the more fashionable term “supply chain management”, though it is of no less importance. To many an experienced participant, the supply chain is perceived as an integrated and inter-connected process through activities, nodes and actors to transport and facilitate the trade of goods and services for both enterprise and economy. There is a growing acceptance of the need to view the supply chain holistically and on an end-to-end basis, including the returns. There are obvious reasons for doing so, which we will elaborate later.
The role of supply chain management is simply to manage the supply line, now interconnected as a chain, from source to destination and back. Given the nature and speed of trade today, there is an attendant need to focus on the cost-to-serve and the time-to-value for goods and services. In this regard, improving trade logistics naturally involves ways and means to improve the flow efficiency through either reducing costs along the chain or improving the timelines of delivery (APEC 2009). There are also
Global value chains in a changing world
246
other imperatives for contemporary supply chains, given the recent developments in this arena. First is that of making the supply chain more secure through better protocols for goods transfer. Second is about guaranteeing the reliability of delivery by reducing the uncertainty factor in either supply or demand risk. Both of these considerations naturally require some form of reasonable connectivity between the stakeholders to communicate or ensure safe passage during transit, and we will return to this area later. According to an article by LaLonde (2003), connectivity ought to be a core principle of supply chain management, other than those of collaboration, synchronization, leverage and scalability.
In the context of global production networks and global value chains, which is another province of study in itself, the notion and practice of connectivity is indeed an important principle. Berenbeim and Shakya (2011) note that as global production networks advance under the effects of globalization, the transnational enterprises are increasingly engaging central and regional governments on the performance and availability of the “at the border and beyond the border” aspects of their supply chain notably on the issues related to logistics infrastructure, connectivity and regulatory environment. Today, these global buyers and producers of goods and services are no longer passive beneficiaries but are very active partners in all stages of industrial development which include the identification of industrial operations bottlenecks, formulation of policy measures to address them and collaboration in taking remedial action. However, in the developing countries, challenges still exist for the export shippers and producers of goods more than for the firms that import goods into the country. There is already a keen awareness that good supply chain management practice and seamlessness throughout the chain is a source of firm competitiveness. Hence, there is a growing reliance on benchmarking transport and logistics cost and time, given the increase in global production sharing and the shortening of product lifecycles. Good connectivity should eradicate any unnecessary informal cost and non-value time.
10.2. Brief overview of work on supply chain connectivity
Much of the traditional literature on supply chain management has sought to focus on the integration effort within the various functions of the firm (Turkulainen, 2011) or to focus on the integration of different enterprises within a supply chain (Frolich and Westbrook, 2002). The existing literature is replete with studies that indicate that
Supply chain connectivity and trade in Asia
247
collaboration between firms leads to improved operational performance (Lockström et al., 2011). More recently, there has been a renewed focus on upstream and downstream collaboration with customers and suppliers, especially for those who operate internationally where the barriers to trade are imposed. This shift came about as a result of the greater awareness of the impact of logistics on trade (trade logistics) and the growing acceptance of the global value chain concept.
Connectivity, in itself, has also been studied in the academic literature, albeit scantily. Hoffman and Hellström (2008) have investigated the connectivity construct in the supply chain management literature. Specifically, they identify the connectivity construct as being informed by information and technology, and it can occur at two levels – in the organization and in the logistics system. Our interest in this paper is focused on the logistics systems level. There is some literature available on articulating the benefits of good supply chain connectivity such as Holloway and Rae (2012) who found that expediting the delivery of imports into a country through the exemption of goods with value of under US$ 200 from customs duties (and hopefully with no inspections needed) can yield US$ 5.9 billion in revenue for the economy through faster commerce. This is equivalent to 0.086 per cent of the GDP of APEC (Holloway and Rae, 2012). At the same time, Holloway and Rae (2012) also provide a timely reminder that the greatest beneficiaries are the small and medium enterprises (SMEs) that face more challenges in completing customs formalities. This agrees with Hummels (2001) who has noted that simplifying import procedures can help to ensure timely inbound shipments to an enterprise’s market. These SMEs do not have the time, money and dedicated business units for customs clearance and value tax reporting.
10.3. Trade and growth nexus in Asia
According to the estimates provided by APEC (CIE, 2009), a one per cent increase in the ratio of trade to GDP would lead to a 2 to 3 per cent increase in per capita income. Further, the World Bank has reported that improving trade-related transparency can increase trade by 7.5 per cent or US$ 148 billion. In short, growing uninterrupted trade is beneficial to any economy or country. For Asia, and APEC in particular, this is of special importance given the current economic climate in Europe and North America. Many countries in Asia are already recognizing this finding (see Figure 10.1) and are focusing on liberalizing their trade regimes to provide for greater economic sustainability.
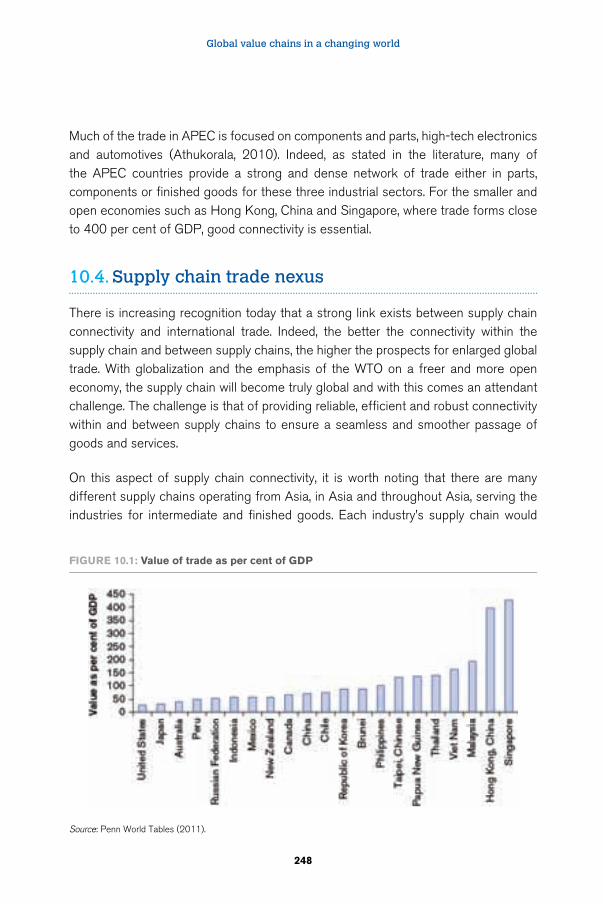
Global value chains in a changing world
248
Much of the trade in APEC is focused on components and parts, high-tech electronics and automotives (Athukorala, 2010). Indeed, as stated in the literature, many of the APEC countries provide a strong and dense network of trade either in parts, components or finished goods for these three industrial sectors. For the smaller and open economies such as Hong Kong, China and Singapore, where trade forms close to 400 per cent of GDP, good connectivity is essential.
10.4. Supply chain trade nexus
There is increasing recognition today that a strong link exists between supply chain connectivity and international trade. Indeed, the better the connectivity within the supply chain and between supply chains, the higher the prospects for enlarged global trade. With globalization and the emphasis of the WTO on a freer and more open economy, the supply chain will become truly global and with this comes an attendant challenge. The challenge is that of providing reliable, efficient and robust connectivity within and between supply chains to ensure a seamless and smoother passage of goods and services.
On this aspect of supply chain connectivity, it is worth noting that there are many different supply chains operating from Asia, in Asia and throughout Asia, serving the industries for intermediate and finished goods. Each industry’s supply chain would
Figure 10.1: Value of trade as per cent of gDP
Source: Penn World Tables (2011).
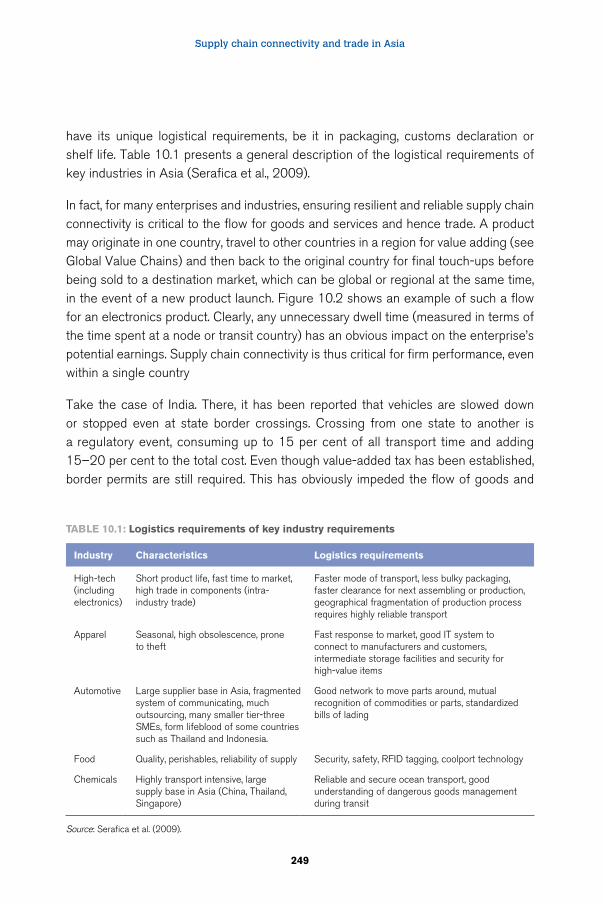
Supply chain connectivity and trade in Asia
249
have its unique logistical requirements, be it in packaging, customs declaration or shelf life. Table 10.1 presents a general description of the logistical requirements of key industries in Asia (Serafica et al., 2009).
In fact, for many enterprises and industries, ensuring resilient and reliable supply chain connectivity is critical to the flow for goods and services and hence trade. A product may originate in one country, travel to other countries in a region for value adding (see Global Value Chains) and then back to the original country for final touch-ups before being sold to a destination market, which can be global or regional at the same time, in the event of a new product launch. Figure 10.2 shows an example of such a flow for an electronics product. Clearly, any unnecessary dwell time (measured in terms of the time spent at a node or transit country) has an obvious impact on the enterprise’s potential earnings. Supply chain connectivity is thus critical for firm performance, even within a single country
Take the case of India. There, it has been reported that vehicles are slowed down or stopped even at state border crossings. Crossing from one state to another is a regulatory event, consuming up to 15 per cent of all transport time and adding 15–20 per cent to the total cost. Even though value-added tax has been established, border permits are still required. This has obviously impeded the flow of goods and
Table 10.1: logistics requirements of key industry requirements
industry Characteristics logistics requirements
High-tech (including electronics)
Short product life, fast time to market, high trade in components (intra-industry trade)
Faster mode of transport, less bulky packaging, faster clearance for next assembling or production, geographical fragmentation of production process requires highly reliable transport
Apparel Seasonal, high obsolescence, prone to theft
Fast response to market, good IT system to connect to manufacturers and customers, intermediate storage facilities and security for high-value items
Automotive Large supplier base in Asia, fragmented system of communicating, much outsourcing, many smaller tier-three SMEs, form lifeblood of some countries such as Thailand and Indonesia.
Good network to move parts around, mutual recognition of commodities or parts, standardized bills of lading
Food Quality, perishables, reliability of supply Security, safety, RFID tagging, coolport technology
Chemicals Highly transport intensive, large supply base in Asia (China, Thailand, Singapore)
Reliable and secure ocean transport, good understanding of dangerous goods management during transit
Source: Serafica et al. (2009).

Global value chains in a changing world
250
Fig
ur
e 1
0.2:
Valu
e c
hain
sid
e o
f a b
usi
ness
Sou
rce:
SIM
Tech
and
ow
n cr
eatio
n.
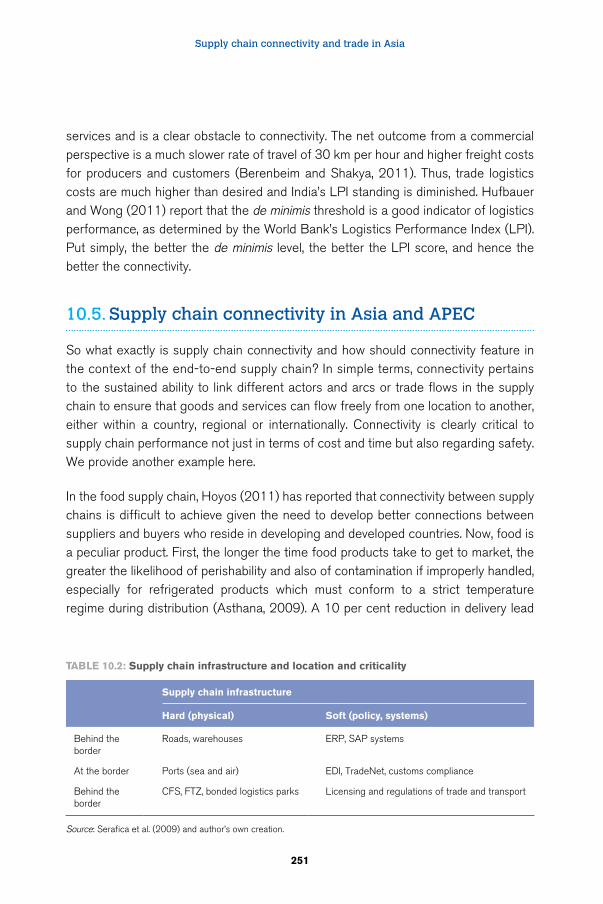
Supply chain connectivity and trade in Asia
251
services and is a clear obstacle to connectivity. The net outcome from a commercial perspective is a much slower rate of travel of 30 km per hour and higher freight costs for producers and customers (Berenbeim and Shakya, 2011). Thus, trade logistics costs are much higher than desired and India’s LPI standing is diminished. Hufbauer and Wong (2011) report that the de minimis threshold is a good indicator of logistics performance, as determined by the World Bank’s Logistics Performance Index (LPI). Put simply, the better the de minimis level, the better the LPI score, and hence the better the connectivity.
10.5. Supply chain connectivity in Asia and APEC
So what exactly is supply chain connectivity and how should connectivity feature in the context of the end-to-end supply chain? In simple terms, connectivity pertains to the sustained ability to link different actors and arcs or trade flows in the supply chain to ensure that goods and services can flow freely from one location to another, either within a country, regional or internationally. Connectivity is clearly critical to supply chain performance not just in terms of cost and time but also regarding safety. We provide another example here.
In the food supply chain, Hoyos (2011) has reported that connectivity between supply chains is difficult to achieve given the need to develop better connections between suppliers and buyers who reside in developing and developed countries. Now, food is a peculiar product. First, the longer the time food products take to get to market, the greater the likelihood of perishability and also of contamination if improperly handled, especially for refrigerated products which must conform to a strict temperature regime during distribution (Asthana, 2009). A 10 per cent reduction in delivery lead
Table 10.2: Supply chain infrastructure and location and criticality
Supply chain infrastructure
Hard (physical) Soft (policy, systems)
Behind the border
Roads, warehouses ERP, SAP systems
At the border Ports (sea and air) EDI, TradeNet, customs compliance
Behind the border
CFS, FTZ, bonded logistics parks Licensing and regulations of trade and transport
Source: Serafica et al. (2009) and author’s own creation.
Global value chains in a changing world
252
time can help to expand the exports of these time-sensitive products by more than four per cent. This is important for countries which are developing economies and highly reliant on food as their source of income. Likewise, for countries that are dependent on food for sustenance, it is also critical to ensure timely connectivity so that consumers do not have to bear the burden of unnecessary wastages and factor-production inefficiencies along the chain.
In this regard, when one speaks of connectivity, the usual reference is to infrastructure. Serifica et al., (2009) embrace a deeper notion of connectivity and its relation to logistics performance. Infrastructure can be hard or soft, and it has its own degree of criticality depending on where it is located along the supply chain. For this purpose, we will highlight the sort of infrastructure, behind the border, at the border and immediately beyond the border.
10.6. Challenges to connectivity in Asia
Typically, when one refers to hard infrastructure, it usually pertains to the assets of high fixed cost such as large distribution warehouses and ports to store, buffer or transhipped stock to manage any supply or demand uncertainty. At the border, this can represent seaports and airports such as in many Asian countries. However, this physical infrastructure may require significant public-funding support and warrant some private-public partnership arrangements. For the less-developed countries, this presents a challenge. In addition, connectivity at the border also includes other assetized equipment such as gantry cranes for terminal handling at the port, airfreight handling equipment including different temperature-control regimes ranging from -28C to 18C, and joint container pallet loaders. Beyond the border, this could take the form of traditional container freight stations where cargo needs to be de-bulked and on-shipped to its final destination. Some of the infrastructure requires heavy commitment and development cost that poorer countries find difficult to afford.
All this equipment naturally carries a cost. For physical infrastructure, determining the right amount and right type of facilities to be used (as for ambient versus cool temperature) and locating them at the right place is important to serve business and trade. Regarding soft infrastructure, there is a mix of public and private sector collaboration in some Asian countries to ensure smooth supply chain connectivity. One prime example is that of the “National Single Window” which is supposed to reduce unnecessary dwell time at the border and expedite cargo clearance through
Supply chain connectivity and trade in Asia
253
a green-lane mechanism. Related to this is the implementation of IATA’s e-freight initiative which serves to reduce the cost of data entry and verification and also to minimize the time goods spend in the supply chain system through the efficient re-use of data. Soft infrastructure in the form of systems connectivity, harmonization of standards and government regulations could possibly be more critical to ensure smooth and seamless goods passage. The challenge is for governments and their key agencies to agree on the right data to capture and house for tax and revenue collection purposes, without unduly slowing the system. Thus, focusing on improving soft infrastructure could possibly reduce the need for excessive hard infrastructure before the border, at the border and behind the border. It has been suggested that a 10 per cent improvement in flow efficiency in across-the-border operations can boost the GDP of the APEC economies by as much as US$ 21 billion annually (CIE, 2009). Further, additional jobs would be created to manage the systems once it was in place.
The typical flow of a finished car from an automotive factory in Chongqing (a major manufacturing and transportation hub) to the international port of Shanghai involves a distance of about 2,150 km along the Yangtze River and requires 8 to 11 days barging downstream (see www.dci-logistics.com). A dwell time of one to two days at Shanghai port and then a transpacific sailing time of 20 days on APL Hyundai Hong Kong before reaching Long Beach on the West Coast of the United States would mean a month would be needed for door-to-door transit. This obviously has implications for the cost of capital tied up in the supply chain. Clearly, saving just one day amounts to a three per cent improvement for the China-US West Coast trade lane. Thus, poor connectivity can reduce the choice set of potential factory locations in China.
However, supply chain connectivity concerns all modes of transport, especially in the case of Asia, a continent with landlocked countries, islands and with increasing reliance on inter-modal transport. Good supply chain connectivity thus concerns road network connectivity, air freight connectivity for commercial airlines and cargo freighters, ocean-faring ships and regional lines feeders, inter-island connections and sailings and the hand-off points for the various modes of transport. Yet there still remains one critical element of supply chain connectivity worthy of much attention. This regards the ease of transiting through borders and customs at international and regional gateways.
A 2009 APEC report on supply chain connectivity identified 20 to 30 chokepoints that give rise to supply chain connectivity issues. Two of them can help us to better
Global value chains in a changing world
254
understand the challenge to improving connectivity and building the necessary capacity for such (CIE, 2009):
1. The lack of physical capacity or poorly maintained infrastructure: in many parts of Asia there are still countries that lack the physical capacity to provide good air, sea and land freight connectivity. This lack of capacity as evidenced by the lack of proper warehousing or temperature-controlled environment for storage can effectively lengthen a cargo’s dwell time and overall transit time. Poorly maintained infrastructure also creates angst for many shippers or logistics providers with old and slow equipment used to move containers and bonded warehouses in dire need of retrofitting with modern technology for better security, screening and safety.
2. Poor, numerous and cumbersome regulations: a report commissioned by the ASEAN secretariat found that there were far too many regulatory requirements (de Souza et al., 2007). This limits the efficiency of clearance and connectivity. The cost of facilitating connectivity at the border has often been alluded to in regional and international forums. There is a need to simplify customs documents and reduce the amount of burdensome inspection due to unfamiliarity with or unclear declaration of goods. This in particular affects the SMEs that form the bulk of all enterprises in Asian countries.
While most of the challenges to connectivity have been addressed with the help of international and regional organizations such as IATA’s e-freight programme and the National Single Window initiative promoted and supported by the World Bank and others, the road to seamless connectivity is still a long one.
In this instance, we recall the situation of product returns management. In the interest of environmental sustainability, product returns for the purpose of repairs, remanufacturing and recycling have become an increasingly important part of the end-to-end supply chain. In Asia, there is good growth potential for this line of business. However, placing product repair points in low-cost labour locations such as India and China does not help the cause of connectivity. This is due to policies that countries like China have adopted in an effort to protect themselves from economic dumping, and these policies tend to scrutinize the flow of returned products more carefully and thus delay the repair process. For these product returns, the time back to market and economic serviceability are of the utmost importance to the mining and high-tech industries. Failing to stick to tight timelines can result in a severe commercial
Supply chain connectivity and trade in Asia
255
penalty for the enterprise. The challenge for supply chain connectivity is therefore the ability to craft regulations that allow for the smooth passage of a genuine return, from a product intended for dumping in a developing country. Asian countries need to work around these regulations, given their high degree of involvement in the global production network and the proportion of closed-loop supply chain activities.
10.7. State of progress on the supply chain connectivity initiative in APEC
According to its charter, APEC aims to strengthen regional economic integration by removing impediments to trade and investment “at the border”, enhancing supply chain connectivity “across the border” and improving the business environment “behind the border”. It endeavours to improve the operating environment for business by reducing the cost of cross-border trade, improving access to trade information and simplifying regulatory and administrative processes (see www.dfait-maeci.gc.ca/apec/index.apec?view=id). We note that connectivity first came to the fore of the APEC agenda in 2001.
We recall the earlier statement that a ten per cent efficiency gain in across-the-border supply chain connectivity would generate jobs for APEC countries and raise the GDP by US$ 21 billion annually. At the company level, trade reports have shown that a five per cent reduction in the logistics spend (presumably through human resources to manage complex processes, transport and border clearance) has a similar impact on the bottom line as a 25-30 per cent increase in sales (see www.supplychainconnection.com). Besides, a one-day loss in exports can lead to a loss in export value of one per cent. Clearly, in a global environment rife with uncertainty, improving cross-border connectivity is a big first step for economic growth both in a region and for an individual country. At the policy level, the APEC trade facilitation principles were agreed upon in close partnership with the business community in 2002 and then in 2006. The less ambitious objective then was to reduce the transaction cost by 5 per cent by 2016, taken over two five-year time frames.
At a recent APEC workshop held on improving supply chain connectivity across economies through open and competitive services, several key points were raised and discussed among the business, academic and policy communities (APEC 2010). Particular issues such as regulatory impediments and their cost to supply chain connectivity were highlighted and deliberated upon. These actions serve to highlight
Global value chains in a changing world
256
the importance of connectivity to trade, even for services. Clearly, good supply chain connectivity facilitates the trade in goods and services and it has a regional impact. More importantly, it has an indirect influence on growth and development.
To date, 13 of the 21 APEC economies have implemented single-window systems for customs declarations and clearance. Another five APEC members have systems under development. It is worth noting that this progress has been aided by the political will of the governments concerned who are keen to see greater liberalization in trade and services and also fewer impediments to the passage of goods and services at the border. The business community, through the ABAC (APEC’s Business Advisory Council), has also helped to project a meaningful and impactful agenda for action. In fact, ABAC has accelerated APEC’s supply chain work plan to integrate the supply chain regionally. Leveraging new technologies, ABAC is also responsible for initiating the move of APEC’s Single Window concept to a cloud-computing platform. This has helped to defray the cost of operations particularly in implementation and ICT infrastructure, to improve systems inter-operability, to increase ease of access in terms of any time, any place and through any device, to afford greater flexibility to logistics service providers and shippers to do their declarations and also to improve scalability and deployment.
10.8. Some lessons learned
Improving supply chain connectivity for better trade is a journey to be taken with perseverance and patience, as shown by the APEC case. Table 10.3 contains the chronological details of this journey. Some of the key takeaways include: (i) the need and willingness to better share information through the National Single Window mechanisms, (ii) to improve the collection of data, (iii) to accelerate the harmonization of procedures and regulatory requirements particularly customs, and (iv) to spur proactive effort to remove non-tariff barriers. The recipe for success is a tripartite effort involving governmental cooperation, multi-agency cooperation and vested commercial interests.
10.9. Moving forward
We have thus far covered the case of APEC, which hopefully is representative of the situation in Asia. The transit of goods across national and international borders will always be a work in progress for shippers, logistics service providers and regulatory
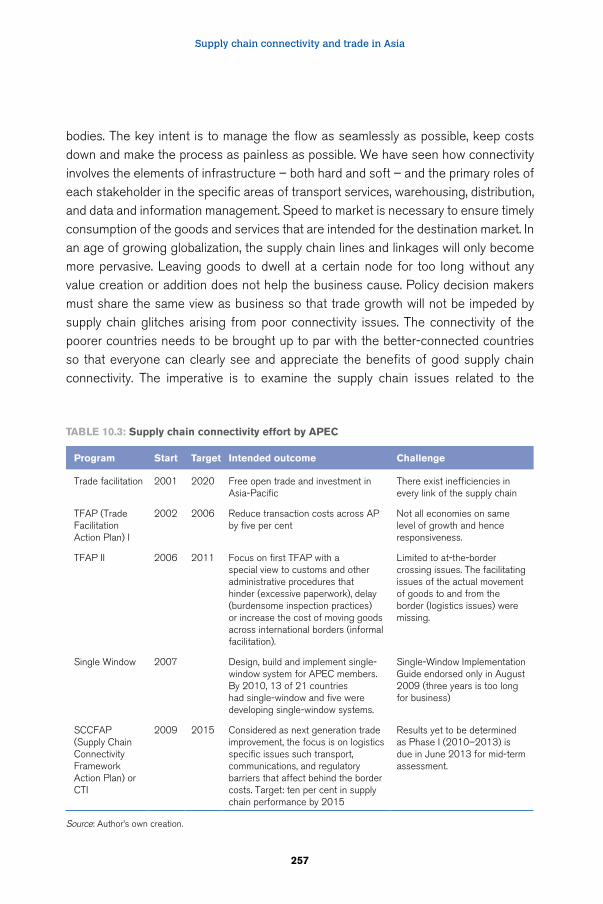
Supply chain connectivity and trade in Asia
257
bodies. The key intent is to manage the flow as seamlessly as possible, keep costs down and make the process as painless as possible. We have seen how connectivity involves the elements of infrastructure – both hard and soft – and the primary roles of each stakeholder in the specific areas of transport services, warehousing, distribution, and data and information management. Speed to market is necessary to ensure timely consumption of the goods and services that are intended for the destination market. In an age of growing globalization, the supply chain lines and linkages will only become more pervasive. Leaving goods to dwell at a certain node for too long without any value creation or addition does not help the business cause. Policy decision makers must share the same view as business so that trade growth will not be impeded by supply chain glitches arising from poor connectivity issues. The connectivity of the poorer countries needs to be brought up to par with the better-connected countries so that everyone can clearly see and appreciate the benefits of good supply chain connectivity. The imperative is to examine the supply chain issues related to the
Table 10.3: Supply chain connectivity effort by aPeC
Program Start Target intended outcome Challenge
Trade facilitation 2001 2020 Free open trade and investment in Asia-Pacific
There exist inefficiencies in every link of the supply chain
TFAP (Trade Facilitation Action Plan) I
2002 2006 Reduce transaction costs across AP by five per cent
Not all economies on same level of growth and hence responsiveness.
TFAP II 2006 2011 Focus on first TFAP with a special view to customs and other administrative procedures that hinder (excessive paperwork), delay (burdensome inspection practices) or increase the cost of moving goods across international borders (informal facilitation).
Limited to at-the-border crossing issues. The facilitating issues of the actual movement of goods to and from the border (logistics issues) were missing.
Single Window 2007 Design, build and implement single-window system for APEC members. By 2010, 13 of 21 countries had single-window and five were developing single-window systems.
Single-Window Implementation Guide endorsed only in August 2009 (three years is too long for business)
SCCFAP (Supply Chain Connectivity Framework Action Plan) or CTI
2009 2015 Considered as next generation trade improvement, the focus is on logistics specific issues such transport, communications, and regulatory barriers that affect behind the border costs. Target: ten per cent in supply chain performance by 2015
Results yet to be determined as Phase I (2010–2013) is due in June 2013 for mid-term assessment.
Source: Author’s own creation.
Global value chains in a changing world
258
movement of goods not just at the border but also from source to destination and return. A de minimis regime as suggested by Holloway and Rae (2012) which provides for streamlined border clearance and exemption from customs duties and other taxes clearly helps in ensuring supply chain connectivity at the border.
10.10. Concluding remarks
This paper seeks to highlight the importance of supply chain connectivity on trade particularly for growing economies in the context of Asia. No doubt some progress has been made, but more work lies ahead especially in the tripartite engagement between governments, the business community and international development agencies such as the World Trade Organization, the World Customs Organization and the Asian Development Bank in order to promote greater freedom in the movement of goods and services between, across and beyond borders. We need a more logistics-friendly and business-enabling environment for faster trade flows and greater economic growth.
References
Asia-Pacific Economic Co-operation (APEC). 2010. “Improving Supply Chain Connectivity through Open and Competitive Services”, Workshop on 27–29 September (Hanoi, Vietnam).
Asia-Pacific Economic Co-operation (APEC), 2009. “A Results-oriented approach to APEC’s Supply Chain Connectivity Initiative”, APEC Report N° 209-SE-01.11 (APEC Policy Support Unit).
Asthana, S. 2009. “Supply Chain Connectivity and Food Distribution”, paper presented at the Agro Enterprise without Borders, Singapore, assessed on 11 January 2013.
Athukorala, P.C. 2010. “Production Networks and Trade Patterns in East Asia: Regionalization or Globalization?, in ADB Working Paper Series on Regional Economic Integration, No. 56, August.
Berenbeim, R. E.; Shakya, M. 2011. “Integration of Developing Countries in the Global Supply Chain: A Global Buyers’ and Producers’ Perspective”, in The Conference Board, New York.
The CIE (The Centre for International Economics). 2009. “Supply-Chain Connectivity across APEC: Improving Trade Logistics”, paper prepared for the APEC Committee for Trade and Investment.
De Souza, R.; Goh, M.; Gupta, S.; Lei, L. 2007. “An investigation into the Measures Affecting the Integration of ASEAN’s Priority Sectors, Phase 2: the Case of Logistics”, REPSF Project N° 06/001d.
Supply chain connectivity and trade in Asia
259
Frohlich, M.T.; Westbrook, R. 2002. “Arcs of Integration: An International Study of Supply Chain Strategies”, in Journal of Operations Management, 19(2)185–200.
Hoffman, K.; Hellström, D. 2008. “Connectivity in Logistics and Supply Chain Management: A Framework”, Proceedings of the Logistics Network Conference, 10–12 September, University of Liverpool Management School.
Holloway, S.; Rae, J. 2012. “De minimis thresholds in APEC”, in World Customs Journal, 6(1)31–62.
Hoyos, J. 2011. “Connectivity in the Food Supply Chain”, in International Trade Forum, issue 2, pp. 37–38.
Hufbauer, G.C.; Wong, Y. 2011. “Logistics Reform for Low-Value Shipments”, in Policy Brief No. PB 11–7, June, (Washington, DC, Peterson Institute for International Economics).
Hummels, D. 2001. “Time as a Trade Barrier”, GTAP Working Paper, No. 18, Centre for Global Trade Analysis, Department of Agricultural Economics, (Lafayette, IN, Purdue University).
Jacobi, S. 2012. “Promoting Supply Chain Connectivity – Can APEC Deliver”, paper presented at Customs Brokers and Freight Forwarders Conference, Auckland, 10 May (New Zealand International Business Forum).
LaLonde, B. 2003. “Five Principles of Supply Chain Management: Connectivity, Collaboration, Synchronization, Leverage and Scalability as the Core Supply Chain Principles”, in Supply Chain Management Review, May 1.
Lockström, M.; Harrison, N.; Moser, R.; Malhotra, M.; Schadel, J. 2011. “Supplier Integration in the Automotive Industry”, in B. B. Flynn, M. Morita and J. Machuca (eds): Managing Global Supply Chain Relationships: Operations, Strategies and Practices (Hershey, PA, IGI Global).
Policy Support Unit (PSU). 2010. “Reducing Trade Transaction Costs in APEC Economies by 5%: Progress with Achieving the Goals of TFAP II” in interim assessment of TFAP II (Asia-Pacific Economic Cooperation Secretariat, Singapore).
Serafica, R. B.; Hao, J.; Hredzak, T. L. 2009. “A Results-Oriented Approach to APEC’s Supply Chain Connectivity Initiative”, report of the Asia-Pacific Economic Cooperation (APEC) Policy Support Unit, 16 Oct.
Turkulainen, V. 2011. “Internal Supply Chain Integration: Effective Integration Strategies in the Global Context”, in B. B. Flynn, M. Morita and J. Machuca (eds): Managing Global Supply Chain Relationships: Operations, Strategies and Practices (Hershey, PA, IGI Global).


Part IV
Plugging into supply chains: designing policy for a changing world

263
11 Policies to improve the supply chain: what needs to be done?1
Michael J. Ferrantino
11.1. Introduction
As the agenda of trade facilitation achieves more prominence on the international stage, the prioritization of interventions takes on increasing importance. Discussions of trade facilitation often take in anything that might promote trade other than tariff reduction. In its broadest sense, trade facilitation can include both eliminating non-tariff measures (NTMs), often defined as policies other than tariffs that impede trade (compare UNCTAD, 2010), reforms to customs and border measures, improvements in transformation and communications infrastructure, regulatory issues, and broader improvements in transparency and accountability that could impact trade. From the business standpoint, the classification of methods of trade facilitation is not as important as taking action that will in fact promote trade.
Given both limited governmental resources and, perhaps more importantly, limits of attention in the policymaking process, it is therefore vital to set priorities. We need to know what types of interventions deserve the most attention and resources. In order to determine this, we would require a catalogue of possible issues and interventions in order to find out what is in the choice set. Different issues of policy, technology, and private practice come up at every stage of the movement of goods, from the initial movement from the factory to the port, through port logistics (both seaport and airport, including land border crossings), international transport, customs clearance, to distribution in the importing country including wholesaling and retailing (Ferrantino, 2012). The metrics appropriate to assessing policy interventions in each of these areas include costs, time, uncertainty, and by extension, the impact of changes in each on actual trade flows and on broader measures such as GDP and welfare. Moreover, the possibility of interaction effects should be taken into account, since improvements in one area without accompanying improvements in other areas might have little effect.
Global value chains in a changing world
264
This chapter attempts to survey the types of interventions whose effects should be compared in order to make informed policy choices as well as the quality of evidence that is available at present. The discussion follows the approximate order in which goods move along the supply chain from the producer to the consumer, with a bit of backtracking. It will also touch on the relative ease or difficulty of making different interventions, and the reasons for this. This approach is meant to be suggestive rather than exhaustive. Important contributions in many areas will either be overlooked, due to author ignorance, or set aside due to lack of space. However, the aim is that the reader will gain at least a clearer idea of what might be done, and what we do or do not know about the effects of action. In addition, I hope to at least raise some questions about the sources of inaction. Which measures to improve the supply chain are costly in financial terms? Which are technically complex? Which are impeded by rent seekers who benefit from the status quo?
11.2. Infrastructure versus border measures – which is more important?
One issue that has regularly come up in policy discussions of trade facilitation is whether “hard” or “soft” trade facilitation is more important for improving trade performance. Hard trade facilitation is usually used to signify improvement to roads, seaports and airports – or overall transportation infrastructure – and also sometimes to telecommunications infrastructure. Soft trade facilitation refers to improvements in customs procedures, such as single windows and trusted-trader programmes, as well as measures to improve transparency and reduce corruption. The WTO trade facilitation agenda mainly focuses on soft trade facilitation, and much of the WTO debate so far centers on whom will pay to implement reforms, and whether any financial contributions made by wealthy countries can be used to support physical infrastructure as well as customs modernization (Washington Trade Daily, 2012). One thing we would like to know is whether hard or soft trade facilitation has a bigger “bang for the buck,” as determined by some appropriate metric. Another is how much each costs. It is generally believed that hard trade facilitation is much more expensive than soft, although there are certainly costs associated with soft trade facilitation such as automation and training. One area we would like to focus on is to identify the costs of each and to find an appropriate metric to measure whether soft or hard trade facilitation has a “bigger bang for the buck”.
Policies to improve the supply chain: what needs to be done?
265
In principle, we would like to know the marginal contribution to the lowering of trade costs for each additional dollar spent on each type of trade facilitation, not only regarding “hard” versus “soft” but also subcategories within each (roads versus ports and airports, programmes for authorized operators versus advanced rulings versus processing zones, training versus automation, and so on.) Ideally, these would be measured in a series of randomized field trials, as is sometimes done for localized anti-poverty interventions in developing countries.2 It is difficult to imagine implementing (or not) large projects like road building or customs reform by random assignment. This leaves the effects of different patterns of intervention on a cross-country basis to be determined by econometric or survey methods. Depending on one’s methodological stance, good econometrics is either a perfectly serviceable method for randomized trials (Angrist and Pischke, 2009) or hopelessly misleading (Manzi, 2012).
An example of the type of information arising from econometrics is provided by Wilson et al., (2005). Using trade data for 2000 and 2001, they estimate the potential gains in merchandise trade if all countries with below-average performance were to improve the level of four indicators halfway to the global median. The resulting gains break down as follows: port efficiency (airports and seaports) US $107 billion, service infrastructure (internet) US $154 billion, customs US $33 billion, and regulatory environment (transparency and corruption) US $83 billion. If we group port efficiency and service infrastructure as “hard” trade facilitation and the rest as “soft,” that gives US $261 billion of potential gains from “hard” policies and US $116 billion from “soft.” However, it is not quite so simple – some of the gains from improving transparency and reducing corruption are no doubt economy-wide and not trade facilitation per se, and some improvements in port efficiency might be achieved by “soft” policies such as privatization.
By comparison, a 2012 survey (World Economic Forum, 2013) asked respondents in the retail and manufacturing industries which trade facilitation issues added the most to the c.i.f. price of goods they were familiar with. The cost increases were attributed 34 per cent to transport and communications infrastructure, 25 per cent to border administration, 21 per cent to the business environment – including the regulatory environment, investment policy, security, and related issues – and 20 per cent to market access, which includes not only tariffs, but NTMs, SPS/TBT requirements, quotas, licenses, rules of origin and related issues. While these results are based on a small sample size (< 100), and pose similar definitional questions as the econometric results just presented, they also suggest that infrastructure issues weigh larger than border administration issues, although in terms of cost reductions per unit of expenditure, improvements in customs administration might still be a bargain.
Global value chains in a changing world
266
A third metric, related to time, can be obtained from the World Bank’s Doing Business Report, (2013). Of the total time involved in exporting from Sub-Saharan Africa in 2012, approximately 20 days are accounted for by document preparation, customs clearance and technical control (soft issues), while about 10 days are accounted for by port and terminal handling and inland transport (hard issues). Similar splits are observed for importing, and for other developing regions – although for Eastern Europe and Central Asia, including a number of remote and landlocked countries, the average time associated with hard issues is about half the total. The same source also reports that since 2006, most of the observed time savings has come from reforms in document preparation.
Casual observation suggests that some aspects of trade-related infrastructure in developing countries have improved more rapidly than others. The diffusion of cell phones and the Internet in the last decade has been dramatic, while physical conditions in roads and ports are unlikely to have improved as much. Some evidence suggests that the impact of improvements in trade costs on communication infrastructure is larger for rich countries than for poor countries, while improvements in transport infrastructure are relatively more important for poor countries, with transport and communications being of approximately equal importance for a country such as Malaysia (Zhai, 2010). If this were true, the implication would be that while everybody’s trade costs have been reduced, the reductions have been disproportionately greater for high and upper-middle income countries. This is a point worth further examination, as it may lead to a stronger argument for the relative importance of physical infrastructure for trade.
These results and others like them, taken together, are by no means dispositive, and suggest that we need to know more. But in broad terms, it can be said that the difficulties created by inadequacies in hard infrastructure are still quite large, but that the potential gains from improving border administration measures may be cheaper and easier to achieve and are still significant.
11.3. Movement to and from the port
The first step in the journey of goods in international trade is the move from the original farm or factory to the port or seaport to which they must travel. The measurement of land transport times in the Doing Business Report gives some idea of the long periods of time necessary to move goods to port, particularly for landlocked countries. But point estimates only tell part of the story. Just as important, if not more so, is the uncertainty involved in land transport under difficult conditions, leading to a “long tail”
Policies to improve the supply chain: what needs to be done?
267
of adverse outcomes. That is, if the average time to traverse a particular land route is four days, the distribution of travel times is highly skewed, so that transit times exceeding 10 or even 20 days occur with significant probability (Arvis et al., 2012). The road from the border of Burkina Faso to the port at Tema may take two days to transit under ideal conditions, and might take six hours if it were paved and maintained according to OECD standards. Random occurrences might include a flooded bridge, a broken axle (requiring a repair crew which may also take several days to arrive, even if the driver has a cell phone) or an unauthorized checkpoint for bribes.
This unpredictability may affect the linkage of land transport to the port (Christ and Ferrantino, 2011). If a truck arrives too late, it may miss a scheduled ship departure. If it arrives too early, this causes a waiting period which could cause perishable cargo to spoil or, in the absence of adequate warehousing facilities, non-perishable cargo to be stolen. It could even cause disruption in stages of the production process that have to be timed closely relative to the departure of the truck. For example, the de-greening of pineapples must take place a certain number of days before harvest, with truck loading following immediately thereafter.
Since analysts have been able to derive a value for the cost of time in trade (Hummels and Schaur, 2012), the value of reducing such time can be compared to a tariff reduction, albeit the value of reducing uncertainty is more challenging. Such a value could be compared to the costs of reducing transit time for movement to port. It might be assumed that the costs of paving roads are very high. However, not all costs associated with movement to port are directly linked to road quality. The actual price of trucking services in remote developed countries often substantially exceeds the marginal cost of providing such services due to the presence of trucking cartels (Arvis et al., 2012). This suggests that land transport may not be so unlike customs in that there may be “soft” low-cost interventions that lower its cost. There may also be some endogeneity between road quality and trucking prices. That is, the challenges involved in driving on very bad roads create an implicit barrier to entry, which may facilitate cartelization among the small number of firms willing to drive on such roads. Anecdotal observation suggests that repairing roads induces complimentary investments in vehicles, because a new vehicle is less likely to break down on a good road. Thus, road repairs might also promote competitive entry into trucking services.
Impediments to the road system also affect domestic distribution systems at the other end of the supply chain, and interfere with the movement of both imported and
Global value chains in a changing world
268
domestic goods. A recent study of India’s agricultural trade (USITC, 2009) examined the road system, and found again a mixture of “hard” and “soft” issues leading to long and unreliable transit times. Many roads are in poor condition and consist of mixed traffic (freight trucks, private cars, bicycles and animal-drawn carts), with few having limited access – an expensive infrastructure issue. On the other hand, trucks are compelled to stop at state borders due to differing state regulations on weight, emissions and safety, as well as to collect entry taxes. Such issues in principle could be addressed without any new road building.
11.4. Ports, airports and connectivity
A number of studies identify differences in port efficiency and maritime services across countries as significant determinants of the volume and the costs of trade. For seaborne trade, both the efficiency of the port and the cost of international transportation services are relevant. The improvement of ports is in part an infrastructure issue – road access to the port and adequacy of warehousing space are important. But some significant cost differences in ports and in maritime transport can be traced to policy, implying that gains can be achieved by “soft” measures. Port services are more expensive when shippers are required to pay for mandatory port services, such as a fee for use of the gantry crane even when the ship’s own crane is actually used. The presence of organized crime is also a significant determinant of port costs (Clark et al., 2004). Governance of seaports is also a significant determinant of port efficiency. The government may own the port and operate services (service ports), allow private firms to supply services (landlord ports), or also allow private firms to lease and operate port assets (tool ports), (Fink et al., 2002). Improvements in port governance that allow a greater role for the private sector can bring about substantial improvements in performance (Londoño-Kent et al., 2003).
The determinants of maritime transport costs per se include the long-run trend towards the use of regularly scheduled liner routes (as compared to “tramp” routes which go wherever cargo is) and the closely associated spread of containerization which improves efficiency on many products. The impact of liner conferences and other international price-fixing agreements has been found by some studies to be substantial, while others have argued that the role of conferences has declined over time, necessitating mergers among shipping companies to maintain market power. This area of policy deserves closer examination, as the reach of national antitrust policies on the high
Policies to improve the supply chain: what needs to be done?
269
seas is unclear. Similarly, the decision to open markets for air transport to foreign carriers in the form of “open skies” agreements has a measurable impact on prices (Micco and Servrisky, 2004).
Another force raising rates for developing countries is the negative relationship between the size of the market and the number of transport companies that find it profitable to serve the market. This phenomenon is familiar to personal travellers in developed countries – one finds more competition and lower rates between New York and Chicago than between Fargo and Albuquerque. Both for air travel (Arvis and Shepherd, 2011) and for sea travel, the network connectivity of remote places is lower. There are significant cost advantages associated with being a hub, like Singapore or Rotterdam, than a spoke like the ports in many developing countries. It is notoriously faster and easier to travel from an African port to Rotterdam than between two African ports for which the distance is much shorter, because of the lack of scheduled routes.
The fact that poor countries have low international transport traffic, and thus have limited competition for services, raises a problem of causality. Are transport services limited because the country is poor, and demand is low? If such is the case, then there may be a “low-level poverty trap” of the sort difficult to overcome by policy. Alternately, are countries poor in part because transport options are limited? The evidence that efficient ports and low transport service prices promote exports and imports, which in turn promote development, suggests that improvements in transport can lead to development. The historical experience of the countries that are first to develop suggests the same. See Mokyr, (2010) on Great Britain.
This does not necessarily mean that expenditures on seaport and airport infrastructure cannot be poorly conceived or wasteful, especially if they are not accompanied by market access to those service providers who can best help the facility to operate efficiently. The question of market access and national treatment for firms in express delivery, third-party logistics and related industries points to the linkage between trade facilitation and services liberalization. The quality of services associated with transport is also likely to be associated to the types of goods traded – so-called “advanced technology” products – such as electronics that usually have longer supply chains than primary products, and countries without adequate facilities for the physical movement of these goods practically exclude themselves from participation in their trade.
Global value chains in a changing world
270
11.5. Customs, tariffs, and related issues
It seems plausible that the costs of implementing customs reform are low relative to the cost of upgrading physical infrastructure, and that the (monetizable) gains in transit time are non-trivial. Thus, even if there are more absolute gains to trade and welfare available from infrastructure improvement, on the margin the gains per dollar of expenditure may be higher for customs. Moreover, customs is an easier topic for the WTO to take up than physical infrastructure; the Doha Round trade facilitation negotiations are rooted in topics addressed in GATT 1947. Let’s look a little deeper.
Customs upgrading may be cheap in a relative sense, but it is not free. There are often expenditures involved both for electronic document management and training. Many customs systems still rely heavily on “heaps” of difficult-to-search paper. The role of IT in customs is critical. The ability of traders to file documents on line, especially in a single-window arrangement which facilitates communication with multiple government agencies simultaneously, leads to significant efficiency gains. Properly trained customs staff with access to information can also apply risk assessment schemes. This means that instead of inspecting every package, an algorithm is used to identify those packages which have a high probability of needing to be seen – because the products have high duties, the shipment raises security, regulatory, or intellectual property issues – while randomly sampling the other packages at a low rate. This reduces wait time. Automation also reduces the scope for corruption by increasing transparency. This is true for port automation as well as customs automation. A port official may claim that a container is difficult to locate, or a customs official may claim that a package is “somewhere” in the inspection queue, in either case demanding a “speed payment” for locating the shipment. Such incidents are less likely if a supervisor can verify the claim using an electronic database. Countries which adopt the ASYCUDA electronic data standard also facilitate an international exchange of information.
Moreover, it is often reported that “soft” customs is the bottleneck in the port or airport, which means that customs inefficiency could lead to knock-on inefficiency in the “hard” transport operations. If we observe ships floating in the ocean waiting for their turn to berth, the first suggestion might be to build more berths, which may get rejected on costs. However, if trucks are also queued up at the port exit gate because customs is slow to do their job, everything may back up behind customs as well. Reducing the customs bottleneck could create a positive externality for the rest of the port.
Policies to improve the supply chain: what needs to be done?
271
Somebody once observed that even if a country chose a mercantilist policy, they would not deliberately place rocks in their own port. One wonders why a similar observation does not apply to inefficient customs. Improvements in customs are made on a unilateral basis all the time. In the twelve months ending June 2012 alone, 22 countries improved some aspect of customs procedures, risk management or related port procedures (World Bank, 2013). What do the countries have in common that do not reform customs? One suspects a political economy motive – if the inefficiencies are linked to corruption, there is a constituency against reform.
We have some quantitative information on how the various measures referenced in the draft WTO trade facilitation text influence trade costs in OECD countries (Moisé et al., 2011), for which advance rulings appear to be most important. For these countries, an indicator of “governance and impartiality,” which may be a proxy for corruption, yields ambiguous results. As yet, there is no comparable information for developing countries. It is likely that there are interactions between corruption and transparency issues and the effect of more formal customs measures.
Finally, a fair amount of customs administration is taken up with collecting de minimis tariffs (variously defined as less than 1 per cent or 5 per cent ad valorem), many of which are legacies of the formula tariff cuts in earlier GATT rounds. Such duties may have minimal impact either in their effect on domestic producers or on customs revenues, although this is an empirical question. Agreements to eliminate de minimis duties could have a salutary impact on customs efficiencies.
11.6. Product standards – SPS and TBT
The presence of classic non-tariff measures (NTMs) is one of the prevalent issues in global supply chains. In recent years, measures arising from national regulation such as sanitary and phytosanitary standards (SPS) and technical barriers to trade (TBT) have become increasingly common relative to more traditional NTMs such as quantitative restrictions and automatic licensing. Regulatory NTMs impact at least two stages of the supply chain – the original production stage, because costs of production can be increased by efforts to comply with product standards (Maskus et al., 2005) and the import procedure stage, because inspection and testing may cause delays (the description of regulatory NTMs as “behind the border” does not always reflect the physical layout of import facilities).
Global value chains in a changing world
272
NTMs are unlike tariffs and transport impediments in that we do not have a simple “less is better” metric for measuring progress in reducing them. Indeed, NTMs may be the most challenging area in the field of trade costs when it comes to keeping a scorecard. It is universally recognized that countries may adopt domestic regulations for safety, health, environmental or other reasons, and that such regulations may apply to international trade so long as they are non-discriminatory, according to the principle expressed in GATT Article XX and the WTO’s SPS and TBT Agreements. Thus, if we have a catalogue of NTMs we do not know per se that simply striking items from the catalogue improves welfare. It may not even promote trade in all instances, since in some cases a stricter regulatory environment is associated with enhanced product quality and higher prices. It is possible to measure a “tariff equivalent” for NTMs, which captures their impact on traded-goods prices (Ferrantino, 2006) and thus to work out the impact of NTMs on trade, but from a policy standpoint any distortion in trade patterns needs to be weighed against welfare benefits that may arise from regulation.
In principle, one would want to identify cases of NTMs for which the trade-restricting effect substantially exceeds the contemplated welfare benefit, and modify or eliminate those. Casual empiricism suggests that there may be many cases falling into this category. SPS and TBT issues loom large in catalogues of NTMs (in 2010, the Office of the United States Trade Representative tripled the size of its National Trade Estimate report, adding separate volumes for SPS and TBT), in surveys of traders’ complaints (Basu et al., 2013) and in the activity of trade policymakers, as measured both by new chapters on SPS/TBT in “deeper” free trade agreements (FTAs) and in issues arising before dispute settlement. It is notoriously difficult to point to cases in which the negotiation of an FTA actually eliminated an NTM with trade-expanding effect, although sometimes FTAs can promote convergence of standards.
The relatively slow process of modifying or eliminating “bad” NTMs may be due to the large amount of political will it takes to overcome national preferences for particular types of health, safety or environmental regulation. Countries that “lose” at WTO dispute settlement on NTMs often prefer to absorb the authorized sanction rather than modify their policies. Even in the presence of seemingly high political will the process of regulatory coordination is massively difficult. The Single European Act of 1987 launched a programme of standards convergence for the existing members of the European Community. Six years later, 20 per cent of the national legislation required to create the regulatory “single market” was still not implemented, including 58 per cent of the regulations for medical devices (USITC, 1994).
Policies to improve the supply chain: what needs to be done?
273
The difficulty of negotiating changes in NTMs has led to approaches that recognize the need for flexibility so that the gains from convergence can be reconciled with national sovereignty and some differences in national practices. The implementation of the Single Market in the EU-10 countries of Central and Eastern Europe highlighted the use of a mix of approaches. Some cases were dealt with by the “old approach” of detailed harmonization using exhaustively specified directives, others by a “new approach” focusing on essential requirements of products while giving manufactures more flexibility as to how to satisfy those requirements, and those handled by the principle of mutual recognition, an acknowledgement that a partner country’s regulations afford equivalent levels of protection to those achieved by domestic regulation, even though they are very different (Brenton et al., 2000). The use of good regulatory practice and regulatory impact analysis in establishing regulations in the first place can make discussions of regulatory convergence easier and minimize future trade conflicts over regulatory issues (Johnson, 2009).
11.7. Distribution, wholesaling, and retailing
Once the goods have cleared the port or airport and are on the truck, the last step in the supply chain is getting the goods to the consumer. Since this part of the supply chain is more fully behind the border, it has received less attention from international economists. Yet distribution, wholesaling and retailing probably contribute a considerable amount to the total mark-up between ex-farm or ex-factory prices in the exporting country and consumer prices in the importing country. Mention has already been made of the way in which difficulties in domestic transport raise costs and time in the movement between the port of entry and the final consumer. Inefficiencies and restrictions in wholesaling and retailing have a comparable effect. Competition in these areas can lower costs, including international competition. However, existing policies in many countries impose barriers to entry. Many of the recent cost reductions in distribution have been brought about by large multinational retailers, which take advantage of advances in logistics and computerized product tracking. Market access and national treatment for such firms is often resisted because of the possible exit of smaller “mom-and-pop” retailers, or of concerns that global retailers threaten to undermine the preservation of national culture. Existing restrictions on retailing have a substantial impact on the marketplace. For a sample of twelve mostly developed countries, a reduction in the restrictiveness of retail policies to the mean level is associated with an increase of US $75 billion in sales (about 35 per cent) of foreign-owned retailing affiliates, of which over US $60 billion would be in Italy and France (Reisman and Vu, 2012.) One modeling exercise
Global value chains in a changing world
274
focusing on FDI suggests that liberalization of multi-brand retailing in India would lead to substantial increases in foreign presence without necessarily reducing the output of domestically-owned retailers, especially if the presence of foreign retailers leads to productivity spillovers to the domestic distribution sectors and to upstream suppliers such as farmers (Lakatos and Fukui, 2012).
11.8. Summary and lessons for policy
The types of policies that may reduce costs, time and uncertainty along the supply chain are diverse both in terms of the level of policymaking involved and their costs. Some measures, such as improving bad feeder roads in developing countries, may be expensive and involve national or local resources. Measures to improve customs can be undertaken unilaterally and may not be too expensive but can be facilitated by technical assistance. Trucking deregulation can also be achieved unilaterally, perhaps at the stroke of a pen. Improving market access in logistics, express delivery, telecommunications and retailing can be a matter of negotiation or of unilateral action. Reforming the ways in which international shipping rates are set may be both international in scope and involve innovation in policy. Limiting the negative trade impact of regulatory NTMs may involve difficult negotiations.
After reviewing the evidence, it appears that the North-South divide over how trade facilitation should be approached is based at least in part on empirical features of the actual trading world. The absolute gains from improving transport and communications are probably very large and comprise a substantial component of the overall gains from national economic development, including in the domestic economy. At the same time, the reduction in trade costs per dollar might be largest for “soft” reforms such as customs modernization. This does not mean that action in either “hard” or “soft” areas of trade facilitation needs to be postponed because the other is seen as a higher priority. Further quantitative research can help with setting priorities. It is also useful to recognize that there are interaction effects between reforms at different stages of the supply chain, so that a “soft” reform may help address a “hard” problem and vice versa. The intimate relationship between “hard” port reform and “soft” customs reform is a good example of this.
Reducing trade costs is, on the whole, a win-win proposition. This should not blind us to the fact that in a number of cases, political economy issues may need to be overcome before progress can be made in reducing trade costs. There are obvious beneficiaries from barriers to entry in trucking, shipping and retailing. There are
Policies to improve the supply chain: what needs to be done?
275
also rent-seeking gains from corruption in customs and in the operation of ports. Similarly, there may be rents to be earned from regulatory NTMs that are designed, intentionally or otherwise, to have a trade-reducing effect unnecessary to achieve the safety, health, or environmental benefits intended to be secured by regulation.
In any reform process, the easy steps are taken first, leaving the tough ones for later. The difficult steps often involve questions of rent-seeking and political economy. In the case of tariff liberalization, historical experience has revealed where the “big dead bodies” of rent-seeking lie, most notably in agriculture and textiles and apparel. As supply chains continue to improve, we will discover by future historical experience what the tough nuts are to crack. Some of these may be purely technical challenges, such as the projected trans-African highway system, but others are likely to lie in the areas where established interests that benefit from high trade costs are most predominant.
Endnotes
1 The author is Lead International Economist, U.S. International Trade Commission. This paper reflects solely the views of the author and is not meant to represent the views of the U.S. International Trade Commission or any of its Commissioners.
2 See http://www.povertyactionlab.org/about-j-pal for examples.
References
Angrist, J.D.; Pischke, J-S. 2009. “Mostly Harmless Econometrics: An Empiricist’s Companion”, (Princeton, New Jersey: Princeton University Press).
Arvis, J-F.; Raballand, G.;Marteau, J.F. 2012. “The Cost of Being Landlocked: Logistics Costs and Supply Chain Reliability”, (Washington, DC, World Bank).
Arvis, J-F.; Shepherd, B. 2011. “The Air Connectivity Index: Measuring Integration in the Global Air Transport Network,” World Bank Policy Research Working Paper No. 5722 (Washington, DC, World Bank).
Basu, S. R.; Kuwahara, H.; Dumesnil, F. 2012. “Evolution of Non-Tariff Measures: Emerging Cases From Selected Developing Countries” UNCTAD Policy Issues in International Trade and Commodities Study Series No. 52 (United Nations: New York and Geneva).
Brenton, P.; Sheehy, J.; Vancautern, M. 2000. “Technical Barriers to Trade in the European Union: Importance for Accession Countries,” CEPS Working Document No. 144, April. (Brussels, Belgium, Centre for European Policy Studies).
Global value chains in a changing world
276
Clark, X.; Dollar, D.; Micco, A. 2004. “Port Efficiency, Maritime Transport Costs, and Bilateral Trade,” in Journal of Development Economics Vol. 75(2): 417–460.
Christ, N.; Ferrantino, M.J. 2011. “Land Transport for Export: The Effects of Cost, Time, and Uncertainty in Sub-Saharan Africa,” in World Development Vol. 39(10): 1760–1770.
Ferrantino, M. J. 2006. “Quantifying the Trade and Economic Effects of Non-Tariff Measures,” OECD Trade Policy Working Paper No. 28 (Paris, France, OECD).
Ferrantino, M. J. 2012. “Using Supply-Chain Analysis to Analyse the Costs of NTMs and the Benefits of Trade Facilitation,” World Trade Organization Working Paper ERSD 2012–02 (Geneva, Switzerland, World Trade Organization).
Fink, C.; Mattoo, A.; Neagu, I.C. 2002. “Trade in International Maritime Services: How Much Does Policy Matter?” in World Bank Economic Review 16(1): 81–108.
Hummels, D.; Schaur, G. 2012. “Time as a Trade Barrier,” NBER Working Paper No. 17758 (Cambridge MA, National Bureau of Economic Research).
Johnson, C. 2009. “The Role of Good Regulatory Practice in Reducing Technical Barriers to Trade.” U.S. International Trade Commission Office of Industries Working Paper No. ID–24. (Washington, DC, USITC).
Lakatos, C.; Fukui, T. 2012. “Liberalization of FDI in Retail Services: A Fast Death Instrument for India?” Paper presented at the GTAP 15th Annual Conference on Global Economic Analysis, Geneva, Switzerland, June 2012.
Londoño-Kent,; Del Pilar, M.; Kent, P. 2003. “A Tale of Two Ports: The Cost of Inefficiency,” research report submitted to the Office of the Chief Economist for Latin America and the Caribbean, December. (Washington, DC, World Bank).
Maskus, K. E.; Otsuki, T.; Wilson, J.S. 2005. “The Cost of Compliance with Product Standards for Firms in Developing Countries: An Econometric Study,” World Bank Policy Research Working Paper 3590 (Washington DC, World Bank).
Manzi, Jim, 2012. “Uncontrolled: The Surprising Payoff of Trial-and-Error for Business, Politics and Society.” (New York: Basic Books).
Micco, A.; Servrisky, T. 2004. “Infrastructure, Competition Regime and Air Transport Costs: Cross-country Evidence”, World Bank Research Working Paper 3355 (Washington DC, World Bank).
Moisé, E.; Orhac, T.; Minor, P. 2011. “Trade Facilitation Indicators: The Impact of Trade Costs “OECD Working Paper N° 118 (OECD, Paris).
Policies to improve the supply chain: what needs to be done?
277
Mokyr, J. 2010. “The Enlightened Economy: An Economic History of Britain 1700–1850.” (New Haven, Yale University Press).
Reisman, M.; Vu, D. 2012. “Nontariff Measures in the Global Retailing Industry,” U.S. International Trade Commission Office of Industries Working Paper No. ID-30 (Washington, DC: USITC).
UNCTAD. 2010. “Non-Tariff Measures: Evidence from Selected Developing Countries and Future Research Agenda”. Study. (New York and Geneva: United Nations). Available at: http://www.unctad.org/en/docs/ditctab20093_en.pdf
USITC. 1994. “1992: Implementing the European Community Single Market: Sixth Follow-up Report”. USITC Publication 2723 (Washington DC, United States International Trade Commission).
USITC. 2009. “India: Effects of Tariffs and Nontariff Measures on U.S. Agricultural Exports”. USITC Publication 4107 (Washington DC, United States International Trade Commission).
Washington Trade Daily. 2012. “LDCs and Trade Facilitation,” Vol. 21 no. 233, (Washington DC, Trade Reports International Group).
Wilson, J. S.; Mann, C.L.; Otsuki, T. 2005. “Assessing the Benefits of Trade Facilitation: A Global Perspective” in The World Economy 28 (6): 841–871.
World Bank. 2013. “Doing Business 2013: Smarter Regulations for Small and Medium-Sized Enterprises”. (Washington, DC, World Bank).
World Economic Forum. 2013. “Enabling Trade: Valuing Growth Opportunities”. In collaboration with Bain & Company and the World Bank. (Geneva, Switzerland,World Economic Forum). Available at: http://www3.weforum.org/docs/WEF_SCT_EnablingTrade_Report_2013.pdf
Zhai, F. 2010. “The Benefits of Regional Infrastructure Investment in Asia: A Quantitative Exploration.” ADBI Working Paper Series No. 223, (Tokyo, Japan, Asian Development Bank Institute).

279
12 Can SMEs participate in global production networks?
Evidence from ASEAN firms
Ganeshan Wignaraja
12.1. Introduction
This paper examines factors influencing the participation of small and medium enterprises (SMEs) in the Association of Southeast Asian Nations (ASEAN) economies in global production networks. SMEs – which are seen as the backbone of employment and poverty reduction in ASEAN economies – have returned to the spotlight with expanding global production networks in East Asia. Greater SME participation in global production networks through closer linkages with multinational corporations (MNCs) and direct exports can be a potent means of accelerating technology transfer, spillovers and economic development (Hobday, 2001; Lim and Kimura, 2010). Facing a fragile world growth outlook, the ASEAN and East Asia Summits in 2011 have emphasized SMEs as a vehicle for increasing intra-regional trade, rebalancing towards domestic and regional demand and inclusive growth in Asia.1
A sizable body of research has analysed production fragmentation and economic implications. Two alternative approaches have been used to quantify the magnitude of trade occurring within global production networks. The first uses national trade data obtained from the UN trade data reporting system to identify trade in parts and components (Ng and Yeats, 2003; Athukorala, 2011). It suggests that East Asia’s trade is increasingly made up of parts’ and components’ trade which suggests that global production networks are growing in importance. The second approach – relying on input output tables to trace value added in production networks – suggests that value added seems a more accurate means of capturing production network activity than trade data (Koopman et al., 2010; WTO-IDE-JETRO, 2011). Neither approach, however, sheds light on the links between firm size and the region’s production
Global value chains in a changing world
280
networks. Case studies show that large MNCs, which use the region as an international production base, drive the process of production fragmentation (Kuroiwa and Heng, 2008; Kuroiwa, 2009).
Research on the contribution of SMEs in ASEAN economies to global production networks is scarce and sometimes contentious, often due to different definitions used and timeliness. Studies show that SMEs account for the majority of firms and half of the employment in ASEAN economies (Harvie and Lee, 2002).2 Yet concerns exist that the internationalization of SMEs remains an emerging trend (Harvie, 2010; Tranh et al., 2010). The SMEs in ASEAN economies seem to make little contribution to international trade relative to the sector’s size or employment contribution (Harvie and Lee, 2002). It is possible that the average SME’s export share in ASEAN economies may be understated if indirect exports through subcontracting or input supply are included (Tambunan, 2009). Furthermore, Malaysia, Singapore and Viet Nam are notable for having higher SME export shares than others. Nonetheless, with SMEs in more advanced East Asian newly-industrialized economies (NIEs) such as Chinese Taipei and China contributing more to exports, room exists for the advancement of SMEs in ASEAN economies’ trade through global production networks. Multiple market failures are said to exist in relation to SME development and local entrepreneurship which may be mitigated by appropriate policies (Tambunan, 2009; Lim and Kimura, 2010).
There are few firm-level econometric studies (covering production networks or exporting) in ASEAN economies (see Table 12.1 for a summary of results) and it is difficult to draw general conclusions for three reasons. First, the coverage of countries and sectors is somewhat limited in these studies. Typically, studies have looked at a single country and a specific sector within manufacturing (such as electronics). There are a couple of multi-country, multi-sector studies (Harvie et al., 2010; Wignaraja, 2011) and one multi-country single sector study (Rasiah, 2004). Second, most work is based on small samples of enterprises. With the notable exception of Van Dijk (2002), nearly all the studies have fewer than 1,000 firms and two draw on fewer than 200 observations. It is difficult to generalize the findings from small sample studies. Third, there is insufficient comparative firm-level analysis. Although a couple of studies deal exclusively with SMEs in production networks (Harvie et al., 2010; Rasiah et al., 2010), none compare the behaviour of SME exporters with large firms or SME exporters with indirect SME exporters.
The paper undertakes two kinds of analysis of factors affecting the participation of SMEs in ASEAN economies in global production networks (hereafter production
Can SMEs participate in global production networks?
281
networks). The main focus of the research is an econometric analysis of firm-level factors affecting participation in production networks drawing on recent empirical literature on international trade, industrial organization and technology. Highlighting the notion of heterogeneity of firms in international trade, this literature points to certain firm-level characteristics (such as size, skills and technological capabilities) as shaping firm-level participation in production networks. As the overall business environment impinges upon SME participation in production networks, the research also explores selected policy influences including a ranking by SMEs of the main obstacles to conducting business in ASEAN economies as well as SME perceptions of business and support services.
The econometric analysis attempts to remedy gaps in existing firm-level studies. It covers five ASEAN economies (Malaysia, Thailand, Indonesia, Philippines and Viet Nam) and a wide range of industrial sectors. Second, the data set used here is a large one from the World Bank comprising 5,900 manufacturing enterprises (including 70 per cent SMEs), which were randomly selected using a comprehensive questionnaire. Third, the analysis is based on two alternative econometric models, one for all firms in production networks (direct and indirect exporters) and one for sustained exporters only. Each model was estimated separately for SMEs and all manufacturing firms. In line with the standard Organization for Economic Co-operation and Development (OECD) definition, SMEs are defined here as enterprises with fewer than 100 employees (OECD, 1997). To the best of our knowledge, this is the most comprehensive analysis of its kind attempted for ASEAN economies.
For convenience, internationalization of SMEs in relation to production networks can be defined in terms of three types of activities (OECD, 1997; Hollenstein, 2005): direct exporting or importing (which is usually the most frequent type of international activity); indirect exporting as subcontractors to large firms or input suppliers (which is somewhat common); and foreign direct investment (FDI) in overseas locations by SMEs (which is more risky than home market production or trade). This research looks only at the direct and indirect exporting behaviour in SMEs in ASEAN economies due to a lack of data on FDI by SMEs.
Section two reviews the literature. Section three sets out the empirical methodology. Section four describes the data set and provides data on SMEs engagement in production networks. Section five presents t-test and econometric results. Section six explores selected policy influences on enterprises. Section seven concludes.
Global value chains in a changing world
282
12.2. Literature review
An established body of trade, industrial organization, and technology literature points to the overwhelming importance of firm-specific factors, on which competitive advantages are built. As background to this study of the role of SMEs in production networks, key aspects of the theoretical and empirical literature are discussed here.
Theory
Four main strands of theory can explain trade and production network activity of firms, which is the focus of this paper. The neo-Hecksher-Ohlin model and Vernon’s concept of the product cycle provided the early rationale for studies highlighting the importance of firm-specific advantages (such as differences in skills, technologies and tastes) in the operation of industry-level determinants of comparative advantage (Lall, 1986; Wilmore, 1992; Wakelin, 1998).
The fragmentation of production approach — found in seminal works by Jones and Kierzkowski (1990) and Arndt and Kierzkowski (2001) — refined these insights. It showed how increasing returns and the advantages of specialization of factors within firms encouraged the location of different stages of production across geographical space connected by service links. Products traded between firms in different countries are components rather than final goods.
Furthermore, the “new new” trade theory of Melitz (2003) and Helpman et al., (2004) emphasized firm heterogeneity in international trade (that firms are considered different in terms of efficiency and fixed and variable costs when involved in trade). Accordingly, only a few highly efficient firms are able to export and invest overseas as they are able to make sufficient profit to cover the large trade costs required for overseas operations.
Finally, the technological capability and national innovation systems approach reveals a different channel through which firm behaviour affects export performance. Focusing on innovation and learning processes in developing countries, proponents emphasize the acquisition of technological capabilities as a major source of export advantage at firm level (Bell and Pavitt, 1993; Lall, 1992; Iammarino et al., 2008). The underlying evolutionary theory of technical change emphasizes that difficult firm-specific processes and complex interactions with institutions are needed to absorb imported technologies efficiently (Nelson and Winter, 1982).
Can SMEs participate in global production networks?
283
Implicit in most of the above theories is the notion that SMEs are at a disadvantage in participation in production networks compared with large firms. The SMEs face, to a higher extent than large firms, resource constraints (in terms of finance, information, management capacity, and technological capability).3 In addition, SMEs suffer disproportionately from external barriers like market imperfections and regulations. Accordingly, the probability of SMEs joining production networks (as direct exporters, indirect exporters, or overseas investors) is lower than that of large firms. Furthermore, justification exists for public policies to support the entry of SMEs in production networks. In the main, such support should be geared to an enabling environment that opens access to markets, reduces bureaucratic impediments against SMEs and provides appropriate SME institutional support services (for example, technological, marketing and financial support).
Empirical studies and hypotheses
The relationship between firm size and exports at enterprise level has attracted considerable interest in a growing econometric literature (Kumar and Siddharthan, 1994; Zhao and Li, 1997; Wignaraja, 2002; Srinivasan and Archana, 2011). There have also been econometric studies of SMEs and exports (Lefebvre and Lefebvre, 2001). A very few recent econometric studies have begun to explicitly look at the link between SMEs and production networks (Harvie et al., 2010; Kyophilavong, 2010; Rasiah et al., 2010). Several studies report that the characteristics of firms vary widely within industries. Firms which are involved in exports or production networks are larger, more efficient, and have higher levels of skills than other firms. Relevant studies will be discussed below in order to formulate hypotheses for empirical testing in this paper.
Firm size. Most studies are based on the conventional assumption that large firms are more competitive than SMEs in international markets (Zhao and Li, 1997; Van Dijk, 2002; Srinivasan and Archana, 2011). A positive relationship between size and exports is thus reported. Similar arguments can be made about participation in production networks through direct and indirect exporting. Owing to scale economies, larger firms may have lower average and marginal costs, which would increase the probability of participation in production networks. Furthermore, large firms have more resources to meet the fixed costs of entry into production networks (like information, marketing and technology expenses). A few studies, however, report no relationship or a negative one. This conflicting result can be partly attributed to the non-linear nature of this relationship (Kumar and Siddarthan, 1994; Lefebvre and Lefebvre, 2001). It may be that economies of scale and fixed
Global value chains in a changing world
284
costs are significant in the early stages of joining production networks but less relevant in the longer term. For instance, SMEs may join together in industrial clusters and collectively overcome the disadvantage of firm size. Alternatively, some SMEs might concentrate on niche markets and emerge as leading enterprises. As a result of the above discussion, the following hypothesis is proposed. Hypothesis one — firm size is expected to have a positive effect on participation in production networks up to a given threshold but may not matter later on.
Foreign ownership. A joint venture with a foreign partner (or 100 per cent foreign equity) facilitates participation in production networks, as it enables SMEs to reap the ownership advantages of parent companies (Wilmore, 1992; Nguyen and Nishijima, 2009; Srinivasan and Archana, 2011). First, access to the superior marketing connections and know-how of parents enables direct and indirect exporting. Second, access to parents’ accumulated learning experience of export production as well as access to sophisticated technologies and management experience improves technical efficiency. The transfer of such ownership-specific advantages depends on whether the foreign firm has a controlling interest in the domestic venture. A controlling interest typically can occur with minority foreign equity in a project rather than total foreign equity. In most of the previous literature on firm-level exporting and participation in production networks, it has been consistently observed that foreign ownership matters. These arguments lead to the following proposition. Hypothesis two — foreign ownership is positively related to participation in production networks because it provides access to superior marketing, technology, and management expertise.
Human capital. Within a given activity, a higher level of human capital contributes to a firm’s export performance. Higher levels of human capital are generally linked with the development of more effective business strategies and more rapid technological learning that can provide a competitive edge at enterprise level (Van Dijk, 2002; Dueñas-Caparas, 2006). Those SMEs with a stock of high-quality human capital are expected to be more likely to engage and perform well in production networks as this is essential for forging close supplier relationships with large exporters, effective technology transfer and efficient production of orders (Harvie et al., 2010). Although human capital at all levels is important, workers’ education and the chief executive officer (CEO)’s education and experience are particularly significant for SMEs involved in production networks. A literate workforce made up of high school graduates is more productive and adaptive to new technology than one that is not. Furthermore, a CEO with a college degree or vocational training as well as work experience may have a better business attitude (in terms of risk taking or willingness
Can SMEs participate in global production networks?
285
to implement new business ideas). In very small firms, with few high school-educated workers, much of the firm’s human capital may be reflected in the quality of the CEO’s education and experience. Accordingly, hypothesis three proposes that higher levels of human capital — in terms of secondary level educated workers or well-educated and experienced CEOs — are positively related to participation in production networks.
Technological capabilities. Previous empirical studies indicate that firm-level technological capabilities contribute to export performance (Zhao and Li, 1997; Hobday, 2001; Rasiah, 2004; Wignaraja, 2002 and 2011). Building technological capabilities in developing country firms, particularly SMEs, is not just a simple function of the number of years of production experience. Rather, it requires conscious investments in creating skills and information to operate imported technology efficiently. Such investments involve a spectrum of technological activities such as technology search, quality management, engineering and R&D activities (Kumar and Siddarthan, 1994; Lefebvre and Lefebvre, 2001). Importing technology through foreign licenses is an important mechanism for transfer of new technologies and internal capability building. Furthermore, foreign buyers and subcontractors view internal quality standards (like the International Organization for Standardization, or ISO certification) as increasingly compulsory for SMEs to qualify as potential suppliers. Developing new products (or modifying existing products) and taking out patents to protect intellectual property rights also facilitate export competitiveness in SMEs. These considerations suggest hypothesis four — SMEs that have acquired high levels of technological capabilities are more likely to succeed in production networks.
Age. The older the firm, the more accumulated experience in production and tacit knowledge, which is likely to facilitate participation in production networks. Alternatively, mature firms may become complacent with an overreliance on accumulated experience and “set in the past” ways. Meanwhile, younger firms may be at an advantage in joining production networks for two reasons. First, younger enterprises may use relatively modern technology, which increases productivity and product quality (Van Dijk, 2002). Second, they may be more proactive in learning about business and technological opportunities in production networks. For instance, younger firms may be more nimble in seeking out new sources of information and external knowledge such as market information from buyers of output or technical know-how from equipment suppliers. Younger firms may be more flexible in combining external and internal information to realize opportunities in production networks. Bearing in mind these different possibilities, hypothesis five is put forward — firm age needs to be controlled when looking relationships between factors affecting firm-level participation in production networks.
Global value chains in a changing world
286
Access to credit. Access to credit for working capital and investment is typically a binding constraint on SMEs involvement in production networks (Harvie et al., 2010). Capital markets in developing countries are highly segmented into a formal bank sector and informal sources due to various market imperfections associated with underdevelopment. Credit from commercial banks is usually cheaper than finance from informal credit sources but requires substantial information about balance sheets and collateral. Many SMEs find it difficult to provide the requisite financial information and collateral and instead rely on internally generated funds or more expensive informal sources. This puts them at a cost disadvantage compared to well-organized SMEs with an established record with commercial banks. Thus hypothesis six emerges — SMEs with access to bank credit are more likely to join production networks than other firms.
12.3. Empirical methodology
In order to examine the firm-level characteristics shaping SMEs’ and all manufacturing firms’ participation in production networks, the following general equation is estimated:
Y = βX + ε, (1)
where Y is the vector denoting participation in production networks at the firm level, X is the matrix of explanatory variables, β is the matrix of coefficients, and e is the matrix of error terms.
Participation in production networks is captured by a binary variable reflecting different activities by firms in such networks, particularly SMEs. The probit model in two alternative forms was used here. In the first, the dependent variable takes a value of 1 if a firm undertakes any form of activity in a production network (as an exporter, an indirect exporter or some combination of the two) and 0 for a wholly domestic-market oriented firm. In the second, the dependent variable is 1 if the firm’s primary mission is to export (defined as more than total sales being exported globally) and 0 otherwise. The first captures all involvement of firms in production networks regardless of the intensity of exporting or indirect exporting behaviour of a given firm. While this definition is inclusive, it encompasses a range of participation in production networks from occasional and limited involvement of firms to more sustained involvement. Accordingly, the second was formulated to represent a more focused mission of sustained involvement in production networks through exports. It is interesting to examine whether the determinants are the same for both models. Our approach refines previous work which did not distinguish between different activities undertaken by SMEs in production networks. For instance, Harvie et al., (2010) simply define SME
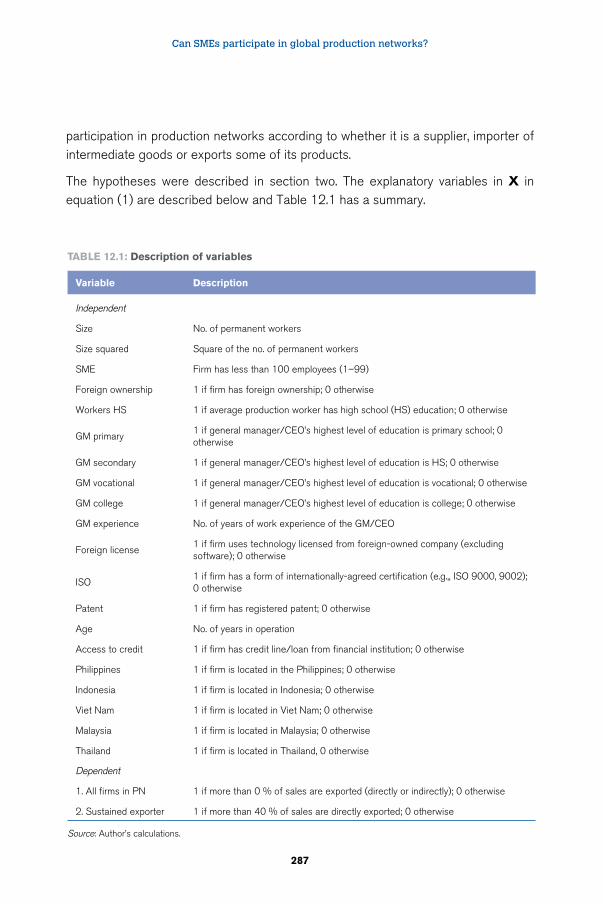
Can SMEs participate in global production networks?
287
participation in production networks according to whether it is a supplier, importer of intermediate goods or exports some of its products.
The hypotheses were described in section two. The explanatory variables in X in equation (1) are described below and Table 12.1 has a summary.
TAble 12.1: Description of variables
Variable Description
Independent
Size No. of permanent workers
Size squared Square of the no. of permanent workers
SME Firm has less than 100 employees (1–99)
Foreign ownership 1 if firm has foreign ownership; 0 otherwise
Workers HS 1 if average production worker has high school (HS) education; 0 otherwise
GM primary1 if general manager/CEO’s highest level of education is primary school; 0 otherwise
GM secondary 1 if general manager/CEO’s highest level of education is HS; 0 otherwise
GM vocational 1 if general manager/CEO’s highest level of education is vocational; 0 otherwise
GM college 1 if general manager/CEO’s highest level of education is college; 0 otherwise
GM experience No. of years of work experience of the GM/CEO
Foreign license1 if firm uses technology licensed from foreign-owned company (excluding software); 0 otherwise
ISO1 if firm has a form of internationally-agreed certification (e.g.,, ISO 9000, 9002); 0 otherwise
Patent 1 if firm has registered patent; 0 otherwise
Age No. of years in operation
Access to credit 1 if firm has credit line/loan from financial institution; 0 otherwise
Philippines 1 if firm is located in the Philippines; 0 otherwise
Indonesia 1 if firm is located in Indonesia; 0 otherwise
Viet Nam 1 if firm is located in Viet Nam; 0 otherwise
Malaysia 1 if firm is located in Malaysia; 0 otherwise
Thailand 1 if firm is located in Thailand, 0 otherwise
Dependent
1. All firms in PN 1 if more than 0 % of sales are exported (directly or indirectly); 0 otherwise
2. Sustained exporter 1 if more than 40 % of sales are directly exported; 0 otherwise
Source: Author’s calculations.
Global value chains in a changing world
288
Firm size is represented by the number of employees. This is commonly used in empirical work as other measures like value added or output are more susceptible to variations in macroeconomic conditions. To provide additional insights, a size-squared variable was also added to some of the models.
Foreign ownership is captured by a dummy variable which takes a value of 1 if the firm has any foreign equity. The standard measure — share of foreign equity — seems to suffer from some noise and may be correlated with number of employees.
Human capital is proxied by the following variables: (i) a dummy variable which is 1 if the average production worker has high school education; (ii) four dummy variables to capture different levels of educational attainment of the Chief Executive Officer (CEO) from primary schooling to college education; and (iii) the number of years of work experience of the CEO. In line with the hypothesis on human capital, these variables attempt to capture the average quality of education of workers and the CEO. In addition, the CEO’s experience is included. Most unfortunately, data was not available from the World Bank surveys on the share of engineers and technicians in employment to capture technical-level skills.
Technological capabilities are represented by several variables: (i) a dummy variable which is 1 when a firm has a technology license; (ii) a dummy variable which is 1 when a firm has a form of internationally agreed quality certification (such as ISO 9000 or 9002); and (iii) a dummy variable which is 1 when a firm has registered a patent. Technological capabilities are hard to measure and empirical work has either used aspects of technological activity (quality certification, patents, etc.) or a composite index of technological capability made up of different technical functions performed by enterprises to assimilate imported technologies. The chosen variables were the only technology variables included in the data set for Philippines, Indonesia and Viet Nam. Accordingly, these were included and a composite index could not be constructed.
Age is represented by the number years in operation of the firm. This is more accurate than number of years since establishment as there can be a lag between the legal incorporation of a firm and the start-up of plant operations.
Access to credit is proxied by a dummy variable which is 1 if a firm has a credit line or loan from a formal financial institution.
In addition, four country dummy variables were included to capture country-specific effects of the five ASEAN countries.
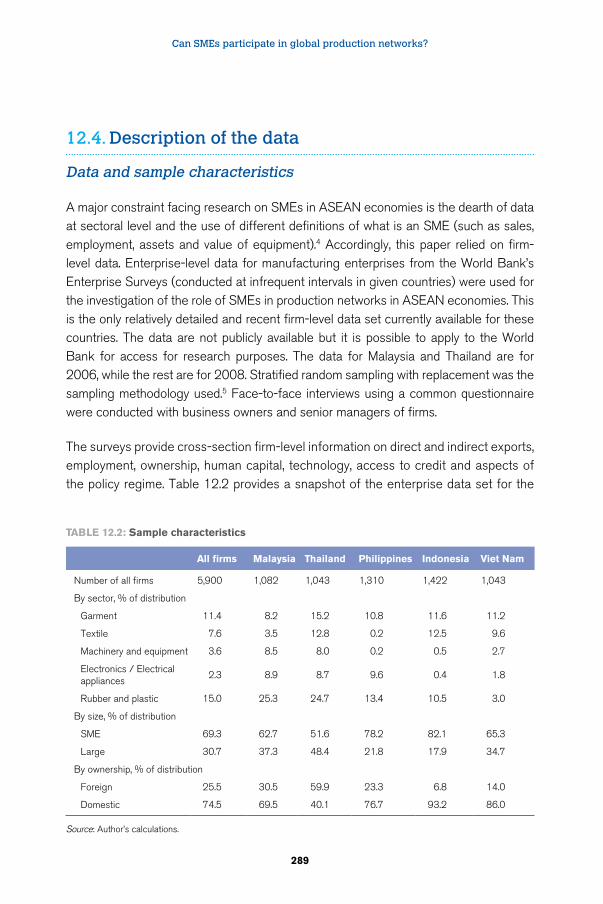
Can SMEs participate in global production networks?
289
12.4. Description of the data
Data and sample characteristics
A major constraint facing research on SMEs in ASEAN economies is the dearth of data at sectoral level and the use of different definitions of what is an SME (such as sales, employment, assets and value of equipment).4 Accordingly, this paper relied on firm-level data. Enterprise-level data for manufacturing enterprises from the World Bank’s Enterprise Surveys (conducted at infrequent intervals in given countries) were used for the investigation of the role of SMEs in production networks in ASEAN economies. This is the only relatively detailed and recent firm-level data set currently available for these countries. The data are not publicly available but it is possible to apply to the World Bank for access for research purposes. The data for Malaysia and Thailand are for 2006, while the rest are for 2008. Stratified random sampling with replacement was the sampling methodology used.5 Face-to-face interviews using a common questionnaire were conducted with business owners and senior managers of firms.
The surveys provide cross-section firm-level information on direct and indirect exports, employment, ownership, human capital, technology, access to credit and aspects of the policy regime. Table 12.2 provides a snapshot of the enterprise data set for the
TAble 12.2: Sample characteristics
All firms Malaysia Thailand Philippines Indonesia Viet Nam
Number of all firms 5,900 1,082 1,043 1,310 1,422 1,043
By sector, % of distribution
Garment 11.4 8.2 15.2 10.8 11.6 11.2
Textile 7.6 3.5 12.8 0.2 12.5 9.6
Machinery and equipment 3.6 8.5 8.0 0.2 0.5 2.7
Electronics / Electrical appliances
2.3 8.9 8.7 9.6 0.4 1.8
Rubber and plastic 15.0 25.3 24.7 13.4 10.5 3.0
By size, % of distribution
SME 69.3 62.7 51.6 78.2 82.1 65.3
Large 30.7 37.3 48.4 21.8 17.9 34.7
By ownership, % of distribution
Foreign 25.5 30.5 59.9 23.3 6.8 14.0
Domestic 74.5 69.5 40.1 76.7 93.2 86.0
Source: Author’s calculations.
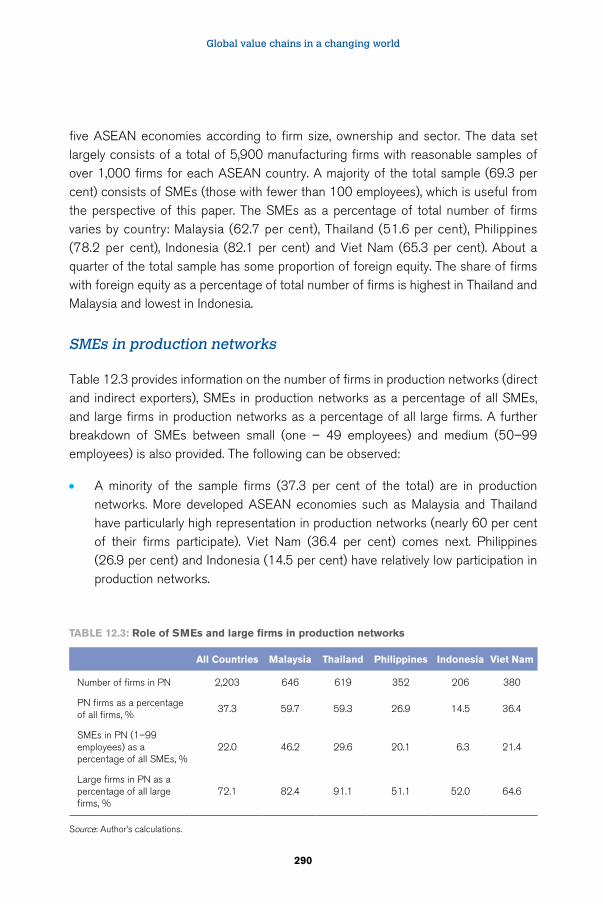
Global value chains in a changing world
290
five ASEAN economies according to firm size, ownership and sector. The data set largely consists of a total of 5,900 manufacturing firms with reasonable samples of over 1,000 firms for each ASEAN country. A majority of the total sample (69.3 per cent) consists of SMEs (those with fewer than 100 employees), which is useful from the perspective of this paper. The SMEs as a percentage of total number of firms varies by country: Malaysia (62.7 per cent), Thailand (51.6 per cent), Philippines (78.2 per cent), Indonesia (82.1 per cent) and Viet Nam (65.3 per cent). About a quarter of the total sample has some proportion of foreign equity. The share of firms with foreign equity as a percentage of total number of firms is highest in Thailand and Malaysia and lowest in Indonesia.
SMEs in production networks
Table 12.3 provides information on the number of firms in production networks (direct and indirect exporters), SMEs in production networks as a percentage of all SMEs, and large firms in production networks as a percentage of all large firms. A further breakdown of SMEs between small (one – 49 employees) and medium (50–99 employees) is also provided. The following can be observed:
• A minority of the sample firms (37.3 per cent of the total) are in production networks. More developed ASEAN economies such as Malaysia and Thailand have particularly high representation in production networks (nearly 60 per cent of their firms participate). Viet Nam (36.4 per cent) comes next. Philippines (26.9 per cent) and Indonesia (14.5 per cent) have relatively low participation in production networks.
TAble 12.3: Role of SMes and large firms in production networks
All Countries Malaysia Thailand Philippines Indonesia Viet Nam
Number of firms in PN 2,203 646 619 352 206 380
PN firms as a percentage of all firms, %
37.3 59.7 59.3 26.9 14.5 36.4
SMEs in PN (1–99 employees) as a percentage of all SMEs, %
22.0 46.2 29.6 20.1 6.3 21.4
Large firms in PN as a percentage of all large firms, %
72.1 82.4 91.1 51.1 52.0 64.6
Source: Author’s calculations.
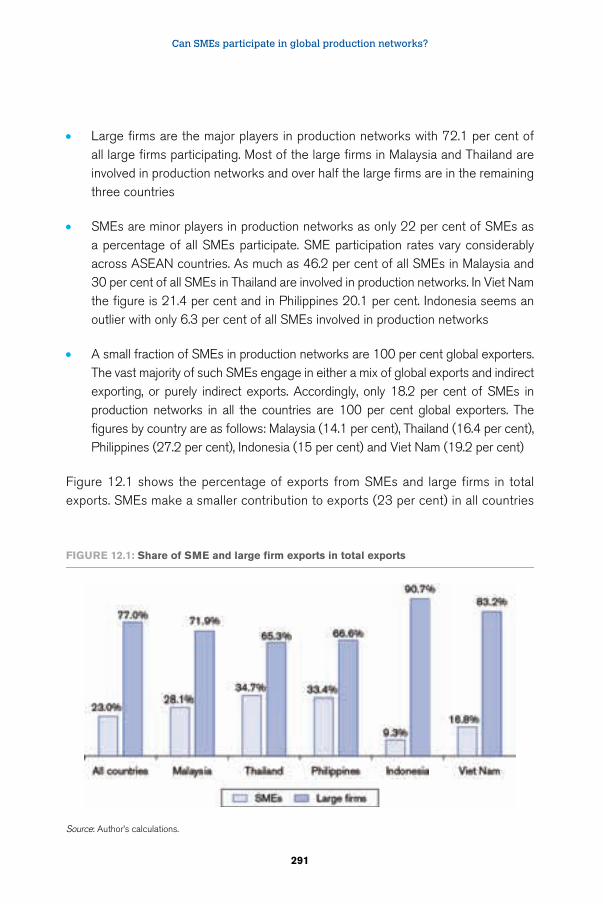
Can SMEs participate in global production networks?
291
• Large firms are the major players in production networks with 72.1 per cent of all large firms participating. Most of the large firms in Malaysia and Thailand are involved in production networks and over half the large firms are in the remaining three countries
• SMEs are minor players in production networks as only 22 per cent of SMEs as a percentage of all SMEs participate. SME participation rates vary considerably across ASEAN countries. As much as 46.2 per cent of all SMEs in Malaysia and 30 per cent of all SMEs in Thailand are involved in production networks. In Viet Nam the figure is 21.4 per cent and in Philippines 20.1 per cent. Indonesia seems an outlier with only 6.3 per cent of all SMEs involved in production networks
• A small fraction of SMEs in production networks are 100 per cent global exporters. The vast majority of such SMEs engage in either a mix of global exports and indirect exporting, or purely indirect exports. Accordingly, only 18.2 per cent of SMEs in production networks in all the countries are 100 per cent global exporters. The figures by country are as follows: Malaysia (14.1 per cent), Thailand (16.4 per cent), Philippines (27.2 per cent), Indonesia (15 per cent) and Viet Nam (19.2 per cent)
Figure 12.1 shows the percentage of exports from SMEs and large firms in total exports. SMEs make a smaller contribution to exports (23 per cent) in all countries
FIguRe 12.1: Share of SMe and large firm exports in total exports
Source: Author’s calculations.
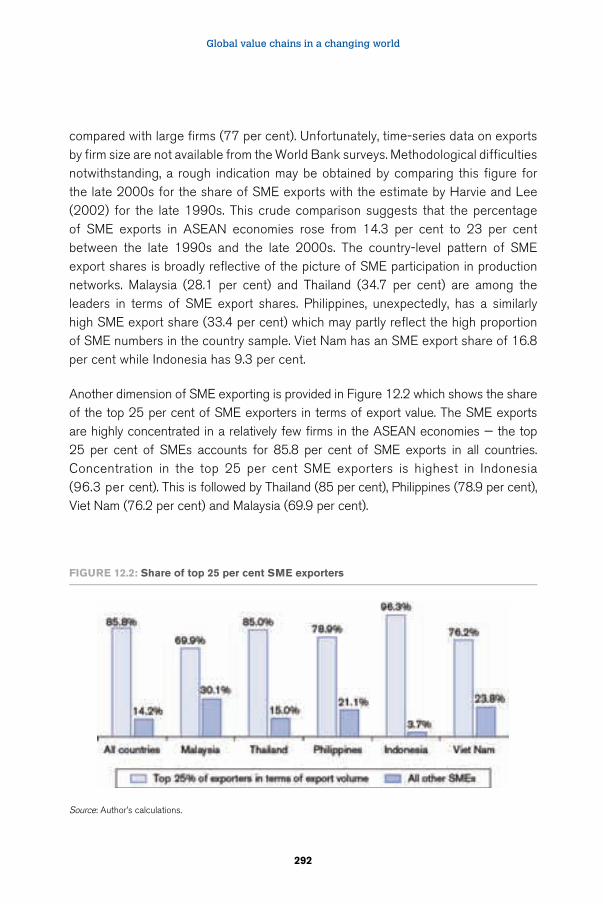
Global value chains in a changing world
292
compared with large firms (77 per cent). Unfortunately, time-series data on exports by firm size are not available from the World Bank surveys. Methodological difficulties notwithstanding, a rough indication may be obtained by comparing this figure for the late 2000s for the share of SME exports with the estimate by Harvie and Lee (2002) for the late 1990s. This crude comparison suggests that the percentage of SME exports in ASEAN economies rose from 14.3 per cent to 23 per cent between the late 1990s and the late 2000s. The country-level pattern of SME export shares is broadly reflective of the picture of SME participation in production networks. Malaysia (28.1 per cent) and Thailand (34.7 per cent) are among the leaders in terms of SME export shares. Philippines, unexpectedly, has a similarly high SME export share (33.4 per cent) which may partly reflect the high proportion of SME numbers in the country sample. Viet Nam has an SME export share of 16.8 per cent while Indonesia has 9.3 per cent.
Another dimension of SME exporting is provided in Figure 12.2 which shows the share of the top 25 per cent of SME exporters in terms of export value. The SME exports are highly concentrated in a relatively few firms in the ASEAN economies — the top 25 per cent of SMEs accounts for 85.8 per cent of SME exports in all countries. Concentration in the top 25 per cent SME exporters is highest in Indonesia (96.3 per cent). This is followed by Thailand (85 per cent), Philippines (78.9 per cent), Viet Nam (76.2 per cent) and Malaysia (69.9 per cent).
FIguRe 12.2: Share of top 25 per cent SMe exporters
Source: Author’s calculations.
Can SMEs participate in global production networks?
293
Next, we turn to an analysis of factors influencing SME participation in production networks.
12.5. T-test and econometric results
T-test results
Given the paucity of literature on SMEs in production networks in ASEAN economies, what initial inferences can be drawn about differences between SMEs in production networks and other SMEs (those not in production networks)? Table 12.4 shows the means values of characteristics of SMEs in production networks and other SMEs, along with their T-values. Five findings are noteworthy:
• SMEs in production networks are larger than other SMEs. SMEs in production networks in Malaysia (49.9 employees) are the largest and followed by Viet Nam (46 employees), Indonesia (42 employees), Thailand (41.7 employees), and Philippines (40.3 employees). Meanwhile, other SMEs range from 39.6 employees in Malaysia to 16.5 employees in Indonesia
• Underlining the link between size and foreign equity, there is a significant difference in the share of foreign equity between SMEs in production networks and other SMEs. SMEs in production networks in the Philippines have the highest average foreign equity share, 36.6 per cent, compared with 26.8 per cent in Indonesia, 23 per cent in Malaysia, 20.2 per cent in Thailand and 10.8 per cent in Viet Nam
• There is a significant difference in high school education between SMEs in production networks and other SMEs in all the countries except Malaysia. Likewise, there is a significant difference in internationally agreed quality certification between SMEs in production networks and other SMEs in all the countries
• SMEs in production networks are somewhat younger than other SMEs in three countries, but not significantly so. SMEs in production networks are older than other SMEs in Viet Nam and Indonesia, but the difference is only significant in Viet Nam
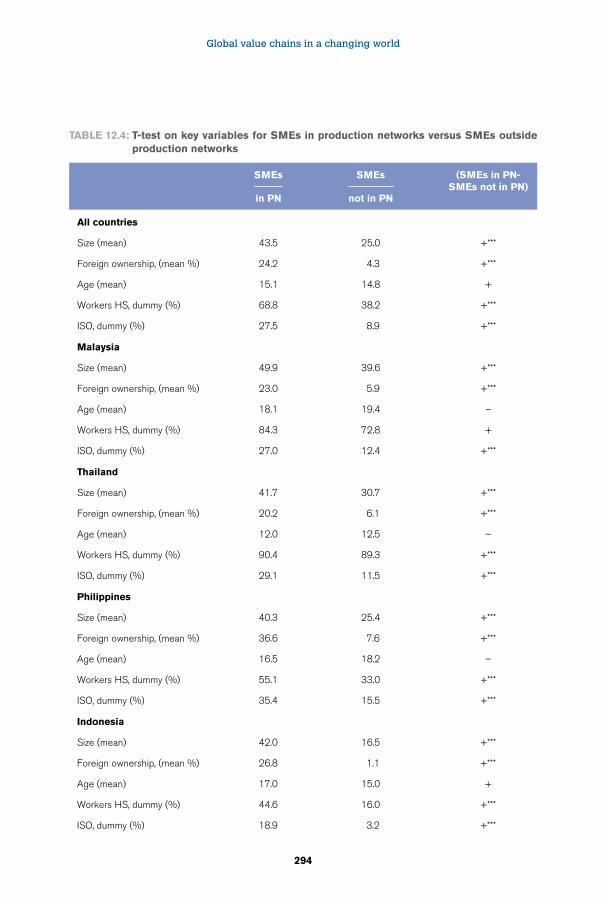
Global value chains in a changing world
294
TAble 12.4: T-test on key variables for SMes in production networks versus SMes outside production networks
SMes SMes (SMes in PN-SMes not in PN)
in PN not in PN
All countries
Size (mean) 43.5 25.0 +***
Foreign ownership, (mean %) 24.2 4.3 +***
Age (mean) 15.1 14.8 +
Workers HS, dummy (%) 68.8 38.2 +***
ISO, dummy (%) 27.5 8.9 +***
Malaysia
Size (mean) 49.9 39.6 +***
Foreign ownership, (mean %) 23.0 5.9 +***
Age (mean) 18.1 19.4 –
Workers HS, dummy (%) 84.3 72.8 +
ISO, dummy (%) 27.0 12.4 +***
Thailand
Size (mean) 41.7 30.7 +***
Foreign ownership, (mean %) 20.2 6.1 +***
Age (mean) 12.0 12.5 –
Workers HS, dummy (%) 90.4 89.3 +***
ISO, dummy (%) 29.1 11.5 +***
Philippines
Size (mean) 40.3 25.4 +***
Foreign ownership, (mean %) 36.6 7.6 +***
Age (mean) 16.5 18.2 –
Workers HS, dummy (%) 55.1 33.0 +***
ISO, dummy (%) 35.4 15.5 +***
Indonesia
Size (mean) 42.0 16.5 +***
Foreign ownership, (mean %) 26.8 1.1 +***
Age (mean) 17.0 15.0 +
Workers HS, dummy (%) 44.6 16.0 +***
ISO, dummy (%) 18.9 3.2 +***
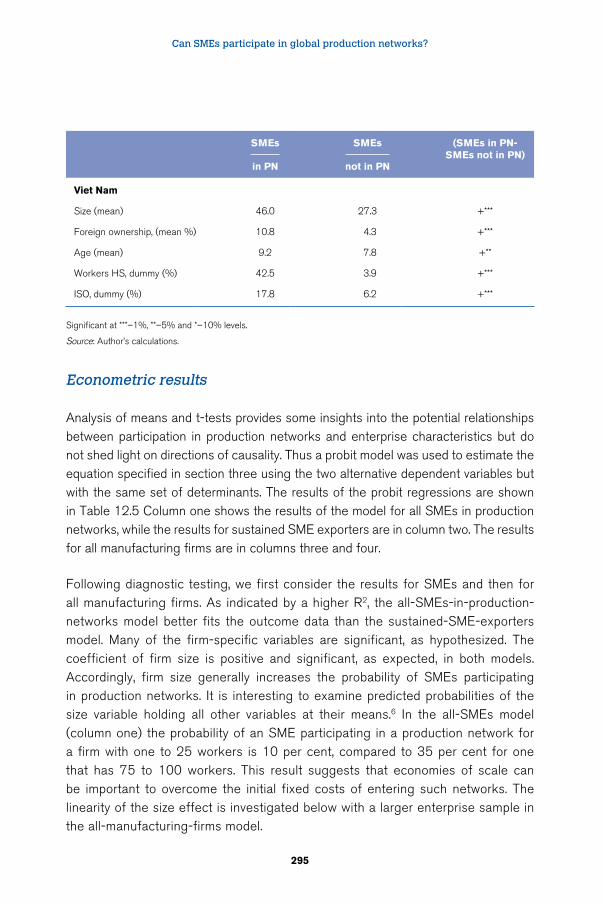
Can SMEs participate in global production networks?
295
Econometric results
Analysis of means and t-tests provides some insights into the potential relationships between participation in production networks and enterprise characteristics but do not shed light on directions of causality. Thus a probit model was used to estimate the equation specified in section three using the two alternative dependent variables but with the same set of determinants. The results of the probit regressions are shown in Table 12.5 Column one shows the results of the model for all SMEs in production networks, while the results for sustained SME exporters are in column two. The results for all manufacturing firms are in columns three and four.
Following diagnostic testing, we first consider the results for SMEs and then for all manufacturing firms. As indicated by a higher R2, the all-SMEs-in-production-networks model better fits the outcome data than the sustained-SME-exporters model. Many of the firm-specific variables are significant, as hypothesized. The coefficient of firm size is positive and significant, as expected, in both models. Accordingly, firm size generally increases the probability of SMEs participating in production networks. It is interesting to examine predicted probabilities of the size variable holding all other variables at their means.6 In the all-SMEs model (column one) the probability of an SME participating in a production network for a firm with one to 25 workers is 10 per cent, compared to 35 per cent for one that has 75 to 100 workers. This result suggests that economies of scale can be important to overcome the initial fixed costs of entering such networks. The linearity of the size effect is investigated below with a larger enterprise sample in the all-manufacturing-firms model.
SMes SMes (SMes in PN-SMes not in PN)
in PN not in PN
Viet Nam
Size (mean) 46.0 27.3 +***
Foreign ownership, (mean %) 10.8 4.3 +***
Age (mean) 9.2 7.8 +**
Workers HS, dummy (%) 42.5 3.9 +***
ISO, dummy (%) 17.8 6.2 +***
Significant at ***–1%, **–5% and *–10% levels.
Source: Author’s calculations.
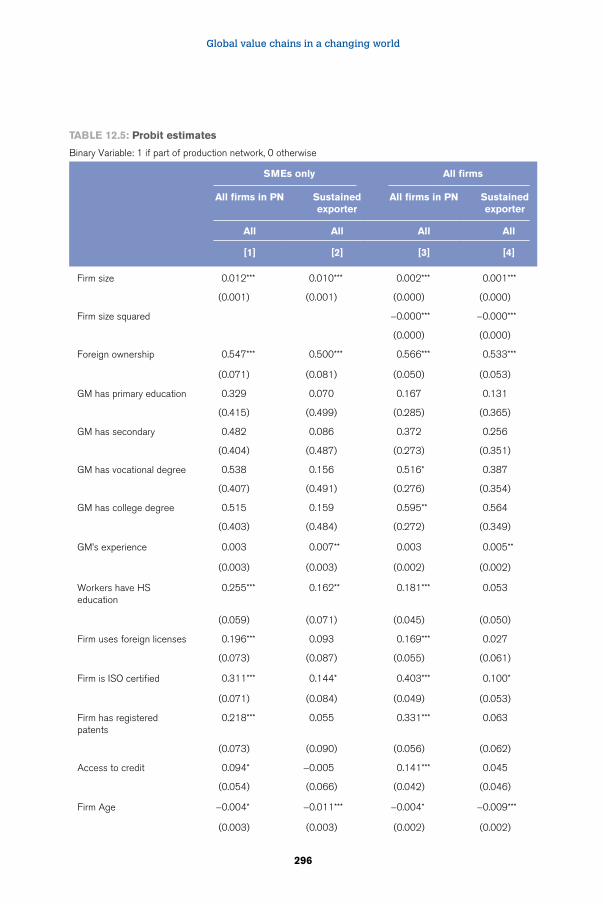
Global value chains in a changing world
296
TAble 12.5: Probit estimates
Binary Variable: 1 if part of production network, 0 otherwise
SMes only All firms
All firms in PN Sustained exporter
All firms in PN Sustained exporter
All All All All
[1] [2] [3] [4]
Firm size 0.012*** 0.010*** 0.002*** 0.001***
(0.001) (0.001) (0.000) (0.000)
Firm size squared -0.000*** -0.000***
(0.000) (0.000)
Foreign ownership 0.547*** 0.500*** 0.566*** 0.533***
(0.071) (0.081) (0.050) (0.053)
GM has primary education 0.329 0.070 0.167 0.131
(0.415) (0.499) (0.285) (0.365)
GM has secondary 0.482 0.086 0.372 0.256
(0.404) (0.487) (0.273) (0.351)
GM has vocational degree 0.538 0.156 0.516* 0.387
(0.407) (0.491) (0.276) (0.354)
GM has college degree 0.515 0.159 0.595** 0.564
(0.403) (0.484) (0.272) (0.349)
GM’s experience 0.003 0.007** 0.003 0.005**
(0.003) (0.003) (0.002) (0.002)
Workers have HS education
0.255*** 0.162** 0.181*** 0.053
(0.059) (0.071) (0.045) (0.050)
Firm uses foreign licenses 0.196*** 0.093 0.169*** 0.027
(0.073) (0.087) (0.055) (0.061)
Firm is ISO certified 0.311*** 0.144* 0.403*** 0.100*
(0.071) (0.084) (0.049) (0.053)
Firm has registered patents
0.218*** 0.055 0.331*** 0.063
(0.073) (0.090) (0.056) (0.062)
Access to credit 0.094* -0.005 0.141*** 0.045
(0.054) (0.066) (0.042) (0.046)
Firm Age -0.004* -0.011*** -0.004* -0.009***
(0.003) (0.003) (0.002) (0.002)
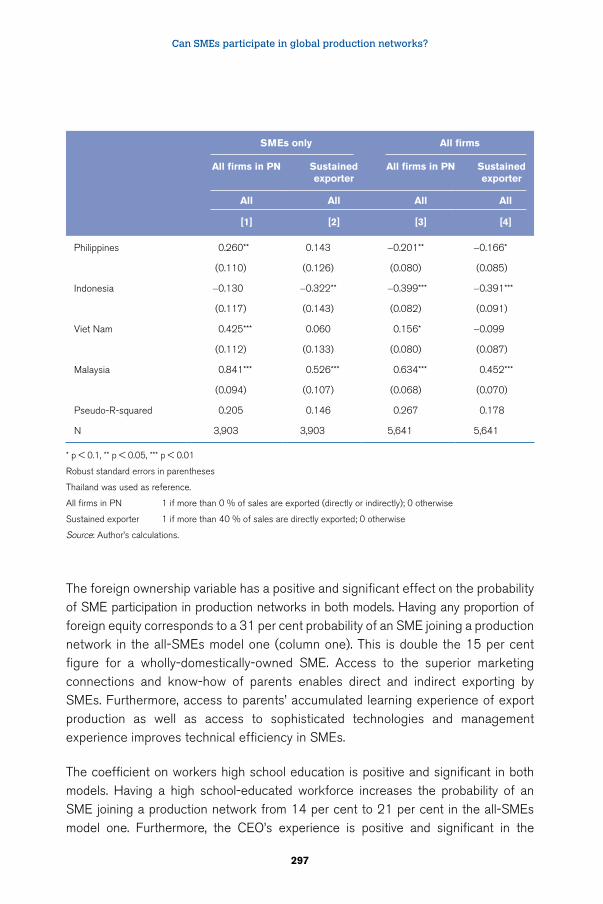
Can SMEs participate in global production networks?
297
SMes only All firms
All firms in PN Sustained exporter
All firms in PN Sustained exporter
All All All All
[1] [2] [3] [4]
Philippines 0.260** 0.143 -0.201** -0.166*
(0.110) (0.126) (0.080) (0.085)
Indonesia -0.130 -0.322** -0.399*** -0.391***
(0.117) (0.143) (0.082) (0.091)
Viet Nam 0.425*** 0.060 0.156* -0.099
(0.112) (0.133) (0.080) (0.087)
Malaysia 0.841*** 0.526*** 0.634*** 0.452***
(0.094) (0.107) (0.068) (0.070)
Pseudo-R-squared 0.205 0.146 0.267 0.178
N 3,903 3,903 5,641 5,641
* p < 0.1, ** p < 0.05, *** p < 0.01
Robust standard errors in parentheses
Thailand was used as reference.
All firms in PN 1 if more than 0 % of sales are exported (directly or indirectly); 0 otherwise
Sustained exporter 1 if more than 40 % of sales are directly exported; 0 otherwise
Source: Author’s calculations.
The foreign ownership variable has a positive and significant effect on the probability of SME participation in production networks in both models. Having any proportion of foreign equity corresponds to a 31 per cent probability of an SME joining a production network in the all-SMEs model one (column one). This is double the 15 per cent figure for a wholly-domestically-owned SME. Access to the superior marketing connections and know-how of parents enables direct and indirect exporting by SMEs. Furthermore, access to parents’ accumulated learning experience of export production as well as access to sophisticated technologies and management experience improves technical efficiency in SMEs.
The coefficient on workers high school education is positive and significant in both models. Having a high school-educated workforce increases the probability of an SME joining a production network from 14 per cent to 21 per cent in the all-SMEs model one. Furthermore, the CEO’s experience is positive and significant in the
Global value chains in a changing world
298
sustained-SME-exporters model. These results suggest that higher levels of human capital, particularly literate secondary-level educated workers and experienced CEOs, increase the probability of SME participation in production networks.
The coefficient on internationally agreed quality certification is positive and significant in both models. Having an internationally agreed quality certificate like ISO increases the probability of an SME joining a production network from 16 per cent to 25 per cent in the all-SMEs model one. In addition, foreign licenses and registered patents are significant with the correct sign in the all-SMEs model. Accordingly, SMEs which have acquired higher levels of technological capabilities are more likely to succeed in production networks.7 This requires SMEs to undertake conscious investments in skills and information to operate imported technologies rather than simply learning by doing. Capability building in SMEs involves a range of technological activities including actively acquiring new technologies through foreign licenses, implementing international quality standards and developing new products supported by patent protection.
The firm age variable is negative and significant in both models, thereby rejecting the hypothesized positive sign. While age may be a proxy for many influences, this result suggests that younger firms are likely to be more nimble in learning new market and technological information and more flexible in combining internal and external knowledge in an efficient manner. Both of these traits are likely to facilitate younger firms joining production networks.
Access to commercial bank credit is positive and significant in the all-SMEs model. This suggests that, in the presence of capital market imperfections, well-organized SMEs with collateral and an established record with commercial banks are more likely to join production networks.
The significance of the coefficients on the country dummies suggests that some differences exist between the ASEAN countries. Malaysia is significant in both models. With opposite signs, Viet Nam is significant in the SMEs model, while Indonesia is significant the sustained-exporter model.
Turning to the two all-manufacturing-firms models (columns three and four), the all-firms-in-production-networks model is likewise a better fit to the outcome data than the sustained-exporters model. The two all-manufacturing-firms models provide a somewhat better fit than the two SME models (compare the R2 in columns three and four with columns one and two). Interestingly, several variables (firm size, foreign
Can SMEs participate in global production networks?
299
ownership, workers high school education, international quality certification and firm age) turn out as significant with the correct sign in both all-manufacturing-firm models. Hence, the key determinants of firm-level participation in production networks are remarkably stable across the four models, suggesting that the pattern for SMEs broadly holds for all manufacturing firms.
There are also some differences between the all-manufacturing-firms models and the SME models. Adding a size-squared variable in the all-manufacturing-firms model was useful in clarifying the size effect. The coefficient on size-squared is negative and significant, implying a non-linear relationship. It seems that economies of scale and fixed costs are important in the early stages of joining production networks but less relevant over time as SMEs become important players in their own niche markets or form industrial clusters. Furthermore, the CEO’s characteristics are more pronounced in the all-firms-in-production-networks model (column three) with significant coefficients for college degrees and vocational education. Higher levels of CEO education are clearly required for more complex, scale economy-intensive operations associated with firm size in production networks. Finally, country characteristics matter but differ between the all-manufacturing-firm models with all four country dummies significant in the all-firms-in-production-networks model, but only two in the sustained-exporter model.
12.6. Exploring selected policy influences
The overall business environment in ASEAN economies is an important influence on SME participation in production networks. A myriad of reform policies, factor markets and targeted SME policies are involved. These range from trade policies and customs regulations, business start-up regulations, export promotion initiatives, special financing schemes, to technology support measures.8 It is hard to portray the overall business environment for SMEs in ASEAN economies and disentangle the different effects on firms. One practical method is to use available data on enterprise perceptions to examine the supportive nature of the policy regime facing SMEs in their quest to participate in production networks.
Table 12.6 lists the main obstacles to conducting business in the ASEAN economies identified by the SMEs using information from the World Bank’s Enterprise Surveys. These are grouped under three headings: incentive framework, supply-side factors and other. The discussion below highlights SMEs’ views of major obstacles facing them for all ASEAN economies and for individual economies. The data for Thailand
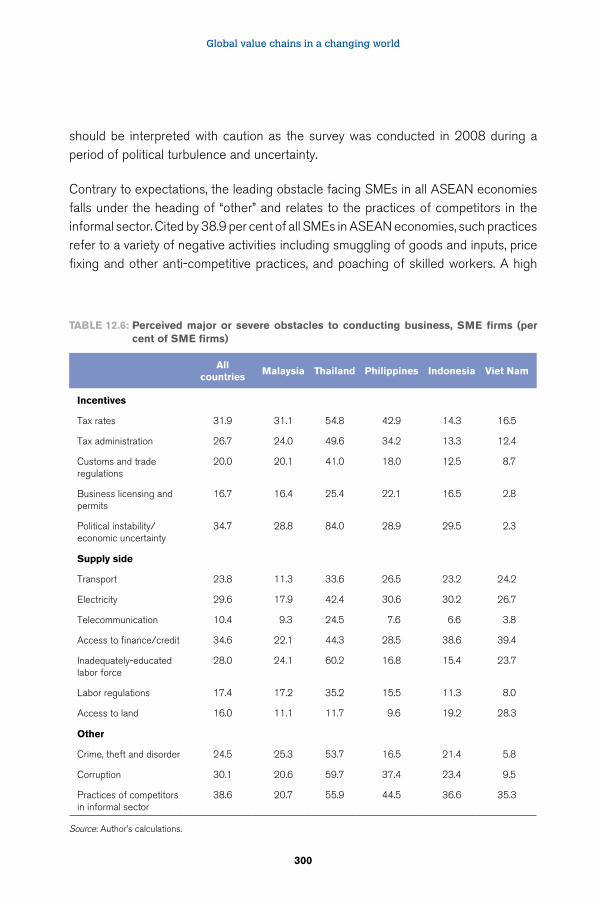
Global value chains in a changing world
300
should be interpreted with caution as the survey was conducted in 2008 during a period of political turbulence and uncertainty.
Contrary to expectations, the leading obstacle facing SMEs in all ASEAN economies falls under the heading of “other” and relates to the practices of competitors in the informal sector. Cited by 38.9 per cent of all SMEs in ASEAN economies, such practices refer to a variety of negative activities including smuggling of goods and inputs, price fixing and other anti-competitive practices, and poaching of skilled workers. A high
TAble 12.6: Perceived major or severe obstacles to conducting business, SMe firms (per cent of SMe firms)
All countries
Malaysia Thailand Philippines Indonesia Viet Nam
Incentives
Tax rates 31.9 31.1 54.8 42.9 14.3 16.5
Tax administration 26.7 24.0 49.6 34.2 13.3 12.4
Customs and trade regulations
20.0 20.1 41.0 18.0 12.5 8.7
Business licensing and permits
16.7 16.4 25.4 22.1 16.5 2.8
Political instability/economic uncertainty
34.7 28.8 84.0 28.9 29.5 2.3
Supply side
Transport 23.8 11.3 33.6 26.5 23.2 24.2
Electricity 29.6 17.9 42.4 30.6 30.2 26.7
Telecommunication 10.4 9.3 24.5 7.6 6.6 3.8
Access to finance/credit 34.6 22.1 44.3 28.5 38.6 39.4
Inadequately-educated labor force
28.0 24.1 60.2 16.8 15.4 23.7
Labor regulations 17.4 17.2 35.2 15.5 11.3 8.0
Access to land 16.0 11.1 11.7 9.6 19.2 28.3
Other
Crime, theft and disorder 24.5 25.3 53.7 16.5 21.4 5.8
Corruption 30.1 20.6 59.7 37.4 23.4 9.5
Practices of competitors in informal sector
38.6 20.7 55.9 44.5 36.6 35.3
Source: Author’s calculations.
Can SMEs participate in global production networks?
301
degree of trust among firms is increasingly regarded by MNCs as a critical ingredient for developing market-led production networks. Among other things, high levels of trust encourages positive collective behaviour among firms — such as sharing of sensitive information, pooling of technical knowledge and joint production and marketing activities — which is critical in technologically intense, efficient production networks. However, the data are suggestive of a general “trust deficit” among SMEs in ASEAN economies which impedes the development of production networks with greater SME involvement. Interestingly, Malaysian SMEs (20.7 per cent) seem to view the practices of competitors much less seriously than the other ASEAN economies suggesting that higher levels of trust exist among its enterprises.
A variety of supply-side factors are viewed as an obstacle by SMEs. The usual constraint in most studies of SMEs — access to finance (34.6 per cent) — follows closely as the second most important obstacle in ASEAN economies. This issue seems least severe in Malaysia (22.1 per cent) and most severe in Viet Nam (39.4 per cent) and Indonesia (38.6 per cent). Both the high cost of borrowing and the availability of financing from commercial banks fall under this heading. Inter-country differences in access to finance partly reflect the influence of monetary policies and the development of capital markets. A lack of financing is a deterrent to some firms investing in new equipment, technologies and marketing methods which are needed to participate in production networks.
Bottlenecks pertaining to physical infrastructure and worker skills also show up as impediments to SMEs joining production networks in ASEAN economies. Electricity costs (and some fluctuations in supply) were cited by 29.6 per cent of SMEs in all ASEAN economies and the quality of transport systems (roads, rail and ports) by another 23.8 per cent. High electricity costs and the quality of transport systems appear to be less of a problem in energy producers such as Malaysia and Indonesia than in the three energy importers. Relative infrastructure gaps in energy-importing ASEAN economies was reflected in poorer connectivity and higher trade costs compared with energy producing economies.
An inadequately educated labour force was mentioned as a problem by 28 per cent of SMEs in all ASEAN economies, but Thailand, Malaysia and Viet Nam report higher figures than the other economies. This pattern may reflect skill shortages and rising wage costs in part associated with moves in the direction of full employment. Amidst a tightening labour market, labour regulations were perceived to be more of a problem for SMEs in Malaysia and Thailand than in the other ASEAN economies.
Global value chains in a changing world
302
In contrast, access to land is generally not seen as an obstacle, with only 16 per cent of SMEs in all ASEAN economies highlighting this issue. Within this overall picture, however, SMEs in Viet Nam (28.3 per cent) may have some concerns in relation to access to land.
On the policy and incentive front, regulatory issues at the border seem to be a limited concern. For instance, only 20 per cent of SMEs in all ASEAN economies cited customs and trade regulations as a concern. This may reflect the fact that tariffs are quite low in ASEAN economies and that customs administration has been improved due to decades of gradual trade reforms. Thailand may be somewhat of an outlier, and the issue may relate to customs administration rather than trade regulations per se. Thus, customs and trade regulations generally do not seem to be an important impediment to SMEs participating in production networks.
There are mixed views about some behind-the-border regulatory issues. Business licensing and permits are not a widespread problem in ASEAN economies, with only 16.7 per cent of firms pointing to this issue. Meanwhile, tax policy issues do matter. In this vein, high corporate tax rates were cited by 31.9 per cent of SMEs and gaps in tax administration by another 26.7 per cent. Tax policy issues directly affect enterprise profitability and the incentive to participate in production networks. These issues appear to be a particular concern in Philippines and Thailand and, to a lesser extent, in Malaysia.
According to 34.7 per cent of SMEs in all ASEAN economies economic uncertainty is also a notable impediment. However, a closer look at the data indicates that this figure is partly attributed to Thailand (84 per cent) being an outlier for an unusually long period of domestic political turbulence. With the exception of Viet Nam (2.3 per cent), some concerns about economic uncertainty were also expressed in the other ASEAN economies.
Finally, corruption was mentioned by 30.1 per cent of SMEs in all ASEAN economies and crime, theft, and disorder by another 24.5 per cent, indicating that these are significant issues for SMEs.
Thus far, the availability of enterprise-level data on the five ASEAN economies has limited further exploration of supply-side factors influencing SME participation in production networks. The important area of business services markets and business service providers for SMEs has not been discussed. Fortunately, some data for
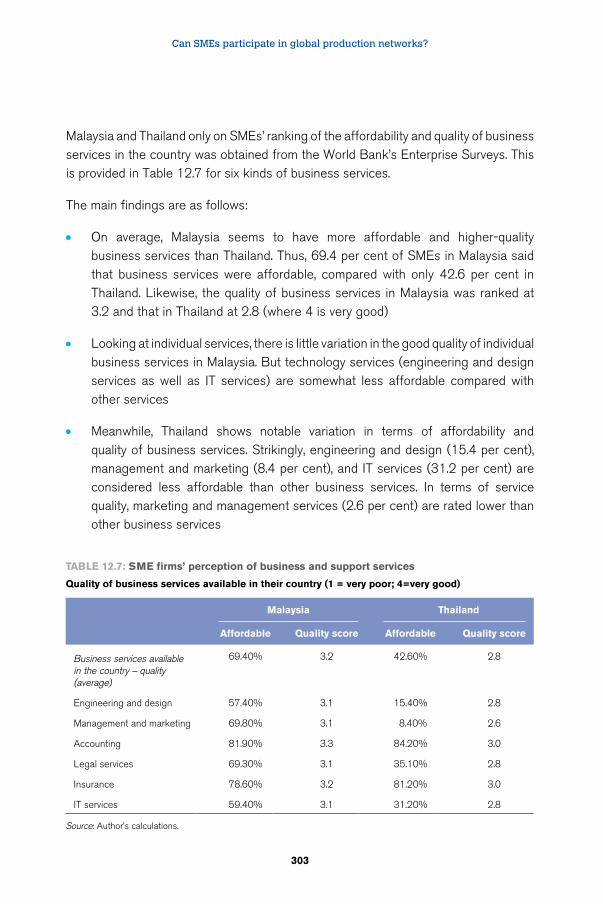
Can SMEs participate in global production networks?
303
Malaysia and Thailand only on SMEs’ ranking of the affordability and quality of business services in the country was obtained from the World Bank’s Enterprise Surveys. This is provided in Table 12.7 for six kinds of business services.
The main findings are as follows:
• On average, Malaysia seems to have more affordable and higher-quality business services than Thailand. Thus, 69.4 per cent of SMEs in Malaysia said that business services were affordable, compared with only 42.6 per cent in Thailand. Likewise, the quality of business services in Malaysia was ranked at 3.2 and that in Thailand at 2.8 (where 4 is very good)
• Looking at individual services, there is little variation in the good quality of individual business services in Malaysia. But technology services (engineering and design services as well as IT services) are somewhat less affordable compared with other services
• Meanwhile, Thailand shows notable variation in terms of affordability and quality of business services. Strikingly, engineering and design (15.4 per cent), management and marketing (8.4 per cent), and IT services (31.2 per cent) are considered less affordable than other business services. In terms of service quality, marketing and management services (2.6 per cent) are rated lower than other business services
TAble 12.7: SMe firms’ perception of business and support services
Quality of business services available in their country (1 = very poor; 4=very good)
Malaysia Thailand
Affordable Quality score Affordable Quality score
Business services available in the country – quality (average)
69.40% 3.2 42.60% 2.8
Engineering and design 57.40% 3.1 15.40% 2.8
Management and marketing 69.80% 3.1 8.40% 2.6
Accounting 81.90% 3.3 84.20% 3.0
Legal services 69.30% 3.1 35.10% 2.8
Insurance 78.60% 3.2 81.20% 3.0
IT services 59.40% 3.1 31.20% 2.8
Source: Author’s calculations.
Global value chains in a changing world
304
12.7. Conclusions and policy implications
This paper examined factors affecting SME participation in global production networks in five ASEAN economies through a firm-level econometric exercise and descriptive analysis of policy influences. The research was based on a large World Bank multi-country enterprise data set.
Our research suggests that large firms are the leading players in production networks in ASEAN economies in the late 2000s while SMEs are relatively minor. Nonetheless, the available information also hints at a modest increase in the participation of SMEs in ASEAN economies between the late 1990s and the late 2000s as measured by the share of SME exports. More developed ASEAN economies such as Malaysia and Thailand, which are more established in production networks, have higher SME export shares than other ASEAN economies.
The outcome of the econometric exercise underscores the notion of firm heterogeneity in relation to firm-level participation in production networks. The results suggest that size, foreign ownership, educated workers, experienced CEOs, building technological capabilities and access to commercial bank credit all positively affect the probability of SME participation in production networks. By contrast, age has a negative relationship.
The exploration of policy influences on SME business activity provides additional insights. A trust deficit seems to hamper the requisite intra-firm cooperation needed for effective SME participation in production networks. Supply-side factors — like lack of access to finance, high electricity costs, variable quality of transport systems and inadequately educated workers — are an additional hindrance to SMEs. On the policy and incentive side, behind-the-border issues such as high corporate tax rates as well as economic uncertainty also play their part. Finally, the limited evidence from Malaysia and Thailand suggests that the affordability and quality of business support services are an issue. Tackling these constraints at firm and country level would help to unleash the full potential of SMEs as players in production networks in the future.
Thus, our results suggest that exploration of SME participation in production networks is important as ASEAN economies further deepen their engagement with production networks and supply chains as a part of rebalancing. It also indicates that improving the quality of published data on SMEs in ASEAN economies and further empirical
Can SMEs participate in global production networks?
305
research into this area would be fruitful. Some limitations in the methodology employed in this paper may be addressed in future research. First, several factors that may also affect the participation of SMEs in production networks (such as trade policies, domestic regulations, infrastructure and business support services) were considered in the descriptive part but not in the econometric exercise. Attempting to include such factors in future econometric work may provide additional insights. Second, the production network functions estimated are static as only cross-section data were available. Third, the research was unable to examine the issue of FDI by ASEAN SMEs due to data gaps. Thus, the findings need to be interpreted with caution. Panel data analysis would be invaluable to highlight changes over time when the requisite data are available.
Endnotes
1 The vision of ASEAN leaders builds on the Strategic Action Plan for ASEAN SME Development 2010–2015 which covers mandates stipulated in the ASEAN Economic Community (AEC) Blueprint. The major deliverables under the plan are: (i) a common curriculum for entrepreneurship in ASEAN, (ii) a comprehensive SME service centre with regional and subregional linkages in ASEAN economies, (iii) an SME financing facility in each ASEAN economy, (iv) a regional program of internship schemes for staff exchanges and visits for skills training, and (v) regional SME development funding for supporting intra-ASEAN business leaders.
2 Harvie and Lee (2002) provide a reasonably reliable snapshot for the late-1990s showing that on average SMEs made up 91.8 per cent of enterprises and 50.5 per cent of employment in ASEAN economies. But their average export share is only 14.3 per cent (estimated from Harvie and Lee 2002, Table 1.2, p. 6).
3 For further discussion of resource constraints and external barriers faced by SMEs as well as appropriate policy interventions see Levy et al., (1999); and Hallberg (2000).
4 For instance, in Malaysia SMEs are defined by sales, employment and type of industry. In Indonesia, different government agencies seem to have different definitions of what constitutes an SME.
5 This means that all population units are grouped within a homogenous group and simple random samples are selected within each group. This method allows computing estimates for each of the strata with a specific level of precision while population estimates can also be estimated by properly weighting individual observations. The strata for enterprise surveys are firm size, business sector and geographic region within a country. In most developing countries, small and medium-sized enterprises form the bulk of the enterprises. Large firms are oversampled in the firm surveys as they tend to be engines of job creation. For more details of the sampling methodology see www.enterprisesurveys.org/methodology.
6 The same assumption is made for all the probabilities given in the text. A complete set of results on predicted probabilities is available on request.
Global value chains in a changing world
306
7 Wignaraja et al., (2013) further explore this insight for a sample of Malaysian and Thai firms using a technology index (consisting of eight technical functions) based on the taxonomy of technological capabilities developed by Lall (1992). The results show that participation in production networks is positively correlated with technology upgrading at firm-level.
8 It is recognized that the developing industrial clusters involving SMEs and large firms are also an important means to promote SME entry into production networks. However, a lack of data on this aspect meant that clustering and cluster promotion could not be examined in this paper (Fischer and Reuber, 2003).
References
Arndt, S. W.; Kierzkowski, H. 2001. “Fragmentation: New Production Patterns in World Economy.” (Oxford, UK, Oxford University Press).
Athukorala, P. 2011. “Production Networks and Trade Patterns in East Asia: Regionalization or Globalization?”, in Asian Economic Papers, 10(1): 65–95.
Bell, M.; Pavitt, K. 1993. “Technological Accumulation and Industrial Growth”, in Industrial and Corporate Change, 2(2): 157–209.
Dueñas-Caparas, M. T. 2006. “Determinants of Export Performance in the Philippine Manufacturing Sector”, in Discussion Paper DP 2006–18. (Makati City, Philippines, Philippine Institute for Development Studies).
Erbes, A.; Robert, V.; Yoguel, G. 2010. “Capacities, Innovation and Feedbacks in Production Networks in Argentina”, in Economics of Innovation and New Technology 19(8): 719–741.
Fischer, E.; Reuber, R. 2003. “Industrial Clusters and Business Development Services for Small and Medium Enterprises”, in G. Wignaraja (ed.): Competitiveness Strategy in Developing Countries, (London, Routledge).
Hallberg, K. 2000. “A Market-Oriented Strategy for Small and Medium-Scale Enterprises”, in International Finance Corporation, Discussion Paper No. 40. April. (Washington DC, World Bank).
Harvie, C. 2010. “East Asian Production Networks – The Role and Contribution of SMEs”, in International Journal of Business and Development Studies, 2(1): 27–62.
Harvie, C.; Lee, B. C. 2002. “East Asian SMEs: Contemporary Issues and Developments – An Overview”, in The Role of SMEs in C. Harvie and B. C. Lee (eds): National Economies in East Asia (Cheltenham, UK: Edward Elgar).
Can SMEs participate in global production networks?
307
Harvie, C.; Narjoko, D.; Oum, S. 2010. “Firm Characteristic Determinants of SME Participation in Production Networks”, ERIA Discussion Paper Series 2010–11 (Jakarta, Indonesia, Economic Research Institute for ASEAN and East Asia).
Helpman, E.; Melitz, M. J.; Yeaple, S. R. 2004. “Export versus FDI with Heterogeneous Firms”, in American Economic Review, 94(1): 300–316.
Hobday, M. 2001. “The Electronics Industries of the Asia-Pacific: Exploring International Production Networks for Economic Development”, in Asian-Pacific Economic Literature, 15(1): 13–29.
Hollenstein, H. 2005. “Determinants of International Activities: Are SMEs different?”, in Small Business Economics, 24(5): 431–450.
Iammarino, S.; Padilla-Perez, R.; von Tunzelmann, N. 2008. “Technological Capabilities and Global-local Interactions: The electronics Industry in two Mexican Regions”, in World Development, 36(10): 1980–2003.
Jones, R. W.; Kierzkowski, H. 1990. “The Role of Services in Production and International Trade: A Theoretical Framework”, in R. W Jones and A. O. Krueger (eds): The Political Economy of International Trade: Essays in Honour of R.E. Baldwin ( Oxford, UK, Basil Blackwell).
Kimura, F.; Ando, M. 2005. “Two-Dimensional Fragmentation in East Asia: Conceptual Framework and Empirics”, in International Review of Economics and Finance, 14(3): 317–48.
Koopman, R.; Powers, W. M.; Wang, Z.; Wei, S. J. 2010. “Give Credit where Credit is Due: Tracing Value Added in Global Production Networks”, NBER Working Paper No. W16426 (Cambridge, MA, National Bureau of Economic Research).
Kumar, N.; Siddharthan, N. S. 1994. “Technology, Firm Size and Export Behaviour in Developing Countries: The Case of Indian Enterprises”, in Journal of Development Studies, 31(2): 289–309.
Kuroiwa, I.; Heng, T. M. (eds). 2008. “Production Networks and Industrial Clusters: Integrating Economies in Southeast Asia” (Singapore, Institute of Southeast Asian Studies).
Kuroiwa, I. (ed). 2009. “Plugging into Production Networks! Industrialization Strategies in Less Developed Southeast Asian Countries” (Singapore, Institute of Southeast Asian Studies).
Kyophilavong, P. 2010 “Integrating LAO SMEs into a more integrated East Asia region” in Harvie C., Oum S., Narjoko D. (Eds) Integrating Small and Medium Enterprises (SMEs) into more Integrated East Asia. ERIA Research Project Report 2009 No. 8. (Jakarta, Economic Research Institute for ASEAN and East Asia).
Global value chains in a changing world
308
Lall, S. 1986. “Technological Development and Export Performance in LDCs: Leading Engineering and Chemical Firms in India”, in Weltwirtschaftliches Archiv, 122(1): 80–91.
Lall, S. 1992. “Technological Capabilities and Industrialization”, in World Development, 20(2): 165–186.
Lefebvre, E.; Lefebvre, L. A. 2001. “Innovative Capabilities as Determinants of Export Behavior and Performance: A Longitudinal Study of Manufacturing SMEs”, in A. Kleinknecht and P. Mohnen (eds): Innovation and Firm Performance, Econometric Exploration of Survey Data (London: Palgrave).
Levy, B.; Berry, R. A.; Nugent, J. I. 1999. “Fulfilling the Export Potential of Small and Medium Firms”, (Dordrecht, The Netherlands, Kluwer Academic Publishers).
Lim, H.; Kimura, F. 2010. “The Internationalization of Small and Medium Enterprises in Regional and Global Value Chains”, ADBI Working Paper Series No. 231 (Tokyo, Japan, Asian Development Bank Institute).
Melitz, M. J. 2003. “The Impact of Trade on Intra-Industry Reallocations and Aggregate Industry Productivity”, in Econometrica, 17(6): 1,695–1,725.
Nelson, R. R.; Winter, S. G. 1982. “An Evolutionary Theory of Economic Change” (Cambridge, MA, Belknap/Harvard University Press).
Ng, F.; Yeats, A. 2003. “Major Trade Trends in East Asia – What are their Implications for Regional Cooperation and Growth?”, World Bank Policy Research Working Paper 3084 (Washington, DC, World Bank).
Nguyen, H.; Nishijima, S. 2009. “Export Intensity and Impacts from Firm Characteristics, Domestic Competition and Domestic Constraints in Vietnam: A Micro-data Analysis”, in Kobe University Research Institute for Economics & Business Administration Discussion Paper Series 238 (Kobe, Japan, Kobe University).
Organization for Economic Co-operation and Development (OECD). 1997. “Globalisation and Small and Medium Enterprises”, in Vol. 1 Synthesis Report. (Paris, France, OECD).
Rasiah, R. 2004. “Foreign Firms, Technological Intensities and Economic Performance: Evidence from Africa, Asia and Latin America”, (Cheltenham, UK, Edward Elgar).
Rasiah, R.; Rosli, M.; Sanjivee, P. 2010. “The Significance of Production Networks in Productivity, Exports and Technological Upgrading: Small and Medium Enterprises in Electric-Electronics, Textiles-Garments, Automotives and Wood Products in Malaysia” in V. T. Tranh, D. Narjoko, and S. Oum (eds): Integrating Small and Medium Enterprises into More Integrating
Can SMEs participate in global production networks?
309
East Asia, ERIA Research Report 2009 No. 8. (Jakarta, Indonesia, Economic Research Institute for ASEAN and East Asia).
Srinivasan, T. N.; Archana, V. 2011. “Determinants of Export Decision of Firms”, in Economic and Political Weekly 46(7): 49–58.
Tambunan, T. T. H. 2009. “SMEs in Asian Developing Countries”, (Basingstoke, UK, Palgrave Macmillan).
Tranh, V. T; Narjoko, D.; Oum, S. 2010. “Integrating Small and Medium Enterprises into More Integrating East Asia”, ERIA Research Report 2009 No. 8. (Jakarta, Indonesia, Economic Research Institute for ASEAN and East Asia).
Van Dijk, M. 2002. “The Determinants of Export Performance in Developing Countries: The Case of Indonesian Manufacturing”, Eindhoven Centre for Innovation Studies Working Paper 02.01 (Eindhoven, The Netherlands, Eindhoven University).
Wakelin, K. 1998. “Innovation and Export Behaviour at the Firm Level”, in Research Policy 26: 829–841.
Wilmore, L. 1992. “Transnationals and Foreign Trade: Evidence from Brazil”, in Journal of Development Studies 28(2): 314–335.
Wignaraja, G. 2002. “Firm Size, Technological Capabilities and Market-Oriented Policies in Mauritius”, in Oxford Development Studies 30(1): 87–104.
Wignaraja, G. 2011. “FDI, Size, and Innovation: Influences on Firm-Level Exports in East Asia”, TMD Working Paper Series No. 047 (Oxford, UK, University of Oxford).
Wignaraja, G. 2012. “Innovation, Learning and Exporting in China: Does R&D or a Technology Index Matter?”, in Journal of Asian Economics 23(3): 224–233.
Wignaraja, G.; Kruger, J.; Tuazon, A.M. 2013. “Production Networks, Profits and Innovative Activity: Evidence from Malaysia and Thailand”, ADBI Working Paper Series No. 460, February (Tokyo, Japan, Asian Development Bank Institute).
World Bank. 2012. World Bank Enterprise Surveys. Available at: www.enterprisesurveys.org
WTO; IDE-JETRO. 2011. “Trade Patterns and Global Value Chains in East Asia: From Trade in Goods to Trade in Tasks” (Geneva, Switzerland, World Trade Organization and Tokyo, Japan, Institute for Developing Economies-Japan External Trade Organization.
Zhao, H.; Li, H. 1997. “R&D and Exports: An Empirical Analysis of Chinese Manufacturing Firms”, in The Journal of High Technology Management Research 8(1): 89–1.
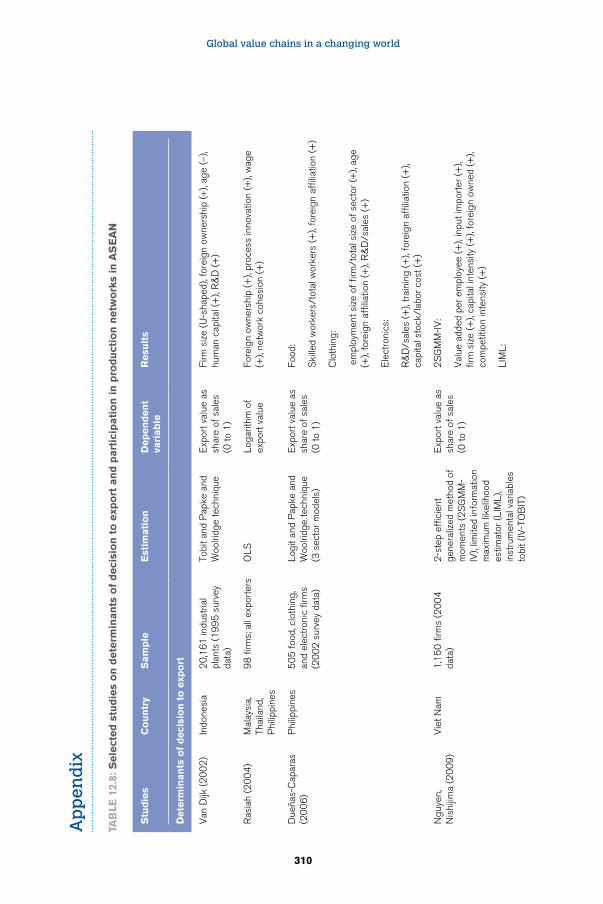
Global value chains in a changing world
310
Stu
die
sC
ou
ntr
yS
am
ple
est
imati
on
Dep
en
den
t va
riab
leR
esu
lts
Dete
rmin
an
ts o
f d
eci
sio
n t
o e
xpo
rt
Van
Dijk
(2
00
2)
Indo
nesi
a2
0,1
61
indu
stria
l pl
ants
(1
99
5 s
urve
y da
ta)
Tobi
t and
Pap
ke a
nd
Woo
lridg
e te
chni
que
Exp
ort v
alue
as
shar
e of
sal
es
(0 to
1)
Firm
siz
e (U
-sha
ped)
, for
eign
ow
ners
hip
(+),
age
(-),
hum
an c
apita
l (+
), R
&D
(+
)
Ras
iah
(20
04
)M
alay
sia,
Th
aila
nd,
Phi
lippi
nes
98
firm
s; a
ll ex
port
ers
OLS
Loga
rithm
of
expo
rt v
alue
Fore
ign
owne
rshi
p (+
), pr
oces
s in
nova
tion
(+),
wag
e (+
), ne
twor
k co
hesi
on (
+)
Due
ñas-
Cap
aras
(2
00
6)
Phi
lippi
nes
50
5 f
ood,
clo
thin
g,
and
elec
tron
ic f
irms
(20
02
sur
vey
data
)
Logi
t and
Pap
ke a
nd
Woo
lridg
e te
chni
que
(3 s
ecto
r m
odel
s)
Exp
ort v
alue
as
shar
e of
sal
es
(0 to
1)
Food
:
Ski
lled
wor
kers
/tot
al w
orke
rs (
+),
fore
ign
affil
iatio
n (+
)
Clo
thin
g:
em
ploy
men
t siz
e of
firm
/tot
al s
ize
of s
ecto
r (+
), ag
e (+
), fo
reig
n af
filia
tion
(+),
R&
D/s
ales
(+
)
Ele
ctro
nics
:
R&
D/s
ales
(+
), tr
aini
ng (
+),
fore
ign
affil
iatio
n (+
), ca
pita
l sto
ck/l
abor
cos
t (+
)
Ngu
yen,
N
ishi
jima
(20
09
)V
iet N
am1
,15
0 f
irms
(20
04
da
ta)
2-s
tep
effic
ient
ge
nera
lized
met
hod
of
mom
ents
(2
SG
MM
-IV
), lim
ited
info
rmat
ion
max
imum
like
lihoo
d es
timat
or (
LIM
L),
inst
rum
enta
l var
iabl
es
tobi
t (IV
-TO
BIT
)
Exp
ort v
alue
as
shar
e of
sal
es
(0 to
1)
2S
GM
M-I
V:
Val
ue a
dded
per
em
ploy
ee (
+),
inpu
t im
port
er (
+),
firm
siz
e (+
), ca
pita
l int
ensi
ty (
+),
fore
ign
owne
d (+
), co
mpe
titio
n in
tens
ity (
+)
LIM
L:
TAb
le 1
2.8:
Sele
cted
stu
die
s o
n d
ete
rmin
an
ts o
f d
eci
sio
n t
o e
xpo
rt a
nd
part
icip
ati
on
in
pro
du
ctio
n n
etw
ork
s in
AS
eA
N
Ap
pen
dix
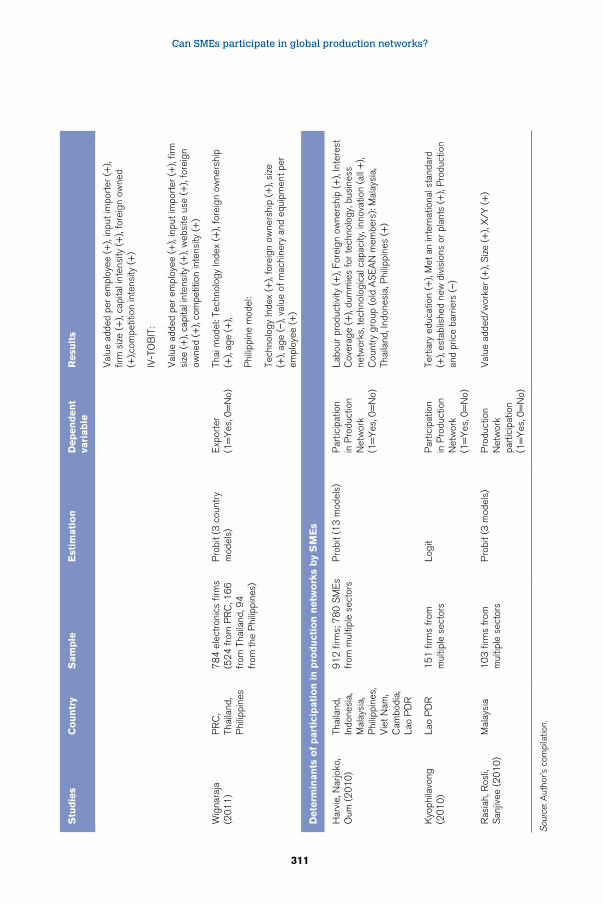
Can SMEs participate in global production networks?
311
Stu
die
sC
ou
ntr
yS
am
ple
est
imati
on
Dep
en
den
t va
riab
leR
esu
lts
Val
ue a
dded
per
em
ploy
ee (
+),
inpu
t im
port
er (
+),
firm
siz
e (+
), ca
pita
l int
ensi
ty (
+),
fore
ign
owne
d (+
),com
petit
ion
inte
nsity
(+
)
IV-T
OB
IT:
Val
ue a
dded
per
em
ploy
ee (
+),
inpu
t im
port
er (
+),
firm
si
ze (
+),
capi
tal i
nten
sity
(+
), w
ebsi
te u
se (
+),
fore
ign
owne
d (+
), co
mpe
titio
n in
tens
ity (
+)
Wig
nara
ja
(20
11
)P
RC
, Th
aila
nd,
Phi
lippi
nes
78
4 e
lect
roni
cs f
irms
(52
4 f
rom
PR
C, 1
66
fr
om T
haila
nd, 9
4
from
the
Phi
lippi
nes)
Pro
bit (
3 c
ount
ry
mod
els)
Exp
orte
r (1
=Y
es, 0
=N
o)Th
ai m
odel
: Tec
hnol
ogy
Inde
x (+
), fo
reig
n ow
ners
hip
(+),
age
(+),
Phi
lippi
ne m
odel
:
Tech
nolo
gy In
dex
(+),
fore
ign
owne
rshi
p (+
), si
ze
(+),
age
(–),
valu
e of
mac
hine
ry a
nd e
quip
men
t per
em
ploy
ee (
+)
Dete
rmin
an
ts o
f p
art
icip
ati
on
in
pro
du
ctio
n n
etw
ork
s b
y S
Me
s
Har
vie,
Nar
joko
, O
um (
20
10
)Th
aila
nd,
Indo
nesi
a,
Mal
aysi
a,
Phi
lippi
nes,
V
iet N
am,
Cam
bodi
a,
Lao
PD
R
91
2 f
irms;
78
0 S
ME
s fr
om m
ultip
le s
ecto
rsP
robi
t (1
3 m
odel
s)P
artic
ipat
ion
in P
rodu
ctio
n N
etw
ork
(1=
Yes
, 0=
No)
Labo
ur p
rodu
ctiv
ity (
+),
Fore
ign
owne
rshi
p (+
), In
tere
st
Cov
erag
e (+
), du
mm
ies
for
tech
nolo
gy, b
usin
ess
netw
orks
, tec
hnol
ogic
al c
apac
ity, i
nnov
atio
n (a
ll +
), C
ount
ry g
roup
(ol
d A
SE
AN
mem
bers
): M
alay
sia,
Th
aila
nd, I
ndon
esia
, Phi
lippi
nes
(+)
Kyo
phila
vong
(2
01
0)
Lao
PD
R1
51
firm
s fr
om
mul
tiple
sec
tors
Logi
tP
artic
ipat
ion
in P
rodu
ctio
n N
etw
ork
(1=
Yes
, 0=
No)
Tert
iary
edu
catio
n (+
), M
et a
n in
tern
atio
nal s
tand
ard
(+),
esta
blis
hed
new
div
isio
ns o
r pl
ants
(+
), P
rodu
ctio
n an
d pr
ice
barr
iers
(–
)
Ras
iah,
Ros
li,
San
jivee
(2
01
0)
Mal
aysi
a1
03
firm
s fr
om
mul
tiple
sec
tors
Pro
bit (
3 m
odel
s)P
rodu
ctio
n N
etw
ork
part
icip
atio
n (1
=Y
es, 0
=N
o)
Val
ue a
dded
/wor
ker
(+),
Siz
e (+
), X
/Y (
+)
Sou
rce:
Aut
hor’s
com
pila
tion.
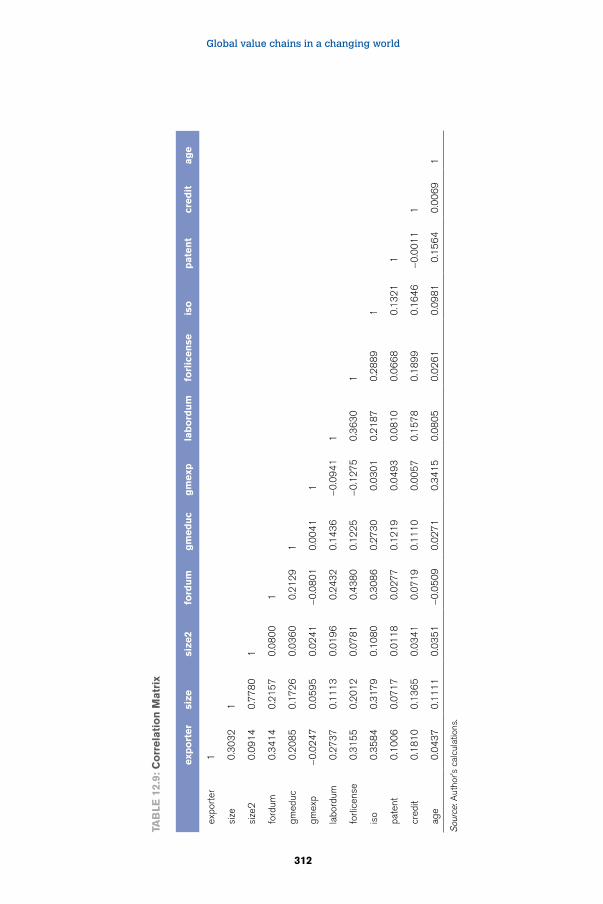
Global value chains in a changing world
312
TAb
le 1
2.9:
Co
rrela
tio
n M
atr
ix
exp
ort
er
size
size
2fo
rdu
mg
med
uc
gm
exp
lab
ord
um
forl
icen
seis
op
ate
nt
cred
itag
e
expo
rter
1
size
0.3
03
21
size
20
.09
14
0.7
78
01
ford
um0
.34
14
0.2
15
70
.08
00
1
gmed
uc0
.20
85
0.1
72
60
.03
60
0.2
12
91
gmex
p-0
.02
47
0.0
59
50
.02
41
-0.0
80
10
.00
41
1
labo
rdum
0.2
73
70
.11
13
0.0
19
60
.24
32
0.1
43
6-0
.09
41
1
forli
cens
e0
.31
55
0.2
01
20
.07
81
0.4
38
00
.12
25
-0.1
27
50
.36
30
1
iso
0.3
58
40
.31
79
0.1
08
00
.30
86
0.2
73
00
.03
01
0.2
18
70
.28
89
1
pate
nt0
.10
06
0.0
71
70
.01
18
0.0
27
70
.12
19
0.0
49
30
.08
10
0.0
66
80
.13
21
1
cred
it0
.18
10
0.1
36
50
.03
41
0.0
71
90
.11
10
0.0
05
70
.15
78
0.1
89
90
.16
46
-0.0
01
11
age
0.0
43
70
.11
11
0.0
35
1-0
.05
09
0.0
27
10
.34
15
0.0
80
50
.02
61
0.0
98
10
.15
64
0.0
06
91
Sou
rce:
Aut
hor’s
cal
cula
tions
.
313
13 The globalization of supply chains – policy challenges for developing countries
Ujal Singh Bhatia
13.1. Introduction
Global Value Chains (GVCs) represent the dominant form of cross-border economic organization for the production and delivery of goods and services, and developing countries have to deal with them to maintain and enhance their participation in the global economy. While GVCs are the product of the significant changes that have taken place in the global economy over the last three decades and market forces largely determine their scope and direction, governments still have an important role to play in influencing the nature and terms of participation of their firms. The ongoing expansion of trade in services has added a significant new dimension to GVCs and offers another avenue for developing countries to grow their economies. This paper looks at policy challenges and opportunities that global and regional value chains raise for developing countries and argues that proactive policy measures can improve outcomes for these countries. However, GVCs pose particular problems for small, poor countries with weak governance structures to maintain and improve their participation in the global trading system. GVCs require a robust multilateral rule-making process in order to enhance their economic and political sustainability.
The paper is organized in the following manner: the first part deals with the key issues involved for developing countries to integrate GVCs into their policy frameworks; the second deals with some key developments in GVCs, especially in the context of the current economic crisis; and the third with the increasing role that global services networks are playing in the global trading system. The fourth part looks at how some industry sectors in India and South Asia have fared in their interaction with GVCs. The concluding part draws some policy conclusions, including on the issue of rule-making for GVCs.
Global value chains in a changing world
314
13.2. GVCs and governments
Two aspects of economic globalization have a particularly significant bearing on the economic crisis and its resolution: the integration of global financial markets and the geographical fragmentation of manufacturing and services. Both aspects have deeply influenced recent changes in the composition and direction of global trade flows. While the post-crisis efforts of world leaders (most notably the G-20) have largely focused on the first aspect, the second has elicited inadequate policy attention until recently. The new interest of researchers and policymakers in the study of GVCs and the use of the GVC framework as a policy tool is therefore a positive development. Essentially, the GVC framework focuses on how value is created within the GVC and how it is distributed among the participant firms and countries. Empirical studies of GVCs also demonstrate how firms and countries have been able to improve outcomes for themselves in terms of the value captured and the employment generated, as well as the role that government policies play in such outcomes.
GVCs are the outcome of the unprecedented integration of factor and product markets around the world in response to the political and technological changes that have taken place in recent years promoting economic openness and facilitating easier communication and delivery of goods and services. The fundamental rationale for value chains is economic efficiency and competitive advantage, based on transaction cost minimizing behaviour of firms. Lead firms within value chains, whether such value chains are producer driven or buyer driven, weigh the risks of offshoring or outsourcing their production in various locations and countries against the cost advantages. Such decisions are continuously re-evaluated in the light of changing consumer preferences, technological changes, geographical shifts in demand, competitive conditions and locational risks.
However, governments can be expected to view value chains from a different perspective that encompasses economic, political and strategic factors. Thus, while most policymakers would generally view domestic value chains in positive terms as reflecting a move towards greater economic efficiency and regional value chains as involving economic and strategic benefits, their approach to extra-regional supply chains with a wider dispersal of value would tend to factor in other issues, such as systemic risk arising from exogenous shocks, policy objectives of developing national capacities in a range of industries and maximizing employment opportunities. In countries where food security concerns are important policy preoccupations, governments would tend to look at agro-food GVCs differently from participant firms.
The globalization of supply chains – policy challenges for developing countries
315
Policymakers can also be expected to view the issue of “upgradation” within the value chain from a perspective which is often different from that of participant firms. From the viewpoint of firms, moving up the chain usually has positive connotations, yet there can be a number of situations where they would feel more secure within their niches in the value chain. Economic “downgrading” is often used by firms as a business strategy.1 Conversely, upgrading often involves higher technology that is usually labour saving. In brief, while firms participating in GVCs would approach the issue of upgrading from the perspective of economic logic, policy makers would operate across a larger canvas of capturing maximum value within the country and generating the most jobs.
The over-arching framework for policymakers is of course their national development strategies. In the post-colonial era of the 1950s, many developing countries adopted the import substitution paradigm for industrialization. The “East Asian miracle” based on the rapid growth of Japan on the one hand and the Republic of Korea; Chinese Taipei; Hong Kong, China and Singapore on the other, provided a striking counternarrative through export oriented development strategies. The remarkable success of the latter, along with the oil shocks of the 1970s which led to debt servicing problems for several countries that had embraced import substitution strategies, gradually resulted in the waning of the import substitution paradigm.2 The World Bank and the International Monetary Fund pushed the transition from import substitution to more open strategies in many indebted countries. This transition was further assisted by a sharp increase in outsourcing by multinational corporations of relatively standardized activities to lower-cost production locations.3 As a result of all these factors, developing countries became more export-reliant, with exports growing to 33 per cent of GDP in 2007, compared with 15 per cent in 1980. China’s transition was even more dramatic. Its export reliance increased from three per cent of GDP in 1970 to 43 per cent in 2007.4 However, while there is a strong a link between the emergence of GVCs and the adoption of export-oriented industrialization strategies by a large number of developing countries, it also must be borne in mind that in a number of countries such as China and India, many of the capabilities which enabled them to effectively participate in GVCs were created during their import substitution phase, elements of which are still in existence in their policy regimes.
In the present context, the discussion on GVCs and national development strategies has to move beyond the construct of import substitution versus export-oriented industrialization. It should be recognized that while the world is witnessing a phase of unprecedented economic interdependence, at the same time it is in the throes of
Global value chains in a changing world
316
deep structural changes. As a consequence, industrialized economies can no longer be expected to function as the main drivers of global growth in the foreseeable future, having ceded the role to a considerable extent to the emerging economies. The consequent shift of demand to the emerging economies is bound to impact the nature and direction of GVCs. The current economic crisis has also highlighted the risks involved in export dependence and has shifted policy focus in many countries to the generation of domestic demand.
Secondly, while participation in GVCs clearly has its rewards, there is growing concern regarding the uneven distribution of the gains between countries, within countries and among participant firms. The increasing consolidation of GVCs tends to favour larger countries with more domestic demand and better infrastructure and larger firms with greater capability of scaling up. Such a trend is consistent with the economic logic of GVCs. However, this “process of unequalization”5 has implications for the political sustainability of globalization. It is therefore clearly relevant for policymakers at the national level to look at policy options that seek to improve outcomes for firms and workers in terms of incomes and employment. At the same time, it should be recognized that any economic activity carries with it risks of unequal benefits. The question for policymakers is to consider whether such risks emerging from GVCs are greater than in the case of counterfactual scenarios and whether they can be mitigated through appropriate policy instruments.
A third issue relates to the risk of transmission of exogenous shocks by GVCs. Critics of GVCs point to the speed with which the demand fallout of the current economic crisis has impacted developing country participants in GVCs, to argue against untrammelled exposure to GVCs and for risk mitigation measures. The 2008–09 downturn “resulted not only in larger declines in trade than had occurred previously but also declines that were more rapid”.6 While robust domestic demand can provide a cushion against such shocks, that avenue is not open to all economies, especially for countries with small domestic markets.
At a broader level, given their significant role in the global trading system, GVCs raise issues of international governance and rule making. Within GVCs, the rules are usually set by lead firms based on their requirements. The proliferation of product- and process-related private standards is an example of the exercise of this power. Such “private rules” can act as market entry barriers, especially where the lead firms imposing them have large market power. The antidote for this can only be a multilateral rule-making process that is in tune with market realities. It is often argued that in the
The globalization of supply chains – policy challenges for developing countries
317
absence of such a process, the new generation of deep RTAs is filling the breach. However, given the often-asymmetrical distribution of power between RTA members, it can be argued with equal conviction that rule making in such RTAs is susceptible to the same problems as witnessed in GVCs.
To summarize, policy formulation exercises to integrate GVCs into the national development strategies of developing countries must contend with a global economy in the throes of deep structural change. The shifts in the centres of final demand will have obvious implications for the nature, scope and governance of GVCs. The economic downturn in industrialized countries combined with robust growth in emerging economies is leading to consolidation of GVCs with a sharp reduction in the number of suppliers and changes in the pattern of value distribution within GVCs. These changes tend to favour larger, more capable suppliers in emerging economies. The significant role being played by GVCs in the global trading system also has implications for multilateral rule making.
13.3. Consolidation, value distribution, market shifts and participation
Milberg and Winkler distinguish between two types of consolidation of value chains – vertical and horizontal. The former relates to a reduction in the number of tiers in the value chain and the latter to the number of suppliers in a tier. It is logical to expect both types of consolidation in a downturn, but the real issue is its reversibility when demand rebounds. While there is broad evidence of consolidation across GVCs as a result of the present economic crisis, the bulk of this is occurring in buyer-led chains where relationships between buyer firms and suppliers are typically more short-term. Producer driven chains, which usually involve deeper relationships including technology sharing between lead firms and suppliers, have been less affected. These conclusions are borne out across a number of industries. The global apparel industry has undergone deep restructuring in recent years, first as a result of the WTO-driven phase-out of the quota regime in 2005 and now also due to the current economic downturn in major markets. As a result, a large number of marginal players (both countries and firms) have been edged out and buyers now prefer to work with “fewer, larger and more capable suppliers”.7 In the automobile industry, the economic crisis has accelerated the shift of demand and capacity towards emerging markets in large developing countries.8 The response of the electronics industry to the economic crisis highlights the strong role of deep supplier capabilities among contract manufacturers and platform leaders.9
Global value chains in a changing world
318
At the same time, given the history of dynamic change in the industry, incumbents cannot take their positions for granted and the structure and direction of electronics GVCs is bound to change in line with increasing capabilities and demand in emerging economies. The issue of reversibility of consolidation depends on a number of factors – the speed of recovery, the ability of surviving suppliers to expand capacity and capture scale economies and the entry barriers such capabilities would create for prospective entrants. Overall, the more capable survivors are, the more they are in a better position to expand when the market recovers.10 In general, much of the ongoing consolidation can be expected to be irreversible in the medium term.
The frequently cited examples of value distribution in Apple’s Ipod11 and Nokia’s N95 phone provide good illustrations of the low share of offshored manufacturing in the total value added in a product. Although the Ipod and N95 are mostly made in Asia, most of the value accrues in the United States and Europe, respectively. The “smile curve” provides graphic illustration of the same phenomenon – the bulk of the value capture of a product developed and owned by a lead firm takes place in the preproduction (product concept, design, R&D) and postproduction (sales and marketing, after sales) stages.12 This has clear lessons for industrial policy in developing countries. It is no longer enough to focus on manufacturing; it is essential for policy makers to look at all stages of the value chain in order to maximize income and employment outcomes. This calls for an integration of policies for manufacturing, services, investment, innovation and intellectual property in the larger trade policy regime.
It is almost axiomatic to contend that the “nature of final markets”13 plays a determinative role in economic growth. Some observers have speculated that the shift of markets away from the North could have negative implications for low-income economies participating in GVCs. They argue that the shift could entail a move from differentiated products to commodities, with less emphasis on quality, both in products and processes, environmental aspects and standards. Given the lesser complementarity in the economies of the emerging-economy buyers and the low-income economy suppliers, there would be greater competition in the division of labour within GVCs. This could put the low-income economies at a disadvantage in their efforts to move up the value chain.
However, these apprehensions remain largely untested against empirical evidence of shifts in GVCs that provide differentiated products to northern markets.14 As far as food and agricultural products especially are concerned, value added in low-income economies supplying their products to northern markets has been
The globalization of supply chains – policy challenges for developing countries
319
frequently constrained by the significant tariff escalation in the tariff structures of the northern markets as well as by other non-tariff barriers. The issue of standards is more complex. It can be argued that the proliferation of private standards in northern economies often has as much to do with the lead firms in buyer-driven GVCs seeking to add more value to their products through differentiation as it does with consumer preferences. There is evidence to suggest that “the value generated by the standard tends to be captured by downstream market operators, in particular large-scale retailers, and only a small share of it accrues to producers”.15 Regarding environmental aspects, advanced economies, especially while dealing with mineral-based products, have been quite content to export their pollution to developing country suppliers by encouraging processing in situ. The reasoning that less complementarity between the economies of emerging markets and low-income economies will discourage value addition in the latter is also open to question. Recent reports of labour shortages and increasing labour costs in China point to the dynamic nature of comparative advantage.
Overall, there is little hard evidence to suggest that the shift of markets away from the North would have a negative impact on the participation of low-income economies in GVCs. On the other hand, the increase in demand in emerging markets has helped to maintain or even enhance the incomes of low-income economy participants. Still, similar risks emerging from the consolidation in GVCs are real and well documented.
13.4. Globalization of services
Development theory has traditionally associated economic development with the expansion of manufacturing. However, the rapid growth in services trade in recent years has provided another additional opportunity for developing countries. Changes in communication technology have revolutionized the way services are organized and delivered. The technological advances that have led to the unbundling of services have created new opportunities for specialization and for the entry of newcomers into the value chain. An added advantage for the tradability of many modern services is that they are traded digitally and are therefore not subject to many of the trade barriers that typically affect merchandise trade. Based on the available evidence, it would be fair to say that the enormous expansion of trade in “modern” services in the last two decades demonstrates that we are now witnessing the emergence of a new paradigm for development that accords equal importance to services as a growth accelerator.
Global value chains in a changing world
320
The importance of services growth for developing countries can be gauged from the following indicators.
• In the last three decades, services have contributed more to total global growth than industry. Developing countries outperformed developed countries in growth of services exports, and their services exports grew faster than their goods exports
• In roughly the same period, the services sector led to rapid job creation in developed and developing countries, while industry and agriculture shed jobs
• The rise in the contribution of services to employment is associated with labour productivity growth. This implies that the global technology frontier for services is expanding
• The product mix of services exported by developing countries is changing with higher growth in modern services as compared to traditional services like tourism16
• There is good evidence to suggest that the sophistication of services exports is positively related to growth17 and that entry barriers to services exports are not too strongly related to the economic sophistication of the exporting country (as measured by per capita income)18
• Cross-country evidence from some 50 developing countries suggests that growth in the service sector is more correlated to poverty reduction than growth in manufacturing19
Given that the globalization of services is still far from achieving its potential, services-led growth strategies can potentially yield rich dividends for developing countries. Delivery through supply chains is intrinsic to the unbundling of services and the services economy can only grow through the vehicle of supply chains. An examination of the development implications of the rapidly increasing trade in services is therefore an important dimension of the policy debate on GVCs.
13.5. South Asia and GVCs – experience of some key sectors
Services
Services have led the growth process in South Asia in recent years and have enabled the region to match the high growth rates in East Asia. Labour productivity in services
The globalization of supply chains – policy challenges for developing countries
321
has expanded faster than in industry, and productivity growth in services in South Asia matches productivity growth in manufacturing in East Asia. This has helped the region to reduce poverty levels.20
Within the impressive growth of the services trade in South Asia, the performance of India’s information technology business process outsourcing (IT-BPO) industry has been remarkable. During fiscal year 2012, despite the global slowdown, Indian industry is expected to achieve aggregate revenues of over US$ 100 billion, including exports of US$ 69 billion. Of this, IT software and services revenue is expected to reach US$ 88 billion, reflecting growth of around 15 per cent over the previous year. Despite the controversies around offshoring, India was able to increase its share of the global sourcing industry from 51 per cent in 2009 to 58 per cent in 2011. Reflecting the growing sophistication and diversity of the Indian industry, engineering and R&D services, and software products constitute one fifth of its total software and services exports. The industry expects to add 230,000 jobs in fiscal year 2012, thus providing direct employment to about 2.8 million people and indirectly employing 8.9 million. The industry’s revenues now comprise around 7.5 per cent of India’s GDP compared to 1.2 per cent in 1998. Over the same period, its contribution to total Indian exports (merchandise plus services) increased from less than four per cent to about 25 per cent.21
The performance of India’s IT-BPO industry enables it to provide positive responses to several questions that policymakers concerned with GVCs would tend to ask. India’s participation in GVCs is creating jobs and augmenting incomes, thus helping to reduce poverty; it is moving up the value chain and scaling up to remain competitive; it is diversifying its markets in response to changing conditions; and it has been able to hold its own and even increase market share in the global sourcing industry during the economic crisis.
A number of factors have enabled India to take advantage of global opportunities to build its IT services industry. These include positive policies which have enabled its industry to take advantage of openness in key markets, high-quality telecom facilities including broadband, innovative programmes such as the government’s Software Technology Parks initiative in 1991. This initiative created the base for IT start-ups and high-quality tertiary education through institutions like the Indian Institutes of Technology that helped foster a large pool of highly skilled IT workers. A growing domestic economy needing IT solutions to enhance productivity has been another positive factor.
Global value chains in a changing world
322
The Indian automotive industry
The Indian automotive industry provides an illustration of how government policies can leverage domestic market advantages to improve the bargaining power of local firms and thus influence value distribution in a GVC. Initially, the industry developed under tightly controlled policy conditions. The Auto Components Licensing Policy of 1997 provided four requirements to be fulfilled by investors: establishment of production facilities, minimum foreign equity of US$ 50 million, a phased programme of indigenization and broad foreign exchange balancing over a defined period. The United States and the EU filed a complaint with the WTO, which was upheld, against the local content and indigenization requirements. However, India’s policy along with a high tariff regime contributed to its success in attracting the global automobile majors to set up production facilities in India. In fiscal year 2011, the industry produced over 20 million vehicles, including over two million passenger cars, with a turnover of US$ 58.58 billion. About 2.9 million vehicles were exported including over half a million passenger cars.22 Similarly, the auto components sector has witnessed rapid growth. In fiscal year 2011, the industry had a turnover of US$ 43.5 keep together billion including exports of US$ 6.8 billion. Some 59 per cent of the exports went to the United States and Europe.23
A mix of factors has enabled Indian automotive firms to straddle the value chains at all levels: high protection walls, policies that incentivize local production, a large and growing domestic market, a reservoir of skilled labour and strong IT skills. India’s strengths in IT-enabled design have helped Indian firms move into this area.24 These factors have also strengthened the bargaining position of Indian firms with the lead firms in the automotive GVC. The acquisition of foreign automobile brands (Jaguar and Land Rover by Tata Motors, SsangYong by Mahindra) has helped Indian firms to acquire valuable know-how, especially in design and development.25
The South Asian apparel industry
The GVC for apparel has witnessed fairly tumultuous times over the last decade leading to significant changes in the participation of countries and firms. The consolidation engendered by the Multi Fibre Arrangement’s phase-out has been intensified by the effects of the ongoing economic crisis. The skewed nature of global demand (in 2008, the EU, the United States, Japan, and the Russian Federation accounted for about 82 per cent of world apparel imports) has contributed to changes in the scope, participation and direction of the apparel GVC26 due to intensified competition for the
The globalization of supply chains – policy challenges for developing countries
323
reduced demand. Power equations between the various actors in the GVC (brand owners, retailers, purchasing agents and suppliers) have changed to the detriment of suppliers. The shakeout among suppliers has led to changes in the way the survivors deal with the lead firms with greater emphasis on long-term relationships, scale and full package capabilities. The export-driven business model has come under question and there is new emphasis on domestic markets.
The South Asian industry has not done too badly in the crisis, and Bangladesh has emerged as the star performer in the region. However, the economic crisis has highlighted the considerable potential efficiency gains from an integration of the textiles and clothing industry. This industry is extremely important for the region as it employs 55 million people directly and nearly 90 million indirectly. In 2007, textiles and clothing exports accounted for 80 per cent of Bangladesh’s total exports. The figures for Pakistan, Sri Lanka and India were 55 per cent, 45 per cent, and 12 per cent respectively. A recent study27 has pointed to the potential gains and the policy challenges that greater integration would entail. An indication of the challenges to integration is provided by the fact that, in many instances, despite the South Asian Free Trade Agreement (SAFTA), South Asian countries maintain a more restrictive trade regime with their regional trade partners than with the rest of the world, and many products being imported from the rest of the world find place in the sensitive lists for tariff concessions under SAFTA.
A similar ongoing study by UNCTAD28 (called “Intra-Regional Trade in Leather and Leather Products in South Asia: Identification of Potential Regional Supply Chains”) concludes that, with greater integration and removal of tariffs, intra-regional trade in leather and leather products can increase tenfold from the existing level (US$ 63 million in 2010).
13.6. Conclusions
Global value chains are the consequence of the geographical fragmentation of manufacturing and services and require a fresh policy paradigm if they are to be leveraged for development. Global commerce involves criss-crossing networks of goods, services, finance, capital, technology, intellectual property and people. National development strategies which aim to harness globalization for development must be based on an integrated approach that recognizes the organic links between these factors and seeks to remove impediments in their flows. The value chain framework provides a good basis for such integrated policy formulation. Such a
Global value chains in a changing world
324
policy framework would take developing country trade policymakers away from solely focusing on tariffs or industrial policy and towards the objective of maximizing value capture across the value chain.
The conceptual basis for value chains is economic efficiency based on transaction cost minimization, thus the foundation of an integrated policy approach must be domestic market integration. This is a task only partly accomplished in many developing countries. Effective participation in international value chains can only be built on the shoulders of efficient and well-integrated domestic markets; policy instruments such as Special Economic Zones can only be a partial, suboptimal panacea.
Regional value chains are a natural bridge between domestic and global value chains. They serve to expand markets and enhance scalability. Politically, they are an easier bridge to cross and successful regional value chains based on RTAs have the dual advantage of building political and strategic relationships along with economic relationships.
For many developing countries managing the risks inherent in GVCs is an important policy challenge. However, once the absence of a viable counterfactual to GVCs is acknowledged, policy attention can be focused on the risks, which are many: demand compression in existing markets, ever-changing product and process standards, the emergence of new technologies, changes in labour markets and food security challenges. Robust domestic market conditions can function as an antidote to these risks, but small low-income economies with poor governance structures will feel especially vulnerable.
The issue of rule-making for GVCs is linked with the larger objective of a fair distribution of value between all participants. The fact that such rules (like standards) are often being made by lead firms in a GVC highlights the extent to which multilateral rule- making has lagged behind market realities. The “deep” regional trade agreements have tried to fill the breach but their multiplicity can only contribute to greater complexities in the noodle bowl.. The most ambitious among them, the Trans Pacific Partnership (TPP), is now challenged by the newly launched Regional Comprehensive Economic Partnership (RCEP). Both a largely overlapping membership and overlapping value chains. These developments threaten the centrality of the WTO in the multilateral trading system and at the same time provide it with an opportunity to re-establish its relevance and pre-eminence. For this, the WTO requires a fresh mandate that acknowledges the organic linkages between manufacturing, services (including the movement of people), capital flows, technology and IPRs.
The globalization of supply chains – policy challenges for developing countries
325
In view of the largely market-driven nature of GVCs, multilateral rule-making for them requires a bespoke approach. Rule-making through a public-private partnership platform is one option and there are some existing initiatives that can provide such a template. “Principles for Responsible Agricultural Investment that Respects Rights, Livelihoods and Resources”, a joint initiative of FAO, IFAD, UNCTAD and the World Bank, seeks to establish a code of good practices for agricultural investments while respecting local rights and concerns like food security in developing countries.29 The principles provide a tool-kit of best practices, guidelines and governance frameworks for investors and host governments. The Extractive Industry Transparency Initiative (EITI) provides a global standard, based on public-private partnership, for ensuring transparency of payments from natural resources. It is followed in several countries.30 Such initiatives can create a possible basis for intergovernmental agreements to assist low-income countries to obtain a fair share of value from GVCs. They cannot, however, be a substitute for basic development work like infrastructural development and capacity building in such countries.
Endnotes
1 Barrientos et al., (2011).
2 Gereffi (2012).
3 Gereffi – ibid.
4 Milberg and Winkler (2010).
5 Kaplinsky (2004).
6 Milberg and Winkler, ibid.
7 Gereffi and Frederick (2010).
8 Van Biesebroeck and Sturgeon (2010).
9 Sturgeon and Kawakami (2010).
10 Milberg and Winkler (2010).
11 Linden et al., (2007).
12 Baldwin (2012).
13 Kaplinsky and Farooki (2010).
Global value chains in a changing world
326
14 Kaplinsky and Farooki, ibid.
15 Liu (2009).
16 Ghani et al., (2012).
17 Mishra et al., (2011).
18 Ghani et al., ibid.
19 Ghani (2010).
20 Ghani, ibid.
21 NASSCOM, “Indian IT-BPO Industry, available at: “ http://www.nasscom.org/indian-itbpo-industry.
22 Society of Indian Automobile Manufacturers, www.siamindia.com.
23 ACMA, “Auto Component Industry in India: Growing Capabilities & Strengths,” PowerPoint presentation, http://www.acmainfo.com/pdf/Status_Indian_Auto_Industry.pdf.
24 Nathan and Kalpana (2007).
25 Van Biesebroeck and Sturgeon (2010).
26 Gereffi and Frederick (2010).
27 UNCTAD (2011).
28 UNCTAD (2012).
29 FAO, IFAD, UNCTAD, World Bank (2010).
30 Available at: http://eiti.org/eiti
References
Automotive Component Manufacturers Association of India (ACMA). “Auto Component Industry in India: Growing Capabilities & Strengths.” PowerPoint presentation. Available at: http://www.acmainfo.com/pdf/Status_Indian_Auto_Industry.pdf.
Baldwin, R. 2012. “Global Supply Chains: Why They Emerged, Why They Matter, and Where They Are Going”, Working Paper FGI-2012-1 (Hong Kong, Hong Kong, China; Fung Global Institute) .
The globalization of supply chains – policy challenges for developing countries
327
Barrientos, S.; Gereffi, G.; Rossi, A. 2011. “Economic and Social Upgrading in Global Production Networks: A New Paradigm for a Changing World.” In International Labour Review 150(3–4) (2011): 319.
Cattaneo, O.; Gereffi, G.; Staritz, C. (eds). 2010. Global Value Chains in a Post Crisis World: A Development Perspective. (Washington, DC, World Bank).
FAO, IFAD, UNCTAD, World Bank. 2010. “Principles for Responsible Agricultural Investment that Respects Rights, Livelihoods and Resources”. Available at: http://unctad.org/en/docs/ciicrp3_en.pdf
Ghani, E. (ed.). 2010. The Service Revolution in South Asia. (New Delhi, India, Oxford University Press).
Ghani, E.; Goswami, A. G.; Kharas, H. 2012. “Service with a Smile.” PREM Network. Economic Premise 96, November (Washington, DC, World Bank). Available at: http://siteresources.worldbank.org/EXTPREMNET/Resources/EP96.pdf.
Gereffi, G. 2012. “Global Value Chains in a Post-Washington Consensus World: Shifting Governance Structures, Trade Patterns and Development Prospects”, forthcoming: Special Issue of Review of International Political Economy.
Gereffi, G.; Frederick, S. 2010. “The Global Apparel Value Chain, Trade and the Crisis: Challenges and Opportunities for Developing Countries.” in O. Cattaneo, G. Gereffi, and C. Staritz (eds): Global Value Chains in a Post Crisis World: A Development Perspective. (Washington, DC, World Bank).
Gereffi, G.; Fernandez-Stark, K. 2010. “The Offshore Services Value Chain: Developing Countries and the Crisis.” in O. Cattaneo, G. Gereffi, and C. Staritz (eds): Global Value Chains in a Post Crisis World: A Development Perspective. (Washington, DC, World Bank).
Kaplinsky, R.; Farooki, M. 2010. “What Are the Implications for Global Value Chains when the Market Shifts from the North to the South” in World Bank Policy Research Working Paper No. 5205, February (Washington, DC, World Bank).
Kaplinsky, R. 2004. “Sustaining Income Growth in a Globalising World: The Search for the Nth Rent.” . IDS Discussion Paper No. 365 (Brighton, UK, Centre for Research in Innovation Management, University of Brighton). Available at: http://www.ids.ac.uk/files/RKrentJan04.pdf. and at: http://www.ids.ac.uk/files/Dp365.pdf.
Linden, G.; Kraemer, K. L.; Dedrick, J. 2007. “Who Captures Value in a Global Innovation System? The Case of Apple’s iPod”, Personal Computing Industry Center (PCIC), (Irvine, CA, Paul Merage School of Business, University of California, June).
Global value chains in a changing world
328
Liu, P. 2009. “Private Standards in International Trade: Issues and Opportunities.” Paper presented at WTO workshop on Environment-Related Private Standards, Certification and Labelling Requirements. (Geneva, Switzerland, World Trade Organization, 9 July).
Milberg, W.; Winkler, D. 2010. “Trade, Crisis, and Recovery: Restructuring Global Value Chains.” in O. Cattaneo, G. Gereffi, and C. Staritz (eds): Global Value Chains in a Post Crisis World: A Development Perspective. (Washington, DC, World Bank).
Mishra, S.; Lundstrom, S.; Anand, R. 2011. “Service Export Sophistication and Economic Growth.” Policy Research Working Paper 5606. (Washington, DC, World Bank). Available at: http://www.worldbank.org/economicpremise.
National Association of Software and Services Companies (NASSCOM). 2012. “Indian IT-BPO Industry.” Available at: http://www.nasscom.org/indian-itbpo-industry.
Nathan, D.; Kalpana, V. 2007. “Issues in the Analysis of Global Value Chains and their Impact on Employment and Incomes in India.” (Geneva, Switzerland, International Institute for Labour Studies. Available at: http://www.ilo.org/public/english/bureau/inst/publications/discussion/dp18307.pdf.
Sturgeon, T.L. and Kawakami, M. 2010. “Global value chains in the electronic industry: was the crisis a window of opportunity for developing countries?” in Cattaneo, Gereffi and Staritz, eds.
Trienekens, J. 2011. “Agricultural Value Chains in Developing Countries: A Framework for Analysis.” In International Food and Agribusiness Management Review 14(2).
United Nations Conference on Trade and Development (UNCTAD). 2011. “Potential Supply Chains in the Textiles and Clothing Sector in South Asia”. (Delhi, India, Centre for WTO Studies; London, Commonwealth Secretariat).
United Nations Conference on Trade and Development (UNCTAD). 2012. “Intra-Regional Trade in Leather and Leather Products in South Asia: Identification of Potential Regional Supply Chains”. On-going. Regional Industry Consultation Paper under UNCTAD’s Project on Development-Oriented Regional Integration in South Asia.
Van Biesebroeck, J.; Sturgeon, T.J. 2010. “Effects of the 2008-09 Crisis on the Automotive Industry in Developing Countries: A Global Value Chain Perspective.” in O. Cattaneo, G. Gereffi, and C. Staritz (eds): Global Value Chains in a Post Crisis World: A Development Perspective. (Washington, DC, World Bank).
329
14 Global value chain-oriented industrial policy: the role of emerging economies
Gary Gereffi and Timothy Sturgeon
14.1. Introduction
In the past two decades, profound changes in the structure of the global economy have reshaped global production and trade and altered the organization of industries and national economies. The geographic fragmentation of industries, where value is added in multiple countries before products make their way to consumers, has been accompanied by vast improvements in the functional integration of these far-flung activities, creating what have come to be known as global value chains, or GVCs. As supply chains become global in scope, more intermediate goods are traded across borders, and more imported parts and components are embodied in exports (Feenstra, 1998). In 2009, world exports of intermediate goods exceeded the combined export values of final and capital goods for the first time, representing 51 per cent of non-fuel merchandise exports (WTO and IDE-JETRO, 2011). Governments and international organizations are taking notice of the effects of GVCs on global trade and development (OECD, 2011; WTO and IDE-JETRO, 2011; UNCTAD, 2013; World Economic Forum, 2013).
The rise of GVCs occurred in a period of falling trade barriers, the rise of the World Trade Organization (WTO), and the policy prescriptions associated with the “Washington Consensus” – governments had only to provide a strong set of “horizontal” policies (such as education, infrastructure, and macro-economic stability) and be open to trade to succeed. Of course, many observers noted that the fastest growing emerging economies did much more than this through a set of industrial policies that targeted key domestic industries for growth, either behind protectionist walls, known as import-substituting industrialization (ISI), and increased market access through export promotion, known as export-oriented industrialization (EOI). The goal of these
Global value chains in a changing world
330
“domestic industrial policies” was to nurture a set of fully blown national industries in key sectors that could eventually compete head to head with the industrialized nations (Baldwin, 2011).
Today, despite a growing list of signatories to the World Trade Organization, industrial policy is on the upswing. WTO accession often comes with allowances for selective industrial policies (such as trade promotion, local content rules, taxes, tariffs and more indirect programs that drive local production) to remain in force for specified periods. Bilateral trade agreements can supersede what has been agreed to under WTO rules, and a handful of relatively large and advanced emerging economies (such as those in the G-20) have more influence in the institutions of global governance and are using it to create greater leeway to engage in activist industrial policies.
Still, the fragmentation of global industries in GVCs complicates industrial policy debates. In this chapter, we argue that there can be no return to the ISI and EOI policies of old. Domestic industries in both industrialized and developing countries no longer stand alone and compete mainly through arms-length trade; instead, they have become deeply intertwined through complex, overlapping business networks created through recurrent waves of foreign direct investment (FDI) and global sourcing. Companies, localities and entire countries have come to occupy specialized niches within GVCs. For these reasons, today’s industrial policies have a different character and generate different outcomes from before. Intentionally or not, governments currently engage in GVC-oriented industrialization when targeting key sectors for growth. In this paper we develop the notion of GVC-oriented industrialization through a comparison of seven emerging economies and a case study of Brazil’s consumer electronics industry.
The roots of GVCs extend back to experiments with global sourcing by a handful of pioneering retailers (such as JC Penny, Sears, Kmart) and manufacturing enterprises (IBM, General Motors, Volkswagen) that set up production in East Asia, Mexico and a handful of other locations around the world in the 1970s and 1980s with the explicit purpose of lowering production costs and exporting finished goods back to home markets (Fröbel et al., 1980; Dassbach, 1989; Gereffi, 1994, 2001).
After 1989, the opening of China, the Russian Federation, India and Brazil (the so-called “BRIC” countries) added huge product and labour markets that had been all but outside the capitalist trading system, nearly doubling the field of play for international
Global value chain-oriented industrial policy: the role of emerging economies
331
companies (Freeman, 2006). Faced with slow growth at home, large “lead” firms in GVCs rushed to set up operations in BRIC countries, especially China, in an effort to carve out brand recognition and market share in rapidly expanding consumer markets and to cut costs on goods produced for export back to home markets. This greatly accelerated the globalization process, since these giant economies offered seemingly inexhaustible pools of low-wage workers, increasingly capable manufacturing and trade infrastructures, abundant raw materials and huge underserved domestic markets with incipient middle classes.
Over time, retailers and branded manufacturers in wealthy countries became more experienced with international outsourcing. In response, developing countries acquired the infrastructure and capabilities needed to sustain larger scale operations, and suppliers upgraded their capabilities in response to larger orders for more complex goods (Hamilton and Gereffi, 2009). In the 1990s, the most successful US- and Europe-based manufacturers quickly became huge global players, with facilities in scores of locations around the world (e.g., Siemens, Valeo, Flextronics), and a handful of elite East Asian suppliers (Pao Chen, Quanta, Foxconn) and trading companies (for example Li & Fung) also took on more tasks for multinational affiliates and global buyers. These firms expanded production, not only in China but also in other Asian countries and more recently in Africa, East Europe and Latin America as well. As the resources in the global supply-base improved, more lead firms gained the confidence to embrace the twin — and often intertwined — strategies of outsourcing and offshoring.
In the 2000s, the industries and activities encompassed by GVCs grew exponentially, driving trade in finished goods and customized intermediates (such as components and sub-assemblies), spreading from manufacturing into energy, food and a growing set of services previously considered to be “untradeable,” ranging from call centres and accounting, to medical procedures and R&D (Dossani and Kenney, 2003; Engardio et al., 2003; Engardio and Einhorn, 2005; Wadhwa et al., 2008; Cattaneo et al., 2010; Staritz et al., 2011). The impact of these changes was felt most strongly in a handful of countries. China became the “factory of the world,” India the world’s “back office,” Brazil had a wealth of agricultural and primary commodities and the Russian Federation possessed enormous reserves of natural resources plus the military technologies linked to its role as a Cold War superpower. For goods that require shorter supply lines such as “fast fashion” apparel and automobiles, the countries of Eastern Europe joined more traditional “export processing” locations such as Mexico and North Africa.
Global value chains in a changing world
332
The rapidity of these changes left the scholarly community struggling to catch up. Beginning in the early 2000s, the GVC concept gained popularity as a way of framing and characterizing the international expansion and geographical fragmentation of contemporary supply chains (Gereffi et al., 2001; Dicken at al., 2001; Henderson et al., 2002; Gereffi, 2005; Feenstra and Hamilton, 2006; Gereffi and Lee, 2012). Much of this research and theoretical work has focused on how “lead” firms in specific GVCs have driven this process in various ways. Decisions about outsourcing and offshoring are, after all, strategic decisions made by managers. Such decisions, however, are not made in a vacuum. The policies and programmes of countries and multilateral institutions set the context for corporate decision-making. We have seen an evolution in the form and effects of industrial policy along with the evolution of the business networks that comprise GVCs.
Today the organization of the global economy is entering a new phase, what some have referred to as a “major inflection point” (Fung, 2011), which could have dramatic implications for both emerging and industrialized countries, firms and workers. As world trade rebounds from the 2008–09 economic crisis, emerging economies have become a major engine of growth. Slow growth in the global North since the mid-1980s was dampened further by the latest crisis, whereas demand is quickly growing in the global South, particularly in large emerging economies like China, India and Brazil (Staritz et al., 2011). Over the period 2005–10, the merchandise imports of the European Union and the United States increased by 27 per cent and 14 per cent, respectively, while emerging economies expanded their merchandise imports much faster: Brazil (147 per cent), India (129 per cent), China (111 per cent) and South Africa (51 per cent). These differences represented more than an acceleration of previous global sourcing arrangements; they represented a shift in end markets to the developing world: in 2010, a full 52 per cent of Asia’s manufactured exports were destined for developing countries (WTO, 2011).
Clearly, developing countries are now in a position to exert greater influence over the shape of the global order, economically and politically, as the impact of the “Washington consensus” as a paradigm for developing countries wanes (Gore, 2000). However, no overarching alternative development strategy has taken its place. Thus, our analysis of GVCs in this new period must take account not only of changes in the organization of production and trade on a global scale, but also the role of emerging economies as new markets and production hubs in the global economy.
The remainder of this chapter is divided into four parts. First, we examined the export performance of seven of the most significant emerging economies: China, India,
Global value chain-oriented industrial policy: the role of emerging economies
333
Brazil, Mexico, the Russian Federation, the Republic of Korea and South Africa, noting the changing distribution of their exports across four broad technology categories between 2000 and 2011. Second, we then examine the kinds of industrial policies utilized by these emerging economies and propose a new typology that includes the category of GVC-oriented industrial policies. Third, we illustrate how industrial policy intersects with GVCs in the context of the consumer electronics industry in Brazil. We conclude with a reprise of GVC-oriented industrial policies and provide some reflections about the implications of these trends for the future of the global economy.
14.2. Emerging economies in comparative perspective
A dynamic set of large emerging economies, initially referred to as BRICs (Brazil, the Russian Federation, India and China), are becoming significant drivers of aggregate supply and demand in the global economy.1 In this section, we broaden the focus to a set of seven emerging economies that belong to what O’Neill (2011) sees as contemporary “growth economies”: China, India, Brazil, Mexico, the Russian Federation, the Republic of Korea and South Africa. These countries are quite diverse in terms of their economic and social characteristics. However, they are all centrally involved in distinct types of GVCs in agriculture, extractive industries (mining, oil and gas), manufacturing, and services. Together, these seven emerging economies account for 45 per cent of the world’s population, 23 per cent of gross domestic product (GDP), and 22 per cent of global exports, and their GDP growth rates are nearly double the world average (4.8 per cent versus 2.7 per cent). See Table 14.1.
The specific roles of these seven countries in the global economy vary according to their openness to trade and foreign investment; endowments of natural, human and technological resources; their geopolitical relationships to the world’s most powerful countries; and the characteristics of their immediate neighbours. Many have significantly improved their relative position in the global economy, surging ahead of the advanced industrial countries in terms of export performance for example. Between 1995 and 2007, the global export shares of the United States and Japan fell by 3.8 and 3.7 percentage points, respectively, while China more than doubled its share from four per cent in 1995 to 10.1 per cent in 2007, making it the world export leader (ahead of Germany, the United States and Japan). The Republic of Korea, Mexico, Turkey, South Africa, and the former transition countries in central Europe also increased their export shares during this period (Beltramello et al., 2012).
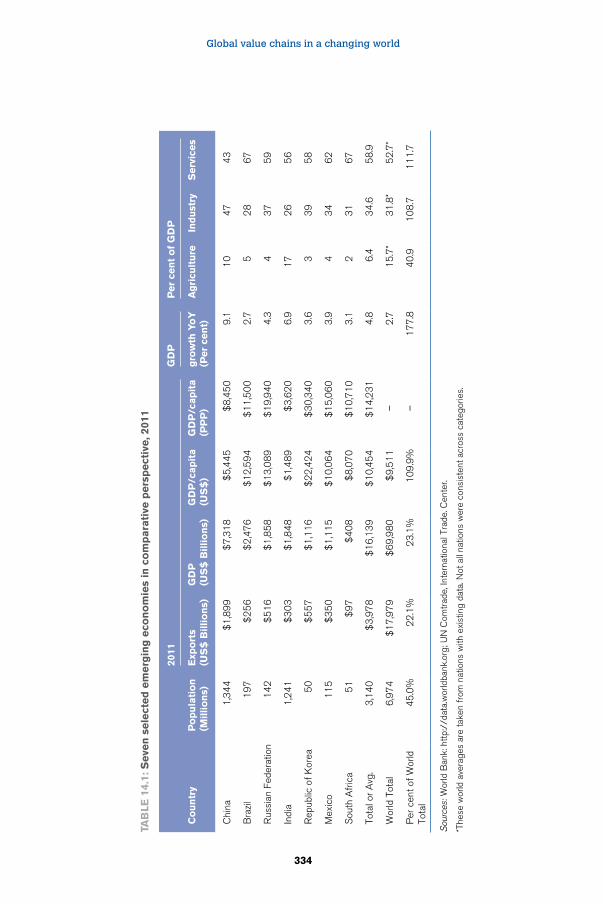
Global value chains in a changing world
334
Tab
le 1
4.1:
Seve
n s
ele
cted
em
erg
ing
eco
no
mie
s in
co
mp
ara
tive
pers
pect
ive, 2
011
2011
GD
PP
er
cen
t o
f G
DP
Co
un
try
Po
pu
lati
on
(M
illi
on
s)e
xpo
rts
(U
S$
bil
lio
ns)
GD
P
(US
$ b
illi
on
s)G
DP
/cap
ita
(US
$)
GD
P/c
ap
ita
(PP
P)
gro
wth
Yo
Y
(Per
cen
t)a
gri
cult
ure
Ind
ust
ryS
erv
ices
Chi
na1
,34
4
$1
,89
9$
7,3
18
$5
,44
5$
8,4
50
9.1
10
47
43
Bra
zil
19
7
$2
56
$2
,47
6$
12
,59
4$
11
,50
02
.75
28
67
Rus
sian
Fed
erat
ion
14
2
$5
16
$1
,85
8$
13
,08
9$
19
,94
04
.34
37
59
Indi
a1
,24
1
$3
03
$1
,84
8$
1,4
89
$3
,62
06
.91
72
65
6
Rep
ublic
of
Kor
ea5
0
$5
57
$1
,11
6$
22
,42
4$
30
,34
03
.63
39
58
Mex
ico
11
5
$3
50
$1
,11
5$
10
,06
4$
15
,06
03
.94
34
62
Sou
th A
fric
a5
1
$9
7$
40
8$
8,0
70
$1
0,7
10
3.1
23
16
7
Tota
l or
Avg
.3
,14
0
$3
,97
8
$1
6,1
39
$
10
,45
4$
14
,23
14
.86
.43
4.6
58
.9
Wor
ld T
otal
6,9
74
$
17
,97
9$
69
,98
0
$9
,51
1–
2.7
15
.7*
31
.8*
52
.7*
Per
cen
t of
Wor
ld
Tota
l4
5.0
%2
2.1
%2
3.1
%1
09
.9%
–1
77
.84
0.9
10
8.7
11
1.7
Sou
rces
: Wor
ld B
ank:
htt
p://
data
.wor
ldba
nk.o
rg; U
N C
omtr
ade,
Inte
rnat
iona
l Tra
de. C
ente
r.
*The
se w
orld
ave
rage
s ar
e ta
ken
from
nat
ions
with
exi
stin
g da
ta. N
ot a
ll na
tions
wer
e co
nsis
tent
acr
oss
cate
gorie
s.
Global value chain-oriented industrial policy: the role of emerging economies
335
Although collectively these seven nations have considerable economic influence China is the global pacesetter of the group. While China and India are the most populous countries in the world at 1.3 and 1.2 billion inhabitants, respectively, China is the undisputed export leader with US$ 1.9 trillion in exports in 2011. China’s export total is equal to that of the Republic of Korea, the Russian Federation, India, Brazil and Mexico combined, while China’s GDP has grown at over nine per cent per year for over 30 years. It is now the second-largest economy in the world (trailing only the United States) and has overtaken Germany as the world’s largest exporter (Beltramello et al., 2012). Notwithstanding China’s rapid economic growth, its GDP per capita is the second lowest among the emerging economies in 2011 (US$ 5,445), well ahead of India (US$ 1,489), but less than half that of Brazil and the Russian Federation, and just one-quarter that of the Republic of Korea. On average, the GDP per capita of these seven emerging economies is about ten per cent above the world average in 2011 (see Table 14.1).
An indicator of the roles emerging economies play in GVCs can be found in their export profiles, broadly classified by the technological content of their exports. Using a classification scheme introduced by Sanjaya Lall (2000) that groups traded goods according to primary products plus four types of manufactured exports (resource-based, low-tech, medium-tech and high-tech), Table 14.2 highlights some of the differences between these countries in terms of their export profiles. Three of the emerging economies are heavily oriented toward primary product or resource-based exports (the first two columns in Table 14.2): the Russian Federation (72 per cent), Brazil (69 per cent), and South Africa (59 per cent). Half of India’s exports are resource oriented, with another 40 per cent being low tech (primarily apparel products) and medium technology manufactured goods.2 China, the Republic of Korea and Mexico, by contrast, are heavily involved in manufacturing GVCs. Over 90 per cent of China’s exports are manufactured goods, while a preponderance of the exports by the Republic of Korea (72 per cent) and Mexico (60 per cent) are medium technology (automotive, machinery) and high technology (mainly electronics) exports.
If we look at trends in these export patterns between 2000 and 2011, we see that China and India have increased their exports over six-fold, Brazil and the Russian Federation each increased their exports around 360 per cent, and South Africa and the Republic of Korea more than doubled their exports (Table 14.2). The fastest growing exports in these countries were primary products and resource-based manufactures. The boom in primary product exports since 2000 has largely been driven by China’s
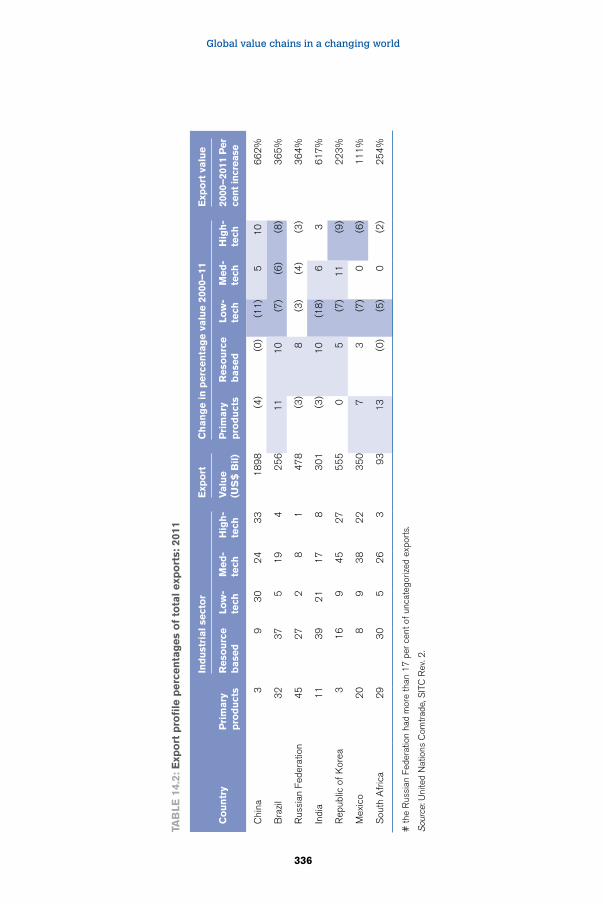
Global value chains in a changing world
336
Tab
le 1
4.2:
exp
ort
pro
file
perc
en
tag
es
of
tota
l exp
ort
s: 2
011
Ind
ust
rial
sect
or
exp
ort
Ch
an
ge i
n p
erc
en
tag
e v
alu
e 2
000–
11e
xpo
rt v
alu
e
Co
un
try
Pri
mary
p
rod
uct
sR
eso
urc
e
base
dlo
w-
tech
Med
-te
chH
igh
-te
chV
alu
e
(US
$ b
il)
Pri
mary
p
rod
uct
sR
eso
urc
e
base
dlo
w-
tech
Med
-te
chH
igh
-te
ch20
00–
2011
Per
ce
nt
incr
ease
Chi
na3
93
02
43
31
89
8(4
)(0
)(1
1)
5
10
6
62
%
Bra
zil
32
37
51
94
25
61
1
10
(7
)(6
)(8
)3
65
%
Rus
sian
Fed
erat
ion
45
27
28
14
78
(3)
8
(3)
(4)
(3)
36
4%
Indi
a1
13
92
11
78
30
1(3
)1
0
(18
)6
3
6
17
%
Rep
ublic
of
Kor
ea3
16
94
52
75
55
0
5
(7)
11
(9
)2
23
%
Mex
ico
20
89
38
22
35
07
3
(7
)0
(6
)1
11
%
Sou
th A
fric
a2
93
05
26
39
31
3
(0)
(5)
0
(2)
25
4%
# th
e R
ussi
an F
eder
atio
n ha
d m
ore
than
17
per
cen
t of
unca
tego
rized
exp
orts
.
Sou
rce:
Uni
ted
Nat
ions
Com
trad
e, S
ITC
Rev
. 2.
Global value chain-oriented industrial policy: the role of emerging economies
337
imports of the raw materials needed to fuel its industrial growth. At the same time, low-technology exports declined in all of these emerging economies, reflecting slack consumer demand in advanced economies, especially as a result of the 2008–09 economic recession.
Though such gross export figures do not account for the technological content of imported inputs, which new data sets will allow us to determine in future research,3 it is still notable that these emerging economies made their most significant gains in exports of high and medium-technology products, previously the stronghold of advanced industrial countries. While the export of final products provides only a partial picture of the technological development of each economy, it does signal that these countries have come to play important roles in the GVCs of relatively advanced products in technology-intensive industries, such as electronics and motor vehicles. This phenomenon was mainly driven by China, whose share of exports of goods in high-tech industries (mainly electronics) soared by 13.5 percentage points in the period 1995–2007, moving it ahead of the United States as the world’s largest exporter of high-tech products (Beltramello et al., 2012).
In summary, our focus on these seven emerging economies serves two purposes. First, we demonstrate that these large, dynamic countries are deeply entrenched in GVCs but in very different ways. Second, given recent changes in the global economy, we believe that the role of emerging economies in GVCs is undergoing a number of changes in the post-Washington consensus era, including an increasingly central role for China, a greater emphasis on production and upgrading for the domestic market, shifting export markets with a greater role for South-South trade, and a new form of industrial policy in emerging economies (Gereffi, forthcoming). It is to this latter topic that we now turn.
14.3. GVCs and industrial policy: an evolving debate
Twentieth-century debates over the merits of industrial policy as a strategy for economic development occurred before there was broad recognition of the importance of GVCs (Amsden, 1989; Wade, 1990; World Bank, 1993; Evans, 1995; Chang, 2002). The GVC lens provides some crucial insights into the processes of contemporary economic development. A main difference is the potential for vertical specialization, not only at the level of firms but also at the level of nations. China might be the “world’s workshop,” but much of the work is in producing products designed and developed elsewhere. The central goals of industrial policy in the GVC context
Global value chains in a changing world
338
shift from creating fully blown, vertically integrated national industries to moving into higher-value niches in GVCs.
Industrial policies that take the new realities of GVCs into account include traditional measures to regulate links to the global economy, especially regulation of trade, FDT and exchange rates used in ISI and EOI policies that sought to elevate the position of “national champions” (Baldwin, 2011). Today, GVC-oriented industrial policy focuses to a greater extent than in the past on the intersection of global and local actors, and it takes the interests, power and reach of lead firms and global suppliers into account, accepts international (and increasingly regional) business networks as the appropriate field of play and responds to pressures from international non-governmental organizations (NGOs). Upgrading national firms in this context is not an easy task. Because GVC lead firms induce suppliers in different countries to compete with each other for orders, and they often choose to work with the same global suppliers in multiple locations to reduce transaction costs, states tend to have less leverage to demand local content requirements or less scope to develop links to domestic suppliers.
In the face of such challenges, some large emerging economies are shifting their development strategies inward and relying more extensively on regional production networks buttressed by regional industrial policy. China’s upgrading strategy now operates on a global scale because Chinese firms have become such large foreign investors and buyers of raw materials (Kaplinsky et al., 2010). China’s rise as a major global buyer means that South-South trade will continue to expand as a share of world trade. While China has instituted policies to ensure domestic processing of raw materials from the rest of the world, China’s trading partners are resisting these.4
One example is South Africa, whose policy emphasizes regional integration as a basis for industrial upgrading, focused on mining, agriculture and pharmaceuticals (Davies, 2012). South Africa has announced a strategy of additional processing of regionally sourced minerals shipped to China in order to drive skill development, higher wages and large profits within Africa. While it remains to be seen how other countries in Sub-Saharan Africa respond to these ideas since higher value processes are likely to be concentrated in South Africa, this regional industrial policy is based on the view that African companies will have access to more minerals and raw materials, greater productive and processing capacity and larger markets, resulting in region-wide upgrading.
Global value chain-oriented industrial policy: the role of emerging economies
339
This suggests that regional integration strategies, including preferential trade agreements (PTAs), economic cooperation arrangements and regional production networks will increasingly be based on supply-side strategies rather than the traditional demand-side considerations that usually justify regional integration. The demand-side logic of regional integration highlights expanding market size, market access and the possibility of capturing FDI and better scale economies by serving this larger market. The supply-side approach uses regional integration to create scale and complementarities that can drive more production and processing and thus higher-value exports from the region.
Large emerging economies clearly have more options in terms of upgrading within GVCs than small economies. They can focus on manufactured exports, as China and Mexico have done since the mid-1990s, but they can also reorient their productive capacity to serve domestic demand if export markets become less attractive. While both small and large countries can pursue upgrading at the regional level by diversifying or adding new capabilities that aren’t available at the national level, large countries clearly have more leverage in such arrangements. Large countries with high potential for market growth (such as the BRICs) can also institute policies to drive FDI in technology- and capital-intensive sectors such as electronics and motor vehicles.
Small countries have fewer options. Their market size is not large enough to attract FDI for the local market, and domestic firms tend to be small-scale and less advanced. However, the regional organization of some GVCs has created opportunities for smaller countries to leverage low costs and proximity to large markets to build export capacities in specialized GVC niches (like intermediate goods) in the context of regional production systems. Costa Rica, for example, has clear supply-side constraints related to productive capacity and skills and conceivably could partner with Mexico to enhance its training programs and skills development. Nicaragua, whose apparel firms have been buying textiles from East Asia, is consciously pursuing supply arrangements with textile firms in Honduras and Guatemala. In sum, specialization and regional GVC linkages matter for political and economic integration in a way that was not the case previously.
In order to view these industrial policies in a more systematic way, we have created a typology of the various kinds of industrial policies that characterize the contemporary emerging economies (see Table 14.3). We distinguish three types of industrial policies: “horizontal” policies that affect the entire national economy; “selective”, or “vertical”, industrial policies targeted at particular industries or sectors; and GVC-oriented
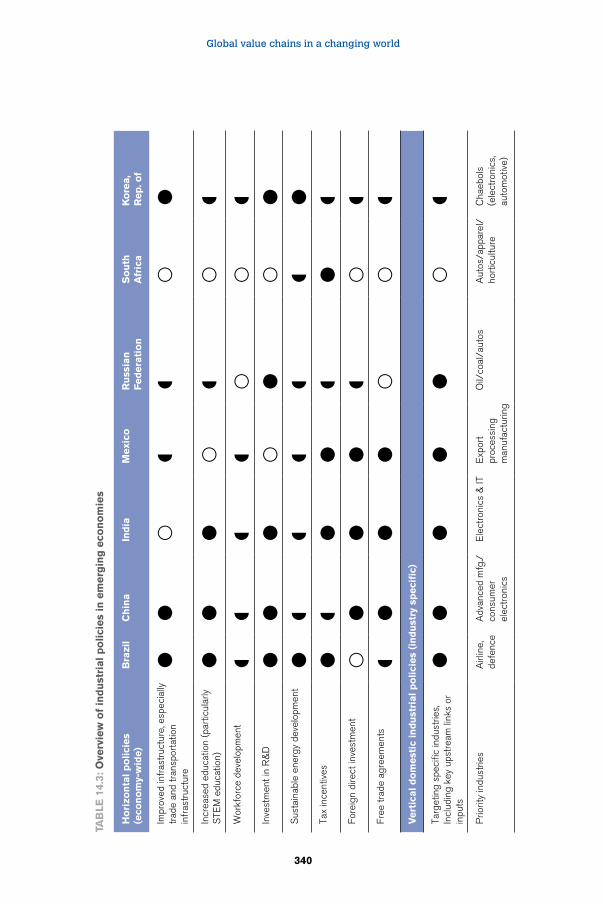
Global value chains in a changing world
340
Tab
le 1
4.3:
Ove
rvie
w o
f in
du
stri
al p
olici
es
in e
merg
ing
eco
no
mie
s
Ho
rizo
nta
l p
oli
cies
(eco
no
my-
wid
e)
bra
zil
Ch
ina
Ind
iaM
exi
coR
uss
ian
F
ed
era
tio
nS
ou
th
afr
ica
Ko
rea,
R
ep. o
f
Impr
oved
infr
astr
uctu
re, e
spec
ially
tr
ade
and
tran
spor
tatio
n in
fras
truc
ture
Incr
ease
d ed
ucat
ion
(par
ticul
arly
S
TEM
edu
catio
n)
Wor
kfor
ce d
evel
opm
ent
In
vest
men
t in
R&
D
Sus
tain
able
ene
rgy
deve
lopm
ent
Tax
ince
ntiv
es
Fo
reig
n di
rect
inve
stm
ent
Fr
ee tr
ade
agre
emen
ts
Vert
ical
do
mest
ic i
nd
ust
rial
po
lici
es
(in
du
stry
sp
eci
fic)
Targ
etin
g sp
ecifi
c in
dust
ries,
Incl
udin
g ke
y up
stre
am li
nks
or
inpu
ts
Prio
rity
indu
strie
sA
irlin
e,
defe
nce
Adv
ance
d m
fg./
co
nsum
er
elec
tron
ics
Ele
ctro
nics
& IT
Exp
ort
proc
essi
ng
man
ufac
turin
g
Oil/
coal
/aut
osA
utos
/app
arel
/ho
rtic
ultu
reC
haeb
ols
(e
lect
roni
cs,
auto
mot
ive)
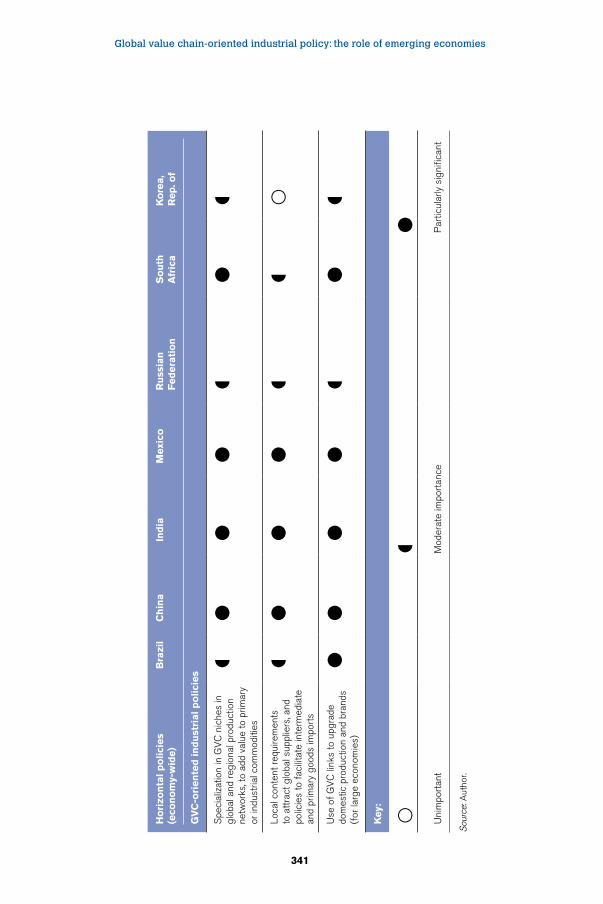
Global value chain-oriented industrial policy: the role of emerging economies
341
Ho
rizo
nta
l p
oli
cies
(eco
no
my-
wid
e)
bra
zil
Ch
ina
Ind
iaM
exi
coR
uss
ian
F
ed
era
tio
nS
ou
th
afr
ica
Ko
rea,
R
ep. o
f
GV
C-o
rien
ted
in
du
stri
al
po
lici
es
Spe
cial
izat
ion
in G
VC
nic
hes
in
glob
al a
nd r
egio
nal p
rodu
ctio
n ne
twor
ks, t
o ad
d va
lue
to p
rimar
y or
indu
stria
l com
mod
ities
Loca
l con
tent
req
uire
men
ts
to a
ttra
ct g
loba
l sup
plie
rs, a
nd
polic
ies
to f
acili
tate
inte
rmed
iate
an
d pr
imar
y go
ods
impo
rts
Use
of
GV
C li
nks
to u
pgra
de
dom
estic
pro
duct
ion
and
bran
ds
(for
larg
e ec
onom
ies)
Key:
Uni
mpo
rtan
t
Mod
erat
e im
port
ance
Par
ticul
arly
sig
nific
ant
Sou
rce:
Aut
hor.
Global value chains in a changing world
342
industrial policies that leverage international supply chain linkages or dynamics to improve a country’s role in global or regional value chains.
“Horizontal” policies focus on the basic building blocks of competitive national economies such as education, health, infrastructure and R&D expenditures. Although these areas all provide attractive opportunities for private investors, the public sector typically plays a role in providing widespread access to these factors as public goods. While “horizontal” policies are crosscutting and in principle have economy-wide effects, such policies may also target particular national industries or GVCs (such as tax credits for shale gas or oil investors). In these cases, the policy in question could be analysed in either of the other two categories in Table 14.3.
Domestic industrial policies tend to be “selective” or “vertical” because they are associated with prioritizing particular industries at the national level. This has been justified for various reasons including the following: (a) these industries are considered strategic in terms of natural resources (like oil, natural gas and minerals in the Middle East and Latin America); (b) they present exceptional opportunities for forward and backward linkages with domestic suppliers (autos in Mexico and Brazil; electronics in Japan, the Republic of Korea and China); (c) they have an impact on national security in terms of defence or critical consumption needs (military procurement, essential medicines, basic foodstuffs during famines or droughts); and (d) the policies support “infant industries” that need temporary protection from larger and more established international competitors. In practice, these industrial policies were associated with the import-substitution (ISI) development strategies that became popular in Latin America, South Asia and other developing regions from the late 1950s through the early 1980s, and effectively they were disrupted by the Latin American debt crisis of the 1980s and displaced by EOI development strategies associated with the rise of East Asia and the “Washington Consensus” in the 1990s (Gereffi and Wyman, 1990; World Bank, 1993).
GVC-oriented industrial policies go beyond the domestic economy focus of ISI-style policy regimes which try to recreate entire supply chains within a national territory. Given the international production networks associated with GVCs, this type of industrial policy explicitly utilizes extra-territorial linkages that affect a country’s positioning in global or regional value chains. In the global apparel industry, for instance, a good illustration of GVC-oriented industry policies were the “triangle manufacturing” networks associated with East Asian economies, such as Hong Kong, China; Chinese Taipei and the Republic of Korea (Gereffi, 1999). In order
Global value chain-oriented industrial policy: the role of emerging economies
343
to deal with the quota constraints put in place by the Multi-Fiber Arrangement that regulated apparel trade from the 1970s through 2005, East Asian textile and apparel manufacturers complemented the strengths of their domestic economies in product development, design and textiles by seeking out low-cost apparel suppliers in various regions of the world, and these East Asian middleman firms would also sell to global buyers (large apparel retailers and brands) using flexible triangle manufacturing schemes to improve the competitiveness of East Asian economies in the apparel GVC by coordinating the activities of multiple actors across the chain.
Current examples include efforts to create and sustain regional supply chains that provide needed inputs for national export success, such as the East Asian supply base that has been created for China’s electronics inputs needed for its exports of smart phones (Xing and Detert, 2010; Gereffi and Lee, 2012). Case studies in Central America and Sub-Saharan Africa showcase efforts to create regional integration arrangements that could strengthen the export position of countries in each region by sourcing inputs from regional neighbors – e.g., textiles and apparel in Central America or Sub-Saharan Africa (Bair and Gereffi, 2013; Morris et al., 2011) and minerals processing in Sub-Saharan Africa (Davies, 2012).
Table 14.3 highlights the varied industrial policy instruments utilized by the seven emerging economies that we focus on. Brazil, China, India and the Republic of Korea deploy the most extensive array of horizontal or economy-wide policies. In terms of selective domestic industrial policies, most of the emerging economies have particular industries that they deem particularly important, and these are supported by policies requiring local content, joint ventures, local R&D or other benefits that tend to favour domestic over foreign firms. Finally, there is a third and relatively new category of industrial policy that is oriented to improving a country’s position in GVCs. These policies recognize that a country’s possibilities for upgrading depend at least in part on links across different segments of the value chain, within a regional or global context.
While free trade agreements are enabling factors that permit greater openness to GVCs, these are often supplemented by policies that try to induce regional production networks in specific industries to facilitate functional upgrading or the opportunity of emerging economies to more fully exploit regional economies of scale and scope. In East Asia, China benefits from close economic ties with many of its East Asian neighbours that facilitate imports of materials and components that go into China’s manufactured export products. In South Africa and Brazil, there are policies to limit the
Global value chains in a changing world
344
restrictions that trade partners (like China) have placed on the processing of primary product exports. Thus, GVC-oriented industrial policies seek to improve the ability of emerging economies to enhance their upgrading opportunities within these chains by facilitating both intermediate and primary goods trade.
14.4. GVC-oriented industrial policies in action: the case of Brazil
Brazil’s development strategy has both similarities and distinctive elements when compared to South Africa and China. Although Brazil belongs to Mercosur – a regional trade agreement that includes Argentina, Uruguay, Paraguay and Venezuela – this does not reflect a pan-Latin America vision analogous to that of South Africa’s economic integration plans for Sub-Saharan Africa (Davies, 2012) nor does it embody the highly efficient regional division of labour that China participates in with its East Asian neighbours. Brazil dominates Mercosur by its size and level of economic development, and thus it occupies an asymmetric position in terms of regional integration. Mutual gains from the long-heralded complementarities between Brazil and Argentina in the automotive sector have been weakening. Like South Africa, Brazil is concentrated in primary product exports with relatively low levels of processing and is seeking to reverse the so-called “primarization” of its export profile (Jenkins, 2012).
This is not entirely a new situation. ASEAN had been driven in part by Toyota and Ford’s search for a secure regional production network through complementarity schemes (Sturgeon and Florida, 2004). Access to low-cost auto parts was also an important consideration for the automotive firms that promoted the North American Free Trade Agreement (NAFTA). But today, these efforts are proliferating. China is seeking to strengthen the regional production system in East Asia, South Africa has announced a regional integration and industrial policy to promote upgrading in raw materials production, and Brazil and its Mercosur neighbours are broadening their customs union to build regional supply-side capabilities.
As we have already mentioned, a major challenge for some large emerging economies that have become primary product exporters based on high demand from China is how to increase the technological content of their exports in order to move into higher value activities. For example, China is Brazil’s largest trading partner, accounting for about 15 per cent of Brazil’s exports and imports in 2010. From a GVC perspective, what is particularly notable is that the pattern of Brazil’s exports to China is skewed
Global value chain-oriented industrial policy: the role of emerging economies
345
toward products (both primary commodities and manufactured goods) with very low levels of processing.
The soybean value chain is a good example. About 95 per cent of Brazil’s soybean exports to China in 2009 were unprocessed beans. In contrast, there were virtually no exports of soybean meal, flour or oil to China. In order to pursue its strategy of promoting the Chinese soybean processing industry, China imposed a tariff of nine per cent on soybean oil imports, while the tariff on unprocessed soybean imports was only three per cent. Imports of products based on processed soybeans were also levied at a higher value-added tax rate in China than were unprocessed beans. Similar protectionist policies, including both tariff and non-tariff barriers, have been imposed by the Chinese government on other primary and processed intermediate products from Brazil, including leather, iron and steel, and pulp and paper (Jenkins, 2012).
On the import side, Brazil has also been influenced by China’s structure of international trade. In 1996, low-technology products accounted for 40 per cent of Brazil’s imports from China, while high-technology products were 25 per cent. By 2009, the pattern was nearly reversed: high-tech products were 41.4 per cent of the total, and low-tech products were 20.8 per cent. If we look at this trend in terms of the end use of imports, consumer goods imports from China to Brazil fell from 44 per cent to 16 per cent between 1996 and 2009, while the imports of capital goods doubled from 12 per cent to 25 per cent and parts for capital goods rose from 12 per cent to 25 per cent (Jenkins, 2012). Thus, Brazil has fallen to the lowest rungs of the value-added ladder in its trade with China in recent decades.
While the trade relationship with China is the most severe challenge for Brazil, the problem is more pervasive. For example, Embraer, a successful Brazilian producer of regional passenger aircraft, depends on imports for 100 per cent of its aircraft-grade aluminium, despite Brazil’s abundance of the aluminium ore (bauxite) and rare minerals required for aircraft-grade alloys. South Africa has had some success in this regard. It is the largest exporter of catalytic converters for use in vehicle exhaust systems, products that rely on platinum, a precious metal that is abundant in South Africa.
Leveraging consumer electronics GVCs to build capabilities in Brazil
An instructive case of how GVCs intersect with national industrial policies can be found in Brazil’s recent efforts to leverage its large and growing internal market
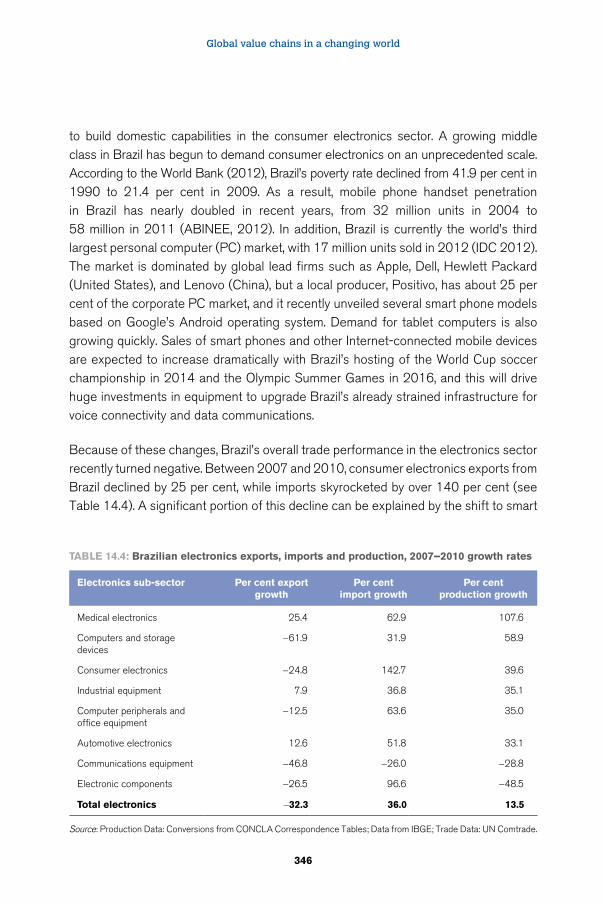
Global value chains in a changing world
346
to build domestic capabilities in the consumer electronics sector. A growing middle class in Brazil has begun to demand consumer electronics on an unprecedented scale. According to the World Bank (2012), Brazil’s poverty rate declined from 41.9 per cent in 1990 to 21.4 per cent in 2009. As a result, mobile phone handset penetration in Brazil has nearly doubled in recent years, from 32 million units in 2004 to 58 million in 2011 (ABINEE, 2012). In addition, Brazil is currently the world’s third largest personal computer (PC) market, with 17 million units sold in 2012 (IDC 2012). The market is dominated by global lead firms such as Apple, Dell, Hewlett Packard (United States), and Lenovo (China), but a local producer, Positivo, has about 25 per cent of the corporate PC market, and it recently unveiled several smart phone models based on Google’s Android operating system. Demand for tablet computers is also growing quickly. Sales of smart phones and other Internet-connected mobile devices are expected to increase dramatically with Brazil’s hosting of the World Cup soccer championship in 2014 and the Olympic Summer Games in 2016, and this will drive huge investments in equipment to upgrade Brazil’s already strained infrastructure for voice connectivity and data communications.
Because of these changes, Brazil’s overall trade performance in the electronics sector recently turned negative. Between 2007 and 2010, consumer electronics exports from Brazil declined by 25 per cent, while imports skyrocketed by over 140 per cent (see Table 14.4). A significant portion of this decline can be explained by the shift to smart
Table 14.4: brazilian electronics exports, imports and production, 2007–2010 growth rates
electronics sub-sector Per cent export growth
Per cent import growth
Per cent production growth
Medical electronics 25.4 62.9 107.6
Computers and storage devices
-61.9 31.9 58.9
Consumer electronics -24.8 142.7 39.6
Industrial equipment 7.9 36.8 35.1
Computer peripherals and office equipment
-12.5 63.6 35.0
Automotive electronics 12.6 51.8 33.1
Communications equipment -46.8 -26.0 -28.8
Electronic components -26.5 96.6 -48.5
Total electronics -32.3 36.0 13.5
Source: Production Data: Conversions from CONCLA Correspondence Tables; Data from IBGE; Trade Data: UN Comtrade.
Global value chain-oriented industrial policy: the role of emerging economies
347
phones, tablet computers and notebook computers – products that are displacing the feature phones and desktop computers produced in Brazil – both for the local market and for export to developing country markets with compatible standards. For example, in 2004, before the smart phone market was fully established, Brazil exported 10 million units per year and imported just 1.3 million units. By 2007, the year Apple computer introduced the first iPhone, Brazil’s feature phone exports were valued at more two billion US dollars per year. As the market for smart phones took off, export and local demand for feature phones plummeted, and by 2011 Brazil was importing 15.7 million handsets and exporting only 7.4 million (ABINEE, 2012). In response, feature phone producers in Brazil, such as NEC (Japan) and Nokia (Finland), withdrew from local production.
These rapid market shifts brought a new set of players to the fore, namely Apple and the many makers of Android-based smart phone handsets and the contract manufacturers that produce the bulk of these products, such as Flextronics (United States and Singapore) and Foxconn (Chinese Taipei). Market growth and access to its Mercosur trading partners are providing Brazil with the leverage it needs to demand local production and content from consumer electronics and communications GVC lead firms, who in turn have put pressure on their key global suppliers to make investments in Brazil. To exploit this opportunity, Brazil is bringing to bear a range of old and new policies aimed at spurring local production in the electronics sector. The key laws and programs to stimulate local production are listed and described in Table 14.5.
Like the ISI policies of old, Brazil’s current industrial policies consist mainly of tax incentives meant to spur local R&D, assembly and component manufacturing. But because GVCs bring new actors and industry structures to the fore, the challenges, opportunities and outcomes related to these policies are different. For example, a centrepiece of Brazil’s strategy to increase local production of consumer electronics has been to attract global contract manufacturers, known in the industry as electronic manufacturing services (EMS) providers. As electronics lead firms such as Apple and Hewlett Packard continue to outsource manufacturing, contract manufacturers have become increasingly important players in the component purchasing, assembly, test and after-sale service functions of electronics GVCs. The threshold for new investments, however, is high (large, globally operating contract manufacturers rarely open up a new automated circuit board assembly line for orders less than several hundred thousand units), and the promise of business from a single customer is rarely enough.
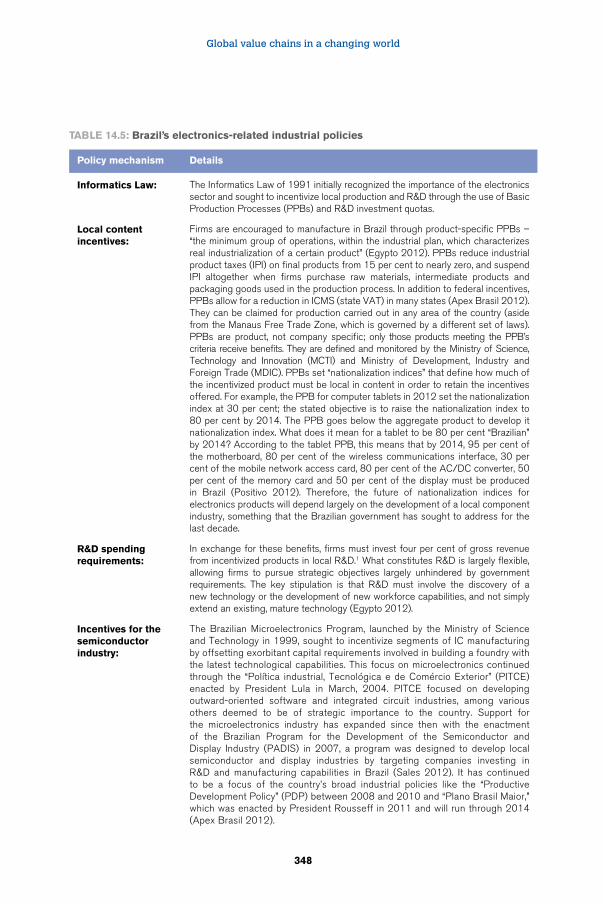
Global value chains in a changing world
348
Table 14.5: brazil’s electronics-related industrial policies
Policy mechanism Details
Informatics law: The Informatics Law of 1991 initially recognized the importance of the electronics sector and sought to incentivize local production and R&D through the use of Basic Production Processes (PPBs) and R&D investment quotas.
local content incentives:
Firms are encouraged to manufacture in Brazil through product-specific PPBs – “the minimum group of operations, within the industrial plan, which characterizes real industrialization of a certain product” (Egypto 2012). PPBs reduce industrial product taxes (IPI) on final products from 15 per cent to nearly zero, and suspend IPI altogether when firms purchase raw materials, intermediate products and packaging goods used in the production process. In addition to federal incentives, PPBs allow for a reduction in ICMS (state VAT) in many states (Apex Brasil 2012). They can be claimed for production carried out in any area of the country (aside from the Manaus Free Trade Zone, which is governed by a different set of laws). PPBs are product, not company specific; only those products meeting the PPB’s criteria receive benefits. They are defined and monitored by the Ministry of Science, Technology and Innovation (MCTI) and Ministry of Development, Industry and Foreign Trade (MDIC). PPBs set “nationalization indices” that define how much of the incentivized product must be local in content in order to retain the incentives offered. For example, the PPB for computer tablets in 2012 set the nationalization index at 30 per cent; the stated objective is to raise the nationalization index to 80 per cent by 2014. The PPB goes below the aggregate product to develop it nationalization index. What does it mean for a tablet to be 80 per cent “Brazilian” by 2014? According to the tablet PPB, this means that by 2014, 95 per cent of the motherboard, 80 per cent of the wireless communications interface, 30 per cent of the mobile network access card, 80 per cent of the AC/DC converter, 50 per cent of the memory card and 50 per cent of the display must be produced in Brazil (Positivo 2012). Therefore, the future of nationalization indices for electronics products will depend largely on the development of a local component industry, something that the Brazilian government has sought to address for the last decade.
R&D spending requirements:
In exchange for these benefits, firms must invest four per cent of gross revenue from incentivized products in local R&D.1 What constitutes R&D is largely flexible, allowing firms to pursue strategic objectives largely unhindered by government requirements. The key stipulation is that R&D must involve the discovery of a new technology or the development of new workforce capabilities, and not simply extend an existing, mature technology (Egypto 2012).
Incentives for the semiconductor industry:
The Brazilian Microelectronics Program, launched by the Ministry of Science and Technology in 1999, sought to incentivize segments of IC manufacturing by offsetting exorbitant capital requirements involved in building a foundry with the latest technological capabilities. This focus on microelectronics continued through the “Política industrial, Tecnológica e de Comércio Exterior” (PITCE) enacted by President Lula in March, 2004. PITCE focused on developing outward-oriented software and integrated circuit industries, among various others deemed to be of strategic importance to the country. Support for the microelectronics industry has expanded since then with the enactment of the Brazilian Program for the Development of the Semiconductor and Display Industry (PADIS) in 2007, a program was designed to develop local semiconductor and display industries by targeting companies investing in R&D and manufacturing capabilities in Brazil (Sales 2012). It has continued to be a focus of the country’s broad industrial policies like the “Productive Development Policy” (PDP) between 2008 and 2010 and “Plano Brasil Maior,” which was enacted by President Rousseff in 2011 and will run through 2014 (Apex Brasil 2012).
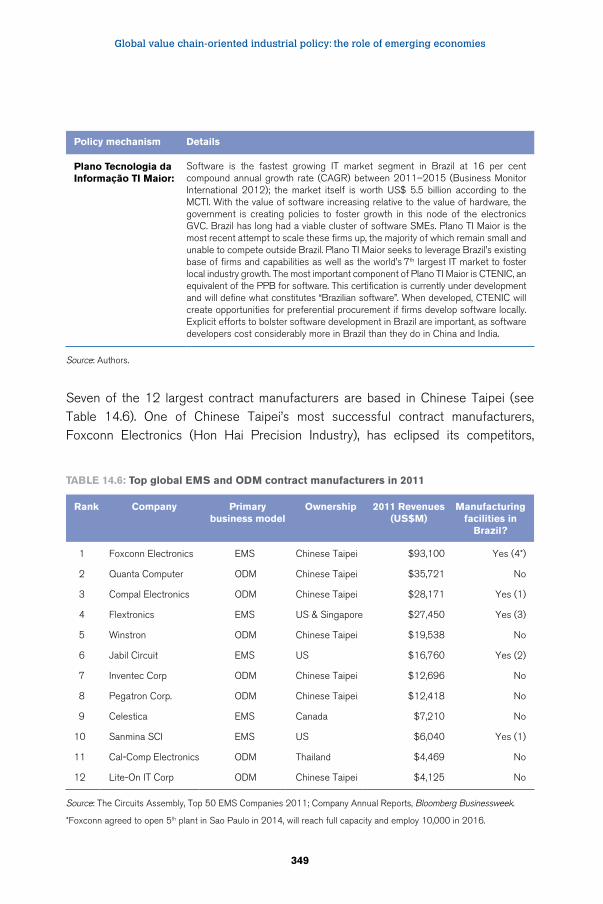
Global value chain-oriented industrial policy: the role of emerging economies
349
Policy mechanism Details
Plano Tecnologia da Informação TI Maior:
Software is the fastest growing IT market segment in Brazil at 16 per cent compound annual growth rate (CAGR) between 2011–2015 (Business Monitor International 2012); the market itself is worth US$ 5.5 billion according to the MCTI. With the value of software increasing relative to the value of hardware, the government is creating policies to foster growth in this node of the electronics GVC. Brazil has long had a viable cluster of software SMEs. Plano TI Maior is the most recent attempt to scale these firms up, the majority of which remain small and unable to compete outside Brazil. Plano TI Maior seeks to leverage Brazil’s existing base of firms and capabilities as well as the world’s 7th largest IT market to foster local industry growth. The most important component of Plano TI Maior is CTENIC, an equivalent of the PPB for software. This certification is currently under development and will define what constitutes “Brazilian software”. When developed, CTENIC will create opportunities for preferential procurement if firms develop software locally. Explicit efforts to bolster software development in Brazil are important, as software developers cost considerably more in Brazil than they do in China and India.
Seven of the 12 largest contract manufacturers are based in Chinese Taipei (see Table 14.6). One of Chinese Taipei’s most successful contract manufacturers, Foxconn Electronics (Hon Hai Precision Industry), has eclipsed its competitors,
Table 14.6: Top global eMS and ODM contract manufacturers in 2011
Rank Company Primary business model
Ownership 2011 Revenues (US$M)
Manufacturing facilities in
brazil?
1 Foxconn Electronics EMS Chinese Taipei $93,100 Yes (4*)
2 Quanta Computer ODM Chinese Taipei $35,721 No
3 Compal Electronics ODM Chinese Taipei $28,171 Yes (1)
4 Flextronics EMS US & Singapore $27,450 Yes (3)
5 Winstron ODM Chinese Taipei $19,538 No
6 Jabil Circuit EMS US $16,760 Yes (2)
7 Inventec Corp ODM Chinese Taipei $12,696 No
8 Pegatron Corp. ODM Chinese Taipei $12,418 No
9 Celestica EMS Canada $7,210 No
10 Sanmina SCI EMS US $6,040 Yes (1)
11 Cal-Comp Electronics ODM Thailand $4,469 No
12 Lite-On IT Corp ODM Chinese Taipei $4,125 No
Source: The Circuits Assembly, Top 50 EMS Companies 2011; Company Annual Reports, Bloomberg Businessweek.
*Foxconn agreed to open 5th plant in Sao Paulo in 2014, will reach full capacity and employ 10,000 in 2016.
Source: Authors.
Global value chains in a changing world
350
bringing in almost three times the revenue of the second-place contractor, Quanta Computer. However, Foxconn, much like other EMS contract manufacturers, suffers from low profit margins (just 2.4 per cent in 2011) and must compete on a global level to maintain market share (Mishkin and Palmer, 2012). Foxconn’s close relationship with Apple has been its main driver of revenue growth. Contract manufacturers fill an increasingly complex role in the electronics GVC; they must not only work closely with lead firms to develop products and meet tight production schedules but also with a worldwide network of component manufacturers and distributors to ensure that they can meet demand and keep their lines operating at, or near, full capacity.
Thanks to Brazil’s GVC-oriented industrial policies and direct pressure on the company from policymakers, Foxconn has begun to assemble iPhones, iPads and most recently iPad minis for Apple in Brazil. While Foxconn currently imports 90-95 per cent of its components, the company, which is more vertically integrated than most EMS firms, is likely to begin to manufacture components, including displays, in Brazil. Recent negotiations for a fifth Foxconn factory in Brazil have included language to suggest that once production is at 100 per cent (projected to be 2016), Foxconn will be manufacturing components including cables, cameras, touch-sensor glass, LED products and printed-circuit boards (Wang, 2012).
Hewlett Packard (HP) uses three global contract manufacturers to produce in Brazil (Foxconn, Flextronics and Jabil Circuit). Products include computers, desktop PCs, notebook PCs, workstations, computer servers, single function printers and multi-function printers. Local production accounts for 95 per cent of local sales. HP imports low-volume products such as large format printers, high-end servers and some high-end portable computers and makes printer ink cartridges in its own plant using a proprietary manufacturing process. Most components are imported except RFID chips for printer cartridges, which are developed by CEITEC, a local government-supported semiconductor foundry.
But hardware production is only part of the picture. In meeting the requirements for local R&D spending (four per cent of sales), HP Brazil employs 400 engineers and researchers in its laboratory in the south of Brazil and has contracts with another 1,000 collaborators from universities and research centres in the country. It also has four software centres working on local customer-specific applications, while contract manufacturers are being used to help meet the R&D spending requirement. Two of HP’s research centres have been set up in collaboration with the Flextronics Institute of Technology (FIT): the RFID Center of Excellence, which has worked on over 100
Global value chain-oriented industrial policy: the role of emerging economies
351
RFID-related projects with HP; and the newer Sinctronics IT Innovation Centre, which focuses on environmental compliance and product recycling (Flextronics International, 2012). Like manufacturing capacity, the R&D of contract manufacturers can serve multiple lead firms. In addition to the work it does for HP, FIT runs research institutes to develop software solutions for IBM servers and Lenovo computers. It even conducts R&D on behalf of competitors like Foxconn and Compal, which do not have the R&D facilities in Brazil needed to spend their R&D quota internally. In other words, Flextronics has been able to develop economies of scale in R&D, much like it does through its manufacturing and assembly services.
The presence of global contract manufacturers in Brazil creates a number of immediate advantages. The most obvious is jobs. For example, Foxconn currently employs 6,000 in Brazil and could add 10,000 more jobs by 2016 (Luk, 2012). Because contract manufacturers serve multiple customers, their manufacturing capabilities can satisfy local content requirements for multiple brands. Production capacity is generic and flexible enough to effectively pool capacity across all high-volume segments of the electronics industry. Capacity can be switched toward product categories and firms that are successful in the local market and in exporting. The focus of Brazil’s GVC-oriented industrial policy on attracting investments by contract manufacturers, as well as GVC lead firms, signals a sophisticated understanding of the dynamics of the electronics GVCs by policy-makers. Contract manufacturers provide a leading-edge, flexible and scalable platform for local production and R&D. Lead firms like Apple and HP tend to use the same contractors on a global basis, and their presence in Brazil lowers the bar for localization.
14.5. Conclusions: what do GVC-oriented industrial policies look like?
Emerging economies are playing significant and diversified roles in GVCs. During the 2000s, they have become major exporters of intermediate and final manufactured goods (China, the Republic of Korea and Mexico) as well as primary products (Brazil, the Russian Federation and South Africa). However, market growth in emerging economies has also led to shifting end markets in GVCs, as more trade has been South-South, especially since the 2008–09 economic recession (Staritz et al., 2011). China has been the focal point for both patterns since it is the world’s leading exporter with an emphasis on manufactured goods, but it has also stoked the primary product export boom as the world’s largest importer of a wide range of primary products.

Global value chains in a changing world
352
The primary product exporting profiles of Brazil, the Russian Federation, and India (BRI) suggest that these countries are contributing to China’s role as a materials processing and final assembly hub. Finished manufactured items are then exported from China back to these BRI countries and the rest of the world. Still, trade statistics cannot reveal where ownership, intellectual property (IP) and GVC coordination – and much of the profits in GVCs – lie. From case studies (Linden et al., 2007; Xing and Detert, 2010) and new research on trade in value-added (UNCTAD, 2013; Gereffi and Lee, 2012), we know that many of China’s exports consist of foreign-branded products, contain core IP from industrialized countries (United States, Europe, Japan) and include sophisticated intermediate products imported from the most industrialized and advanced emerging economies such as the Republic of Korea and Chinese Taipei, as well as other developing countries in East Asia (Malaysia, Thailand, etc.). Thus, rising South-South trade may in fact signal the emergence of a GVC structure that undergirds China’s role as “the world’s workshop.” This helps to explain efforts by the BRI countries to diversify away from primary commodities, first by adding more value to exported commodities, and second by moving into technology-intensive final products such as automobiles and electronics.
Various types of industrial policy are industry-specific. While this puts them in line for criticism when policymakers are seen to be “picking winners,” the industry focus is essential. Research at the level of global industries clearly shows that the structure and upgrading trajectories of GVCs vary significantly, and, as a result, cross-industry comparisons are essential (Sturgeon et al., 2008; Cattaneo et al., 2010; Sturgeon and Kawakami, 2011; Staritz et al., 2011). For example, trade in customized intermediate goods is extremely high, growing and global in scope in electronics, while trade in automotive parts tends to be organized in regional production systems (North America, Europe, Asia), and trade in intermediate inputs to apparel products (fibre and fabric) is actually falling as the major apparel producing countries (for example China and Bangladesh) gain huge capabilities in textile production (Sturgeon and Memedovic, 2010). The reasons for these differences are complex. On the one hand, the detailed characteristics of product designs, intermediate components, final goods and logistics requirements greatly influence the geography of industry GVCs (Gereffi et al., 2005). On the other hand, certain products (like autos) come with high levels of political sensitivity that drive production toward end markets (Sturgeon and Van Biesebroeck, 2010).
As the Brazil consumer electronics case suggests, the formation of industrial policy does not always begin with policy-makers “picking” industries but rather with attempts to improve
Global value chain-oriented industrial policy: the role of emerging economies
353
the performance of existing industries that link their country to the global economy. This involves a search for mechanisms that can capture investment and improve a country’s value-adding position in highly mobile segments of GVCs that are already in the process of spreading to new locations or may already be present in the jurisdiction that policy makers are responsible for. When Brazil’s policy-makers try to capture more local value-added in local markets that are already growing rapidly, they cannot be said to be picking winners.
Of course, policy-makers must also be concerned with slowing market growth by raising prices to levels that block consumers’ access to leading-edge products. Broad economic growth can be slowed when markets for products that make the whole economy more efficient, such as smart phones and computers, are truncated. Yet it is possible for policies that pressure lead firms to add more value locally to be modest and targeted enough so that they do not raise prices to the point where market growth is impeded, and leading-edge products fail to make it into the hands of the businesses and consumers that want them.
Once the proposition that a balanced approach is possible is accepted by policymakers, the question then becomes how to craft effective GVC-oriented industrial policies. One way to examine this question is to ask how current industrial policies differ from traditional industrial policies. A superficial analysis of the Brazilian consumer electronics case might suggest that the motivations and policy tools being employed by large emerging economies simply replicate many of the features of traditional ISI industrial policy: driving import substitution with local content requirements, instituting requirements for investment in local R&D and stimulating demand in key product areas.
However, we see three major differences that highlight the distinctive nature of GVC-oriented industrial policies:
1. Global suppliers – Instead of merely demanding that lead firms make major investments, the GVC-oriented industrial policies described in this paper reveal an increasingly sophisticated understanding of the global-scale patterns of industrial organization that have come to the fore in GVCs since at least the 1990s. Lead firms are relying on global suppliers and intermediaries for an array of processes, specialized inputs and services and demanding that their most important suppliers have a global presence. Hence it is suppliers, not lead firms, which are making many of the new investments that developing countries are seeking to capture. In many cases, suppliers generate the bulk of exports as well. Furthermore, the largest suppliers serve multiple customers, so the success of investments is not necessarily tied to the success of any single lead firm.5 In the context of rapidly
Global value chains in a changing world
354
shifting market share among lead firms and the sudden entry of new players (neither Apple nor Google participated in the mobile communications industry before 2007), the capability to serve multiple customers takes on heightened importance. Therefore, it is no accident that Brazil sought investments from Foxconn, rather than Apple, in its desire for iPhones and iPads to be produced in the country for domestic consumption and export elsewhere in Latin America.
2. Global sourcing and value chain specialization – Policies that promote linkages to GVCs have very different aims from traditional industrial policies that intend to build fully blown, vertically integrated domestic industries. Policies can target specialized niches in GVCs. These can be higher-value niches suited to existing capabilities. They can also be generic capabilities that can be pooled across foreign investors. Either of these can serve both domestic or export markets. This sort of value chain specialization assumes an ongoing dependence on imported inputs and services. Reliance on global sourcing means that the entire value chain may never be captured, but it also assures ongoing involvement in leading-edge technologies, standards and industry “best practices.” Clearly, industries in developing countries can no longer make outmoded products. As the Brazilian mobile phone case shows, consumers with rising incomes will no longer accept them.
3. Moving to the head of GVCs – Encouraging global suppliers to establish facilities within a country can have long-term advantages. Local lead firms can rely on global suppliers in their midst and on broader industry GVCs for a wide range of inputs and services, from design to production to logistics to marketing and distribution. This can lower risk and barriers to entry for local firms, provide access to capabilities and scale that far outstrip what is available domestically and ensure that products and services are up to date, precisely because they participate in GVCs from the beginning. As long as policies have not driven costs above world norms, up-to-date, world-class products and services also open up export markets.
The use of industrial policies by emerging economy policymakers should not come as a big surprise. Both developed and developing countries have used these policies in the past and often with considerable sophistication as in the case of East Asian economies such as Japan, the Republic of Korea, Singapore, Chinese Taipei and now China.
There are two GVC-related features of emerging economies that are distinctive today. First, there is the centrality of China. A number of natural resource-based emerging economies such as Brazil, South Africa and the Russian Federation see China’s procurement policies as limiting their ability to add value to their raw material
Global value chain-oriented industrial policy: the role of emerging economies
355
exports, whereas manufacturing powers such as the Republic of Korea, Mexico and to a lesser degree India see China as their most formidable competitor in both export and domestic markets. Second, the flourishing of GVCs has led intermediate goods exports to exceed the total of final and capital goods exports for the first time. This raises a new competitiveness challenge over who wins the “trade in value added” battle. Countries now seek to capture the highest value segments of GVCs, not only to increase total exports but also to provide local firms with access to world-class inputs. Thus, GVC-oriented industrialization and GVC-oriented industrial policies appear to be elements of the current industrial landscape that are here to stay.
Endnotes
1 Jim O’Neill (2011), the Goldman Sachs executive who coined the term BRIC in 2001 to refer to Brazil, Russia, India and China, now argues that there is a much larger number of “growth economies” (BRICs plus 11) that fall into this category. These include the MIST nations (Mexico, Indonesia, Republic of Korea and Turkey), and other periodic high-performers such as Bangladesh, Egypt, Pakistan, Philippines and Viet Nam (Martin, 2012). The original BRIC classification was extended to BRICS with the addition of South Africa in 2010. For purposes of this paper, the origin of these acronyms is less important than the collective effect of this set of so-called emerging economies, which are reshaping both supply and demand in many GVCs.
2 However, Lall’s categories only cover goods, and India is also the world leader in exports of offshore services, with 45 per cent of the global total (see Fernandez-Stark et al., 2011).
3 Two recently announced international databases will permit us to examine the domestic versus foreign (imported) content of value added in export production. The first comprehensive effort is the OECD-WTO Trade in Value Added (TiVA) database, which presents indicators for 40 countries (all OECD countries, Brazil, China, India, Indonesia, Russian Federation and South Africa) covering the years 2005, 2008 and 2009 and broken down by 18 industries (see http://www.oecd.org/industry/ind/measuringtradeinvalue-addedanoecd-wtojointinitiative.htm). In addition, there is the UNCTAD-Eora GVC database, which was launched in February 2013, and it covers 187 countries during the 1990-2010 period for 25-500 industries, depending on the country (UNCTAD, 2013).
4 This is particularly clear in the case of Brazil’s soybean exports to China, discussed in the next section of this paper.
5 By serving multiple customers, global suppliers can generate enough business to justify capital-intensive investments that have high minimum scale requirements, such as electronic displays and automated production lines.
Author’s aknowledgements
The authors would like to thank Jessie Anderson, Jackie Xu, and Ezequiel Zylberberg for their research assistance on this paper, and Gary Thompson for his help in preparing the tables. Appreciation also goes to Patrick Low and Penny Bamber for their insightful comments on an earlier draft of this paper.
Global value chains in a changing world
356
References
Amsden, A. H. 1989. “Asia’s Next Giant: South Korea and Late Industrialization”, (New York, Oxford University Press).
Bair, J.; Gereffi, G. 2013. “Better Work in Central America: Assessing the opportunities for upgrading in Nicaragua’s apparel sector”, Capturing the Gains Working Paper 17, February. (Manchester, UK, The University of Manchester). Available at: http://www.capturingthegains.org/pdf/ctg-wp-2013-17.pdf
Baldwin, R. 2011. “Trade and Industrialisation after Globalisation’s 2nd Unbundling: How Building and Joining a Supply Chain are Different and Why it Matters”, NBER Working Paper No. 17716, December (Cambridge, MA, National Bureau of Economic Research).
Beltramello, A.; De Backer, K.; Moussiegt, L. 2012. “The Export Performance of Countries within Global Value Chains (GVCs)”, OECD Science, Technology and Industry Working Papers, 2012/02. (Paris, France, Organization for Economic Co-operation and Development). Available at: http://dx.di.org/10.1787/5k9bh3gv6647-en.
Brazilian Electrical and Electronics Industry Association (ABINEE). 2012. “Economic Overview and Performance of the Sector.” Powerpoint Presentation. Available at: http://www.abinee.org.br/ing/informac/arquivos/pan2012i.pdf
Business Monitor International. 2012. “Brazil Information Technology Report Q4 2012” in Market Research, November 7. Available at: http://www.marketresearch.com/Business-Monitor-International-v304/Brazil-Information-Technology-Q4-7213839/
Chang, H-J. 2002. “Kicking Away the Ladder: Development Strategy in Historical Perspective”, (London, UK, Anthem).
Cattaneo, O.; Gereffi, G.; Staritz, C. (eds.). 2010. “Global Value Chains in a Postcrisis World: A Development Perspective”. (Washington, DC, World Bank).
Dassbach, C. 1989. “Global Enterprises and the World Economy: Ford, General Motors, and IBM, the Emergence of the Transnational Enterprise” (New York, Garland Publishing).
Davies, R. 2012. Keynote address by Rob Davies, South Africa Minister of Trade and Industry, at the Capturing the Gains Global Summit, Cape Town, South Africa, December 3-5. Available at: http://www.capturingthegains.org/pdf/Rob_Davies_Keynote_CtG_Summit_Dec_2012.pdf
Dicken, P.; Kelly, P. F.; Olds, K.; Yeung, H. W-C. 2001. “Chains and Networks, Territories and Scales: Towards a Relational Framework for Analysing the Global Economy”, in Global Networks 1(2): 89–112.
Dossani, R.; Kenney, M. 2003. “Lift and Shift; Moving the Back Office to India”, work in progress, (September) in Information Technologies and International Development, 1(2): 21–37.
Egypto, F. 2012. “Information on PPB”. Apex-Brasil
Global value chain-oriented industrial policy: the role of emerging economies
357
Engardio, P.; Bernstein, A.; Kripalani, M. 2003. “Is Your Job Next?” in Business Week, February 3 (50–60).
Engardio, P.; Einhorn, B. 2005. “Outsourcing Innovation”, in Business Week, March 21 (47–53).
Evans, P. 1995. “Embedded Autonomy: States & Industrial Transformation” (Princeton, NJ, Princeton University Press).
Feenstra, R. 1998.” Integration of Trade and Disintegration of Production in the Global Economy,” in Journal of Economic Perspectives, Fall , 31–50.
Feenstra, R.; Hamilton, G. 2006. “Emergent Economies, Divergent Paths: Economic Organization and International Trade in South Korea and Taiwan” (Cambridge, UK, Cambridge University Press).
Fernandez-Stark, K.; Bamber, P.; Gereffi, G. 2011. “The Offshore Services Value Chain: Upgrading Trajectories in Developing Countries” in International Journal of Technological Learning, Innovation and Development 4(1–3): 206–234.
Flextronics International. 2012. “Flextronics Institute of Technology (FIT) Capabilities” Powerpoint Presentation, October 24.
Freeman, R. 2006. “The Great Doubling: America in the New Global Economy” Usery Lecture, April 8, (Atlanta, GA, Georgia State University). Available at: http://emlab.berkeley.edu/users/webfac/eichengreen/e183_sp07/great_doub.pdf
Fröbel, F.; Heinrichs, J.; Kreye, O. 1980. “The New International Division of Labor”, (Cambridge, UK, Cambridge University Press).
Fung, V. 2011. “Global Supply Chains – Past Developments, Emerging Trends,” speech by the Chairman of the Fung Global Institute and of the Li & Fung Group of companies, to the Executive Committee of the Federation of Indian Chambers of Commerce and Industry, Bangalore, 11 October. Available at: http://www.fungglobalinstitute.org/publications/speeches/global-supply-chains--past-developments-emerging-trends-193.html
Gereffi, G. 1994. “The Organization of Buyer-Driven Global Commodity Chains: How U.S. Retailers Shape Overseas Production Networks” in G. Gereffi and M. Korzeniewicz (eds.): Commodity Chains and Global Capitalism (Westport, CT, Praeger).
Gereffi, G. 1999. “International Trade and Industrial Upgrading in the Apparel Commodity Chain” in Journal of International Economics 48(1): 37–70.
Gereffi, G. 2001. “Beyond the Producer-Driven/Buyer-Driven Dichotomy: The Evolution of Global Value Chains in the Internet Era” in IDS Bulletin 32(3): 30–40.
Gereffi, G. 2005. “The Global Economy: Organization, Governance, and Development” in N. J. Smelser and R. Swedberg (eds.): The Handbook of Economic Sociology (Princeton, NJ, Princeton University Press, 2nd edition).
Global value chains in a changing world
358
Gereffi, G. (forthcoming). “Global Value Chains in a Post-Washington Consensus World: Shifting Governance Structures, Trade Patterns and Development Prospects” in Review of International Political Economy.
Gereffi, G.; Humphrey, J.; Kaplinsky, R.; Sturgeon, T. J. 2001. “Introduction: Globalisation, Value Chains and Development” in IDS Bulletin 32(3).
Gereffi, G.; Lee, J. 2012. “Why The World Suddenly Cares About Global Supply Chains” in Journal of Supply Chain Management 48(3): 24–32.
Gereffi, G.; Wyman, D.L. (eds.). 1990. “Manufacturing Miracles: Paths of Industrialization in Latin America and East Asia (Princeton, NJ, Princeton University Press).
Gore, C. 2000. “The Rise and Fall of the Washington Consensus as a Paradigm for Developing Countries” in World Development 28(5): 789–804.
Guzmán, G. C.; López, D. L. 2000. “Contract Manufacturing in Brazil: Challenges and Opportunities of a New Model of Production” in Anais Do XX Encontro Nacional De Engenharia De Produccão, São Paulo, SP. Available at: http://www.abepro.org.br/biblioteca/ENEGEP2000_I0265.PDF.
Hamilton, G.G.; Gereffi. G. 2009. “Global commodity chains, market makers, and the rise of demand-responsive economies.” Pp. 136–161 in Jennifer Bair (ed.), Frontiers of Commodity Chain Research, Stanford, CA: Stanford University Press.
Henderson, J.; Dicken, P.; Hess, M.; Coe, N.; Yeung, H. W-C. 2002. “Global Production Networks and the Analysis of Economic Development” in Review of International Political Economy 9(3): 426–464.
International Data Corporation (IDC). 2012. “Brazil Quarterly PC Tracker.” Available at: http://www.idc.com/tracker/showtrackerhome.jsp
Jenkins, R. 2012. “China and Brazil: Economic Impacts of a Growing Relationship” in Journal of Current Chinese Affairs, 1: 21–47.
Kaplinsky, R.; Terheggen, A.; Tijaja, J. 2010. “What Happens When the Market Shifts to China? The Gabon Timber and Thai Cassava Value Chains.” in O. Cattaeo, G. Gereffi, and C. Staritz (eds): Global Value Chains in a Postcrisis World: A Development Perspective (Washington, DC, World Bank).
Kramer, A. E. 2012. “Russia’s Desire for Cars Grows, and Foreign Makers Take Notice” in The New York Times, Global Business. December 25. Available at: http://www.nytimes.com/2012/12/26/business/global/foreign-automakers-see-potential-in-russian-market.html?_r=0
Lall, S. 2000. “The Technological Structure and Performance of Developing Country Manufactured Exports, 1985–98”, in Oxford Development Studies, 28(3): 337–369.
Linden, G.; Kraemer, K.L.; Dedrick, J. 2007. “Who Captures Value in a Global Innovation System? The case of Apple’s iPod,” Personal Computing Industry Center Working Paper, 06-01-2007, UC Irvine, Irvine, CA. http://escholarship.org/uc/item/1770046n
Luk, L. 2012. “Foxconn to Build Fifth Brazil Plant” in The Wall Street Journal, September 19. Available at: http://online.wsj.com/article/SB10000872396390444165804578005722309270246.html.
Global value chain-oriented industrial policy: the role of emerging economies
359
Lüthje, B. 2002. “Electronics Contract Manufacturing: Global Production and the International Division of Labor in the Age of the Internet” in Industry and Innovation 9(3): 227–247.
Martin, E. 2012. “Move Over, BRICs. Here Come the MISTs” in Bloomberg Business Week, August 9. Avaible at: http://www.businessweek.com/articles/2012-08-09/move-over-brics-dot-here-come-the-mists
Mishkin, S.; Palmer, M. 2012. “Foxconn Survives on Thin Slices of Apple” in The Financial Times, Tech Hub, September 24. Available at: http://www.ft.com/cms/s/0/170a225c-0356-11e2-a284-00144feabdc0.html#axzz2MkjQYokQ
Morris, M.; Staritz, C.; Barnes, J. 2011. “Value Chain Dynamics, Local Embeddedness, and Upgrading in the Chothing Sectors of Lesotho and Swaziland” in International Journal of Technological Learning, Innovation and Development 4(1–3): 96–119.
Organization for Economic Co-operation and Development (OECD). 2011. “Global Value Chains: Preliminary Evidence and Policy Issues”, DSTI/IND(2011)3. (Paris, France, OECD). Available at: http://www.oecd.org/dataoecd/18/43/47945400.pdf
Ojo, B. 2012. “Think Electronics Manufacturing Is on Life Support? Think Again” in EE Times, 18 September. Available at: http://www.eetimes.com/electronics-news/4396537/Think-electronics-manufacturing-is-on-life-support--Think-again.
O’Neill, J. 2011. “The Growth Map: Economic Opportunity in the BRICs and Beyond” (New York, NY, Penguin).
Positivo Informatica. 2012. “Taxation in Brazil’s PC Industry.” November 8. Available at: http://www.mzweb.com.br/positivo/web/conteudo_en.asp?idioma=1&conta=44&tipo=21962
Sales, J. R. R. 2012. “The Brazilian Semiconductor Landscape,” presented at the CeBIT Conference, March 8 (Hannover, Germany).
Staritz, C.; Gereffi, G.; Cattaneo, O.(eds.). 2011. Special Issue. “Shifting End Markets and Upgrading Prospects in Global Value Chains” in International Journal of Technological Learning, Innovation and Development 4(1–3). Available at: http://www.inderscience.com/info/inarticletoc.php?jcode=ijtlid&year=2011&vol=4&issue=1/2/3
Sturgeon, T.; Florida, R. 2004. “Globalization, Deverticalization, and Employment in the Motor Vehicle Industry”, in M. Kenny and R. Florida (eds): Locating Global Advantage: Industry Dynamics in a Globalizing Economy (Palo Alto, CA, Stanford University Press).
Sturgeon, T.; Gereffi, G. 2009. “Measuring Success in the Global Economy: International Trade, Industrial Upgrading, and Business Function Outsourcing in Global Value Chains” in Transnational Corporations 18(2): 1–36.
Sturgeon, T.J.; Kawakami, M. 2011. “Global Value Chains in the Electronics Industry: Characteristics, Crisis, and Upgrading Opportunities in Firms from Developing Countries.” in International Journal of Technological Learning, Innovation and Development 4(1–3): 120–147.
Global value chains in a changing world
360
Sturgeon, T.; Memedovic, O. 2010. “Measuring Global Value Chains: Intermediate Goods Trade, Structural Change and Compressed Development” UNIDO Working Paper (Vienna, Austria, United Nations Industrial Development Organization, UNIDO).
Sturgeon, T. J.;Van Biesebroeck, J. 2010. “Global Value Chains in the Automotive Industry: An Enhanced Role for Developing Countries?” in International Journal of Technological Learning, Innovation and Development 48(1–3): 181–205.
Sturgeon, T. J.;Van Biesebroeck, J.; Gereffi, G. 2008. “Value Chains, Networks and Clusters: Reframing the Global Automotive Industry” in Journal of Economic Geography 8: 297–321.
United Nations Conference on Trade and Development (UNCTAD). 2013. “Global Value Chains and Development: Investment and Value Added Trade in the Global Economy – A Preliminary Analysis” (Geneva, Switzerland, United Nations Conference on Trade and Development). Available at: http://unctad.org/en/PublicationsLibrary/diae2013d1_en.pdf
United Nations Commodity Trade Statistics Database (UN Comtrade). 2012. “Data.” Available at: http://comtrade.un.org/db/
Wadhwa, V.; De Vitton, U. K.; Gereffi, G. 2008. “How the Disciple Became the Guru: Workforce Development in India’s R&D Labs”, Report prepared for the Ewing Marion Kauffman Foundation. Available at: http://papers.ssrn.com/sol3/papers.cfm?abstract_id=1170049.
Wade, R. 1990. “Governing the Market: Economic Theory and the Role of Government in East Asian Industrialization” (Princeton, NJ, Princeton University Press).
Wang, L. 2012. “Foxconn invests more in Brazil” available at: http://www.taipeitimes.com/News/biz/archives/2012/09/20/2003543171
World Bank. 1993. “The East Asian Miracle: Economic Growth and Public Policy” (New York, NY, Oxford University Press).
World Bank. 2012. “Data”. Available at: http://data.worldbank.org.
World Economic Forum (WEF). 2013. “Enabling Trade: Valuing Growth Opportunities”, report prepared in collaboration with Bain & Company and the World Bank. Available at: http://www3.weforum.org/docs/WEF_SCT_EnablingTrade_Report_2013.pdf
WTO. 2011. “International Trade Statistics 2011” (Geneva, Switzerland, World Trade Organization).
WTO; IDE-JETRO. 2011. “Trade Patterns and Global Value Chains in East Asia: From Trade in Goods to Trade in Tasks” (Geneva, Switzerland, World Trade Organization and Tokyo, Japan, Institute for Developing Economies-Japan External Trade Organization). Available at: http://www.ide.go.jp/English/Press/pdf/20110606_news.pdf.
Xing, Y.; Detert, N. 2010. “How the iPhone widens the United States trade deficit with the People’s Republic of China.” ADBI Working Paper 257, December. Tokyo: Asian Development Bank.
361
15 How have production networks changed development strategies in East Asia?
Fukunari Kimura
15.1. Production networks in East Asia
Production networks in East Asia, a result of “the second unbundling”, are currently the most advanced in the world, particularly in machinery industries1 A new type of international division of labour has fundamentally changed the development strategies of less developed countries (LDCs) as well as developed countries’ (DCs) approach to LDCs.
“Global value chains” and “production networks” are similar concepts that certainly overlap but also hold differences in what they emphasize. The concept “production networks” emphasizes speed and tight coordination among production blocks through swift service links. Speed and tight coordination can be realized only in a limited number of countries, and this is linked to the locational choices of production blocks, in keeping with international trade theory. Speed and tight coordination are found typically at the regional level such as in East Asia, rather than globally. The concept of “the second unbundling” (Baldwin, 2011) also emphasizes speed and tight coordination. This paper describes the concept in parallel with “production networks” in order to deal with quick, high-frequency, synchronized transactions in the manufacturing sector.
Global value chains in textiles and garments are typically linked by slow, low-frequency and loosely synchronized transactions and are qualitatively different from production networks in the machinery industries that have developed in East Asia since the beginning of the 1990s. Further, even among production networks, there has been a big jump from simplistic “cross-border production sharing” to production “networks” with sophisticated combinations of intra-firm and arm’s length (inter-firm)
Global value chains in a changing world
362
transactions. East Asia has arrived at a stage of development where international fragmentation of production and the formation of industrial agglomerations are occurring at the same time. Production networks in East Asia have reached a higher stage of development than in other parts of the world such as Latin America and Eastern Europe.
This paper discusses how such changes in the North-South division of labour transform development strategies in LDCs as well as the responses to such transformation by the DCs. In LDCs, production networks enable latecomers to jump-start industrialization. The initiation of industrialization becomes much easier and quicker than in the regime of the industry-by-industry international division of labour or “the first unbundling”. After reaching a certain level of income and forming industrial agglomerations, understanding how to take advantage of positive agglomeration effects becomes imperative in order to design the latter half of the development strategies and to make the transition from middle-income to fully developed economies.
In DCs, de-industrialization is always a concern, but the “second unbundling” provides opportunities to generate domestic economic activities rather than losing jobs, possibly resulting in delaying de-industrialization. Both for LDCs and DCs alike, production networks may work as a shock transmission channel once a massive shock occurs somewhere in the world. At the same time, because of a strong incentive for private firms to keep production links alive, production networks may work as a part of greater macroeconomic stabilizers. Such attributes of production networks certainly influence policies in both LDCs and DCs. In the end, in East Asia, LDCs are on the way to implementing a full set of new development strategies, and DCs are aggressive in foreign operations in order to gain international competitiveness and generate domestic employment.
The next three sections of this paper are devoted to the impact of production networks on the LDCs. Section two discusses the implications for production networks at the early stage of development in enabling a jump-start of industrialization. Section three examines development stages at middle-income levels in which industrial agglomeration starts to take shape. Section four employs two-dimensional fragmentation theory and systematically presents policies to effectively utilize fragmentation and agglomeration. Section five presents the possibility of delaying de-industrialization in DCs by effectively utilizing the mechanism of production networks. Section six argues that production networks may transmit negative waves when large shocks such as the global financial crisis and the East Japan earthquake occur anywhere in the world. Yet, at the same time, firms try to keep linkages in production networks and resume them as soon as
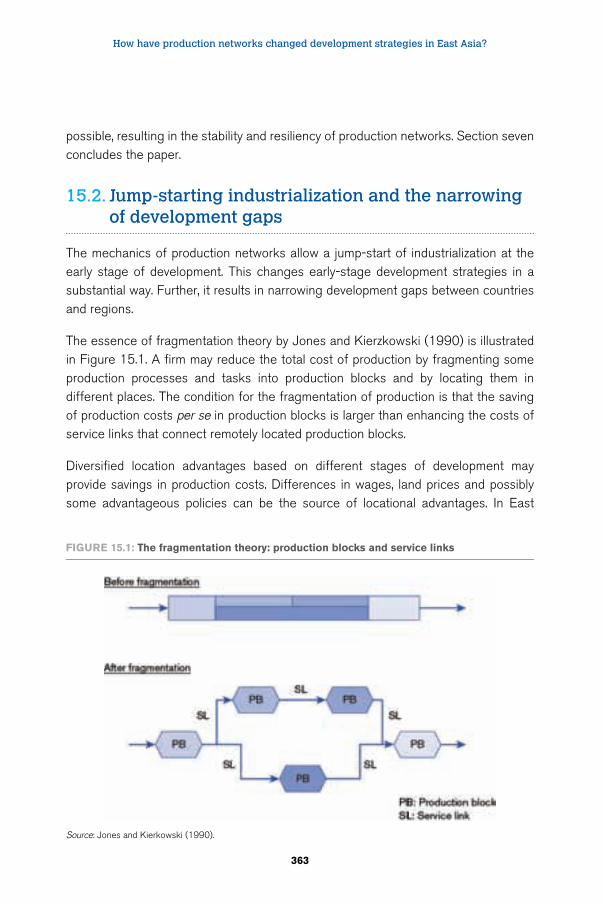
How have production networks changed development strategies in East Asia?
363
possible, resulting in the stability and resiliency of production networks. Section seven concludes the paper.
15.2. Jump-starting industrialization and the narrowing of development gaps
The mechanics of production networks allow a jump-start of industrialization at the early stage of development. This changes early-stage development strategies in a substantial way. Further, it results in narrowing development gaps between countries and regions.
The essence of fragmentation theory by Jones and Kierzkowski (1990) is illustrated in Figure 15.1. A firm may reduce the total cost of production by fragmenting some production processes and tasks into production blocks and by locating them in different places. The condition for the fragmentation of production is that the saving of production costs per se in production blocks is larger than enhancing the costs of service links that connect remotely located production blocks.
Diversified location advantages based on different stages of development may provide savings in production costs. Differences in wages, land prices and possibly some advantageous policies can be the source of locational advantages. In East
Figure 15.1: The fragmentation theory: production blocks and service links
Source: Jones and Kierkowski (1990).
Global value chains in a changing world
364
Asia, there exist huge differences in development stages, which generate a condition advantageous for fragmentation.
Of course, not all LDCs can automatically enter into production networks. Low wages are certainly a source of attraction. However, if other local conditions are too bad, it does not work. To participate in production networks, the minimal set of locational advantages and low service-link costs are necessary. Minimally required location advantages include electricity supply, industrial estate services and decently functioning investment hosting agencies. These, however, do not have to be perfect all over the country. For example, a country can start out with spotty, ad-hoc arrangements limited to special economic zones. Service link costs consist of costs for transportation, telecommunication and for various kinds of coordination. In the case of the transportation of parts and components, monetary costs, time costs and the reliability of logistics links are all crucial to participate effectively in production networks.
A number of East Asian developing economies have taken advantage of the mechanics of production networks and have successfully started up industrialization. Singapore, Malaysia, Thailand and the Philippines went through this process by the late 1980s and early 1990s. China accelerated the process of participating in production networks, particularly from 1992. Indonesia, Viet Nam and India began the process in the mid-1990s and 2000s. Cambodia, Lao P.D.R. and Myanmar are now about to start industrialization.
Figures 15.2 and 15.3 present the ratios of machinery and machinery parts and components to total manufacturing exports and imports in selected countries in the world in 1994 and 2007. The machinery trade includes trade in HS84-92, or the sum of general machinery, electric machinery, transport equipment and precision machinery. Machinery parts and components are defined by our own definition (Kimura and Obashi, 2010). The ratio of machinery parts and components in total manufacturing exports is a good indicator for the degree of participation in production networks with quick and high-frequency transactions. A number of East Asian developing countries such as the Philippines, Singapore, Malaysia and Thailand have high ratios of machinery parts and components exports. China rapidly enhanced this ratio during the period between 1994 and 2007. Countries such as Viet Nam and Indonesia are still in the process of entering into production networks.
Production networks with quick and high-frequency transactions so far cover only a limited number of countries and regions. Figure 15.4, the data compiled by the
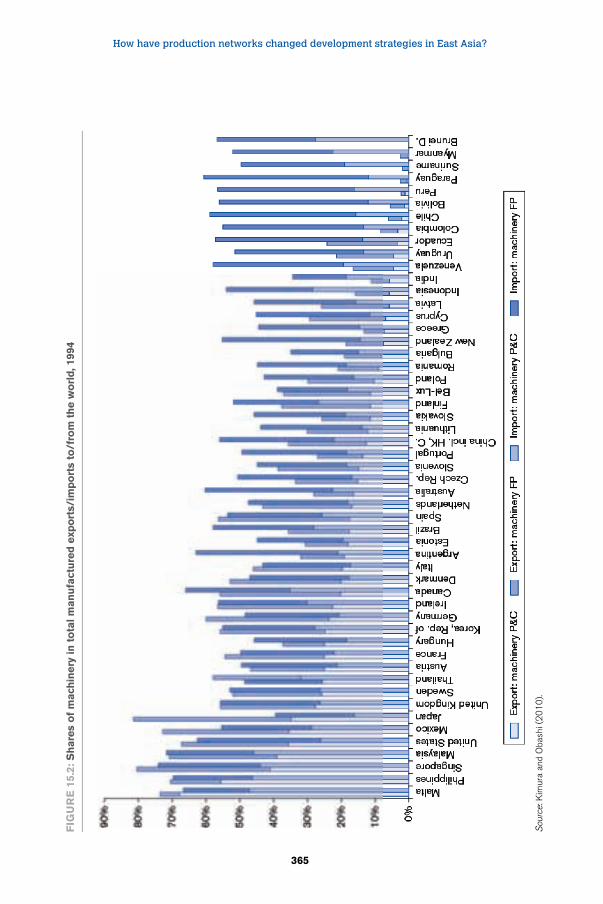
How have production networks changed development strategies in East Asia?
365
Fig
ur
e 1
5.2:
Sh
ares
of
mac
hin
ery
in t
ota
l man
ufa
ctu
red
exp
ort
s/im
po
rts
to/f
rom
th
e w
orl
d, 1
994
Sou
rce:
Kim
ura
and
Oba
shi (
20
10
).
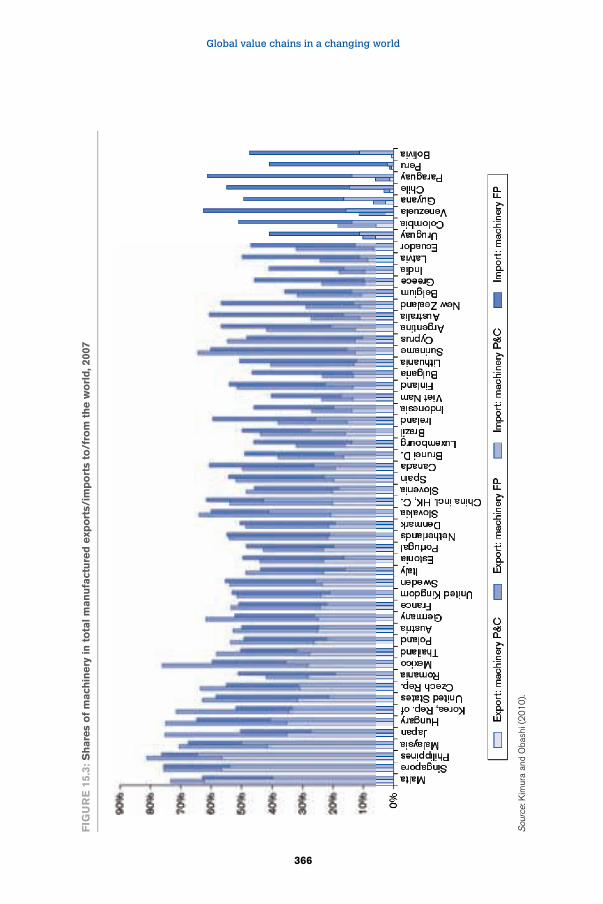
Global value chains in a changing world
366
Fig
ur
e 1
5.3:
Sh
ares
of
mac
hin
ery
in t
ota
l man
ufa
ctu
red
exp
ort
s/im
po
rts
to/f
rom
th
e w
orl
d, 2
007
Sou
rce:
Kim
ura
and
Oba
shi (
20
10
).
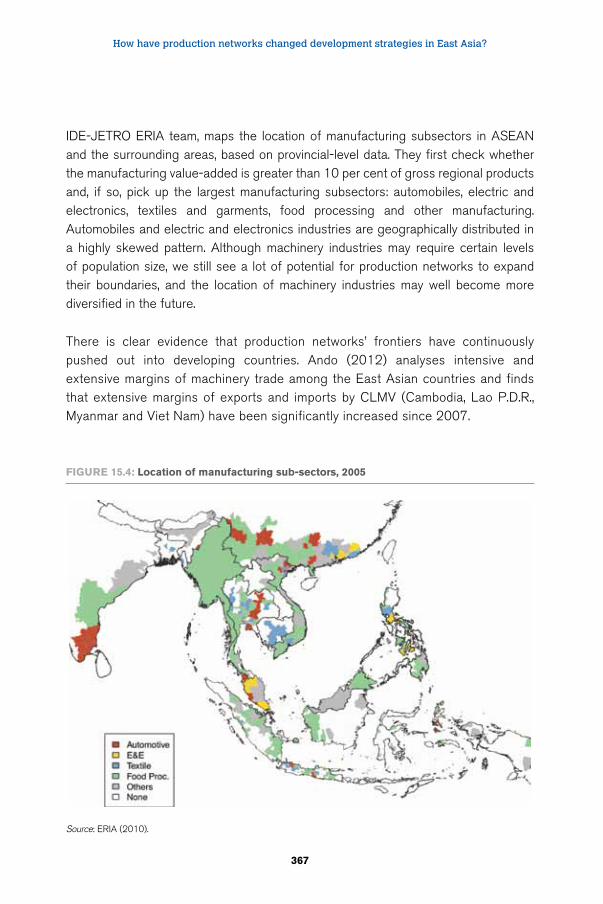
How have production networks changed development strategies in East Asia?
367
IDE-JETRO ERIA team, maps the location of manufacturing subsectors in ASEAN and the surrounding areas, based on provincial-level data. They first check whether the manufacturing value-added is greater than 10 per cent of gross regional products and, if so, pick up the largest manufacturing subsectors: automobiles, electric and electronics, textiles and garments, food processing and other manufacturing. Automobiles and electric and electronics industries are geographically distributed in a highly skewed pattern. Although machinery industries may require certain levels of population size, we still see a lot of potential for production networks to expand their boundaries, and the location of machinery industries may well become more diversified in the future.
There is clear evidence that production networks’ frontiers have continuously pushed out into developing countries. Ando (2012) analyses intensive and extensive margins of machinery trade among the East Asian countries and finds that extensive margins of exports and imports by CLMV (Cambodia, Lao P.D.R., Myanmar and Viet Nam) have been significantly increased since 2007.
Figure 15.4: Location of manufacturing sub-sectors, 2005
Source: ERIA (2010).
Global value chains in a changing world
368
What happens when a country begins to industrialize from diverse locations such as in industrial estates or special economic zones? First, a country establishes production blocks, rather than a whole industry. It is much easier to prepare a minimal set of locational advantages than to foster an entire industry. Once production blocks commence, multinational enterprises (MNEs) can obtain local information to allow investment set-up costs to be drastically reduced. Host countries become accustomed to MNEs and learn how to deal with them. By listening to their complaints, trouble-shooting becomes possible and the investment climate will thus improve. If necessary infrastructure and institutional arrangements are prepared along the way, more and more production blocks may be attracted.
This early development strategy is fundamentally different from infant industry protection or import-substitution strategies, with or without foreign direct investment (FDI) applied by Japan, the Republic of Korea or Chinese Taipei in the 1950s to 1970s.
The mechanics of production networks move production blocks from advanced areas to those that lag behind. Production networks actually help address development gaps between countries and regions and achieve geographical inclusiveness for East Asia. In the past 15 years, CLMV actually had higher economic growth rates than ASEAN as a whole.
15.3. Industrial agglomeration and middle-income development strategy
Some East Asian developing countries have been successful in starting up industrialization by fully utilizing the mechanics of production networks and they have now attained middle-income levels. Today, the issue has become how to make the transition from a middle-income to a fully developed economy. If we simply extrapolate GDP per capita, a number of East Asian developing countries including Malaysia, Thailand, China, Indonesia and the Philippines may reach US$ 10,000 or higher within 10 to 15 years. Such simplistic macroeconomic growth cannot be automatic. Indeed, it will certainly require substantial economic transformation.
The strength of East Asia lies in the formation of its industrial agglomerations. Production networks in the region have reached a new stage of development (Figure 15.5). Fragmentation of production between the United States and Mexico, on the other hand, mostly consists of “cross-border production sharing” in which
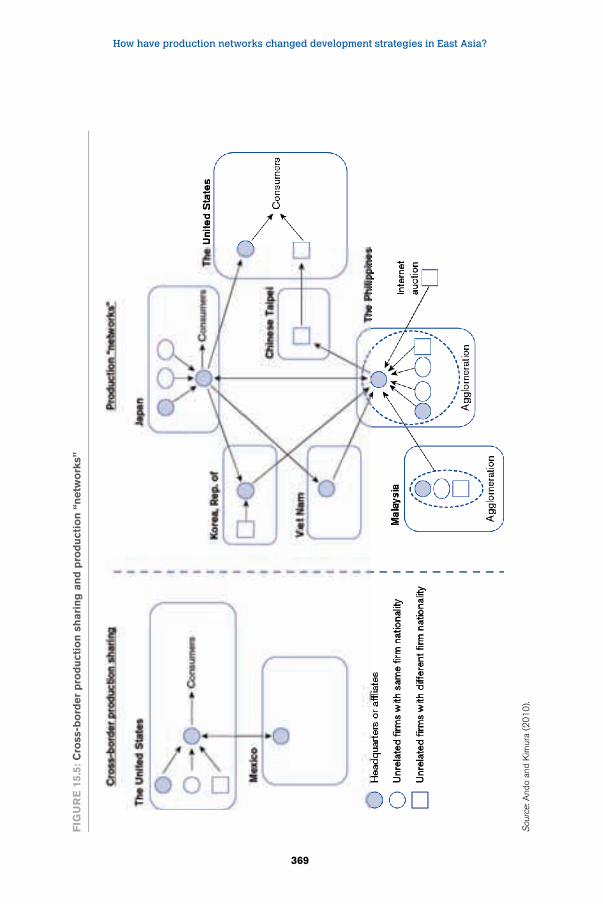
How have production networks changed development strategies in East Asia?
369
Fig
ur
e 1
5.5:
Cro
ss-b
ord
er
pro
du
ctio
n s
hari
ng
an
d p
rod
uct
ion
“n
etw
ork
s”
Sou
rce:
And
o an
d K
imur
a (2
01
0).
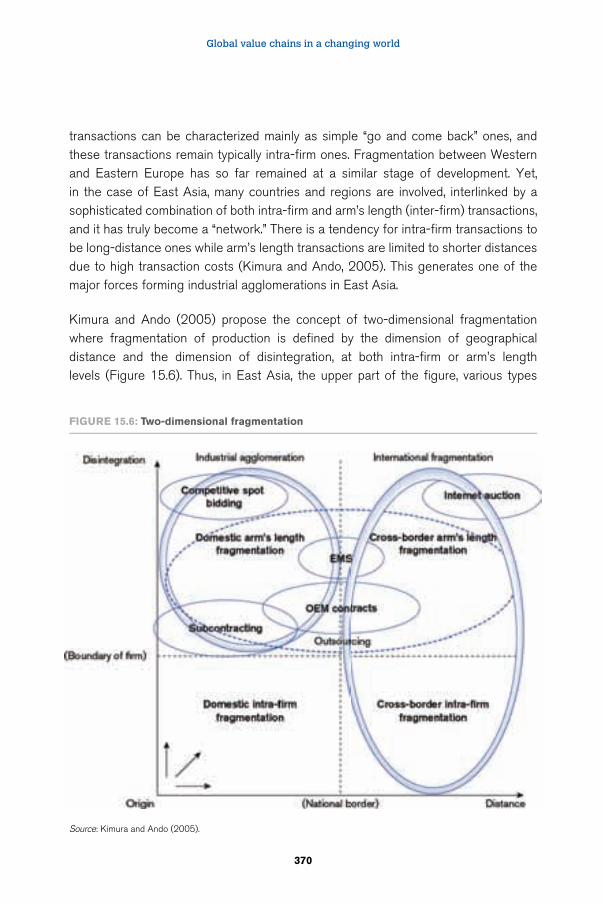
Global value chains in a changing world
370
transactions can be characterized mainly as simple “go and come back” ones, and these transactions remain typically intra-firm ones. Fragmentation between Western and Eastern Europe has so far remained at a similar stage of development. Yet, in the case of East Asia, many countries and regions are involved, interlinked by a sophisticated combination of both intra-firm and arm’s length (inter-firm) transactions, and it has truly become a “network.” There is a tendency for intra-firm transactions to be long-distance ones while arm’s length transactions are limited to shorter distances due to high transaction costs (Kimura and Ando, 2005). This generates one of the major forces forming industrial agglomerations in East Asia.
Kimura and Ando (2005) propose the concept of two-dimensional fragmentation where fragmentation of production is defined by the dimension of geographical distance and the dimension of disintegration, at both intra-firm or arm’s length levels (Figure 15.6). Thus, in East Asia, the upper part of the figure, various types
Figure 15.6: Two-dimensional fragmentation
Source: Kimura and Ando (2005).
How have production networks changed development strategies in East Asia?
371
of outsourcing, appears proliferated. In particular, the northwest part of the figure corresponds to industrial agglomeration.
How to take advantage of industrial agglomerations? First, once a certain level of industrial agglomeration has been formed, industrial structure becomes stabilized to some extent. Fragmented production blocks are footloose by nature and thus tend to move outwards when the original locational advantages such as an abundance of low-wage workers have faded. However, if transactions within industrial agglomeration are flourishing, positive agglomeration effects generate another type of locational advantage, and production blocks may remain. In this sense, a country can gain some extra time to transform its industrial structure.
Second, local firms and local entrepreneurs may have a good chance to participate in production networks run by multinationals. Although it depends on the industry and the corporate strategy of the multinationals, local parts suppliers tend to enjoy price competitiveness vis-à-vis multinational parts producers. Their weaknesses are rather typically non-price competitive such as inconsistent product quality, a lack of preciseness in delivery timing and credibility in general. Once local firms gain overall competitiveness close to the threshold of participating in production networks, MNEs are willing to help them upgrade their capabilities and invite them into such networks.2
Third, contact with MNEs is one of the most important channels for local firms to gain access to technological information. In particular, once local firms join production networks and have transactions with MNEs, the MNEs are sometimes even willing to transfer technology and managerial know-how to them, helping to upgrade local firms’ innovation, from process innovation and market access information to product innovation.3
Heavy dependence on MNEs works well during the first half of the industrialization process. In the latter half, however, a country must address its own weaknesses. Of particular importance is the development of human capital. Industrial transformation requires massive numbers of scientists and engineers. Compared with the Republic of Korea and China, ASEAN has been slow to respond to the demand for human capital. Another missing element is R&D stock. Table 15.1 presents the ratios of R&D expenditure to GDP. These ratios are still extremely low, except in Singapore and Malaysia.4
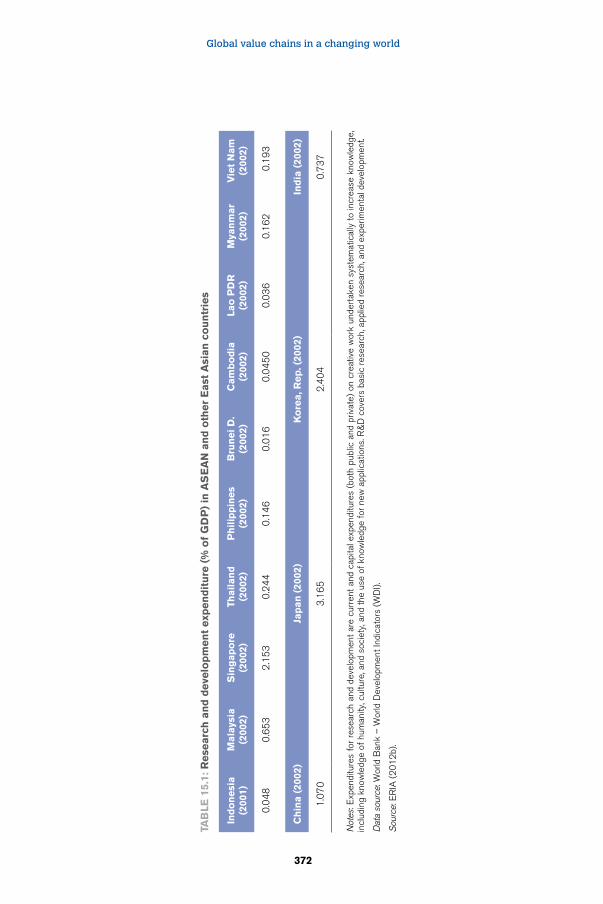
Global value chains in a changing world
372
Tab
Le 1
5.1:
rese
arc
h a
nd
deve
lop
men
t exp
en
dit
ure
(%
of
gD
P)
in a
Se
aN
an
d o
ther
east
asi
an
co
un
trie
s
ind
on
esi
a
(200
1)M
ala
ysia
(2
002)
Sin
gap
ore
(2
002)
Thail
an
d
(200
2)P
hil
ipp
ines
(200
2)b
run
ei
D.
(200
2)C
am
bo
dia
(2
002)
Lao
PD
r
(200
2)M
yan
mar
(200
2)V
iet
Nam
(2
002)
0.0
48
0.6
53
2.1
53
0.2
44
0.1
46
0.0
16
0.0
45
00
.03
60
.16
20
.19
3
Ch
ina (
2002
)Ja
pan
(20
02)
Ko
rea, r
ep
. (20
02)
ind
ia (
2002
)
1.0
70
3.1
65
2.4
04
0.7
37
Not
es: E
xpen
ditu
res
for
rese
arch
and
dev
elop
men
t ar
e cu
rren
t an
d ca
pita
l exp
endi
ture
s (b
oth
publ
ic a
nd p
rivat
e) o
n cr
eativ
e w
ork
unde
rtak
en s
yste
mat
ical
ly t
o in
crea
se k
now
ledg
e,
incl
udin
g kn
owle
dge
of h
uman
ity, c
ultu
re, a
nd s
ocie
ty, a
nd th
e us
e of
kno
wle
dge
for
new
app
licat
ions
. R&
D c
over
s ba
sic
rese
arch
, app
lied
rese
arch
, and
exp
erim
enta
l dev
elop
men
t.
Dat
a so
urce
: Wor
ld B
ank
– W
orld
Dev
elop
men
t Ind
icat
ors
(WD
I).
Sou
rce:
ER
IA (
20
12
b).
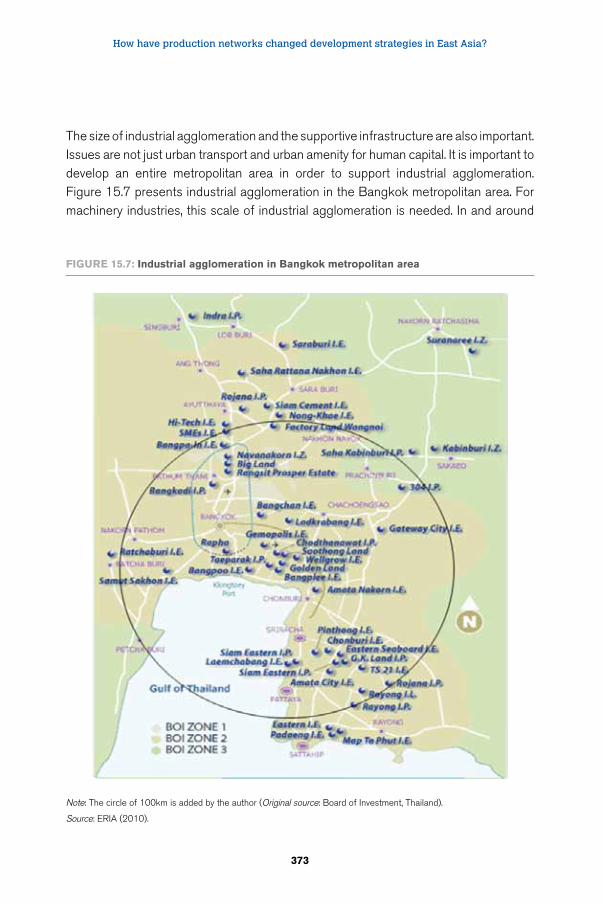
How have production networks changed development strategies in East Asia?
373
The size of industrial agglomeration and the supportive infrastructure are also important. Issues are not just urban transport and urban amenity for human capital. It is important to develop an entire metropolitan area in order to support industrial agglomeration. Figure 15.7 presents industrial agglomeration in the Bangkok metropolitan area. For machinery industries, this scale of industrial agglomeration is needed. In and around
Figure 15.7: industrial agglomeration in bangkok metropolitan area
Note: The circle of 100km is added by the author (Original source: Board of Investment, Thailand).
Source: ERIA (2010).
Global value chains in a changing world
374
Bangkok, more than 40 industrial estates are located within a 100 km diameter, and a just-in-time procurement system can be set up with just two- to 2.5-hour drive times. To operate the system well, mass physical infrastructure is essential, which includes logistic infrastructure such as a highway network, a large-scale container port and a major airport as well as other economic infrastructure including electricity supply and industrial estate services. The Pearl River delta and Shanghai’s environs have about the same geographical size. Jakarta and Manila are large in terms of population but have not yet developed infrastructure to support this scale of industrial agglomeration. Ho Chi Minh City and Hanoi also require infrastructure support, and the recent hikes in wages and land prices there due to insufficient infrastructure prevent them from effectively mobilizing human resources from rural to urban locations.
The “middle-income trap” has recently been a popular subject within the development community and in this regard East Asia shares similar challenges with other parts of the world. However, fragmentation and agglomeration in the manufacturing sector in East Asia have created characteristics distinctive from those of other regions. Understanding how to utilize the advantages of industrial agglomerations and overcome a heavy dependency on multinationals is among the prime issues confronting the region and its desire to step up from a middle-income to a fully developed economy.
15.4. Policies to utilize forces of fragmentation and agglomeration
The past two sections of this paper presented how production networks have generated a new development strategy in East Asia. Required policy reform for the development strategy is shown in the framework of the two-dimensional fragmentation (Table 15.2).
The costs of fragmenting production can be grouped into three categories: network setup costs, service link costs and production costs per se. To initiate or further enhance production networks, there typically exist some bottlenecks to be resolved in terms of these costs. On the other hand, there are two dimensions of fragmentation: fragmentation in geographical distance and particularly international fragmentation; and fragmentation in disintegration linked with the formation of industrial agglomerations.
The upper section of the table is particularly important to a country starting industrialization. Various policy modes beyond simplistic tariff removal are listed,
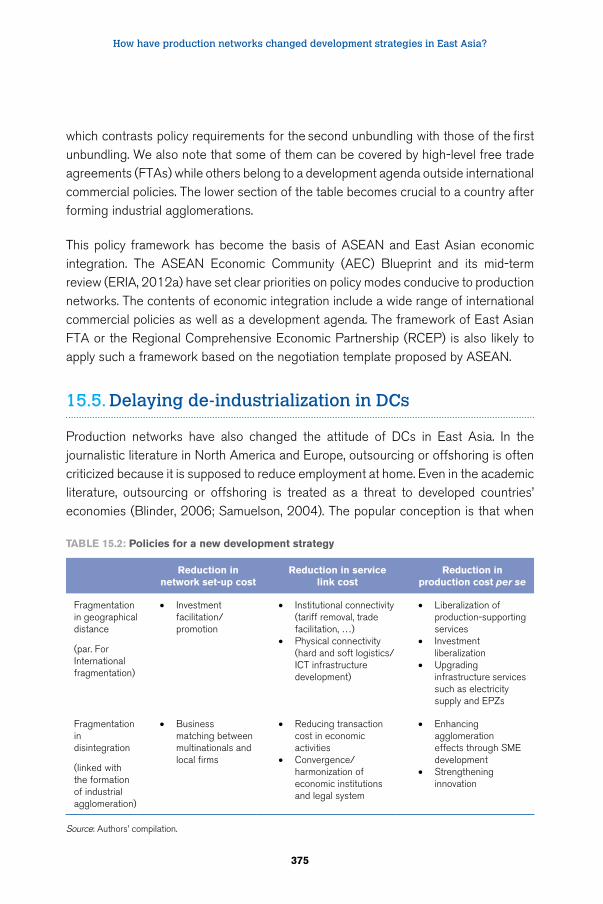
How have production networks changed development strategies in East Asia?
375
which contrasts policy requirements for the second unbundling with those of the first unbundling. We also note that some of them can be covered by high-level free trade agreements (FTAs) while others belong to a development agenda outside international commercial policies. The lower section of the table becomes crucial to a country after forming industrial agglomerations.
This policy framework has become the basis of ASEAN and East Asian economic integration. The ASEAN Economic Community (AEC) Blueprint and its mid-term review (ERIA, 2012a) have set clear priorities on policy modes conducive to production networks. The contents of economic integration include a wide range of international commercial policies as well as a development agenda. The framework of East Asian FTA or the Regional Comprehensive Economic Partnership (RCEP) is also likely to apply such a framework based on the negotiation template proposed by ASEAN.
15.5. Delaying de-industrialization in DCs
Production networks have also changed the attitude of DCs in East Asia. In the journalistic literature in North America and Europe, outsourcing or offshoring is often criticized because it is supposed to reduce employment at home. Even in the academic literature, outsourcing or offshoring is treated as a threat to developed countries’ economies (Blinder, 2006; Samuelson, 2004). The popular conception is that when
TabLe 15.2: Policies for a new development strategy
reduction in network set-up cost
reduction in service link cost
reduction in production cost per se
Fragmentation in geographical distance
(par. For International fragmentation)
• Investment facilitation/promotion
• Institutional connectivity (tariff removal, trade facilitation, …)
• Physical connectivity (hard and soft logistics/ICT infrastructure development)
• Liberalization of production-supporting services
• Investment liberalization
• Upgrading infrastructure services such as electricity supply and EPZs
Fragmentation in disintegration
(linked with the formation of industrial agglomeration)
• Business matching between multinationals and local firms
• Reducing transaction cost in economic activities
• Convergence/harmonization of economic institutions and legal system
• Enhancing agglomeration effects through SME development
• Strengthening innovation
Source: Authors’ compilation.
Global value chains in a changing world
376
a firm moves labour-intensive activities from DCs to LDCs, it lays off workers, scraps factories and then sets up new ones in LDCs.
However, such criticism is scarce in Japan. Many people in Japan, both capitalists and labour, believe that the globalization of Japanese firms, particularly in the context of production networks in East Asia, has been good for the Japanese economy. If a firm successfully sets up a proper international division of labour between North and South, it can actually enlarge its domestic operation and even increase employment. At least at the firm level, fragmentation may actually generate domestic employment in Japan.
There is empirical evidence supporting this. Ando and Kimura (2007, 2012b) show that Japanese manufacturing firms that increase the number of their affiliates in East Asia enlarge domestic employment and operations relative to other Japanese manufacturing firms, no matter whether in normal periods or during a crisis.5 Table 15.3 summarizes changes in domestic employment in 1998–2002, 2002–06 and 2007–09 by Japanese manufacturing firms. Although the long-term trend of Japanese manufacturing employment is one of gradual shrinkage, the firms that expand their operations in East Asia tend to “relatively increase” domestic employment compared with the firms that do not. This tendency is even stronger in the case of small and medium enterprises (SMEs) defined as firms with less than 300 domestic employees. By controlling for various firm-level characteristics, the econometric analysis confirms that the firms that expand their operations in East Asia generate domestic employment compared with the firms without operations in East Asia by 4.3 per cent, 6.6 per cent and 3.6 per cent respectively over the periods 1998–2002, 2002–06 and 2007–09.
We should note that the long-term trend still seems to be one of de-industrialization. In particular, after the recent global financial crisis, some signs of narrowing the scope of domestic manufacturing activities are observed in a relative shrinkage of manufacturing activities (Ando and Kimura, 2012b) and a permanent reduction in the extensive margins of Japanese exports (Ando and Kimura, 2012a). It is, however, still important to recognize that globalizing corporate activities can generate domestic operations and jobs if proper job demarcation between domestic and foreign operations is established. The Japanese government, both central and local, has continuously promoted further globalization of Japanese firms, particularly in the context of their expanding operations in East Asia.
A positive perception of production networks also affects Japan’s strategy regarding East Asian economic integration. Although Japan’s overall FTA strategy has been
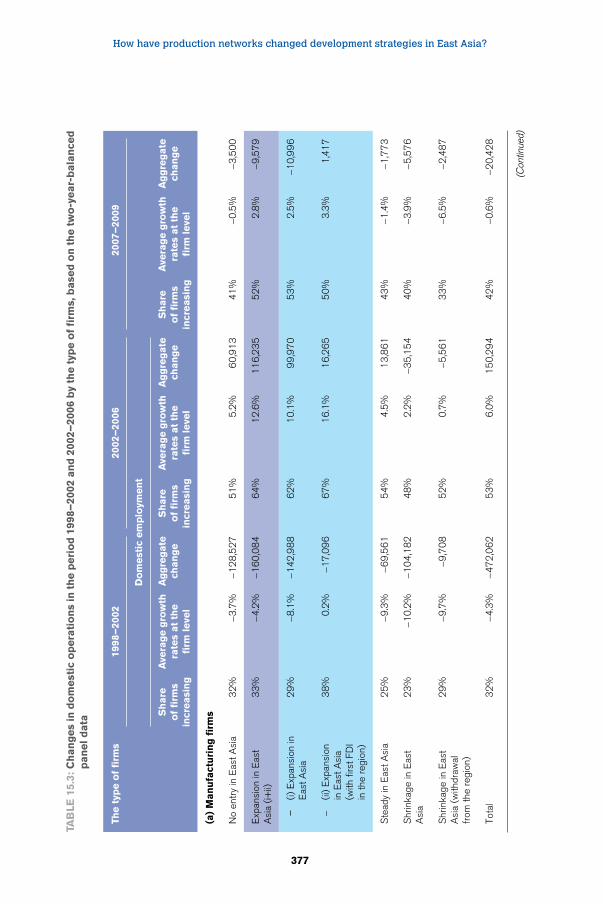
How have production networks changed development strategies in East Asia?
377
Tab
Le 1
5.3:
Ch
an
ges
in d
om
est
ic o
pera
tio
ns
in t
he p
eri
od
199
8–20
02 a
nd
200
2–20
06 b
y th
e t
ype o
f fi
rms,
base
d o
n t
he t
wo
-year-
bala
nce
d
pan
el d
ata
The t
ype o
f fi
rms
1998
–20
0220
02–
2006
2007
–20
09
Do
mest
ic e
mp
loym
en
t
Sh
are
o
f fi
rms
incr
easi
ng
ave
rag
e g
row
th
rate
s at
the
firm
leve
l
ag
gre
gate
ch
an
ge
Sh
are
o
f fi
rms
incr
easi
ng
ave
rag
e g
row
th
rate
s at
the
firm
leve
l
ag
gre
gate
ch
an
ge
Sh
are
o
f fi
rms
incr
easi
ng
ave
rag
e g
row
th
rate
s at
the
firm
leve
l
ag
gre
gate
ch
an
ge
(a)
Man
ufa
ctu
rin
g f
irm
s
No
entr
y in
Eas
t Asi
a3
2%
-3.7
%-1
28
,52
75
1%
5.2
%6
0,9
13
4
1%
-0.5
%-3
,50
0
Exp
ansi
on in
Eas
t A
sia
(i+ii)
33
%-4
.2%
-16
0,0
84
64
%1
2.6
%1
16
,23
5
52
%2
.8%
-9,5
79
–
(i) E
xpan
sion
in
Eas
t Asi
a2
9%
-8.1
%-1
42
,98
86
2%
10
.1%
99
,97
0
53
%2
.5%
-10
,99
6
- (ii
) E
xpan
sion
in
Eas
t Asi
a (w
ith f
irst F
DI
in th
e re
gion
)
38
%0
.2%
-17
,09
66
7%
16
.1%
16
,26
5
50
%3
.3%
1,4
17
Ste
ady
in E
ast A
sia
25
%-9
.3%
-69
,56
15
4%
4.5
%1
3,8
61
4
3%
-1.4
%-1
,77
3
Shr
inka
ge in
Eas
t A
sia
23
%-1
0.2
%-1
04
,18
24
8%
2.2
%-3
5,1
54
4
0%
-3.9
%-5
,57
6
Shr
inka
ge in
Eas
t A
sia
(with
draw
al
from
the
regi
on)
29
%-9
.7%
-9,7
08
52
%0
.7%
-5,5
61
3
3%
-6.5
%-2
,48
7
Tota
l3
2%
-4.3
%-4
72
,06
25
3%
6.0
%1
50
,29
4
42
%-0
.6%
-20
,42
8
(Con
tinue
d)
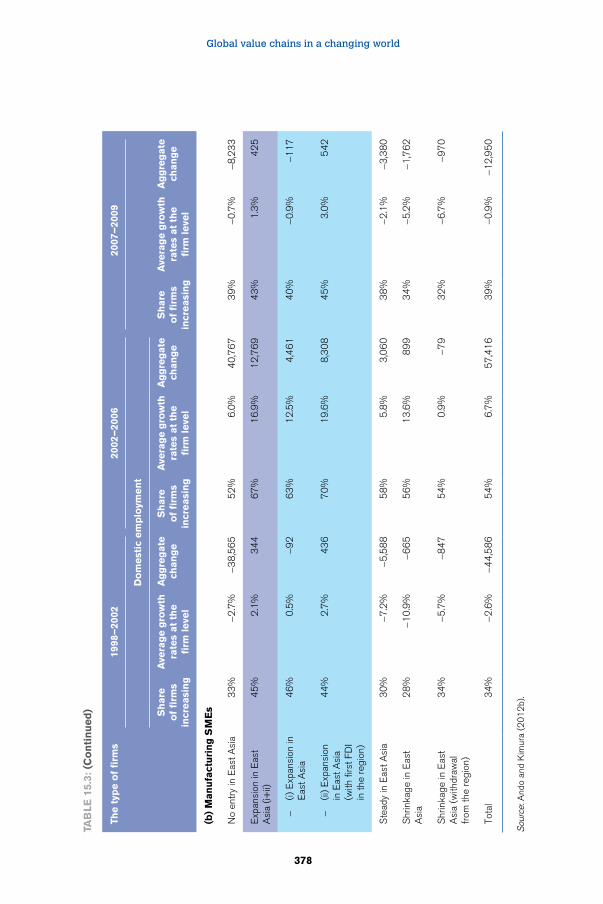
Global value chains in a changing world
378
The t
ype o
f fi
rms
1998
–20
0220
02–
2006
2007
–20
09
Do
mest
ic e
mp
loym
en
t
Sh
are
o
f fi
rms
incr
easi
ng
ave
rag
e g
row
th
rate
s at
the
firm
leve
l
ag
gre
gate
ch
an
ge
Sh
are
o
f fi
rms
incr
easi
ng
ave
rag
e g
row
th
rate
s at
the
firm
leve
l
ag
gre
gate
ch
an
ge
Sh
are
o
f fi
rms
incr
easi
ng
ave
rag
e g
row
th
rate
s at
the
firm
leve
l
ag
gre
gate
ch
an
ge
(b)
Man
ufa
ctu
rin
g S
Me
s
No
entr
y in
Eas
t Asi
a3
3%
-2.7
%-3
8,5
65
52
%6
.0%
40
,76
7
39
%-0
.7%
-8,2
33
Exp
ansi
on in
Eas
t A
sia
(i+ii)
45
%2
.1%
34
46
7%
16
.9%
12
,76
9
43
%1
.3%
42
5
- (i)
Exp
ansi
on in
E
ast A
sia
46
%0
.5%
-92
63
%1
2.5
%4
,46
1
40
%-0
.9%
-11
7
- (ii
) E
xpan
sion
in
Eas
t Asi
a (w
ith f
irst F
DI
in th
e re
gion
)
44
%2
.7%
43
67
0%
19
.6%
8,3
08
4
5%
3.0
%5
42
Ste
ady
in E
ast A
sia
30
%-7
.2%
-5,5
88
58
%5
.8%
3,0
60
3
8%
-2.1
%-3
,38
0
Shr
inka
ge in
Eas
t A
sia
28
%-1
0.9
%-6
65
56
%1
3.6
%8
99
3
4%
-5.2
%-1
,76
2
Shr
inka
ge in
Eas
t A
sia
(with
draw
al
from
the
regi
on)
34
%-5
.7%
-84
75
4%
0.9
%-7
9
32
%-6
.7%
-97
0
Tota
l3
4%
-2.6
%-4
4,5
86
54
%6
.7%
57
,41
6
39
%-0
.9%
-12
,95
0
Sou
rce:
And
o an
d K
imur
a (2
01
2b)
.
Tab
Le 1
5.3:
(C
on
tin
ued
)
How have production networks changed development strategies in East Asia?
379
partly hampered by the notorious agricultural lobby, clear priorities have been placed on policy modes conducive to production networks. Japan’s participation in the Trans-Pacific Strategic Economic Partnership Agreement (TPP) is regarded as an inevitable step towards realizing an international economic environment favourable to production networks, particularly through high levels of liberation in terms of tariffs, services, investment and intellectual property rights protection. TPP, however, will not cover all the policy modes for ASEAN and East Asia. Trade, services and investment facilitation as well as a varied development agenda including infrastructure and SME development is considered to be the task of East Asian economic integration.
15.6. Stability and resiliency against macro shocks
An often-claimed concern regarding committing ourselves to production networks in both LDCs and DCs is that production networks may work as a shock transmission channel once a massive macro shock occurs somewhere in the world. Production networks aggressively take advantage of differences in locational advantages and connect separately located production blocks by tight service links. When a negative shock affects part of the production networks, it will necessarily influence the whole system.
In the case of the global financial crisis starting in 2008, a massive negative demand shock came up through the value chain from downstream, affecting all production networks in East Asia. In the case of the East Japan earthquake and the disastrous flooding in Thailand in 2011, part of the supply chain was disrupted and supply shocks were transmitted through production networks.
However, these shock transmissions should not be confused with financial contagion. A financial crisis shakes the credibility of the entire financial system, whose weaker parts are prone to be attacked, and a wide range of financial sectors in multiple countries may be exposed to contagion. On the other hand, shocks in production networks do not carry such a risk of contagion. Rather, private companies make every effort to minimize a shock and keep production networks working well.
Transactions in production networks are indeed more stable and resilient against shocks than other types of transaction. Ando and Kimura (2012a) employ by-destination data of Japanese exports at the HS nine-digit level and decompose a drop and recovery of export values into intensive and extensive margins in the global financial crisis and the East Japan earthquake. They find that trade in machinery
Global value chains in a changing world
380
parts and components within East Asia is less likely to be interrupted and more likely to recover than are other types of international trade. Private companies try hard to maintain quick, high-frequency synchronized production networks. This result suggests that production networks may rather work as a macroeconomic stabilizer against shocks.
One important observation is that even after the East Japanese earthquake and the massive flooding in Thailand, private companies did not go back to the pre-fragmentation system of production. They made various efforts to strengthen control of the entire production network and to establish back-up channels to some extent. These efforts however are certainly costly, and there are tradeoffs between the benefits of fragmented production and the insurance against shocks. Policy debates do not focus on pulling back from production networks but rather on how to strengthen geographical links extended in East Asia.
15.7. Conclusion
Production networks of the second unbundling in the manufacturing sector in East Asia are currently the most advanced in the world and present fundamentally different development strategies for LDCs. The first half of these development strategies is pretty well established. By participating in production networks through resolving bottlenecks, LDCs can jump-start industrialization. The latter half of these development strategies is still in uncharted territory. How to step up from a middle-income to a fully developed economy is a challenge that relatively advanced parts of East Asia face, although the strength of having industrial agglomeration should certainly be effectively utilized.
Changes in the nature of the North-South division of labour also affect DCs’ attitudes toward globalizing corporate activities. Moving labour-intensive activities to LDCs does not necessarily mean the loss of domestic employment. If a firm successfully sets up an efficient division of labour between LDCs and DCs, it can even generate domestic economic activities and employment. This is instinctively perceived as a way of enjoying trickle-down benefits from East Asian economic dynamism.
Linking to the globalizing world is necessarily accompanied by risks of exposure to various shocks. However, differences between shocks transmitted through production networks and arising from financial links have been well recognized, and the stability
How have production networks changed development strategies in East Asia?
381
and resilience of production networks have increasingly been appreciated rather as a stabilizing factor.
Production networks and the second unbundling have changed the nature of the North-South division of labour. East Asia is about to present a new model for the world.
Endnotes
1 In this paper, East Asia includes ASEAN plus three Northeast Asian countries (Japan, the Republic of Korea and China) and, sometimes, Chinese Taipei.
2 Vo et al., (2010) conduct a questionnaire survey and examine the characteristics of local firms that determine whether they can participate in production networks or not.
3 Intarakumnerd and Ueki (2010); Intarakumnerd (2011) and Sunami and Intarakumnerd (2011) investigate what sort of technological information is obtained through which channels as well as how firms can upgrade their innovation by conducting extensive questionnaire surveys.
4 For the Republic of Korea and China, more recent data presents more than 3 per cent and 2 per cent, respectively.
5 Hijzen et al., (2007) obtain similar results for new entrants to foreign investment, using the propensity score matching technique.
References
Ando, M. 2012. “Development and Restructuring of Regional Production/Distribution Networks in East Asia.” Forthcoming in an ERIA Report (Jakarta, Indonesia, Economic Research Institute for ASEAN and East Asia).
Ando, M.; Kimura, F. 2007. “Can Offshoring Create Domestic Jobs? Evidence from Japanese Data,” CEPR Policy Insight, No. 16, December, (London, UK, Centre for Economic Policy Research). Available at: http://www.cepr.org/pubs/PolicyInsights/CEPR_Policy_Insight_016.asp. Summarized version “Job-creating Offshoring?” is available at: http://voxeu.org/.
Ando, M.; Kimura, F. 2010. “The Spatial Pattern of Production and Distribution Networks in East Asia” in P.-C. Athukorala (ed.): The Rise of Asia: Trade and Investment in Global Perspective, (London, UK and New York, NY, Routledge).
Ando, M.; Kimura, F. 2012a. “How Did the Japanese Exports Respond to Two Crises in the International Production Networks? The Global Financial Crisis and the East Japan Earthquake” in Asian Economic Journal, 26(3): 261–287.
Global value chains in a changing world
382
Ando, M.; Kimura, F. 2012b. “International Production Networks and Domestic Operations by Japanese Manufacturing Firms: Normal Periods and the Global Financial Crisis”, RIETI Discussion Paper Series 12-E-047, July (Tokyo, Japan, Research Institute of Economy, Trade and Industry). Available at: http://www.rieti.go.jp/jp/publications/act_dp.html.
Baldwin, R. 2011. “21st Century Regionalism: Filling the Gap between 21st Century Trade and 20th Century Trade Rules”, CEPR Policy Insight, No. 56, May, (London, UK, Centre for Economic Policy Research). Available at: http://www.cepr.org/pubs/policyinsights/PolicyInsight56.pdf
Blinder, A. S. 2006. “Offshoring: The Next Industrial Revolution?” in Foreign Affairs, 85: 113–128.
ERIA. 2010. “Comprehensive Asia Development Plan” (Jakarta, Indonesia, Economic Research Institute for ASEAN and East Asia). Available at: http://www.eria.org/ERIA-PB-2010-02.pdf.
ERIA. 2012a. “Mid-Term Review of the Implementation of AEC Blueprint: Executive Summary” (Jakarta, Indonesia, Economic Research Institute for ASEAN and East Asia). Available at: http://www.eria.org/publications/key_reports/mid-term-review-of-the-implementation-of-aec-blueprint-executive-summary.html.
ERIA. 2012b. “Phnom Penh Initiative for Narrowing Development Gaps” in A. Hijzen; Tomohiko, I.; and Yasuyuki, T.: “The Effects of Multinational Production on Domestic Performance: Evidence from Japanese Firms” RIETI Discussion Paper Series No.07-E-0006-047 (Tokyo, Japan, Research Institute of Economy, Trade and Industry and Jakarta, Indonesia, Economic Research Institute for ASEAN and East Asia). Available at: http://www.rieti.go.jp/jp/publications/act_dp.html.
Hijzen, A.; Inui, T.; Todo, Y. 2007. “The effects of Multinational Production on Domestic Performance: Evidence from Japanese Firms,” RIETI Discussion Paper Series 07-E-006.
Intarakumnerd, P. (ed). 2011. “How to Enhance Innovation Capability with Internal and External Sources”, ERIA Research Project Report 2010-9 (Jakarta, Indonesia, Economic Research Institute for ASEAN and East Asia). Available at: http://www.eria.org.
Intarakumnerd, P.; Ueki, Y. (eds). 2010. “Fostering Production and Science and Technology Linkages to Stimulate Innovation in ASEAN,” ERIA Project Report 2009-7-4, posted March 2010. Available at: http://www.eria.org/publications/research_project_reports/fostering-production-and-science-technology-linkages-to-stimulate-innovation-in-asean.html
Intarakumnerd, P.; Yasushi, U. (eds.). 2010. “Fostering Production and Science & Technology Linkages to Stimulate Innovation in ASEAN”, ERIA Research Project Report 2009-7-4 (Jakarta, Indonesia, Economic Research Institute for ASEAN and East Asia). Available at: http://www.eria.org.
How have production networks changed development strategies in East Asia?
383
Jones, R. W.; Kierzkowski, H. 1990. “The Role of Services in Production and International Trade: A Theoretical Framework” in R.W. Jones and A. O. Krueger (eds): The Political Economy of International Trade: Essays in Honor of Robert E. Baldwin (Oxford, UK, Basil Blackwell).
Kimura, F.; Ando, M. 2005. “Two-Dimensional Fragmentation in East Asia: Conceptual Framework and Empirics” in International Review of Economics and Finance (special issue on “Outsourcing and Fragmentation: Blessing or Threat” edited by Henryk Kierzkowski), 14(3): 317–348.
Kimura, F.; Obashi, A. 2010. “International Production Networks in Machinery Industries: Structure and Its Evolution”, ERIA Discussion Paper Series ERIA-DP-2010-10, September, (Jakarta, Indonesia, Economic Research Institute for ASEAN and East Asia). Available at: http://www.eria.org.
Samuelson, P.A. 2004. “Where Ricardo and Mill Rebut and Confirm Arguments of Mainstream Economists Supporting Globalization” in Journal of Economic Perspectives, 18: 135–146. Available at: http://pubs.aeaweb.org/doi/pdfplus/10.1257/0895330042162403
Sunami, A.; Intarakumnerd, P. (eds). 2011. “A Comparative Study on the Role of University and PRI as External Resources for Firms’ Innovation”, ERIA Research Project Report 2010–10, (Jakarta, Indonesia, Economic Research Institute for ASEAN and East Asia). Available at: http://www.eria.org.
Vo, T. T.; Narjoko, D.; Oum, S. (eds). 2010. “Integrating Small and Medium Enterprises (SMEs) into the More Integrated East Asia”, ERIA Research Project Report 2009-8, (Jakarta, Indonesia, Economic Research Institute for ASEAN and East Asia). Available at: http://www.eria.org.

385
16 Expansion of global value chains in Asian developing countries
Automotive case study in the Mekong subregion
Masato Abe
16.1. Introduction
During the past three decades, the development of highly integrated global value chains in which products are supplied, manufactured and distributed across national boundaries have created a new form of division of labour among Asian economies, especially in North-East and South-East Asia (IDE-JETRO and WTO, 2011). The rapid growth of global value chains has dramatically changed production patterns, international trade and foreign direct investment (FDI) in the region, with a notable expansion of intra-regional trade through multiple border crossings of parts and components (ESCAP, 2009).
While an increasing number of literatures have examined the global value chain phenomenon in Asia (ESCAP, 2007; 2009), little attention has been paid to its expansion from developing countries to less developed neighbours, such as least developed countries (LDCs) (Makishima, 2012). The lack of existing research and reliable national data has made an adequate review of global value chains in less developed countries particularly difficult.
Against this background, key research questions of this case study are proposed as follows:
• What are key drivers of global value chain, particularly in less developed countries?
• How do sectoral characteristics impact on the development of global value chains?
• How can public interventions accelerate the expansion of the global value chains in less developed countries?
The Mekong subregion (Figure 16.1),1 which is part of South-East Asia and comprises five Mekong river basin countries (Cambodia, Lao People’s Democratic Republic or
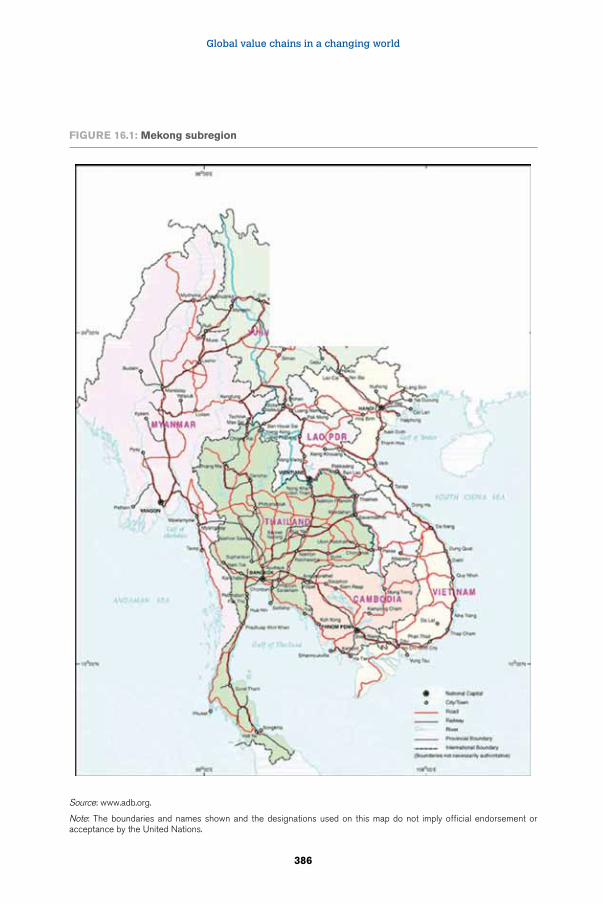
Global value chains in a changing world
386
Figure 16.1: Mekong subregion
Source: www.adb.org.
Note: The boundaries and names shown and the designations used on this map do not imply official endorsement or acceptance by the United Nations.
Expansion of global value chains in Asian developing countries
387
Lao PDR, Myanmar, Thailand and Viet Nam) is the geographical focus of this study. The subregion provides valuable laboratories to explore these research topics since it has experienced a varied degree of economic development and includes a middle-income country (Thailand), a lower middle-income country (Viet Nam) and three least-developed countries (Cambodia, Lao PDR and Myanmar).
In the Mekong subregion, the automotive industry has been growing rapidly. Several major automakers have established production bases in Thailand and Viet Nam, and their supplier networks have been expanding into Cambodia, Lao PDR and Myanmar. The subregion has benefited from increased capital inflows, the creation of employment and human resource development. While the automotive industry operates within a single sector and shares a common frame of reference, the industry shows much diversity in terms of products and technologies, presenting diversified supply and production networks.
This study is based on both quantitative and qualitative analyses. Trade, foreign direct investment (FDI) and descriptive data are used to review the ongoing integration of the subregion into the global automotive value chains. The outcomes of three industrial surveys in the subregion (JETRO, 2009 and 2012; FPRI, 2012) are also reviewed to identify sectoral issues in the automotive industry. This article begins by examining the development of the automotive industry in the Mekong subregion and its key drivers. The characteristics of global automotive value chains are then identified, while covering the recent expansion of the automotive value chains within the subregion. The outcomes of the three industrial surveys are then discussed. Before concluding, policy implications are then presented.
16.2. Development of the automotive value chains in the Mekong subregion
The automotive industry, which covers all companies and activities involved in the manufacturing of automobiles, parts and components, is the largest global industrial sector with a total unit production of nearly 80 million in 2011 (OICA, 2012) and total sales of approximately US$ 2.2 trillion in 2008 (FPRI, 2012). Its final products, parts and components are the second most-traded manufactured goods in the world after electronic appliances and equipment, accounting for approximately 7.5 per cent of world trade in 2010.2 Automakers have adopted an expansion strategy in Asia, particularly given the maturing markets of the European Union, Japan and the United States, with growth coming particularly from Asian developing countries (FPRI, 2012).
Global value chains in a changing world
388
Since the 1960s, Thailand has gradually emerged as the major production base of automobiles and intermediaries for both Japanese and Western automakers. Later, the 1980s and the 1990s saw a wave of assembly and supplier plant construction in Thailand and Viet Nam, respectively, as declining tariffs and transportation costs allowed for more flexibility in assembling vehicles and sourcing components from various countries. The establishment of assembly lines in Cambodia in the 2000s further strengthened this trend. Myanmar recently started the mass production of commercial vehicles. Currently, major suppliers have begun sourcing labour-intensive parts and components from Lao PDR.
Along the way, automakers have taken advantage of regional trade and investment liberalization, such as the ASEAN Economic Community (AEC)3 to develop production facilities in South-East Asia and enhance the division of labour within the region in order to achieve greater market access and economies of scale (Kohpaiboon and Yamashita, 2011).4 However, economic integration has also evolved beyond the geographical scope of ASEAN, building the formal economic partnership of ASEAN+6 with China, India, the Republic of Korea, Australia, Japan and New Zealand. Table 16.1 summarizes regional trade agreements pertinent to ASEAN and thus the Mekong subregion.
When looking at the current tariff schedules for automobiles and auto parts in the Mekong subregion (Table 16.2), the countries in the subregion, except for Lao PDR and Myanmar, have provided preferential tariff rates within ASEAN, although automobiles and auto parts appear on the sensitive list under the ASEAN Trade in Goods Agreement (ATIGA). Lao PDR and Myanmar apply flat rates with 122 per cent and 30 per cent, respectively, on both completely-built units (CBU) and complete knock-down (CKD) kits regardless whether it involves imports from within or outside ASEAN. For the category of intra-ASEAN imports of CBUs, Viet Nam applies the second highest rate with 70 per cent whereas the tariff rates of Cambodia and Thailand are significantly lower, with zero to five per cent and zero per cent, respectively. If the imported CBUs originate from outside ASEAN, then Cambodia, Thailand and Viet Nam use a 35 per cent, 80 per cent and 70-82 per cent tariff, respectively. While the same tariff rate is in place for both CBUs and CKDs in Cambodia, Thailand and Viet Nam apply higher rates on CKDs from outside ASEAN (30 per cent and 65–78 per cent, respectively). The applied tariff rates for auto parts range from zero per cent in Thailand, through zero to five per cent in Cambodia to five per cent in Viet Nam if the parts come from another ASEAN country. Otherwise, Cambodia charges seven to 15 per cent, Thailand five to 30 per cent and Viet Nam zero to 30 per cent. It is
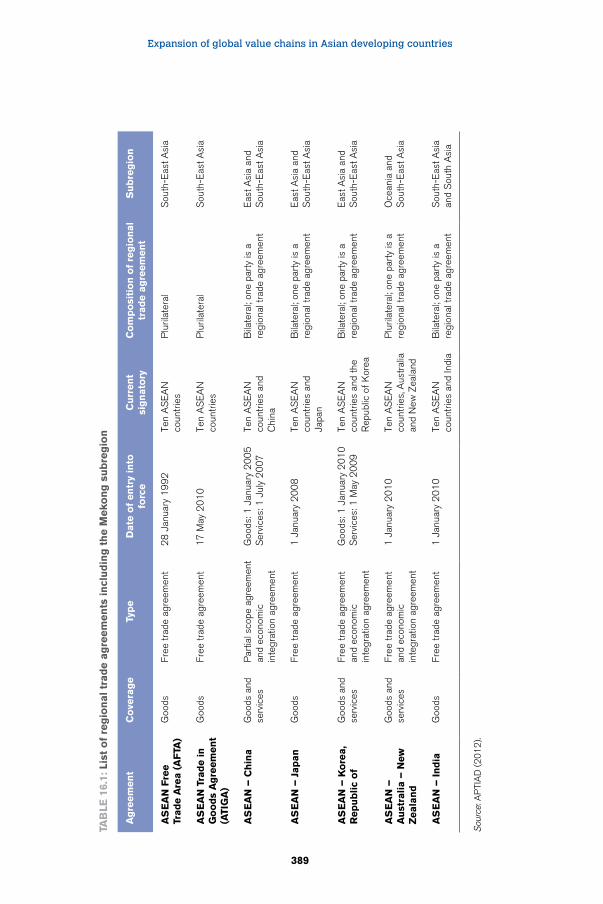
Expansion of global value chains in Asian developing countries
389
Tab
le 1
6.1:
lis
t o
f re
gio
nal tr
ad
e a
gre
em
en
ts in
clu
din
g t
he M
eko
ng
su
bre
gio
n
ag
reem
en
tC
ove
rag
eTy
pe
Date
of
en
try
into
fo
rce
Cu
rren
t si
gn
ato
ryC
om
po
siti
on
of
reg
ion
al
trad
e a
gre
em
en
tS
ub
reg
ion
aS
ea
N F
ree
Trad
e a
rea (
aF
Ta)
Goo
dsFr
ee tr
ade
agre
emen
t2
8 J
anua
ry 1
99
2Te
n A
SE
AN
co
untr
ies
Plu
rilat
eral
Sou
th-E
ast A
sia
aS
ea
N T
rad
e i
n
go
od
s a
gre
em
en
t (a
Tig
a)
Goo
dsFr
ee tr
ade
agre
emen
t1
7 M
ay 2
01
0Te
n A
SE
AN
co
untr
ies
Plu
rilat
eral
Sou
th-E
ast A
sia
aS
ea
N –
Ch
ina
Goo
ds a
nd
serv
ices
Par
tial s
cope
agr
eem
ent
and
econ
omic
in
tegr
atio
n ag
reem
ent
Goo
ds: 1
Jan
uary
20
05
Ser
vice
s: 1
Jul
y 2
00
7Te
n A
SE
AN
co
untr
ies
and
Chi
na
Bila
tera
l; on
e pa
rty
is a
re
gion
al tr
ade
agre
emen
tE
ast A
sia
and
Sou
th-E
ast A
sia
aS
ea
N –
Jap
an
Goo
dsFr
ee tr
ade
agre
emen
t1
Jan
uary
20
08
Ten
AS
EA
N
coun
trie
s an
d Ja
pan
Bila
tera
l; on
e pa
rty
is a
re
gion
al tr
ade
agre
emen
tE
ast A
sia
and
Sou
th-E
ast A
sia
aS
ea
N –
Ko
rea,
rep
ub
lic
of
Goo
ds a
nd
serv
ices
Free
trad
e ag
reem
ent
and
econ
omic
in
tegr
atio
n ag
reem
ent
Goo
ds: 1
Jan
uary
20
10
Ser
vice
s: 1
May
20
09
Ten
AS
EA
N
coun
trie
s an
d th
e R
epub
lic o
f K
orea
Bila
tera
l; on
e pa
rty
is a
re
gion
al tr
ade
agre
emen
tE
ast A
sia
and
Sou
th-E
ast A
sia
aS
ea
N –
a
ust
rali
a –
New
Z
eala
nd
Goo
ds a
nd
serv
ices
Free
trad
e ag
reem
ent
and
econ
omic
in
tegr
atio
n ag
reem
ent
1 J
anua
ry 2
01
0Te
n A
SE
AN
co
untr
ies,
Aus
tral
ia
and
New
Zea
land
Plu
rilat
eral
; one
par
ty is
a
regi
onal
trad
e ag
reem
ent
Oce
ania
and
S
outh
-Eas
t Asi
a
aS
ea
N –
in
dia
Goo
dsFr
ee tr
ade
agre
emen
t1
Jan
uary
20
10
Te
n A
SE
AN
co
untr
ies
and
Indi
aB
ilate
ral;
one
part
y is
a
regi
onal
trad
e ag
reem
ent
Sou
th-E
ast A
sia
and
Sou
th A
sia
Sou
rce:
AP
TIA
D (
20
12
).
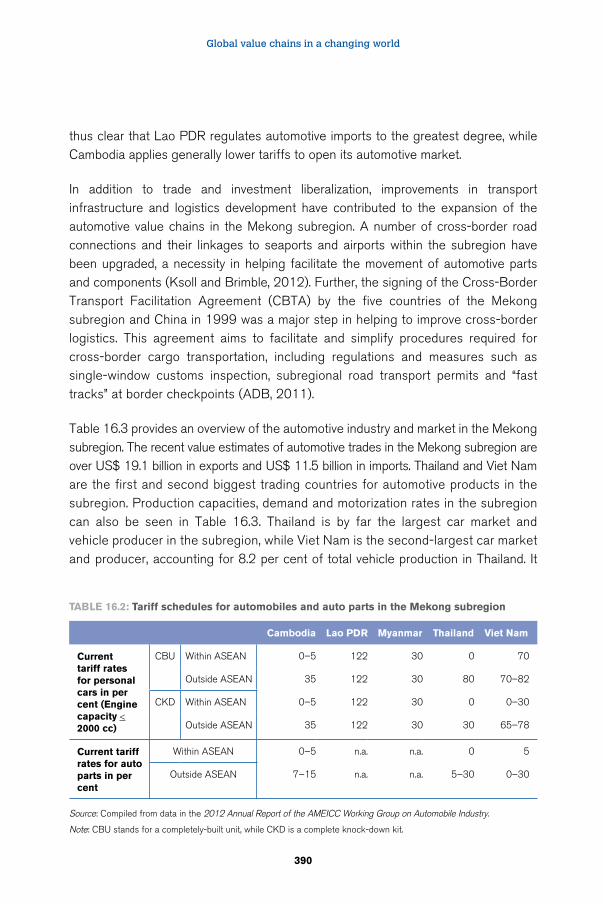
Global value chains in a changing world
390
Table 16.2: Tariff schedules for automobiles and auto parts in the Mekong subregion
Cambodia lao PDr Myanmar Thailand Viet Nam
Current tariff rates for personal cars in per cent (engine capacity < 2000 cc)
CBU Within ASEAN 0–5 122 30 0 70
Outside ASEAN 35 122 30 80 70–82
CKD Within ASEAN 0–5 122 30 0 0–30
Outside ASEAN 35 122 30 30 65–78
Current tariff rates for auto parts in per cent
Within ASEAN 0–5 n.a. n.a. 0 5
Outside ASEAN 7–15 n.a. n.a. 5–30 0–30
Source: Compiled from data in the 2012 Annual Report of the AMEICC Working Group on Automobile Industry.
Note: CBU stands for a completely-built unit, while CKD is a complete knock-down kit.
thus clear that Lao PDR regulates automotive imports to the greatest degree, while Cambodia applies generally lower tariffs to open its automotive market.
In addition to trade and investment liberalization, improvements in transport infrastructure and logistics development have contributed to the expansion of the automotive value chains in the Mekong subregion. A number of cross-border road connections and their linkages to seaports and airports within the subregion have been upgraded, a necessity in helping facilitate the movement of automotive parts and components (Ksoll and Brimble, 2012). Further, the signing of the Cross-Border Transport Facilitation Agreement (CBTA) by the five countries of the Mekong subregion and China in 1999 was a major step in helping to improve cross-border logistics. This agreement aims to facilitate and simplify procedures required for cross-border cargo transportation, including regulations and measures such as single-window customs inspection, subregional road transport permits and “fast tracks” at border checkpoints (ADB, 2011).
Table 16.3 provides an overview of the automotive industry and market in the Mekong subregion. The recent value estimates of automotive trades in the Mekong subregion are over US$ 19.1 billion in exports and US$ 11.5 billion in imports. Thailand and Viet Nam are the first and second biggest trading countries for automotive products in the subregion. Production capacities, demand and motorization rates in the subregion can also be seen in Table 16.3. Thailand is by far the largest car market and vehicle producer in the subregion, while Viet Nam is the second-largest car market and producer, accounting for 8.2 per cent of total vehicle production in Thailand. It
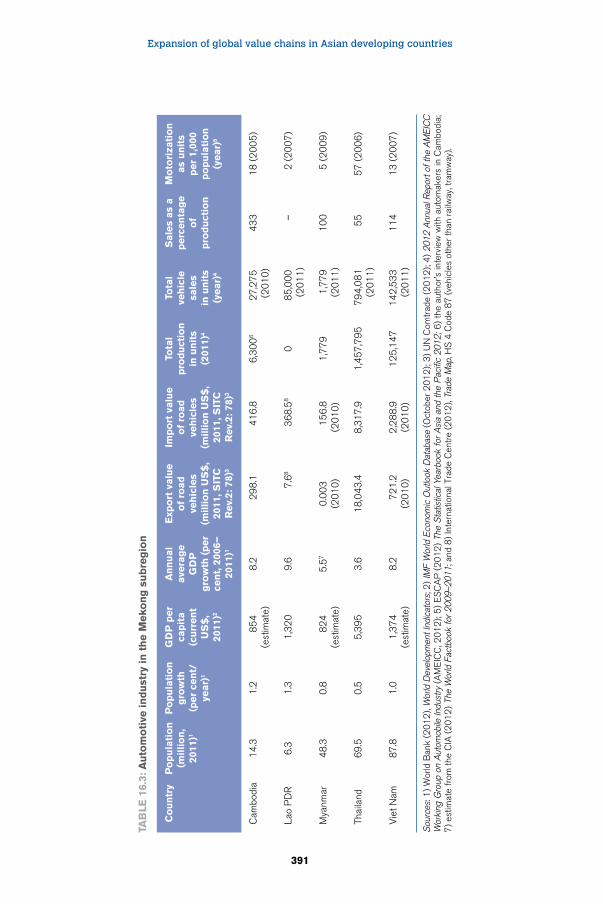
Expansion of global value chains in Asian developing countries
391
Tab
le 1
6.3:
au
tom
oti
ve in
du
stry
in
th
e M
eko
ng
su
bre
gio
n
Co
un
try
Po
pu
lati
on
(m
illi
on
, 20
11)1
Po
pu
lati
on
g
row
th(p
er
cen
t/ye
ar)
1
gD
P p
er
cap
ita
(cu
rren
t u
S$
, 20
11)2
an
nu
al
ave
rag
e
gD
P
gro
wth
(p
er
cen
t, 2
006–
2011
)1
exp
ort
valu
e
of
road
ve
hic
les
(mil
lio
n u
S$
, 20
11, S
iTC
r
ev.
2: 7
8)3
imp
ort
valu
e
of
road
ve
hic
les
(mil
lio
n u
S$
, 20
11, S
iTC
r
ev.
2: 7
8)3
Tota
l p
rod
uct
ion
in
un
its
(201
1)4
Tota
l ve
hic
le
sale
s in
un
its
(year)
4
Sale
s as
a
perc
en
tag
e
of
pro
du
ctio
n
Mo
tori
zati
on
as
un
its
per
1,00
0 p
op
ula
tio
n
(year)
5
Cam
bodi
a1
4.3
1.2
85
4(e
stim
ate)
8.2
2
98
.1
41
6.8
6,3
00
62
7,2
75
(2
01
0)
43
31
8 (
20
05
)
Lao
PD
R6
.31
.31
,32
09
.6
7.6
8
36
8.5
80
85
,00
0 (
20
11
)–
2 (
20
07
)
Mya
nmar
48
.30
.88
24
(est
imat
e)5
.57
0.0
03
(20
10
)
15
6.8
(20
10
)1
,77
91
,77
9 (
20
11
)1
00
5 (
20
09
)
Thai
land
69
.50
.55
,39
53
.61
8,0
43
.48
,31
7.9
1,4
57
,79
57
94
,08
1 (
20
11
) 5
55
7 (
20
06
)
Vie
t Nam
87
.81
.01
,37
4(e
stim
ate)
8.2
7
21
.2(2
01
0)
2,2
88
.9(2
01
0)
12
5,1
47
14
2,5
33
(2
01
1)
11
41
3 (
20
07
)
Sou
rces
: 1)
Wor
ld B
ank
(20
12
), W
orld
Dev
elop
men
t Ind
icat
ors;
2)
IMF
Wor
ld E
cono
mic
Out
look
Dat
abas
e (O
ctob
er 2
01
2);
3)
UN
Com
trad
e (2
01
2);
4)
2012
Ann
ual R
epor
t of t
he A
ME
ICC
W
orki
ng G
roup
on
Aut
omob
ile In
dust
ry (
AM
EIC
C, 2
01
2);
5)
ES
CA
P (
20
12
) Th
e S
tatis
tical
Yea
rboo
k fo
r A
sia
and
the
Pac
ific
2012
; 6)
the
auth
or’s
inte
rvie
w w
ith a
utom
aker
s in
Cam
bodi
a;
7)
estim
ate
from
the
CIA
(2
01
2)
The
Wor
ld F
actb
ook
for 2
009–
2011
; and
8)
Inte
rnat
iona
l Tra
de C
entr
e (2
01
2),
Trad
e M
ap, H
S 4
Cod
e 8
7 (
vehi
cles
oth
er th
an r
ailw
ay, t
ram
way
).
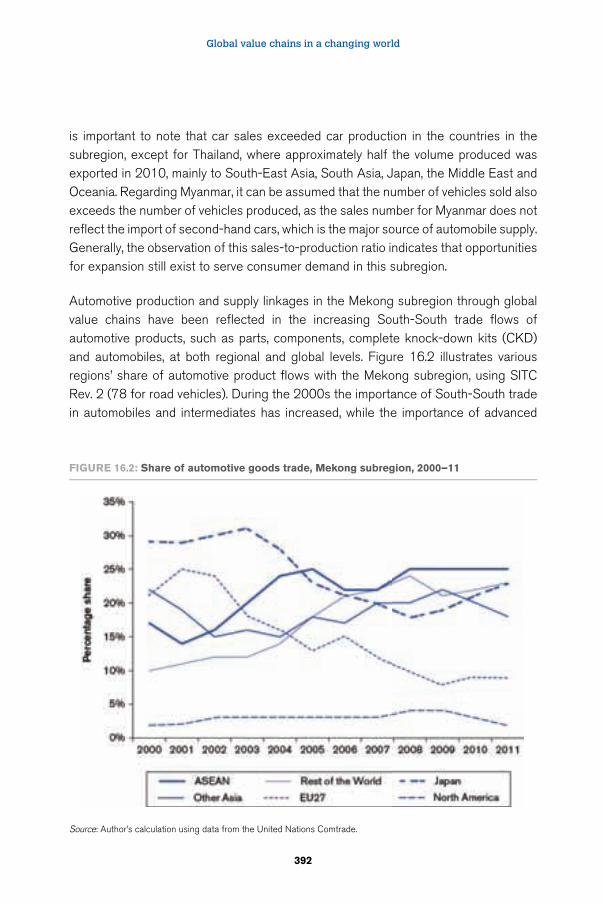
Global value chains in a changing world
392
is important to note that car sales exceeded car production in the countries in the subregion, except for Thailand, where approximately half the volume produced was exported in 2010, mainly to South-East Asia, South Asia, Japan, the Middle East and Oceania. Regarding Myanmar, it can be assumed that the number of vehicles sold also exceeds the number of vehicles produced, as the sales number for Myanmar does not reflect the import of second-hand cars, which is the major source of automobile supply. Generally, the observation of this sales-to-production ratio indicates that opportunities for expansion still exist to serve consumer demand in this subregion.
Automotive production and supply linkages in the Mekong subregion through global value chains have been reflected in the increasing South-South trade flows of automotive products, such as parts, components, complete knock-down kits (CKD) and automobiles, at both regional and global levels. Figure 16.2 illustrates various regions’ share of automotive product flows with the Mekong subregion, using SITC Rev. 2 (78 for road vehicles). During the 2000s the importance of South-South trade in automobiles and intermediates has increased, while the importance of advanced
Figure 16.2: Share of automotive goods trade, Mekong subregion, 2000–11
Source: Author’s calculation using data from the United Nations Comtrade.
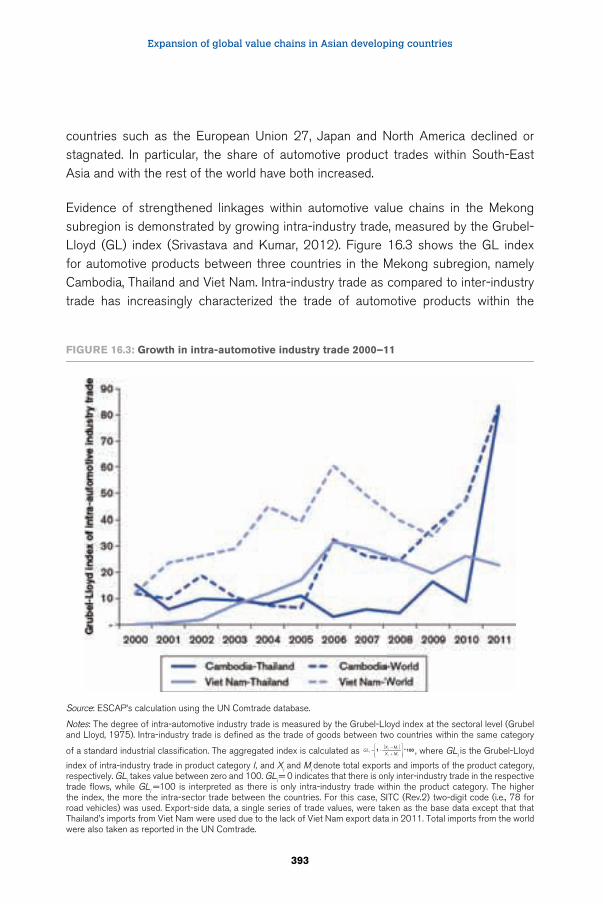
Expansion of global value chains in Asian developing countries
393
countries such as the European Union 27, Japan and North America declined or stagnated. In particular, the share of automotive product trades within South-East Asia and with the rest of the world have both increased.
Evidence of strengthened linkages within automotive value chains in the Mekong subregion is demonstrated by growing intra-industry trade, measured by the Grubel-Lloyd (GL) index (Srivastava and Kumar, 2012). Figure 16.3 shows the GL index for automotive products between three countries in the Mekong subregion, namely Cambodia, Thailand and Viet Nam. Intra-industry trade as compared to inter-industry trade has increasingly characterized the trade of automotive products within the
Figure 16.3: growth in intra-automotive industry trade 2000–11
Source: ESCAP’s calculation using the UN Comtrade database.
Notes: The degree of intra-automotive industry trade is measured by the Grubel-Lloyd index at the sectoral level (Grubel and Lloyd, 1975). Intra-industry trade is defined as the trade of goods between two countries within the same category
of a standard industrial classification. The aggregated index is calculated as GLX MX Mi
i i
i i
= −−+
1 * 100 , where GLi is the Grubel-Lloyd
index of intra-industry trade in product category I, and Xi and Mi denote total exports and imports of the product category, respectively. GLi takes value between zero and 100. GLi = 0 indicates that there is only inter-industry trade in the respective trade flows, while GLi =100 is interpreted as there is only intra-industry trade within the product category. The higher the index, the more the intra-sector trade between the countries. For this case, SITC (Rev.2) two-digit code (i.e., 78 for road vehicles) was used. Export-side data, a single series of trade values, were taken as the base data except that that Thailand’s imports from Viet Nam were used due to the lack of Viet Nam export data in 2011. Total imports from the world were also taken as reported in the UN Comtrade.
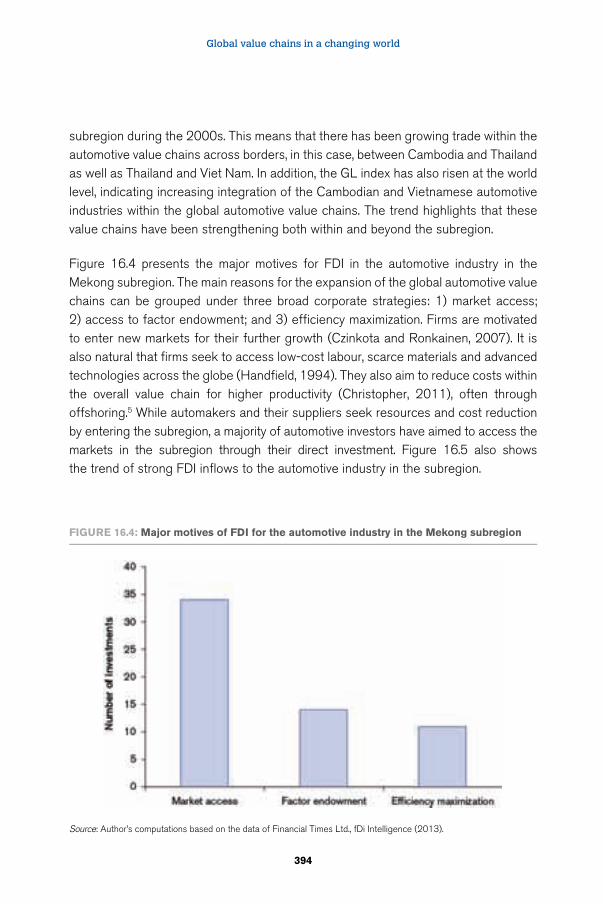
Global value chains in a changing world
394
subregion during the 2000s. This means that there has been growing trade within the automotive value chains across borders, in this case, between Cambodia and Thailand as well as Thailand and Viet Nam. In addition, the GL index has also risen at the world level, indicating increasing integration of the Cambodian and Vietnamese automotive industries within the global automotive value chains. The trend highlights that these value chains have been strengthening both within and beyond the subregion.
Figure 16.4 presents the major motives for FDI in the automotive industry in the Mekong subregion. The main reasons for the expansion of the global automotive value chains can be grouped under three broad corporate strategies: 1) market access; 2) access to factor endowment; and 3) efficiency maximization. Firms are motivated to enter new markets for their further growth (Czinkota and Ronkainen, 2007). It is also natural that firms seek to access low-cost labour, scarce materials and advanced technologies across the globe (Handfield, 1994). They also aim to reduce costs within the overall value chain for higher productivity (Christopher, 2011), often through offshoring.5 While automakers and their suppliers seek resources and cost reduction by entering the subregion, a majority of automotive investors have aimed to access the markets in the subregion through their direct investment. Figure 16.5 also shows the trend of strong FDI inflows to the automotive industry in the subregion.
Figure 16.4: Major motives of FDi for the automotive industry in the Mekong subregion
Source: Author’s computations based on the data of Financial Times Ltd., fDi Intelligence (2013).
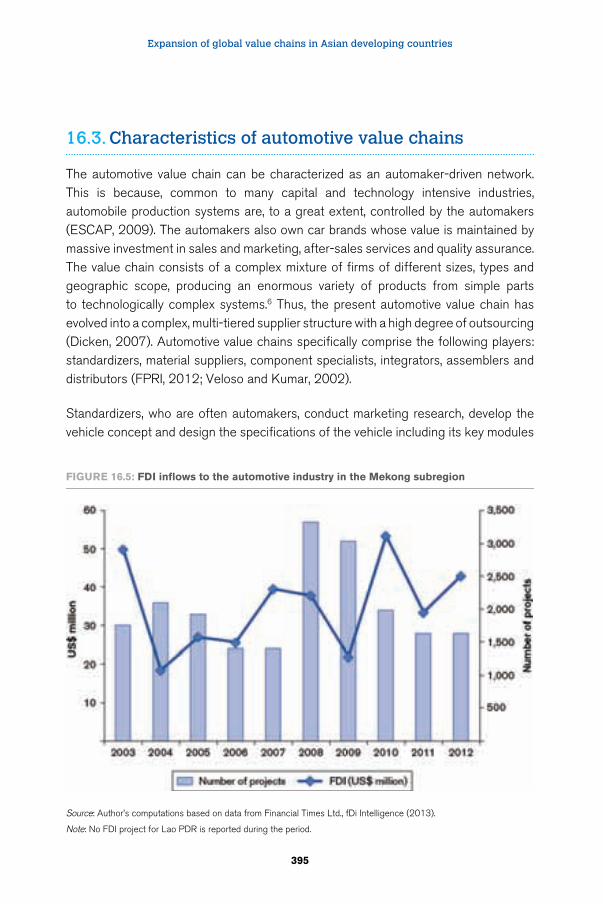
Expansion of global value chains in Asian developing countries
395
16.3. Characteristics of automotive value chains
The automotive value chain can be characterized as an automaker-driven network. This is because, common to many capital and technology intensive industries, automobile production systems are, to a great extent, controlled by the automakers (ESCAP, 2009). The automakers also own car brands whose value is maintained by massive investment in sales and marketing, after-sales services and quality assurance. The value chain consists of a complex mixture of firms of different sizes, types and geographic scope, producing an enormous variety of products from simple parts to technologically complex systems.6 Thus, the present automotive value chain has evolved into a complex, multi-tiered supplier structure with a high degree of outsourcing (Dicken, 2007). Automotive value chains specifically comprise the following players: standardizers, material suppliers, component specialists, integrators, assemblers and distributors (FPRI, 2012; Veloso and Kumar, 2002).
Standardizers, who are often automakers, conduct marketing research, develop the vehicle concept and design the specifications of the vehicle including its key modules
Figure 16.5: FDi inflows to the automotive industry in the Mekong subregion
Source: Author’s computations based on data from Financial Times Ltd., fDi Intelligence (2013).
Note: No FDI project for Lao PDR is reported during the period.
Global value chains in a changing world
396
and systems, heavily investing in research and development and process engineering. A first-tier supplier could be a standardizer by cooperating with the automakers in designing components and modules. Thailand has been the location of choice to date for standardizers, and R&D centres have been established by automakers in Thailand for the design of engines and localization of specifications. This is mainly due to the growing importance of the Thai market and Thailand’s role as a regional production hub, where a localized R&D function is necessary to comply with local needs and trends, such as the green car policy, enacted in Thailand and other countries in the region. Standardizers have not as yet been established in other countries in the subregion.
Material suppliers provide various raw materials to automakers and their suppliers for parts and components production. Those materials include steels and metals, textiles, glasses, plastics, rubbers and chemicals. From the data currently available from the author’s interviews with automakers and suppliers in the subregion, materials for automotive parts and components production are mainly sourced from Thailand (both Thai and foreign nationals) and supplemented by imports from other ASEAN countries, in particular Indonesia and Malaysia, and in some cases Australia, China, Europe, India, Japan, the Republic of Korea and North America. The automotive industry in the subregion still has to rely on imported materials from countries where advanced production technology and know-how are available.
Components specialists manufacture, according to the specification and requirement given by the standardizers, and deliver the required goods to integrators or assemblers for the purpose of module and system production or the final assembly of vehicles. The components specialists can be further categorized as either first-tier suppliers that deliver components directly to the assemblers and lower-tier suppliers that provide components to other suppliers or integrators. The lower-tier suppliers — most of them are smaller enterprises — tend to manufacture simpler and more labour-intensive parts that would later be incorporated by the higher tier suppliers (Veloso and Kumar, 2002). Thailand and Viet Nam are two primary locations for component specialists. Thailand has established its automotive parts sector with over 1,800 suppliers with growing involvement by local firms. Viet Nam has also established an automotive parts sector on a smaller scale with 200 suppliers, and it is more heavily reliant on imported parts than that of Thailand. Localization for Thai auto production now exceeds 90 per cent, while in Viet Nam it accounts for approximately ten per cent (Yamamoto, 2012). The presence of component specialists in other countries in the Mekong subregion apart is, at the moment, not yet widely established but some Japanese and other
Expansion of global value chains in Asian developing countries
397
first- and second-tier suppliers have recently expanded into Cambodia, Lao PDR and Myanmar (JETRO, 2012).
Integrators design and assemble key modules and systems for final assembly and are typically first-tier suppliers. Examples include integrating key elements into an engine and an air conditioning system. As the integrators must deal with a number of lower-tier suppliers, they must possess a high degree of supply chain management skill, while adequately investing in R&D and process engineering. Today, Thailand and Viet Nam are the primary locations for the integrators in the subregion. No integrator has yet to move to Cambodia, Lao PDR or Myanmar.
Assemblers, which are typically automakers (and for some exceptional cases first-tier suppliers), assemble vehicles in locations near their main markets or offer adequate access to factor endowment. Thailand is the leading location in terms of volume and variety of car assembly, including a large share for export. Since the 1990s, assemblers have also been also present in Viet Nam but on a much smaller scale, solely for the domestic market. Cambodia is now receiving increasing, if still modest, attention from assemblers, starting complete knock-down (CKD) assembly in the mid- 2000s. Myanmar has recently developed auto assembly lines on a small scale and still imports used cars as a main source of automobile supply. Lao PDR has yet to attract any assembly line and is a net importer of vehicles.
Distributors supply vehicles to consumers in the local market, conducting various sales and marketing activities and providing after-sales services. As there is growing automobile demand in all countries in the subregion, a need for dealership and repair services has rapidly arisen. Dealership networks have been set up by major automakers in all countries except Myanmar where dealership development is underway.
Figure 16.6 illustrates the simplified relationships among the key players within the global automotive value chains. It also indicates specific national presence among the value chain players in the Mekong subregion.
Regarding the cost structure of the automotive value chain, the purchasing and production of parts, components and modules represent the largest cost area (see Figure 16.6), accounting for between 40 and 70 per cent of the price of an average car (ABN-AMRO, 2000; Holweg et al., 2009). The second and third largest cost areas are sales and marketing as well as research and development,7 accounting for roughly 20 per cent and nearly ten per cent of the car price, respectively. The costs for assembling and materials are both modest, each accounting for less than
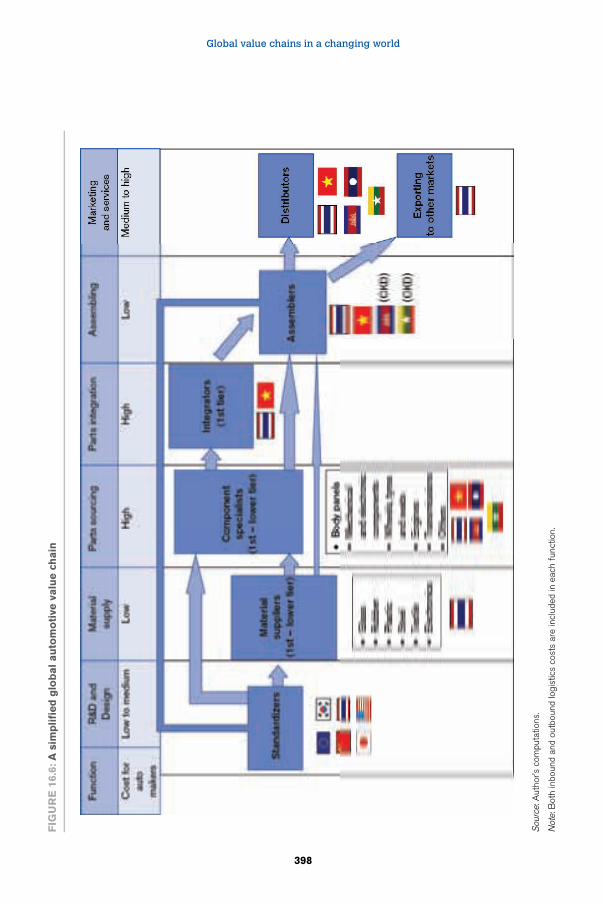
Global value chains in a changing world
398
Fig
ur
e 1
6.6:
a s
imp
lifi
ed
glo
bal au
tom
oti
ve v
alu
e c
hain
Sou
rce:
Aut
hor’s
com
puta
tions
.
Not
e: B
oth
inbo
und
and
outb
ound
logi
stic
s co
sts
are
incl
uded
in e
ach
func
tion.
Expansion of global value chains in Asian developing countries
399
ten per cent of the car price (Holweg et al., 2009). Since supplies such as parts, components and modules account for the largest cost group, one key strategy adopted by the automakers to improve competitiveness has been effective supply chain management in order to reduce costs, and this has led to the expansion of automotive value chains to low-cost neighbouring countries.
16.4. Key findings from three industrial surveys
This section reviews the results of three most recent industrial surveys conducted in the Mekong subregion. The Japan External Trade Organization (JETRO) conducted the first and second surveys in 2009 and 2012, respectively. The third survey was conducted by the United Nations Economic and Social Commission for Asia and the Pacific (UNESCAP) and the Fiscal Policy Research Institute (FPRI) of Thailand in 2012. The first survey interviewed 103 Japanese investors and local enterprises mainly in manufacturing sectors, which operate in the Mekong subregion, to identify corporate strategies and challenges in their cross-border operations (JETRO, 2009). The second survey was conducted with 240 firms as the follow-up to the first survey and aimed to identify the major changes of corporate strategies and challenges from the 2009 survey, including the quality of infrastructure and related policies and regulations (JETRO, 2012). The third survey conducted by UNESCAP and FPRI looked into the specific strategies and challenges of the automotive industry in the subregion to complement the results of the JETRO surveys; thus, it was undertaken with 22 automotive-related agencies in the subregion, including automakers and automotive parts suppliers as well as automotive associations and institutes (FPRI, 2012). All three surveys adopted the semi-structured interview method but some informants participated in the surveys through telephone interviews and questionnaires.
The major findings from the three surveys are summarized as follows:
• The majority of surveyed firms have expanded or have a strong intention to expand their automotive value chains within the Mekong subregion, including less developed countries such as Cambodia, Lao PDR and Myanmar, for example, through investment in new factories and upgrading of existing facilities
• The motives for expansion of cross-border operations in the subregion are in line with the three major motives for automotive investment (see Figure 16.4): 1) to seek a greater access to market; 2) to secure key factor inputs such as labour; and 3) to reduce operational costs through pro-business policy framework in the host country
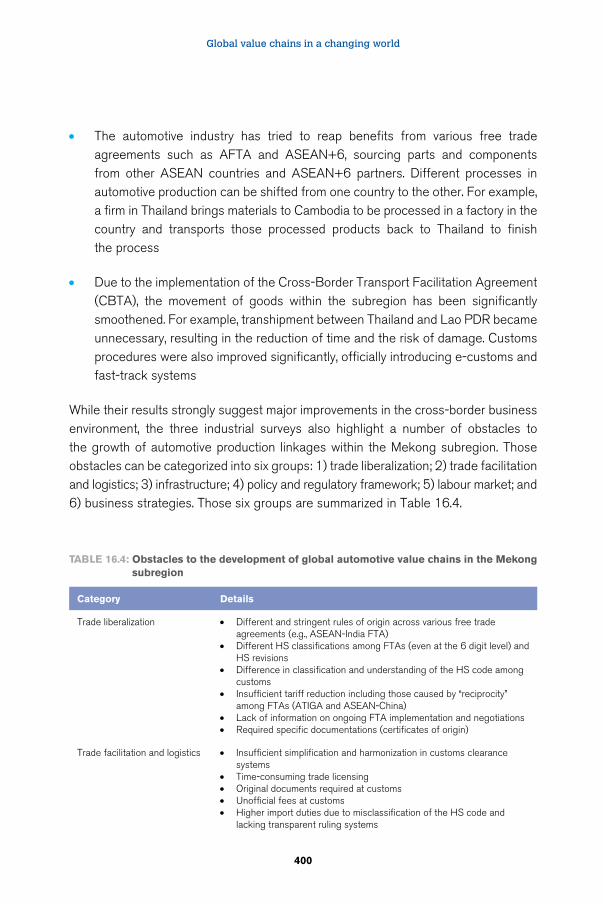
Global value chains in a changing world
400
• The automotive industry has tried to reap benefits from various free trade agreements such as AFTA and ASEAN+6, sourcing parts and components from other ASEAN countries and ASEAN+6 partners. Different processes in automotive production can be shifted from one country to the other. For example, a firm in Thailand brings materials to Cambodia to be processed in a factory in the country and transports those processed products back to Thailand to finish the process
• Due to the implementation of the Cross-Border Transport Facilitation Agreement (CBTA), the movement of goods within the subregion has been significantly smoothened. For example, transhipment between Thailand and Lao PDR became unnecessary, resulting in the reduction of time and the risk of damage. Customs procedures were also improved significantly, officially introducing e-customs and fast-track systems
While their results strongly suggest major improvements in the cross-border business environment, the three industrial surveys also highlight a number of obstacles to the growth of automotive production linkages within the Mekong subregion. Those obstacles can be categorized into six groups: 1) trade liberalization; 2) trade facilitation and logistics; 3) infrastructure; 4) policy and regulatory framework; 5) labour market; and 6) business strategies. Those six groups are summarized in Table 16.4.
Table 16.4: Obstacles to the development of global automotive value chains in the Mekong subregion
Category Details
Trade liberalization • Different and stringent rules of origin across various free trade agreements (e.g., ASEAN-India FTA)
• Different HS classifications among FTAs (even at the 6 digit level) and HS revisions
• Difference in classification and understanding of the HS code among customs
• Insufficient tariff reduction including those caused by “reciprocity” among FTAs (ATIGA and ASEAN-China)
• Lack of information on ongoing FTA implementation and negotiations• Required specific documentations (certificates of origin)
Trade facilitation and logistics • Insufficient simplification and harmonization in customs clearance systems
• Time-consuming trade licensing• Original documents required at customs• Unofficial fees at customs• Higher import duties due to misclassification of the HS code and
lacking transparent ruling systems
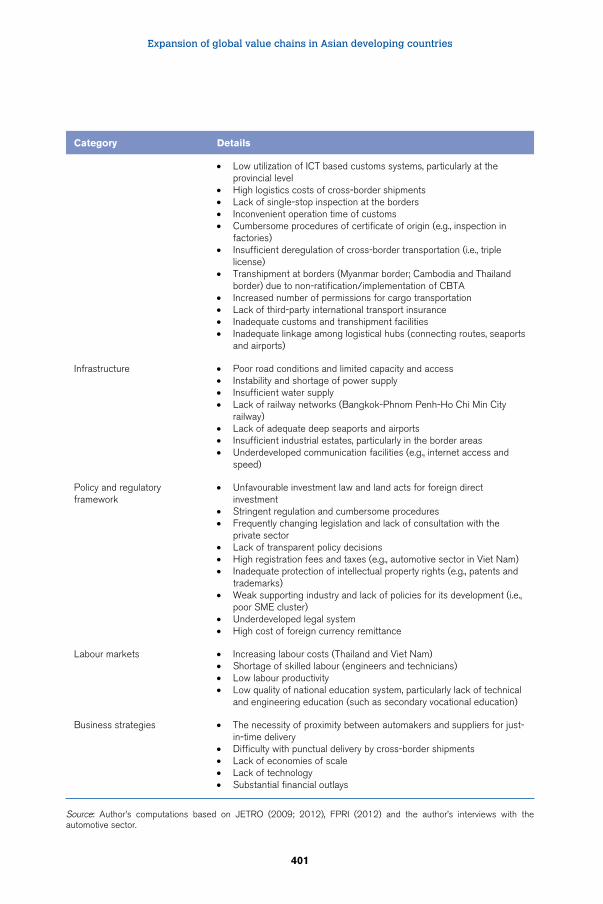
Expansion of global value chains in Asian developing countries
401
Category Details
• Low utilization of ICT based customs systems, particularly at the provincial level
• High logistics costs of cross-border shipments• Lack of single-stop inspection at the borders• Inconvenient operation time of customs• Cumbersome procedures of certificate of origin (e.g., inspection in
factories)• Insufficient deregulation of cross-border transportation (i.e., triple
license)• Transhipment at borders (Myanmar border; Cambodia and Thailand
border) due to non-ratification/implementation of CBTA• Increased number of permissions for cargo transportation• Lack of third-party international transport insurance• Inadequate customs and transhipment facilities• Inadequate linkage among logistical hubs (connecting routes, seaports
and airports)
Infrastructure • Poor road conditions and limited capacity and access• Instability and shortage of power supply• Insufficient water supply• Lack of railway networks (Bangkok-Phnom Penh-Ho Chi Min City
railway)• Lack of adequate deep seaports and airports• Insufficient industrial estates, particularly in the border areas• Underdeveloped communication facilities (e.g., internet access and
speed)
Policy and regulatory framework
• Unfavourable investment law and land acts for foreign direct investment
• Stringent regulation and cumbersome procedures• Frequently changing legislation and lack of consultation with the
private sector• Lack of transparent policy decisions• High registration fees and taxes (e.g., automotive sector in Viet Nam)• Inadequate protection of intellectual property rights (e.g., patents and
trademarks)• Weak supporting industry and lack of policies for its development (i.e.,
poor SME cluster)• Underdeveloped legal system• High cost of foreign currency remittance
Labour markets • Increasing labour costs (Thailand and Viet Nam)• Shortage of skilled labour (engineers and technicians)• Low labour productivity• Low quality of national education system, particularly lack of technical
and engineering education (such as secondary vocational education)
Business strategies • The necessity of proximity between automakers and suppliers for just-in-time delivery
• Difficulty with punctual delivery by cross-border shipments• Lack of economies of scale• Lack of technology• Substantial financial outlays
Source: Author’s computations based on JETRO (2009; 2012), FPRI (2012) and the author’s interviews with the automotive sector.
Global value chains in a changing world
402
16.5. Policy implications
A number of key findings were derived from the analyses as described in the previous sections. The automotive industry has increasingly moved to adopt a subregional production sharing strategy, that is, “the break-up of a production process into vertically separated stages carried out in two or more countries” (Athukorala and Menon, 2010). This strategy is to manufacture complex components and subassemblies in a central location (such as Thailand and Viet Nam); use lower tier parts suppliers from low cost countries in the subregion (e.g., Cambodia, Lao PDR and Myanmar); then distribute these components and subassemblies to the central location for integration; and ship those intermediate products to final assembly plants.
In this, the Mekong countries can enhance their cost-competitive position, while growing their domestic markets and increasing subregional linkages under the ongoing trade and investment liberalization in South-East Asia (i.e., ASEAN Economic Community and ASEAN+6). Strengthening cross-border automotive value chain linkages can enhance the participation of the Mekong subregion in this important industry and facilitate upgrading related to technology and skills. This, in turn, can strengthen the role of the subregion as a production base within an increasingly integrated regional economy. To apply this concept to the Mekong subregion, there are many opportunities to relocate the production of some parts and components — most likely labour intensive process — to the countries within the same geographical areas with the purpose of reducing costs as production of automobiles relies on many different activities.
In this context, a subregionally coordinated strategy of production relocation and integration could provide opportunities for neighbouring lower-cost countries such as Cambodia, Lao PDR and Myanmar to become lower-tier suppliers of selected labour-intensive components for the Thai automotive parts sector (and Vietnamese automotive parts sector to a lesser extent). Such cross-border production linkages could provide an entry point for such a country to the global automotive value chains, with significant developmental benefits.
In order to achieve the development potential derived from the global automotive value chains, collective actions may be seriously considered among key stakeholders, particularly in the areas of constraint summarized in the previous section: trade liberalization; trade facilitation and logistics; infrastructure; policy and regulatory framework; labour market; and business strategies. Table 16.5 combines
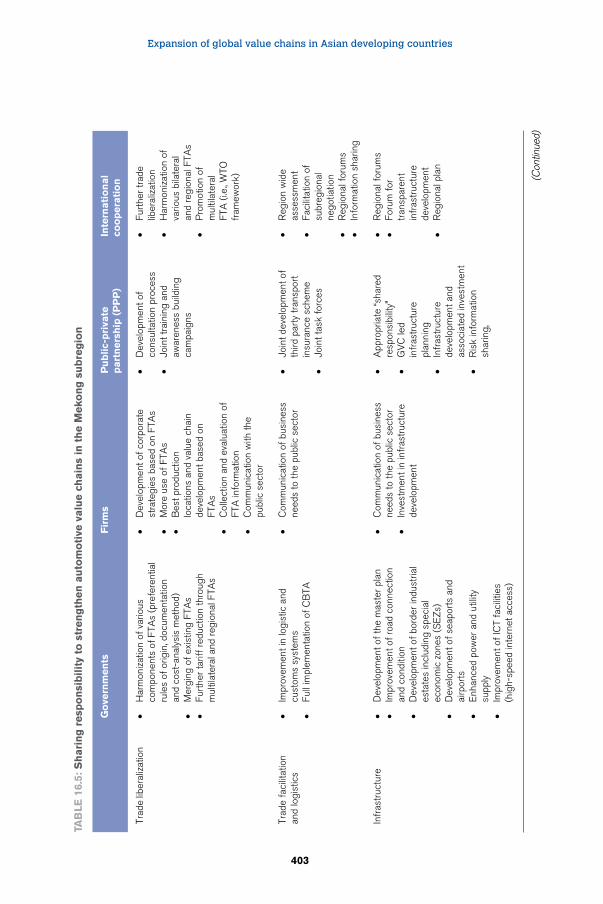
Expansion of global value chains in Asian developing countries
403
Tab
le 1
6.5:
Sh
ari
ng
resp
on
sib
ilit
y to
str
en
gth
en
au
tom
oti
ve v
alu
e c
hain
s in
th
e M
eko
ng
su
bre
gio
n
go
vern
men
tsF
irm
sP
ub
lic-
pri
vate
p
art
ners
hip
(P
PP
)in
tern
ati
on
al
coo
pera
tio
n
Trad
e lib
eral
izat
ion
•H
arm
oniz
atio
n of
var
ious
co
mpo
nent
s of
FTA
s (p
refe
rent
ial
rule
s of
orig
in, d
ocum
enta
tion
and
cost
-ana
lysi
s m
etho
d)
•M
ergi
ng o
f ex
istin
g FT
As
•Fu
rthe
r ta
riff
redu
ctio
n th
roug
h m
ultil
ater
al a
nd r
egio
nal F
TAs
•D
evel
opm
ent o
f co
rpor
ate
stra
tegi
es b
ased
on
FTA
s•
Mor
e us
e of
FTA
s•
Bes
t pro
duct
ion
loca
tions
and
val
ue c
hain
de
velo
pmen
t bas
ed o
n FT
As
•C
olle
ctio
n an
d ev
alua
tion
of
FTA
info
rmat
ion
•C
omm
unic
atio
n w
ith th
e pu
blic
sec
tor
•D
evel
opm
ent o
f co
nsul
tatio
n pr
oces
s •
Join
t tra
inin
g an
d aw
aren
ess
build
ing
cam
paig
ns
•Fu
rthe
r tr
ade
liber
aliz
atio
n•
Har
mon
izat
ion
of
vario
us b
ilate
ral
and
regi
onal
FTA
s•
Pro
mot
ion
of
mul
tilat
eral
FT
A (
i.e.,
WTO
fr
amew
ork)
Trad
e fa
cilit
atio
n an
d lo
gist
ics
•Im
prov
emen
t in
logi
stic
and
cu
stom
s sy
stem
s•
Full
impl
emen
tatio
n of
CB
TA
•C
omm
unic
atio
n of
bus
ines
s ne
eds
to th
e pu
blic
sec
tor
•Jo
int d
evel
opm
ent o
f th
ird p
arty
tran
spor
t in
sura
nce
sche
me
•Jo
int t
ask
forc
es
•R
egio
n w
ide
asse
ssm
ent
•Fa
cilit
atio
n of
su
breg
iona
l ne
gotia
tion
•R
egio
nal f
orum
s•
Info
rmat
ion
shar
ing
Infr
astr
uctu
re•
Dev
elop
men
t of
the
mas
ter
plan
•Im
prov
emen
t of
road
con
nect
ion
and
cond
ition
•
Dev
elop
men
t of
bord
er in
dust
rial
esta
tes
incl
udin
g sp
ecia
l ec
onom
ic z
ones
(S
EZ
s)•
Dev
elop
men
t of
seap
orts
and
ai
rpor
ts•
Enh
ance
d po
wer
and
util
ity
supp
ly
•Im
prov
emen
t of
ICT
faci
litie
s (h
igh-
spee
d in
tern
et a
cces
s)
•C
omm
unic
atio
n of
bus
ines
s ne
eds
to th
e pu
blic
sec
tor
•In
vest
men
t in
infr
astr
uctu
re
deve
lopm
ent
•A
ppro
pria
te “s
hare
d re
spon
sibi
lity”
•
GV
C le
d in
fras
truc
ture
pl
anni
ng•
Infr
astr
uctu
re
deve
lopm
ent a
nd
asso
ciat
ed in
vest
men
t•
Ris
k in
form
atio
n sh
arin
g,
•R
egio
nal f
orum
s•
Foru
m f
or
tran
spar
ent
infr
astr
uctu
re
deve
lopm
ent
•R
egio
nal p
lan
(Con
tinue
d)
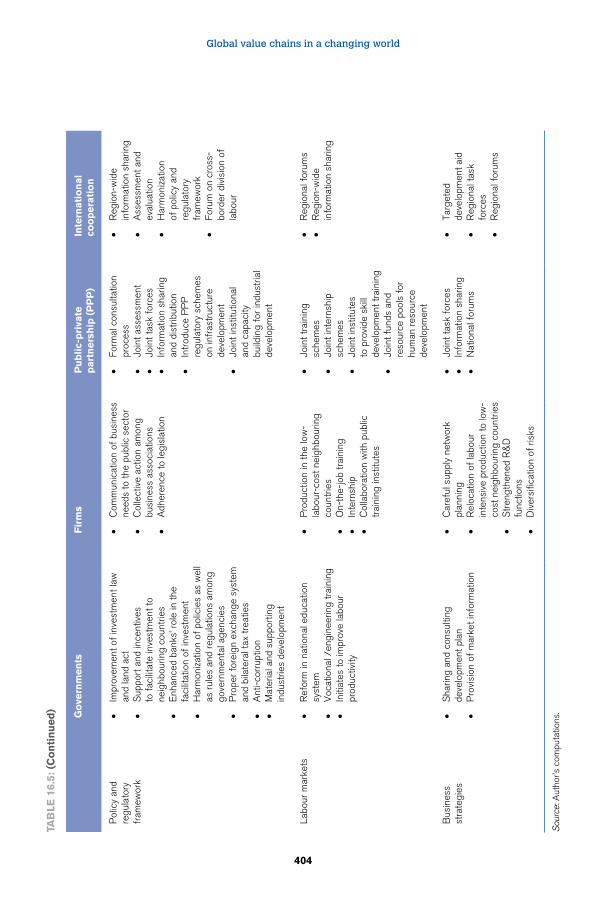
Global value chains in a changing world
404
go
vern
men
tsF
irm
sP
ub
lic-
pri
vate
p
art
ners
hip
(P
PP
)in
tern
ati
on
al
coo
pera
tio
n
Pol
icy
and
regu
lato
ry
fram
ewor
k
•Im
prov
emen
t of
inve
stm
ent l
aw
and
land
act
•S
uppo
rt a
nd in
cent
ives
to
fac
ilita
te in
vest
men
t to
neig
hbou
ring
coun
trie
s•
Enh
ance
d ba
nks’
rol
e in
the
faci
litat
ion
of in
vest
men
t•
Har
mon
izat
ion
of p
olic
ies
as w
ell
as r
ules
and
reg
ulat
ions
am
ong
gove
rnm
enta
l age
ncie
s•
Pro
per
fore
ign
exch
ange
sys
tem
an
d bi
late
ral t
ax tr
eatie
s•
Ant
i-cor
rupt
ion
•M
ater
ial a
nd s
uppo
rtin
g in
dust
ries
deve
lopm
ent
•C
omm
unic
atio
n of
bus
ines
s ne
eds
to th
e pu
blic
sec
tor
•C
olle
ctiv
e ac
tion
amon
g bu
sine
ss a
ssoc
iatio
ns•
Adh
eren
ce to
legi
slat
ion
•Fo
rmal
con
sulta
tion
proc
ess
•Jo
int a
sses
smen
t•
Join
t tas
k fo
rces
•In
form
atio
n sh
arin
g an
d di
strib
utio
n•
Intr
oduc
e P
PP
re
gula
tory
sch
emes
on
infr
astr
uctu
re
deve
lopm
ent
•Jo
int i
nstit
utio
nal
and
capa
city
bu
ildin
g fo
r in
dust
rial
deve
lopm
ent
•R
egio
n-w
ide
info
rmat
ion
shar
ing
•A
sses
smen
t and
ev
alua
tion
•H
arm
oniz
atio
n of
pol
icy
and
regu
lato
ry
fram
ewor
k •
Foru
m o
n cr
oss-
bord
er d
ivis
ion
of
labo
ur
Labo
ur m
arke
ts•
Ref
orm
in n
atio
nal e
duca
tion
syst
em
•V
ocat
iona
l /en
gine
erin
g tr
aini
ng•
Initi
ates
to im
prov
e la
bour
pr
oduc
tivity
•P
rodu
ctio
n in
the
low
-la
bour
-cos
t nei
ghbo
urin
g co
untr
ies
•O
n-th
e-jo
b tr
aini
ng•
Inte
rnsh
ip•
Col
labo
ratio
n w
ith p
ublic
tr
aini
ng in
stitu
tes
•Jo
int t
rain
ing
sche
mes
•
Join
t int
erns
hip
sche
mes
•Jo
int i
nstit
utes
to
pro
vide
ski
ll de
velo
pmen
t tra
inin
g•
Join
t fun
ds a
nd
reso
urce
poo
ls f
or
hum
an r
esou
rce
deve
lopm
ent
•R
egio
nal f
orum
s•
Reg
ion-
wid
e in
form
atio
n sh
arin
g
Bus
ines
s st
rate
gies
•S
harin
g an
d co
nsul
ting
deve
lopm
ent p
lan
•P
rovi
sion
of
mar
ket i
nfor
mat
ion
•C
aref
ul s
uppl
y ne
twor
k pl
anni
ng
•R
eloc
atio
n of
labo
ur
inte
nsiv
e pr
oduc
tion
to lo
w-
cost
nei
ghbo
urin
g co
untr
ies
•S
tren
gthe
ned
R&
D
func
tions
•D
iver
sific
atio
n of
ris
ks
•Jo
int t
ask
forc
es•
Info
rmat
ion
shar
ing
•N
atio
nal f
orum
s
•Ta
rget
ed
deve
lopm
ent a
id•
Reg
iona
l tas
k fo
rces
•R
egio
nal f
orum
s
Sou
rce:
Aut
hor’s
com
puta
tions
.
Tab
le 1
6.5:
(C
on
tin
ued
)
Expansion of global value chains in Asian developing countries
405
specific policy suggestions for enhanced cross-border automotive value chains via strengthened sharing responsibility among governments, business and public-private partnership (PPP) and international organizations.
16.6. Conclusion
Trade liberalization, along with investment by automakers and increasing trade facilitation and logistics development, has been the cause of the recent transformation in the automotive industry in the Mekong subregion. The automakers have looked for opportunities for greater market and resources access as well as for cost reduction. As a result, less developed countries in the Mekong subregion are increasingly integrated into the global automotive value chains, and a number of suppliers, particularly those producing labour-intensive goods, are increasingly moving to Cambodia, Lao PDR and Myanmar. Integration into global automotive value chains, which typically comprise standardizers, material suppliers, components specialists, integrators, assemblers and distributors, has made it possible for the subregion to establish strong manufacturing bases and benefit from increased exports and further FDI inflows. Diversified and growing division of labour also is being developed among the countries in the subregion.
However, a number of constraints still exist preventing full achievement of the growth potential of cross-border automotive production linkages within the subregion. Collective actions among governments, business and international agencies are required in various fields, including: trade liberalization; trade facilitation and logistics; infrastructure; policy and regulatory framework; labour market; and business strategies.
For further research, two approaches are recommended. First, more reliable trade and investment data must be collected directly from the countries in the Mekong subregion. With growing membership among the countries of the subregion to the WTO (most recently, Lao PDR’s accession in 2012), it is expected that more reliable and comprehensive trade statistics will become more available in the subregion. Second, a small number of representative automotive value chains should be selected for detailed mapping, in close consultation with governments and automotive industry in the Mekong subregion. Diagnosing specific bottlenecks that constrain growth and efficiency in the selected automotive value chains will then provide the basis for recommendations with more general implications for the automotive industry in the subregion.
Global value chains in a changing world
406
Endnotes
1 This subregion is also part of the Association of Southeast Asian Nations (ASEAN). It is often called mainland ASEAN, while Brunei Darussalam, Indonesia, Malaysia, the Philippines and Singapore are called maritime ASEAN.
2 ESCAP’s calculation based on data from the UN Comtrade (SITC Rev.2: 78).
3 ASEAN countries have agreed to establish the AEC by the end of 2015. For more details visit http://www.aseansec.org/.
4 For details see Legewie (1999) and Hiratsuka (2010).
5 Offshoring refers to activities that utilize facilities located in a country other than where the enterprise is based (Vitasek, 2006). The motivation for offshoring has primarily been cost reductions, economies of scale and possibly lower financial costs such as borrowing costs and tax rates (Aron and Singh, 2005).
6 For example, over 4,000 parts and components are used for the 2012 model of the Toyota Camry sedan car (the author’s interview with the automotive industry in Bangkok, November 2012).
7 It is understood that the cost of research and development varies widely among standardizers and automakers.
Author’s aknowledgements
The author acknowledges with appreciation useful inputs provided by George Abonyi, Pich Nitsmer, Fabian Suwanprateep and the Fiscal Policy Research Institute of Thailand. This paper also benefited from the author’s earlier work with Witada Anukoonwattaka. The views expressed herein are those of the author and do not necessarily reflect the views of the United Nations.”
References
ABN-AMRO. 2000. “European Auto Components: Driven by Technology” (London, UK, ABN-AMRO).
ADB. 2011. “Greater Mekong Subregion Cross-Border Transport Facilitation Agreement: Instruments and Drafting History” (Mandaluyong City, Philippines, Asian Development Bank).
AMEICC. 2012. “2012 Annual Report of the AMEICC Working Group on Automobile Industry” (Bangkok, Thailand, The AEM-METI Economic and Industrial Cooperation Committee) Member access only.
Expansion of global value chains in Asian developing countries
407
APTIAD. 2012. “Asia-Pacific Trade and Investment Agreements Database”. Available at: http://www.unescap.org/tid/aptiad/.
Athukorala, P.; Menon, J. 2010. “Global Production Sharing, Trade Patterns, and Determinants of Trade Flows in East Asia”, ADB Working Paper No. 41, January (Manila, Philippines, Asian Development Bank).
Aron, R.; Singh, J. V. 2005. “Getting Offshoring Right”, in Harvard Business Review, 83(12): 135–140.
Christopher, M. 2011. “Logistics and Supply Chain Management”, 4th Edition, (Harlow, UK, Pearson Education Limited).
CIA. 2012. “The World Factbook for 2009-2011”, Central Intelligence Agency. Available at: https://www.cia.gov/library/publications/the-world-factbook/.
Czinkota, M.; Ronkainen, I. 2007. “International Marketing”, 8th Edition, (Mason, OH, Thomson South-Western).
Dicken, P. 2007.”Global Shift: Mapping the Changing Contours of the World Economy”, 5th Edition, (London, UK, The Guilford Press).
Findlay, C. 2011. “ASEAN +1 FTAS and Global Value Chains in East Asia”, ERIA Research Project Report 2010-29, November, (Jakarta, Indonesia, Economic Research Institution for ASEAN and East Asia).
ESCAP. 2012. “The Statistical Yearbook for Asia and the Pacific 2012 ”, (Bangkok, Thailand, United Nations Economic and Social Commission for Asia and the Pacific).
ESCAP. 2009. “Globalization of Production and the Competitiveness of Small and Medium-Sized Enterprises in Asia and the Pacific: Trends and Prospects”, Studies in Trade and Investment, No. 65, (Bangkok, Thailand, United Nations Economic and Social Commission for Asia and the Pacific).
ESCAP. 2007. “Linking Greater Mekong Subregion Enterprises to International Markets: The Role of Global Value Chains, International Production Networks and Enterprise Clusters”, Studies in Trade and Investment No. 59, (Bangkok, Thailand, United Nations Economic and Social Commission for Asia and the Pacific).
Financial Times, The. 2013. fDi Intelligence. Available at: http://www.fdimarkets.com/.
FPRI. 2012. “Business for Development: Capacity building of enterprises (SMEs) in the Greater Mekong Subregion for their Effective Penetration into Regional and Global Markets”, Summary Briefs based on Preliminary Overview of Selected GMS Sectors/Value Chains of UNESCAP Project. (Bangkok, Thailand, Fiscal Policy Research Institute).
Global value chains in a changing world
408
Grubel, H. G.; Lloyd, P. J. 1975. “Intra-Industry Trade: The Theory and Measurement of International Trade in Differentiated Products”, (New York, NY, Wiley).
Handfield, R.B. 1994. “U.S. Global Sourcing: Patterns of Development,” International Journal of Operations and Production Management, (14:6): 40–51.
Handfield, R. 2007. “Reducing the Impact of Disruptions to the Supply Chain: A Managerial Framework Based on Observations from Multiple Executives”, in SASCOM Magazine, Industry Issues.
Hiratsuka, D. 2010. “Characteristics and determinants of East Asia’s trade patterns,” in Input Trade and Production Networks in East Asia, edited by D. Hiratsukaand Y. Uchida, Cheltenham: Edward Elgar.
Hiratsuka, D., 2011. “Production Networks in Asia: A Case Study from the Hard Disk Drive Industry”, ADBI Working Paper No. 301, (Tokyo, Japan, Asian Development Bank Institute).
Holweg, M.; Davies, P.; Podpolny, D. 2009. “The Competitive Status of the UK Automotive Industry”, (Buckingham, UK, PICSIE Books).
IMF. 2012. “World Economic Outlook Database”, October 2012, (Washington, DC, International Monetary Fund). Available at: http://www.imf.org/external/pubs/ft/weo/data/changes.htm
ITC. 2012. “Trade Map”. (Geneva, Switzerland, International Trade Centre), Available at: http://www.intracen.org/trade-support/market-analysis-tools/.
JETRO. 2012. “Business Needs and Strategies in Mekong Sub-Region”, Survey, 30 August, (Bangkok, Thailand, Japan External Trade Organization).
JETRO 2009. “The Business Needs and Strategies in Mekong Sub-Region”, Survey, 30 September, (Bangkok, Thailand, Japan External Trade Organization).
Kohpaiboon, A.; Yamashita, N. 2011. “FTAs and the Supply Chain in the Thai Automotive Industry” in C. Findlay (ed.): ASEAN +1 FTAS and Global Value Chains in East Asia, ERIA Research Project Report 2010-29, March, (Jakarta, Indonesia, Economic Research Institute for ASEAN and East Asia).
Ksoll, C.; Brimble, P. 2012. “Facilitating Trade along the Southern Economic Corridor”, in P. Srivastava and U. Kumar (eds.): Trade and Trade Facilitation in the Greater Mekong Subregion, (Mandaluyong City, Philippines, Asian Development Bank).
Legewie, J. 1999. “Manufacturing Strategies for Southeast Asia after the Crisis: European, US and Japanese Firms”, in Business Strategy Review, 10: 55–64.
Expansion of global value chains in Asian developing countries
409
Makishima, M. 2012. “New Division of Labor between Japan and CLMV Countries: A View from Japan’s Growth Strategy”, in Y. Ueki and T. Bhongmakapat (eds): Industrial Readjustment in the Mekong River Basin Countries Toward the AEC, BRC Research Report No.7, (Bangkok, Thailand, Bangkok Research Centre).
OICA. 2012. “Production Statistics: 2011 Statistics”, the International Organization of Motor Vehicle Manufacturers, Available at: http://oica.net/category/production-statistics/.
Srivastava, P.; Kumar, U. 2012. “GMS Trade - Trends and Patterns”, in P. Srivastava and U. Kumar (eds.): Trade and Trade Facilitation in the Greater Mekong Subregion, (Mandaluyong City, Philippines, Asian Development Bank).
United Nations. 2012. “UN Comtrade, United Nations Commodity Trade Statistics Database”, United Nations Statistics Division. Available at: http://comtrade.un.org/.
Veloso, F.; Kumar, R. 2002. “The Automotive Supply Chain: Global Trends and Asian Perspectives”, ERD Working Paper No. 3, January, (Manila, Philippines, Asian Development Bank).
Vitasek, K. 2006. “Supply Chain and Logistics Terms and Glossary”, Supply Chain Visions. Available at: http://www.logisticsservicelocator.com/resources/glossary03.pdf
Yamamoto, H. 2012. “ASEAN Automotive Market: Outlook and Challenges and Opportunities for Suppliers” PowerPoint Presentation, (Bangkok, Thailand, IHS, Automotive, Inc.)
World Bank. 2012. “World Development Indicators” (Washington, DC, World Bank).
WTO; IDE-JETRO. 2011. “Trade Patterns and Global Value Chains in East Asia: From Trade in Goods to Trade in Tasks”, (Geneva, Switzerland, World Trade Organization and Tokyo, Japan, Institute for Developing Economies-Japan External Trade Organization).

Global value chains in a changing world
WTO
– FGI – TFC
TNG
lob
al va
lue ch
ain
s in a
cha
ng
ing
wo
rldE
lms a
nd
Low
(eds)
Edited by Deborah K. Elms and Patrick LowGlobal value chains (GVC) are a major driving force of globalisation. They are an inevitable outgrowth of the application of transformative information and transport technologies, combined with new business models and largely open borders. The GVC phenomenon promotes integration on multiple levels. Today’s international production systems confound traditional ways of looking at investment, production, finance, information systems and technology. These can no longer be seen as separate, meriting distinct attention and discrete policy treatment. The international fragmentation of production has generated the opposite of fragmentation – a complex networked system of production and consumption with innumerable moving, interactive parts.
Efforts to understand the dimensions of GVCs have spread across disciplines. This volume is the product of a dialogue with policy makers in the Asian region, where economists, political scientists, management specialists, development thinkers and business executives joined together in an exploration of the multiple dimensions of supply chains, what drives them, how they operate, how they adapt in a rapidly changing world, and what they mean for development and for policy.
Global value chains in a changing world
WTO ISBN 978-92-870-3882-1
DGVC cover-Mar13 AWfin.indd 1 12/06/2013 11:09