GLOBAL VALUE CHAINS: A CASE - Europa
15
GLOBAL VALUE CHAINS: A CASE FOR EUROPE TO CHEER UP Filippo di Mauro, Hedwig Plamper and Robert Stehrer COMPNET POLICY BRIEF 03/2013 AUGUST 2013 NOTE: this policy brief should not be reported as representing the views of the European Central Bank (ECB). The views expressed are those of the authors and do not necessarily reflect those of the ECB.
Transcript of GLOBAL VALUE CHAINS: A CASE - Europa

GLOBAL VALUE CHAINS: A CASE FOR EUROPE TO CHEER UP
Filippo di Mauro, Hedwig Plamper and
Robert Stehrer
COMPNET POLICY BRIEF 03/2013 AUGUST 2013
NOTE: this policy brief should not be reported as representing the views of the European Central Bank (ECB). The views expressed are those of the authors and do not necessarily reflect those of the ECB.

This policy brief presents research conducted within the Competitiveness Research Network (CompNet). The network is composed of economists from the European System of Central Banks (ESCB) - i.e. the 28 national central banks of the European Union (EU) and the European Central Bank – a number of international organisations (World Bank, OECD, EU Commission) universities and think-tanks, as well as a number of non-European Central Banks (Argentina and Peru) and organisations (US International Trade Commission).
The objective of CompNet is to develop a more consistent analytical framework for assessing competitiveness, one which allows for a better correspondence between determinants and outcomes.
The research is carried out in three workstreams: 1) Aggregate Measures of Competitiveness; 2) Firm Level; 3) Global Value Chains. CompNet is chaired by Filippo di Mauro (ECB). The three workstreams are headed respectively by Chiara Osbat (ECB), Antoine Berthou (Banque de France) and João Amador (Banco de Portugal). Julia Fritz (ECB) is responsible for the CompNet Secretariat.
Acknowledgements The authors wish to thank João Amador, Chiara Osbat and Julia Wörz for their useful comments. © European Central Bank, 2013
Address Kaiserstrasse 29, 60311 Frankfurt am Main, Germany Postal address Postfach 16 03 19, 60066 Frankfurt am Main, Germany Telephone +49 69 1344 0
Fax +49 69 1344 6000 Internet http://www.ecb.int/home/html/researcher_compnet.en.html http://www.ecb.europa.eu All rights reserved.
ISBN 978-92-899-1020-0 (online)
ISSN 2315-0084 (online) EU Catalogue No QB-BK-13-003-EN-N (online) Reproduction for educational and non-commercial purposes is permitted provided that the source is acknowledged.

ESCB COMPNET Global value chains: A case for Europe to cheer up August 2013
1
ABSTRACT A higher integration of firms in global value chains is – in the public debate - often seen with
suspicion and frequently made the culprit of adverse economic developments, most notably
competitiveness losses, import penetration, export compression, and job shedding. New
indicators based on a decomposition of value added into its domestic and foreign components
are better able to assess the challenges, but also the opportunities of higher fragmentation of
production, arising for instance from economies being able to serve emerging export markets,
and ‘climbing up the value chain’, via increasing international division of labour. In the last
few years there has been a strong effort to construct databases, which allow us to proxy –
admittedly, still only partially - the complex interactions that are increasingly taking place in
global production and supply chains. Such statistics, aimed at measuring trade in value-added
terms, show in many cases a different picture than the traditional trade indicators based on
gross terms.
If we apply such new indicators to Europe, the picture that emerges in terms of trade
performance and competitiveness is more nuanced than standard statistics would suggest.
The European economies have by and large been able to deepen their internal integration as
well as to re-orient themselves towards higher skilled and higher value-added service activities.
As a corollary, substantial job opportunities by exporting are also being created in service
activities (when appropriately measured), which at times more than compensate for job losses
experienced in the shrinking traditional manufacturing activities. This policy brief provides few
examples of such developments and offers an overview of existing new value-added based
databases, which provide a basis for the improvement of our assessment on global value chains
in Europe and beyond.

ESCB COMPNET Global value chains: A case for Europe to cheer up August 2013
2
INTRODUCTION
The widespread internationalisation of production processes has often a negative connotation in
the public discussion. Economic "hollowing out", job shedding, risk of closure of once
successful iconic firms tend to be seen as the most disturbing results, while the positive effects
of higher global competition and the ensuing healthy restructuring of the "affected" economies
are largely overlooked.
One major reason for that is inaccurate measurement. Standard trade indicators do not take at all
into consideration that economies are increasingly interconnected at all stages of the production
chain. How can we continue solely utilising aggregate trade performance indicators, such as
gross exports, when we know that domestic firms are increasingly outsourcing part of their
production activities? Obviously, at the very least, we would need to disentangle the domestic
from the foreign value-added component of such gross export, and further adjust for (value-
added adjusted) market-share developments, when assessing competitiveness. And even if
domestic value-added as a share of exports might be lower in such circumstances, the increasing
integration in global value chains (GVCs) is a plus for the firms involved, as it allows a flexible
adjustment to changes in the pattern of competitive advantages.
But if international comparisons based on gross trade indicators have become less meaningful,
how can we distil its value-added (VA) component in order to measure the exact benefits and
disadvantages of GVC integration? One way to handle this question is to make use of global
input-output tables, which allow for a more accurate representation of the extent and the nature
in which firms participate in GVCs, as well as of the related impact on value-added and other
economic indicators at the individual country and even industry level.
In using these new methods it has been shown, for instance, that in value-added terms the
bilateral trade surplus of China vis-à-vis the EU or the US is actually a fraction of what it would
appear to be in standard statistics. What is however less known is that Europe as a whole tends
to emerge as a much more resilient and potentially competitive economy than traditionally
portrayed, once standard economic activity and trade measures have been purged of distortions.
One example shown in this policy brief is that higher integration in global supply chains by EU
firms has implied, for certain countries in particular, an overall increase in employment, as the
losses in manufacturing activities have been more than compensated by gains in services.
A technical appendix provides an overview of the available global input-output tables and
databases on value-added trade, which form the basis of the analysis here presented.

ESCB COMPNET Global value chains: A case for Europe to cheer up August 2013
3
EUROPEAN GLOBAL VALUE CHAINS ARE THRIVING
Global trade linkages have been steadily gaining in depth and importance over the last few
years. This has taken the form of production processes that are much more finely fragmented
across borders in order to better exploit the comparative advantages of the participating
countries, both in terms of resource cost and efficiency and proximity to final destination
markets. A commonly used indicator to measure this phenomenon is the so-called “GVC
participation index” developed by Koopman et al. (2011), which takes into account two factors:
(i) the extent in which exporters depend on foreign suppliers for intermediate inputs (i.e. the
share of foreign VA in exports), and (ii) the share of domestic VA contained in foreign exports
to third countries. Looking at Europe, the vast majority of countries records an increase of the
index between 2000 and 2008 (Figure 1), which points to an increase in the vertical
specialisation of production.1
Also, the financial crisis appears to have stopped the global integration of euro area economies
only temporarily: CompNet research indeed confirms a rebound of foreign value added in
exports in 2011 after a sharp contraction in 2009 (Figure 2; Amador et al., 2013).
Notwithstanding this increase in global integration, the average share of foreign VA in euro area
exports (e.g. broadly, the import content of exports) equalled still just over 30% in 2011.2 This
is a far cry from the fears that Europe would fail to generate continued growth in value-added
while integrating into global value chains.
1 A similar GVC participation index is calculated by Miroudot and De Backer (2013) using the OECD inter-country input-output database, which overall confirms the ordering of EU countries with regards to GVC participation in 2008. Both indices are descriptive and do not per se imply any changes in welfare arising from GVC participation. 2 Smaller countries generally exhibit higher shares of foreign VA (e.g. over 60% in Luxembourg in 2011, a country strongly affected by financial services).
Figure 1: EU countries’ participation in GVCs, 2000 vs. 2008
Source: ECB calculations using WIOD, based on Koopman et al. (2011)
0%
20%
40%
60%
80%
CY IT UK FR ES DE GR RO LV PT IE SE PL AT LT DK FI EE SI NL MT BG CZ HU BE SK LU
2008 2000

ESCB COMPNET Global value chains: A case for Europe to cheer up August 2013
4
Another positive outcome for Europe of the higher GVC integration is that the reorganisation of
production was taking place amid higher integration within the continent. Using 2001 data for
the euro area, Amador et al. (2013) show for instance that the foreign value-added - while
increasing as a share of exports - was to a major extent sourced from other euro area countries
(Figure 3).
Another critical development associated with an increasing integration into GVCs is the
growing importance of services. In particular, it is increasingly recognised that production of
final manufacturing goods “embodies” also a larger share of service activities (Figure 4;
Timmer et al., 2013). This implies that trade in services is more important – and by the above
mentioned estimates more than double - than the current trade statistics would report.
Figure 2: Foreign value added in exports, 2000-2011
Source: Amador et al. (2013) using WIOD
10%
20%
30%
40%
50%
60%
70%
AT BE CY DE ES EE FI FR GR IE IT LU MT NL PT SK SI
2000
2007
2009
2011
Figure 3: Share of foreign value added (in exports) by origin – 2011 (percentages)
Source: Amador et al. (2013) using WIOD
0
20
40
60
AT BE CY DE ES EE FI FR GR IR IT LU MT NL PT SK SI ave.
EARest of the world USA China Asia exc. China
GB, DK, SE Eastern EU countries Euro17

ESCB COMPNET Global value chains: A case for Europe to cheer up August 2013
5
Services also are an increasingly important
contributor to job creation. Similar to their
indicator “manufacturers GVC income”3,
Timmer et al. (2013) build another indicator,
“manufactures GVC jobs”, which computes
the number of jobs associated with all
activities that are directly and indirectly
involved in the production of final
manufacturing goods. Results are even in this
case rather positive for Europe (Figure 5).
While manufacturing jobs cuts were rather
high over the 1995-2008 period, service
activities embodied in final manufacturing
goods were associated with substantial job
creation (with the notable exception of the UK). For instance, for Germany and Spain service
jobs creation more than compensated the losses in manufacturing (net creation between 1995
and 2008 equalled 561,000 GVC jobs in Germany and 440,000 in Spain), providing a good
argument in favour of policies supporting high-skilled services and improving domestic services
infrastructure.
3 “Manufactures GVC income” according to Timmer et al. (2013) is defined as the sum of all value added by all labour and capital that is directly and indirectly used for the production of final manufacturing goods.
Figure 5: GVC jobs creation (in 1000s), 1995 vs. 2008
Source: Timmer et al. (2013) using WIOD
561
-151
-1,624
91440
-19 50
-2,000
-1,500
-1,000
-500
0
500
1,000
1,500
DE FR UK IT ES PL CZ
Services
Manufacturing
Agriculture
Total
Figure 4: Services VA embodied in gross exports, 1995-2009
Source: WTO-OECD TiVA (2013)
20%
25%
30%
35%
40%
45%
50%
55%
60%
1995 2000 2005 2008 2009
US ChinaIndia EU27Japan

ESCB COMPNET Global value chains: A case for Europe to cheer up August 2013
6
CONCLUSIONS
While frequently controversial, the internationalisation of production and, more specifically, a
higher degree of vertical integration into global value chains provided in recent years critical
stimulus to the European economy. First, it fostered an industrial restructuring both across the
European economies and between Europe and the rest of the world, which allowed European
firms to vertically specialise in those activities in which they have a comparative advantage.
Such specialisation also took the form of a deeper integration within a European value chain.
That this process was not accompanied with a hollowing-out of the European economy is shown
by the fact that foreign value added still represents only less than a third of the average euro area
gross exports, which reduces to about a fifth when one excludes intra-euro area sourcing.
On the contrary, the generation of domestic value added by European economies remains very
high. Furthermore, along with the increase in GVC participation, the importance of services -
both directly and as “embodied” in final manufacturing - has grown in terms of value added and
job creation. For instance, from the mid-90s, job creation in service activities in Germany and
Spain more than compensated job losses in declining traditional manufacturing activities.
Overall, the most critical policy message is the following: when assessing country
competitiveness - both in terms of export performance and job creation - it is essential to make
systematic use of the newly developed indicators, which are able to distil value added creation
from traditional trade statistics in gross terms. Given their relevance, it is all the more important
to ameliorate these new indicators, particularly for what concerns sector disaggregation. The
latter remains limited, as it is derived from aggregated Input-Output tables, which are hard to
collect. An obvious direction is to integrate such tables with firm-level data; a route which is
being investigated within CompNet.

ESCB COMPNET Global value chains: A case for Europe to cheer up August 2013
7
APPENDIX 1 – COMPARISON OF THE MAIN GLOBAL DATABASES
In the light of complex production lines, parts and components of an individual finished good
typically cross several borders many times before reaching the final consumer. In order to
eliminate this double-counting of intermediates and to extract exactly how much value added is
generated at each of the different production stages, researchers rely on information coming
from input-output tables. This is a very complex task, since reliable I-O tables are only available
at the national level and hardly interconnected across countries. Also, the degree of sector detail,
typically ranging between 25 and 100, can only broadly mimic the complexity and variety of
existing products. Notwithstanding these difficulties, there are now a number of available
databases, which allow for a distillation of value-added from gross trade flows (see Table 1).
Typically these databases differ in a number of dimensions, such as i) the country, sector and
time coverage, ii) their linked satellite datasets, iii) the methodology used for their construction,
and iv) their public accessibility.
Table 1: Summary of existing global databases
Coverage
Time Dimension
Features Satellite Accounts or
Ready-to-use Indicators
TRADE
IDE-JETRO(Asian IIO)
9 Asian countries and US, 76 industries
intermittent years 1975-2005
ICIO employment statistics
(2000, 2005)
WIOD (World Input-
Output Database)
40 countries (incl. all EU27) plus ROW, 35 sectors
1995-2009 annually, will be updated to 2011
ICIO based on SUTs and
benchmarked to national accounts
available in this and last year's prices
socio-economic accounts (employment statistics)
services environmental accounts
OECD-WTO TiVA
(Trade in Value Added)
57 countries, 18 industries (37 in underlying tables)
1995, 2000, 2005, 2008, 2009
OECD ICIO (not publicly available)
OECD-WTO Trade in Value Added indicators (TivA)
services GVC indicators: incl.
GVC participation, distance to final demand, GVC length, GVC income
YNU-GIO (Yokohama
National University – Global IO
Table)
27 endogenous and 61 exogenous countries, 35 sectors
2005-2010 annually ICIO
shock transmission indicators: Simultaneous Shock Transmission Index (SSTI), industry-specific Shock Transmission Index (STI)
GTAP4 (Global Trade
Analysis Project)
129 countries, 57 sectors, 5 factors (land, skilled/unskilled labour, natural resources, capital)
2000, 2004, 2007
dataset of harmonised national IOTs and social accounting matrices (SAMs)
serves as a basis for a number of ICIO projects
energy volumes, land use, CO2 emissions
international migration processing trade accounts
for China and Mexico constructed by Koopman et al. (2013) and Tsigas et al. (2013)
4 GTAP consists of a harmonised meta-dataset of bilateral trade, together with national IOTs as well as social accounting matrices (SAMs) for 129 countries and 57 sectors (Walmsley et al., 2012). Instead of harmonising data from a wide range of sources themselves, a number of authors, including Koopman et al. (2013) and Tsigas et al. (2013), take the GTAP dataset as a basis for constructing inter-country IOTs.

ESCB COMPNET Global value chains: A case for Europe to cheer up August 2013
8
Coverage
Time Dimension
Features Satellite Accounts or
Ready-to-use Indicators
ENVIRONMENT
EXIOPOL (Externality and IO Tools
for Policy Analysis)
43 countries plus ROW, 129 sectors/products
2000, currently being updated to 2007
environmentally enhanced Supply & Use table SUT/ MRIO
30 emitted substances, 80 resources by industry
environmental accounts (global warming potential, acidification, total material requirement, external costs)
land use and water use
EORA
187 countries, 25-500 sectors depending on country
1990-2011 (based on initial MRIO estimated for year 2000)
MRIO reliability statistics
(est. standard deviations)
highly disaggregated avoids transforming
original raw data
35 environmental indicators (air pollution, greenhouse gas emissions, water use, ecological footprint, human appropriation of net primary etc.)
Therefore, the choice of the preferred database will depend on the nature of the policy/research
questions at hand, across the four dimensions mentioned above.
i) With regards to the first dimension, for policy makers with a focus on Asia the database of
Asian International IOTs (AIIOTs), produced by the Institute for Developing Economies of the
Japan External Trade Organisation (IDE-JETRO) (Meng et al., 2013), is the most natural
choice. However, if the recent financial crisis is the subject, one should better rely on the World
Input-Output Database (WIOD) (Dietzenbacher et al., 2013), which is currently the only
database providing data up to the year 2011 in both current and previous year’s prices. Finally,
in case of the prospect of being able to count on periodical updates was a priority, the WTO-
OECD Trade in Value Added (TiVA) database (De Backer and Miroudot, 2013) would be the
only option.
ii) Value-added databases are used for different purposes, and this is reflected in the satellite
datasets they are connected to. For instance, on account of providing a set of socio-economic
satellite accounts, WIOD is well suited to exploring the interaction between GVCs and
employment creation for 40 countries (incl. EU27). On the other hand, the most prominent
environmentally extended (EE) input-output tables EORA (Lenzen et al., 2013) and EXIOPOL
(Tukker et al., 2013) are linked to environmental accounts and emission datasets.
iii) With respect to the methodology used to extract the value-added, there is a clear trade-off
between accuracy and data availability. In particular, a first group of researchers uses a
simplifying proportionality assumption5 to break down imports into intermediate and final uses
(e.g. EORA, EXIOPOL, Johnson and Noguera (2012), Andrew and Peters (2013)). A second
5 The product-level breakdown into intermediate and final uses is assumed to be proportional to the aggregate breakdown in the destination country.
ESCB COMPNET Global value chains: A case for Europe to cheer up August 2013
9
group instead assigns each import flow to one of the three end-use categories (intermediate
inputs, final consumption and gross fixed capital formation) individually, with help of
additional data. In particular, detailed trade data and correspondences to broad end-use
categories (BEC) are used, increasing the accuracy of the resulting inter-country IOTs (e.g.
WIOD, Koopman et al. (2013), Tsigas et al. (2012)). The problem is that, while the second
methodology improves accuracy in comparison to the simple proportionality assumption, some
proportionality assumptions still have to be applied within certain use categories.6
iv) Finally, with respect to accessibility, at the moment only WIOD (up to the year 2009) and
parts of EORA are freely available, while GTAP and IDE-JETRO can be accessed against
payment of a fee. EXIOPOL and the OECD do not publish their global input-output tables,
although the OECD-WTO Trade in Value Added (TiVA) database can be accessed freely
online.
6 Interested readers can also refer to Appendix II of this policy brief, to the Economic Systems Research special issue (Vol. 25, Nr. 1), as well as to Miller and Blair’s textbook on input-output analysis (2009) for more technical explanations.

ESCB COMPNET Global value chains: A case for Europe to cheer up August 2013
10
APPENDIX II – INPUT-OUTPUT ANALYSYS APPLIED TO THE STUDY OF GLOBAL VALUE CHAINS
Although input-output analysis has a long tradition in economics since the 17th century, in its
modern form was first developed by Leontief in the 1930s as a tool for inter-industry analysis
(Miller & Blair, 2009). This framework accounts for the fact that each industry produces
products (output) that may be used by other industries, and also by the industry itself, as inputs,
giving rise to the name input-output analysis. Part of the output will also be attributed to final
consumption, as well as exports. Therefore, input-output tables (IOTs), as the one shown in
Figure 1, allow one to track the distribution of each industry’s product throughout the economy.
The emergence of global value chains has extended the use of IOTs, allowing for addressing the
impact of interdependencies of industries across different countries (or regions). The elements
of these multi-regional input-output (MRIO) (also called inter-country input-output (ICIO))
tables7 now represent flows between country-industry pairs (see Figure 2).
7 For the sake of brevity the terms MRIO and ICIO are used interchangeably in this policy brief. However, there are some differences with regards to the underlying methodology, which are discussed in more detail in the appendix.
Figure 1: Single-region input-output table
Industry 1 Industry 2 Industry 3
Final Consumption
Gross Capital Formation
Exports Total
Industry 1
use of intermediate inputs final uses total use of output
Industry 2
Industry 3
Imports use of imported inputs imported final uses
Value Added use of primary inputs
Gross Output total supply of output
Source: The authors, adapted from EUROSTAT (2008)
Figure 2: Interregional input-output table
Inter‐industry Transactions/Intermediate Demand Final Demand Total
Country 1 Country 2 … Country 1 Country 2 …
Ind 1 Ind 2 … Ind 1 Ind 2 … …
Country 1
Industry 1
use of domestic inputs use of foreign inputs
Industry 2
…
Country 2
Industry 1
use of foreign inputs use of domestic inputs
Industry 2
…
… … use of foreign inputs use of foreign inputs
Value Added use of primary inputs use of primary inputs
Gross output
Source: The authors, adapted from De Backer and Miroudot (2013)
ESCB COMPNET Global value chains: A case for Europe to cheer up August 2013
11
In principle, an inter-country input-output table is, therefore, a device that makes it possible to
track the flows of products between sectors and countries as well as to final uses, like household
and government consumption and gross fixed capital formation. Furthermore, it provides
information on the use of and payment to primary factors. In doing so it follows the national
accounting principle in the sense that the value-added (GDP) is recorded at a regional basis and
not according to the ownership principle (GNP). Thus, an IOT allows one to track domestic
rather than national value-added. Whereas most countries provide information on domestic -
and in fewer cases imported - inter-industry flows in the form of supply and use tables (SUT)
and national input-output tables (IOTs), there is generally a lack of data on imports from
specific country-industry pairs.
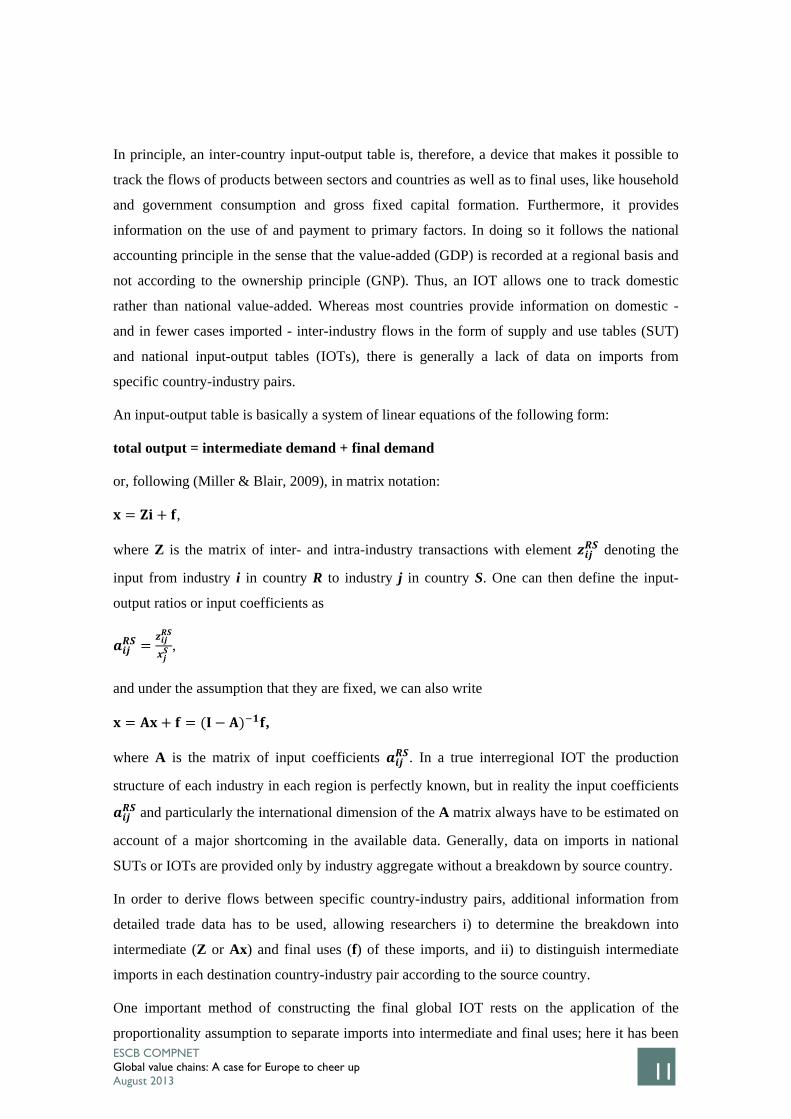
An input-output table is basically a system of linear equations of the following form:
total output = intermediate demand + final demand
or, following (Miller & Blair, 2009), in matrix notation:
,
where Z is the matrix of inter- and intra-industry transactions with element denoting the
input from industry i in country R to industry j in country S. One can then define the input-
output ratios or input coefficients as
,
and under the assumption that they are fixed, we can also write
,
where A is the matrix of input coefficients . In a true interregional IOT the production
structure of each industry in each region is perfectly known, but in reality the input coefficients
and particularly the international dimension of the A matrix always have to be estimated on
account of a major shortcoming in the available data. Generally, data on imports in national
SUTs or IOTs are provided only by industry aggregate without a breakdown by source country.
In order to derive flows between specific country-industry pairs, additional information from
detailed trade data has to be used, allowing researchers i) to determine the breakdown into
intermediate (Z or Ax) and final uses (f) of these imports, and ii) to distinguish intermediate
imports in each destination country-industry pair according to the source country.
One important method of constructing the final global IOT rests on the application of the
proportionality assumption to separate imports into intermediate and final uses; here it has been

ESCB COMPNET Global value chains: A case for Europe to cheer up August 2013
12
assumed that for each product the breakdown into intermediate and final uses is proportional to
the aggregate breakdown into intermediate and final uses in the destination country. An IOT
resulting from the use of the proportionality method is commonly called a multiregional input-
output (MRIO) table.
A second way to separate intermediate from final imports is to sort bilateral trade flows with
help of the UN Broad Economic Categories (BEC) or refinements of these, which makes it
possible to assign each imported product to one of the three end-use categories (intermediate
inputs, final consumption and gross fixed capital formation) at the 6-digit HS level. This results
in an individual split into intermediate and final uses for each origin industry increasing the
accuracy of estimated input coefficients.
Lastly, it has to be mentioned that for both MRIOs and ICIOs an assumption of proportionality
is applied within the three end-use categories, particularly to split imported intermediates across
industries. A more sophisticated approach would be to use additional information to provide a
more differentiated breakdown of use patterns of imported intermediates across industries, but
this data is generally unavailable.8
8 This holds with the exception of IDE-JETRO (Tukker and Dietzenbacher, 2013).

ESCB COMPNET Global value chains: A case for Europe to cheer up August 2013
13
BIBLIOGRAPHY
Amador, J., Cappariello, R., & Stehrer, R. (2013). Global value chains: A view from the euro area. Paper presented at the CompNet conference in Washington, 16-17 April 2013.
Andrew, R. M., & Peters, G. P. (2013). A Multi-Region Input-Output Table Based on the Global Trade Analysis Project Database (GTAP-MRIO). Economic Systems Research, 25(1), 99-121.
Baldwin, R. (2006). The Great Unbundling(s). Helsinki: Report for the Economic Council of Finland.
Dietzenbacher, E., Los, B., Stehrer, R., Timmer, M., & de Vries, G. (2013). The Construction of World Input-Output Tables in the WIOD Project. Economic Systems Research, 25(1), 71-98.
EUROSTAT. (2008). Eurostat Manual of Supply, Use and Input-Output Tables. Luxembourg: Eurostat, European Commission, Office for Official Publications of the European Communities.
Johnson, R. C., & Noguera, G. (2012). Accounting for intermediates: Production sharing and trade in value added. Journal of International Economics(86), 224-236.
Koopman, R., W. Powers, Z. Wang and S.-J. Wei (2011). Give credit to where credit is due: tracing value added in global production chains, NBER Working Papers Series 16426, September 2010, revised September 2011.
Koopman, R., Wang, Z., & Wei, S.-J. (2013). Tracing Value-added and Double Counting in Gross Exports. Forthcoming in American Economic Review.
Lenzen, M., Moran, D., Kanemoto, K., & Geschke, A. (2013). Building EORA: A Global Multi-Region Input-Output Database at High Country and Sector Resolution. Economic Systems Research, 25(1), 20-49.
Meng, B., Zhang, Y., & Inomata, S. (2013). Compilation and Applications of IDE-JETRO's International Input-Output Tables. Economic Systems Research, 25(1), 122-142.
Miller, R. E., & Blair, P. D. (2009). Input-output Analysis : Foundations and Extensions. Cambridge [England]: Cambridge University Press.
Miroudot, S., & De Backer, K. (2013). Mapping Global Value Chains. Forthcoming CompNet Working Paper.
Timmer, M., Los, B., Stehrer, R., & De Vries, G. (2013). Fragmentation, Incomes and Jobs. An analysis of European competitiveness. Paper presented at the CompNet conference in Washington, 16-17 April 2013.
Timmer, M., Los, B., Stehrer, R., & De Vries, G. (2013). Fragmentation, Incomes and Jobs. An analysis of European competitiveness. Economic Policy, forthcoming.
Tsigas, M., Wang, Z., & Gehlhar, M. (2012). How a Global Inter-Country Input-Output Table with Processing Trade Account Can Be Constructed from GTAP Database. Paper presented at the 15th GTAP Conference on Global Economic Analysis in Geneva, 28 June 2012.
Tukker, A., & Dietzenbacher, E. (2013). Global Multiregional Input-Output Frameworks: An Introduction and Outlook. Economic Systems Research, 25(1), 1-19.
Tukker, A., de Koning, A., Wood, R., Hawkins, T., Lutter, S., Acosta, J., et al. (2013). EXIOPOL - Development and Illustrative Analyses of a Deatailed Global MR EE SUT/IOT. Economic Systems Research, 25(1), 50-70.
Walmsley, T. L., Aguiar, A. H., & Narayanan, B. (2012). Introduction to the Global Trade Analysis Project and the GTAP Database. GTAP Working Paper, 67.