GLOBAL URBAN CONNECTED - RMIT
102
2014 ANNUAL REPORT GLOBAL URBAN CONNECTED
Transcript of GLOBAL URBAN CONNECTED - RMIT

2014 ANNUAL REPORT
GLOBALURBAN CONNECTED

Published by: RMIT University Communications Building 1, Level 2 124 La Trobe Street Melbourne
GPO Box 2476 Melbourne VIC 3001 Australia
Tel. +61 3 9925 2000 ABN: 49 781 030 034 CRICOS Provider No: 00122A
Project manager and editor: Pauline Charleston Design layout and production: Michelle Aquino, Vince Lowe
RMIT University’s 2014 Annual Report and previous reports are available online at: www.rmit.edu.au/about/governance-and-management/governance/annual-reports
13971 0315

RMIT UNIVERSITY 2014 ANNUAL REPORT
CONTENTS
Letter of Transmittal 2
ORGANISATIONAL OVERVIEW
Mission, Vision, Goals and Values 4
Chancellor’s Statement 5
Vice-Chancellor’s Statement 6
About RMIT 7
Senior Officers 8
Academic Schools and Research Institutes 10
Organisational Chart 11
Statistical Snapshot 12
Financial Performance 13
REPORT OF OPERATIONS
Global 15
Urban 19
Connected 21
Students and Staff 23
Sustainability and Resource Usage 26
UNIVERSITY GOVERNANCE
Governance 27
Council Members 28
Council Committees 29
RMIT Subsidiaries 30
Statutory Reporting 31
Risk Management and Internal Audit 32
Objects of the University 32
Consultancies 33
DISCLOSURE INDEX 34
ATTESTATION ON COMPLIANCE WITH RISK MANAGEMENT STANDARD 36
FINANCIAL STATEMENTS
Declarations 38
Independent Auditor’s Report 39
Income Statement 41
Statement of Comprehensive Income 42
Statement of Changes in Equity 43
Statement of Financial Position 44
Statement of Cash Flows 45
Contents to the Notes to the Financial Statements 46
Notes to the Financial Statements 47
Balance Sheet for the Years 2014 to 2010 inclusive 99
Income Statement for the Years 2014 to 2010 inclusive 100
3

RMIT UNIVERSITY 2014 ANNUAL REPORT
Mission of RMIT UniversityThe University brings knowledge within reach through education and research to enrich and transform the futures of individuals, cities, industries and nations.
RMIT’s Vision to 2015RMIT will be a global university of technology and design. As a university of technology and design, RMIT will focus on creating solutions that transform the future for the benefit of people and their environments. We will collaborate with partners to ensure the global impact of our education and research, and we will reach out through our presence in cities across the world to make a difference.
GoalsTo achieve our vision, we will be:
1. Global in attitude, action and presence, offering our students a global passport to learning and work.
2. Urban in orientation and creativity, shaping sustainable cities and drawing inspiration from the challenges and opportunities they provide.
3. Connected through active partnerships with professions, industries and organisations to support the quality, reach and impact of our education and research.
Core Values Creative— RMIT creates opportunities for students and staff to explore,
test and fulfil their potential.
— Imaginative curriculum and research solutions are sought, applied and rewarded.
— RMIT fosters a creative and inventive culture which values achievement.
Connected— Students’ aspirations, experience and needs are central to
evaluating our performance and shaping improvement.
— Industry and community are active partners in our education and research.
— Global networks formed around knowledge, industries and cities underpin our operations.
— Collaboration and team work is encouraged and a sense of belonging for students and staff is supported.
Fair— Learning opportunities support a diverse range of students,
including those who may be disadvantaged.
— Respect for Indigenous cultures is reflected in our work.
— Intellectual freedom and tolerance are nurtured and debate encouraged.
— A physically, culturally and socially safe work and study environment is provided for all staff and students.
— Ethical, honest and open dealings characterise relationships with students, staff and partners.
Passionate— Building enthusiasm and a sense of achievement in our
students and staff is a high priority.
— Excellence in teaching, scholarship, research and service is rewarded and supported.
— Cultural and social diversity is encouraged and celebrated.
Committed to making a difference— Our graduates are creative, skilled, highly employable and
purposeful.
— Knowledge and skills developed in our students and staff serve the needs of and bring benefits to individuals, cities, industries and nations.
— Our staff are constructive and agile in meeting the needs of individuals, cities, industries and nations.
Mission, Vision, Goals and Values
ORGANISATIONAL OVERVIEW4

RMIT UNIVERSITY 2014 ANNUAL REPORT
After more than nine years as Vice-Chancellor and President, Professor Margaret Gardner AO resigned from RMIT University early in 2014 to take up a leadership position at another university. She left behind an institution with an excellent reputation, strong academic and financial performance, and a platform for continuing growth and success.
Mr Martin Bean CBE, formerly Vice-Chancellor at the Open University, UK, was appointed during the year as the new RMIT University head, to take up his position at the start of 2015.
During the search process, we learnt from a number of qualified candidates what they saw as attractive and distinctive about our university. Here is what they noted:
The structure and composition of our three colleges of Science, Engineering and Health, Design and Social Context, and Business, reflect a modern university with a clear, differentiated mission focused upon technology, design and business.
Being a city-based university in one of the most liveable cities in the world is immensely appealing to overseas and domestic students alike.
In an era of globalisation, our strategy, assets and footprint especially across Asia emphasise our historic commitment to international development and the quality of our networks across this vibrant region.
Our scale – 82,000 students across the world – implies levels of resources, range of partnerships and cultural diversity which work to the benefit of our students. Our researchers and alumni are making important contributions across the globe.
Our readiness to construct facilities, and to innovate in learning and teaching to exploit best practice in the use of online processes, ensures a satisfying student experience and builds confidence in our ability to produce graduates who are job-ready and equipped with contemporary skills in a digital and connected world.
We occupy leadership positions across the learning and teaching spectrum – from vocational education to higher education with pathways programs providing important linkages.
The RMIT brand is a valued and trusted one, recognised globally.
I believe these are characteristics which also appeal to parents and the students who join us in growing numbers every year.
The 2014 year saw consolidated group revenues reach $1078 million, up 6.5 per cent, and operating cash flows of $151 million. Given our strong balance sheet and the low interest rate environment, this cash flow augmented conservatively by borrowings is sufficient to fund the $870 million capital investment we expect to make in support of offshore campuses, new infrastructure, IT systems, research facilities and student housing over the next five years or so.
The year ahead will see the development of our next five-year strategy and plan. Our new Vice-Chancellor will lead this at a time when the higher education landscape is changing rapidly.
But it has ever been thus and we look forward with enthusiasm to crafting a plan which will strengthen this University’s position among its national and international peers.
The composition of our Council also continues to change. During this past year, Ms Rosi Lever, Deputy Chancellor, and Ms Moira Schulze retired. Dr Stephen Duckett, Brigadier Gary Hogan, Mr James Michelmore and Professor Julianne Reid joined, while Professor David Hayward remained on Council following his re-election as Chair of the Academic Board. Ms Janet Latchford was appointed Deputy Chancellor.
The University has been exceptionally well served by its Council members and I am grateful to them for their diligence, enthusiasm and wisdom in helping guide our institution.
Finally, in the transition from Professor Gardner to Mr Bean, Professor Gill Palmer was Vice-Chancellor for nine months. On behalf of the University and its Council, I would like to thank her for her excellent stewardship through this period.
Dr Ziggy Switkowski AO Chancellor
Chancellor’s Statement
2014 was a year that highlighted the most valued attributes of RMIT and saw the University preparing for transition from a solid basis to ensure its continued strong growth into the future.
5

RMIT UNIVERSITY 2014 ANNUAL REPORT
The University graduated 24,833 students, including 276 higher degrees by research. The Group’s surplus was $75.5 million on revenue of $1078 million. EBITDA (Earnings Before Interest, Taxes, Depreciation and Amortisation) was 14.0 per cent. This strong financial position enabled the University to address ageing infrastructure, adapt administrative systems and teaching delivery to the digital world, and prepare for increased international competition and domestic policy changes.
The University’s focus on improving student experience and outcomes has intensified. The new Global Learning by Design project is creating courses and programs with technology-enhanced, work-relevant curriculum developed for multi-channel, multi-location delivery. Projects to achieve paperless student administration are responding to student demand for processes that are seamless and that support the learner experience.
The RMIT Campus Store opened in 2014, giving students at the City and Bundoora campuses a one-stop shop for course materials and branded merchandise.
Student employability was featured in the Jobs on Campus project, with 80 students gaining work experience in the program’s first year of operation. A work-integrated learning system was implemented to support the sourcing and management of professional placement activities for students, and mentoring by alumni and industry advisors was expanded to benefit RMIT students in Vietnam and Singapore. More than 1500 Australian-based students undertook part of their study overseas.
Our graduates continue to be highly sought after by employers, with the 2014 QS World University Rankings placing RMIT 79th in the world for employer reputation.
Work continued on delivering the University’s capital development program to upgrade ageing buildings and enhance learning spaces. The recently completed Swanston Academic Building was named Best Public Building of 2014 by the Property Council of Australia, and the new Academic Building 2 on the Saigon South campus was a winner in the Vietnam Ministry of Construction’s High Quality Construction Awards.
Plans to transform the heart of our campus in central Melbourne were announced. The New Academic Street project will refurbish four 1970s buildings along Swanston Street to create interconnecting learning spaces and laneways which will open the University to the city.
The temporary A’Beckett Urban Square opened in August, providing sporting courts, BBQ facilities, WiFi and bike parking for University and public use.
Infrastructure developments supported the research needed to achieve RMIT’s strategy to differentiate itself in technology and design. The MicroNano Research Facility was opened on the City campus, the first of its kind in Australia to bring together multidisciplinary micro and nano technology research.
Research will be a focus of the $98 million Sustainable Urban Precincts Program which will significantly reduce electricity and water use at RMIT’s Melbourne campuses.
RMIT Europe became a founding member of the Barcelona KEY Economic and Knowledge cluster with the Government of Catalonia and Barcelona City Council to further develop research.
RMIT is the most internationalised university in Australia, and possibly the world on many counts. In 2013 it established an internal Global Management Hub to enhance the RMIT Group’s overall cohesiveness. In 2014 it delivered an alignment of controlled entity business plans, as well as building closer leadership and management relations between academic colleges, RMIT Vietnam, RMIT Europe and RMIT Training.
RMIT Training has experienced a successful year with the extension of its RMIT English Worldwide business in China and Myanmar, and increased Informit EduTV sales to international universities, securing 36 per cent of market share.
RMIT Vietnam continues to be the world’s largest offshore campus with 6263 students in higher education and English language programs.
Academic program delivery through international partnerships continues to grow, with 10,825 students enrolled through partner institutions in Singapore, Indonesia, Hong Kong, mainland China, Sri Lanka, Belgium, Spain and Germany. It is pleasing that the first students to study through RMIT’s partnership with Universitas Pelita Harapan in Indonesia graduated in September.
The University is in a very strong position, and I am confident that it will continue to build on its global learning, teaching and research successes as it enters into a new and exciting period, welcoming Martin Bean as its new Vice-Chancellor.
Professor Gill Palmer Vice-Chancellor and President
RMIT’s 2010-15 Strategic Plan, Transforming the Future, focuses on the University’s contribution as a global university of technology and design, and 2014 saw many achievements.
Vice-Chancellor’s Statement
6

RMIT UNIVERSITY 2014 ANNUAL REPORT
One of Australia’s original educational institutions founded in 1887, RMIT University now has more than 82,000 students. The University enjoys an international reputation for excellence in professional and vocational education, applied and innovative research, and engagement with the needs of industry and the cities in which we are located.
RMIT has a 5-Star QS ranking for excellence in higher education and is ranked among the top 15 Australian universities in the 2014 QS World University Rankings.
In the 2014 QS Top 50 Under 50 index, we were 32nd in the world among universities less than 50 years (RMIT was granted university status in 1992).
With three campuses in Melbourne (CBD, Brunswick and Bundoora), two in Vietnam (Hanoi and Ho Chi Minh City) and a centre in Barcelona, Spain, RMIT is a truly global university. RMIT also offers programs through partners in Singapore, Hong Kong, mainland China, Indonesia, Sri Lanka, Spain, Belgium and Germany, and enjoys research and industry partnerships on every continent.
At the inaugural Victorian International Education Awards, RMIT received the Premier’s Award for International Education Provider of the Year and the award for Excellence in International Education (University).
We offer postgraduate, undergraduate and vocational programs, enabling students to have the option of work-relevant pathways between vocational and higher education qualifications. A range of scholarships is available to support education and research. RMIT is a leader in engineering, accounting and finance, computer science and information systems, communication and media studies, psychology, education, law and economics.
From the design of curriculum to applied research, RMIT works closely with domestic and international partners to equip students with the knowledge and state-of-the-art skills that enable them to excel in their chosen professions. As a result, RMIT graduates are highly regarded around the world for their leadership skills and work readiness.
We pride ourselves on our work-integrated learning opportunities which combine theory with practice in a workplace environment, ensuring that graduates are equipped with the skills and insight that employers value in the ever-changing global economy.
RMIT’s researchers are engaged alongside our partners world-wide in solving practical problems of our time. Our connections to industry partners, to governments, and to the urban communities within which we operate, are vital.
Our four Research Institutes (Design, Global Cities, Platform Technologies, and Health Innovations), together with other research groups in the University, work within multidisciplinary teams to address the needs of industry and communities world-wide.
The quality of the RMIT’s research work has been endorsed by the Australian Research Council. The most recent round of its Excellence in Research Australia exercise placed RMIT among the top five Australian universities for excellence in key research disciplines, with 85 per cent of our research outputs rated at “above” or “well above” world standard.
As part of a continuing capital investment program, RMIT has recently completed several major projects including the Swanston Academic Building and Design Hub which have significantly enhanced the University’s learning, teaching and research spaces.
RMIT University is a self-accrediting university established under Victorian Government legislation. RMIT’s objects under its Act are to foster excellence in teaching, training, scholarship, research, consultancy, community service and other educational services and products. The University has the power to confer degrees, diplomas, certificates and other awards, and is a major provider of vocational education and training programs.
RMIT is a global university of technology and design, focused on creating solutions that transform the future for the benefit of people and their environments.
About RMIT
7

RMIT UNIVERSITY 2014 ANNUAL REPORT
Senior OfficersSenior Officers
Vice-Chancellor and President Professor Gill Palmer BSocSc(Hons) (Birm, UK), MSc(Industrial Admin) (LSE), PhD (London City), GAICD
Professor Palmer is Vice-Chancellor and President of RMIT University and all of its controlled entities. She is also Vice-Chair of RMIT Training.
Professor Palmer has previously worked in the UK at the London School of Economics, Cass Business School, the British Government’s Commission on Industrial Relations and her own business consultancy. In Australia from 1984, she has held senior roles at the University of Wollongong, Queensland University of Technology and Monash University.
She has published in organisational sociology and employment relations and has been President of ANZAM and the Association of Industrial Relations Academics of Australia and NZ. She is currently a director of Open Universities Australia and is on the EQUIS Committee of the European Foundation for Management Development.
Acting Deputy Vice-Chancellor Academic and Vice-President Professor Geoffrey Crisp BSc(Hons) (UQ), PhD (ANU), FHERDSA
Professor Crisp has held positions in chemistry at the University of Melbourne and University of Adelaide, as well as roles in online education and academic development at the University of Adelaide and at RMIT. He is a former President of HERDSA.
Professor Crisp has received the Royal Australian Chemical Institute’s Stranks Medal for Chemical Education, the University of Adelaide’s Stephen Cole the Elder Prize for Excellence in Teaching, an Office for Learning and Teaching National Fellowship and an ASCILITE Fellowship.
Chief Operating Officer and Vice-President Resources Mr Steve Somogyi MSc (Melb), SM (MIT), FIAA, FAICD, F Fin
Steve Somogyi was appointed to this role in 2006, having previously had extensive experience in the financial services and health care industries, including three years as executive member of the Australian Prudential Regulation Authority and many years in senior executive roles with National Mutual.
Mr Somogyi is a Fellow of the Institute of Actuaries of Australia, the Australian Institute of Company Directors and the Financial Services Institute of Australia.
He is a commissioner on the Safety, Rehabilitation and Compensation Commission, a director of ANZ Wealth companies, Guild Group companies, UniSuper, Higher Education Services and Spatial Vision Innovations, and a trustee of RMIT Foundation.
Pro Vice-Chancellor Business and Vice-President Professor Ian Palmer BA(Hons) (ANU), PhD (Monash), FASSA
Professor Palmer’s leadership of the College of Business is informed by a distinguished academic career in Australia and overseas.
A previous President of ANZAM and foundation Chair of the Business Academic Research Directors Network, Professor Palmer was elected in 2008 to the US Academy of Management’s Organizational Development and Change Division as Representative-at-Large. He was also appointed Chair of the Research Quality Framework Panel 10 for Economics, Commerce and Management, and to Life Membership of ANZAM.
In 2011 Professor Palmer was appointed a Fellow of the Academy of the Social Sciences in Australia and is the current Treasurer of the Australian Business Deans Council.
Pro Vice-Chancellor Design and Social Context and Vice-President Professor Paul Gough BA(Hons), MA, PhD (Royal College of Art), FRSA, RWA
A painter, broadcaster and writer, Professor Gough has exhibited internationally, most recently in UK, Canada, NZ and Australia, with representation in several permanent art collections. These have included London’s Imperial War Museum, the Canadian War Museum and NZ’s National War Memorial.
Professor Gough has published five books on the representation of war and peace, and more than 100 research papers. He is an Academician of Royal West of England Academy.
He has chaired international research assessment schemes in UK, Australia, Rumania and NZ, and has addressed universities and research councils on international research and evaluation schemes.
Pro Vice-Chancellor Science, Engineering and Health and Vice-PresidentProfessor Peter Coloe BSc(Hons), PhD (Monash), FASM
Professor Coloe was appointed to this role in 2008. He served on Council from 1999 to 2008 and chaired the Academic Board from 2000 to 2008. A prolific researcher and sought-after research supervisor, Professor Coloe has more than 160 publications and has been awarded three worldwide patents.
Professor Coloe has served as an advisor to the Federal Government’s Biosecurity Australia risk assessment panel and the Victorian Government’s biotechnology task force. He is a Fellow of the Australian Society for Microbiology, a member of the International Union of Microbiological Services, an ARC and NHMRC grants referee and serves on Microbiology Australia’s Editorial Board.
Deputy Vice-Chancellor Research and Innovation and Vice-President Professor Calum Drummond BscEd, BSc(Hons), DSc, PhD (Melb), FAICD, FTSE, FRACI, FRSC, CChem
Professor Drummond has a leadership role in the development of discovery and practice-based research, and in building and enhancing capability in research and innovation across the University.
Professor Drummond joined RMIT in 2014 from CSIRO where he was Group Executive for Manufacturing, Materials and Minerals, and previously Chief of Materials Science and Engineering. He was seconded from CSIRO to be the inaugural Vice-President Research at CAP-XX, an Intel portfolio company.
He remains an active research professor and has published more than 200 articles and patents in the area of advanced materials. He has a strong interest in the commercialisation of research outcomes.
President RMIT Vietnam and Vice-President RMIT University Professor Gael McDonald BBus (Massey), MBA (UWA), PhD (LSE)
Professor McDonald commenced as President of RMIT Vietnam in February 2014, having previously been Pro Vice-Chancellor of Deakin University’s Faculty of Business and Law and Secretary of the Australian Business Deans Council.
Her background has included the roles of Vice-President International, Vice-President Research, Dean of Business and Professor of Business Ethics at Unitec Institute of Technology, New Zealand. She is a past President of ANZAM and has also consulted in the private sector.
Professor McDonald has published widely and is author of Business Ethics: A Contemporary Approach and co-author of Surviving and Thriving in Postgraduate Research and Organising an Academic Conference: Guidelines for Scholarly and Financial Success.
8

RMIT UNIVERSITY 2014 ANNUAL REPORT
Deputy Vice-Chancellor Engagement and Vocational Education and Vice-President Mr John Barnes BA (Monash), BEd (Deakin), GradDip BA (Swinburne), GradDip CSP (ACSA), MBA (RMIT)
John Barnes has had extensive involvement in tertiary education, particularly in vocational education. Prior to joining RMIT in 2012, he held senior management positions in TAFE institutes for 16 years, most recently as GM Business Development at Kangan Institute of TAFE.
Mr Barnes has extensive experience in developing industry-based vocational education, both in Australia and internationally. He is committed to strong educational outcomes in responding effectively to industry, student and government needs.
Deputy Vice-Chancellor International and Vice-President Professor Andrew MacIntyre BA(Hons), MA, PhD (ANU), FASSA
Before joining RMIT in 2014, Professor MacIntyre was Professor of Political Science at ANU, where he also served as Dean of the College, Director of the Research School of Asia and the Pacific, and Founding Director of the Crawford School of Public Policy.
He was previously Professor and Interim Dean at the University of California San Diego’s Graduate School of International Relations and Pacific Studies.
A recipient of many international awards, Professor MacIntyre was the founder of the Australia-Indonesia Governance Research Partnership and serves on the Bulletin of Indonesian Economic Studies’ editorial board. He is Vice-Chairman of AusPECC and a director of the Australian-American Leadership Dialogue and Asia Foundation in Australia.
University Secretary and Vice-President Mr Trent Gillam LLB (ANU), F Fin
Mr Gillam was appointed interim University Secretary in August 2014, heading the Office of Governance and Planning which provides integrated support for university governance and strategic, academic and business planning.
He has been RMIT Chief of Staff and Director Government Relations since 2009, and has previously served as Principal Policy Advisor to the Vice-Chancellor.
President RMIT Europe and Vice-President RMIT University Professor Colin Fudge BArch(Hons), MA (Town and Regional Planning) (Sheffield), DSc (Bristol), FRIBA, MRTPI, FRSA
From 2008 until being appointed President RMIT Europe in 2013, Professor Fudge held the role of PVC Design and Social Context.
Prior to that, he worked for the two universities in Bristol and the University of Cardiff (UK), Chalmers University and KTH Royal Institute of Technology (Sweden), the UK and Swedish governments, the Victorian Government and European Commission.
Professor Fudge has contributed through interdisciplinary research on public policy and public health, sustainable cities, demographic change, and urban design. This has been recognised through the awarding of the Royal Professorship of Environmental Science by the Swedish Academy of Sciences and an Honorary Fellowship of the Royal Institute of British Architects.
Chief Executive Officer, RMIT Training Rachel Holthouse BA (Monash), DipEd (Melb), RSA/Cambridge CELTA (RMIT), MAppLing (Macquarie)
Ms Holthouse was appointed to this role in 2009. She previously held senior positions at the University of Melbourne, including Executive Manager of Business Strategy and Operations for the Department of Otolaryngology, home of Australia’s renowned Bionics Institute.
She has also worked in Asia as Director of Hawthorn-Singapore Language School, and in Scotland as Principal of Edinburgh School of English. This role included corporate governance responsibilities on the board of UMEE UK Ltd.
Ms Holthouse is committed to the creation and implementation of high-quality innovative educational products and services. She has achieved global partnerships with educational organisations and corporations for RMIT Training.
9

RMIT UNIVERSITY 2014 ANNUAL REPORT
Academic Schools and Research InstitutesAs at 31 December 2014, RMIT University offered programs of study in 23 schools across three academic colleges.
College of Business
School Head of School
Accounting Professor Garry Carnegie
Business IT and Logistics Professor Caroline Chan
Economics, Finance and Marketing Professor Timothy Fry
Graduate School of Business and Law Professor Mark Farrell
Management Professor Pauline Stanton
Vocational Business Education Ms Vicki Molloy
College of Design and Social Context
School Head of School
Architecture and Design Professor Richard Blythe
Art In recruitment
Education Professor Robert Strathdee
Fashion and Textiles Professor Robyn Healy
Global, Urban and Social Studies Professor David Hayward
Media and Communication Professor Martyn Hook
Property, Construction and Project Management
Professor Ron Wakefield
College of Science, Engineering and Health
School Head of School
Aerospace, Mechanical and Manufacturing Engineering
Professor Aleksandar Subic
Applied Sciences Professor Andrew Smith
Civil, Environmental and Chemical Engineering
Professor Chun Qing Li
Computer Science and Information Technology
Professor Athman Bouguettaya
Electrical and Computer Engineering Professor Michael Austin
Health Sciences Professor Charlie Xue
Mathematical and Geospatial Sciences Professor John Hearne
Medical Sciences Professor David Pow
Vocational Engineering Mr Peter Ryan
Vocational Health and Sciences Ms Cheryl Underwood
Research InstitutesRMIT University has four Research Institutes which unite researchers from across the University within multidisciplinary teams. These Institutes, together with other research groups in the University, are concerned with addressing the problems and needs of industry and communities world-wide.
Institute Director
Design Research Institute Professor Mark Burry
Global Cities Research InstituteProfessor Peter Fairbrother
Health Innovations Research Institute Professor David Adams
Platform Technologies Research Institute Professor Xinghuo Yu
10

RMIT UNIVERSITY 2014 ANNUAL REPORT
This organisational chart provides a graphical representation of the management structure of RMIT University as at 31 December 2014. Current versions of the organisational chart are available on RMIT’s website.
University Council
Ombuds
Vice-Chancellor and President Professor Gill Palmer
Organisational Chart
University Secretary and Vice-PresidentMr Trent Gillam
Oversight of the Governance and Planning office— Chancellery — Global Quality and Regulation — Policy and Planning — University Secretariat
Deputy Vice-Chancellor International and Vice-PresidentProfessor Andrew MacIntyre
International recruitment, mobility, partnerships and development— International Partnerships and Development— International Recruitment and Mobility
Deputy Vice-Chancellor Engagement and Vocational Education and Vice-PresidentMr John Barnes
— Advancement — Industry Business Development— Marketing — Office of the Executive Director Vocational Education— Web Services and Information Policy
Chief Operating Officer and Vice-President ResourcesMr Stephen Somogyi
Campus infrastructure, human and financial resources— Financial Services — Internal Audit and Risk Management — Human Resources — Legal Services— Information Technology Services — Property Services
Acting Deputy Vice-Chancellor Academic and Vice-PresidentProfessor Geoffrey Crisp
Academic leadership to support the education provided to students through programs, systems and processes— Academic Registrar’s Group — Global Management Hub including management — Office of Dean, Learning and Teaching oversight of:— Office of Dean, Students — University Library
Deputy Vice-Chancellor Research and Innovation and Vice-PresidentProfessor Calum Drummond
Research development— Research Office — School of Graduate Research— RMIT Research Institutes
Pro Vice-Chancellor Science, Engineering and Health and Vice-PresidentProfessor Peter Coloe
Academic leadership and management of 10 schools and the Bundoora campuses— Aerospace, Mechanical and Manufacturing — Vocational Engineering Engineering — Health Sciences— Applied Sciences — Vocational Health and Sciences— Civil, Environmental and Chemical Engineering — Mathematical and Geospatial Sciences— Computer Science and Information Technology — Medical Sciences— Electrical and Computer Engineering
Pro Vice-Chancellor Design and Social Context and Vice-PresidentProfessor Paul Gough
Academic leadership and management of seven schools and RMIT Hamilton— Architecture and Design — Global, Urban and Social Studies— Art — Media and Communication— Education — Property, Construction and Project Management— Fashion and Textiles
Pro Vice-Chancellor Business and Vice-PresidentProfessor Ian Palmer
Academic leadership and management of six schools— Accounting — Economics, Finance and Marketing— Business IT and Logistics — Graduate School of Business and Law— Vocational Business Education — Management
• RMIT Vietnam • RMIT Europe • Offshore activities of RMIT Training
11

RMIT UNIVERSITY 2014 ANNUAL REPORT
Statistical Snapshot
Sector/Level Enrolments (headcounts)
2010 2011 2012 2013 2014 1
Higher Education (HE) 53,350 55,178 56,724 59,313 61,091
Postgraduate Research 1,672 1,690 1,761 1,873 1,945
Postgraduate Coursework 10,805 10,625 9,984 9,836 9,990
Undergraduate 37,813 39,008 40,409 42,197 43,582
Sub Degrees 3,060 3,855 4,570 5,407 5,574
Open Universities Aust 5,821 7,277 6,914 6,090 5,393
Postgraduate 487 564 628 617 690
Undergraduate 5,334 6,713 6,282 5,473 4,663
Vocational Education (VE) 20,554 19,667 17,935 16,200 14,298
Diploma and Advanced Diploma (AQF 5-6)
9,123 8,854 8,302 7,853 7,064
Certificates III and IV (AQF 3-4)
8,775 8,527 7,327 6,215 5,733
Certificates I and II (AQF 1-2)
1,453 1,099 1,029 912 314
VCE/VCAL 511 526 562 572 493
Other 2 692 661 715 648 694
Foundation Studies 808 723 606 626 788
Total 80,533 82,845 82,179 82,229 81,570
Student Fee-Type Enrolments (HE and VE load in % )
Higher Education
Government-funded 43 43 47 49 51
Australian fee-paying 6 6 5 5 5
International Onshore 22 22 20 18 18
International Offshore 18 17 16 16 16
Vietnam 11 12 12 11 10
Other 0 0 0 1 0.1
Vocational Education
Government-funded 71 72 73 77 77
Australian fee-paying 15 17 19 16 16
International Onshore 8 7 6 6 7
International Offshore 3 2 1 0 0
Other 3 2 2 1 0
Student Load
Student load EFTSL HE 38,985 40,423 41,475 44,169 45,510
Student contact hours VE 8,241,993 7,959,312 7,842,106 7,054,268 6,571,174
Award Completions
Higher Education 13,762 14,894 15,775 18,034 16,819
Postgraduate Research 207 231 233 297 277
Postgraduate Coursework 4,228 4,538 4,218 4,025 3,661
Undergraduate (including Associate Degrees
and Diplomas)
9,327 10,125 11,324 13,712 12,881
Vocational Education 6,497 6,590 6,662 6,384 5,635
Total 20,259 21,484 22,437 24,418 22,415
Graduate Outcomes % 2010 2011 2012 2013 2014 1
Higher Education (Domestic)
Student satisfaction 79.4 80.4 79.2 78.3 79.2
Graduates in full-time employment
76.2 77.6 74.3 69.1 65.8
Graduates in further full-time study
13.7 13.7 13.5 16.1 16.4
Vocational Education
Student satisfaction 80.8 85.4 86.6 86.0 85.4
Graduates in employment 79.7 78.5 74.4 77.2 69.6
Graduates in further study 46.3 40.1 45.5 44.1 53.6
Global, Urban and Connected 3
2010 2011 2012 2013 4 2014
Research
Research income from international sources—total
$1.8m $3.3m $2.4m $1.9m N/A
Research income from international sources—%
6.3% 8.5% 6.5% 5.0% N/A
Staff
HE International academic staff onshore
45.8% 44.0% 45.2% 46.7% 48.9%
HE Academic staff Level B and above holding PhDs
65.5% 67.6% 74.6% 77.4% 81.6%
Mobility
HE and VE student mobility uptake (onshore EFTSL)
3.9% 4.0% 4.1% 4.5% 3.2%
HE UG completions with a mobility experience
14.2% 15.3% 14.6% 14.6% 16.2%
HE and VE International students EFTSL
41.7% 41.9% 39.1% 38.2% 37.8%
International student ranking in QS World University Rankings
4th 6th 8th 12th 40th
Selectivity
HE UG and PG selectivity of coursework students (applications per place)
8.8 8.3 8.1 7.7 8.3
HE UG selectivity of coursework students (applications per place)
3.6 3.5 3.2 3.3 3.4
RMIT's global reputation with employers (HE) ranking in QS World University Ranking
76th 51st 75th 87th 79th
Industry
Industry scholarships $2.1 m $3.0 m $6.6m $5.0m $6.1m
Industry scholarships (student load EFTSL)
843.2 1,193.4 2,642.3 1,984.9 2,423.2
Commercial revenue from industry
$31.8m $35.0m $32.4m $30.7m $31.9m
Industry scholarships as a % of load (HE onshore EFTSL)
3.1% 4.2% 8.9% 6.2% 7.2%
1 Some 2014 indicators are provisional and will not be finalised until Q2 2015. HE and VE data excludes Foundation Studies and OUA unless specified. VE student load converted using Student Contact Hours/720.N/A: Not yet available UG: Undergraduate PG: Postgraduate
2 Non-award programs not elsewhere classified. 3 This represents a subset of RMIT’s Business Plan Indicators. 4 Some 2013 and historical values updated to reflect final position.
12

RMIT UNIVERSITY 2014 ANNUAL REPORT
Financial Performance
The consolidated 2014 net operating result for RMIT University and its subsidiaries was $75.5 million, continuing the strong results of recent years. RMIT University’s operating result was $71.2 million or 7.2 per cent of revenue.
For the consolidated group, revenue increased to $1078.3 million in 2014 from $1012.4 million in 2013. Expenditure increased to $998.9 million from $942.9 million, resulting in an operating result of $75.5 million after income tax. Cash balances for the group totalled $110.7 million.
The following comments refer to RMIT University only, unless specified otherwise.
Revenue increased to $988.5 million from $924.9 million. Australian Government Financial Assistance – including HECS-HELP and VET FEE-HELP – increased to $530.4 million from $484.9 million. Commonwealth research grants increased to $24.4 million from $23.4 million.
VE-specific State Government grants totalled $31.7 million, a decrease of $2.7 million on 2013, due to the change in State Government funding arrangements. VET FEE-HELP revenue increased to $20.0 million from $16.2 million.
Course fees and charges increased to $323.6 million from $307.6 million, or 5.2 per cent.
International fee-paying student revenue increased by 9.6 per cent (or $24.2 million) to $274.8 million.
Other fees and charges increased by 5.3 per cent to $11.5 million. Investment revenue increased slightly to $5.3 million from $4.8 million based on the amounts of funds available in short-term deposits. RMIT’s Council-approved investment policy ensures only high quality securities issued by prudentially safe institutions are utilised.
Expenditure increased by 4.7 per cent to $914.5 million from $873.1 million in 2013.
Employee benefits and on-costs increased by 8.4 per cent to $554.7 million, excluding the effect of deferred superannuation benefits. Salary increases were incurred according to the enterprise bargaining agreement. The average number of full-time equivalent staff in 2014 was 3665 – 97 higher, or an increase of 2.7 per cent, compared to the previous year.
Repairs and maintenance increased to $21.1 million from $15.1 million.
The operating result attributed to VE was a profit of $1.8 million, compared to a profit of $1.7 million in 2013. Revenue increased by 1.5 per cent to $158.3 million. State Government funding decreased by 7.8 per cent or $2.7 million. Total expenses increased by 1 per cent ($2.2 million) to $156.5.
Current assets decreased to $148.9 million from $156.8 million, with cash and cash equivalents decreasing by $5.6 million.
Current liabilities increased by $9.4 million mainly due to increases in provisions.
Capital expenditure was $156.2 million, compared to $102.2 million in 2013, with property-related capital expenditure being a large proportion of the total for the year.
In 2010 RMIT entered into an agreement with CBA for the provision of $225 million in long-term borrowings, with funds to be drawn down as per the agreement commencing Quarter 1, 2011. The total outstanding loan at the end of 2014 was $125.0 million, providing a major source of funds for the capital works program. A new borrowing agreement was negotiated at the end of 2014 to replace the existing facility, based on future funding requirements, for a total of $296 million. This will be drawn down from two banks, namely CBA and Westpac.
From a subsidiaries perspective, RMIT Vietnam delivered a profit of $2.7 million compared to $7.9 million in 2013 due to incremental investment in strategic initiatives in 2014.
RMIT Training delivered a minor loss of $0.7 million compared to a profit of $2.2 million in 2013. The 2014 loss included a $4 million donation to RMIT University.
RMIT Foundation delivered an operating result of $2.5 million compared to $8.2 million in 2013.
13

RMIT UNIVERSITY 2014 ANNUAL REPORT
In 2014, RMIT University made significant progress in the implementation of its Strategic Plan to 2015, Transforming the Future.
The Strategic Plan commits RMIT to be recognised as a global university of
technology and design, focused on creating solutions that transform the future
for the benefit of people and their environments. A key aspect in this vision
is that we will collaborate with partners to ensure the global impact of our
education and research, and will reach out through our presence in cities across
the world to make a difference.
The University’s Academic Plan, Transforming the Student Experience,
articulates our goal to facilitate excellent learning, refine our program offerings,
seek new educational partnerships and ensure strong student engagement and
employment.
Also supporting the Strategic Plan is our Research Plan, Impact Through
Innovation, which aims to increase the quality, scale and impact of our research
activity and outcomes. The Internationalisation Plan, Enabling RMIT’s Global
Aspirations, examines how we can bring international activity into alignment with
the University’s key priorities to establish a strong global presence by 2015.
This Report highlights key achievements, activities and highlights for the
University in 2014 against the three elements of our vision as encapsulated in
the Strategic Plan.
.
REPORT OF OPERATIONS14

RMIT UNIVERSITY 2014 ANNUAL REPORT
With 28,500 international students, of whom more than 17,000 are taught offshore (including almost 6300 at RMIT Vietnam), RMIT is a recognised global leader in international education.
RMIT’s global standing was reflected in the 2014 QS World University Rankings:
— 32nd in the world for the international profile of academic staff
— 40th in the world for the international profile of student cohort
— 79th in the world for employer reputation
— Among the world’s top 100 universities in Electrical Engineering, Mechanical Engineering, Accounting and Finance, and Computer Science and Information Systems
— Among the world’s top 200 universities in Civil and Structural Engineering, Communication and Media Studies, Psychology, Education, Law, and Economics and Econometrics.
In the QS Top 50 Under 50 index for 2014, RMIT was ranked 32nd in the world among universities less than 50 years old.
RMIT also has a 5-Star ranking in the QS Stars international evaluation system for excellence in teaching, engagement, facilities, infrastructure and student employability.
RMIT’s global reach includes:
— Two campuses in Vietnam. Since RMIT Vietnam was established in 2001 at the invitation of the Government of Vietnam, enrolments have grown to 6263 at campuses in Ho Chi Minh City and Hanoi.
— European centre. In 2013, RMIT opened a postgraduate research and industry collaboration centre in Barcelona, Spain.
— Offshore partnership programs. RMIT enrols 10,825 students through 18 partners in Singapore, Indonesia, Hong Kong, mainland China, Sri Lanka, Vietnam, Belgium, Spain and Germany.
— Onshore international students. RMIT has 11,400 international students – 24 per cent of our Australian campus student population.
— Student mobility. RMIT places significant emphasis on providing opportunities to gain overseas industry and clinical experience. All students have the chance to participate in international experiences including
student exchange, study tours, industry placements, research programs, internships and volunteering, as well as inter-campus opportunities at RMIT’s Melbourne and Vietnam campuses. More than 1500 Australian-based students took part in international mobility programs in 2014.
As well, RMIT enjoys research and industry partnerships on every continent, and recorded many highlights in 2014:
Indonesia The first students to study through RMIT’s partnership with Universitas Pelita Harapan in Indonesia graduated in September. The Diploma of Business students joined 3500 students who marked the end of their studies at RMIT graduation ceremonies in Kuala Lumpur, Singapore, Shanghai and Hong Kong.
Fiji In a cross-Pacific first, RMIT has partnered with Fiji National University and the Water Authority of Fiji to launch a new training and research hub. The Centre for Water and Energy Engineering will promote research, development and innovation in much-needed resource areas, and will provide top level training to staff at the Water Authority and other institutions in the region.
Global
RMIT aims to be global in attitude, action and presence, offering our students a global passport to learning and work.
International Centres at RMIT
— European Union Centre
— Australia APEC Study Centre
— Chinese Medicine Confucius Institute
— World Health Organization (WHO) Collaborating Centre for Traditional Medicine
— Global Compact Cities Programme
— Asia@RMIT
RMIT is also a research partner of UN Habitat Asia-Pacific.
Deputy Vice-Chancellor International Professor Andrew MacIntyre with one of RMIT’s first graduates in Indonesia.
Pro Vice-Chancellor Science, Engineering and Health, Professor Peter Coloe, at the opening of the Centre for Water and Energy Engineering in Fiji.
15

RMIT UNIVERSITY 2014 ANNUAL REPORT
Asia-Pacific— In 2014, the Department of Foreign Affairs and Trade
appointed the Australian APEC Study Centre at RMIT as Secretariat for Australian members of the APEC Business Advisory Council (ABAC). ABAC provides a platform for business to provide input to APEC leaders on regional financial market integration, trade and investment liberalisation, infrastructure development and supply chain connectivity. The Centre’s role as ABAC Secretariat puts RMIT in a leading position to support Australian efforts to promote regional economic integration.
— An innovative program supporting cultural immersion for Australian writers is expanding across the region after receiving $225,000 in funding. The Copyright Agency Cultural Fund will continue to support RMIT’s Writers Immersion and Cultural Exchange program until 2017, enabling 15 established, early career and emerging Australian writers to be awarded fellowships over the next three years. The announcement followed the fund’s support of a highly successful writers exchange held in Malaysia and Singapore early in 2014.
China— Research into the use of different metals in 3D
printing will be the focus of a new centre, a collaboration between RMIT and Chongqing University of Arts and Sciences. The key research node will be based at RMIT’s Centre for Additive Manufacturing. RMIT has invested $25 million on the establishment of its Advanced Manufacturing Precinct, and the Centre is the latest innovation to be housed there. The Centre is expected to attract HDR students as well as Australian and Chinese industry partners.
— RMIT will work with China’s Fengtai District Government to deliver teacher training in the region, which is home to 150 schools with more than 10,000 teachers and 100,000 students. RMIT English Worldwide will provide teachers with programs delivered in English that present the latest teaching methodologies to support them in their professional work. Under a further agreement, RMIT will deliver English teacher training to lecturers at Tongji University in Shanghai.
— In a study funded by the Australia-China Council, researchers from RMIT’s Centre for Sustainable Organisations and Work and the School of Management explored the focus and methods of community engagement adopted by Chinese firms in Australia, and the benefits derived by local communities. The researchers interviewed managers of Chinese companies and government officials, as well as visiting remote regions of Australia, meeting with community leaders in mid-west WA and north-west Tasmania.
MyanmarRMIT English Worldwide has established a new relationship with EduLink Australia to support the development of English language proficiency in Myanmar. The two organisations will work together to provide training for employees in the corporate sector and specialised English programs in the education sector of the developing country.
EuropeRMIT’s European Union Centre will strengthen its activities until the end of 2017, following the signing of a new funding agreement with the EU. The agreement allows the Centre to build on its academic outreach and exchange activities developed since its establishment in 2010, and will fund a Comparative Regional Policy Research Project, which provides a foundation for further international research and linkages.
GermanyRMIT’s GEElab (Games and Experimental Entertainment Laboratory) has expanded to Europe with a satellite laboratory based in Karlsruhe. In 2014, RMIT’s research into the near future for games, entertainment and creative media industries was showcased at key European forums. They included bizplay, a two-day symposium in Karlsruhe, the key Gamescomtrade fair in Cologne, and the Respawn: Gathering of Game Developers conference.
IrelandIn a global work-integrated learning project, Public Relations students travelled to Ireland to present an integrated marketing communications plan to the Dundalk Tourism authority. The students worked in virtual teams with Kirkwood Community College (Iowa, USA) and Dundalk Institute of Technology throughout the semester to develop strategies for increasing international and domestic tourism into Ireland and the Dundalk region.
UKRMIT’s Design Hub hosted The Future is Here, a touring exhibition created by London’s Design Museum. The exhibition charted the new industrial revolution, focusing on the shift in manufacturing that is changing how we produce, fund, distribute, buy and consume everything from cars to shoes. It included 14 design research projects, the majority from RMIT, which demonstrated the importance of speculation and prototyping to innovation and design within an international context.
APEC Business Advisory Council members John Denton, Mark Johnson and Anna Buduls brief Australian Prime Minister Tony Abbott.
The Future is Here exhibition charted the changing nature of manufacturing. Image courtesy of Matthew Sleeth and Claire Oliver Gallery, New York.
Internationally renowned architect Alisa Andrasek’s interactive installation Bloom was exhibited at RMIT’s Design Hub in conjunction with the exhibition. Image courtesy of Alisa Andrasek and Jose Sanchez.
16

RMIT UNIVERSITY 2014 ANNUAL REPORT
In a breakthrough for micro-fluidics, RMIT researchers have developed the world’s first liquid metal enabled pump, a revolutionary new micro-scale device with no mechanical parts. The unique design will enable micro-fluidics and lab-on-a-chip technology to realise their potential, with applications ranging from biomedicine to biofuels.
Inspired by nature’s own anti-turbulence devices – feathers – researchers from RMIT’s Unmanned Systems Research Team have developed an innovative system that mimics the way feathers help birds detect disturbances in the air and could spell the end of turbulence on flights (right). Flight testing on a micro plane showed the system significantly reduced the effects of turbulence and could result in longer life for aircraft.
RMIT has become a key academic partner in the UN’s Global Land Tool Network (GLTN), aimed at reducing poverty. GLTN was developed by UN-Habitat as an alliance of global, regional and national partners contributing to poverty alleviation through land reform, improved land management and security of tenure. RMIT is one of only three partners in the southern hemisphere.
A new agreement between RMIT and the Global Compact Cities Programme will strengthen efforts to tackle the world’s urban challenges, with RMIT committing $5 million in funding until 2019.
Hosted by RMIT in Melbourne since 2008, the Cities Programme is the urban component of the UN Global Compact and is dedicated to the promotion and adoption by cities of the initiative’s 10 principles on human rights, labour, environment and anti-corruption. Under the new agreement, the Cities Programme will aim to expand into the Asia-Pacific and double the number of signatory cities and states (currently 86).
In the lead up to the 2014 FIFA World Cup, RMIT researchers utilised the Aerodynamics Research Wind Tunnel at Bundoora campus to test the balls designed for Brazil’s higher altitude stadiums. The research compared the aerodynamics of the balls used at the last four FIFA World Cups.
RMIT staff and alumni dominated the Augmented Australia exhibition selection for the 2014 Venice Architecture Biennale. Six out of the 11 architectural practices selected are directed by either staff, alumni or current PhD researchers from RMIT. As well, short films made by RMIT students and alumni screened at the Cannes and St Kilda film festivals.
ABC News Breakfast presenter Michael Rowland hosted a forum at RMIT to identify the challenges and opportunities facing global business. The event brought together finance, technology, energy, social enterprise and media experts to explore the theme Designing Sustainable Business Models.
For the first time, a team from Singapore Institute of Management (SIM) was among the 10 finalists in the $100,000 RMIT Business Plan Competition. RMIT has delivered award programs in partnership with SIM for 27 years. As in 2013, the event was won by student entrepreneurs from RMIT Vietnam, and another Vietnam team took out second prize.
RMIT received a record $501,600 for outbound mobility grants through the New Colombo Plan Mobility Program. This was up from $88,000 in 2013, and placed RMIT among the most successful recipients in 2014. The funding covers five projects in China, India, Thailand and Vietnam to be delivered by mid-2016.
The Brazuca ball being tested in RMIT’s wind tunnel.
An image of the aircraft turbulence mitigation system being developed by RMIT researchers.
Business Plan Competition winners Vu Pham Ngoc Ha, Nguyen Thanh Tu and Nguyen Thuc Hien with Professor Ian Palmer, RMIT Pro Vice-Chancellor Business.RMIT Europe
In 2013, RMIT opened a postgraduate education, research and industry collaboration centre in Barcelona. Since that time, there has been significant progress in research, postgraduate programs, events in Europe and new projects.
A number of strategic projects are underway, notably:
— Barcelona KEY (Knowledge Economy Yard), an economic and knowledge cluster which fosters international investment projects in Barcelona and Catalonia, of which RMIT is the leading participating university
— research with UN Habitat
— development of research and PhD programs with Volvo Group and Siemens
— planned research and developing relations with Mistra Urban Futures
— a strategic relationship with Tecnalia in the Basque region of Spain, including research bidding, exchange of research staff and involvement in European innovation networks
There are also new strategic partnerships developing with universities across Europe, including:
— University of Barcelona, Universitat Ramon Llull (which includes ESADE) and Aalto University, Helsinki
— industry organisations including SEAT, Solvay, BMW, Volkswagen, Airbus, British Aerospace, Novartis, Audi, Google, Future Cities Catapult, European architecture practices and fashion companies
— European cities including Barcelona, Stockholm, London, Gothenburg and Bristol
17

RMIT UNIVERSITY 2014 ANNUAL REPORT
RMIT Vietnam is the centrepiece of RMIT’s global reach, with campuses in both Ho Chi Minh City and Hanoi catering for 6300 students in higher education and English language programs. In 2014, more than 1800 students graduated in ceremonies at the two campuses.
RMIT’s strong links with Vietnam were reinforced in 2014 during a visit from Vietnam’s Ambassador to Australia, Thanh Nghi Luong. Mr Luong visited the University as part of his first official visit to Victoria, and was briefed on plans to build on RMIT’s strong growth and ongoing success in Vietnam. Plans include expanded program offerings at the South Saigon campus which will bring RMIT in line with Vietman’s growing educational development needs.
Academic Building 2, which doubled the teaching space at the Saigon South campus when it opened in 2013, has been named a winner in the Vietnam Ministry of Construction’s Quality Construction Awards.
The prestigious biannual awards program assesses buildings against criteria such as sustainability, quality assurance, safe construction practices, fire protection and new technology. The building meets Australian five-star “green building” standards and was designed by Australian architectural firm Pentago Spowers International.
The building previously known as Academic Building 1 was named in 2014 after a former RMIT Vice-Chancellor and director of RMIT Vietnam, Emeritus Professor David Beanland AO. The Beanland Building at the South Saigon campus recognises Professor Beanland’s significant role as a founder and driver in the establishment RMIT Vietnam.
RMIT and KPMG Limited have come together to support good governance through an innovative new centre in the heart of Ho Chi Minh City. The KPMG-RMIT Centre of Governance will develop and disseminate industry-focused research, encouraging discussion at networking events and harnessing the knowledge of University students and academics.
The Centre will offer support and expertise to the business community including government and regulatory agencies, professional bodies, industry leaders and academics.
The 19th International Symposium on Logistics held at RMIT Vietnam provided a forum for discussion between leading academics, researchers and practitioners specialising in logistics and supply chain management. It was organised by Nottingham University’s Centre for Concurrent Enterprise, Cardiff Business School, the University of Hull and RMIT.
Also in 2014, Media and Communication students from Vietnam and Melbourne collaborated on a communication project at the Saigon South campus through an innovative cross-campus elective. The study tour was part of the 12-week Interdisciplinary Communication Project, which encourages intercultural awareness and industry engagement through the design and execution of communication campaigns.
A new global mobility model was trialled in 2014, which will see RMIT Vietnam included in all of RMIT’s exchange partnerships. It will provide students from partner universities with a unique opportunity to study at our Vietnam campuses, and will allow students from RMIT Vietnam access to a network of more than 150 partners in 40 countries.
Graduation celebrations at the Saigon South campus.
RMIT Vice-Chancellor Professor Gill Palmer watches as Vietnam’s Ambassador to Australia, Thanh Nghi Luong, signs the visitors book.
South Saigon campus.
RMIT Vietnam
Professor David Beanland AO and his wife Heather, the then RMIT Vice-Chancellor, Professor Margaret Gardner AO and RMIT Vietnam President Professor Gael McDonald.

RMIT UNIVERSITY 2014 ANNUAL REPORT
The University’s built infrastructure embodies its strategic vision, representing the future of urban campus excellence. Work is continuing on delivering the University’s Capital Development Program to provide a built environment that supports students and staff in delivering excellent learning and teaching, enabling innovative research outcomes and providing an enhanced student experience.
During the year, RMIT announced plans to transform the heart of its campus in central Melbourne, making the City campus an even better place to study, collaborate and work. The New Academic Street project will refurbish four 1970s buildings along Swanston Street, opening them to the streetscape and creating interconnected learning spaces, outdoor terraces, laneways and light wells. The Swanston Library, which attracts 9600 students a day, will undergo a major upgrade.
In 2014, a $1.2 million temporary urban landscaping project, A’Beckett Urban Square, opened to students, staff and the general community. The space has brought a new lease of life to the City campus, providing multi-use sporting courts, landscaping features, BBQ facilities, table tennis, WiFi, bike parking and a specially commissioned large-scale artwork. The Peter Elliott Architects-designed urban pop-up will temporarily occupy the 2800 square metre site, which is flagged for future development by RMIT.
The Swanston Academic Building continues to receive industry recognition. In 2014, it was named Best Public Building by the Property Council of Australia in its prestigious Innovation and Excellence Awards. The project was also a finalist for Best Sustainable Development and represented Victoria in the National Development of the Year category.
At the 2014 Victoria Engineering Excellence Awards, RMIT – together with engineers AECOM and the Bonacci Group – was presented with the Engineering Excellence Award in the Building and Structures category. The Swanston Academic Building was recognised for its technical complexity and elegant design features, with a particular focus on environmental design and smart automation features.
RMIT continued to support a range of learning, teaching and research initiatives in the area of innovation, urban development and sustainability.
A major achievement in 2014 was the launch of a new research facility which will drive cutting-edge advances in micro and nano technologies. The first of its kind in Australia, the MicroNano Research Facility enables undergraduate and postgraduate engineering students to study clean room operations and microfabrication. RMIT researchers are at the forefront of ground-breaking micro nano advances, including bendable electronics and clothing that can potentially incorporate smart devices.
The facility brings to Australia the world’s first rapid 3D nanoscale printer, capable of producing thousands of structures – each a fraction of the width of a human hair – in seconds. It will support projects that encompass the traditional disciplines of physics, chemistry, engineering, biology and medicine. The facility designed by SK Jacobs was a major refurbishment of the 31-year-old Microelectronics and Materials Technology Centre.
RMIT has also launched a new centre focusing on critical urban issues. The Centre for Urban Research will provide a home for interdisciplinary and policy-orientated research, with a strong capacity for collaboration with industry and government to help shape sustainable cities and draw inspiration from the opportunities they provide. It builds on the excellent reputation of the Australian Housing and Urban Research Institute at RMIT, established in 1999, which now sits within the new centre.
RMIT has invested in a state-of-the-art laboratory that will allow researchers to work with the aviation industry to develop and test a wide range of new technologies. The custom-designed simulation laboratory, developed in conjunction with SimRoom, will support research into communication, navigation, surveillance and avionics systems for manned and unmanned aircraft, as well as decision-support tools and human machine interfaces for air traffic controllers.
The $200,000 laboratory, at the Sir Lawrence Wackett Aerospace Centre in Bundoora, also features sophisticated eye and head tracking equipment that will allow researchers to study human performance in the monitoring and control of aircraft.
Urban
RMIT aims to be urban in orientation and creativity, shaping sustainable cities and drawing inspiration from the challenges and opportunities they provide.
RMIT A’Beckett Urban Square has made use of a vacant block behind the Swanston Academic Building.
The $30 million MicroNano Research Facility.
Former Education Minister Bronwyn Pike and Professor Robin Goodman launch the Centre for Urban Research.
19
RMIT UNIVERSITY 2014 ANNUAL REPORT
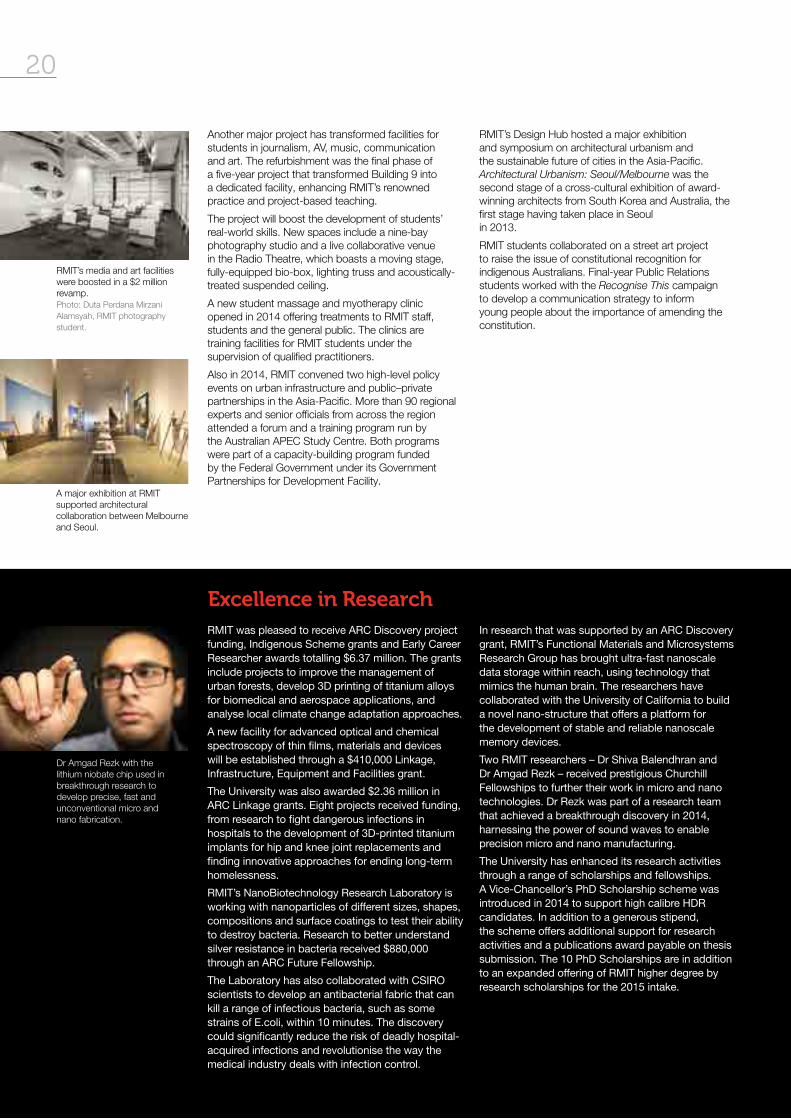
Another major project has transformed facilities for students in journalism, AV, music, communication and art. The refurbishment was the final phase of a five-year project that transformed Building 9 into a dedicated facility, enhancing RMIT’s renowned practice and project-based teaching.
The project will boost the development of students’ real-world skills. New spaces include a nine-bay photography studio and a live collaborative venue in the Radio Theatre, which boasts a moving stage, fully-equipped bio-box, lighting truss and acoustically-treated suspended ceiling.
A new student massage and myotherapy clinic opened in 2014 offering treatments to RMIT staff, students and the general public. The clinics are training facilities for RMIT students under the supervision of qualified practitioners.
Also in 2014, RMIT convened two high-level policy events on urban infrastructure and public–private partnerships in the Asia-Pacific. More than 90 regional experts and senior officials from across the region attended a forum and a training program run by the Australian APEC Study Centre. Both programs were part of a capacity-building program funded by the Federal Government under its Government Partnerships for Development Facility.
RMIT’s Design Hub hosted a major exhibition and symposium on architectural urbanism and the sustainable future of cities in the Asia-Pacific. Architectural Urbanism: Seoul/Melbourne was the second stage of a cross-cultural exhibition of award-winning architects from South Korea and Australia, the first stage having taken place in Seoul in 2013.
RMIT students collaborated on a street art project to raise the issue of constitutional recognition for indigenous Australians. Final-year Public Relations students worked with the Recognise This campaign to develop a communication strategy to inform young people about the importance of amending the constitution.
A major exhibition at RMIT supported architectural collaboration between Melbourne and Seoul.
RMIT’s media and art facilities were boosted in a $2 million revamp. Photo: Duta Perdana Mirzani Alamsyah, RMIT photography student.
Excellence in Research RMIT was pleased to receive ARC Discovery project funding, Indigenous Scheme grants and Early Career Researcher awards totalling $6.37 million. The grants include projects to improve the management of urban forests, develop 3D printing of titanium alloys for biomedical and aerospace applications, and analyse local climate change adaptation approaches.
A new facility for advanced optical and chemical spectroscopy of thin films, materials and devices will be established through a $410,000 Linkage, Infrastructure, Equipment and Facilities grant.
The University was also awarded $2.36 million in ARC Linkage grants. Eight projects received funding, from research to fight dangerous infections in hospitals to the development of 3D-printed titanium implants for hip and knee joint replacements and finding innovative approaches for ending long-term homelessness.
RMIT’s NanoBiotechnology Research Laboratory is working with nanoparticles of different sizes, shapes, compositions and surface coatings to test their ability to destroy bacteria. Research to better understand silver resistance in bacteria received $880,000 through an ARC Future Fellowship.
The Laboratory has also collaborated with CSIRO scientists to develop an antibacterial fabric that can kill a range of infectious bacteria, such as some strains of E.coli, within 10 minutes. The discovery could significantly reduce the risk of deadly hospital-acquired infections and revolutionise the way the medical industry deals with infection control.
In research that was supported by an ARC Discovery grant, RMIT’s Functional Materials and Microsystems Research Group has brought ultra-fast nanoscale data storage within reach, using technology that mimics the human brain. The researchers have collaborated with the University of California to build a novel nano-structure that offers a platform for the development of stable and reliable nanoscale memory devices.
Two RMIT researchers – Dr Shiva Balendhran and Dr Amgad Rezk – received prestigious Churchill Fellowships to further their work in micro and nano technologies. Dr Rezk was part of a research team that achieved a breakthrough discovery in 2014, harnessing the power of sound waves to enable precision micro and nano manufacturing.
The University has enhanced its research activities through a range of scholarships and fellowships. A Vice-Chancellor’s PhD Scholarship scheme was introduced in 2014 to support high calibre HDR candidates. In addition to a generous stipend, the scheme offers additional support for research activities and a publications award payable on thesis submission. The 10 PhD Scholarships are in addition to an expanded offering of RMIT higher degree by research scholarships for the 2015 intake.
Dr Amgad Rezk with the lithium niobate chip used in breakthrough research to develop precise, fast and unconventional micro and nano fabrication.
20

RMIT UNIVERSITY 2014 ANNUAL REPORT
Entrepreneur Brad Bond with gym users training with the Versus system, being developed by RMIT’s SportzEdge research program.
Associate Professor Vipul Bansal, Director of the new NanoBioSensing Facility at RMIT, which is being established with the support of a $500,000 Ian Potter Foundation 50th Anniversary Commemorative Grant.
Connected
RMIT is proud of the strong industry links it has forged over its 127-year history. Collaboration is integral to the University’s leadership in applied research and education, and to the development of highly skilled, globally focused graduates.
The University is focused nationally and globally across six broad sectors in which we have extensive expertise:
— Aerospace and Aviation— Automotive, Transport and Logistics— Built Environment, Construction and Infrastructure — Energy and Resources— Health and Community Services — Media and Communications
For each of these sectors, RMIT exhibits excellence in teaching, research and consultancy, and maintains strategic partnerships with key industry players, both locally and abroad.
Throughout 2014, RMIT continued to build on its engagement strategy and recorded many achievements.
— A new $1.25 million NanoBioSensing Facility will support the development of cheap, ultra-precise and easy-to-use nano devices for the rapid diagnosis and detection of health hazards. Research projects will include a nano-device that cuts diagnosis time of meningococcal from hours to minutes, an inexpensive tool for diagnosing malaria in developing countries, and devices for early-stage diagnosis of cancer and cardio-vascular diseases.
— The RMIT Health Sciences Research Hub was launched in 2014 to support multidisciplinary research into treatments for chronic diseases. The state-of-the-art facilities enable laboratory-based and clinical research in areas such as pharmacology; diabetes and obesity; respiratory, skin and sleep disorders; chronic pain and musculoskeletal disorders; and public health and health services.
— A new lab aims to provide a boost to the emerging data economy for Australian business. The $1.5 million NICTA RMIT Data Analytics Lab will foster a new generation of researchers as experts in big data and data analytics, and will promote collaborations with other research centres and industry partners, nationally and internationally, to enable local businesses to compete on a global scale.
— RMIT’s new Centre for Environmental Sustainability and Remediation is working with industries and research entities world-wide to address the sustainability of local and international communities. The team of world-renowned researchers includes environmental scientists, engineers and social scientists who work collaboratively to minimise the impact of land, water and air pollution.
— RMIT is one of the key participants in the new Australian Cooperative Research Centre for Space Environment Management, based at Mount Stromlo in the ACT. International and Australian space researchers and companies will work together to determine ways to monitor and potentially move space debris that put satellites at risk.
Enabled by a $20 million grant from the Federal Government’s Department of Industry, the CRC creates a high-tech consortium including some of the world’s leading space agencies. Researchers will be joined by experts from Optus, EOS Space Systems, NASA’s Ames Research Centre, Lockheed Martin, and Japan’s National Institute of Information and Communications Technology.
— RMIT is a core partner in the ARC’s new $38 million Centre of Excellence for Nanoscale BioPhotonics, which will develop novel techniques for studying individual cells within biological systems. Over a seven-year funding period, the Centre will bring together researchers from RMIT, Macquarie University and the University of Adelaide, in collaboration with key international, national and industry partners, to address the challenges of probing biological molecular processes on the nanometer scale.
— RMIT researchers will lead two major projects in the newly-opened ARC Research Hub for Australian Steel Manufacturing, which will focus on developing breakthrough process and product innovations to solve complex challenges confronting the steel industry.
— SportzEdge researchers received $62,500 through the Victorian Government’s Technology Voucher Program to work with industry in the development of an interactive system that quantifies fitness and links exercise with gaming. “Versus” uses 3D cameras, motion sensors and TV monitors to track a range of exercises through cost-effective, yet accurate, sensors embedded in the gym floor.
RMIT aims to be connected through active partnerships with professions, industries and organisations to support the quality, reach and impact of our education and research.
21

RMIT UNIVERSITY 2014 ANNUAL REPORT
— Meeting Melbourne’s future railway needs is the focus of a $1 million collaboration between RMIT and Metro Trains Melbourne. Metro will provide sponsorship for a Chair in Asset Management of Railway Infrastructure at RMIT, who will lead research into the remaining safe life of ageing railway infrastructure. RMIT will provide support for the research which will bring together different elements of the University’s civil, environmental, mechanical and manufacturing engineering expertise.
— RMIT is the lead agency in collaborative research which will receive $1.6 million in funding from the Department of Defence’s Capability Technology Demonstrator program. The research is developing a silent portable power supply based on a hydrogen fuel cell for defence units in the field.
— Three RMIT projects to find new ways to make maths more engaging for high school students received research funding totalling $1.47 million from the Australian Maths and Science Partnership Program.
— RMIT has celebrated 10 years of success in its collaboration with the Plumbing Trades Employees Union to provide plumbing apprenticeships for young people from Aboriginal communities across Australia. Under the specialised program, the PTEU funds indigenous apprentices to stay in Melbourne and complete their studies at RMIT. Since the program’s inception, the PTEU has found employment for 80 per cent of RMIT’s indigenous apprentice graduates.
In 2014, Plumbing teacher Wayne Ellerton from RMIT’s School of Vocational Engineering won a prestigious Wurreker Award in recognition of his contribution to indigenous education over the past seven years.
— A partnership with Banyule City Council has provided students with hands-on experience in environmental preservation. Through the program, Conservation and Land Management students undertake regular field trips to Melbourne’s north-east to explore natural bushland and undertake restoration projects for rare or threatened species. The importance of engagement with community members and local conservation groups is stressed.
— Two exhibitions at RMIT Gallery explored indigenous art of remote Western Australia, attracting capacity audiences. Stories of Christianity entwined with the mission history of Balgo from Warlayirti Artists provided a contrast to the Gija narrative of Dreaming Moon man from the neighbouring Warmun Art Centre in the Tanami desert.
— A collaboration between RMIT and the State Library of Victoria captured the family stories of the Somali community in Melbourne. The project was designed to preserve traditional Somali culture, which has a very strong oral focus that is slowly disappearing as younger generations become more attuned to written and visual media.
— The Centre for Design and Society partnered with Burbank Homes in 2014 to build a sustainable home that diverted 99 per cent of its waste away from landfill. Researchers from RMIT and the Housing Industry Association worked to identify, implement and assess design and waste avoidance strategies for the everyday construction, in a project funded through Sustainability Victoria’s Beyond Waste Fund.
— For four years, RMIT has engaged with the Sustainable Living Festival to offer the Green Innovators Competition, which provides a vehicle for students and graduates to present their ideas for a sustainable future. Industrial design graduate Radek Rozkiewicz was named 2014 Green Innovator of the Year with an innovative reimagining of his own socially-responsible kitchen that works without plumbing or power.
— RMIT has been awarded a 5-star rating by the Graduate Management Association of Australia for its MBA (Executive), one of only two such programs to received the top rating in 2014. The annual star rating is recognised across the nation as a rigorous quality assessment of the top Australian business schools.
— Through a partnership with the Transport Accident Commission, RMIT received a grant to investigate the development and application of assistive technology to help those with reduced abilities improve their quality of life and reduce their dependence on others. Researchers have developed a guidebook to help practitioners develop technologies for robotic wheelchairs and prostheses.
— A handbook authored by RMIT experts in sports technology and engineering was launched at the Design Hub together with the Australian Sports Technology Network and industry partners. The book is the first to offer a comprehensive review of contemporary sports technology and engineering, and of academic, professional and industrial knowledge and techniques.
— RMIT confirmed its position as an industry leader with outstanding results at the Fringe Furniture Festival. The open-access program, held in conjunction with Melbourne Fringe, unites local emerging and established designers over inspiring furniture, lighting and interior object design. In 2014, all five award winners, selected from more than 90 works, emanated from the RMIT industrial and furniture design community.
— RMIT fashion alumni led the field in the National Graduate Showcase at the Virgin Australia Melbourne Fashion Festival, with seven of the 12 featured in the event coming from Bachelor of Design (Fashion).
— Visual Merchandising students designed and installed a series of window displays to help Country Road celebrate its 40th birthday, in the latest outcome of the seven-year engagement between RMIT and the iconic retailer.
Dr Ysuf Omar, poet, researcher and peace activist, being interviewed for a Somali community project.
RMIT graduate RadekRozkiewicz was namedGreen Innovator for theIN Season kitchen.
Metro CEO, Andrew Lezala, and the then RMIT Vice-Chancellor, Professor Margaret Gardner AO, at the signing of an agreement aimed at improving Melbourne’s suburban railway.
Artists Eric Moora, Larry Gundora and Jimmy Tchooga, Chair of Warlayirti Artists, at RMIT Gallery.
22

RMIT UNIVERSITY 2014 ANNUAL REPORT
EquityRMIT offers more than 2000 scholarships to students, enabling those from diverse and disadvantaged backgrounds to fulfil their potential. However, every year there are significantly more eligible students applying than scholarships available.
In 2014, the University announced it will match donations to a new RMIT Scholarship Philanthropy Fund up to $10 million. The fund aims to dramatically increase the number of scholarships available for undergraduate and postgraduate students. The matched funding means that donors who give to scholarships will effectively double the impact of their donation, with 100 per cent of the funds raised going directly to students.
Donations to the new fund will be awarded as scholarships to disadvantaged and high achieving undergraduate and postgraduate students.
Developing collaborative partnerships with industry organisations also enables the University to support its students in their learning. RMIT’s relationship with iconic French design and retail company Daniel Hechter has led to the introduction of an annual scholarship in the Fashion Design and Technology program.
Student ExperienceRMIT Link offered students a wide range of sporting and cultural activities and events both on campus and externally.
A new Campus Store opened early in the year at the City and Bundoora campuses, with retail spaces offering textbooks and branded merchandise. An indoor garden featuring landscaping and comfortable seating was added at the City campus with the support of Greening RMIT, a student-run project which aims to create more green spaces and urban gardens.
Careers and Employment In 2014 RMIT launched its pioneering Jobs on Campus program to encourage and assist the employment of students within the University. Eighty students were employed through the program in its first year of operation.
The Global Careers and Employment Service worked with 750 graduating students through its Careers Health Check program. Mentoring programs were expanded to include RMIT Vietnam and Singapore Institute of Management as well as the Melbourne campuses, with 376 students linked with the business world.
Also during 2014, a work-integrated learning system, InPlace, was implemented to support all University schools and centres in sourcing and managing professional placement activities and delivering improved student experiences. The system is making it easier for employers and industry to deal with RMIT in providing work placement opportunities.
Learning and Teaching Global Learning by Design commenced this year with the aim of transforming RMIT courseware through innovative design and flexible delivery. As part of this three-year project, new and revised programs will be developed for multi-channel and multi-location delivery. Innovative curriculum design models and technology-enabled work-integrated learning experiences have been introduced, resulting in a wide range of options for all teaching staff.
A major three-year project funded through the Federal Government’s Higher Education Participation and Partnerships Program was completed in 2014. The Inclusive Teaching and Assessment Practices project developed six Principles for Inclusive Teaching and developed strategies, examples and resources for staff to incorporate into their own teaching. An Inclusive Conversation Series of professional development activities was attended by 1800 academic staff members, and an inclusive teaching pattern was developed as part of the Global Learning by Design project.
The University-wide project, Learning and Teaching for Sustainability (LTfS), continued to support curriculum development and renewal, professional development, learning and teaching recognition and course sustainability. The project produced a toolkit providing templates for program mapping and curriculum development, and a new professional development series, Sustainability: Enabling Graduates, was introduced. RMIT funding enabled two LTfS teaching fellowships and a new research project to be introduced.
RMIT continues to support the learning and teaching function by introducing and strengthening ongoing professional development programs. To support good teaching practices, peer review was introduced as a structured process to provide evidence for academic promotion and internal teaching awards.
Health, Safety and WellbeingIn a major strategic health initiative for the University, all three Australian campuses went smoke-free from Saturday 31 May, World No Tobacco Day. The move has been widely welcomed by staff and students. The message was promoted across the University community through a campaign “RMIT quits … why don’t you?” and a Breathe Easy competition. Staff were offered quit-smoking information sessions and workshops, and students can access tips on quitting smoking via the RMIT website.
In December, the Victorian University Tobacco-Free Working Group comprising nine universities including RMIT received a Victorian Health Promotion Foundation Award for the initiative to prevent tobacco use on campus.
RMIT lecturer Nevil Schultz with students Sam and Bree who helped create a “Noah’s Ark” for threatened species in Banyule’s 380 hectares of natural bushland.
Students and Staff
The RMIT Redbacks team of 230 students competed at the Australian University Games, winning 12 gold medals and attaining seventh place overall.
23
RMIT’s Melbourne campuses have gone smoke-free.

RMIT UNIVERSITY 2014 ANNUAL REPORT
RMIT’s health and safety team continued to align with the University’s strategic direction, including support for significant capital works programs. 2014 saw increased focus on risk management with particular emphasis on chemical, radiation and noise management, as well as a continued focus on injury management through effective delivery of programs and activities.
There was a significant reduction in the workers’ compensation premium as a result of an above industry average performance, and continued success of the University’s early intervention program. Work is continuing on enhancement of the OHS management system.
Appreciation awards again acknowledged safety initiatives throughout the University and the dedication of the 1000 volunteers who act as emergency wardens, first aiders and health and safety representatives.
Staff SatisfactionFollowing completion of an all-staff survey in 2013, action plans were developed to address the areas identified for improvement which included cross-unit cooperation, workload, entrepreneurship, career opportunities and processes. Progress is being tracked in advance of a further survey to be conducted in 2015.
Leadership CapabilityThe University’s commitment to developing leadership capabilities continued throughout 2014. A 360-degree feedback tool was introduced to 300 senior leaders in 2014 to support interpersonal leadership effectiveness and the development of individual capability plans.
A total of 341 staff members and senior managers from across the organisation took part in new People Management Essentials workshops.
As well, the University launched People Change Management workshops to strengthen its leaders’ capacity to managing change. These saw participation from 189 managers, who were given tools to implement a successful and sustainable change program.
Employment and Conduct PrinciplesRMIT has a comprehensive suite of policies and procedures to ensure that staff adhere to all legislative and regulatory requirements. Data is regularly captured and monitored on staff recruitment, performance and compliance matters. More information is available on the RMIT website at: http://www1.rmit.edu.au/policies
Employment Statistics – MelbourneStaff type Total FTE* Female FTE* % Female
2013 2014 2013 2014 2013 2014
Academic (HE) 1,624 1,742 647 694 40 40
Teaching (VET) 606 629 288 307 48 49
Professional 2,194 2,306 1,366 1,431 62 62
Executive 95 95 32 30 34 32
Total 4,519 4,772 2,333 2,462 52 52
New Staff Recruitments Female % Male % TotalAcademic (HE) 83 39.9 125 60.1 208
Teaching (VET) 12 33.3 24 66.7 36
Professional 221 60.5 144 39.5 365
Executive 1 12.5 7 87.5 8
Total 317 51.4 300 48.6 617
Data as at 31 December 2014
Employment Statistics – VietnamStaff type Total FTE* Female FTE* % Female
2013 2014 2013 2014 2013 2014
Academic (HE) 179 167 66 61 37 37
English language programs 122 106 43 35 35 33
Professional 327 367 214 245 65 67
President’s office 7 14 2 5 29 36
Total 635 654 325 346 51 53
Occupational Health and Safety2012 2013 2014
Lost time injury frequency rate 3.37 2.86 1.81
Change to previous year +51% -15% -37%
WorkCover claims submitted 49 38 32
Change to previous year +20% -22% -16%
OHS incident reports 364 413 426
Change to previous year +9% +13% +3%
WorkSafe notifiable incidents 11 6 13
Change to previous year -21% -45% +117%
WorkSafe improvement notices 0 3 0
Code of Conduct The Code of Conduct for Staff defines how RMIT’s values are demonstrated in the University’s day-to-day activities, and outlines the standards of behaviour expected by all members of the RMIT staff community. The Code of Conduct principles are as follows:
Respecting others When working with others, staff are expected to treat students, other staff and members of the community with respect for their rights and obligations.
Behaving professionally
Staff are expected to carry out their work duties in a professional and conscientious manner at all times.
Avoiding conflict of interest
Staff must take reasonable steps to avoid any actual or potential conflict of interest and act in the best interests of the University.
Using University resources
Staff are expected to use all University facilities, equipment and processes efficiently, carefully and in a proper manner.
Recognising intellectual freedom
Staff have a general right to intellectual freedom of enquiry and expression. This applies to areas of intellectual life over which the academic can demonstrate that they possess a level of expertise.
*FTE – full-time equivalent (two people both working 0.5 time fraction = 1 FTE)
24

RMIT UNIVERSITY 2014 ANNUAL REPORT
Student Diversity
2010 2011 2012 2013 2014 1
All Students %
Higher Education
Female 50 50 49 49 48
Male 50 50 51 51 52
International 52 51 49 47 45
Domestic 48 49 51 53 55
Vocational Education
Female 48 46 45 44 43
Male 52 54 55 56 57
International 8 6 5 5 5
Domestic 92 94 95 95 95
Age Group %
Higher Education
Young people 15-19 10 10 12 10 11
Aged 20-24 55 57 57 57 59
Mature age 25-44 32 30 28 30 27
Mature age 45+ 3 3 3 3 3
Vocational Education
Young people 15-19 26 30 31 31 29
Aged 20-24 32 32 32 31 33
Mature age 25-44 33 30 29 30 30
Mature age 45+ 9 9 9 8 8
Equity (Domestic) %
Higher Education (Undergraduate only)
School leavers 48 44 44 47 40
VE student admissions to HE 21 20 18 18 20
Overseas born 20 20 20 20 21
Non-English speaking background
5 5 5 6 6
Rural/remote 11 11 11 8 9
Low socio-economic status (postcode)
15 15 16 16 16
Aboriginal and Torres Strait Islanders
0.4 0.4 0.5 0.4 0.4
Vocational Education
School leavers 15 17 15 14 15
Overseas born 25 25 25 26 26
Non-English speaking background
9 9 10 10 10
Rural/remote 13 12 13 12 11
Low socio-economic status (postcode)
17 16 18 19 19
Aboriginal and Torres Strait Islanders
1.1 1.2 1.2 1.1 1.3
1 2014 data is provisional as at February 2015. Final data available April 2015. Figures are based on student enrolments and exclude OUA and Foundation Studies unless specified.
2 VE EFTSL converted using Student Contact Hours/7203 Multi-modal refers to both internal and external mode of attendance.
Student Fee-Type Enrolments (HE and VE Load in %)Student fee type HE VET Government-funded 51.1 77.0
Australian fee-paying 4.7 16.4
International Onshore 18.6 6.5
International Offshore 15.8 0.0
Vietnam 9.7 0.0
Indonesia 0.1 0.0
51.1%
18.6%
15.8%
9.7%
0.1%
4.7%
77.0%
16.4%
6.5%
HE VE
Age group HE % headcount
VE % headcount
Young people 15-19 11.2 28.8
Aged 20-24 58.6 32.9
Mature age 25-44 27.5 30.6
Mature age 45+ 2.7 7.8
28.8%
32.9%
30.6%
7.8%11.2%
58.6%
27.5%
2.7%
HE VE
2010 2011 2012 2013 2014 1
HE and VE Broad Field of Education (Load in EFTSL/EFTS) 2
Natural and Physical Sciences 2,201 3,363 3,593 3,996 4,119
Information Technology 3,440 4,141 3,911 3,863 3,912
Engineering and related technologies 7,541 6,656 7,035 7,021 7,055
Architecture and Building 3,536 3,245 3,307 3,244 3,589
Agriculture, Environment and related studies
365 333 355 390 403
Health 3,507 3,182 3,322 2,991 3,073
Education 1,482 1,282 1,285 1,434 1,447
Management and Commerce 17,800 13,948 13,621 15,048 14,744
Society and Culture 3,587 7,945 8,264 8,469 8,722
Creative Arts 5,968 6,572 6,815 6,881 7,074
Mixed field programs 1,006 811 859 630 498
Total 50,432 51,478 52,367 53,967 54,636
HE and VE Attendance Type/Mode
Full Time 45,646 47,210 48,674 50,928 52,892
Internal 42,427 43,410 44,197 46,489 47,955
Multi-modal 3
3,219 3,800 4,477 4,439 4,937
Part Time 25,596 25,022 23,757 22,781 21,264
Internal 25,077 24,441 23,087 22,059 20,544
Multi-modal 3
519 581 670 722 720
Distance/fully online 2,662 2,613 2,228 1,804 1,233
Open Universities Australia (OUA) 5,821 7,277 6,914 6,090 5,393
Foundation Studies (FS) 808 723 606 626 788
Total (HE, VE, OUA and FS) 80,533 82,845 82,179 82,229 81,570
25

RMIT UNIVERSITY 2014 ANNUAL REPORT
Sustainability and Resource Usage
RMIT is committed to incorporating sustainability principles and practices into learning and teaching, research and operational activities.
During the year, the University launched a $98 million Sustainable Urban Precincts Program across all the Melbourne campuses which will reduce electricity use over eight years by an estimated 239 million kilowatt hours, leading to a 30,000-tonne reduction in greenhouse gas emissions. Water use will be cut by an estimated 68 million litres. RMIT has worked with Siemens and Honeywell over the past two years to identify opportunities for energy and water savings in 90 buildings in the City, Bundoora and Brunswick campuses.
As well as contributing to global sustainability objectives, the program provides an interactive learning and teaching platform as it will be integrated into education and research so that students and staff can contribute to the process and learn from it.
Also in 2014, RMIT won three accolades including a prestigious international prize at the annual Green Gown sustainability awards
managed by Australasian Campuses Towards Sustainability. RMIT received the International Green Gown Award for Continuous Improvement – Institutional Change, for adopting a holistic approach
to sustainability; the Institutional Award of Excellence; and the Australasian Continuous Improvement Award.
A “living laboratory” project funded by the RMIT Sustainability Committee was highly commended in the Skills for Sustainability Award. The project involved landscape architecture students in designing, developing and evaluating green roofs and planting master plans for the City campus as a way of demonstrating best practice sustainable design for the City of Melbourne.
Since 2008, RMIT has committed to a target in partnership with the Australian Technology Network of Universities to reduce greenhouse gas emissions by 25 per cent by 2020, compared to 2007 as the base. To date, RMIT has met all interim targets and is on track to achieve the overall target by 2020.
Resource Usage 2007 2008 2009 2010 2011 2012 2013 2014Annual energy consumption per floor area (GJ/GFA*)
0.767 0.758 0.732 0.788 0.798 0.767 0.759 0.749
Water consumption per EFTSL (kl) 5.7 5.5 5.1 4.9 4.7 4.9 5.1 5.8Greenhouse gas emissions (t CO2-e) 79,124 70,548 61,414 63,890 64,608 65,053 65,192 64,402GreenPower consumption (MWh) 1,072 8,648 11,329 11,953 11,852 11,925 12,545 12,159
*GFA: Gross Floor Area.
2014
Reduction in emissions from 2007 baseline 19%
Reduction in energy per floor area from 2007 baseline 2%
RMIT’s new urban sustainability plan is the largest of its kind in the southern hemisphere.
239in electricity consumption
A total reduction of
million kWhFunding
million$4.8
in sustainableteachingand research
It would take Australia’s
million population23
That’s enough electricity to power
Upgrading
light fittings26,000
houses7,000 for years6
or power the Melbourne Metro train network for
hours54of non-stop bike riding
An annual reduction of
30,000tonnes CO e2
equivalent to plantingan area the size of Melbourne CBD with
enough to fill
6,000hot air balloons
77months
trees each year128,000
50%We’re replacing
2,000fixtures 425
million cups of coee
equivalent to That’s
million litres per year
saving
68 of Australia’s annualcoee consumption
www.rmit.edu.au/thinkgreen/suppFind out more
We are upgrading 90 buildings across 3 campuses to slash energy and water use, the largest program of its kind in the southern hemisphere.
to generate thesame amount ofelectricity savings
Going GreenSustainable Urban Precincts Program
26

RMIT UNIVERSITY 2014 ANNUAL REPORT
RMIT University is governed by a Council that in 2014 consisted of:
— the Chancellor— the Vice-Chancellor— the Chair of the Academic Board— four persons appointed by the Governor
in Council — one person appointed by the Minister— four persons appointed by Council
Consistent with the Royal Melbourne Institute of Technology Act 2010, as from time to time amended, the Council is the governing body of the University and has responsibility for the general direction and superintendence of the University.
Accordingly, Council members participate in approval of the University’s strategic direction, annual budget and business plan, and in monitoring the University’s performance. The Council appoints the Vice-Chancellor and President.
Members of Council, as required by legislation, have duly completed declarations of director-related transactions. No members of Council hold shares as nominees or beneficially in any statutory authority or subsidiary related to the University. Members of Council do not hold shares in RMIT (no shares are distributed by RMIT) or in related companies. Council members who are not staff of the University may choose to receive remuneration for being members of Council. RMIT does not make loans to Councillors or related parties of Councillors.
As part of its commitment to good governance practices, in 2003 the University Council adopted a charter containing broad governance principles. This charter is reviewed annually and was subject to review in 2014. Declarations received from Council members have indicated no conflict of interest or pecuniary interests other than remuneration disclosed in the financial statements.
RMIT has paid a premium for an insurance policy for the benefit of the directors and employees of RMIT and controlled entities of RMIT.
In accordance with its charter, the Council reviews its performance regularly. Arrangements are currently being made for review. As well as its regular meetings, Council had two strategic discussions in 2014, the first focusing on the impacts of regulatory change and the second on strategic priorities.
The Nomination and Remuneration Committee oversaw nominations to Council, its committees and subsidiaries, as well as induction and professional development for Councillors. In line with Victorian Government guidelines, optional remuneration was available for independent members of Council.
Based on Council’s governance charter, new members took part in an induction program, and all members were able to participate in a professional development program which covered a range of areas including informing members about stakeholder issues and the activities of the University.
Most controlled entities reviewed their statements of governance principles and reported on changes to the skills, experience and qualifications of directors, and on their frameworks for risk management and internal audit.
RMIT is compliant with the Voluntary Code of Best Practice for the Governance of Australian Universities.
UNIVERSITY GOVERNANCE
Governance
L to R: Dr Stephen Duckett, Professor David Hayward, Ms Rhonda O’Donnell, Mr Brett Paton, Ms Rosemary Lever, Mr Gary Hogan AM, Dr Ziggy Switkowski AO, Professor Gill Palmer, Professor Julianne Reid, Mr Bruce Akhurst, Ms Janet Latchford, Mr James Michelmore, Ms Amanda Way (Deputy University Secretary).
27

RMIT UNIVERSITY 2014 ANNUAL REPORT
Council Members in 2014
Mr Bruce AkurstAppointed by RMIT Council, member since 1 August 2013.Most recent appointment: 1 August 2013.BEc(Hons) (Monash), LLB.Other directorships: State Library of Victoria, Adstream Holdings Pty Ltd (Chair), Paul Ramsay Holdings Pty Ltd.
Dr Stephen DuckettAppointed by the Minister, member since 7 April 2014.Most recent appointment: 7 April 2014.DipEd(Tert) (DDIAE), DipLegStud (La Trobe), BEc (ANU), MHA, PhD, DSc (UNSW), DBA (Bath), FASSA, FAICD.Other directorships: Northern Melbourne Medicare Local, SA Health Performance Council.
Professor Margaret Gardner AOVice-Chancellor and President (ex-officio), member from 4 April 2005 to 1 September 2014.Most recent appointment: 4 April 2005.BEcon(Hons), PhD (Syd), DUniv (Griffith), FAIM, GAICD.Other directorships: Museums Board of Victoria (President), Office for Learning and Teaching’s Strategic Advisory Committee (Chair), Open Universities Australia, Fulbright Commission Advisory Board.
Professor David HaywardChair of the Academic Board (ex-officio), member since 11 February 2014.Most recent appointment: 11 February 2014.BA, GradDipUrbSoc (Swinburne), PhD (Monash), GAICD, MAIPA.
Mr Gary Hogan AM, CSCAppointed by Governor in Council, member since 13 October 2014.Most recent appointment: 13 October 2014.BA(Hons), Master of Defence Studies (UNSW).
Ms Janet LatchfordAppointed by Governor in Council, member since 18 May 2010. Most recent appointment: 1 January 2013.Deputy Chancellor since 8 September 2014.BCom (Melb), FCPA, GAICD.Other directorships: Epworth Healthcare (President), Epworth Research Institute (Chair), RCD Fund.
Ms Rosemary LeverAppointed by Governor in Council, member since 1 January 2005.Most recent appointment: 1 January 2012.Deputy Chancellor from 29 August 2011 to 31 December 2014. DipSocStudies, BSocWork(Hons) (Melb).Other directorships: Just Ideas, Adult Parole Board of Victoria, Melbourne IVF Human Research Ethics Committee.
Mr James MichelmoreAppointed by RMIT Council, member since 1 January 2014.Most recent appointment: 1 January 2014.AssDegEngTech(Mechanical) (RMIT), BEng(Automotive)(Hon) – current studies.Other directorships: RMIT University Student Union (President), National Union of Students.
Ms Rhonda O’DonnellAppointed by Governor in Council, member since 23 September 2008.Most recent appointment: 1 January 2013.GradDip (InnovServMgt), MAppSc (InnovServMgt) (RMIT), FAIM, MAICD, MAHRI.Other directorships: Slater & Gordon Ltd, Catapult Group International Ltd, O’Donnell Global Solutions.
Professor Gill PalmerVice-Chancellor and President (ex-officio), member since 1 September 2014.Most recent appointment: 1 September 2014.BSocSc(Hons) (Birmingham), MSc(Industrial Admin) (LSE), PhD (London City), GAICD.Other directorships: Open Universities Australia, The Cranlana Programme.
Mr Brett PatonAppointed by RMIT Council, member since 1 January 2013.Most recent appointment: 1 January 2013.BEc (Monash), ACA.
Professor Julianne ReidAppointed by RMIT Council, member since 7 May 2014.Most recent appointment: 7 May 2014.BPharm(Hons), PhD (Qld), MAICD.
Ms Moira SchulzeAppointed by Governor in Council, member from 1 January 2005 to 7 July 2014.Most recent appointment: 1 January 2012.BA, DipEd(Admin), MEd (Melb), GAICD, FIPAA.
Dr Ziggy Switkowski AOChancellor (ex-officio), member since 1 January 2011.Most recent appointment: 1 January 2011.BSc(Hons), PhD (Melb), FAICD, FTSE.Other directorships: NBN Co (Chair), Suncorp Ltd (Chair), Tabcorp Holdings Ltd, Oil Search Ltd.
28

RMIT UNIVERSITY 2014 ANNUAL REPORT
Council has established committees to assist it in discharging its responsibilities. Each committee had a work plan of activity to exercise its responsibilities in 2014, and all committees reported to Council on their activities.
Audit and Risk Management CommitteeThe Audit and Risk Management Committee acts on behalf of Council to monitor the audit controls and risk management of the University and associated processes. Its objectives are to assist Council in discharging its responsibilities to the University and its controlled entities with respect to:
— the integrity of the annual financial statements and financial reporting
— exposure to legal and business risk — the effectiveness of the external and internal
audit functions— the adequacy and effectiveness of financial
management, financial control systems and other internal controls
— the process for monitoring compliance with laws and regulations
— monitoring of compliance with the code of conduct.
Trust and Philanthropy CommitteeThe Trust and Philanthropy Committee provides oversight of philanthropic funds and donations received by the University and supports the University’s fundraising activities. The Committee:
— supports the University’s fund-raising strategy and the promotion and advocacy of its philanthropy-building activity
— sets and monitors an investment strategy for philanthropic funds and donations received by RMIT
— appoints and oversees the performance of an external asset consultant and funds manager to invest trust funds
— reports quarterly to Council on the investment and disbursement of philanthropic funds and donations
— reviews an annual report prepared on the administration and performance of the trusts for submission to Council
— monitors trust fund activities by:
— receiving regular reports from the University and external funds manager on the investment performance of philanthropic funds
— receiving regular reports from Management on trust funds’ disbursement in line with donor wishes
— noting signed bank statements of the trust funds
— sets RMIT’s annual amount for endowment distribution and oversees the disbursement of funds
— monitors compliance and risk including compliance with the RMIT Foundation Trust Deed, and general and specific-purpose trusts for which the University is trustee
— establishes sub-committees as required from time to time
— considers any matters referred to it by Council, and refers issues to Council that require decisions by Council as they arise
— considers any appropriate matters referred to it by Council or the Vice-Chancellor
— submits the minutes and/or a report of each Committee meeting to the next Council meeting
Nominations and Remuneration CommitteeThe Nominations and Remuneration Committee acts on behalf of Council to ensure Council and the Boards of RMIT-controlled entities have an effective balance of skills and experience and to monitor senior executive remuneration. The Committee meets to:
— recommend candidates for Council vacancies to Council or to the Minister for Training and Skills as appropriate to ensure the Council has an effective balance of relevant skills, experience and knowledge
— recommend to Council a person to be appointed or reappointed as Chancellor and Deputy Chancellor
— recommend to Council membership of Council committees and oversee the appointment of directors to RMIT-controlled entities
— recommend candidates to Council for honorary awards
— annually agree and monitor performance targets for the Vice-Chancellor
— annually decide on the quantum of the Vice-Chancellor’s performance bonus and total employment cost
— consider, when required, issues relating to the Vice-Chancellor’s contract and make recommendations to Council
— review and set total employment cost ranges for all executive staff
— review and approve the performance assessments and bonuses recommended by the Vice-Chancellor for the direct-report senior executives
— recommend the appointment and reappointment for more than 12 months of senior executive staff who report to the Vice-Chancellor
— provide advice to the Vice-Chancellor on executive performance appraisal mechanisms.
Council Committees
Attendance at Council and Committee Meetings 2014Name Council Audit and Risk
ManagementNominations and
RemunerationTrust and
Philanthropy
Bruce Akhurst 6/8
Stephen Duckett 6/6 4/4
Margaret Gardner 4/4 2/2
David Hayward 6/8
Gary Hogan 2/2
Janet Latchford 8/8 6/6 3/4 2/2
Rosemary Lever 6/8 4/4 0/2
James Michelmore 7/8
Rhonda O’Donnell 6/8
Gill Palmer 5/5 2/2 2/2
Brett Paton 7/8 5/6
Julianne Reid 5/5
Moira Schulze 3/4 3/3 1/2
Ziggy Switkowski 8/8 3/4
Notes— Professor Gardner’s term ended 1 September — Professor Palmer’s term commenced 1 September — Ms Schulze’s term ended 7 July — Mr Hogan’s term commenced 13 October — Dr Duckett’s term commenced 7 April— Professor Reid’s term commenced 7 May
29

RMIT UNIVERSITY 2014 ANNUAL REPORT
RMIT Subsidiaries
All University subsidiaries are governed by a Board of Directors which includes a member or members of the RMIT University Council. Financial performance, operational highlights and risk management are reported quarterly to Council.
RMIT Vietnam Holdings Pty LtdRMIT Vietnam Holdings is wholly owned by RMIT University and in turn owns RMIT International University Vietnam. It also accepts and transfers funds destined for RMIT International University Vietnam and philanthropic projects in Vietnam.
RMIT Vietnam Holdings was engaged in six separate projects in Vietnam on behalf of and funded by the Atlantic Philanthropies. These projects principally entailed the construction and development of four Learning Resource Centres, each of approximately 7500 square metres, at the Universities of Hue, Danang, Can Tho and Thai Nguyen. Other projects included the translation of the Dewey Decimal System into Vietnamese, the training of staff in Vietnam libraries through the National Task Force program, and the development of library resources in Vietnam.
Through RMIT Vietnam Holdings, Atlantic Philanthropies has provided funds for the establishment of a scholarship program for disadvantaged students studying at RMIT Vietnam campuses.
RMIT Spain SLRMIT Spain SL is the registered name of the company that establishes RMIT ‘s presence in Europe. It trades as RMIT Europe.
Since the formal opening of RMIT Europe in 2013, there has been significant progress in research, postgraduate programs, events in Europe and strategic projects. New relationships across Europe, placements in key EU networks and strengthening relations in Catalonia and Barcelona have all served to position RMIT strongly in Europe.
Five new postgraduate masters programs commenced in 2014, with eight programmed for commencement in 2015 and four for 2016. There are also five new or expanded PhD programs with currently close to 70 PhD students in Europe.
There are 70 new European research or research network proposals in progress for the period 2014 to the end of 2015. Up to the end of 2014, there were 16 applications submitted, of which 10 were successful, one was unsuccessful and five are awaiting determination.
More than 50 events (seminars, symposia, research workshops etc.) took place in 2014, with a further 50 planned for 2015 plus two European conferences. The Architecture and Design Practice Research Symposium in November was the largest in Europe so far, with 138 participants at the week-long event.
RMIT Training Pty Ltd RMIT Training is a company focused on two business activities: English language programs, and support for academic and professional communities through our Informit Collections and media products.
RMIT English Worldwide (REW) works closely with educational organisations and industry to provide English language programs. Partner organisations across Asia, Europe, Russia and the Middle East work with REW to help students and professionals improve their English. Notable international organisations such as the United Nations’ International Civil Aviation Organization recognise REW assessment and training.
REW also provides a pathway to RMIT University programs. Upon completion of REW’s English programs, students can enter RMIT programs directly, without having to complete further English testing.
The Informit Collections enable researchers to find Australasian content to support their research needs, as well as helping professionals access journals and literature related to specialist industries. EduTV, TVNews and educational media products support learning across the higher education sector.
Informit is accessible from all State and university libraries in Australia and from an increasing number of prestigious international institutions such as the British Library and Oxford University.
Supporting these activities is a Human Resource, Finance and IT team which provides specialised services for the online products and services the company provides. Production and Client Services teams also support the organisation. The latter includes administration for short and single courses offered by schools across RMIT University, which is provided as a donation service along with the University Press activity.
RMIT FoundationThe RMIT Foundation was established in 1994 to receive philanthropic gifts and donations made to RMIT University. RMIT Foundation is managed by a Board of Trustees whose actions are governed by a trust deed. The deed makes the trustees responsible for the prudent stewardship of the funds they invest and manage on behalf of RMIT University. The Board is also responsible for ensuring that donors’ wishes in making their gifts are met.
Trustees are appointed by RMIT Council. The Board counts among its numbers higher education, business and community leaders, and financial and legal experts.
The following are some examples of the funds that RMIT Foundation administers. The International Visiting Fellowship program provides critical support to internationally
engaged research, enabling scholars from around the world who are undertaking research in RMIT’s areas of strength to spend time with RMIT academic staff.
Similarly, the primary purpose of the RMIT Foundation International Research Exchange Fellowship program is to provide support for researchers at overseas partner institutions and at RMIT to make exchange visits in support of collaborative research. The John Storey Junior Memorial Fund allows undergraduate students to visit a sister institution overseas for a period of study. An industry research program, the Malcolm Moore Industry Research Award, encourages the development of applied research and strong links between RMIT and its industry partners.
The largest part of the Foundation’s funds are tied to specific scholarships, prizes, bursaries and grants. These programs support equity in access; overcoming individual financial hardship; excellence in many discipline areas; study and research overseas; presentation of high quality research; industry placements; and community leadership.
Spatial Vision Innovations Pty LtdSpatial Vision provides geospatial technology services for use in environmental, land, asset, emergency and health management to government and a growing range of private sector clients. Integrating geographic and organisational data, Spatial Vision provides award-winning solutions including business systems, advanced spatial analyses, reliable planning systems and practical mapping applications to address some of the country’s most pressing environmental, economic and resource issues.
In 2014, Spatial Vision implemented a new organisational structure to better reflect the needs of the company. This included an increased focus on business development, including the appointment of dedicated business development resources as well as campaigns targeting the company’s core competencies and a small number of new markets.
The importance of mobile and cloud technology continues to be a core consideration for the company, with significant projects undertaken in each of these areas. In 2014, the company commenced development of a number of new products in fisheries administration and market intelligence, for potential launch in 2015.
The company continues to be recognised for its innovation, winning awards at the Asia Pacific Spatial Excellence Awards and Victorian Spatial Excellence Awards for projects undertaken for the Department of Industry, Innovation, Climate Change, Science, Research and Tertiary Education and seven Victorian catchment management authorities, respectively.
30
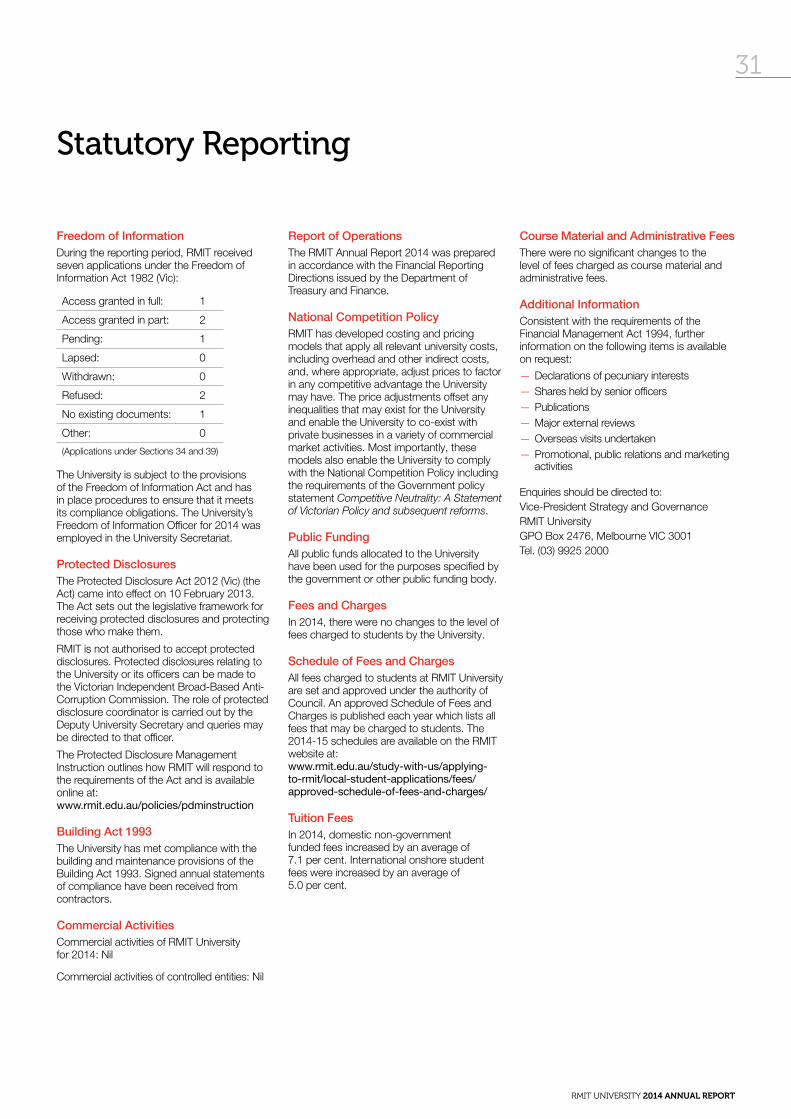
RMIT UNIVERSITY 2014 ANNUAL REPORT
Statutory Reporting
Freedom of InformationDuring the reporting period, RMIT received seven applications under the Freedom of Information Act 1982 (Vic):
Access granted in full: 1
Access granted in part: 2
Pending: 1
Lapsed: 0
Withdrawn: 0
Refused: 2
No existing documents: 1
Other: 0
(Applications under Sections 34 and 39)
The University is subject to the provisions of the Freedom of Information Act and has in place procedures to ensure that it meets its compliance obligations. The University’s Freedom of Information Officer for 2014 was employed in the University Secretariat.
Protected DisclosuresThe Protected Disclosure Act 2012 (Vic) (the Act) came into effect on 10 February 2013. The Act sets out the legislative framework for receiving protected disclosures and protecting those who make them.
RMIT is not authorised to accept protected disclosures. Protected disclosures relating to the University or its officers can be made to the Victorian Independent Broad-Based Anti-Corruption Commission. The role of protected disclosure coordinator is carried out by the Deputy University Secretary and queries may be directed to that officer.
The Protected Disclosure Management Instruction outlines how RMIT will respond to the requirements of the Act and is available online at: www.rmit.edu.au/policies/pdminstruction
Building Act 1993 The University has met compliance with the building and maintenance provisions of the Building Act 1993. Signed annual statements of compliance have been received from contractors.
Commercial Activities Commercial activities of RMIT University for 2014: Nil
Commercial activities of controlled entities: Nil
Report of Operations The RMIT Annual Report 2014 was prepared in accordance with the Financial Reporting Directions issued by the Department of Treasury and Finance.
National Competition Policy RMIT has developed costing and pricing models that apply all relevant university costs, including overhead and other indirect costs, and, where appropriate, adjust prices to factor in any competitive advantage the University may have. The price adjustments offset any inequalities that may exist for the University and enable the University to co-exist with private businesses in a variety of commercial market activities. Most importantly, these models also enable the University to comply with the National Competition Policy including the requirements of the Government policy statement Competitive Neutrality: A Statement of Victorian Policy and subsequent reforms.
Public FundingAll public funds allocated to the University have been used for the purposes specified by the government or other public funding body.
Fees and ChargesIn 2014, there were no changes to the level of fees charged to students by the University.
Schedule of Fees and ChargesAll fees charged to students at RMIT University are set and approved under the authority of Council. An approved Schedule of Fees and Charges is published each year which lists all fees that may be charged to students. The 2014-15 schedules are available on the RMIT website at: www.rmit.edu.au/study-with-us/applying-to-rmit/local-student-applications/fees/approved-schedule-of-fees-and-charges/
Tuition FeesIn 2014, domestic non-government funded fees increased by an average of 7.1 per cent. International onshore student fees were increased by an average of 5.0 per cent.
Course Material and Administrative FeesThere were no significant changes to the level of fees charged as course material and administrative fees.
Additional InformationConsistent with the requirements of the Financial Management Act 1994, further information on the following items is available on request:
— Declarations of pecuniary interests— Shares held by senior officers— Publications— Major external reviews— Overseas visits undertaken— Promotional, public relations and marketing
activities
Enquiries should be directed to: Vice-President Strategy and Governance RMIT University GPO Box 2476, Melbourne VIC 3001 Tel. (03) 9925 2000
31

RMIT UNIVERSITY 2014 ANNUAL REPORT
Risk Management and Internal Audit
The University has implemented a risk management framework that establishes a systematic process of identification, management and monitoring of risk. The framework is supported by:
— Council’s Audit and Risk Management Committee, which regularly monitors and reports to Council on the adequacy of arrangements in place to ensure that risks are effectively managed, and on the outcomes of risk management activities across the group
— a risk management policy that clearly articulates and assigns roles and responsibilities
— the annual review and update of a University-wide risk profile using outcomes from risk assessments that are undertaken by all academic and administrative areas as an integral part of the business planning process
— active management and monitoring by all academic and administrative areas during the year to ensure that appropriate mitigation measures are in place and that net risk exposures remain consistent with RMIT’s objectives and risk appetite
— the provision of risk management support, advice, assessment tools and training for University staff
— execution of the annual internal audit plan which is primarily concerned with evaluating the effectiveness of internal controls, and is risk-based to place greater emphasis on those areas of high risk to the University
— crisis management planning across all University campuses based on a risk management approach
— an insurance program that protects the University from financial loss as a result of physical loss of, or damage to, assets and activities, as well as injuries to University staff, students and third parties.
The University considers that this risk management framework is consistent with the Australian Risk Management Standard (AS/NZS ISO 31000:2009).
Objects of RMIT University
Extract from the RMIT Act 2010:
The objects of the University include:
(a) to provide and maintain a teaching and learning environment of excellent quality offering higher education at an international standard;
(b) to provide vocational education and training, further education and other forms of education determined by the University to support and complement the provision of higher education by the University;
(c) to undertake scholarship, pure and applied research, invention, innovation, education and consultancy of international standing and to apply those matters to the advancement of knowledge and to the benefit of the well-being of the Victorian, Australian and international communities;
(d) to equip graduates of the University to excel in their chosen careers and to contribute to the life of the community;
(e) to serve the Victorian, Australian and international communities and the public interest by:
(i) enriching cultural and community life
(ii) elevating public awareness of educational, scientific and artistic developments
(iii) promoting critical and free enquiry, informed intellectual discourse and public debate within the University and in the wider society;
(f) to use its expertise and resources to involve Aboriginal and Torres Strait Islander people of Australia in its teaching, learning, research and advancement of knowledge activities and thereby contribute to:
(i) realising Aboriginal and Torres Strait Islander aspirations
(ii) the safeguarding of the ancient and rich Aboriginal and Torres Strait Islander cultural heritage;
(g) to provide programs and services in a way that reflects principles of equity and social justice;
(h) to confer degrees and grant diplomas, certificates, licences and other awards;
(i) to utilise or exploit its expertise and resources, whether commercially or otherwise.
32

RMIT UNIVERSITY 2014 ANNUAL REPORT
Consultancies 2014
Vendor NameOrder
Amount ($)Invoiced
Amount ($)Further
Commitments ($)Description
KPMG 1,075,504 750,504 325,000 Various strategic advice
Quantum Information Technology Pty Ltd 532,300 532,300 Nil WIL system implementation
Memko Pty Ltd 516,690 516,690 Nil RAAF course development and training
ServiceNow Neder 484,585 484,585 Nil ServiceNow implementation and training
Red Design Group 490,900 475,700 15,200 Retail strategy
Pricewaterhouse Coopers 452,190 452,190 Nil Various strategic advice
EIC Growth Pty Ltd 315,051 315,051 Nil Entrepreneur in Residence
JDS Australia Pty Ltd 608,723 289,431 319,292 QA Governance 7 testing (ITS)
Nous Group Pty Ltd 288,891 274,391 14,500 Student experience enhancement
Turner & Townsend 267,075 267,075 Nil Project management office setup (NAS)
Digital Silver Pty Ltd 232,130 232,130 Nil Facilitatation of Vietnam training
DBM Consultants 212,729 206,831 Nil Market research
Executive Central Group 201,362 201,362 187,280 Coaching, mentoringand organisational support services
JK Vine Consulting 199,125 199,125 Nil Specialist IT testing
GPD Pty Ltd 190,654 190,654 Nil Hazardous materials consultancy
ShineWing Australia 213,302 188,302 25,000 Taxation and financial modelling advice
Risk Strategies Pty Ltd 212,119 187,031 25,088 Contractor safety management framework
The Knowledge Partnership 175,398 171,398 4,000 Market research and analysis
Strategic Project Partners 155,100 155,100 Nil Facilitation of CRC for Future Aviation bid
Consulting & Implementation Services 150,325 150,325 Nil Research Enterprise program
Lormax Consulting Pty Ltd 201,600 148,610 52,990 IT infrastructure strategy
Tribal Education Ltd 139,945 139,945 Nil International admissions project
Avaya Australia Pty Ltd 138,490 138,490 Nil United Communications project
Talent International (Vic) 132,412 132,412 Nil CareerHUB provisioning solution
Momentum Search and Selection 120,880 120,880 Nil Global Learning by Design project
Ernst & Young 116,818 116,818 Nil Market research services – Indonesia
Larkins Family Trust 105,000 105,000 Nil Indonesia offshore presence project
7,929,298 7,142,330 968,350
13 Consultancies of less than $100,000 855,068
0 Consultancies of less than $10,000
A complete list of all 2014 consultancies is available on the RMIT website at: www.rmit.edu.au/about/governance-and-management/governance/annual-reports
33

RMIT UNIVERSITY 2014 ANNUAL REPORT
Item No Source Reference Summary of Reporting Requirement Page(s)
STANDING DIRECTIONS OF THE MINISTER FOR FINANCE
1 SD 4.2(g) Report of Operations contains general information about the entity and its activities, highlights for reporting period and future initiatives and is prepared on a basis consistent with financial statements pursuant to the Financial Management Act 1994.
4–33
2 SD 4.2(h) Report of Operations is prepared in accordance with Financial Reporting Directions. 31
3 SD 4.2(j) Report of Operations is signed and dated by Chancellor or equivalent and includes date of Council Meeting at which Annual Report was approved.
2
4 SD 4.2(a) Financial Statements are prepared in accordance with:
— Australian Accounting Standards (AAS and AASB standards) and other mandatory professional reporting requirements; 38, 47
— Financial Reporting Directions; and 38, 47
— Business Rules. N/A
5 SD 4.2(b) Financial Statements available, including:
— Balance Sheet and income statement (Statement of Financial Position);
— Statement of Recognised Income and Expense (Income Statement);
— Cash Flows Statement; and
— Notes to the financial statements.
44
41
45
46–98
6 SD 4.2(c) Signed and dated statement by Accountable Officer stating that financial statements: 38
— Present fairly the financial transactions during reporting period and the financial position at end of the period;
— Were prepared in accordance with Standing Direction 4.2(c) and applicable Financial Reporting Directions, and
— Comply with applicable Australian Accounting Standards (AAS and AASB standards) and other mandatory professional reporting requirements.
7 SD 4.2(d) Financial Statements are expressed in the nearest dollar except where the total assets, or revenue, or expenses of the institution are greater than:
55
— $10,000,000, the amounts shown in the financial statements may be expressed by reference to the nearest $1,000; and
— $1,000,000,000, the amounts shown in the financial statements may be expressed by reference to the nearest $100,000.
8 SD 4.2(e) The financial statements were reviewed and recommended by the Audit Committee or Responsible Body prior to finalisation and submission.
2, 38–40
9 SD 4.5.5 Attestation on compliance with the Australian/New Zealand Risk Management Standard. 36
FINANCIAL REPORTING DIRECTIONS
10 FRD 03A Accounting for dividends N/A
11 FRD 07A Early adoption of authoritative accounting pronouncements 55–56
12 FRD 9A Administered assets and liabilities N/A
13 FRD 10 Disclosure Index 34–35
14 FRD 11 Disclosure of ex-gratia payments No ex-gratia payments
15 FRD 17B Long Service Leave wage inflation and discount rates 47, 53
16 FRD 19 Private Provision of Public Infrastructure N/A
17 FRD 21B Responsible Person and Executive Officer Disclosure in the Financial Report 91–94
18 FRD 22E Consultants – Report of Operations must include a statement disclosing:
1. Total number of consultancies over $10,000
2. Location of where details of these consultancies over $10,000 have been made publicly available
3. Total number of consultancies individually valued at less than $10,000 and the total expenditure for the reporting period and publication on university website, for each consultancy more than $10,000, of a schedule listing:
— Consultant engaged — Brief summary of project— Total project fees approved— Expenditure for reporting period— Any future expenditure committed to the consultant for the project
33
19 FRD 22E Manner of establishment and the relevant Minister 7, 27, 91
20 FRD 22E Objectives, functions, powers and duties 4, 7, 11, 27–29, 32
21 FRD 22E Nature and range of services provided including communities served 4-26
22 FRD 22E Organisational structure and chart, including accountabilities 10-11, 27-29
23 FRD 22E Names of Council members 28
24 FRD22E Operational and budgetary objectives, performance against objectives and achievements 12–26
25 FRD 22E Occupational health and safety statement including performance indicators, performance against those indicators, and how they affected outputs
24
34 DISCLOSURE INDEX

RMIT UNIVERSITY 2014 ANNUAL REPORT
26 FRD 22E Workforce data for current and previous reporting period including a statement on employment and conduct principles
24
27 FRD 22E Summary of the financial results for the year including previous 4 year comparisons 99–100
28 FRD 22E Significant changes in financial position during the year 13
29 FRD 22E Major changes or factors affecting performance 13
30 FRD 22E Post-balance sheet date events likely to significantly affect subsequent reporting periods 81
31 FRD 22E Summary of application and operation of the Freedom of Information Act 1982 31
32 FRD 22E Statement of compliance with building and maintenance provisions of the Building Act 1993 31
33 FRD 22E Statement on National Competition Policy 31
34 FRD 22E Summary of application and operation of the Protected Disclosure Act 2012 31
35 FRD 22E Statement, to the extent applicable, on the application and operation of the Carers Recognition Act 2012 (Carers Act), and the actions that were taken during the year to comply with the Carers Act
N/A
36 FRD 22E Summary of Environmental Performance 26
37 FRD 22E List of other information available on request from the Accountable Officer and which must be retained by the Accountable Officer (refer to list at (a) – (l) in the FRD)
31
38 FRD 24C Reporting of office-based environmental impacts 26
39 FRD 25B Victorian Industry Participation Policy in the Report of Operations N/A
40 FRD 26A Accounting for VicFleet Motor Vehicle Lease Arrangements on or after 1 February 2004 N/A
41 FRD 101 First time adoption 55–56
42 FRD 102 Inventories 50, 68
43 FRD 103E Non-current physical assets 52, 69–71
44 FRD 104 Foreign currency 48, 76–77
45 FRD 105A Borrowing Costs 53, 64, 72–74
46 FRD 106 Impairment of assets 41, 49, 51, 56, 64
47 FRD 107 Investment properties N/A
48 FRD 109 Intangible assets 52–53, 71
49 FRD 110 Cash Flow Statements 45
50 FRD 112D Defined benefit superannuation obligations 54, 81
51 FRD 113 Investments in subsidiaries, jointly controlled associates and entities 30, 48, 89–90
52 FRD 119A Transfers through contributed capital N/A
53 FRD 120H Accounting and reporting pronouncements applicable to the reporting period 55–56
54 FMA 1994 Financial Statements: 37–100
49 (a) — Contain such information as required by the Minister;
49 (b) — Are prepared in a manner and form approved by the Minister;
49 (c) — Present fairly the financial transactions of the university during the relevant financial year to which they relate;
49 (d) — Present fairly the financial position of the university as at the end of that year; and
49 (e) — Are certified by the accountable officer in the manner approved by the Minister
55 ETRA, s. 3.2.8 Statement on compulsory non-academic fees, subscriptions and charges payable in 2014 31
56 PAEC Financial and other information relating to the university’s international operations. 15–18, 89–90
57 UNIVERSITY COMMERCIAL ACTIVITY GUIDELINES
— Summary of the university commercial activities — If the university has a controlled entity, include the accounts of that entity in the university’s
Annual Report
30, 31
37–100
N/A – Not applicable
35
RMIT UNIVERSITY 2014 ANNUAL REPORT
36

ROYAL MELBOURNE INSTITUTE OF TECHNOLOGY AND SUBSIDIARIES 37
Notes to the Financial Statements 31 December 2014
Notes to the Financial Statements 31 December 2013
FINANCIAL STATEMENTS 37

38

ROYAL MELBOURNE INSTITUTE OF TECHNOLOGY AND SUBSIDIARIES 39

40

ROYAL MELBOURNE INSTITUTE OF TECHNOLOGY AND SUBSIDIARIES 41
Income Statement for the year ended 31 December 2014
Consolidated RMIT 2014 2013 2014 2013
Note $'000 $'000 $'000 $'000
Income from continuing operations
Australian Government financial assistance
Australian Government grants 3 308,965 295,194 308,965 295,194
HELP – Australian Government payments 3 221,445 189,657 221,445 189,657
State and Local Government financial assistance 4 31,686 34,393 31,686 34,393
HECS-HELP – Student payments 22,063 22,241 22,063 22,241
Fees and charges 5 409,824 386,505 335,064 318,558
Investment revenue 6 7,683 6,735 5,271 4,840
Consultancy and contracts 7 35,663 33,820 31,873 30,704
Other revenue 8 40,986 43,882 32,168 29,341
Total income from continuing operations 1,078,315 1,012,427 988,535 924,928
Expenses from continuing operations
Employee related expenses 9 607,932 557,254 554,754 511,667
Depreciation and amortisation 10 66,292 77,682 58,859 70,570
Repairs and maintenance 11 21,058 15,088 21,051 15,073
Borrowing costs 12 6,871 6,443 7,336 6,810
Impairment of assets 13 (4,077) 12,604 (4,277) 14,628
Other expenses 14 300,807 273,849 276,740 254,364
Total expenses from continuing operations 998,883 942,920 914,463 873,112
Net result before income tax 79,432 69,507 74,072 51,816
Income tax expense 17 3,833 2,450 2,873 1,744
Net result after income tax for the period 75,599 67,057 71,199 50,072
Net result attributable to non-controlling interest 32 (124) 320 – –
Net result attributed to RMIT entity 75,475 67,377 71,199 50,072
The above Income Statement should be read in conjunction with the accompanying notes.

42
Statement of Comprehensive Income for the year ended 31 December 2014
Consolidated RMIT 2014 2013 2014 2013
Note $'000 $'000 $'000 $'000
Net result after income tax for the periodItems that may be reclassified to profit or loss
75,599 67,057 71,199 50,072
Gain/(loss) on revaluation of available for sale financial assets, net of tax 30 1,678 (1,532) 44 –
Cash flow hedges, net of tax 30 (283) 116 (283) 116
Exchange differences on translation of foreign operations 30 6,206 8,264 – –
Total items that may be reclassified to profit or loss 7,601 6,848 (239) 116
Items that will not be reclassified to profit or loss
Gain/(loss) on revaluation of land, buildings and artworks, net of tax 30 171,886 – 171,886 –
Deferred government superannuation contributions 38 1,858 130,639 1,858 130,639
Deferred employee benefits for superannuation 38 (1,858) (130,639) (1,858) (130,639)
Increase in reserve due to deregistration of subsidiaries – 21 – –
Other adjustments – (21) – –
Total items that will not be reclassified to profit or loss 171,886 – 171,886 –
Total comprehensive income 255,086 73,905 242,846 50,188
Total comprehensive income attributable to non-controlling interest 32 (124) 320 – –
Total comprehensive income attributable to RMIT entity 254,962 74,225 242,846 50,188
The above Statement of Comprehensive Income should be read in conjunction with the accompanying notes.

ROYAL MELBOURNE INSTITUTE OF TECHNOLOGY AND SUBSIDIARIES 43
Statement of Changes in Equity for the year ended 31 December 2014
Reserves Retained Earnings Non-controlling Interest
Total
$’000 $’000 $’000 $’000
RMIT CONSOLIDATED ENTITY
Balance at 1 January 2013 628,628 924,047 534 1,553,209
Profit or (loss) – 67,377 (320) 67,057
Gain/(loss) on revaluation of available for sale financial assets, net of tax (1,532) – – (1,532)
Exchange differences on translation of foreign operations 8,264 – – 8,264
Revaluation of hedges 116 – – 116
Other adjustments 21 (21) – –
Balance at 31 December 2013 635,497 991,404 214 1,627,115
Balance at 1 January 2014 635,497 991,404 214 1,627,115
Profit or (loss) – 75,475 124 75,599
Gain/(loss) on revaluation of land, buildings and artworks, net of tax 171,886 – – 171,886
Gain/(loss) on revaluation of available for sale financial assets, net of tax 1,678 – – 1,678
Exchange differences on translation of foreign operations 6,206 – – 6,206
Revaluations of hedges (283) – – (283)
Other adjustments – 74 (60) 14
Balance at 31 December 2014 814,984 1,066,954 278 1,882,216
PARENT ENTITY
Balance at 1 January 2013 606,722 873,833 – 1,480,555
Profit or (loss) – 50,072 – 50,072
Revaluations of hedges 116 – – 116
Balance at 31 December 2013 606,838 923,905 – 1,530,743
Balance at 1 January 2014 606,838 923,905 – 1,530,743
Profit or (loss) – 71,199 – 71,199
Gain/(loss) on revaluation of land, buildings and artworks, net of tax 171,886 – – 171,886
Gain/(loss) on revaluation of available for sale financial assets, net of tax 44 – – 44
Revaluations of hedges (283) – – (283)
Balance at 31 December 2014 778,485 995,104 – 1,773,589
The above Statement of Changes in Equity should be read in conjunction with the accompanying notes.

44
Statement of Financial Position as at 31 December 2014
Consolidated RMIT 2014 2013 2014 2013
Note $'000 $'000 $'000 $'000
ASSETS
Current assets
Cash and cash equivalents 18 110,720 135,110 83,779 89,413
Receivables 19 49,534 52,794 53,553 56,958
Inventories 20 1,775 1,728 1,288 1,159
Other financial assets 22 28,132 17,250 – –
Other non-financial assets 25 12,410 11,138 10,308 9,280
Total current assets 202,571 218,020 148,928 156,810
Non-current assets
Receivables 19 313,274 315,830 313,210 315,894
Available for sale financial assets 21 54,037 28,001 3,960 –
Property, plant and equipment 23 2,095,275 1,832,345 2,041,257 1,780,696
Deferred tax asset 17 1,016 692 – –
Intangible assets 24 16,883 814 16,319 –
Other financial assets 22 158 2,162 2,532 2,536
Total non-current assets 2,480,643 2,179,844 2,377,278 2,099,126
Total assets 2,683,214 2,397,864 2,526,206 2,255,936
LIABILITIES
Current liabilities
Trade and other payables 26 134,195 131,242 83,333 85,287
Borrowings 27 – – 18,137 16,095
Provisions 28 130,656 118,794 129,237 117,378
Current tax liabilities 17 4,947 4,439 4,947 4,439
Other liabilities 29 73,109 76,234 59,991 63,066
Total current liabilities 342,907 330,709 295,645 286,265
Non-current liabilities
Borrowings 27 128,868 110,000 128,868 110,000
Provisions 28 328,916 329,638 328,104 328,928
Deferred tax liabilities 17 4 5 – –
Other liabilities 29 303 397 – –
Total non-current liabilities 458,091 440,040 456,972 438,928
Total liabilities 800,998 770,749 752,617 725,193
Net assets 1,882,216 1,627,115 1,773,589 1,530,743
EQUITY
RMIT entity interest
Reserves 30 814,984 635,497 778,485 606,838
Retained earnings 31 1,066,954 991,404 995,104 923,905
Total RMIT entity interest 1,881,938 1,626,901 1,773,589 1,530,743
Non-controlling interest 32 278 214 – –
Total equity 1,882,216 1,627,115 1,773,589 1,530,743
The above Statement of Financial Position should be read in conjunction with the accompanying notes.

ROYAL MELBOURNE INSTITUTE OF TECHNOLOGY AND SUBSIDIARIES 45
Statement of Cash Flows for the year ended 31 December 2014
Consolidated RMIT 2014 2013 2014 2013
Note $'000 $'000 $'000 $'000
Cash flows from operating activities
Australian Government Grants received 3(g) 495,117 473,723 495,117 473,722
OS-HELP (net) 561 (98) 561 (98)
Superannuation Supplementation 22,550 20,156 22,550 20,156
State Government Grants received 31,686 34,296 31,686 34,296
HECS-HELP – Student payments 22,063 22,241 22,063 22,241
Receipts from student fees and other customers 508,993 475,225 419,119 393,411
Dividends received 1,813 1,413 1,541 1,320
Interest received 5,187 4,897 3,802 3,561
Payments to suppliers and employees (inclusive of GST) (956,199) (875,440) (876,255) (828,755)
Interest and other costs of finance (6,822) (6,447) (7,287) (6,810)
GST recovered/(paid) 28,446 26,116 28,851 26,235
Income tax paid (2,802) (1,569) (2,365) (1,358)
Net cash provided by (used in) operating activities 35(b) 150,594 174,515 139,383 137,921
Cash flows from investing activities
Proceeds from sale of financial assets 6,000 36,658 – –
Proceeds from sale of property, plant and equipment 615 698 615 693
Payments for financial assets (36,986) (50,720) (3,900) –
Payments for intangible assets (17,503) (476) (17,377) –
Payments for property, plant and equipment (152,171) (90,258) (142,713) (83,296)
Net cash provided by (used in) investing activities (200,045) (104,098) (163,375) (82,603)
Cash flows from financing activities
Proceeds from borrowings 48,868 57,000 48,868 57,000
Loans from/(to) related parties 6 (770) (511) (925)
Repayment of borrowings (30,000) (102,000) (30,000) (102,000)
Net cash provided by (used in) financing activities 18,874 (45,770) 18,357 (45,925)
Net increase (decrease) in cash and cash equivalents (30,577) 24,646 (5,635) 9,393
Cash and cash equivalents at the beginning of the financial year
135,110 109,117 89,414 80,021
Effects of exchange rate changes on cash and cash equivalents
6,187 1,348 – –
Cash and cash equivalents at the end of the financial year 35(a) 110,720 135,110 83,779 89,414
The above Statement of Cash Flows should be read in conjunction with the accompanying notes.

46
Notes to the Financial Statements 31 December 2014
Contents of the Notes to the Financial Statements
Note Page
1 Summary of significant accounting policies 47
2 Disaggregation information 56
Income
3 Australian Government financial assistance 60
4 State and Local Government financial assistance 62
5 Fees and charges 62
6 Investment revenue and income 62
7 Consultancy and contracts 62
8 Other revenue and income 63
Expenses
9 Employee related expenses 63
10 Depreciation and amortisation 63
11 Repairs and maintenance 63
12 Borrowing costs 64
13 Impairment of assets 64
14 Other expenses 64
15 Significant items of revenue and expenditure 65
16 Sales of assets 65
17 Income tax 65
Assets
18 Cash and cash equivalents 66
19 Receivables 66
20 Inventories 68
21 Available for sale financial assets 68
22 Other financial assets 69
23 Property, plant and equipment 69
24 Intangible assets 71
25 Other non-financial assets 72
Liabilities
26 Trade and other payables 72
27 Borrowings 72
28 Provisions 74
29 Other liabilities 75
Equity
30 Reserves 76
31 Retained surplus 77
32 Non-controlling interest 77
33 Contingencies 77
34 Commitments 78
35 Notes to statement of cash flows 79
36 Economic dependency 80
37 Events occurring after the balance sheet date 81
38 Superannuation 81
39 Financial risk management 82
40 Fair value measurements 86
41 Subsidiaries 89
42 Related parties 90
43 Remuneration of auditors 91
44 Key management personnel disclosures 91
45 Acquittal of Australian Government financial assistance 94

ROYAL MELBOURNE INSTITUTE OF TECHNOLOGY AND SUBSIDIARIES 47
Notes to the Financial Statements 31 December 2014
1 Summary of significant accounting policies
The principal accounting policies adopted in the preparation of the financial statements are set out below. These policies have been consistently applied to all years reported, unless otherwise stated. The financial statements include statements for Royal Melbourne Institute of Technology (RMIT) as the parent entity and the consolidated entity consisting of RMIT and its subsidiaries.
The principal address of RMIT is Building 1, 124 La Trobe Street, Melbourne.
1.01 Basis of preparation
The annual financial statements represent the audited general purpose financial statements of Royal Melbourne Institute of Technology (RMIT). They have been prepared on an accrual basis and comply with the Australian Accounting Standards.
RMIT applies Tier 1 reporting requirements.
Additionally, the statements have been prepared in accordance with the following statutory requirements:
• Higher Education Support Act 2003 (Financial Statement Guidelines)
• Australian Accounting Standards Board (AASB) Interpretations
• Financial Management Act 1994
RMIT is a not-for-profit entity and these statements have been prepared on that basis. Some of the Australian Accounting Standards requirements for not-for-profit entities are inconsistent with the IFRS requirements.
Date of authorisation for issue
The financial statements were authorised for issue by the Council members of RMIT on 3 March 2015.
Historical cost convention
These financial statements have been prepared under the historical cost convention, as modified by the revaluation of available-for-sale financial assets, financial assets and liabilities (including derivative instruments) at fair value through profit or loss, certain classes of property, plant and equipment and investment property.
Critical accounting estimates
The preparation of financial statements in conformity with Australian Accounting Standards requires the use of certain critical accounting estimates. They also require management to exercise its judgment in the process of applying RMIT’s accounting policies. The estimates and underlying assumptions are reviewed on an ongoing basis.
The areas involving a higher degree of judgment, complexity or areas where assumptions and estimates are significant to the financial statements, are disclosed below:
Estimates assume a reasonable expectation of future events and are based on current trends and economic data, obtained both externally and within the group.
Key Estimates
Depreciation
Management uses external independent valuers to establish the useful life of buildings. Useful lives of other property, plant and equipment are established according to the guidelines provided by the Department of Treasury and Finance, the Australian Taxation Office and Australian Accounting Standards.
Amortisation of Intangible Assets
Management uses estimates of useful life to determine the amortisation of internally developed or acquired Intangible Assets.
Impairment
RMIT assess impairment at each reporting date by evaluating conditions specific to the group that may lead to impairment of assets. Where an impairment trigger exists, the recoverable amount of the asset is determined. Value-in-use calculations performed in assessing recoverable amounts incorporate a number of key estimates.
Long Service Leave Provision
In calculating long service leave provisions, management uses a combination of the bond rates issued by the Reserve Bank of Australia, the salary increases in accordance with the Enterprise Bargaining Agreement and the probability factors based on staff retention rates. The methodology is consistent with the Department of Treasury and Finance’s long service leave model.
Key Judgments – Provision for impaired receivables
Included in consolidated Accounts Receivable at 31 December 2014 are amounts receivable from customers and students amounting to $20.469m (2013 – $22.573m). The full amount of the debt is not recoverable and as such a doubtful debts provision amounting to $7.425m (2013 – $3.310m) has been set aside.
Comparative amounts
Where necessary, comparative information has been reclassified to enhance comparability in respect of changes in presentation adopted in the current year.

48
Notes to the Financial Statements 31 December 2014
1 Summary of significant accounting policies (continued)
1.02 Basis of consolidation
The consolidated financial statements incorporate the assets and liabilities of all subsidiaries of RMIT as at 31 December 2014 and the results of all subsidiaries for the year then ended. RMIT and its subsidiaries together are referred to in the financial statements as the Group or the consolidated entity.
Subsidiaries are all those entities (including special purpose entities) over which the Group has control. The Group has control over an investee when it is exposed, or has rights, to variable returns from its involvement with the investee and has the ability to affect those returns through its power over the investee. Power over the investee exists when the Group has existing rights that give it current ability to direct the relevant activities of the investee. The existence and effect of potential voting rights that are currently exercisable or convertible are considered when assessing whether the Group controls another entity. Returns are not necessarily monetary and can be only positive, only negative, or both positive and negative.
Subsidiaries are fully consolidated from the date on which control is transferred to the Group. They are de-consolidated from the date that control ceases.
The acquisition method is used to account for the acquisition of subsidiaries by the Group.
Intercompany transactions, balances and unrealised gains on transactions between Group companies are eliminated. Unrealised losses are also eliminated unless the transaction provides evidence of the impairment of the asset transferred. Accounting policies of subsidiaries have been changed where necessary to ensure consistency with the policies adopted by the Group.
Non-controlling interests in the results and equity of subsidiaries are shown separately in the consolidated income statement, statement of financial position and statement of changes in equity.
1.03 Foreign currency translation
(i) Functional and presentation currency
Items included in the financial statements of each of the Group’s entities are measured using the currency of the primary economic environment in which the entities operate (‘the functional currency’). The consolidated financial statements are presented in Australian dollars, which is RMIT’s functional and presentation currency.
(ii) Transactions and balances
Foreign currency transactions are translated into the functional currency using the exchange rates prevailing at the dates of the transactions. Foreign exchange gains and losses resulting from the settlement of such transactions and from the translation at year-end exchange rates of monetary assets and liabilities denominated in foreign currencies are recognised in the income statement.
If gains or losses on non-monetary items are recognised in other comprehensive income, translation gains or losses are also recognised in other comprehensive income. Similarly, if gains or losses on non-monetary items are recognised in profit or loss, translation gains or losses are also recognised in profit or loss.
(iii) Group companies
The results and financial position of all the Group entities (none of which has the currency of a hyperinflationary economy) that have a functional currency different from the presentation currency are translated into the presentation currency as follows:
— assets and liabilities for each statement of financial position presented are translated at the closing rate at the date of that statement of financial position;
— income and expenses for each income statement are translated at average exchange rates (unless this is not a reasonable approximation of the cumulative effect of the rates prevailing on the transaction dates, in which case income and expenses are translated at the dates of the transactions); and
— all resulting exchange differences are recognised as a separate component of equity.
On consolidation, exchange differences arising from the translation of any net investment in foreign entities, and of borrowings and other financial instruments designated as hedges of such investments, are accounted for by recognising the effective portion in other comprehensive income and the ineffective portion in the income statement. When a foreign operation is sold or any borrowings forming part of the net investment are repaid, the gain or loss relating to the effective portion of the hedge that has been recognised in other comprehensive income is reclassified from equity to the income statement as a reclassification adjustment.
1.04 Revenue recognition
Revenue is measured at the fair value of the consideration received or receivable. Amounts disclosed as revenue are net of returns, trade allowances, rebates and amounts collected on behalf of third parties.
The Group recognises revenue when the amount of revenue can be reliably measured, it is probable that future economic benefits will flow to the Group and specific criteria have been met for each of the Group’s activities as described below. In some cases this may not be probable until consideration is received or an uncertainty is removed. The group bases its estimates on historical results, taking into consideration the type of customer, the type of transaction and the specifics of each arrangement.
Revenue is recognised for the major business activities as follows:
(i) Government financial assistance
Grants from the government are recognised at their fair value where the Group obtains control of the right to receive the grant, it is probable that economic benefits will flow to the Group and it can be reliably measured.
(ii) Fees and charges
Fees and charges are recognised as income in the year of receipt, except to the extent that fees and charges relate to courses to be held in future periods. Such receipts is treated as income in advance in the statement of financial position. Conversely, fees and charges relating to current year courses are recognised as revenue in the income statement.
(iii) Investment income
Interest income is recognised as it accrues, taking into account the effective yield on the financial asset.
(iv) Consultancy and contracts
Contract revenue is recognised in accordance with the percentage of completion method. The stage of completion is measured by reference to labour hours incurred to date as a percentage of estimated total labour hours for each contract.

ROYAL MELBOURNE INSTITUTE OF TECHNOLOGY AND SUBSIDIARIES 49
Notes to the Financial Statements 31 December 2014
1 Summary of significant accounting policies (continued)
1.04 Revenue recognition (continued)
(v) Sale of non-current assets
The net profit or loss of non-current asset sales are included as revenue or expense at the date control of the asset passes to the purchaser, usually when an unconditional contract of sale is signed.
The gain or loss on disposal is calculated as the difference between the carrying amount of the asset at the time of disposal and the net proceeds on disposal.
(vi) Property rental (lease) income
Rental income from operating leases is recognised as income on a straight-line basis over the lease term.
(vii) Contribution of assets and donations
Contributions of assets and contributions to assist in the acquisition of assets, being non-reciprocal transfers, are recognised as revenue at the fair value of the asset received when the RMIT Consolidated Group gains control of the contribution.
1.05 Income tax
The income tax expense or income for the period is the tax payable/receivable on the current period’s taxable income based on the national income tax rate for each jurisdiction adjusted by changes in deferred tax assets and liabilities attributable to temporary differences between the tax bases of assets and liabilities and their carrying amounts in the financial statements, and to unused tax losses.
Deferred income tax is provided in full, using the liability method, on temporary differences arising between the tax bases of assets and liabilities and their carrying amounts in the consolidated financial statements. However, the deferred income tax is not accounted for if it arises from initial recognition of an asset or liability in a transaction (other than a business combination) that at the time of the transaction affects neither accounting nor taxable profit or loss. Deferred income tax is determined using tax rates (and laws) that have been enacted or substantially enacted by the balance sheet date and are expected to apply when the related deferred income tax asset is realised or the deferred income tax liability is settled.
Deferred tax assets are recognised for deductible temporary differences and unused tax losses only if it is probable that future taxable amounts will be available to utilise those temporary differences and losses.
Deferred tax liabilities and assets are not recognised for temporary differences between the carrying amount and tax bases of investments in controlled entities where the parent entity is able to control the timing of the reversal of the temporary differences and it is probable that the differences will not reverse in the foreseeable future.
Current and deferred tax assets and liabilities relating to the same taxation authority are offset when there is a legally enforceable right to offset current tax assets and liabilities and they are intended to be either settled on a net basis, or the asset is to be realised and the liability settled simultaneously.
Current and deferred tax balances attributable to amounts recognised outside profit or loss are also recognised outside profit or loss.
1.06 Leases
Leases in which a significant portion of the risks and rewards of ownership are retained by the lessor are classified as operating leases – note 34(b). Payments made under operating leases (net of any incentives received from the lessor) are charged to the income statement on a straight-line basis over the period of the lease.
1.07 Business combinations
The acquisition method is used to account for each business combination; this does not include a combination of entities or businesses under common control, the formation of a joint venture, or the acquisition of an asset or a group of assets. Identifiable assets acquired, liabilities assumed and any non-controlling interest are recognised separately from goodwill as of the acquisition date. Intangible assets acquired in a business combination are recognised separately from goodwill if they are separable, but only together with a related contract, identifiable asset or liability. Acquisition related costs are expensed in the periods in which they are incurred with the exception of costs to issue debt or equity securities, which are recognised in accordance with AASB132 and AASB139.
Identifiable assets acquired and liabilities and contingent liabilities assumed in a business combination are measured initially at their fair values at the acquisition date. Measurement of any non-controlling interest is recorded at fair value or the present ownership instruments proportionate share in the recognised amounts of the identifiable net assets. All other components of non-controlling interests are measured at their acquisition-date fair values. Contingent liabilities assumed are recognised as part of the acquisition if there is a present obligation arising from past events and the fair value can be reliably measured. The excess at the acquisition date of the aggregate of the consideration transferred, the amount of any non-controlling interest and any previously held equity interest over the net amounts of identifiable assets acquired and liabilities assumed is recognised as goodwill. If the cost of acquisition is less than the fair value of the identifiable net assets of the subsidiary acquired, the difference is recognised directly in the income statement, but only after a reassessment of the identification and measurement of the net assets acquired.
Consideration transferred in a business combination is measured at fair value. Where the business combination is achieved in stages, previously held equity interest is remeasured at its acquisition date fair value and the resulting gain or loss is recognised in profit or loss.
1.08 Impairment of assets
Intangible assets that have an indefinite useful life are not subject to amortisation and are tested annually for impairment. Other assets are reviewed for impairment whenever events or changes in circumstances indicate that the carrying amount may not be recoverable. An impairment loss is recognised for the amount by which the asset’s carrying amount exceeds its recoverable amount. The recoverable amount for most assets is measured at the higher of depreciated replacement cost and fair value less costs to sell. Recoverable amount for assets held primarily to generate net cash inflows is measured at the higher of the present value of future cash flows expected to be obtained from the asset and fair value less costs to sell. Non-financial assets that were previously impaired are reviewed for possible reversal of the impairment at each reporting date.
1.09 Cash and cash equivalents
For statement of cash flows presentation purposes, cash and cash equivalents includes cash on hand, deposits held at call with financial institutions, other short-term, highly liquid investments with original maturities of three months or less that are readily convertible to known amounts of cash and which are subject to an insignificant risk of changes in value, and bank overdrafts.

50
Notes to the Financial Statements 31 December 2014
1 Summary of significant accounting policies (continued)
1.10 Receivables
Trade receivables are recognised initially at fair value and subsequently measured at amortised cost using the effective interest method, less provision for impairment. Trade receivables are due for settlement no more than 120 days from the date of recognition, and no more than 30 days for other debtors.
Collectability of receivables is reviewed on an ongoing basis. Debts which are known to be uncollectible are written off. A provision for impairment of receivables is established when there is objective evidence that the Group will not be able to collect all amounts due according to the original terms of receivables. Significant financial difficulties of the debtor, probability that the debtor will enter bankruptcy or financial reorganisation, and default or delinquency in payments (more than 30 days overdue for trade and 45 days overdue for student related debt) are considered indicators that the receivable is impaired. The amount of the provision is the difference between the asset’s carrying amount and the present value of estimated future cash flows, discounted at the effective interest rate. Cash flows relating to short-term receivable are not discounted if the effect of discounting is immaterial. The amount of the provision is recognised in the income statement.
The carrying amount of the asset is reduced through the use of an allowance account and the amount of the loss is recognised in the income statement within ‘Bad and doubtful debts’. When a receivable is uncollectible, it is written off against the allowance account for trade /students receivables. Subsequent recoveries of amounts previously written off are credited against ‘Bad and doubtful debts’ in the income statement.
Estimated provision for doubtful debts is recorded based on the aged trial balance and the management judgement of debt recovery. Outstanding trade debts that are 90 days overdue are reviewed on an individual basis, and the provision is recorded based on the assessment of the individual debt and the possibility of the debt recovery. Student debts that are 90 days overdue are provided with 100% provision.
No provision is made for receivables from government and education sectors.
1.11 Inventories
Stock held for distribution
Stock held for distribution are stated at the lower of cost and net realisable value. Costs are assigned to individual items of inventory on the basis of weighted average costs. Costs of purchased inventory are determined after deducting rebates and discounts. Net realisable value is the estimated selling price in the ordinary course of business less the estimated costs of completion and the estimated costs necessary to make the sale.
Work in Progress
Services:
Valuation of Work in Progress - Services is based on the number of hours charged to project milestones in respect of incomplete and unbilled milestones. These hours are calculated at the average labour cost per billable hour, including on-costs, for the final quarter of the year. An allowance of 10% has been deducted for potential project overruns.
Products:
Valuation of Work in Progress – Products is based on the number of hours charged to project milestones net of budget overruns. These hours are valued at the average direct cost per billable hour.
1.12 Investments and other financial assets
Classification
The Group classifies its investments in the following categories: financial assets at fair value through profit or loss, loans and receivables, held-to-maturity investments, and available-for-sale financial assets. The classification depends on the purpose for which the investments were acquired. Management determines the classification of its investments at initial recognition and, in the case of assets classified as held-to-maturity, re-evaluates this designation at each reporting date.
(i) Financial assets at fair value through profit or loss
Financial assets at fair value through profit or loss include financial assets held for trading. A financial asset is classified in this category if acquired principally for the purpose of selling in the short term.
(ii) Derivatives
Derivatives are initially recognised at fair value on the date a derivative contract is entered into and are subsequently remeasured to their fair value. The method of recognising the resulting gain or loss depends on whether the derivative is designated as a hedging instrument, and if so, the nature of the item being hedged. RMIT designates certain derivatives as either; (1) hedges of the fair value of recognised assets or liabilities or a firm commitment (fair value hedge); or (2) hedges of highly probable forecast transactions (cash flow hedges).
(a) Fair value hedge
Changes in the fair value of derivatives that are designated and qualify as fair value hedges are recorded in the income statement, together with any changes in the fair value of the hedged asset or liability that are attributable to the hedged risk.(b) Cash flow hedge
The effective portion of changes in the fair value of derivatives that are designated and qualify as cash flow hedges is recognised in other comprehensive income. The gain or loss relating to the ineffective portion is recognised immediately in the income statement within other income or other expense.
Amounts that have been recognised in other comprehensive income are reclassified from equity to profit or loss as a reclassification adjustment in the periods when the hedged item affects profit or loss (for instance when the forecast sale that is hedged takes place). The gain or loss relating to the effective portion of interest rate swaps hedging variable rate borrowings is recognised in the income statement.
When a hedging instrument expires or is sold or terminated, or when a hedge no longer meets the criteria for hedge accounting, any cumulative gain or loss that has been recognised in other comprehensive income from the period when the hedge was effective shall remain separately in equity until the forecast transaction occurs. When a forecast transaction is no longer expected to occur, the cumulative gain or loss that was recognised in other comprehensive income shall be reclassified to profit or loss as a reclassification adjustment.
(c) Derivatives that do not qualify for hedge accounting
Certain derivative instruments do not qualify for hedge accounting. Changes in the fair value of any derivative instrument that does not qualify for hedge accounting are recognised immediately in the income statement.

ROYAL MELBOURNE INSTITUTE OF TECHNOLOGY AND SUBSIDIARIES 51
Notes to the Financial Statements 31 December 2014
1 Summary of significant accounting policies (continued)
1.12 Investments and other financial assets (continued)
(iii) Loans and receivables
Loans and receivables are non derivative financial assets with fixed or determinable payments that are not quoted in an active market. They are included in current assets, except for those with maturities greater than 12 months after the balance date which are classified as non-current assets. Loans and receivables are included in receivables in the statement of financial position.
(iv) Held-to-maturity investments
Held-to-maturity investments are non-derivative financial assets with fixed or determinable payments and fixed maturities that the Group’s management has the positive intention and ability to hold to maturity.
(v) Available-for-sale financial assets
Available-for-sale financial assets, comprising principally marketable equity securities, are non-derivatives that are either designated in this category or not classified in any of the other categories. They are included in non-current assets unless management intends to dispose of the investment within 12 months of the balance sheet date.
Regular purchases and sales of financial assets are recognised on trade-date – the date on which the Group commits to purchase or sell the asset. Investments are initially recognised at fair value plus transaction costs for all financial assets not carried at fair value through profit or loss. Financial assets carried at fair value through profit or loss are initially recognised at fair value and transaction costs are expensed in the income statement. Financial assets are derecognised when the rights to receive cash flows from the financial assets have expired or have been transferred and the Group has transferred substantially all the risks and rewards of ownership.
When securities classified as available-for-sale are sold, the accumulated fair value adjustments recognised in other comprehensive income are included in the income statement as gains and losses from investment securities.
Subsequent measurement
Available-for-sale financial assets and financial assets at fair value through profit and loss are subsequently carried at fair value. Loans and receivables and held-to-maturity investments are carried at amortised cost using the effective interest method. Gains or losses arising from changes in the fair value of the ‘financial assets at fair value through profit or loss’ category are included in the income statement within other income or other expenses in the period in which they arise.
Changes in the fair value of monetary security denominated in a foreign currency and classified as available-for-sale are analysed between translation differences resulting from changes in amortised cost of the security and other changes in the carrying amount of the security. The translation differences related to changes in the amortised cost are recognised in profit or loss, and other changes in carrying amount are recognised in equity. Changes in the fair value of other monetary and non-monetary securities classified as available-for-sale are recognised in equity.
Fair value
The fair values of quoted investments are based on quoted prices in an active market. If the market for a financial asset is not active (and for unlisted securities), the Group establishes fair value by using valuation techniques. These include reference to the estimated price in an orderly transaction that would take place between market participants at the measurement date, involving the same instruments or other instruments that are substantially the same, discounted cash flow analysis, and option pricing models refined to reflect the issuer’s specific circumstances.
Impairment
The Group assesses at each balance date whether there is objective evidence that a financial asset or group of financial assets is impaired. In the case of equity securities classified as available-for-sale, a significant or prolonged decline in the fair value of a security below its cost is considered in determining whether the security is impaired. If any such evidence exists for available-for-sale financial assets, the cumulative loss – measured as the difference between the acquisition cost and the current fair value, less any impairment loss on that financial asset previously recognised in profit and loss – is removed from equity and recognised in the income statement. Impairment losses recognised in the income statement on equity instruments are not reversed through the income statement. In applying AASB 139, two tests have been considered in determining whether the impairment entries are to be taken to equity: i. the decline is “substantial” (more than 20% below investment cost) and ii. “prolonged” (more than 12 months in that state). Failure to meet either test would require the impairment to be charged to the income statement.
1.13 Fair value measurement
The fair value of assets and liabilities must be measured for recognition and disclosure purposes.
The Group classifies fair value measurements using a fair value hierarchy that reflects the significance of the inputs used in making the measurements.
The fair value of assets or liabilities traded in active markets is based on quoted market prices for identical assets or liabilities at the balance sheet date (level 1). The quoted market price used for assets held by the Group is the most representative of fair value in the circumstances within the bid-ask spread.
The fair value of assets or liabilities that are not traded in an active market (for example, over the counter derivatives) is determined using valuation techniques. The Group uses a variety of methods and makes assumptions that are based on market conditions existing at each balance date. Quoted market prices or dealer quotes for similar instruments (level 2) are used for long term debt instruments held. Other techniques that are not based on observable market data (level 3) such as estimated discounted cash flows, are used to determine fair value for the remaining assets & liabilities. The fair value of interest rate swaps is calculated as the present value of the estimated future cash flows. The level in the fair value hierarchy is determined on the basis of the lowest level input that is significant to the fair value measurement in its entirety.
Fair value measurement of non financial assets is based on the highest and best use of the asset. The Group considers market participants use of, or purchase price of the asset, to use it in a manner that would be highest and best use. In light of AASB 13, the Group has reviewed the fair value principles as well as its current valuation methodologies in assessing the fair value, and the assessment has not materially changed the fair values recognised, eg. the depreciated value represents a reasonable estimate of fair value.
The carrying value less impairment provision of trade receivables and payables are assumed to approximate their fair values due to their short-term nature. The fair value of financial liabilities for disclosure purposes is estimated by discounting the future contractual cash flows at the current market interest rate that is available to the Group for similar financial instruments.

52
Notes to the Financial Statements 31 December 2014
1 Summary of significant accounting policies (continued)
1.14 Property, plant and equipment
Land and buildings are shown at fair value, based on periodic, but at least triennial, valuations by external independent valuers, less subsequent depreciation for buildings. Any accumulated depreciation at the date of revaluation is eliminated against the gross carrying amount of the asset and the net amount is restated to the revalued amount of the asset.
The last revaluation of land and buildings was performed at the end of 2014. The total revaluation adjustment was $171.9m consisting of a revaluation of land of $49.1m, a revaluation of buildings of $117.6m and a revaluation of artworks of $5.2m. The next full revaluation is due at the end of 2017. An assessment of land and buildings is performed every year apart from the full revaluation years and any variances greater than 10% are adjusted.
All other property, plant and equipment is relatively low in value, but represents a large proportion of the total volume of assets. Such assets are acquired and disposed of frequently, have short depreciable lives and subject to impairment tests as applicable. There is no evidence to indicate a fair value significantly different from depreciated cost and depreciated cost represents a reasonable approximation of fair value.
Subsequent costs are included in the asset’s carrying amount or recognised as a separate asset, as appropriate, only when it is probable that future economic benefits associated with the item will flow to the Group and the cost of the item can be measured reliably. All other repairs and maintenance are charged to the income statement during the financial period in which they are incurred.
Increases in the carrying amounts arising on revaluation of land and buildings are recognised, net of tax, in other comprehensive income and accumulated in equity under the heading of revaluation surplus. To the extent that the increase reverses a decrease previously recognised in profit or loss, the increase is first recognised in profit or loss. Decreases that reverse previous increases of the same asset are also firstly recognised in other comprehensive income before reducing the balance of revaluation surpluses in equity, to the extent of the remaining reserve attributable to the asset class; all other decreases are charged to the income statement. Upon disposal, any revaluation surplus relating to the particular asset being sold is transferred out to retained earnings.
An asset’s carrying amount is written down immediately to its recoverable amount if the asset’s carrying amount is greater than its estimated recoverable amount.
Gains and losses on disposals are determined by comparing proceeds with carrying amounts. These are included in the income statement. When revalued assets are sold, it is Group policy to transfer the amounts included in other reserves in respect of those assets to retained earnings.
Land and works of art are not depreciated. Depreciation of other assets is calculated using the straight line method to allocate their cost or revalued amounts, net of their residual values, over their estimated useful lives, as follows:
2014 2013
Years Years
Buildings 25 – 100 25 – 100
Equipment, motor vehicles, furniture and fittings 1.5 – 20 3 – 20
Leasehold improvements 2 – 51 2 – 51
Computer equipment 4 4
Library collections 3 – 10 10
The capitalisation threshold for plant, equipment, computers, motor vehicles and furniture and fittings to be recognised as an asset is $2,000 (2013: $2,000). The library collections are capitalised on an individual unit basis as they are considered to be significant in value as a collective group.
The assets’ residual values and useful lives are reviewed and adjusted if appropriate, at each balance sheet date.
1.15 Leasehold improvements
The cost of improvements to or on leasehold properties is amortised over the unexpired period of the lease or the estimated useful life of the improvement to the RMIT Consolidated Group, whichever is the shorter.
1.16 Intangible assets
(i) Research and development
Expenditure on research activities is recognised in the income statement as an expense, when it is incurred.
Expenditure on development activities, relating to the design and testing of new or improved products, are recognised as intangible assets when it is probable that the project will, after considering its commercial and technical feasibility, be completed and generate future economic benefits and its costs can be measured reliably. The expenditure capitalised comprises all directly attributable costs, including costs of materials, services, direct labour and an appropriate proportion of overheads. Other development expenditure is recognised in the income statement as an expense as incurred. Development costs previously recognised as an expense are not recognised as an asset in a subsequent period. Capitalised development expenditure is recorded as an intangible asset and amortised from the point at which the asset is ready for use. Amortisation is calculated using the straight-line method to allocate the cost over the period of the expected benefit, which varies from 4 to 20 years (2013: 4 to 20 years).
(ii) Intellectual property, trademarks and licences
Trademarks and licences have a finite useful life and are carried at cost less accumulated amortisation and impairment losses.
(iii) Other intangible assets
Other intangible assets that are acquired by the Group and have finite useful lives are measured at cost less accumulated amortisation and any accumulated impairment losses. The total amount of new internally developed intangible assets must be $500K or higher in order to be considered for capitalisation.
(iv) Subsequent expenditure
Subsequent expenditure is capitalised only when it increases the future economic benefits embodied in the specific asset to which it relates. All other expenditure is recognised in profit or loss as incurred.

ROYAL MELBOURNE INSTITUTE OF TECHNOLOGY AND SUBSIDIARIES 53
Notes to the Financial Statements 31 December 2014
1 Summary of significant accounting policies (continued)
1.16 Intangible assets (continued)
(v) Amortisation
Intangible assets are amortised on a straight-line basis in profit or loss over their estimated useful lives, from the date that they are available for use.
The estimated useful lives for the current and comparative years are as follows:
2014 2013
Years Years
Intellectual property, trademarks and licences 4 – 20 4 – 20
Capitalised development costs 2 – 5 2 – 5
Other intangible assets 3 3
Amortisation methods, useful lives and residual values are reviewed at each reporting date and adjusted if appropriate.
1.17 Trade and other payables
These amounts represent liabilities for goods and services provided to the Group prior to the end of financial year which are unpaid. The amounts are unsecured and are usually paid within 30 days of recognition.
1.18 Borrowings
Borrowings are initially recognised at fair value, net of transaction costs incurred. Borrowings are subsequently measured at amortised cost. Any difference between the proceeds (net of transaction costs) and the redemption amount is recognised in the income statement over the period of the borrowings using the effective interest method.
Borrowings are removed from the balance sheet when the obligation specified in the contract is discharged, cancelled or expired. The difference between the carrying amount of a financial liability that has been extinguished or transferred to another party and the consideration paid, including any non-cash assets transferred or liabilities assumed, is recognised in other income or other expenses.
Borrowings are classified as current liabilities unless the Group has an unconditional right to defer settlement of the liability for at least 12 months after the balance sheet date and does not expect to settle the liability for at least 12 months after the balance sheet date.
1.19 Borrowing costs
Borrowing costs incurred for the construction of any qualifying asset are expensed as incurred in accordance with Financial Reporting Directions 105A. All other borrowing costs are also expensed.
Exchange differences arising from foreign currency borrowings to the extent that they are regarded as an adjustment to interest costs are included in the definition of borrowing costs.
1.20 Provisions
Provisions for legal claims are recognised when the Group has a present legal or constructive obligation as a result of past events, it is probable that an outflow of resources will be required to settle the obligation and the amount has been reliably estimated. Provisions are not recognised for future operating losses.
Where there are a number of similar obligations, the likelihood that an outflow will be required in settlement is determined by considering the class of obligations as a whole. A provision is recognised even if the likelihood of an outflow with respect to any one item included in the same class of obligations may be small.
Provisions are measured at the present value of management’s best estimate of the expenditure required to settle the present obligation at the balance date. The discount rate used to determine the present value reflects current market assessments of the time value of money and the risks specific to the liability. The increase in the provision due to the passage of time is recognised as a finance cost.
1.21 Employee benefits
Provision is made for employee benefits and on-costs accumulated as a result of employees rendering services up to the reporting date. These benefits include wages and salaries, annual leave and long service leave.
(i) Short-term obligations
Liabilities for short-term employee benefits including wages and salaries, non-monetary benefits and profit-sharing bonuses are measured at the amount expected to be paid when the liability is settled, if it is expected to be settled wholly before 12 months after the end of the reporting period, and is recognised in other payables. Liabilities for non-accumulating sick leave are recognised when the leave is taken and measured at the rates paid or payable.
(ii) Other long-term obligations
The liability for long-term employee benefits such as annual leave, accumulating sick leave and long service leave is recognised in current provisions for employee benefits if it is not expected to be settled wholly before 12 months after the end of the reporting period. It is measured at the present value of expected future payments to be made in respect of services provided by employees up to the reporting date. Consideration is given to expected future wage and salary levels, experience of employee departures and periods of service. Expected future payments are discounted using market yields at the reporting date on national government bonds with terms to maturity and currency that match, as closely as possible, the estimated future cash outflows.
Regardless of the expected timing of settlements, provisions made in respect of employee benefits are classified as a current liability, unless there is an unconditional right to defer the settlement of the liability for at least 12 months after the reporting date, in which case it would be classified as a non-current liability.

54
Notes to the Financial Statements 31 December 2014
1 Summary of significant accounting policies (continued)
1.21 Employee benefits (continued)
(iii) Retirement benefit obligations
All employees of the Group are entitled to benefits on retirement, disability or death from the Group’s superannuation plans. The Group plans are either a defined benefit scheme or a defined contribution scheme. The defined benefit scheme provides defined lump sum benefits based on years of service and final average salary. The defined contribution scheme receives fixed contributions from Group and the Group’s legal or constructive obligation is limited to these contributions.
A liability or asset in respect of defined benefit superannuation plans is recognised in the balance sheet, and is measured as the present value of the defined benefit obligation at the reporting date less the fair value of the superannuation fund’s assets at that date and any unrecognised past service cost. The present value of the defined benefit obligation is based on expected future payments which arise from membership of the fund to the reporting date, calculated annually by independent actuaries using the projected unit credit method. Consideration is given to expected future wage and salary levels, experience of employee departures and periods of service.
Expected future payments are discounted using market yields at the reporting date on national government bonds with terms to maturity and currency that match, as closely as possible, the estimated future cash outflows.
Remeasurement gains and losses arising from experience and adjustments and changes in actuarial assumptions are recognised in the period in which they occur, directly in other comprehensive income. They are included in retained earnings in the statement of changes in equity and in the statement of financial position.
Past service costs are recognised in income immediately, unless the changes to the superannuation fund are conditional on the employees remaining in service for a specified period of time (the vesting period). In this case, the past service costs are amortised on a straight-line basis over the vesting period.
Contributions to the defined contribution fund are recognised as an expense as they become payable.
Further details are provided in note 38.
(iv) Deferred government benefit for superannuation
In accordance with the 1998 instructions issued by the Department of Education, Training and Youth Affairs (DETYA) now known as the Department of Education (Education), the effects of the unfunded superannuation liabilities of RMIT and its controlled entities were recorded in the Income Statement and the Statement of Financial Position for the first time in 1998. The prior years’ practice had been to disclose liabilities by way of a note to the financial statements.
The unfunded liabilities recorded in the balance sheet under provisions have been determined by actuary of the Victorian Government Superannuation Office and relate to the estimates of net liabilities at 30 June 2014. The methodology of measurement of the net liabilities is based on the following actuarial assumptions:
Economic 2014 2013
Discount Rate 4.1% pa 4.3% pa
Salary increase rate 4.0% pa 4.0% pa
Pension Indexation 2.5% pa 2.5% pa
The actuary currently believes, in respect of the long-term financial condition of the Fund, that assets as at 30 June 2014, together with current contribution rates, are not expected to be sufficient to provide for the current benefit levels for both existing members and anticipated new members if experience follows the “best estimate” assumptions or the more conservative “funding” assumptions.An arrangement exists between the Australian Government and the State Government to meet the unfunded liability for RMIT’s beneficiaries of the State Superannuation Scheme on an emerging cost basis. This arrangement is evidenced by the State Grants (General Revenue) Amendment Act 1987, Higher Education Funding Act 1988 and subsequent amending legislation. Accordingly, the unfunded liabilities have been recognised in the Statement of Financial Position under Provisions with a corresponding asset recognised under Receivables. The recognition of both the asset and the liability consequently does not affect the year end net asset position of RMIT.Deferred government benefits for superannuation are the amounts recognised as reimbursement rights as they are the amounts expected to be received from the Australian Government for the emerging costs of the superannuation funds for the life of the liability.
(v) Termination Benefits
Termination benefits are payable when employment is terminated before the normal retirement date, or when an employee accepts voluntary redundancy in exchange for these benefits. The Group recognises termination benefits when it is demonstrably committed to either terminating the employment of current employees according to a detailed formal plan without possibility of withdrawal or providing termination benefits as a result of an offer made to encourage voluntary redundancy. Benefits not expected to be settled wholly before 12 months after the end of the reporting period are discounted to present value.
(vi) Employee benefit on-costs
Employee benefit on-costs, including payroll tax and workcover, are recognised and included in employee benefit liabilities and costs when the employee benefits to which they relate are recognised as liabilities.
1.22 Goods and Services Tax (GST)
Revenues, expenses and assets are recognised net of the amount of associated GST, unless the GST incurred is not recoverable from the taxation authority. In this case it is recognised as part of the cost acquisition of the asset or as part of the expense.
Receivables and payables are stated inclusive of the amount of GST receivable or payable. The net amount of GST recoverable from, or payable to, the taxation authority is included with other receivables or payables in the statement of financial position and no GST is included on accruals.
Cash flows are included in the statement of cash flows on a gross basis. The GST components of cash flows arising from investing and financing activities which are recoverable from, or payable to, the taxation authority are classified as operating cash flows.
ROYAL MELBOURNE INSTITUTE OF TECHNOLOGY AND SUBSIDIARIES 55
Notes to the Financial Statements 31 December 2014
1 Summary of significant accounting policies (continued)
1.23 Repairs and maintenance
Repairs and maintenance costs are recognised as expenses as incurred, except where they relate to the replacement of a component of an asset, in which case, the costs are capitalised and depreciated. Other routine operating maintenance, repair and minor renewal costs are also recognised as expenses, as incurred.
1.24 Restructurings
A restructuring provision is recognised when the Group has developed a detailed formal plan for the restructuring and has raised a valid expectation in those affected that it will carry out the restructuring by starting to implement the plan or announcing its main features to those affected by it. The measurement of a restructuring provision includes only the direct expenditures arising from the restructuring, which are those amounts that are both necessarily entailed by the restructuring and not associated with the ongoing activities of the entity.
1.25 Contingent assets and contingent liabilities
Contingent assets and liabilities are not recognised in the statement of financial position, but are disclosed by way of a note (refer note 33) and, if quantifiable, are measured at nominal value. Contingent assets and liabilities are presented inclusive of the GST receivable or payable respectively.
1.26 Commitments
Commitments include those operating, capital and other outsourcing commitments arising from non-cancellable contractual or statutory sources and are disclosed at their nominal value and inclusive of the GST payable.
1.27 Rounding of amounts
Amounts in the financial statements have been rounded off in accordance with Class order 98/0100 as amended by Class order 04/667, issued by the Australian Securities and Investments Commission, relating to the ‘rounding off’ of amounts in the financial statements. Amounts have been rounded off to the nearest thousand dollars, or in certain cases, the nearest dollar.
1.28 New Accounting Standards and Interpretations
Certain New Accounting Standards and Interpretations have been published that are not mandatory for 31 December 2014. RMIT’s assessment of the impact of these new Standards and Interpretations is set out below:
Standard/Interpretation Application date Impact on financial reports2010-7 The amendments to other Australian Accounting Standards in AASB 2010-7 arise from the reissuance of AASB 9 in December 2010. In reissuing AASB 9 (December 2010), the derecognition requirements for financial instruments and the recognition and measurement requirements for financial liabilities were transferred from AASB 139. The only change to those requirements is that the portion of a change of fair value relating to the entity’s own credit risk for financial liabilities measured at fair value utilising the fair value option is required to be separately presented in other comprehensive income, except when that would create or enlarge an accounting mismatch. If such a mismatch would be created or enlarged, the entity is required to present all changes in fair value (including the effects of changes in the credit risk of the liability) in profit or loss. There were no changes to the main recognition and measurement requirements for financial liabilities.
1 January 2018 Further assessment is required based on the Financial Assets and Liabilities of the entity and Assets held for sale.
AASB 2014-1 Part D – AASB 14 permits first-time adopters to continue to account for amounts related to rate regulation in accordance with their previous GAAP when they adopt Australian Accounting Standards. However, to enhance comparability with entities that already apply Australian Accounting Standards and do not recognise such amounts, AASB 14 requires that the effect of rate regulation must be presented separately from other items. An entity that is not a first-time adopter of Australian Accounting Standards will not be able to apply AASB 14.
AASB 2014-1 Part D makes amendments to AASB 1 First-time Adoption of Australian Accounting Standards, which arise from the issuance of AASB 14 Regulatory Deferral Accounts in June 2014.
1 January 2016 Not applicable.
2014-1– Amendments to number of accounting standards. Various Further assessment is required. The full impact of the change has not been assessed in full.
2014-3 This Standard amends AASB 11 to provide guidance on the accounting for acquisitions of interests in joint operations in which the activity constitutes a business.
1 January 2016 Currently not applicable, further assessment will be required pending business activities and development of possible joint ventures. The assessment of implication should be included in Business Cases for joint ventures.

56
Notes to the Financial Statements 31 December 2014
1 Summary of significant accounting policies (continued)
1.28 New Accounting Standards and Interpretations (continued)
Standard/Interpretation Application date Impact on financial reports2014-4 –This Standard amends AASB 116 and AASB 138 to:
a) establish the principle for the basis of depreciation and amortisation as being the expected pattern of consumption of the future economic benefits of an asset;
(b) clarify that the use of revenue-based methods to calculate the depreciation of an asset is not appropriate because revenue generated by an activity that includes the use of an asset generally reflects factors other than the consumption of the economic benefits embodied in the asset; and
(c) clarify that revenue is generally presumed to be an inappropriate basis for measuring the consumption of the economic benefits embodied in an intangible asset. This presumption, however, can be rebutted in certain limited circumstances.
1 January 2016 This change may affect the principles of amortisation of Intangible Assets adopted by RMIT.
2 Disaggregation information (dual sector and/or operations outside Australia)
(a) Industries – Parent Entity
Operating revenue and expenses for the Higher Education and Vocational Education divisions of the university are shown in the following tables. The figures refer only to RMIT – consolidated totals are not included.
Higher
Education
VET Total
RMIT
Higher
Education
VET Total
RMIT
2014 2014 2014 2013 2013 2013
$’000 $’000 $’000 $’000 $’000 $’000
(i) Income Statement
Income from continuing operations
Australian Government financial assistance
Australian Government grants 273,948 35,017 308,965 262,193 33,094 295,287
HELP – Australian Government payments 201,421 20,024 221,445 173,458 16,199 189,657
State and Local Government financial assistance 57 31,629 31,686 – 34,300 34,300
HECS-HELP – Student Payments 22,063 – 22,063 22,241 – 22,241
Fees and charges 268,437 66,627 335,064 251,528 67,030 318,558
Investment revenue and income 4,628 643 5,271 4,226 614 4,840
Consultancy and contracts 30,423 1,450 31,873 28,660 2,044 30,704
Other revenue and income 29,282 2,886 32,168 26,692 2,649 29,341
Total income from continuing operations excluding deferred government superannuation contributions
830,259 158,276 988,535 768,998 155,930 924,928
Deferred government superannuation contributions 1,858 – 1,858 130,639 – 130,639
Total income from continuing operations 832,117 158,276 990,393 899,637 155,930 1,055,567
Expenses from continuing operations
Employee related expenses 454,826 99,928 554,754 415,871 95,796 511,667
Depreciation and amortisation 47,674 11,185 58,859 57,797 12,773 70,570
Repairs and maintenance 16,770 4,281 21,051 11,918 3,155 15,073
Borrowing costs 6,650 686 7,336 6,173 637 6,810
Impairment of assets (3,447) (830) (4,277) 12,138 2,490 14,628
Other expenses 235,529 41,211 276,740 215,032 39,332 254,364
Total expenses from continuing operations excluding deferred government superannuation contributions
758,002 156,461 914,463 718,929 154,183 873,112
Deferred employee benefits for superannuation 1,858 – 1,858 130,639 – 130,639
Total expenses from continuing operations 759,860 156,461 916,321 849,568 154,183 1,003,751
Operating result before income tax 72,257 1,815 74,072 50,069 1,747 51,816
Income tax expense 2,873 – 2,873 1,744 – 1,744
Operating result after income tax for the period 69,384 1,815 71,199 48,325 1,747 50,072

ROYAL MELBOURNE INSTITUTE OF TECHNOLOGY AND SUBSIDIARIES 57
Notes to the Financial Statements 31 December 2014
(ii) Statement of Comprehensive Income
Net result after income tax for the period 69,384 1,815 71,199 48,325 1,747 50,072
Gain/(loss) on revaluation of land, buildings and artworks, net of tax 140,528 31,358 171,886 – – –
Gain/(loss) on revaluation of available for sale financial assets, net of tax 44 – 44 – – –
Cash flow hedges (254) (29) (283) 104 12 116
Increase in reserves due to deregistration of subsidiary – – – – – –
Total comprehensive income 209,702 33,144 242,846 48,429 1,759 50,188
(iii) Balance sheet
ASSETS
Current assets
Cash and cash equivalents 75,186 8,593 83,779 62,819 26,594 89,413
Receivables 48,657 4,896 53,553 51,898 5,060 56,958
Inventories 1,030 258 1,288 927 232 1,159
Other non-financial assets 8,833 1,475 10,308 8,246 1,034 9,280
Total current assets 133,706 15,222 148,928 123,890 32,920 156,810
Higher
Education
VET Total
RMIT
Higher
Education
VET Total
RMIT
2014 2014 2014 2013 2013 2013
$’000 $’000 $’000 $’000 $’000 $’000
Non-current assets
Receivables 313,210 – 313,210 315,894 – 315,894
Available for sale financial assets 3,960 – 3,960 – – –
Property, plant and equipment 1,675,084 366,173 2,041,257 1,456,426 324,270 1,780,696
Intangible Assets 12,341 3,978 16,319 – – –
Other financial assets 2,532 – 2,532 2,536 – 2,536
Total non-current assets 2,007,127 370,151 2,377,278 1,774,856 324,270 2,099,126
Total assets 2,140,833 385,373 2,526,206 1,898,746 357,190 2,255,936
LIABILITIES
Current liabilities
Trade and other payables 67,068 16,265 83,333 68,632 16,655 85,287
Borrowings 18,137 – 18,137 16,095 – 16,095
Provisions 110,403 18,834 129,237 99,962 17,416 117,378
Current tax liabilities 4,947 – 4,947 4,439 – 4,439
Other liabilities 55,932 4,059 59,991 50,487 12,579 63,066
Total current liabilities 256,487 39,158 295,645 239,615 46,650 286,265
Non-current liabilities
Borrowings 115,594 13,274 128,868 99,000 11,000 110,000
Provisions 324,986 3,118 328,104 326,068 2,860 328,928
Total non-current liabilities 440,580 16,392 456,972 425,068 13,860 438,928
Total liabilities 697,067 55,550 752,617 664,683 60,510 725,193
Net assets 1,443,766 329,823 1,773,589 1,234,063 296,680 1,530,743
2 Disaggregation information (continued)
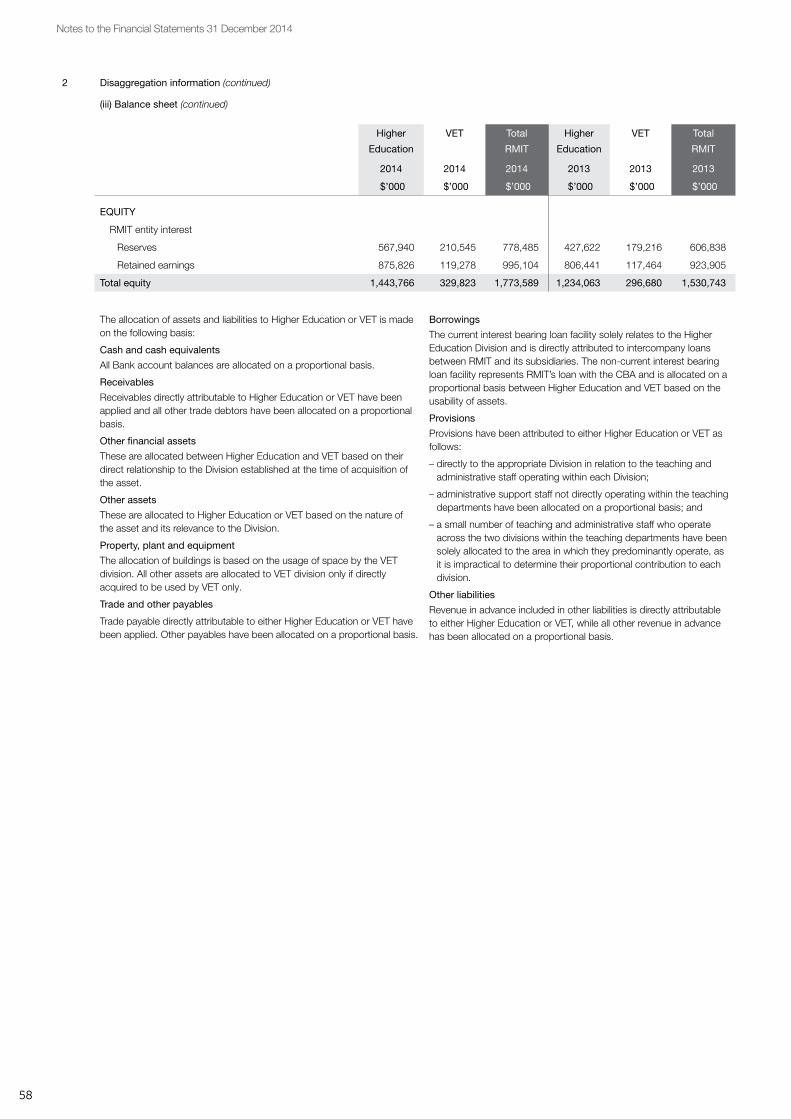
58
Notes to the Financial Statements 31 December 2014
2 Disaggregation information (continued)
(iii) Balance sheet (continued)
Higher
Education
VET Total
RMIT
Higher
Education
VET Total
RMIT
2014 2014 2014 2013 2013 2013
$’000 $’000 $’000 $’000 $’000 $’000
EQUITY
RMIT entity interest
Reserves 567,940 210,545 778,485 427,622 179,216 606,838
Retained earnings 875,826 119,278 995,104 806,441 117,464 923,905
Total equity 1,443,766 329,823 1,773,589 1,234,063 296,680 1,530,743
The allocation of assets and liabilities to Higher Education or VET is made on the following basis:
Cash and cash equivalents
All Bank account balances are allocated on a proportional basis.
Receivables
Receivables directly attributable to Higher Education or VET have been applied and all other trade debtors have been allocated on a proportional basis.
Other financial assets
These are allocated between Higher Education and VET based on their direct relationship to the Division established at the time of acquisition of the asset.
Other assets
These are allocated to Higher Education or VET based on the nature of the asset and its relevance to the Division.
Property, plant and equipment
The allocation of buildings is based on the usage of space by the VET division. All other assets are allocated to VET division only if directly acquired to be used by VET only.
Trade and other payables
Trade payable directly attributable to either Higher Education or VET have been applied. Other payables have been allocated on a proportional basis.
Borrowings
The current interest bearing loan facility solely relates to the Higher Education Division and is directly attributed to intercompany loans between RMIT and its subsidiaries. The non-current interest bearing loan facility represents RMIT’s loan with the CBA and is allocated on a proportional basis between Higher Education and VET based on the usability of assets.
Provisions
Provisions have been attributed to either Higher Education or VET as follows:
– directly to the appropriate Division in relation to the teaching and administrative staff operating within each Division;
– administrative support staff not directly operating within the teaching departments have been allocated on a proportional basis; and
– a small number of teaching and administrative staff who operate across the two divisions within the teaching departments have been solely allocated to the area in which they predominantly operate, as it is impractical to determine their proportional contribution to each division.
Other liabilities
Revenue in advance included in other liabilities is directly attributable to either Higher Education or VET, while all other revenue in advance has been allocated on a proportional basis.

ROYAL MELBOURNE INSTITUTE OF TECHNOLOGY AND SUBSIDIARIES 59
Notes to the Financial Statements 31 December 2014
2 Disaggregation information (continued)
(iv) Statement of Changes in Equity
Higher Education VET RMIT
Reserves Retained earnings
Total Reserves Retained earnings
Total Total
$’000 $’000 $’000 $’000 $’000 $’000 $’000
Balance at 1 January 2013 427,519 758,115 1,185,634 179,204 115,717 294,921 1,480,555
Profit or loss – 48,325 48,325 – 1,747 1,747 50,072
Cash flow hedges 104 – 104 12 – 12 116
Balance at 31 December 2013 427,623 806,440 1,234,063 179,216 117,464 296,680 1,530,743
Balance at 1 January 2014 427,623 806,440 1,234,063 179,216 117,464 296,680 1,530,743
Profit or loss – 69,384 69,384 – 1,815 1,815 71,199
Cash flow hedges (254) – (254) (29) – (29) (283)
Gain/(loss) on revaluation of land, buildings and artworks, net of tax
140,528 – 140,528 31,358 – 31,358 171,886
Gain/(loss) on revaluation of available for sale financial assets, net of tax
44 – 44 – – – 44
Balance at 31 December 2014 567,940 875,825 1,443,765 210,545 119,279 329,824 1,773,589
(v) Statement of Cash Flows
Higher
Education
VET Total
RMIT
Higher
Education
VET Total
RMIT
2014 2014 2014 2013 2013 2013
$'000 $'000 $'000 $'000 $'000 $'000
Cash flows from operating activities
Australian Government Grants received 460,100 35,017 495,117 440,628 33,094 473,722
OS-HELP (net) 561 – 561 (98) – (98)
Superannuation Supplementation 22,550 – 22,550 20,156 – 20,156
State Government Grants received 57 31,629 31,686 93 34,203 34,296
HECS-HELP – Student payments 22,063 – 22,063 22,241 – 22,241
Receipts from student fees and other customers
348,121 70,998 419,119 322,534 70,877 393,411
Dividends received 1,541 – 1,541 1,320 – 1,320
Interest received 3,141 661 3,802 2,998 563 3,561
Payments to suppliers and employees (inclusive of GST)
(740,927) (135,328) (876,255) (705,851) (122,904) (828,755)
Interest and other costs of finance (6,601) (686) (7,287) (6,173) (637) (6,810)
GST recovered/(paid) 24,073 4,778 28,851 21,791 4,444 26,235
Income tax paid (2,365) – (2,365) (1,358) – (1,358)
Net cash provided by (used in) operating activities
132,314 7,069 139,383 118,281 19,640 137,921
Cash flows from investing activities
Proceeds from sale of property, plant and equipment
385 230 615 368 325 693
Payments for financial assets (3,900) – (3,900) – – –
Payments for intangible assets (13,141) (4,236) (17,377) – – –
Payments for property, plant and equipment
(119,762) (22,951) (142,713) (77,686) (5,610) (83,296)
Net cash provided by (used in) investing activities
(136,418) (26,957) (163,375) (77,318) (5,285) (82,603)
Cash flows from financing activities
Proceeds from borrowings 43,981 4,887 48,868 51,300 5,700 57,000
Loans (from)/to related parties (511) – (511) (925) – (925)
Repayment of borrowings (27,000) (3,000) (30,000) (91,800) (10,200) (102,000)
Net cash provided by (used in) financing activities
16,470 1,887 18,357 (41,425) (4,500) (45,925)

60
Notes to the Financial Statements 31 December 2014
2 Disaggregation information (continued)
(v) Statement of Cash Flows (continued)
Higher
Education
VET Total
RMIT
Higher
Education
VET Total
RMIT
2014 2014 2014 2013 2013 2013
$'000 $'000 $'000 $'000 $'000 $'000
Net increase (decrease) in cash and cash equivalents
12,367 (18,001) (5,634) (463) 9,855 9,392
Cash and cash equivalents at the beginning of the financial year
62,819 26,594 89,413 63,282 16,739 80,021
Cash and cash equivalents at end of year 75,186 8,593 83,779 62,819 26,594 89,413
(b) RMIT Consolidated Entity Total Revenue Net Operating Results Total Assets
Geographical 2014 2013 2014 2013 2014 2013
$'000 $'000 $'000 $'000 $'000 $'000
Australia 1,014,347 954,169 72,935 60,407 2,584,764 2,312,418
South East Asia 62,292 58,166 2,740 7,852 96,867 83,614
Europe 1,676 92 (200) (882) 1,583 1,832
1,078,315 1,012,427 75,475 67,377 2,683,215 2,397,864
Consolidated RMIT 2014 2013 2014 2013
Note $’000 $’000 $’000 $’000
3 Australian Government financial assistance including HECS-HELP and FEE-HELP
(a) Commonwealth Grants Scheme and Other Grants 45.1
Commonwealth Grants Scheme 233,092 224,016 233,092 224,016
Indigenous Support Program 472 473 472 473
Partnership & Participation Program 5,457 4,377 5,457 4,377
Disability Support Program 324 149 324 149
Promotion of Excellence in Learning and Teach 535 13 535 13
Reward Funding – 530 – 530
Australian Maths & Science Partnership 520 539 520 539
Total Commonwealth Grants Scheme and Other Grants
240,401 230,097 240,401 230,097
(b) Higher Education Loan Programs 45.2
HECS-HELP 159,536 135,590 159,536 135,590
FEE-HELP 38,257 34,543 38,257 34,543
VET FEE-HELP 20,024 16,199 20,024 16,199
SA-HELP 3,628 3,325 3,628 3,325
Total Higher Education Loan Programs 221,445 189,657 221,445 189,657
(c) Scholarships 45.3
Australian Postgraduate Awards 5,345 4,883 5,345 4,883
International Postgraduate Research Scholarships 411 409 411 409
Commonwealth Education Cost Scholarships (43) (645) (43) (645)
Commonwealth Accommodation Scholarships – (13) – (13)
Indigenous Access Scholarships 54 65 54 65
Total Scholarships 5,767 4,699 5,767 4,699

ROYAL MELBOURNE INSTITUTE OF TECHNOLOGY AND SUBSIDIARIES 61
Notes to the Financial Statements 31 December 2014
3 Australian Government financial assistance
including HECS-HELP and FEE-HELP (continued)
Consolidated RMIT 2014 2013 2014 2013
Note $’000 $’000 $’000 $’000
(d) Education – Research 45.4
Joint Research Engagement 7,157 6,284 7,157 6,284
JRE Engineering Cadetship 82 49 82 49
Research Training Scheme 13,471 13,550 13,471 13,550
Research Infrastructure Block Grants 2,048 1,887 2,048 1,887
Sustainable Research Excellence in Universities 1,678 1,602 1,678 1,602
Total Education – Research Grants 24,436 23,372 24,436 23,372
(e) Australian Research Council 45.5
(i) Discovery 45.5(a)
Projects 6,356 4,608 6,356 4,608
Fellowships 1,959 1,305 1,959 1,305
Total Discovery 8,315 5,913 8,315 5,913
(ii) Linkages 45.5(b)
Infrastructure 500 – 500 –
Projects 3,421 2,675 3,421 2,675
Total Linkages 3,921 2,675 3,921 2,675
(f) Other Australian Government financial assistance
Non-Capital
Superannuation Supplementation 22,320 21,884 22,320 21,884
Other 3,805 6,554 3,805 6,554
Total Non-Capital 26,125 28,438 26,125 28,438
Total Australian Government financial assistance 530,410 484,851 530,410 484,851
Reconciliation
Australian Government grants [a + c + d + e + f ] 308,965 295,194 308,965 295,194
HECS-HELP payments 159,536 135,590 159,536 135,590
FEE-HELP payments 38,257 34,543 38,257 34,543
VET FEE-HELP payments 20,024 16,199 20,024 16,199
SA-HELP payments 3,628 3,325 3,628 3,325
Total Australian Government financial assistance 530,410 484,851 530,410 484,851
(g) Australian Government Grants received – cash basis
CGS and Other Education Grants 45.1 240,401 230,471 240,401 230,471
Higher Education Loan Programs 45.2 207,257 203,320 207,257 203,320
Scholarships 45.3 5,767 4,699 5,767 4,699
Education research 45.4 24,436 23,372 24,436 23,372
ARC grants – Discovery 45.5 8,315 5,913 8,315 5,913
ARC grants – Linkages 45.5 3,921 2,660 3,921 2,660
Other Australian Government Grants 5,020 3,287 5,020 3,287
Total Australian Government Grants received – cash basis
495,117 473,722 495,117 473,722
OS-Help (Net) 45.6 561 (98) 561 (98)
Superannuation Supplementation 45.7 22,550 20,156 22,550 20,156
Total Australian Government funding received – cash basis 518,228 493,780 518,228 493,780

62
Notes to the Financial Statements 31 December 2014
Consolidated RMIT 2014 2013 2014 2013
Note $’000 $’000 $’000 $’000
4 State and Local Government financial assistanceNon-Capital
Recurrent grants 31,203 32,655 31,203 32,655
Other grants 483 869 483 869
31,686 33,524 31,686 33,524
Capital
Capital grants – 869 – 869
– 869 – 869
Total State and Local Government financial assistance 31,686 34,393 31,686 34,393
5 Fees and chargesCourse fees and charges
Fee paying onshore overseas students 225,139 202,952 209,034 190,604
Fee paying offshore overseas students 121,629 112,853 65,746 59,949
Continuing education 20,783 19,171 20,729 19,189
Fee paying domestic postgraduate students 8,938 10,421 8,938 10,421
Fee paying domestic undergraduate students 12,805 22,104 12,805 22,104
Fee paying domestic non-award students 2,766 2,638 2,766 2,638
Other domestic course fees and charges 4,113 3,289 3,547 2,735
Total course fees and charges 396,173 373,428 323,565 307,640
Other non-course fees and charges
Amenities and service fees 10,499 9,511 7,430 6,828
Late fees 138 230 138 230
Library fines 6 4 6 4
Registration fees 30 5 30 5
Other fees and charges 2,978 3,327 3,895 3,851
Total other fees and charges 13,651 13,077 11,499 10,918
Total fees and charges 409,824 386,505 335,064 318,558
6 Investment revenue and incomeInterest 5,152 5,027 3,713 3,520
Dividends 2,531 1,708 1,558 1,320
Net investment income 7,683 6,735 5,271 4,840
7 Consultancy and contractsConsultancy 5,952 6,271 2,736 3,433
Contract research
Commonwealth Government 14,876 15,053 14,876 15,053
Victorian State Government 2,509 3,179 2,509 3,179
Local Government 477 5 477 5
Industry and other 10,800 8,359 10,527 8,359
Total contract research 28,662 26,596 28,389 26,596
Other contract revenue
Seminar and conference fees 567 531 567 531
Service fees 482 422 181 144
Total other contract revenue 1,049 953 748 675
Total consultancy and contracts 35,663 33,820 31,873 30,704
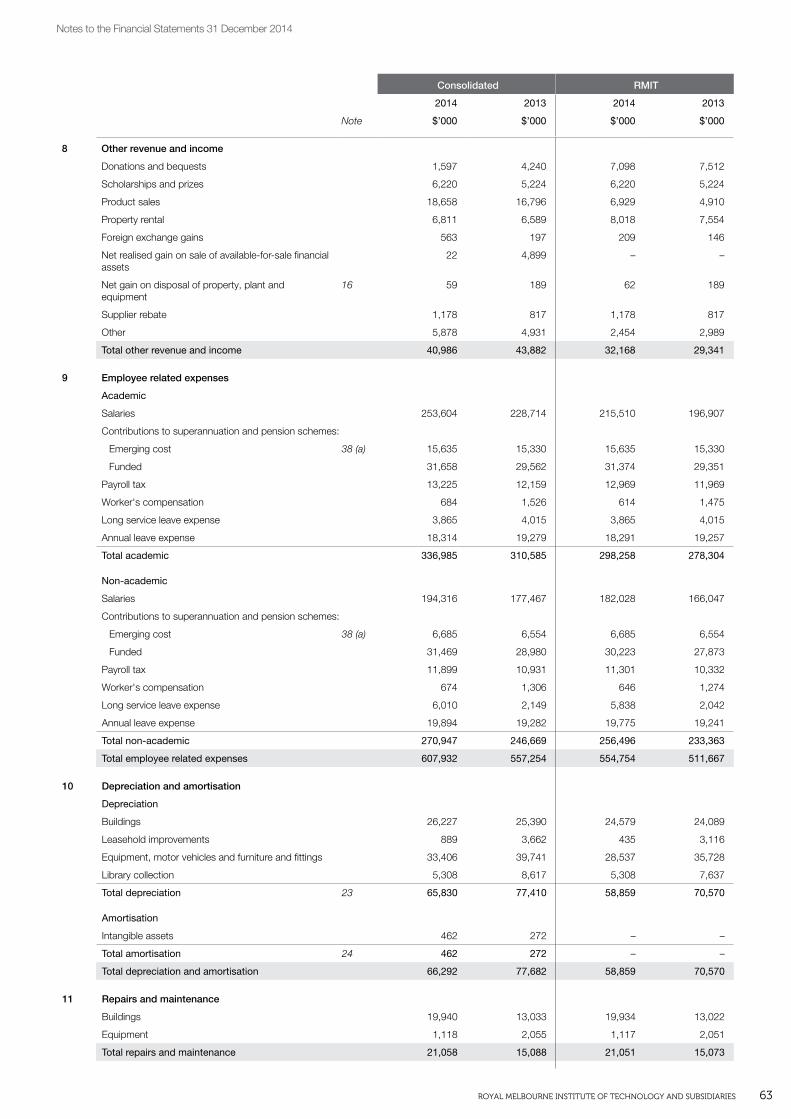
ROYAL MELBOURNE INSTITUTE OF TECHNOLOGY AND SUBSIDIARIES 63
Notes to the Financial Statements 31 December 2014
Consolidated RMIT 2014 2013 2014 2013
Note $’000 $’000 $’000 $’000
8 Other revenue and incomeDonations and bequests 1,597 4,240 7,098 7,512
Scholarships and prizes 6,220 5,224 6,220 5,224
Product sales 18,658 16,796 6,929 4,910
Property rental 6,811 6,589 8,018 7,554
Foreign exchange gains 563 197 209 146
Net realised gain on sale of available-for-sale financial assets
22 4,899 – –
Net gain on disposal of property, plant and equipment
16 59 189 62 189
Supplier rebate 1,178 817 1,178 817
Other 5,878 4,931 2,454 2,989
Total other revenue and income 40,986 43,882 32,168 29,341
9 Employee related expensesAcademic
Salaries 253,604 228,714 215,510 196,907
Contributions to superannuation and pension schemes:
Emerging cost 38 (a) 15,635 15,330 15,635 15,330
Funded 31,658 29,562 31,374 29,351
Payroll tax 13,225 12,159 12,969 11,969
Worker's compensation 684 1,526 614 1,475
Long service leave expense 3,865 4,015 3,865 4,015
Annual leave expense 18,314 19,279 18,291 19,257
Total academic 336,985 310,585 298,258 278,304
Non-academic
Salaries 194,316 177,467 182,028 166,047
Contributions to superannuation and pension schemes:
Emerging cost 38 (a) 6,685 6,554 6,685 6,554
Funded 31,469 28,980 30,223 27,873
Payroll tax 11,899 10,931 11,301 10,332
Worker's compensation 674 1,306 646 1,274
Long service leave expense 6,010 2,149 5,838 2,042
Annual leave expense 19,894 19,282 19,775 19,241
Total non-academic 270,947 246,669 256,496 233,363
Total employee related expenses 607,932 557,254 554,754 511,667
10 Depreciation and amortisationDepreciation
Buildings 26,227 25,390 24,579 24,089
Leasehold improvements 889 3,662 435 3,116
Equipment, motor vehicles and furniture and fittings 33,406 39,741 28,537 35,728
Library collection 5,308 8,617 5,308 7,637
Total depreciation 23 65,830 77,410 58,859 70,570
Amortisation
Intangible assets 462 272 – –
Total amortisation 24 462 272 – –
Total depreciation and amortisation 66,292 77,682 58,859 70,570
11 Repairs and maintenanceBuildings 19,940 13,033 19,934 13,022
Equipment 1,118 2,055 1,117 2,051
Total repairs and maintenance 21,058 15,088 21,051 15,073

64
Notes to the Financial Statements 31 December 2014
Consolidated RMIT 2014 2013 2014 2013
Note $’000 $’000 $’000 $’000
12 Borrowing costsInterest to related corporations – – 479 367
Interest to other corporations 6,871 6,443 6,857 6,443
Total borrowing costs 6,871 6,443 7,336 6,810
13 Impairment of assetsAmounts set aside for impaired receivables
Trade debtors 1,369 1,885 1,393 1,800
Student debtors 2,770 (1,753) 2,698 (1,753)
Subsidiaries – – (2,145) 2,145
4,139 132 1,946 2,192
Amounts set aside for impaired intangibles (8,177) 8,177 (8,177) 8,177
Bad debts written off/(recovered) in the Income Statement
Trade debtors 110 22 108 –
Student debtors (157) 4,259 (157) 4,259
(47) 4,281 (49) 4,259
Amounts written off in relation to investment
Non-related companies 8 14 – –
8 14 – –
Amounts provided for impairment in investment to subsidiaries
Subsidiaries – – 2,003 –
– – 2,003 –
Total impairment of assets (4,077) 12,604 (4,277) 14,628
14 Other expensesScholarships, grants and prizes 46,743 51,321 47,200 52,411
Non-capitalised equipment 9,868 10,435 9,767 10,371
Advertising, marketing and promotional expenses 21,142 17,091 15,467 12,641
General consumables 9,816 10,258 9,639 10,018
Printing and stationery 6,061 6,465 5,979 6,355
Minimum lease payments on operating leases 25,923 26,859 22,452 23,397
Telecommunications 6,781 6,928 4,781 5,153
Travel, staff development and entertainment 23,770 20,138 21,271 18,090
Net loss on disposal of property, plant and equipment – 40 – –
Foreign exchange losses 1,293 361 614 234
Occupancy expenses 29,364 28,574 26,148 25,900
Audit fees, bank charges, legal costs, insurance and taxes
6,711 7,759 6,257 7,067
Contractors and consultancy fees 68,015 50,881 65,614 49,333
Patents, copyright and licences 16,085 14,337 14,011 12,768
Memberships and subscription fees 3,393 3,306 3,369 3,287
Computer software support and maintenance 16,306 12,815 16,020 12,565
Other expenses 9,536 6,281 8,151 4,774
Total other expenses 300,807 273,849 276,740 254,364
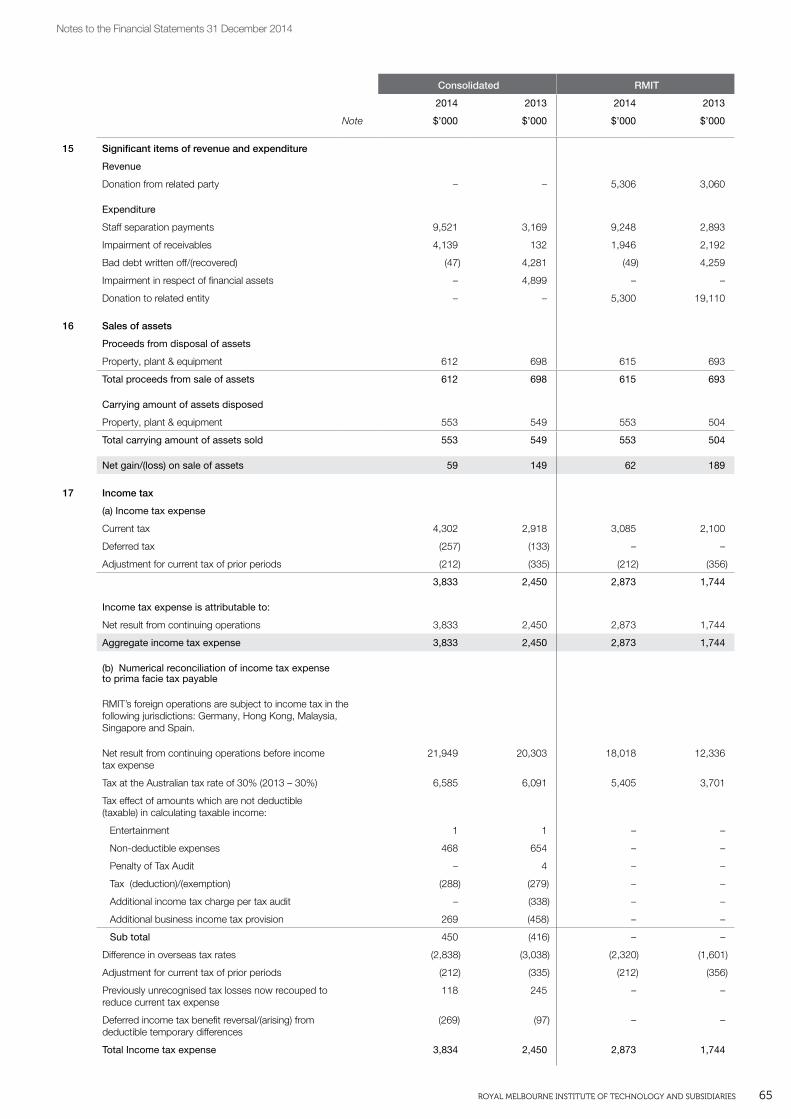
ROYAL MELBOURNE INSTITUTE OF TECHNOLOGY AND SUBSIDIARIES 65
Notes to the Financial Statements 31 December 2014
Consolidated RMIT 2014 2013 2014 2013
Note $’000 $’000 $’000 $’000
15 Significant items of revenue and expenditure Revenue
Donation from related party – – 5,306 3,060
Expenditure
Staff separation payments 9,521 3,169 9,248 2,893
Impairment of receivables 4,139 132 1,946 2,192
Bad debt written off/(recovered) (47) 4,281 (49) 4,259
Impairment in respect of financial assets – 4,899 – –
Donation to related entity – – 5,300 19,110
16 Sales of assetsProceeds from disposal of assets
Property, plant & equipment 612 698 615 693
Total proceeds from sale of assets 612 698 615 693
Carrying amount of assets disposed
Property, plant & equipment 553 549 553 504
Total carrying amount of assets sold 553 549 553 504
Net gain/(loss) on sale of assets 59 149 62 189
17 Income tax(a) Income tax expense
Current tax 4,302 2,918 3,085 2,100
Deferred tax (257) (133) – –
Adjustment for current tax of prior periods (212) (335) (212) (356)
3,833 2,450 2,873 1,744
Income tax expense is attributable to:
Net result from continuing operations 3,833 2,450 2,873 1,744
Aggregate income tax expense 3,833 2,450 2,873 1,744
(b) Numerical reconciliation of income tax expense to prima facie tax payable
RMIT’s foreign operations are subject to income tax in the following jurisdictions: Germany, Hong Kong, Malaysia, Singapore and Spain.
Net result from continuing operations before income tax expense
21,949 20,303 18,018 12,336
Tax at the Australian tax rate of 30% (2013 – 30%) 6,585 6,091 5,405 3,701
Tax effect of amounts which are not deductible (taxable) in calculating taxable income:
Entertainment 1 1 – –
Non-deductible expenses 468 654 – –
Penalty of Tax Audit – 4 – –
Tax (deduction)/(exemption) (288) (279) – –
Additional income tax charge per tax audit – (338) – –
Additional business income tax provision 269 (458) – –
Sub total 450 (416) – –
Difference in overseas tax rates (2,838) (3,038) (2,320) (1,601)
Adjustment for current tax of prior periods (212) (335) (212) (356)
Previously unrecognised tax losses now recouped to reduce current tax expense
118 245 – –
Deferred income tax benefit reversal/(arising) from deductible temporary differences
(269) (97) – –
Total Income tax expense 3,834 2,450 2,873 1,744

66
Notes to the Financial Statements 31 December 2014
17 Income tax (continued)
Consolidated RMIT
2014 2013 2014 2013
Note $’000 $’000 $’000 $’000
(c) Deferred tax
Deferred tax assets
Non-current 1,016 692 – –
1,016 692 – –
Deferred tax liabilities
Non-current 4 5 – –
4 5 – –
Net deferred tax liabilities 1,012 687 – –
(d) Current tax liabilities
Current tax liability 4,947 4,439 4,947 4,439
The following subsidiary is subject to income tax in Australia:
Spatial Vision Innovations Pty Ltd
18 Cash and cash equivalents
Cash at bank and on hand 11,025 10,027 6,695 7,181
Deposits at call 86,218 108,671 77,084 82,232
Foreign currency bank accounts 13,477 16,412 – –
Total cash and cash equivalents 110,720 135,110 83,779 89,413
(a) Cash at bank
The cash at bank is bearing floating interest rates between 0.00% and 1.00% (2013 – 0.00% and 1.00%).
(b) Deposits at call
The deposits are bearing floating interest rates between 2.50% and 2.65% (2013 – 2.50% and 3.75%). These deposits have an average maturity of 45 days.
19 ReceivablesCurrent
Trade receivables 10,328 13,444 7,892 10,383
Less provision for impaired receivables (1,956) (540) (1,828) (436)
8,372 12,904 6,064 9,947
Student loans & student receivables 10,141 9,129 10,141 9,129
Less provision for impaired receivables (5,469) (2,770) (5,469) (2,770)
4,672 6,359 4,672 6,359
Government grants receivable 6,362 4,428 6,362 4,428
Deferred government contributions for superannuation *
22,292 21,874 22,292 21,874
Interest receivable 248 472 167 256
Other debtors and accrued income 7,588 6,800 7,838 7,054
Related parties receivable:
Amounts receivable from subsidiaries – (43) 6,158 9,185
Less Provision for impairment – – – (2,145)
36,490 33,531 42,817 40,652
Total current receivables 49,534 52,794 53,553 56,958
Non-current
Other debtors 776 1,056 764 1,022
Deferred government contributions for superannuation * 312,446 314,722 312,446 314,722
Related parties receivable:
Other related parties 52 52 – 150
Total non-current receivables 313,274 315,830 313,210 315,894
Total receivables 362,808 368,624 366,763 372,852
* RMIT recognises a receivable for the amount expected to be received from the Commonwealth Government in respect of unfunded superannuation schemes operated by the State Government. The total consolidated amount owing in respect of these at 30 June 2014 amounted to $334.7m (2013 – $336.6m). Refer to note 28.

ROYAL MELBOURNE INSTITUTE OF TECHNOLOGY AND SUBSIDIARIES 67
Notes to the Financial Statements 31 December 2014
19 Receivables (continued)
Consolidated RMIT
2014 2013 2014 2013
Note $’000 $’000 $’000 $’000
(a) Impaired receivables
Nominal value of impaired receivables
Trade receivables 1,956 540 1,828 436
Student loans and student receivables 5,469 2,770 5,469 2,770
Amounts receivable from subsidiaries – – – 2,145
7,425 3,310 7,297 5,351
Amount of provision for impaired receivable set aside
Trade receivables 1,956 540 1,828 436
Student loans and student receivables 5,469 2,770 5,469 2,770
Amounts receivable from subsidiaries – – – 2,145
7,425 3,310 7,297 5,351
The ageing of these receivables is as follows:
3 to 6 months 3,280 2,466 3,235 4,608
Over 6 months 4,145 844 4,062 743
7,425 3,310 7,297 5,351
Receivables which were past due but not impaired
These relate to a number of independent customers for whom there is no recent history of default. The ageing analysis of these receivables is as follows:
3 to 6 months – 1,986 61 1,846
Over 6 months – 793 – 707
– 2,779 61 2,553
Movements in the provision for impaired receivables are as follows:
At 1 January 1,012 5,909 5,351 5,895
Provision for impairment recognised during the year (199) 3,050 1,946 5,195
Write back of provision for impairment 6,612 (7,947) – (5,739)
At 31 December 7,425 1,012 7,297 5,351
The creation and release of the provision for impaired receivables has been included in Bad and doubtful debts in the income statement. Amounts charged to the provision are generally written off when there is no expectation of recovering further cash flows.
The other amounts within receivables do not contain impaired assets and are not past due. Based on credit history, it is expected that these amounts will be received when due.

68
Notes to the Financial Statements 31 December 2014
19 Receivables (continued)
Consolidated RMIT 2014 2013 2014 2013
Note $’000 $’000 $’000 $’000
(b) Foreign exchange and interest rate risk
The carrying amounts of current and non-current receivables are denominated in the following currencies:
Australian dollar 359,197 364,907 364,829 370,883
American dollar 1,085 1,200 1,063 1,064
British pound – 1 – 1
Canadian dollar – – – –
Euro 150 92 142 3
Hong Kong dollar 675 902 675 902
Japanese yen 7 – 7 –
New Zealand dollar 3 – 3 –
Norwegian krone – – – –
Saudi riyal – – – –
Singapore dollar 45 – 45 –
South African rand – – – –
Vietnamese dong 1,647 1,522 – –
Total receivables 362,808 368,624 366,763 372,852
Current receivables 49,534 52,794 53,553 56,958
Non-current receivables 313,274 315,830 313,210 315,894
Total receivables 362,808 368,624 366,763 372,852
A summarised analysis of the sensitivity of receivables to foreign exchange and interest rate risk can be found in note 39.
20 InventoriesCurrent
Stock held for distribution 1,604 1,549 1,288 1,159
Work in progress 171 179 – –
Total inventories 1,775 1,728 1,288 1,159
21 Available for sale financial assetsNon-current
Investments in managed trust funds – at fair value 54,037 28,001 3,960 –
Total available for sale financial assets 54,037 28,001 3,960 –
Balance 1 January 2014 28,001 20,340 – –
Additions 26,336 28,031 3,916 –
Disposals (sale and redemption) (2,000) (23,758) – –
Realised gains/(losses) in the market value throughout the year
22 2,838 – –
Unrealised gains/(losses) in the market value throughout the year
1,678 550 44 –
Balance 31 December 2014 54,037 28,001 3,960 –
Represented by:
Financial assets under funds management 54,037 28,001 3,960 –
54,037 28,001 3,960 –
Impairment and risk exposure
None of the financial assets are either past due or impaired.
All available-for-sale financial assets are denominated in Australian currency. For an analysis of the sensitivity of available-for-sale financial assets to price and interest rate risk refer to note 39.

ROYAL MELBOURNE INSTITUTE OF TECHNOLOGY AND SUBSIDIARIES 69
Notes to the Financial Statements 31 December 2014
Consolidated RMIT
2014 2013 2014 2013
Note $’000 $’000 $’000 $’000
22 Other financial assetsCurrent
Term deposits held-to-maturity 28,132 17,250 – –
28,132 17,250 – –
Non-current
Investments traded on organised markets
Term deposits held-to-maturity – 2,000 – –
Unlisted shares in subsidiaries – – 4,378 2,378
Less Provision for diminution in value of investment – – (2,004) –
Unlisted shares in non-related companies 7,466 7,470 7,466 7,466
Less Provision for diminution in value of investment (7,308) (7,308) (7,308) (7,308)
158 2,162 2,532 2,536
Total other financial assets 28,290 19,412 2,532 2,536
Land Buildings Construction in progress
Leasehold improvements
Equipment, motor
vehicles, furniture and
fittings
Library collection Artworks Total
Note $’000 $’000 $’000 $’000 $’000 $’000 $’000 $’000
23 Property, plant and equipmentRMIT Consolidated Entity
1 January 2013
Cost – 31,587 34,996 4,567 24,344 3,606 – 99,100
Valuation 379,262 1,235,384 – 26,231 229,591 78,264 1,808 1,950,540
Accumulated depreciation – (24,999) – (20,553) (152,868) (49,041) – (247,461)
Net book amount 379,262 1,241,972 34,996 10,245 101,067 32,829 1,808 1,802,179
Year ended 31 December 2013
Opening net book amount 379,262 1,241,972 34,996 10,245 101,067 32,829 1,808 1,802,179
Revaluation – – – – – – – –
Additions 4,784 1,840 66,643 – 20,841 7,225 7 101,340
Transfer out of capital works in progress
233 25,034 (30,157) 157 3,502 – 1,222 (9)
Disposals – – – (57) (536) – – (593)
Depreciation – (25,390) – (3,662) (39,741) (8,617) – (77,410)
Reclassification – – – 2,310 (887) (1,423) – –
Foreign currency translation gain/(loss)
– 4,321 520 187 1,701 109 – 6,838
Closing net book amount 384,279 1,247,777 72,002 9,180 85,947 30,123 3,037 1,832,345
31 December 2013
Cost – 35,973 72,002 5,666 27,122 2,622 – 143,385
Valuation 384,279 1,262,482 – 26,392 249,441 84,676 3,037 2,010,307
Accumulated depreciation – (50,678) – (22,878) (190,616) (57,175) – (321,347)
Net book amount 384,279 1,247,777 72,002 9,180 85,947 30,123 3,037 1,832,345

70
Notes to the Financial Statements 31 December 2014
23 Property, plant and equipment (continued)
Land Buildings Construction in progress
Leasehold improvements
Equipment, motor
vehicles, furniture and
fittings
Library collection Artworks Total
Note $’000 $’000 $’000 $’000 $’000 $’000 $’000 $’000
Year ended 31 December 2014
Opening net book amount 384,279 1,247,777 72,002 9,180 85,947 30,123 3,037 1,832,345
Revaluation 49,071 117,614 – – – – 5,201 171,886
Additions 3,950 1,070 116,309 166 19,353 11,715 534 153,097
Transfer out of capital works in progress
1,585 54,126 (70,646) 1,684 13,178 – 73 –
Disposals – – – (4) (403) – (168) (575)
Depreciation – (26,227) – (889) (33,406) (5,308) – (65,830)
Reclassification – prior year adjustments
– – – (2,424) 2,424 – – –
Foreign currency translation gain/(loss)
– 2,898 131 10 1,313 – – 4,352
Closing net book amount 40 438,885 1,397,258 117,796 7,723 88,406 36,530 8,677 2,095,275
31 December 2014
Cost – 43,238 117,796 4,904 43,521 – – 209,459
Valuation 438,885 1,362,630 – 27,227 273,806 96,391 8,677 2,207,616
Accumulated depreciation – (8,610) – (24,408) (228,921) (59,861) – (321,800)
Net book amount 40 438,885 1,397,258 117,796 7,723 88,406 36,530 8,677 2,095,275
Parent entity
1 January 2013
Cost – – 33,875 – – – – 33,875
Valuation 379,261 1,235,388 – 26,235 229,587 78,264 1,808 1,950,543
Accumulated depreciation – (21,112) – (17,397) (141,202) (46,916) – (226,627)
Net book amount 379,261 1,214,276 33,875 8,838 88,385 31,348 1,808 1,757,791
Year ended 31 December 2013
Opening net book amount 379,261 1,214,276 33,875 8,838 88,385 31,348 1,808 1,757,791
Additions 4,785 2,125 62,349 – 18,301 6,412 7 93,979
Transfer out of capital works in progress
233 24,969 (30,032) 157 3,450 – 1,222 (1)
Disposals – – – – (503) – – (503)
Depreciation – (24,089) – (3,116) (35,728) (7,637) – (70,570)
Closing net book amount 384,279 1,217,281 66,192 5,879 73,905 30,123 3,037 1,780,696
31 December 2013
Cost – – 66,192 – – – – 66,192
Valuation 384,279 1,262,482 – 26,392 249,441 84,676 3,037 2,010,307
Accumulated depreciation – (45,201) – (20,513) (175,536) (54,553) – (295,803)
Net book amount 384,279 1,217,281 66,192 5,879 73,905 30,123 3,037 1,780,696
Year ended 31 December 2014
Opening net book amount 384,279 1,217,281 66,192 5,879 73,905 30,123 3,037 1,780,696
Revaluation 49,071 117,614 – – – – 5,201 171,886
Additions 3,950 1,050 113,463 – 17,386 11,715 534 148,098
Transfer out of capital works in progress
1,585 51,265 (63,855) 1,585 9,347 – 73 –
Disposals – – – – (396) – (168) (564)
Depreciation – (24,580) – (435) (28,536) (5,308) – (58,859)
Closing net book amount 40 438,885 1,362,630 115,800 7,029 71,706 36,530 8,677 2,041,257

ROYAL MELBOURNE INSTITUTE OF TECHNOLOGY AND SUBSIDIARIES 71
Notes to the Financial Statements 31 December 2014
23 Property, plant and equipment (continued)
Land Buildings Construction in progress
Leasehold improvements
Equipment, motor
vehicles, furniture and
fittings
Library collection Artworks Total
Note $’000 $’000 $’000 $’000 $’000 $’000 $’000 $’000
31 December 2014
Cost – – 115,800 – – – – 115,800
Valuation 438,885 1,362,630 – 27,227 273,806 96,391 8,677 2,207,616
Accumulated depreciation – – – (20,198) (202,100) (59,861) – (282,159)
Net book amount 40 438,885 1,362,630 115,800 7,029 71,706 36,530 8,677 2,041,257
(a) Valuation of land and buildings
An independent valuation of land and buildings was carried out as at 31 December 2014 by Cunningham Property Consultants Pty Ltd. Fair value disclosure for land and buildings is included in Note 40.
(b) Assets held in the name of the Minister
Land and buildings valued at $369.32m (2013 - $331.88m) is held by RMIT on behalf of the Minister. Upon disposal of any such properties, the application of the proceeds will be directed by the Minister.
(c) Fair Value Disclosure
Fair value disclosure for Property, Plant and Equipment is included in Note 40.
Consolidated RMITIntellectual property
Total Intellectual property
Total
Note $’000 $’000 $’000 $’000
24 Intangible assets1 January 2013
Cost 2,430 2,430 – –
Accumulated amortisation and impairment (2,008) (2,008) – –
Net book amount 422 422 – –
Year Ended 31 December 2013
Opening net book amount 422 422 – –
Additions 8,751 8,751 8,177 –
Transfer from equipment under construction 6 6 – –
Impairment losses (8,177) (8,177) (8,177) –
Amortisation charge 10 (272) (272) – –
Foreign currency translation gain/(loss) 84 84 – –
Closing net book amount 814 814 – –
31 December 2013
Cost 9,960 9,960 8,177 –
Accumulated amortisation and impairment (9,146) (9,146) (8,177) –
Net book amount 814 814 – –
Year Ended 31 December 2014
Opening net book amount 814 814 – –
Additions 8,319 8,319 8,142 8,142
Transfer from equipment under construction 7 7 – –
Disposals (10) (10) – –
Impairment losses 8,177 8,177 8,177 8,177
Amortisation charge 10 (462) (462) – –
Foreign currency translation gain/(loss) 38 38 – –
Net book amount 16,883 16,883 16,319 16,319
31 December 2014
Cost 18,381 18,381 16,319 16,319
Accumulated amortisation (1,498) (1,498) – –
Net book amount 16,883 16,883 16,319 16,319
2014_RMIT Annual Report-FinancialSection_37-100_FINAL.indd 71 27/03/2015 3:40 pm

72
Notes to the Financial Statements 31 December 2014
Consolidated RMIT 2014 2013 2014 2013
Note $'000 $'000 $'000 $'000
25 Other non–financial assetsCurrent
Library subscriptions prepaid 2,089 1,032 2,089 1,032
Other prepayments 10,321 10,106 8,219 8,248
Total other non–financial assets 12,410 11,138 10,308 9,280
26 Trade and other payablesCurrent
Trade creditors 50,002 35,579 47,007 32,502
Sundry creditor and operating accruals 82,483 94,800 34,616 51,920
OS–HELP Liability to Australian Government 825 264 825 264
Derivatives used for hedging 885 601 885 601
Total current trade and other payables 134,195 131,244 83,333 85,287
Foreign currency risk
The carrying amounts of the Group’s and parent entity’s trade and other payables are denominated in the following currencies:
Australian dollar 108,490 111,344 80,688 84,491
American dollar 1,094 335 1,094 335
British pound 10 67 10 67
Canadian dollar 4 31 4 31
Chinese renminbi 30 3 30 3
Danish krone – 36 – 36
Euro 1,346 216 1,346 216
Hong Kong dollar 67 2 67 2
Indian rupee 6 3 6 3
Japanese yen – 5 – 5
Mexican peso – 2 – 2
New Zealand dollar – 13 – 13
Singapore dollar 10 5 10 5
Swiss franc – 7 – 7
Thailand bhat 80 71 80 71
Vietnamese dong 23,060 19,104 – –
Total current trade and other payables 134,195 131,244 83,333 85,287
For an analysis of the sensitivity of trade and other payables to foreign currency risk refer to note 39.
27 BorrowingsCurrent
Amounts payable to subsidiaries – unsecured – – 18,137 16,095
Total current borrowings – – 18,137 16,095
Non-current
Bank loan – unsecured 27(b) 125,000 110,000 125,000 110,000
Other loans – unsecured 27(b) 3,868 – 3,868 –
Total non-current borrowings 128,868 110,000 128,868 110,000
Total borrowings 128,868 110,000 147,005 126,095

ROYAL MELBOURNE INSTITUTE OF TECHNOLOGY AND SUBSIDIARIES 73
Notes to the Financial Statements 31 December 2014
27 Borrowings (continued)
Consolidated RMIT 2014 2013 2014 2013
Note $’000 $’000 $’000 $’000
(a) Financing arrangements
Unrestricted access was available at balance date to the following lines of credit:
Credit standby arrangements
Fixed term debt facility 30,000 30,000 30,000 30,000
Working capital redraw facility 10,000 10,000 10,000 10,000
Bank overdraft facility 250 250 – –
Total facilities 40,250 40,250 40,000 40,000
Amount utilised – – – –
Unused credit facility 40,250 40,250 40,000 40,000
Bank loan facilities
Facilities available 215,625 225,000 215,625 225,000
Amount utilised (125,000) (110,000) (125,000) (110,000)
Unused credit facility 90,625 115,000 90,625 115,000
Technology finance operating lease facility
Lease facility available 20,000 20,000 20,000 20,000
Amount utilised (9,876) (7,710) (9,876) (7,710)
Unused credit facility 10,124 12,290 10,124 12,290
Business credit card facility
Business credit facility available 5,000 7,500 5,000 7,500
Amount utilised (1,267) (1,090) (1,267) (1,090)
Unused credit facility 3,733 6,410 3,733 6,410
Other loan facilities
Facilities available 27,000 – 27,000 –
Amount utilised (3,868) – (3,868) –
Unused credit facility 23,132 – 23,132 –
(b) Details of borrowings
Credit standby arrangements
The fixed term debt facility of $30m and working capital redraw facility of $10m expires on 30 January 2016. The working capital redraw facility is subject to biennial review.
Bank loan facility
The borrowings at the end of 2014 related to the facilities agreement with the Commonwealth Bank of Australia (CBA) signed in December 2010 for the provision of a $215.6m loan facility (2013 – $225m).
In December 2014 a syndicated facility agreement was signed between RMIT University, CBA and Westpac Bank for the provision of a $296m loan facility for a period of 10 years. At the end of 2014 the new facility has not been utilised. Once activated this new facility will replace the CBA $225 million loan facility.
Credit card facilities
RMIT has entered into an arrangement with its bankers for the provision of a corporate credit card facility. No interest has been paid during the year as all outstanding balances have been paid by the due dates.
Other loans
The Government of Victoria awarded RMIT University with $27m interest free loan with repayment period over eight years for the Greener Government Building Program. Amount utilised at the end of 2014 was $3.9m.
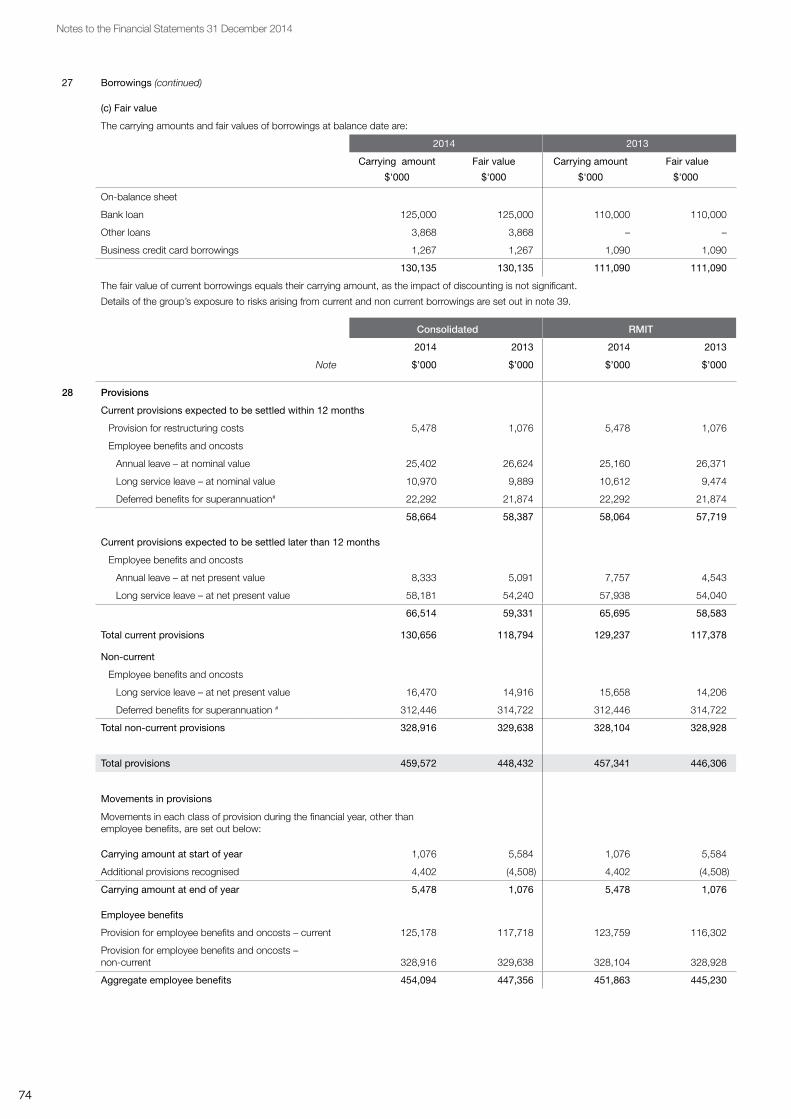
74
Notes to the Financial Statements 31 December 2014
27 Borrowings (continued)
(c) Fair value
The carrying amounts and fair values of borrowings at balance date are:
2014 2013
Carrying amount
$'000
Fair value
$'000
Carrying amount
$'000
Fair value
$'000
On-balance sheet
Bank loan 125,000 125,000 110,000 110,000
Other loans 3,868 3,868 – –
Business credit card borrowings 1,267 1,267 1,090 1,090
130,135 130,135 111,090 111,090
The fair value of current borrowings equals their carrying amount, as the impact of discounting is not significant.
Details of the group’s exposure to risks arising from current and non current borrowings are set out in note 39.
Consolidated RMIT 2014 2013 2014 2013
Note $’000 $’000 $’000 $’000
28 ProvisionsCurrent provisions expected to be settled within 12 months
Provision for restructuring costs 5,478 1,076 5,478 1,076
Employee benefits and oncosts
Annual leave – at nominal value 25,402 26,624 25,160 26,371
Long service leave – at nominal value 10,970 9,889 10,612 9,474
Deferred benefits for superannuation# 22,292 21,874 22,292 21,874
58,664 58,387 58,064 57,719
Current provisions expected to be settled later than 12 months
Employee benefits and oncosts
Annual leave – at net present value 8,333 5,091 7,757 4,543
Long service leave – at net present value 58,181 54,240 57,938 54,040
66,514 59,331 65,695 58,583
Total current provisions 130,656 118,794 129,237 117,378
Non-current
Employee benefits and oncosts
Long service leave – at net present value 16,470 14,916 15,658 14,206
Deferred benefits for superannuation # 312,446 314,722 312,446 314,722
Total non-current provisions 328,916 329,638 328,104 328,928
Total provisions 459,572 448,432 457,341 446,306
Movements in provisions
Movements in each class of provision during the financial year, other than employee benefits, are set out below:
Carrying amount at start of year 1,076 5,584 1,076 5,584
Additional provisions recognised 4,402 (4,508) 4,402 (4,508)
Carrying amount at end of year 5,478 1,076 5,478 1,076
Employee benefits
Provision for employee benefits and oncosts – current 125,178 117,718 123,759 116,302
Provision for employee benefits and oncosts – non-current 328,916 329,638 328,104 328,928
Aggregate employee benefits 454,094 447,356 451,863 445,230

ROYAL MELBOURNE INSTITUTE OF TECHNOLOGY AND SUBSIDIARIES 75
Notes to the Financial Statements 31 December 2014
28 Provisions (continued)
Restructuring costs
Annual leave Long service leave
Deferred benefits for
superannuation
Total
$’000 $’000 $’000 $’000 $’000
RMIT Consolidated Entity
2013
Carrying amount at start of year 5,584 30,538 76,561 467,086 579,769
Net additional provisions recognised/(used) (4,508) 1,177 2,484 (130,490) (131,337)
Carrying amount at end of year 1,076 31,715 79,045 336,596 448,432
2014
Carrying amount at start of year 1,076 31,715 79,045 336,596 448,432
Net additional provisions recognised/(used) 4,402 2,020 6,576 (1,858) 11,140
Carrying amount at end of year 5,478 33,735 85,621 334,738 459,572
Parent entity
2013
Carrying amount at start of year 5,584 29,731 75,278 467,086 577,679
Net additional provisions recognised/(used) (4,508) 1,183 2,442 (130,490) (131,373)
Carrying amount at end of year 1,076 30,914 77,720 336,596 446,306
2014
Carrying amount at start of year 1,076 30,914 77,720 336,596 446,306
Net additional provisions recognised/(used) 4,402 2,003 6,488 (1,858) 11,035
Carrying amount at end of year 5,478 32,917 84,208 334,738 457,341
# A total consolidated unfunded liability for retirement benefits of $334.7m (2013 – $336.6m) accruing to beneficiaries of the State Superannuation Scheme has been recorded in the Balance Sheet as a liability. Refer Notes 1.21 and 38.
Consolidated RMIT 2014 2013 2014 2013
Note $’000 $’000 $’000 $’000
29 Other liabilitiesCurrent
Australian Government unspent financial assistance 1,136 12,965 1,136 12,965
Research grants 19,511 14,968 19,121 14,360
Student fees 50,856 44,519 38,425 32,044
Project fees 296 85 – –
Other 1,310 3,697 1,309 3,697
Total current other liabilities 73,109 76,234 59,991 63,066
Non-current
Deferred lease liabilities 303 397 – –
Total non-current other liabilities 303 397 – –
Total other liabilities 73,412 76,631 59,991 63,066

76
Notes to the Financial Statements 31 December 2014
Consolidated RMIT 2014 2013 2014 2013
Note $’000 $’000 $’000 $’000
30 ReservesBalance at beginning of year 635,497 628,628 606,838 606,722
Transfers from/(to) retained earnings – – – –
Transfers from/(to) subsidiaries – 21 – –
Revaluations of hedges (283) 116 (283) 116
Revaluation of land, buildings and artworks 171,886 – 171,886 –
Foreign exchange gains/(losses) 6,206 8,264 – –
Unrealised valuation gain/(losses) taken to equity 1,678 (1,532) 44 –
Balance at end of year 814,984 635,497 778,485 606,838
Represented by:
Asset revaluation surplus 816,077 644,191 779,305 607,419
Hedge reserve (885) (602) (885) (602)
Foreign currency translation reserve (2,481) (8,687) – –
Share premium reserve 45 45 21 21
Available for sale revaluation surplus 2,228 550 44 –
814,984 635,497 778,485 606,838
Movements in reserves during the year were:
Asset revaluation surplus
Balance at beginning of year 644,191 644,212 607,419 607,440
Transfers from/(to) subsidiary – (21) – (21)
Revaluation of land, buildings and artworks 171,886 – 171,886 –
Balance at end of year 816,077 644,191 779,305 607,419
Hedge reserve
Balance at beginning of year (602) (718) (602) (718)
Revaluations of hedges (283) 116 (283) 116
Balance at end of year (885) (602) (885) (602)
Foreign currency translation reserve
Balance at beginning of year (8,687) (16,951) – –
Foreign currency translation gains/(losses) 6,206 8,264 – –
Balance at end of year (2,481) (8,687) – –
Share premium reserve
Balance at beginning of year 45 24 21 –
Transfers from/(to) subsidiary – 21 – 21
Balance at end of year 45 45 21 21
Available for sale revaluation reserve
Balance at beginning of year 550 2,061 – –
Unrealised valuation gains/(losses) taken to equity 1,678 (1,511) 44 –
Balance at end of year 2,228 550 44 –

ROYAL MELBOURNE INSTITUTE OF TECHNOLOGY AND SUBSIDIARIES 77
Notes to the Financial Statements 31 December 2014
30 Reserves (continued)
Nature and purpose of reserves
Asset revaluation surplus
The asset revaluation surplus is used to record asset revaluation increments and decrements in the value of non-current physical assets.
Hedge reserve
The effective portion of changes in the fair value of derivatives that are designated and qualify as cash flow hedges is recognised in hedge reserve.
Foreign currency translation reserve
Exchange differences arising on translation of foreign controlled entities are recognised in the foreign currency translation reserve. The reserve is recognised in the profit and loss when the net investment is disposed of.
Share premium reserve
Amount paid by shareholders for shares in excess of their nominal value.
Available for sale revaluation reserve
Changes in fair value are taken to available for sale revaluation reserve, as described in note 1.12.
Consolidated RMIT 2014 2013 2014 2013
Note $’000 $’000 $’000 $’000
31 Retained surplusRetained surplus at beginning of year 991,404 924,047 923,905 873,833
Net result attributable to RMIT entity 75,475 67,377 71,199 50,072
Other adjustments 74 (21) – –
Retained surplus at end of year 1,066,954 991,404 995,104 923,905
32 Non-controlling interestOutside equity interest in subsidiaries comprises:
Interest in accumulated funds at the beginning of the year
66 386 – –
Interest in net operating result 124 (320) – –
Other adjustments (60) – – –
Interest in accumulated funds at the end of the year
130 66 – –
Interest in share capital 120 120 – –
Interest in reserves 28 28 – –
Total outside equity interests in controlled entities 278 214 – –
33 ContingenciesContingent liabilities
The RMIT Consolidated Entity and RMIT have contingent liabilities at 31 December in respect of:
Guarantees
Contract performance guarantee 28 28 28 28
Security deposit guarantee 20 20 20 20
Non-trade letter of credit/accommodation 63 42 63 42
Lease guarantee 141 266 – –
Total Guarantees 252 356 111 90

78
Notes to the Financial Statements 31 December 2014
Consolidated RMIT
2014 2013 2014 2013
Note $’000 $’000 $’000 $’000
34 Commitments
(a) Capital commitments
Capital expenditure contracted for at the reporting date but not recognised as liabilities is as follows:
Plant and equipment
Due within one year 10,444 13,285 10,444 13,285
GST reclaimable on the above (568) (1,052) (568) (1,052)
Net Commitment 9,876 12,233 9,876 12,233
Building works
Due within one year 212,590 141,947 211,744 141,717
GST reclaimable on the above (19,249) (12,879) (19,249) (12,879)
Net Commitment 193,341 129,068 192,495 128,838
(b) Operating leases – as lessee
Commitments in relation to leases contracted for at the reporting date but not recognised as liabilities payable:
Future minimum rental payments for leased premises
Due within one year 7,681 9,330 4,383 7,098
Due after one year but within five years 19,759 14,205 13,314 12,380
Due after five years 2,569 3,870 1,585 3,570
30,009 27,405 19,282 23,048
GST payable on the above (1,889) (2,286) (1,753) (2,095)
Net Commitment 28,120 25,119 17,529 20,952
Future minimum rental payments for leased equipment
Due within one year 5,251 4,915 5,251 4,915
Due after one year but within five years 4,873 3,567 4,873 3,567
10,124 8,482 10,124 8,482
GST reclaimable on the above (920) (771) (920) (771)
Net Commitment 9,204 7,711 9,204 7,711
Operating leases – as lessor
Leases contracted for at the reporting date but not recognised as assets
Future minimum rental receivable
Due within one year 2,538 2,759 2,535 2,756
Due after one year but within five years 2,918 5,428 2,918 5,428
5,456 8,187 5,453 8,184
GST reclaimable on the above (497) (744) (496) (744)
Net Commitment 4,959 7,443 4,957 7,440
(c) Other expenditure commitments
Commitments related to CRC research and other non capital expenditure
Due within one year 32,521 35,864 32,521 35,864
Due after one year but within five years 2,922 1,355 2,922 1,355
35,443 37,219 35,443 37,219
GST reclaimable on the above (2,691) (3,000) (2,691) (3,000)
Net Commitment 32,752 34,219 32,752 34,219

ROYAL MELBOURNE INSTITUTE OF TECHNOLOGY AND SUBSIDIARIES 79
Notes to the Financial Statements 31 December 2014
34 Commitments (continued)
Consolidated RMIT
2014 2013 2014 2013
Note $’000 $’000 $’000 $’000
The University has entered into research contracts with the National Health and Medical Research Council and the Australian Research Council, the revenues from which are recognised in the year of receipt. Under these contracts and as at balance date the University is committed to further expenditure to complete the relevant research and satisfy those commitments. 19,121 15,223 19,121 15,223
(d) Remuneration commitments
Commitments for the payment of salaries and other remuneration under long-term employment contracts in existence at the reporting date but not recognised as liabilities.
Due within one year 47,609 62,515 47,609 62,515
Due after one year but within five years 43,780 55,127 43,780 55,127
Due after five years 240 355 240 355
91,629 117,997 91,629 117,997
35 Notes to statement of cash flows
(a) Reconciliation of cash
For the purpose of the statement of cash flows, cash represents:
Cash on hand, at bank, short term money market deposits, short dated bills of exchange and outstanding bank overdrafts.
Cash at the end of the reporting period is shown in the Statement of Cash Flows and is reconciled to the related items in the financial statements as follows:
Cash at the beginning of year
Cash at bank and on hand 10,027 9,459 7,181 8,240
Short-term money market deposits 108,671 82,024 82,232 71,781
Foreign currency bank accounts 16,412 17,634 – –
135,110 109,117 89,413 80,021
Cash at the end of year
Cash at bank and on hand 11,025 10,027 6,695 7,181
Short-term money market deposits 86,218 108,671 77,084 82,232
Foreign currency bank accounts 13,477 16,412 – –
110,720 135,110 83,779 89,413
Cash movement for the year (24,390) 25,993 (5,634) 9,392

80
Notes to the Financial Statements 31 December 2014
(b) Reconciliation of operating result after income tax to net cash inflow from operating activities
Operating result for the period after income tax 75,599 67,057 71,199 50,072
Loss/(gain) on sale of property, plant and equipment
8 & 16 (59) (192) (62) (189)
Loss/(gain) on sale of available-for-sale financial assets
8 (22) (4,899) – –
Loss/(gain) on sale of other non-financial assets 10 – – –
Distribution income re-invested (2,226) (665) – –
Depreciation of property plant and equipment 10 65,830 77,410 58,859 70,570
Amortisation of intangible assets 10 462 272 – –
Net asset impairment loss/(gain) 13 (4,038) 9,306 (4,228) 9,306
Bad debt written off 13 (47) – (49) –
Provision for doubtful debts 72 59 – –
Investment written off/(written back) 13 8 14 – –
Foreign exchange (gain)/loss 505 (114) 405 88
Write off of plant and equipment 8 38 – –
Change in assets and liabilities
Net (increase)/decrease in receivables 4,330 125,044 5,058 118,440
Net (increase)/decrease in inventories (50) (1,142) (129) (1,159)
Net (increase)/decrease in other non-financial assets (968) 1,128 (1,028) 1,129
Net (increase)/decrease in deferred tax assets (337) (153) – –
Net (increase)/decrease in other financial assets (257) 97 4 –
Net increase/(decrease) in payables 1,097 18,307 (1,954) 847
Net Increase/(decrease) in borrowings – – 3,074 7,440
Net increase/(decrease) in other liabilities (3,253) (116,756) (3,309) (118,127)
Net increase/(decrease) in current tax liability 317 12 508 386
Net increase/(decrease) in employee entitlements (excluding deferred superannuation)
13,615 (314) 11,035 (883)
Net cash flows from operating activities 150,594 174,515 139,383 137,920
36 Economic dependency
The RMIT Consolidated Entity is reliant on a significant volume of its revenue being derived from:
Commonwealth Government financial assistance 547,144 630,543 547,144 630,543
Victorian State Government financial assistance 34,195 37,572 34,195 37,572
581,339 668,115 581,339 668,115
The percentage of the RMIT consolidated entity revenue was sourced from:
Commonwealth Government financial assistance 50.65% 55.16% 55.25% 59.74%
Victorian State Government financial assistance 3.17% 3.29% 3.45% 3.56%
35 Notes to statement of cash flows (continued)
Consolidated RMIT
2014 2013 2014 2013
Note $’000 $’000 $’000 $’000

ROYAL MELBOURNE INSTITUTE OF TECHNOLOGY AND SUBSIDIARIES 81
Notes to the Financial Statements 31 December 2014
37 Events occurring after the balance sheet date
No matters or circumstances have arisen since the end of the reporting period which significantly affected or may significantly affect the operations of the RMIT consolidated entity or parent entity, the results of those operations, or the state of affairs of the RMIT consolidated entity or parent entity in future financial years.
38 Superannuation
Funds to which RMIT or any controlled entity contributed during the financial year:
(a) Defined benefit schemes
ESSSUPER – State Superannuation Fund – closed 9 22,320 21,884 22,320 21,884
(b) Defined contribution schemes
Victorian Superannuation Fund 2,292 2,313 2,252 2,273
UniSuper 41,055 38,794 41,028 38,767
Other Superannuation Funds 19,602 17,469 18,317 16,184
85,269 80,460 83,917 79,108
ESSSUPER
ESSSuper is the dedicated super fund for emergency services employees and state employees. RMIT has in its staffing profile a number of employees who are members of ESSSuper (formerly called the Victorian State Superannuation Fund or the State Employees Retirement Benefit Scheme) and in respect of whom defined benefits are payable on termination of employment.
As at 30 June 2014, ESSSuper were carrying total liabilities for member benefits in excess of the value of the fund’s assets. Hence, unfunded superannuation liabilities exist which are recognised in the financial statements of the funds.
The notional share of this public sector employee superannuation funds unfunded liabilities attributable to RMIT, as assessed by the funds as at 30 June 2014, amounted to $334.74m (2013 – $336.60m). Unfunded liabilities are met by the Australian Government. The net movement for the financial year presented in the Statement of Comprehensive Income is $1.86m (2013 – $130.64m).
There was no other unfunded superannuation liability for any other scheme.
(i) Defined benefit schemes
ESSSUPER – State Superannuation Fund
RMIT is required to contribute as and when the Higher Education Sector contributors become beneficiaries under the scheme (Emerging cost). The employer’s contribution is that which is required to meet the defined benefit.
RMIT is required to contribute on a fortnightly basis for VET employees in respect of:
– Revised Scheme 17.30%
– New Scheme 7.40%, 8.60%, 9.50% or 10.30% based on members election.
ESSSUPER – State Employees Retirement Benefit Scheme
RMIT contributes 100.00% of pensions paid in respect of former employees.
(ii) Defined contribution schemes
Victorian Superannuation Fund
RMIT is required to contribute on account of members of the fund at the rate required to meet the “Superannuation Guarantee” – currently 9.5%.
UniSuper Plans
UniSuper is a multi employer superannuation fund operated by UniSuper Limited as the Corporate Trustee and administered by UniSuper Management Pty Ltd, a wholly owned subsidiary of UniSuper Limited. The operations of UniSuper are regulated by the Superannuation Industry (Supervision) Act 1993.
(i) UniSuper offers eligible members the choice of two schemes known as the Defined Benefit Division (DBD) (previously referred to as Defined Benefit Plan) or Accumulation Super (2) (previously referred to as Investment Choice Plan). The contribution rate to the scheme is 21.00% of member’s salary of which the member contributes 7.00% and the University 14.00%. From 1 July 2006, members can elect to reduce the level of member contributions with corresponding reductions in benefits.
Consolidated RMIT
2014 2013 2014 2013
Note $’000 $’000 $’000 $’000
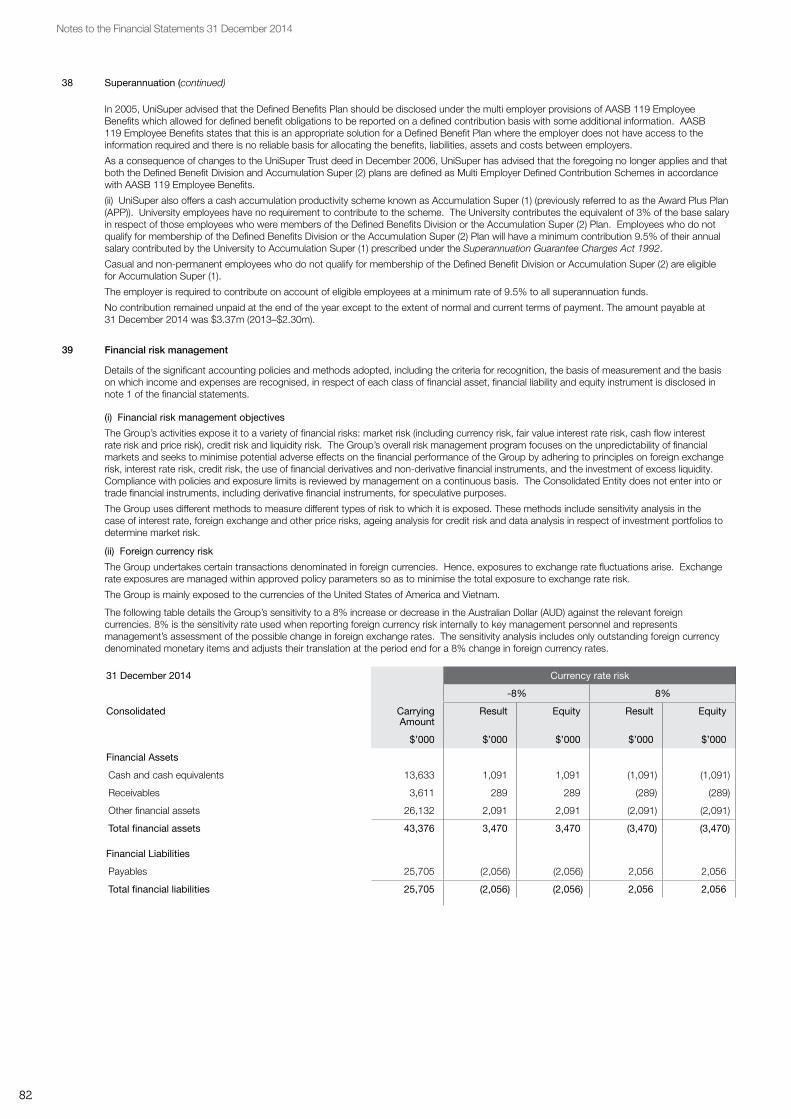
82
Notes to the Financial Statements 31 December 2014
38 Superannuation (continued)
In 2005, UniSuper advised that the Defined Benefits Plan should be disclosed under the multi employer provisions of AASB 119 Employee Benefits which allowed for defined benefit obligations to be reported on a defined contribution basis with some additional information. AASB 119 Employee Benefits states that this is an appropriate solution for a Defined Benefit Plan where the employer does not have access to the information required and there is no reliable basis for allocating the benefits, liabilities, assets and costs between employers.
As a consequence of changes to the UniSuper Trust deed in December 2006, UniSuper has advised that the foregoing no longer applies and that both the Defined Benefit Division and Accumulation Super (2) plans are defined as Multi Employer Defined Contribution Schemes in accordance with AASB 119 Employee Benefits.
(ii) UniSuper also offers a cash accumulation productivity scheme known as Accumulation Super (1) (previously referred to as the Award Plus Plan (APP)). University employees have no requirement to contribute to the scheme. The University contributes the equivalent of 3% of the base salary in respect of those employees who were members of the Defined Benefits Division or the Accumulation Super (2) Plan. Employees who do not qualify for membership of the Defined Benefits Division or the Accumulation Super (2) Plan will have a minimum contribution 9.5% of their annual salary contributed by the University to Accumulation Super (1) prescribed under the Superannuation Guarantee Charges Act 1992.
Casual and non-permanent employees who do not qualify for membership of the Defined Benefit Division or Accumulation Super (2) are eligible for Accumulation Super (1).
The employer is required to contribute on account of eligible employees at a minimum rate of 9.5% to all superannuation funds.
No contribution remained unpaid at the end of the year except to the extent of normal and current terms of payment. The amount payable at 31 December 2014 was $3.37m (2013–$2.30m).
39 Financial risk management
Details of the significant accounting policies and methods adopted, including the criteria for recognition, the basis of measurement and the basis on which income and expenses are recognised, in respect of each class of financial asset, financial liability and equity instrument is disclosed in note 1 of the financial statements.
(i) Financial risk management objectives
The Group’s activities expose it to a variety of financial risks: market risk (including currency risk, fair value interest rate risk, cash flow interest rate risk and price risk), credit risk and liquidity risk. The Group’s overall risk management program focuses on the unpredictability of financial markets and seeks to minimise potential adverse effects on the financial performance of the Group by adhering to principles on foreign exchange risk, interest rate risk, credit risk, the use of financial derivatives and non-derivative financial instruments, and the investment of excess liquidity. Compliance with policies and exposure limits is reviewed by management on a continuous basis. The Consolidated Entity does not enter into or trade financial instruments, including derivative financial instruments, for speculative purposes.
The Group uses different methods to measure different types of risk to which it is exposed. These methods include sensitivity analysis in the case of interest rate, foreign exchange and other price risks, ageing analysis for credit risk and data analysis in respect of investment portfolios to determine market risk.
(ii) Foreign currency risk
The Group undertakes certain transactions denominated in foreign currencies. Hence, exposures to exchange rate fluctuations arise. Exchange rate exposures are managed within approved policy parameters so as to minimise the total exposure to exchange rate risk.
The Group is mainly exposed to the currencies of the United States of America and Vietnam.
The following table details the Group’s sensitivity to a 8% increase or decrease in the Australian Dollar (AUD) against the relevant foreign currencies. 8% is the sensitivity rate used when reporting foreign currency risk internally to key management personnel and represents management’s assessment of the possible change in foreign exchange rates. The sensitivity analysis includes only outstanding foreign currency denominated monetary items and adjusts their translation at the period end for a 8% change in foreign currency rates.
31 December 2014 Currency rate risk
-8% 8%
Consolidated Carrying Amount
Result Equity Result Equity
$’000 $’000 $’000 $’000 $’000
Financial Assets
Cash and cash equivalents 13,633 1,091 1,091 (1,091) (1,091)
Receivables 3,611 289 289 (289) (289)
Other financial assets 26,132 2,091 2,091 (2,091) (2,091)
Total financial assets 43,376 3,470 3,470 (3,470) (3,470)
Financial Liabilities
Payables 25,705 (2,056) (2,056) 2,056 2,056
Total financial liabilities 25,705 (2,056) (2,056) 2,056 2,056

ROYAL MELBOURNE INSTITUTE OF TECHNOLOGY AND SUBSIDIARIES 83
Notes to the Financial Statements 31 December 2014
31 December 2013 Currency rate risk
-14.0% 14.0%
Consolidated Carrying Amount
Result Equity Result Equity
$’000 $’000 $’000 $’000 $’000
Financial Assets
Cash and cash equivalents 17,765 2,487 2,487 (2,487) (2,487)
Receivables 3,717 520 520 (520) (520)
Other financial assets 13,250 1,855 1,855 (1,855) (1,855)
Total financial assets 34,732 4,862 4,862 (4,862) (4,862)
Financial Liabilities
Payables 19,900 (2,786) (2,786) 2,786 2,786
Total financial liabilities 19,900 (2,786) (2,786) 2,786 2,786
(iii) Interest rate risk
Interest rate exposures arise predominantly from assets bearing floating interest rates. The Group’s exposure to interest rates on financial assets is detailed in the liquidity risk management section of this note.
The Group adopts a policy of ensuring that for debt aged 1 year and greater between 20 and 80 percent of its exposure to changes in interest rates on borrowings is on a fixed-rate basis, taking into account assets with exposure to changes in interest rates. The Group enters into and designates interest rate swaps as hedges of the variability in cash flows attributable to interest rate risk.
The sensitivity analysis below has been determined based on the exposure to price adjustments at the reporting date and the stipulated change taking place at the beginning of the financial year and held constant throughout the reporting period. A 100 basis point increase or 50 basis point decrease is used when reporting interest rate risk as this represents management’s assessment of the possible change in interest rates:
31 December 2014 Interest rate risk
-0.50% 1.00 %
Consolidated Carrying Amount
Result Equity Result Equity
$’000 $’000 $’000 $’000 $’000
Financial Assets
Cash and cash equivalents 109,165 (546) (546) 1,092 1,092
Total financial assets 109,165 (546) (546) 1,092 1,092
Financial Liabilities
Borrowings 125,000 625 625 (1,250) (1,250)
Interest rate swap 885 (293) (479) 586 957
Total financial liabilities 125,885 332 146 (664) (293)
31 December 2013 Interest rate risk
-0.50% 1.00 %
Consolidated Carrying Amount
Result Equity Result Equity
$’000 $’000 $’000 $’000 $’000
Financial Assets
Cash and cash equivalents 135,110 (676) (676) 1,351 1,351
Total financial assets 135,110 (676) (676) 1,351 1,351
Financial Liabilities
Borrowings 110,000 550 550 (1,100) (1,100)
Interest rate swap 601 (400) (879) 800 1,757
Total financial liabilities 110,601 150 (329) (300) 657
39 Financial risk management (continued)
(ii) Foreign currency risk (continued)

84
Notes to the Financial Statements 31 December 2014
Consolidated Floating interest
rate $’000
Fixed Interest Maturing Non Interest Bearing $’000
Total
$’000Note
1 year or less $’000
1 to 5 years $’000
Over 5 years $’000
31 December 2014
Financial assets
Cash at bank and on hand 18 11,025 – – – – 11,025
Deposits at call 18 16,142 70,076 – – – 86,218
Foreign currency bank accounts 18 – 11,922 – – 1,555 13,477
Receivables, exclude deferred government contributions for superannuation
19 – – – – 28,070 28,070
Available for sale financial assets 21 – – – – 54,037 54,037
Deferred tax asset 17 – – – – 1,016 1,016
Term deposits held-to-maturity 22 – 28,132 – – – 28,132
Shares in non-related companies 22 – – – – 158 158
Total financial assets 27,167 110,130 – – 84,836 222,133
Weighted average interest rate 1.31% 2.88%
Financial liabilities
Trade and other payables, exclude interest rate swaps
26 – – – – 133,310 133,310
Interest rate swaps used for hedging #1 26 885 – – – – 885
Borrowings 27 125,000 – – – 3,868 128,868
Current tax liabilities 17 – – – – 4,947 4,947
Deferred tax liabilities 17 – – – – 4 4
Total financial liabilities 125,885 – – – 142,129 268,014
Weighted average interest rate 5.28%
Net financial assets (liabilities) (98,718) 110,130 – – (57,293) (45,881)
39 Financial risk management (continued)
(iv) Price Risk
Exposure to price risk arises due to the inherent risk of the possibility of unfavourable movements in the market value of the investments. The sensitivity analysis below has been determined based on the exposure to interest rates at the reporting date and the stipulated change taking place at the beginning of the financial year and held constant throughout the reporting period. A 10% increase or decrease is used when reporting on price risk as this represents management’s assessment of the possible change in prices:
31 December 2014 Price risk
-10.0% 10.0%
Consolidated Carrying Amount
Result Equity Result Equity
$’000 $’000 $’000 $’000 $’000
Financial Assets
Available for sale financial assets – equity 54,037 – (5,404) – 5,404
31 December 2013 Price risk
-10.0% 10.0%
Consolidated Carrying Amount
Result Equity Result Equity
$’000 $’000 $’000 $’000 $’000
Financial Assets
Available for sale financial assets – equity 28,001 – (2,800) – 2,800
(v) Liquidity risk
Ultimate responsibility for liquidity risk management rests with the entity’s governing body, which has built an appropriate liquidity risk management framework for the management of the Group’s short, medium and long-term funding and liquidity management requirements. The Group manages liquidity risk by maintaining adequate reserves and banking facilities by continuously monitoring forecast and actual cash flows and matching the maturity profiles of financial assets and liabilities.
The Group has also established a standby facility of $10 million to provide short-term cash should the need arise. Exposure to liquidity risk and the effective weighted average interest rate for each class of financial assets and financial liabilities is set out in the following table.

ROYAL MELBOURNE INSTITUTE OF TECHNOLOGY AND SUBSIDIARIES 85
Notes to the Financial Statements 31 December 2014
Credit risk refers to the risk that a counterparty will default on its contractual obligations resulting in financial loss to the entity. The Group has adopted a policy of only dealing with creditworthy counterparties, as a means of mitigating the risk of financial loss from defaults. The Group’s exposure and the credit ratings of its counterparties are continuously monitored and the aggregate value of transactions concluded is spread amongst approved counterparty limits that are reviewed and approved by management regularly.
The Group minimises concentrations of credit risk by undertaking transactions with a large number of customers and counterparties, spread across diverse industries and geographical areas and by performing extensive due diligence procedures on major new customers. Ongoing credit evaluation is performed on the financial condition of accounts receivable.
The carrying amount of financial assets recorded in the financial statements, grossed up for any allowances for losses, represents the Group’s maximum exposure to credit without taking account of the value of any collateral obtained.
The Group does not have any significant credit risk exposure to any single counterparty or any group of counterparties having similar characteristics. The credit risk on liquid funds is limited because the counterparties are banks with high credit-ratings assigned by international credit-rating agencies.
The Group has not obtained any collateral or other security for its financial assets.
31 December 2013
Financial assets
Cash at bank and on hand 18 10,027 – – – – 10,027
Deposits at call 18 42,545 66,126 – – – 108,671
Foreign currency bank accounts 18 1,915 14,498 – – – 16,412
Receivables, exclude deferred government contributions for superannuation
19 – – – – 32,028 32,028
Available for sale financial assets 21 – – – – 28,001 28,001
Deferred tax assets 17 – – – – 692 692
Term deposits 22 – 17,250 2,000 – – 19,250
Shares in non-related companies 22 – – – – 162 162
Total financial assets 54,487 97,874 2,000 – 60,883 215,243
Weighted average interest rate 1.64% 4.58% 4.45%
Financial liabilities
Trade and other payables, exclude interest rate swaps
26 – – – – 130,643 130,643
Interest rate swaps used for hedging #1 26 601 – – – – 601
Borrowings 27 110,000 – – – – 110,000
Current tax liabilities 17 – – – – 4,439 4,439
Deferred tax liabilities 17 – – – – 5 5
Total financial liabilities 110,601 – – – 135,087 245,688
Weighted average interest rate 5.33%
Net financial assets (liabilities) (56,114) 97,874 2,000 – (74,204) (30,445)
#1 The notional principal value for the interest rate swaps at 31 December 2014 was $80 million (31/12/2013: $80 million), $40 million maturing less than 1 year and $40 million maturing 1 to 5 years (31/12/2013: $80 million maturing 1 to 5 years). The average contracted fixed interest rate was 3.39% (2013: 3.39%).
(vi) Credit risk
39 Financial risk management (continued)
(v) Liquidity risk (continued)
Floating interest
rate $’000
Fixed Interest Maturing Non Interest Bearing $’000
Total
$’000Note
1 year or less $’000
1 to 5 years $’000
Over 5 years $’000

86
Notes to the Financial Statements 31 December 2014
2014 2013
Carrying Fair Carrying Fair
Amount Value Amount Value
Note $’000 $’000 $’000 $’000
Financial assets
Cash at bank and on hand 18 11,025 11,025 10,027 10,027
Deposits at call 18 86,218 86,218 108,671 108,671
Foreign currency bank accounts 18 13,477 13,477 16,412 16,412
Receivables, exclude deferred government contributions for superannuation
19 28,070 28,070 32,028 32,028
Available for sale financial assets 21 54,037 54,037 28,001 28,001
Term deposits 22 28,132 28,132 19,250 19,250
Unlisted shares in non-related companies
22 158 158 162 162
221,117 221,117 214,551 214,551
Financial liabilities
Trade and other payables 26 134,195 134,195 131,244 131,244
Borrowings 27 128,868 128,868 110,000 110,000
263,063 263,063 241,244 241,244
The net fair value of cash and cash equivalents and non-interest bearing monetary financial assets and financial liabilities of the consolidated entity approximates their carrying amounts.The net fair value of other monetary financial assets and financial liabilities is based upon market prices where a market exists or by discounting the expected future cash flows by the current interest rates for assets and liabilities with similar risk profiles.
(b) Fair value hierarchy
The Group categorises assets and liabilities measured at fair value into a hierarchy based on the level of inputs used in measurement.
Level 1 – quoted prices (unadjusted) in active markets for identical assets or liabilities Level 2 – inputs other than quoted prices within level 1 that are observable for the asset or liability either directly or indirectly Level 3 – inputs for the asset or liability that are not based on observable market data (unobservable inputs)
(i) Recognised fair value measurements
2014 Level 1 Level 2 Level 3
Note $’000 $’000 $’000 $’000
Financial assets
Available for sale financial assets 21 54,037 54,037 – –
Unlisted shares in non-related companies 22 158 – – 158
54,195 54,037 – 158
Non-financial assets
Land 23 438,885 – 33,975 404,910
Buildings 23 1,397,258 – 18,120 1,379,138
Leasehold Improvements 23 7,723 – – 7,723
Equipment, motor vehicles, furniture & fittings, library collection
23 124,936 – – 124,936
Artworks 23 8,677 – 8,677 –
1,977,479 – 60,772 1,916,707
40 Fair Value MeasurementsDetails of the significant accounting policies and methods adopted, including the criteria for recognition, the basis of measurement and the basis on which income and expenses are recognised, in respect of each class of financial asset, financial liability and equity instrument is disclosed in note 1 of the financial statements.
(a) Fair value measurements
The fair value of financial assets and financial liabilities must be estimated for recognition and measurement or for disclosure purposes.
Due to the short-term nature of the current receivables, their carrying value is assumed to approximate their fair value and based on credit history it is expected that the receivables that are neither past due nor impaired will be received when due.
The carrying amounts and aggregate net fair values of financial assets and liabilities at balance date are:

ROYAL MELBOURNE INSTITUTE OF TECHNOLOGY AND SUBSIDIARIES 87
Notes to the Financial Statements 31 December 2014
2014 Level 1 Level 2 Level 3
Note $’000 $’000 $’000 $’000
Financial liabilities
Interest rate swaps 26 885 – 885 –
885 – 885 –
2013 Level 1 Level 2 Level 3
Note $’000 $’000 $’000 $’000
Financial assets
Available for sale financial assets 21 28,001 28,001 – –
Unlisted shares in non-related companies 22 162 – – 162
28,163 28,001 – 162
Non-financial assets
Land 23 384,279 – 24,980 359,299
Buildings 23 1,247,777 – 17,765 1,230,012
Leasehold Improvements 23 9,180 – – 9,180
Equipment, motor vehicles, furniture & fittings, library collection
23 116,070 – – 116,070
Artworks 23 3,037 – 3,037 –
1,760,343 – 45,782 1,714,561
Financial liabilities
Interest rate swaps 26 601 – 601 –
601 – 601 –
Newly acquired land and buildings classified as Level 2 have been transferred to Level 3 in 2014 where categorised as specialised.
(ii) Disclosed fair values
The Group has a number of assets and liabilities which are not measured at fair value, but for which the fair values are disclosed in the notes.
The fair value of assets or liabilities traded in active markets (such as publicly traded derivatives, and trading and available for sale securities) is based on quoted market prices for identical assets or liabilities at the balance sheet date (level 1). This is the most representative of fair value in the circumstances.
The fair values of held to maturity investments and interests in associates that are disclosed in note 21 were determined by reference to published price quotations in an active market (level 1).
The carrying value less impairment provision of trade receivables and payables is a reasonable approximation of their fair values due to the short-term nature of trade receivables. The fair value of financial liabilities for disclosure purposes is estimated by discounting the future contractual cash flows at the current market interest rate that is available to the Group for similar financial instruments (level 3).
The fair value of non-current borrowings disclosed in note 27 is estimated by discounting the future contractual cash flows at the current market interest rates that are available to the group for similar financial instruments. For the period ending 31 December 2014, the borrowing rates were determined to be between 4.79% and 4.86% depending on the type of borrowing. The fair value of current borrowings approximates the carrying amount, as the impact of discounting is not significant (level 2).
Derivative contracts classified as held for trading are fair valued by comparing the contracted rate to the current market rate for a contract with the same remaining period to maturity.
(c) Valuation techniques used to derive level 2 and level 3 fair values
(i) Recurring fair value measurements
The fair value of financial instruments that are not traded in an active market (for example, over the counter derivatives) is determined using valuation techniques. These valuation techniques maximise the use of observable market data where it is available and rely as little as possible on entity specific estimates. If all significant inputs required to fair value an instrument are observable, the instrument is included in level 2.
If one or more of the significant inputs is not based on observable market data, the instrument is included in level 3. This is the case for unlisted equity securities, land (excluding vacant), buildings (excluding recently acquired) equipment and artworks.
The Group uses a variety of methods and makes assumptions that are based on market conditions existing at each balance date. Specific valuation techniques used to value financial instruments include:– The use of quoted market prices or dealer quotes for similar instruments
– The fair value of interest rate swaps is calculated as the present value of the estimated future cash flows based on observable yield curves
– The fair value of forward foreign exchange contracts is determined using forward exchange rates at the balance sheet date
– Other techniques, such as discounted cash flow analysis, are used to determine fair value for the remaining financial instruments
All of the resulting fair value estimates are included in level 2 except for unlisted equity securities which are included in level 3.
40 Fair Value Measurements (continued)
(i) Recognised fair value measurements (continued)

88
Notes to the Financial Statements 31 December 2014
40 Fair Value Measurements (continued)
(c) Valuation techniques used to derive level 2 and level 3 fair values (continued)
Land and buildings are valued independently each year. At the end of each reporting period, the Group updates their assessment of the fair value of each property, taking into account the most recent independent valuations. The Group determines the property’s value within a range of reasonable fair value estimates.
The best evidence of fair value is current prices in an active market for similar properties. Where such information is not available the Group considers information from a variety of sources, including:
– current prices in an active market for properties of different nature or recent prices of similar properties in less active markets, adjusted to reflect those differences
– discounted cash flow projections based on reliable estimates of future cash flows
– capitalised income projections based on a property’s estimated net market income, and a capitalisation rate derived from an analysis of market evidence
All resulting fair value estimates for properties are included in level 3 except for vacant land and recently acquired land and buildings. The level 2 fair value of vacant land has been derived using the sales comparison approach. Sale prices of comparable land in close proximity are adjusted for differences in key attributes such as property size. The most significant input into this valuation approach is price per square metre.
(d) Fair value measurements using significant unobservable inputs (level 3)
The following table is a reconciliation of level 3 items for the periods ended 31 December 2014:
Level 3 Fair Value Measurements 2014 Land BuildingsLeasehold
improvementsEquipment Total
$’000 $’000 $’000 $’000 $’000
Opening balance 359,299 1,230,012 9,180 116,070 1,714,561
Purchases (sales) – 20 166 31,068 31,254
Transfers out of capital works in progress 1,585 54,126 1,684 13,178 70,573
Transfers in (out) of Level 3 1,550 950 – – 2,500
Depreciations – (25,777) (893) (38,713) (65,383)
Disposals – – – (403) (403)
Foreign Currency Translation Movement – 2,898 (2,414) 3,737 4,221
Subtotal 362,434 1,262,229 7,723 124,937 1,757,323
Revaluation 42,476 116,908 – – 159,384
Subtotal 42,476 116,908 – – 159,384
Closing balance 404,910 1,379,137 7,723 124,937 1,916,707
Level 3 Fair Value Measurements 2013 Land BuildingsLeasehold
improvementsEquipment Total
$’000 $’000 $’000 $’000 $’000
Opening balance 358,391 1,225,797 12,557 131,583 1,728,328
Purchases (sales) 675 125 672 27,065 28,537
Transfers out of capital works in progress 233 25,034 157 3,502 28,926
Transfers in (out) of Level 3 – – – – –
Depreciations – (25,265) (4,392) (47,378) (77,035)
Disposals – – (1) (503) (504)
Foreign Currency Translation Movement – 4,321 187 1,801 6,309
Subtotal 359,299 1,230,012 9,180 116,070 1,714,561
Revaluation – – – – –
Subtotal – – – – –
Closing balance 359,299 1,230,012 9,180 116,070 1,714,561
(i) The transfer into Level 3 in 2014 relates to a newly acquired building in December 2013 that formed part of Level 2 disclosure in 2013 due to its newly acquired status (eg. categorised as L2 in 2013 as depreciation would not be a significant unobservable input). As the building is ‘specialised’ and no longer ‘newly acquired’ it has been transferred into L3 in 2014.
(ii) Valuation inputs and relationships to fair value
The following table summarises the quantitative information about the significant unobservable inputs used in level 3 fair value measurements. See (c) above for the valuation techniques adopted.
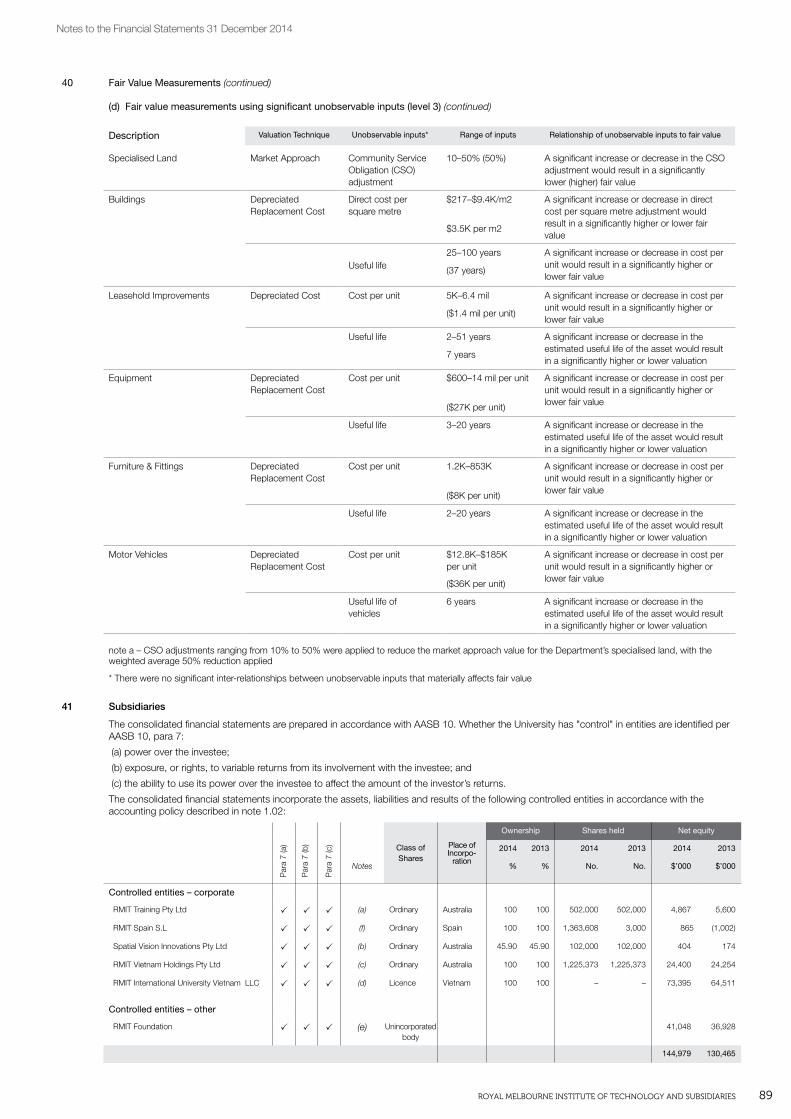
ROYAL MELBOURNE INSTITUTE OF TECHNOLOGY AND SUBSIDIARIES 89
Notes to the Financial Statements 31 December 2014
40 Fair Value Measurements (continued)
(d) Fair value measurements using significant unobservable inputs (level 3) (continued)
Description Valuation Technique Unobservable inputs* Range of inputs Relationship of unobservable inputs to fair value
Specialised Land Market Approach Community Service Obligation (CSO) adjustment
10–50% (50%) A significant increase or decrease in the CSO adjustment would result in a significantly lower (higher) fair value
Buildings Depreciated Replacement Cost
Direct cost per square metre
$217–$9.4K/m2 A significant increase or decrease in direct cost per square metre adjustment would result in a significantly higher or lower fair value
$3.5K per m2
Useful life25–100 years A significant increase or decrease in cost per
unit would result in a significantly higher or lower fair value
(37 years)
Leasehold Improvements Depreciated Cost Cost per unit 5K–6.4 mil A significant increase or decrease in cost per unit would result in a significantly higher or lower fair value
($1.4 mil per unit)
Useful life 2–51 years A significant increase or decrease in the estimated useful life of the asset would result in a significantly higher or lower valuation
7 years
Equipment Depreciated Replacement Cost
Cost per unit $600–14 mil per unit A significant increase or decrease in cost per unit would result in a significantly higher or lower fair value($27K per unit)
Useful life 3–20 years A significant increase or decrease in the estimated useful life of the asset would result in a significantly higher or lower valuation
Furniture & Fittings Depreciated Replacement Cost
Cost per unit 1.2K–853K A significant increase or decrease in cost per unit would result in a significantly higher or lower fair value($8K per unit)
Useful life 2–20 years A significant increase or decrease in the estimated useful life of the asset would result in a significantly higher or lower valuation
Motor Vehicles Depreciated Replacement Cost
Cost per unit $12.8K–$185K per unit
A significant increase or decrease in cost per unit would result in a significantly higher or lower fair value($36K per unit)
Useful life of vehicles
6 years A significant increase or decrease in the estimated useful life of the asset would result in a significantly higher or lower valuation
note a – CSO adjustments ranging from 10% to 50% were applied to reduce the market approach value for the Department’s specialised land, with the weighted average 50% reduction applied
* There were no significant inter-relationships between unobservable inputs that materially affects fair value
41 SubsidiariesThe consolidated financial statements are prepared in accordance with AASB 10. Whether the University has "control" in entities are identified per AASB 10, para 7:
(a) power over the investee;
(b) exposure, or rights, to variable returns from its involvement with the investee; and
(c) the ability to use its power over the investee to affect the amount of the investor’s returns.
The consolidated financial statements incorporate the assets, liabilities and results of the following controlled entities in accordance with the accounting policy described in note 1.02:
Class of Shares
Place of Incorpo-
ration
Ownership Shares held Net equity
2014 2013 2014 2013 2014 2013
Notes % % No. No. $’000 $’000
Controlled entities – corporate
RMIT Training Pty Ltd P P P (a) Ordinary Australia 100 100 502,000 502,000 4,867 5,600
RMIT Spain S.L P P P (f) Ordinary Spain 100 100 1,363,608 3,000 865 (1,002)
Spatial Vision Innovations Pty Ltd P P P (b) Ordinary Australia 45.90 45.90 102,000 102,000 404 174
RMIT Vietnam Holdings Pty Ltd P P P (c) Ordinary Australia 100 100 1,225,373 1,225,373 24,400 24,254
RMIT International University Vietnam LLC P P P (d) Licence Vietnam 100 100 – – 73,395 64,511
Controlled entities – other
RMIT Foundation P P P (e) Unincorporated body
41,048 36,928
144,979 130,465
Par
a 7
(a)
Par
a 7
(b)
Par
a 7
(c)

90
Notes to the Financial Statements 31 December 2014
42 Related partiesThe following related party transactions occurred during the financial year and were conducted on normal terms and conditions unless otherwise stated:
(a) Responsible persons and specified executives
The names, remuneration and retirement benefits of persons who were Councillors of RMIT and specified executives at any time during the financial year are set out in note 44.
(b) Controlled entities
Interests in subsidiaries is set out in note 41.
(c) Transactions with related parties
The following transactions occurred with related parties:
Aggregate amounts included in the determination of operating result from ordinary activities that resulted from transactions with each class of other related parties within the group:
Consolidated RMIT 2014 2013 2014 2013
Note $’000 $’000 $’000 $’000
Sale of services
Fees and charges – – 3,353 3,207
Donations and bequests – – 5,300 4,638
Rental income – – 1,246 1,182
Purchase of services
Expenditure in relation to delivery of programs – – – –
Grants, scholarships and prizes – – 5,300 19,110
Expenditure incurred on behalf of related parties
Audit fees – – 8 8
Loans advanced to/(repaid by) subsidiaries – – (3,027) 7,093
Interest expense – – 479 376
Interest income – – 41 33
(d) Outstanding balances
The following balances are outstanding at the reporting date in relation to transactions with related parties:
Current Receivables – – 6,158 9,185
Provision for impairment – – – (2,145)
Interest bearing liabilities – – 18,137 16,095
(e) Terms and conditions
All transactions were made on normal commercial terms and conditions and at market rates, except that there are no fixed terms for repayment of loans between the parties. The average interest rate on loans during the year was 2.60% (2013 – 2.87%).
Outstanding balances are unsecured and are repayable in cash.
Certain administrative services are provided by RMIT to a number of entities within the wholly owned group at no charge.
41 Subsidiaries (continued)
(a) RMIT Training Pty Ltd is a company incorporated under the Corporations Act 2001 with share capital of 502,000 ordinary shares of $1 each.
(b) Spatial Vision Innovations Pty Ltd is a company incorporated under the Corporations Act 2001 with ordinary shares of 222,222 (2013 - 222,222) of $1 each. The company is a subsidiary of RMIT by virtue of its financial control and the power to appoint the board. During 2013, RMIT negotiated with Spatial Vision an interest bearing intercompany loan facility of $250,000. $150,000 was drawn down in 2013 and has been fully repaid in 2014.
(c) RMIT Vietnam Holdings Pty Ltd (RVH) is a wholly owned entity of RMIT. The company’s principal activity is holding RMIT’s investment in RMIT International University Vietnam (RIUV) and to hold funds for distribution to operations at the RIUV Campus and RMIT’s investment in RIUV. Each year the RVH results will be affected by a timing difference between receipt of grants and the subsequent payment of those grants to RIUV.
(d) RMIT International University Vietnam is a wholly owned entity of RMIT Vietnam Holdings Pty Ltd. Its purpose is to provide advanced education to the Vietnamese community in Vietnam.
(e) RMIT Foundation is a trust. Its principal purpose is to raise funds, provide grants to RMIT for the conduct of research, provide for scholarships and student awards and to engage visiting scholars.
(f) RMIT has established a new subsidiary in Barcelona. The company was established in 2012. RMIT provided a capital injection of 3,000 Euros ($4.6K) in 2013 and an additional paid in capital of $1.36 million Euros ($2.02 million) in 2014. RMIT also provides financial assistance under a Letter of Support.

ROYAL MELBOURNE INSTITUTE OF TECHNOLOGY AND SUBSIDIARIES 91
Notes to the Financial Statements 31 December 2014
Consolidated RMIT 2014 2013 2014 2013
$’000 $’000 $’000 $’000
43 Remuneration of auditorsDuring the year, the following fees were paid for services provided by the auditor of the parent entity, its related practices and non-related audit firms:
Audit and review of the Financial Statements
Fees paid to Auditor-General of Victoria 378 354 273 266
Fees paid to PricewaterhouseCoopers 56 51 – –
Total auditing services 434 405 273 266
44 Key management personnel disclosures(a) Responsible persons related disclosures
In accordance with the directions of the Minister for Finance under the Financial Management Act 1994, the following disclosures are made for the responsible Ministers and responsible Members of Council.
(i) Minister
The Hon. Peter Hall, MLC was the Minister for Higher Education and Skills (1 Jan to 17 Mar 2014)
The Hon. Nick Wakeling, MP was the Minister for Higher Education and Skills (17 Mar to 3 Dec 2014)
The Hon. Steve Herbert, MP is the current Minister for Training and Skills.
Remuneration of these Ministers is disclosed in the financial statements of the Department of Premier and Cabinet.
Other relevant interests are declared in the Register of Members interests which is completed by each member of Parliament.
(ii) Names of responsible persons and executive officers
The following persons were responsible persons and executive officers of RMIT during the year:
Responsible persons
Council Members
Akhurst, B.
Duckett, S. (term commenced on 7 Apr 2014)
Gardner, M. (term concluded on 31 Aug 2014)
Hayward, D. (term commenced on 11 Feb 2014)
Hogan, G. (term commenced on 13 Oct 2014)
Latchford, J.
Lever, R.
Michelmore, J.
O’Donnell, R.
Palmer, G. (term commenced on 1 Sep 2014)
Paton, B.
Reid, J. (term commenced on 7 May 2014)
Schulze, M. (term concluded on 7 Jul 2014)
Switkowski, Z.
All responsbile persons have been in office since the start of the financial year to the date of this report unless otherwise noted above.
Executive Officers
Adams, D. (term concluded on 21 Feb 2014)
Barnes, J.
Coloe, P.
Cowlishaw, K. (term concluded on 28 Feb 2014)
Crisp, G. (term: 1 Sep 2014 to 31 Dec 2014)
De La Harpe, B. (term concluded on 14 Feb 14)
Drummond, C. (term commenced on 27 Jan 14)
Fudge, C.
Gillam, T. (term: 5 Aug 2014 to 31 Dec 2014)
Gough, P. (term commenced on 3 Feb 2014)
MacIntyre, A. (term commenced on 3 Mar 2014)
Palmer, G.
Palmer, I.
Somogyi, S.
Wells, J. (term concluded on 27 Jun 2014).
All executive officers have been in office since the start of the financial year to the date of this report unless otherwise noted above.

92
Notes to the Financial Statements 31 December 2014
44 Key management personnel disclosures (continued)
(b) Remuneration of responsible persons
Income paid or payable, or otherwise made available, to Councillors and/or directors by entities in the RMIT consolidated entity and related parties in connection with the management of affairs of the RMIT entity or its subsidiaries.
Consolidated RMIT 2014 2013 2014 2013
$’000 $’000 $’000 $’000
2,736 2,792 1,342 1,310
Number of RMIT Councillors and directors whose total remuneration from RMIT and any related bodies corporate was within the following bands:
2014 2013 2014 2013
No. No. No. No.
$ 0 – $ 10,000 14 12 4 3
$ 10,000 – $ 19,999 7 9 7 7
$ 70,000 – $ 79,999 – 1 – –
$110,000 – $119,999 – 1 – –
$120,000 – $129,999 – 1 – –
$130,000 – $139,999 – 1 – –
$170,000 – $179,999 1 – 1 –
$190,000 – $199,999 – 1 – –
$200,000 – $299,999 1 – – –
$240,000 – $249,999 – 2 – 1
$270,000 – $279,999 1 – 1 –
$520,000 – $529,999 – 1 – –
$540,000 – $549,999 1 – – –
$630,000 – $639,999 1 – – –
$770,000 – $779,999 1 – 1 –
$940,000 – $949,999 – 1 – 1
27 30 14 12
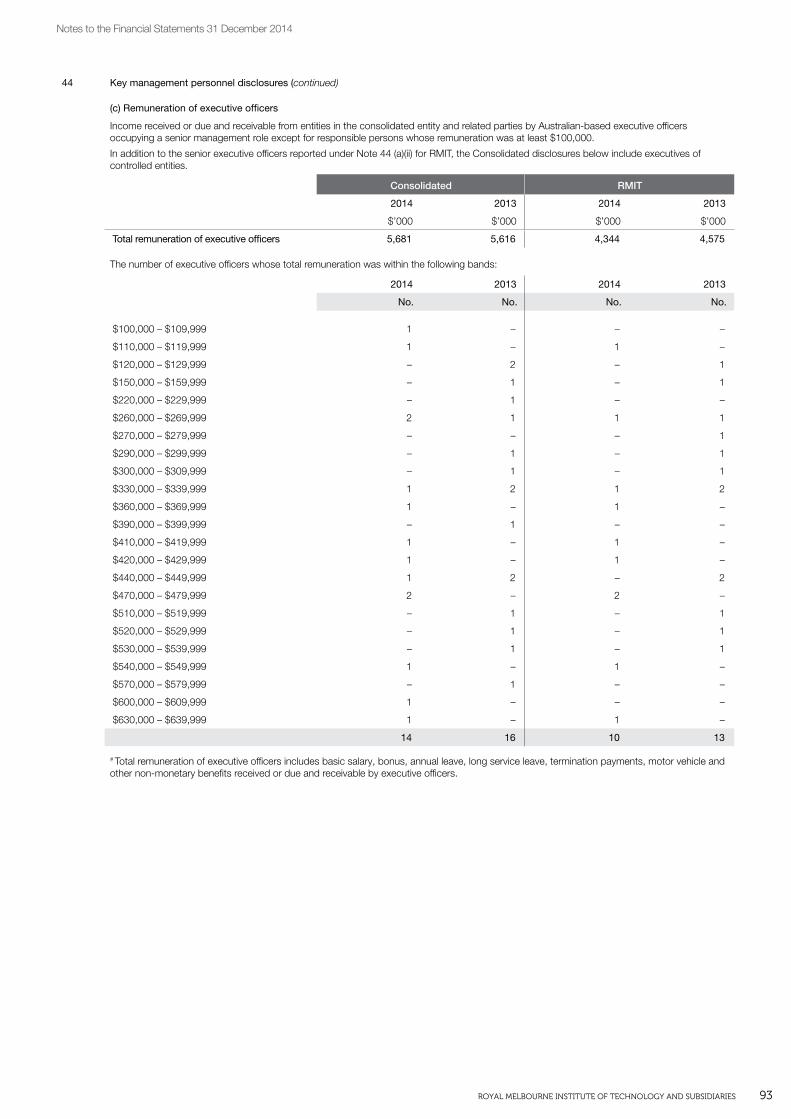
ROYAL MELBOURNE INSTITUTE OF TECHNOLOGY AND SUBSIDIARIES 93
Notes to the Financial Statements 31 December 2014
44 Key management personnel disclosures (continued)
(c) Remuneration of executive officers
Income received or due and receivable from entities in the consolidated entity and related parties by Australian-based executive officers occupying a senior management role except for responsible persons whose remuneration was at least $100,000.
In addition to the senior executive officers reported under Note 44 (a)(ii) for RMIT, the Consolidated disclosures below include executives of controlled entities.
Consolidated RMIT 2014 2013 2014 2013
$’000 $’000 $’000 $’000
Total remuneration of executive officers 5,681 5,616 4,344 4,575
The number of executive officers whose total remuneration was within the following bands:
2014 2013 2014 2013
No. No. No. No.
$100,000 – $109,999 1 – – –
$110,000 – $119,999 1 – 1 –
$120,000 – $129,999 – 2 – 1
$150,000 – $159,999 – 1 – 1
$220,000 – $229,999 – 1 – –
$260,000 – $269,999 2 1 1 1
$270,000 – $279,999 – – – 1
$290,000 – $299,999 – 1 – 1
$300,000 – $309,999 – 1 – 1
$330,000 – $339,999 1 2 1 2
$360,000 – $369,999 1 – 1 –
$390,000 – $399,999 – 1 – –
$410,000 – $419,999 1 – 1 –
$420,000 – $429,999 1 – 1 –
$440,000 – $449,999 1 2 – 2
$470,000 – $479,999 2 – 2 –
$510,000 – $519,999 – 1 – 1
$520,000 – $529,999 – 1 – 1
$530,000 – $539,999 – 1 – 1
$540,000 – $549,999 1 – 1 –
$570,000 – $579,999 – 1 – –
$600,000 – $609,999 1 – – –
$630,000 – $639,999 1 – 1 –
14 16 10 13
# Total remuneration of executive officers includes basic salary, bonus, annual leave, long service leave, termination payments, motor vehicle and other non-monetary benefits received or due and receivable by executive officers.
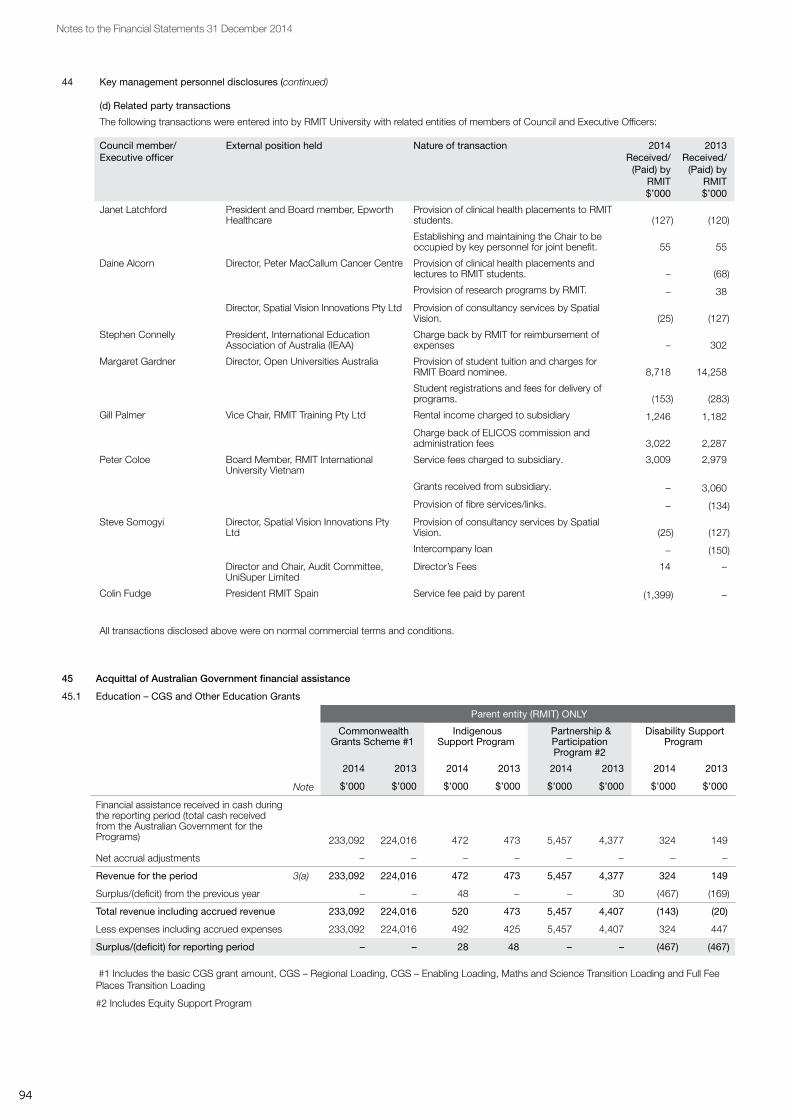
94
Notes to the Financial Statements 31 December 2014
44 Key management personnel disclosures (continued)
(d) Related party transactions
The following transactions were entered into by RMIT University with related entities of members of Council and Executive Officers:
Council member/Executive officer
External position held Nature of transaction 2014 Received/
(Paid) by RMIT $’000
2013 Received/
(Paid) by RMIT $’000
Janet Latchford President and Board member, Epworth Healthcare
Provision of clinical health placements to RMIT students. (127) (120)
Establishing and maintaining the Chair to be occupied by key personnel for joint benefit. 55 55
Daine Alcorn Director, Peter MacCallum Cancer Centre Provision of clinical health placements and lectures to RMIT students. – (68)
Provision of research programs by RMIT. – 38
Director, Spatial Vision Innovations Pty Ltd Provision of consultancy services by Spatial Vision. (25) (127)
Stephen Connelly President, International Education Association of Australia (IEAA)
Charge back by RMIT for reimbursement of expenses – 302
Margaret Gardner Director, Open Universities Australia Provision of student tuition and charges for RMIT Board nominee. 8,718 14,258
Student registrations and fees for delivery of programs. (153) (283)
Gill Palmer Vice Chair, RMIT Training Pty Ltd Rental income charged to subsidiary 1,246 1,182
Charge back of ELICOS commission and administration fees 3,022 2,287
Peter Coloe Board Member, RMIT International University Vietnam
Service fees charged to subsidiary. 3,009 2,979
Grants received from subsidiary. – 3,060
Provision of fibre services/links. – (134)
Steve Somogyi Director, Spatial Vision Innovations Pty Ltd
Provision of consultancy services by Spatial Vision. (25) (127)
Intercompany loan – (150)
Director and Chair, Audit Committee, UniSuper Limited
Director’s Fees 14 –
Colin Fudge President RMIT Spain Service fee paid by parent (1,399) –
All transactions disclosed above were on normal commercial terms and conditions.
45 Acquittal of Australian Government financial assistance45.1 Education – CGS and Other Education Grants
Parent entity (RMIT) ONLY
Commonwealth Grants Scheme #1
Indigenous Support Program
Partnership & Participation Program #2
Disability Support Program
2014 2013 2014 2013 2014 2013 2014 2013
Note $’000 $’000 $’000 $’000 $’000 $’000 $’000 $’000
Financial assistance received in cash during the reporting period (total cash received from the Australian Government for the Programs) 233,092 224,016 472 473 5,457 4,377 324 149
Net accrual adjustments – – – – – – – –
Revenue for the period 3(a) 233,092 224,016 472 473 5,457 4,377 324 149
Surplus/(deficit) from the previous year – – 48 – – 30 (467) (169)
Total revenue including accrued revenue 233,092 224,016 520 473 5,457 4,407 (143) (20)
Less expenses including accrued expenses 233,092 224,016 492 425 5,457 4,407 324 447
Surplus/(deficit) for reporting period – – 28 48 – – (467) (467)
#1 Includes the basic CGS grant amount, CGS – Regional Loading, CGS – Enabling Loading, Maths and Science Transition Loading and Full Fee Places Transition Loading
#2 Includes Equity Support Program

ROYAL MELBOURNE INSTITUTE OF TECHNOLOGY AND SUBSIDIARIES 95
Notes to the Financial Statements 31 December 2014
Notes to the Financial Statements 31 December 2013
45 Acquittal of Australian Government financial assistance (continued)
45.1 Education – CGS and Other Education Grants (continued)
Parent entity (RMIT) ONLY
Diversity and Structural
Adjustment Fund #3
Transitional Cost Program
Promo of Exc in Learn and Teaching
Reward Funding
2014 2013 2014 2013 2014 2013 2014 2013
Note $'000 $'000 $'000 $'000 $'000 $'000 $'000 $'000
Financial assistance received in cash during the reporting period (total cash received from the Australian Government for the Programs) – – – – 535 387 – 530
Net accrual adjustments – – – – – (374) – –
Revenue for the period 3(a) – – – – 535 13 – 530
Surplus/(deficit) from the previous year (11) (11) – 94 5 27 – 496
Total revenue including accrued revenue (11) (11) – 94 540 40 – 1,026
Less expenses including accrued expenses – – – 94 323 35 – 1,026
Surplus/(deficit) for reporting period (11) (11) – – 217 5 – –
#3 includes Collaboration and Structural Adjustment Program
Parent entity (RMIT) ONLY
Australian Maths & Science Partnership
Program
Total
2014 2013 2014 2013
Note $'000 $'000 $'000 $'000
Financial assistance received in cash during the reporting period (total cash received from the Australian Government for the Programs) 520 539 240,401 230,471
Net accrual adjustments – – – (374)
Revenue for the period 3(a) 520 539 240,401 230,097
Surplus/(deficit) from the previous year 234 – (191) 467
Total revenue including accrued revenue 754 539 240,210 230,564
Less expenses including accrued expenses 32 305 239,721 230,755
Surplus/(deficit) for reporting period 722 234 489 (191)
45.2 Higher Education Loan Programs (excl OS-HELP)
Parent entity (RMIT) ONLY
HECS-HELP (Australian
Government payments only)
FEE-HELP #4 VET FEE-HELP SA HELP
2014 2013 2014 2013 2014 2013 2014 2013
Note $'000 $'000 $'000 $'000 $'000 $'000 $'000 $'000
Cash Payable/(Receivable) at beginning of year – – (427) (1,360) 8,780 (376) 2,696 (878)
Financial assistance received in Cash during the reporting period 159,536 135,590 36,554 35,476 10,214 25,355 954 6,899
Cash available for period 159,536 135,590 36,126 34,116 18,994 24,979 3,650 6,021
Revenue earned 3(b) 159,536 135,590 38,257 34,543 20,024 16,199 3,628 3,325
Cash Payable/(Receivable) at end of year – – (2,131) (427) (1,030) 8,780 22 2,696
#4 Program is in respect of FEE-HELP for Higher Education only and excluded funds received in respect of VET FEE-HELP

96
Notes to the Financial Statements 31 December 2014
Notes to the Financial Statements 31 December 2013
Parent entity (RMIT) ONLY
Total
2014
$'000
2013
$'000Note
Cash Payable/(Receivable) at beginning of year 11,049 (2,614)
Financial assistance received in Cash during the reporting period 207,257 203,320
Cash available for period 218,306 200,706
Revenue earned 3(b) 221,445 189,657
Cash Payable/(Receivable) at end of year (3,139) 11,049
45 Acquittal of Australian Government financial assistance (continued)
45.2 Higher Education Loan Programs (excl OS-HELP) (continued)
45.3 ScholarshipsParent entity (RMIT) ONLY
Australian Postgraduate
Awards
International Postgraduate
Research Scholarships
Commonwealth Education Costs Scholarships #5
Commonwealth Accommodation Scholarships #5
2014 2013 2014 2013 2014 2013 2014 2013
Note $'000 $'000 $'000 $'000 $'000 $'000 $'000 $'000
Financial assistance received in cash during the reporting period (total cash received from the Australian Government for the Programs) 5,345 4,883 411 409 (43) (645) – (13)
Net accrual adjustments – – – – – – – –
Revenue for the period 3(c) 5,345 4,883 411 409 (43) (645) – (13)
Surplus/(deficit) from the previous year 1,247 863 (174) (175) (430) 320 (118) (51)
Total revenue including accrued revenue 6,592 5,746 237 234 (473) (325) (118) (64)
Less expenses including accrued expenses 5,491 4,499 407 408 – 105 – 54
Surplus/(deficit) for reporting period 1,101 1,247 (170) (174) (473) (430) (118) (118)
Parent entity (RMIT) ONLY
Indigenous Access Scholarships
Total
2014 2013 2014 2013
Note $'000 $'000 $'000 $'000
Financial assistance received in cash during the reporting period (total cash received from the Australian Government for the Programs) 54 65 5,767 4,699
Net accrual adjustments – – – –
Revenue for the period 3(c) 54 65 5,767 4,699
Surplus/(deficit) from the previous year – – 525 957
Total revenue including accrued revenue 54 65 6,292 5,656
Less expenses including accrued expenses 54 65 5,951 5,131
Surplus/(deficit) for reporting period – – 341 525
#5 Includes Grandfathered Scholarships, National Priority and National Accommodation Priority Scholarship respectively
ROYAL MELBOURNE INSTITUTE OF TECHNOLOGY AND SUBSIDIARIES 97
Notes to the Financial Statements 31 December 2014
45 Acquittal of Australian Government financial assistance (continued)
45.4 Education Research
Parent entity (RMIT) ONLY
Joint research Engagement
Research Training Scheme
Research Infrastructure Block
Grants
JRE Engineering Cadetships
2014 2013 2014 2013 2014 2013 2014 2013
Note $'000 $'000 $'000 $'000 $'000 $'000 $'000 $'000
Financial assistance received in cash during the reporting period (total cash received from the Australian Government for the Programs) 7,157 6,284 13,471 13,550 2,048 1,887 82 49
Net accrual adjustments – – – – – – – –
Revenue for the period 3(d) 7,157 6,284 13,471 13,550 2,048 1,887 82 49
Surplus/(deficit) from the previous year 250 – – – – 14 50 12
Total revenue including accrued revenue 7,407 6,284 13,471 13,550 2,048 1,901 132 61
Less expenses including accrued expenses 7,407 6,034 13,471 13,550 2,048 1,901 24 11
Surplus/(deficit) for reporting period – 250 – – – – 107 50
Parent entity (RMIT) ONLY
Australian Scheme for Higher Education
Repositories
Sustainable Research Excellence
in UniversitiesTotal
2014 2013 2014 2013 2014 2013
Note $'000 $'000 $'000 $'000 $'000 $'000
Financial assistance received in cash during the reporting period (total cash received from the Australian Government for the Programs) – – 1,678 1,602 24,436 23,372
Net accrual adjustments – – – – – –
Revenue for the period 3(d) – – 1,678 1,602 24,436 23,372
Surplus/(deficit) from the previous year – – 509 436 809 462
Total revenue including accrued revenue – – 2,187 2,038 25,245 23,834
Less expenses including accrued expenses – – 2,187 1,529 25,137 23,025
Surplus/(deficit) for reporting period – – – 509 107 809
45.5 Australian Research Council Grants
(a) Discovery
Parent entity (RMIT) ONLY
Projects Fellowships Total
2014 2013 2014 2013 2014 2013
Note $'000 $'000 $'000 $'000 $'000 $'000
Financial assistance received in cash during the reporting period (total cash received from the Australian Government for the Programs) 6,356 4,608 1,959 1,305 8,315 5,913
Net Accrual adjustments – – – – – –
Revenue for the period 3(e)(i) 6,356 4,608 1,959 1,305 8,315 5,913
Surplus/(deficit) from the previous year 2,666 2,342 1,208 1,349 3,874 3,691
Total revenue including accrued revenue 9,022 6,950 3,167 2,654 12,189 9,604
Less expenses including accrued expenses 5,547 4,284 1,826 1,446 7,373 5,730
Surplus/(deficit) for reporting period 3,475 2,666 1,341 1,208 4,816 3,874

98
Notes to the Financial Statements 31 December 2014
45 Acquittal of Australian Government financial assistance (continued)
45.5 Australian Research Council Grants (continued)
(b) Linkages
Parent entity (RMIT) ONLY
Infrastructure Projects Total
2014 2013 2014 2013 2014 2013
Note $'000 $'000 $'000 $'000 $'000 $'000
Financial assistance received in cash during the reporting period (total cash received from the Australian Government for the Programs) 500 – 3,421 2,660 3,921 2,660
Net Accrual adjustments – – – 15 – 15
Revenue for the period 3(e)(ii) 500 – 3,421 2,675 3,921 2,675
Surplus/(deficit) from the previous year 90 587 2,028 1,716 2,118 2,303
Total revenue including accrued revenue 590 587 5,449 4,391 6,039 4,978
Less expenses including accrued expenses
500 497 2,988 2,363 3,488 2,860
Surplus/(deficit) for reporting period 90 90 2,461 2,028 2,551 2,118
45.6 OS-HELPParent entity (RMIT)
ONLY
2014 2013
Note $'000 $'000
Cash Received during the reporting period 3,289 889
Cash Spent during the reporting period 2,728 987
Net Cash received 3(g) 561 (98)
Cash Surplus/(deficit) from the previous period 263 361
Cash Surplus/(deficit) for reporting period 824 263
45.7 Superannuation SupplementationParent entity (RMIT)
ONLY
2014 2013
Note $'000 $'000
Cash Received during the reporting period 3(g) 22,550 20,156
University contribution in respect of current employees (22,965) (22,474)
Cash available (415) (2,318)
Cash Surplus/(deficit) from previous period (2,872) (554)
Cash available for current period 19,678 19,602
Contribution to specified defined benefit funds 22,965 22,474
Cash surplus/(deficit) this period (3,287) (2,872)
45.8 Student Services and Amenities FeeParent entity (RMIT)
ONLY
2014 2013
Note $'000 $'000
Unspent/(overspent) revenue from previous period – –
SA-HELP Revenue Earned 3,628 3,325
Student Services Fees direct from Students 11,058 10,153
Total revenue expendable in period 14,686 13,478
Student Services expenses during period (14,686) (13,478)
Unspent/(overspent) Student Services Revenue – –

ROYAL MELBOURNE INSTITUTE OF TECHNOLOGY AND SUBSIDIARIES 99
Balance Sheet for the years 2014 to 2010 inclusive
Consolidated RMIT
2014 2013 2012 2011 2010 2014 2013 2012 2011 2010
$’000 $’000 $’000 $’000 $'000 $’000 $’000 $’000 $’000 $'000
ASSETS
Current assets
Cash and cash equivalents 110,720 135,110 109,117 69,262 82,276 83,779 89,413 80,021 41,677 47,333
Receivables 49,534 52,794 50,003 57,029 59,402 53,553 56,958 49,500 59,320 63,062
Inventories 1,775 1,728 586 720 658 1,288 1,159 – – –
Other financial assets 28,132 17,250 8,800 7,200 – – – – – –
Other non–financial assets 12,410 11,138 12,493 8,774 8,653 10,308 9,280 10,409 7,148 6,983
Total current assets 202,571 218,020 180,999 142,985 150,989 148,928 156,810 139,930 108,145 117,378
Non–current assets
Receivables 313,274 315,830 443,839 339,833 339,134 313,210 315,894 443,787 339,781 339,082
Available for sale financial assets through equity
54,037 28,001 20,340 17,665 20,896 3,960 – – – –
Other financial assets 158 2,162 172 2,468 164 2,532 2,536 2,536 2,494 2,494
Property, plant and equipment 2,095,275 1,832,345 1,802,180 1,699,222 1,566,691 2,041,257 1,780,696 1,757,790 1,657,989 1,529,682
Deferred tax asset 1,016 692 749 231 183 – – – – –
Intangible assets 16,883 814 422 648 616 16,319 – – – –
Total non–current assets 2,480,643 2,179,844 2,267,702 2,060,067 1,927,685 2,377,278 2,099,126 2,204,113 2,000,264 1,871,258
Total assets 2,683,214 2,397,864 2,448,701 2,203,052 2,078,674 2,526,206 2,255,936 2,344,043 2,108,409 1,988,636
LIABILITIES
Current liabilities
Trade and other payables 134,195 131,242 93,399 83,841 105,975 83,333 85,287 65,579 59,585 86,923
Borrowings – – – – – 18,137 16,095 10,650 17,289 19,549
Provisions 130,656 118,794 122,797 113,326 104,010 129,237 117,378 121,436 111,874 102,635
Current tax liabilities 4,947 4,439 4,053 4,015 4,120 4,947 4,439 4,053 3,930 4,120
Other liabilities 73,109 76,234 62,769 57,638 71,038 59,991 63,066 50,527 44,178 57,772
Total current liabilities 342,907 330,709 283,018 258,820 285,142 295,645 286,265 252,245 236,856 270,999
Non–current liabilities
Borrowings 128,868 110,000 155,000 90,000 – 128,868 110,000 155,000 90,000 –
Provisions 328,916 329,638 456,972 350,611 349,428 328,104 328,928 456,243 349,907 348,700
Deferred tax liabilities 4 5 12 11 6 – – – – –
Other liabilities 303 397 490 – – – – – – –
Total non–current liabilities 458,091 440,040 612,474 440,622 349,433 456,972 438,928 611,243 439,907 348,700
Total liabilities 800,998 770,749 895,492 699,442 634,576 752,617 725,193 863,488 676,763 619,699
Net assets 1,882,216 1,627,115 1,553,209 1,503,610 1,444,098 1,773,589 1,530,743 1,480,555 1,431,646 1,368,937
Equity
RMIT entity interest
Reserves 814,984 635,497 628,628 628,246 623,663 778,485 606,838 606,722 607,419 599,983
Retained Earnings 1,066,954 991,404 924,047 874,666 819,803 995,104 923,905 873,833 824,227 768,954
Total RMIT entity interest 1,881,938 1,626,901 1,552,675 1,502,912 1,443,466 1,773,589 1,530,743 1,480,555 1,431,646 1,368,937
Outside equity interest in controlled entities 278 214 534 698 632 – – – – –
Total equity 1,882,216 1,627,115 1,553,209 1,503,610 1,444,098 1,773,589 1,530,743 1,480,555 1,431,646 1,368,937

100
Income Statement for the years 2014 to 2010 inclusive
Consolidated RMIT
2014 2013 2012 2011 2010 2014 2013 2012 2011 2010
$’000 $’000 $’000 $’000 $'000 $’000 $’000 $’000 $’000 $'000
Income from continuing operations
Australian Government financial assistance
Australian Government grants 308,965 295,194 276,248 246,216 242,397 308,965 295,194 276,248 246,216 242,397
HELP – Australian Government payments
221,445 189,657 145,925 126,740 111,598 221,445 189,657 145,925 126,740 111,598
State and Local Government financial assistance
31,686 34,393 56,892 64,728 86,615 31,686 34,393 56,892 64,728 86,615
HECS–HELP – Student Payments
22,063 22,241 21,182 16,991 16,629 22,063 22,241 21,182 16,991 16,629
Fees and charges 409,824 386,505 351,009 348,347 336,688 335,064 318,558 293,909 298,583 283,812
Investment income 7,683 6,735 7,209 7,889 7,230 5,271 4,840 5,101 5,002 6,158
Consultancy and contracts 35,663 33,820 36,670 41,275 37,971 31,873 30,704 32,417 34,980 31,837
Other revenue and income 40,986 43,882 30,662 30,605 30,301 32,168 29,341 28,988 24,016 27,599
1,078,315 1,012,427 925,797 882,791 869,428 988,535 924,928 860,662 817,256 806,646
Deferred government superannuation contributions 1,858 130,639 104,798 1,298 45,536 1,858 130,639 104,798 1,298 45,536
Total revenue from continuing operations 1,080,173 1,143,066
1,030,595 884,089 914,964 990,393
1,055,567 965,460 818,554 852,182
Expenses from continuing operations
Employee related expenses 607,932 557,254 549,929 515,786 490,513 554,754 511,667 506,925 472,868 450,694
Depreciation and amortisation 66,292 77,682 66,339 62,713 49,044 58,859 70,570 60,060 56,803 45,183
Repairs and maintenance 21,058 15,088 11,713 14,148 20,941 21,051 15,073 11,672 14,074 20,876
Finance costs 6,871 6,443 8,227 3,909 2 7,336 6,810 8,786 4,731 964
Impairment of assets (4,077) 12,604 3,904 792 5,394 (4,277) 14,628 4,296 1,505 5,798
Investment losses – – – 1,654 287 – – – – –
Other expenses 300,807 273,849 234,259 229,157 222,749 276,740 254,364 217,648 211,237 205,694
998,883 942,920 874,371 828,159 788,930 914,463 873,112 809,387 761,218 729,209
Deferred employee benefits for superannuation 1,858 130,639 104,798 1,298 45,536 1,858 130,639 104,798 1,298 45,536
Total expenses from continuing operations 1,000,741 1,073,559 979,169 829,457 834,466 916,321
1,003,751 914,185 762,516 774,745
Operating result before income tax 79,432 69,507 51,426 54,632 80,498 74,072 51,816 51,275 56,038 77,437
Income tax expense 3,833 2,450 2,192 1,270 1,744 2,873 1,744 1,670 765 993
Operating result from continuing operations 75,599 67,057 49,234 53,362 78,754 71,199 50,072 49,605 55,273 76,444
Operating result attributable to minority interest (124) 320 164 (96) (170) – – – – –
Operating result attributed to RMIT entity 75,475 67,377 49,398 53,266 78,584 71,199 50,072 49,605 55,273 76,444


www.rmit.edu.au