Global trends in telecom development - ITU · Global trends in telecom development ... Digital...
35
Global trends in telecom development Seminar in Niamey, April 2001 The original document is elaborated by Dr Tim Kelly, ITU/SPU. It has completed by Saburo Tanaka and by Pape-Gorgui Toure. The views expressed in this presentation are those of the authors, a nd do not necessarily reflect the opinions of the ITU or its membership. Authors can be contacted by e -mail at: [email protected] [email protected] [email protected].
Transcript of Global trends in telecom development - ITU · Global trends in telecom development ... Digital...
Global trends in telecom development
Seminar in Niamey, April 2001
The original document is elaborated by Dr Tim Kelly, ITU/SPU. It has completed by Saburo Tanaka and by Pape-Gorgui Toure. The views expressed in this presentation are those of the authors, and do not necessarily reflect the opinions of the ITU or its membership. Authors can be contacted by e -mail at: [email protected] [email protected] [email protected].
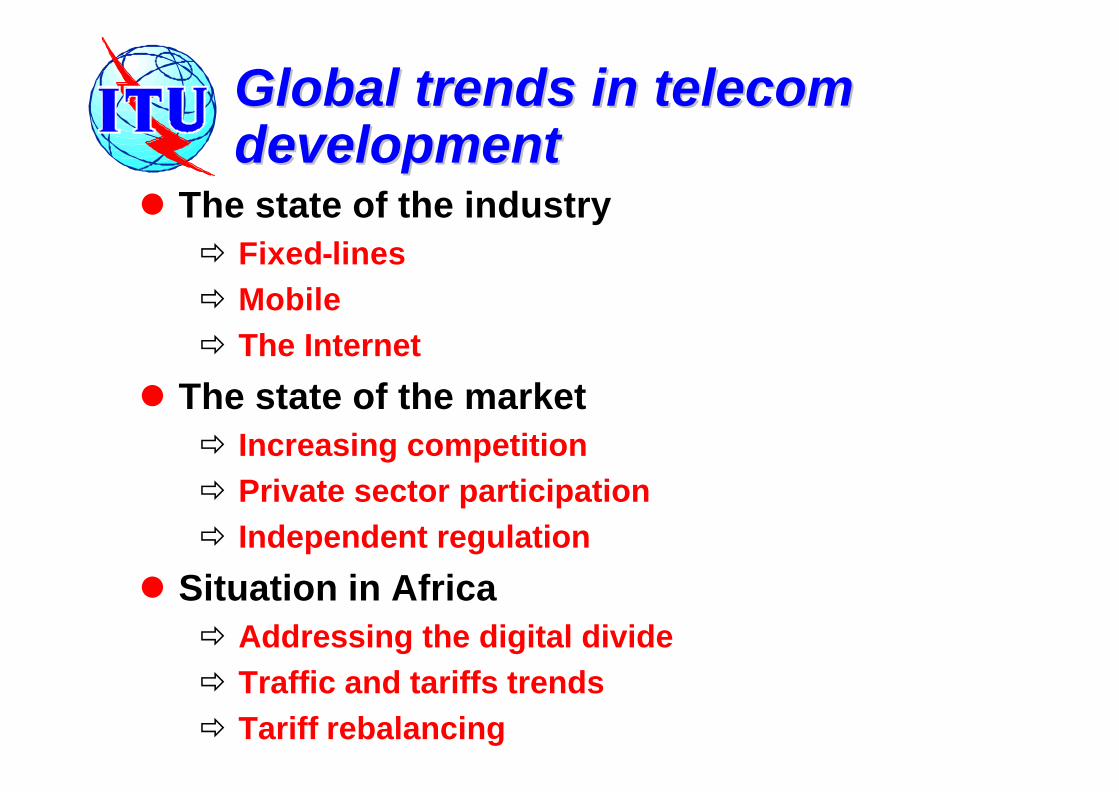
Global trends in telecom Global trends in telecom developmentdevelopment
l The state of the industryð Fixed-linesð Mobileð The Internet
l The state of the marketð Increasing competitionð Private sector participationð Independent regulation
l Situation in Africað Addressing the digital divideð Traffic and tariffs trendsð Tariff rebalancing
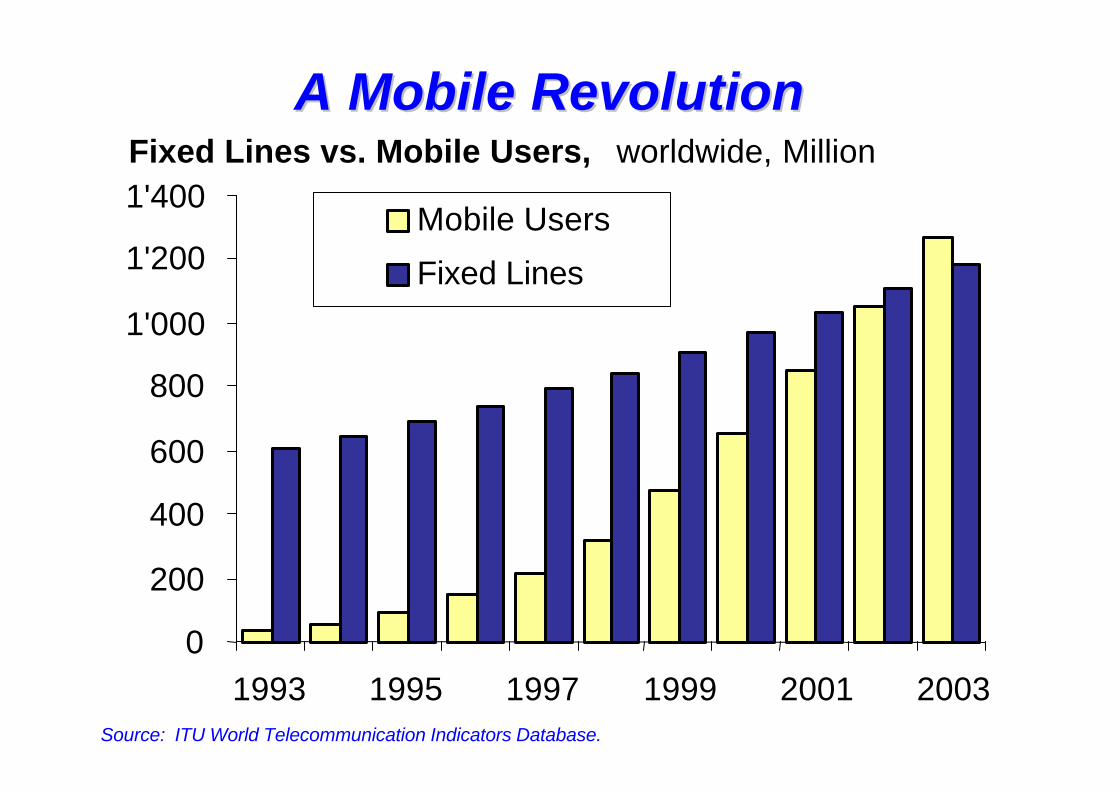
A Mobile RevolutionA Mobile Revolution
Source: ITU World Telecommunication Indicators Database.
0
200
400
600
800
1'000
1'200
1'400
1993 1995 1997 1999 2001 2003
Mobile Users
Fixed Lines
Fixed Lines vs. Mobile Users, worldwide, Million
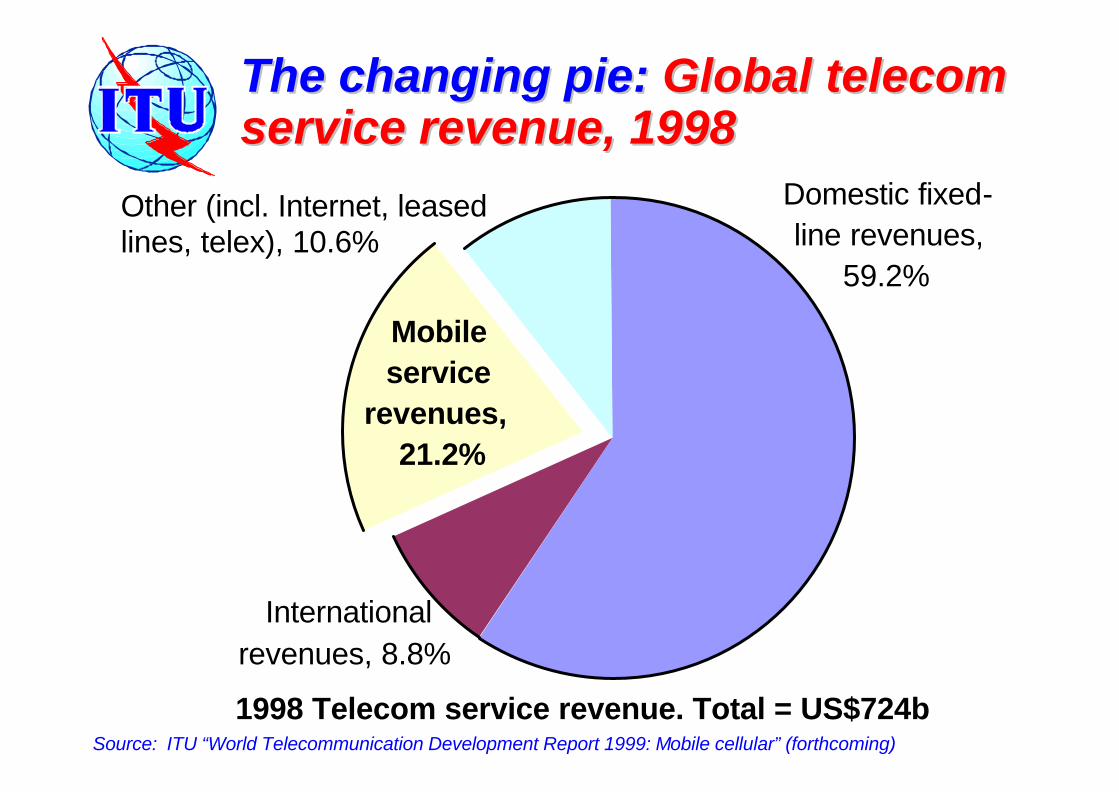
Domestic fixed-line revenues,
59.2%
International revenues, 8.8%
Mobile service
revenues, 21.2%
Other (incl. Internet, leased lines, telex), 10.6%
1998 Telecom service revenue. Total = US$724b
The changing pie: The changing pie: Global telecom Global telecom service revenue, 1998service revenue, 1998
Source: ITU “World Telecommunication Development Report 1999: Mobile cellular” (forthcoming)
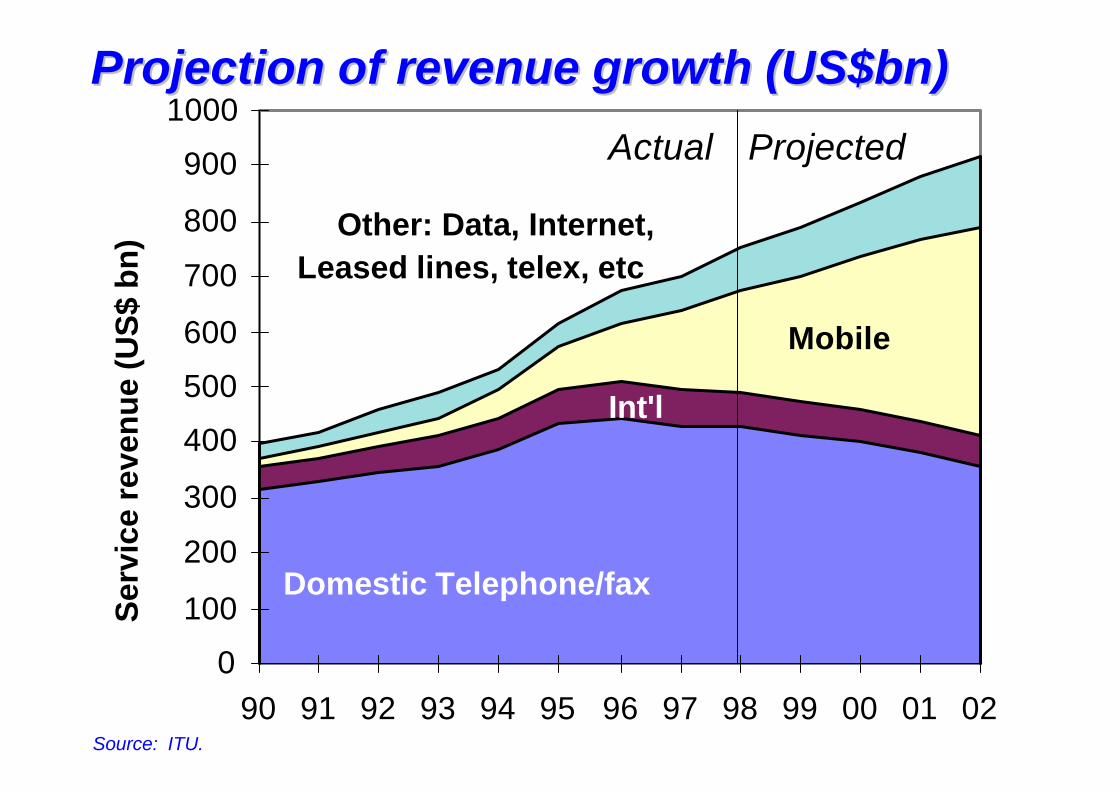
0
100
200
300
400
500
600
700
800
900
1000
90 91 92 93 94 95 96 97 98 99 00 01 02
Ser
vice
rev
enu
e (U
S$
bn
)Actual Projected
Domestic Telephone/fax
Int'l
Mobile
Other: Data, Internet, Leased lines, telex, etc
Projection of revenue growth (US$bn)Projection of revenue growth (US$bn)
Source: ITU.
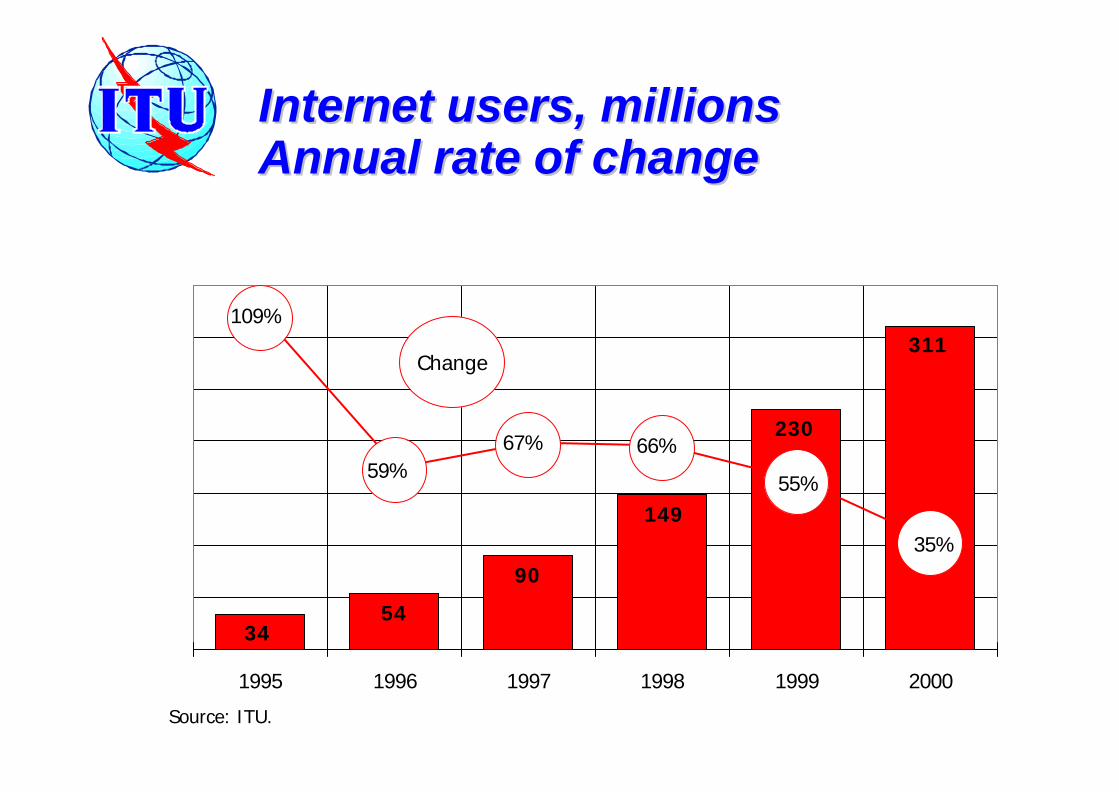
Internet users, millionsInternet users, millionsAnnual rate of changeAnnual rate of change
311
230
3454
90
14935%
55%
66%67%59%
109%
1995 1996 1997 1998 1999 2000
Change
Source: ITU.
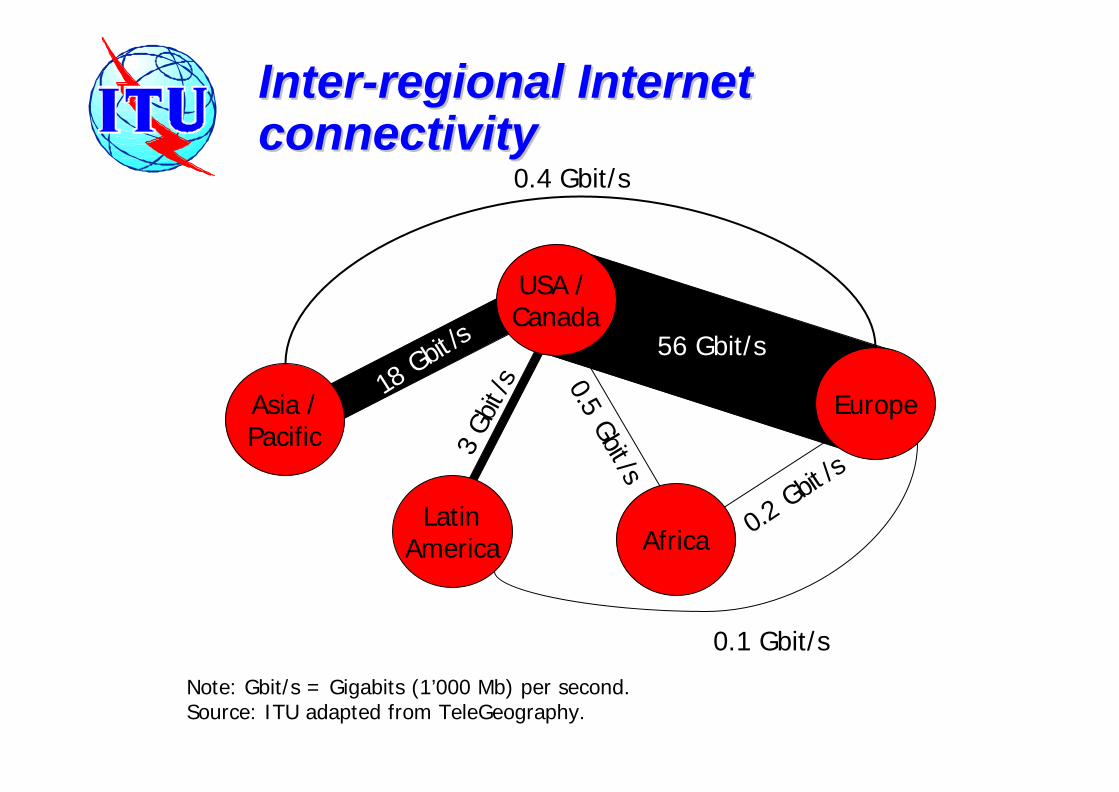
InterInter--regional Internet regional Internet connectivityconnectivity
Asia /Pacific
LatinAmerica
USA / Canada
Europe
Africa
56 Gbit/s
0.1 Gbit/s
0.5 Gbit/s
Note: Gbit/s = Gigabits (1’000 Mb) per second.Source: ITU adapted from TeleGeography.
18 Gbit /
s
0.4 Gbit/s
3 Gb
it /s
0.2 Gbit
/s
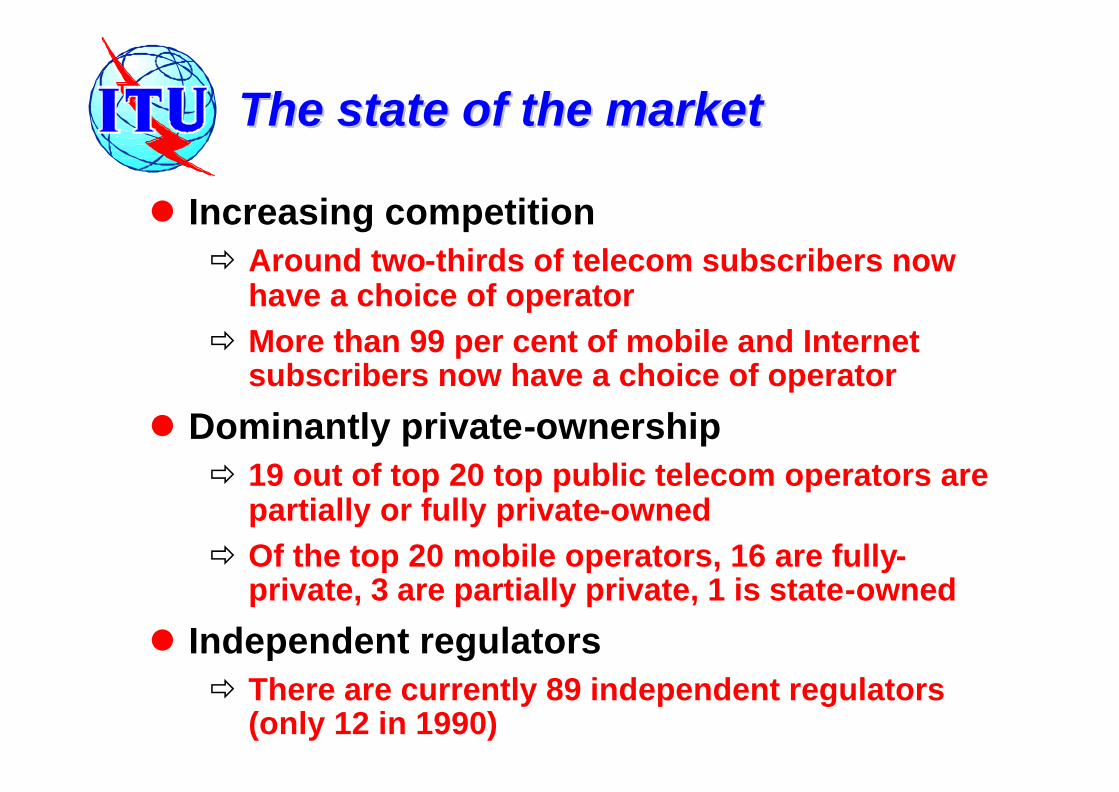
The state of the marketThe state of the market
l Increasing competitionð Around two-thirds of telecom subscribers now
have a choice of operatorð More than 99 per cent of mobile and Internet
subscribers now have a choice of operator
l Dominantly private-ownershipð 19 out of top 20 top public telecom operators are
partially or fully private-ownedð Of the top 20 mobile operators, 16 are fully-
private, 3 are partially private, 1 is state-owned
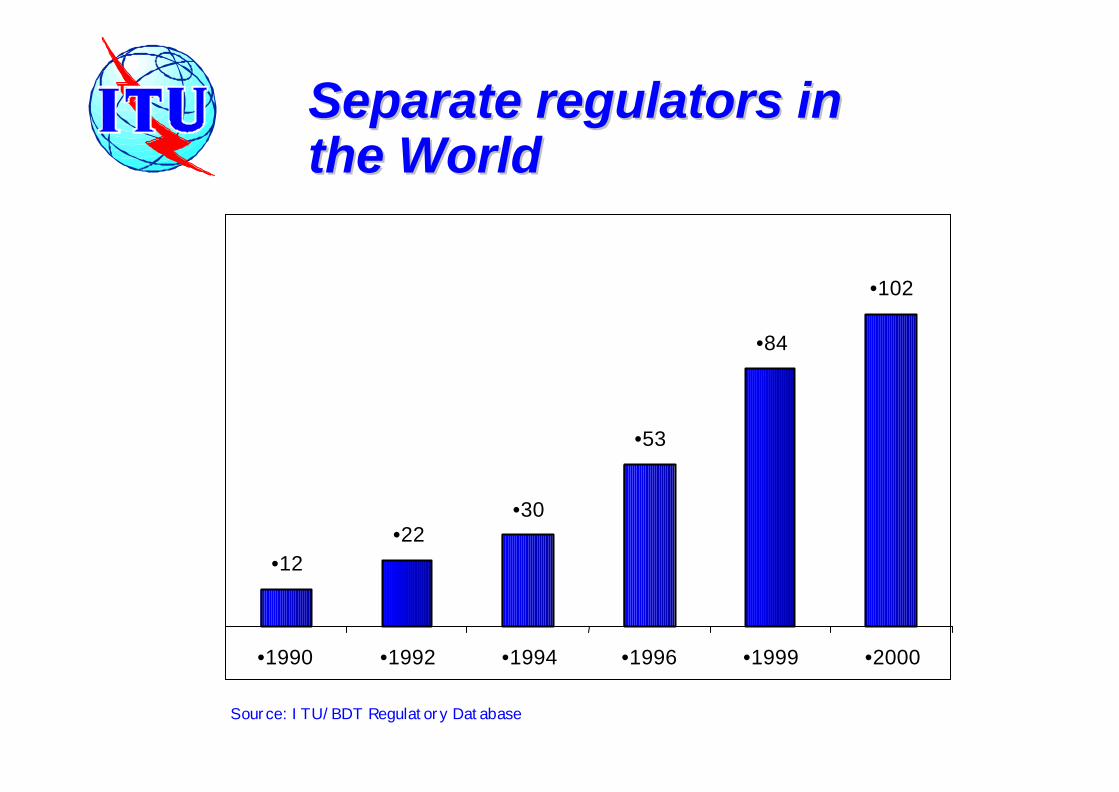
l Independent regulatorsð There are currently 89 independent regulators
(only 12 in 1990)
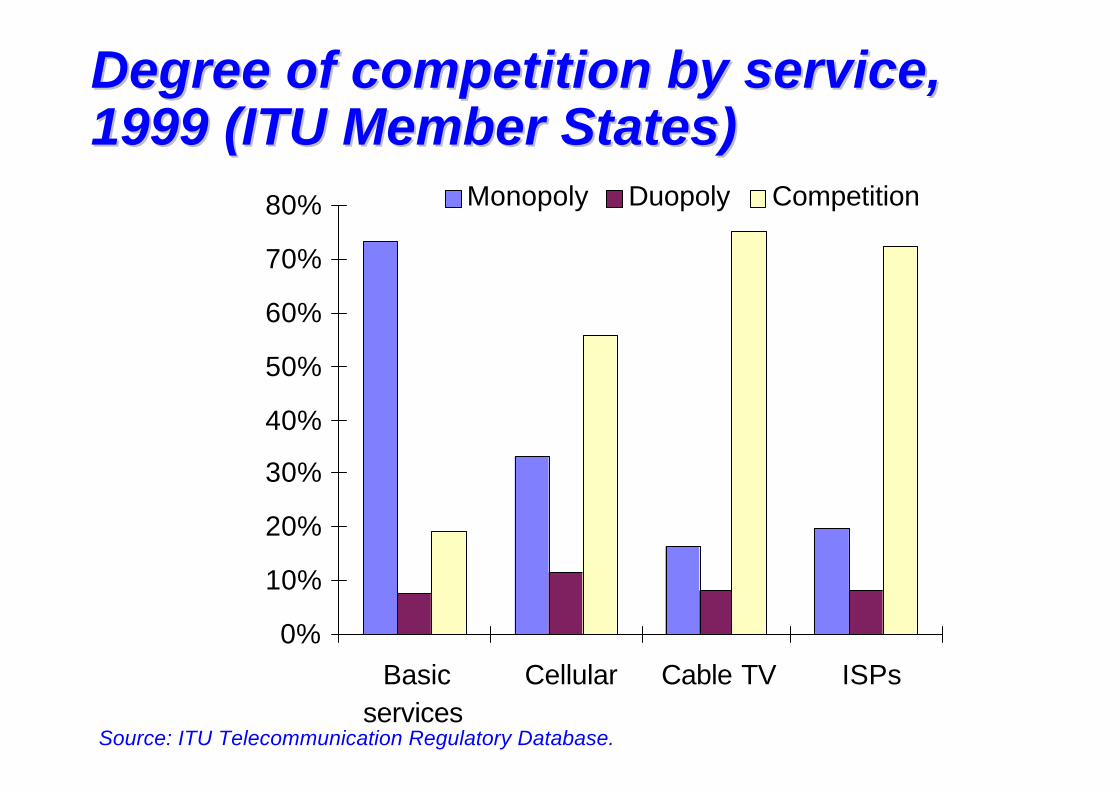
Degree of competition by service, Degree of competition by service, 1999 (ITU Member States)1999 (ITU Member States)
Source: ITU Telecommunication Regulatory Database.
0%
10%
20%
30%
40%
50%
60%
70%
80%
Basicservices
Cellular Cable TV ISPs
Monopoly Duopoly Competition
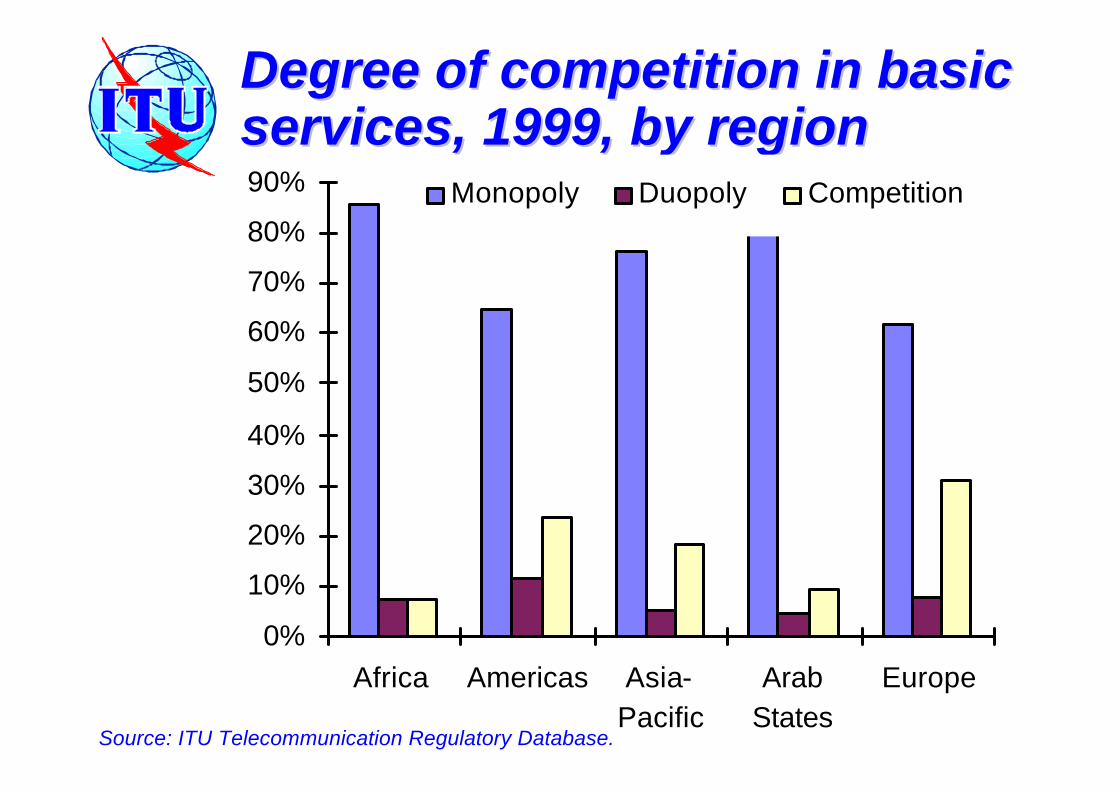
Degree of competition in basic Degree of competition in basic services, 1999, by regionservices, 1999, by region
Source: ITU Telecommunication Regulatory Database.
0%
10%
20%
30%
40%
50%
60%
70%
80%
90%
Africa Americas Asia-Pacific
ArabStates
Europe
Monopoly Duopoly Competition
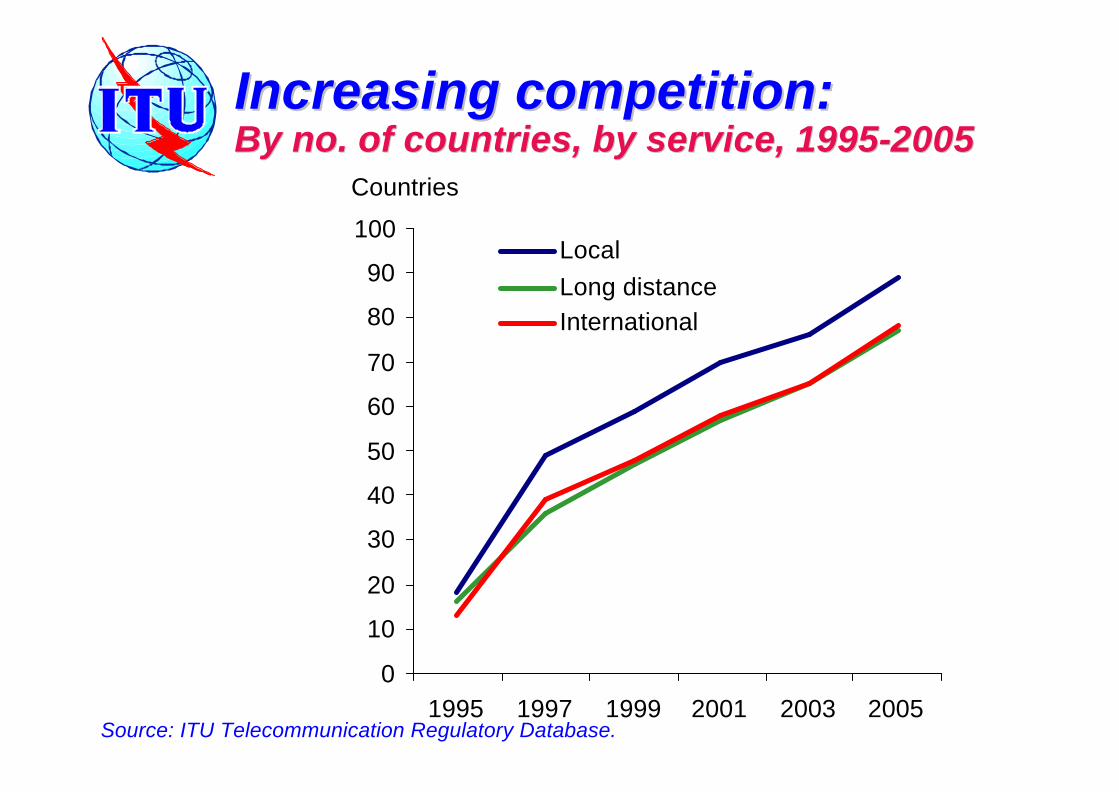
0
10
20
30
40
50
60
70
80
90
100
1995 1997 1999 2001 2003 2005
LocalLong distanceInternational
Countries
Increasing competition: Increasing competition: By no. of countries, by service, 1995By no. of countries, by service, 1995--20052005
Source: ITU Telecommunication Regulatory Database.
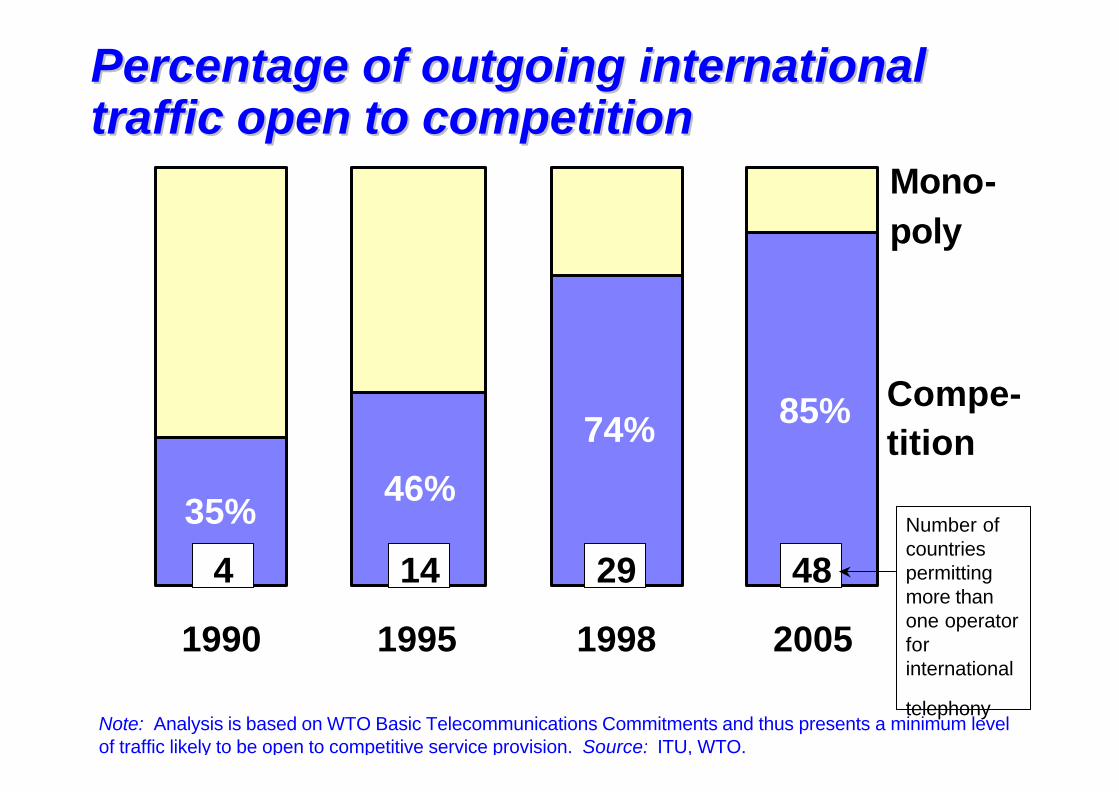
35%46%
74% 85%
1990 1995 1998 2005
Mono-poly
Compe-tition
4 14 29 48Number of countries permitting more than one operator for international
telephony
Percentage of outgoing international Percentage of outgoing international traffic open to competitiontraffic open to competition
Note: Analysis is based on WTO Basic Telecommunications Commitments and thus presents a minimum level of traffic likely to be open to competitive service provision. Source: ITU, WTO.
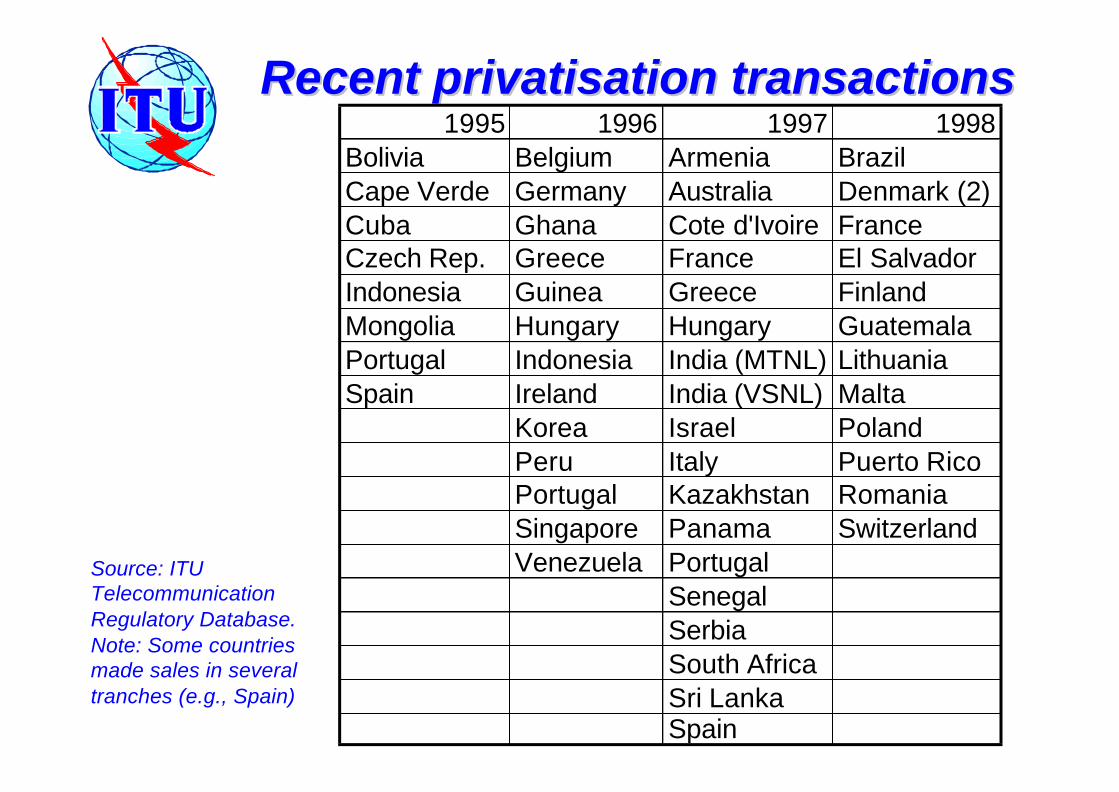
Recent privatisation transactionsRecent privatisation transactions
Source: ITU Telecommunication Regulatory Database. Note: Some countries made sales in severaltranches (e.g., Spain)
1995 1996 1997 1998Bolivia Belgium Armenia BrazilCape Verde Germany Australia Denmark (2)Cuba Ghana Cote d'Ivoire FranceCzech Rep. Greece France El SalvadorIndonesia Guinea Greece FinlandMongolia Hungary Hungary GuatemalaPortugal Indonesia India (MTNL) LithuaniaSpain Ireland India (VSNL) Malta
Korea Israel PolandPeru Italy Puerto RicoPortugal Kazakhstan RomaniaSingapore Panama SwitzerlandVenezuela Portugal
SenegalSerbiaSouth AfricaSri LankaSpain
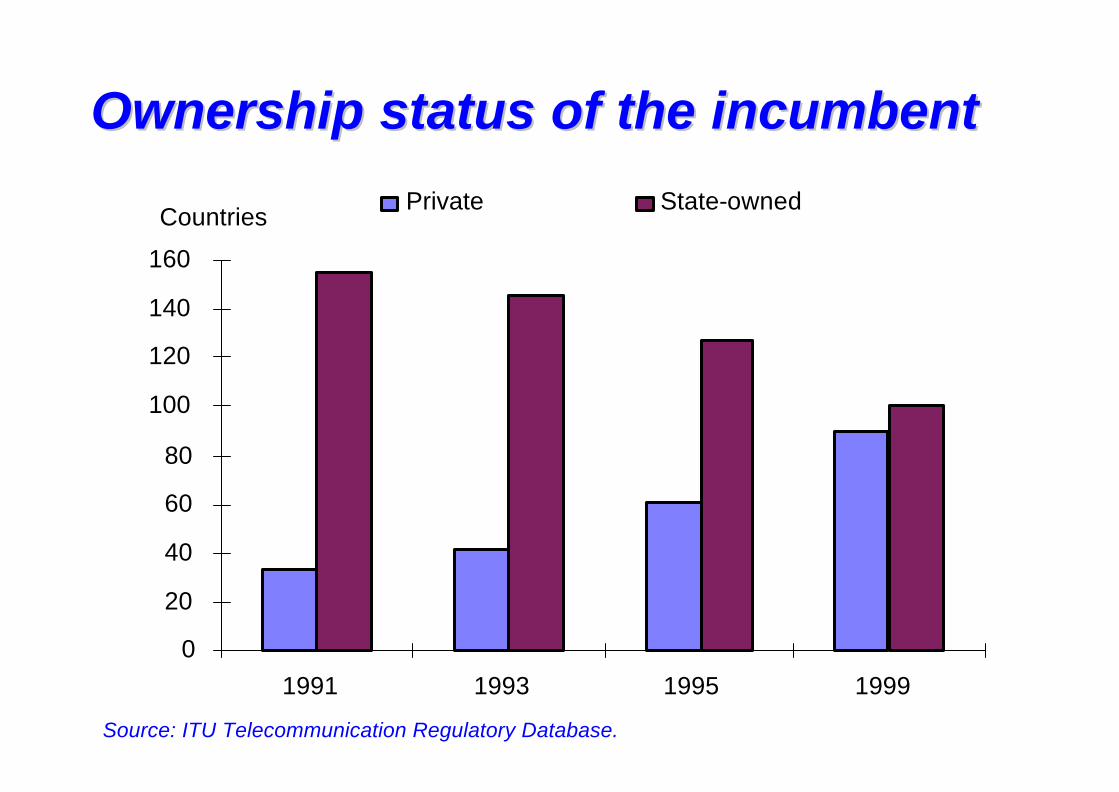
0
20
40
60
80
100
120
140
160
1991 1993 1995 1999
Private State-ownedCountries
Ownership status of the incumbentOwnership status of the incumbent
Source: ITU Telecommunication Regulatory Database.
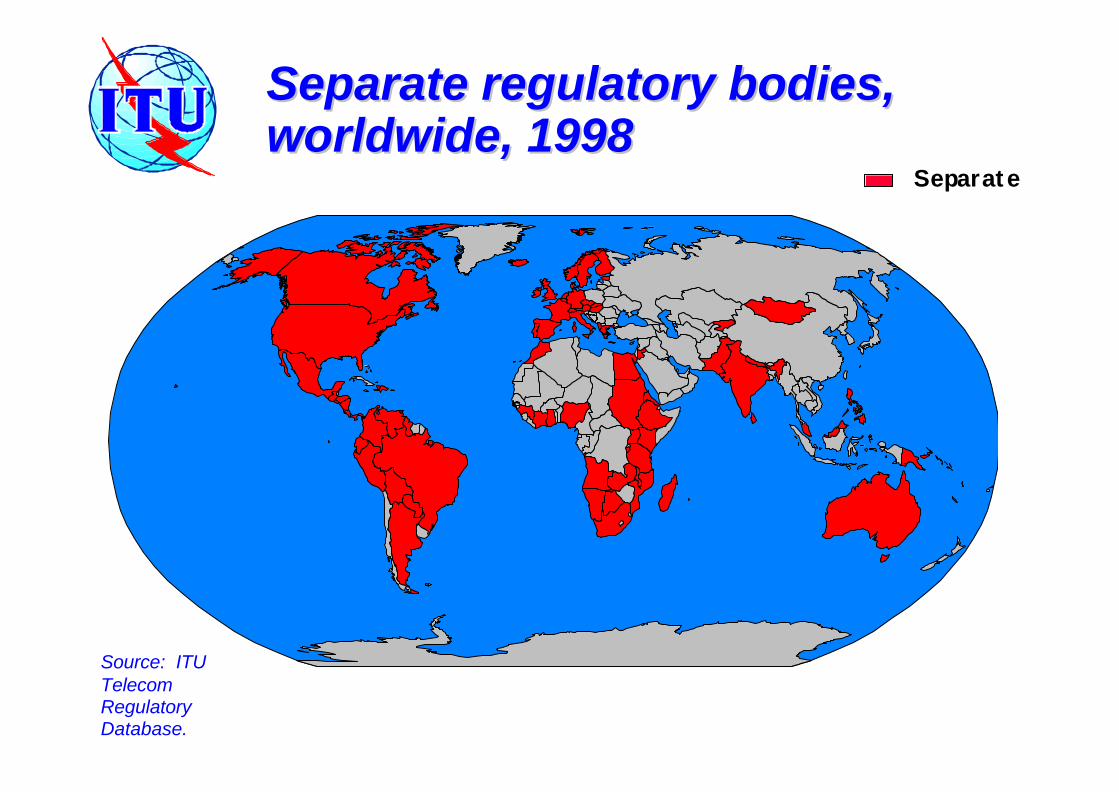
Separate
Separate regulatory bodies, Separate regulatory bodies, worldwide, 1998worldwide, 1998
Source: ITU Telecom Regulatory Database.
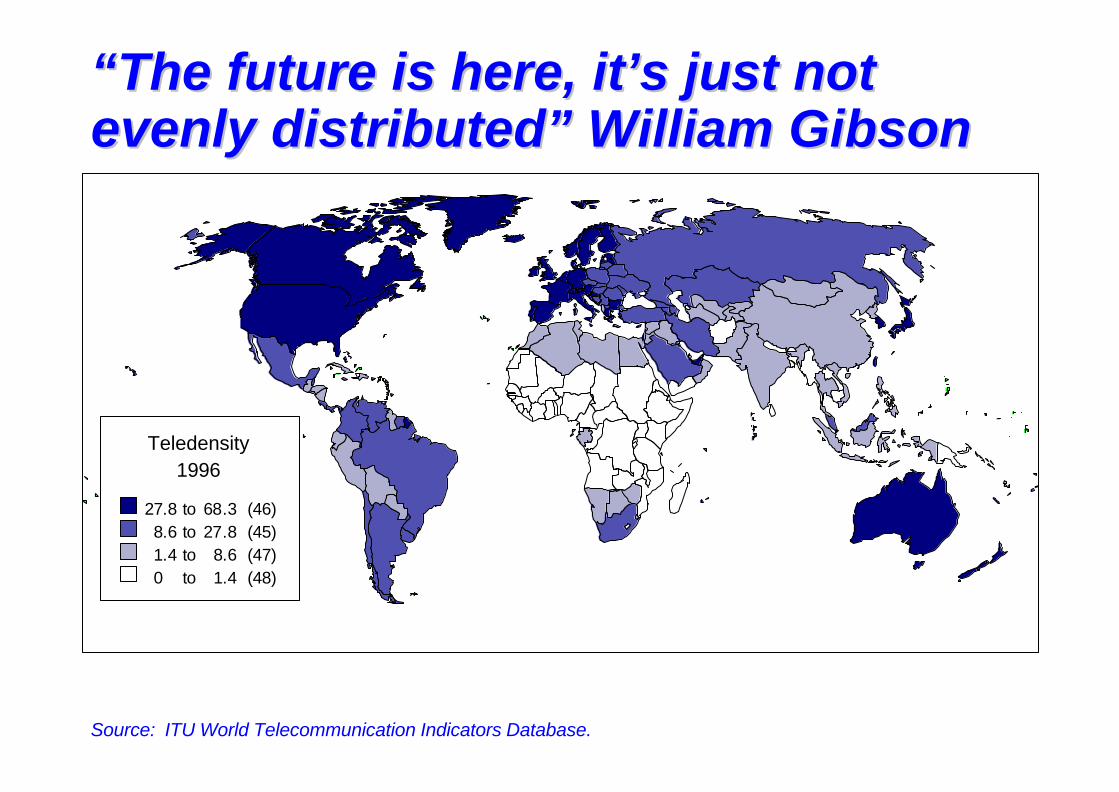
Source: ITU World Telecommunication Indicators Database.
“The future is here, it’s just not “The future is here, it’s just not evenly distributed” William Gibsonevenly distributed” William Gibson
Teledensity1996
27.8 to 68.3 (46)8.6 to 27.8 (45)1.4 to 8.6 (47)0 to 1.4 (48)
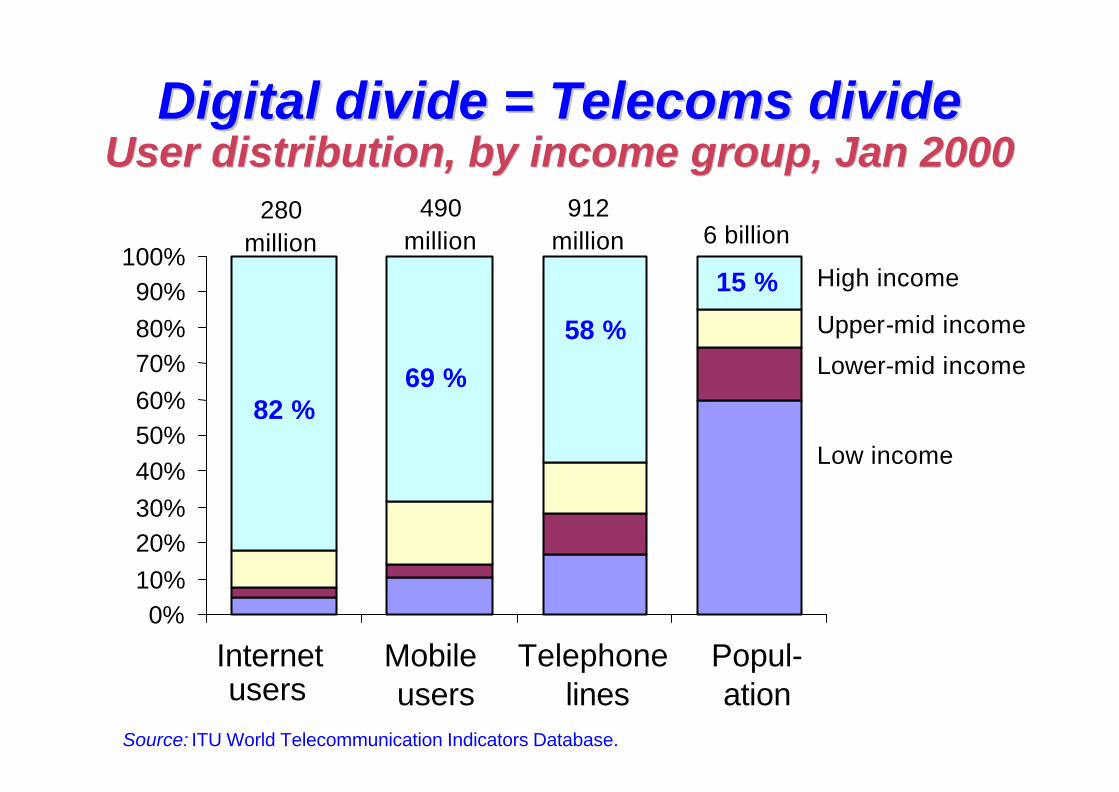
0%10%20%30%40%50%60%70%80%90%
100%
Internetusers
Mobile users
Telephonelines
Popul-ation
High income
Upper-mid income
Lower-mid income
Low income
280 million
490 million
912 million 6 billion
82 %69 %
58 %
15 %
Digital divide = Telecoms divideDigital divide = Telecoms divideUser distribution, by income group, Jan 2000User distribution, by income group, Jan 2000
Source: ITU World Telecommunication Indicators Database.
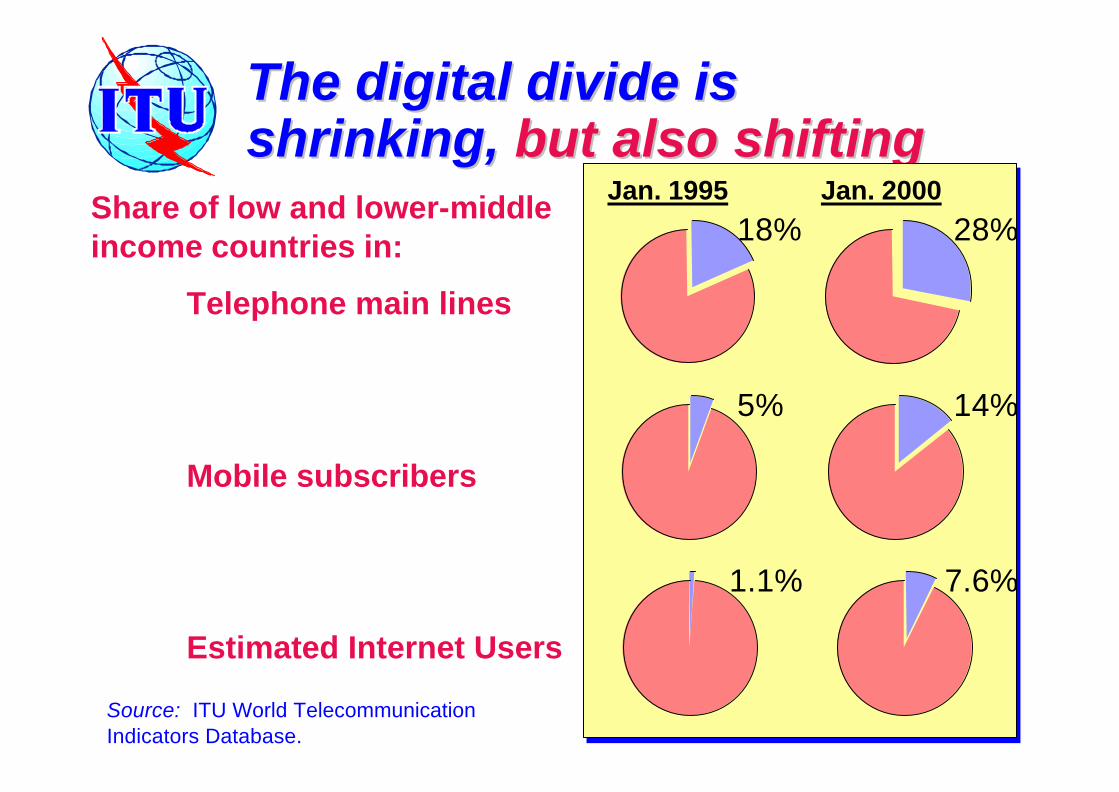
The digital divide is The digital divide is shrinking, shrinking, but also shiftingbut also shifting
Share of low and lower-middle income countries in:
Telephone main lines
Mobile subscribers
Estimated Internet Users
Source: ITU World Telecommunication Indicators Database.
18%Jan. 1995 Jan. 2000
28%
5% 14%
1.1% 7.6%
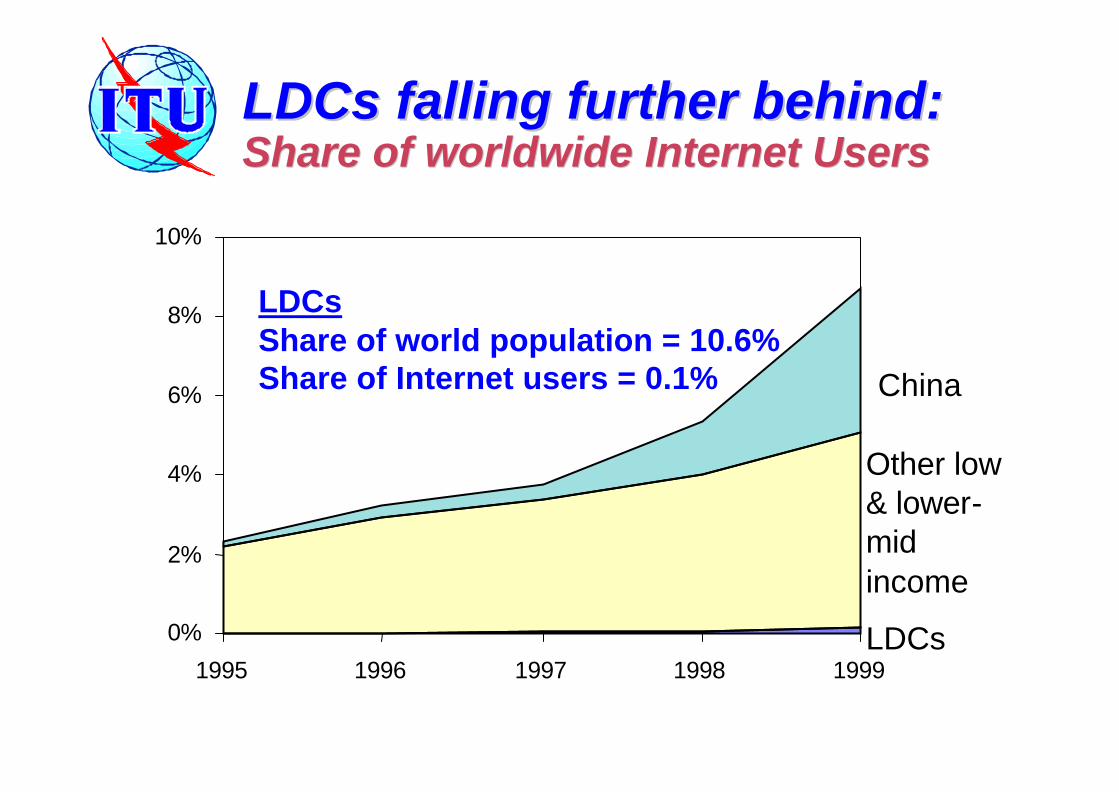
LDCs falling further behind:LDCs falling further behind:Share of worldwide Internet UsersShare of worldwide Internet Users
LDCsShare of world population = 10.6%Share of Internet users = 0.1%
0%
2%
4%
6%
8%
10%
1995 1996 1997 1998 1999
China
Other low & lower-mid income
LDCs
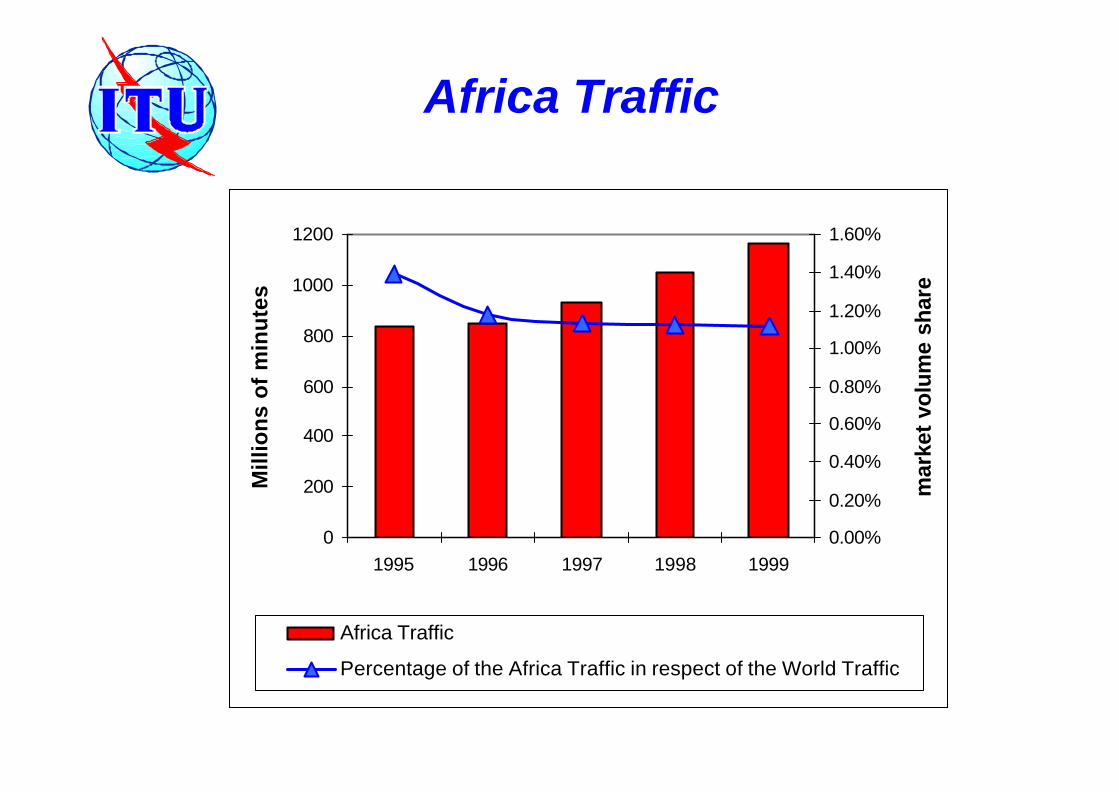
Africa Traffic
0
200
400
600
800
1000
1200
1995 1996 1997 1998 1999
Mill
ion
s o
f m
inu
tes
0.00%
0.20%
0.40%
0.60%
0.80%
1.00%
1.20%
1.40%
1.60%
mar
ket
volu
me
shar
e
Africa Traffic
Percentage of the Africa Traffic in respect of the World Traffic
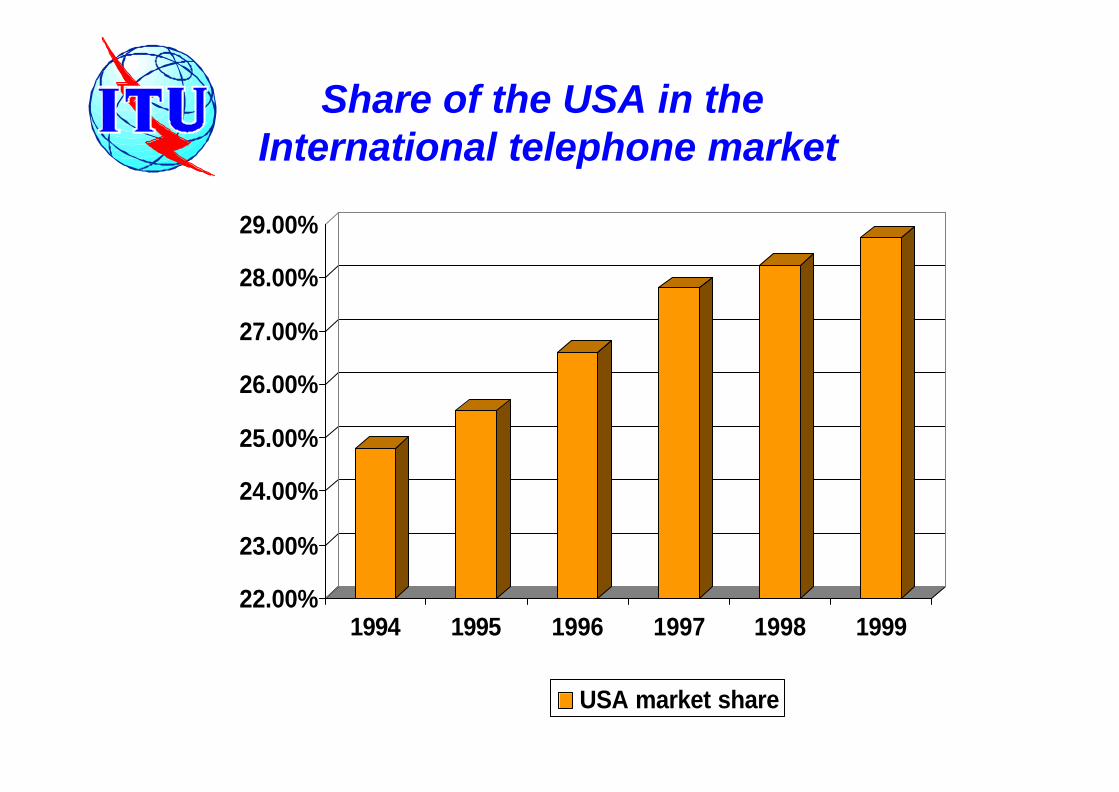
22.00%
23.00%
24.00%
25.00%
26.00%
27.00%
28.00%
29.00%
1994 1995 1996 1997 1998 1999
USA market share
Share of the USA in the International telephone market
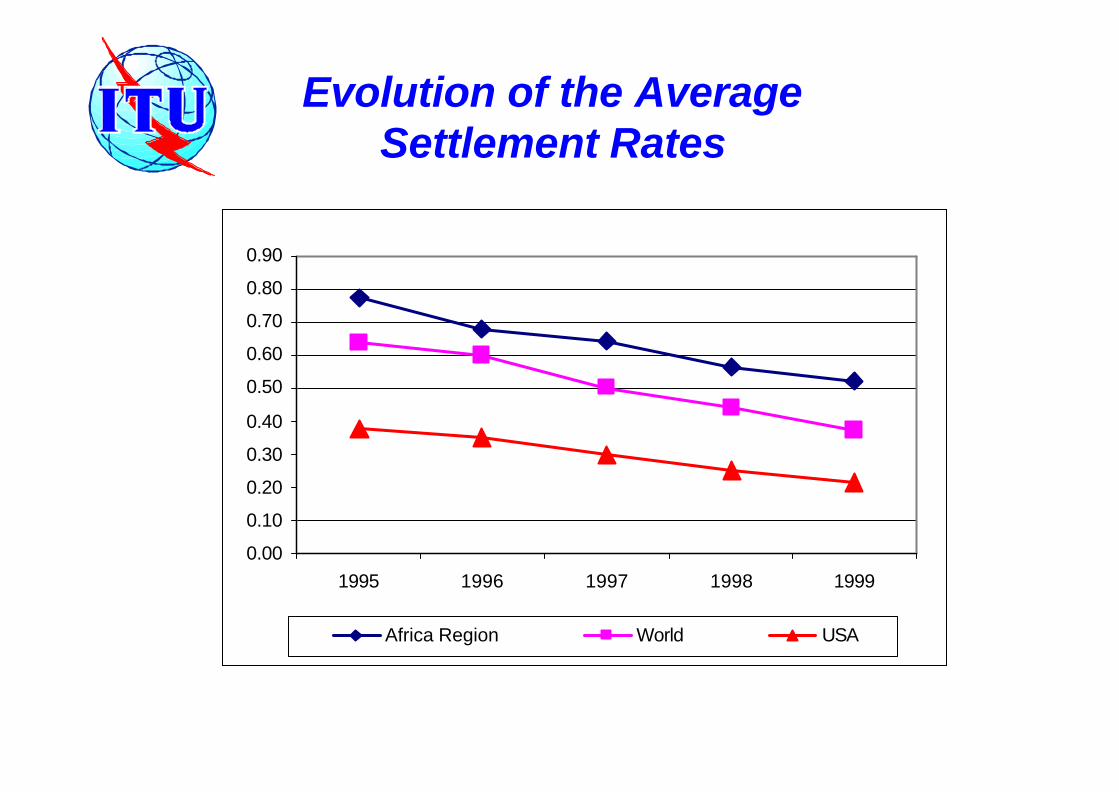
Evolution of the Average Settlement Rates
0.00
0.10
0.20
0.30
0.40
0.50
0.60
0.70
0.80
0.90
1995 1996 1997 1998 1999
Africa Region World USA
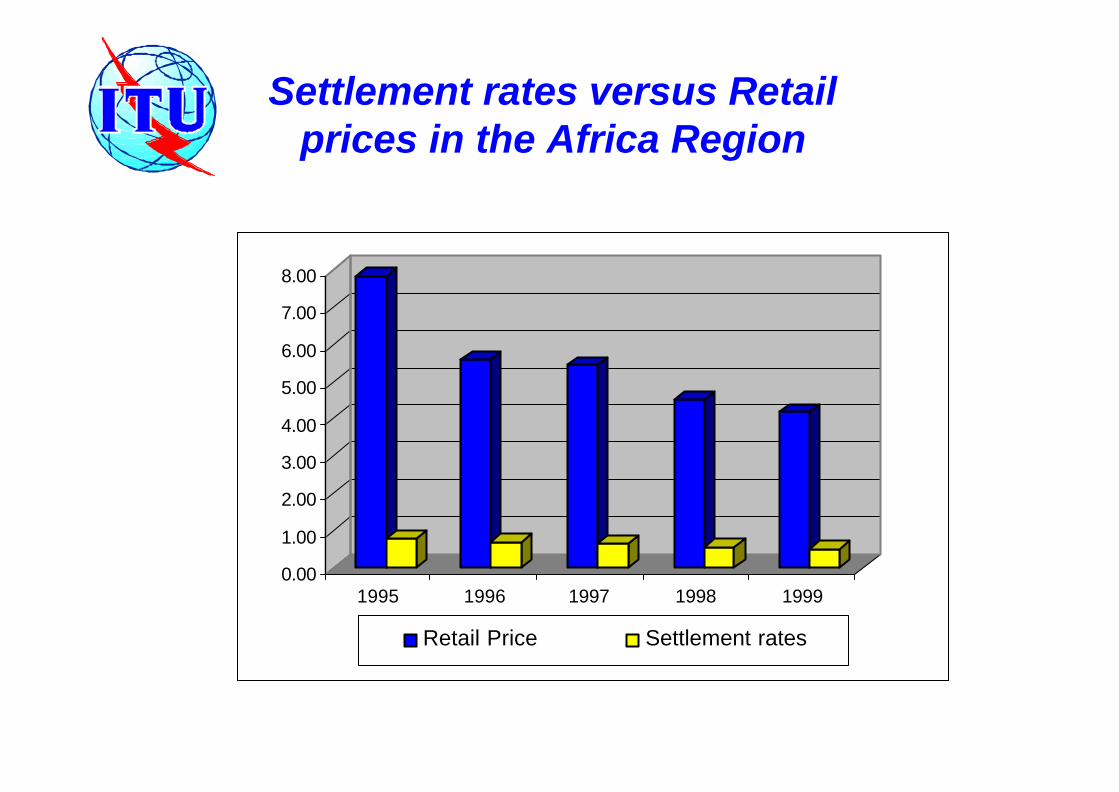
Settlement rates versus Retail prices in the Africa Region
0.00
1.00
2.00
3.00
4.00
5.00
6.00
7.00
8.00
1995 1996 1997 1998 1999
Retail Price Settlement rates
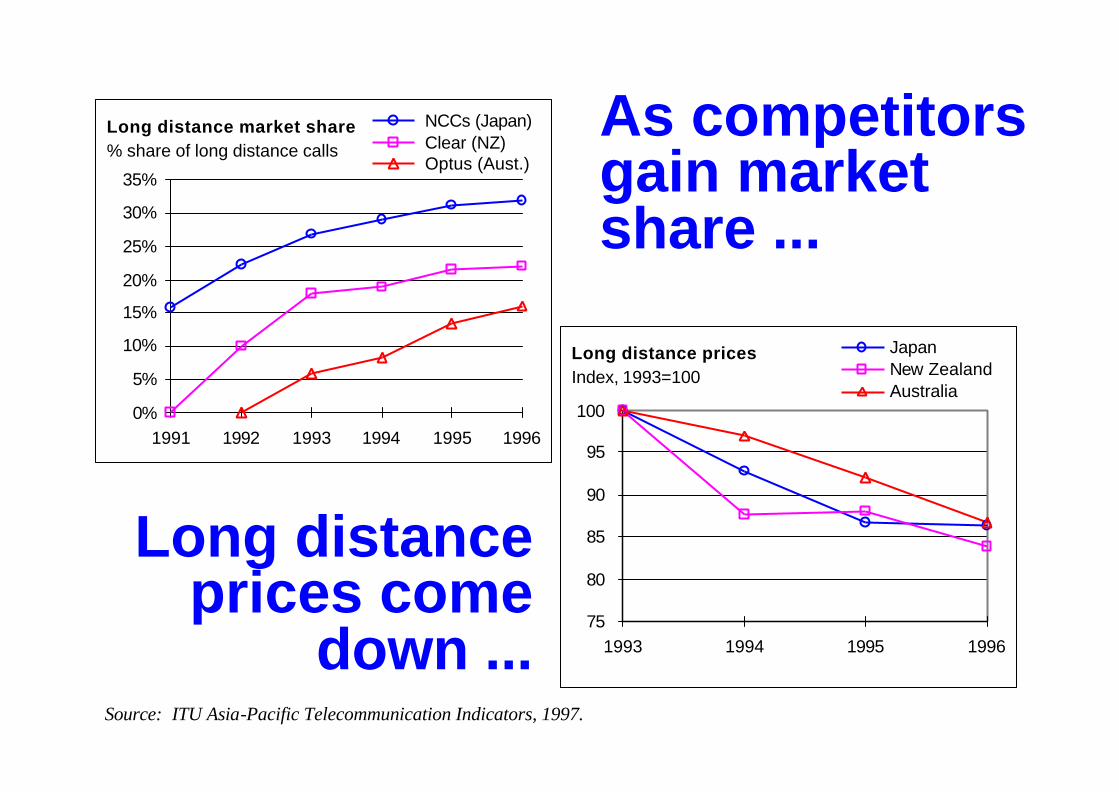
Long distance market share% share of long distance calls
0%
5%
10%
15%
20%
25%
30%
35%
1991 1992 1993 1994 1995 1996
NCCs (Japan) Clear (NZ) Optus (Aust.)
Long distance pricesIndex, 1993=100
75
80
85
90
95
100
1993 1994 1995 1996
JapanNew ZealandAustralia
As competitors gain market share ...
Long distance prices come
down ...Source: ITU Asia-Pacific Telecommunication Indicators, 1997.
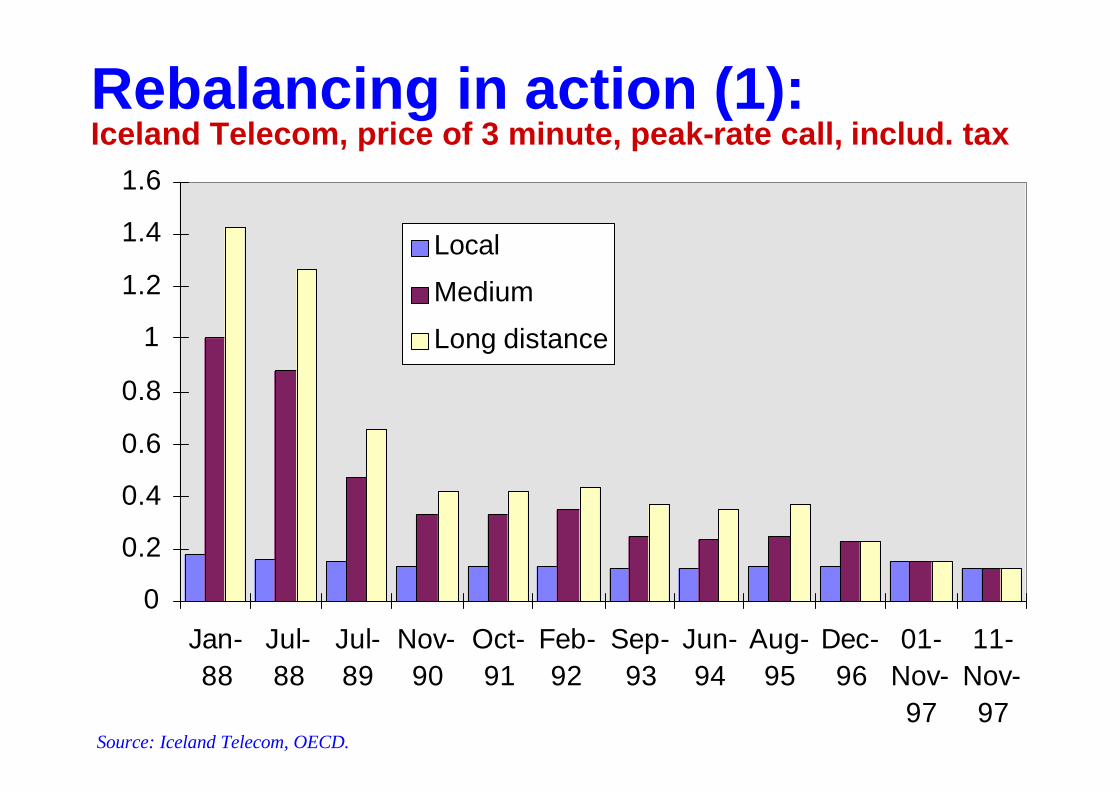
0
0.2
0.4
0.6
0.8
1
1.2
1.4
1.6
Jan-88
Jul-88
Jul-89
Nov-90
Oct-91
Feb-92
Sep-93
Jun-94
Aug-95
Dec-96
01-Nov-97
11-Nov-97
Local
Medium
Long distance
Rebalancing in action (1): Iceland Telecom, price of 3 minute, peak-rate call, includ. tax
Source: Iceland Telecom, OECD.
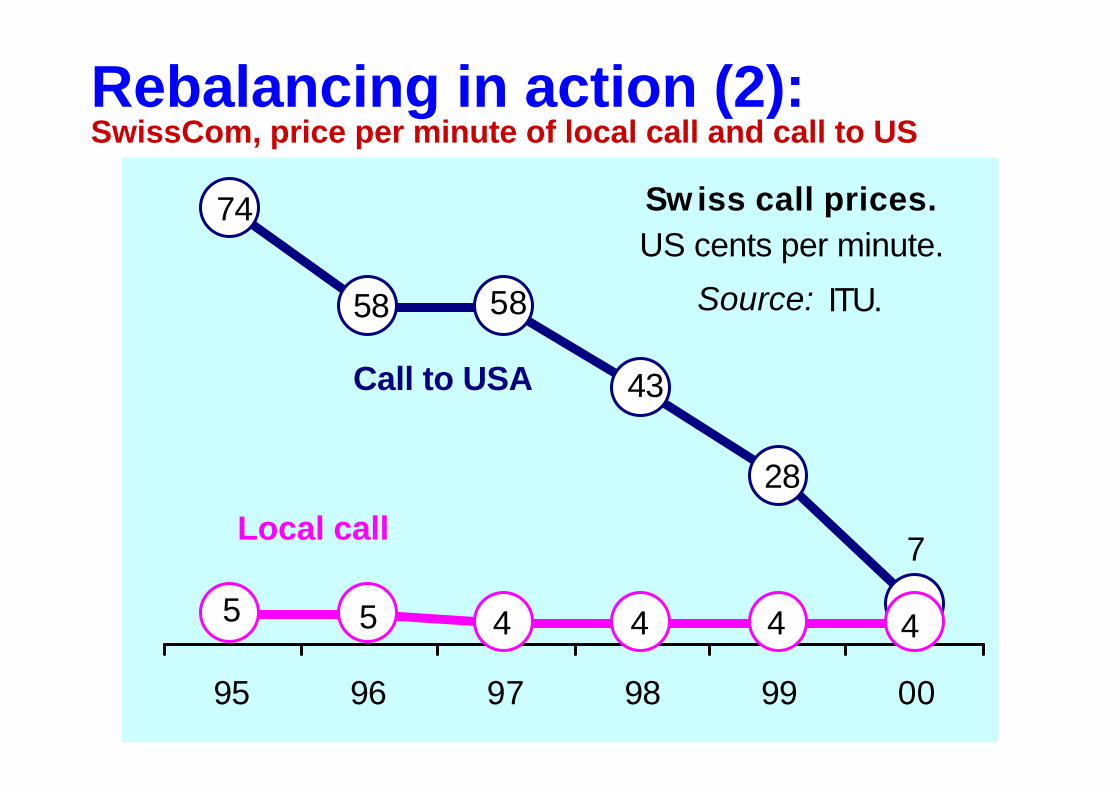
Rebalancing in action (2): SwissCom, price per minute of local call and call to US
7
28
43
5858
74
444455
95 96 97 98 99 00
Sw iss call prices. US cents per minute.
Source: ITU.
Call to USA
Local call
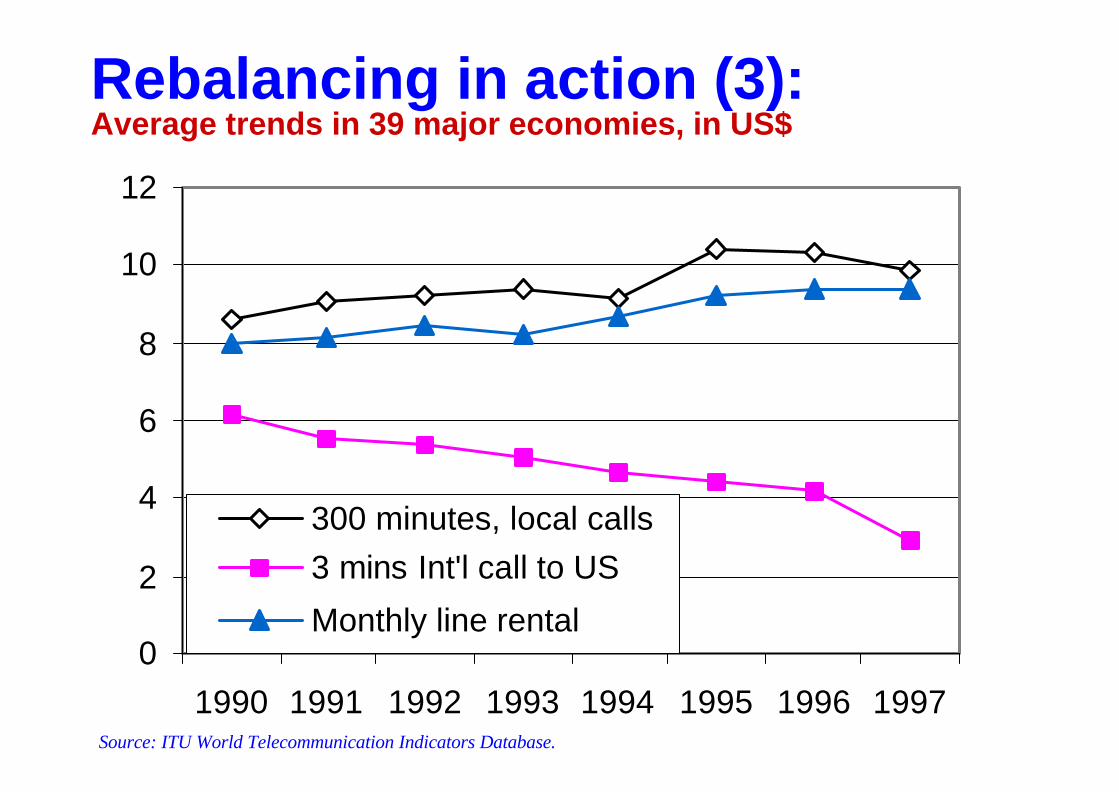
0
2
4
6
8
10
12
1990 1991 1992 1993 1994 1995 1996 1997
300 minutes, local calls3 mins Int'l call to US
Monthly line rental
Source: ITU World Telecommunication Indicators Database.
Rebalancing in action (3): Average trends in 39 major economies, in US$
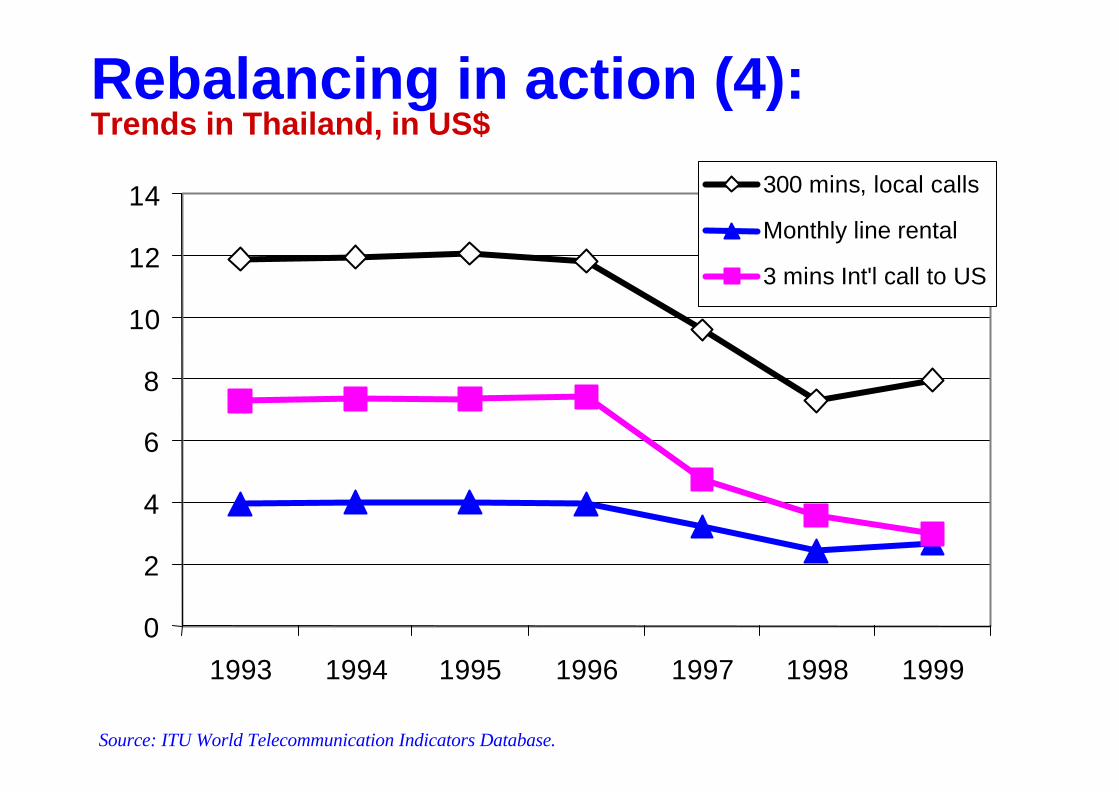
Rebalancing in action (4): Trends in Thailand, in US$
Source: ITU World Telecommunication Indicators Database.
0
2
4
6
8
10
12
14
1993 1994 1995 1996 1997 1998 1999
300 mins, local calls
Monthly line rental
3 mins Int'l call to US
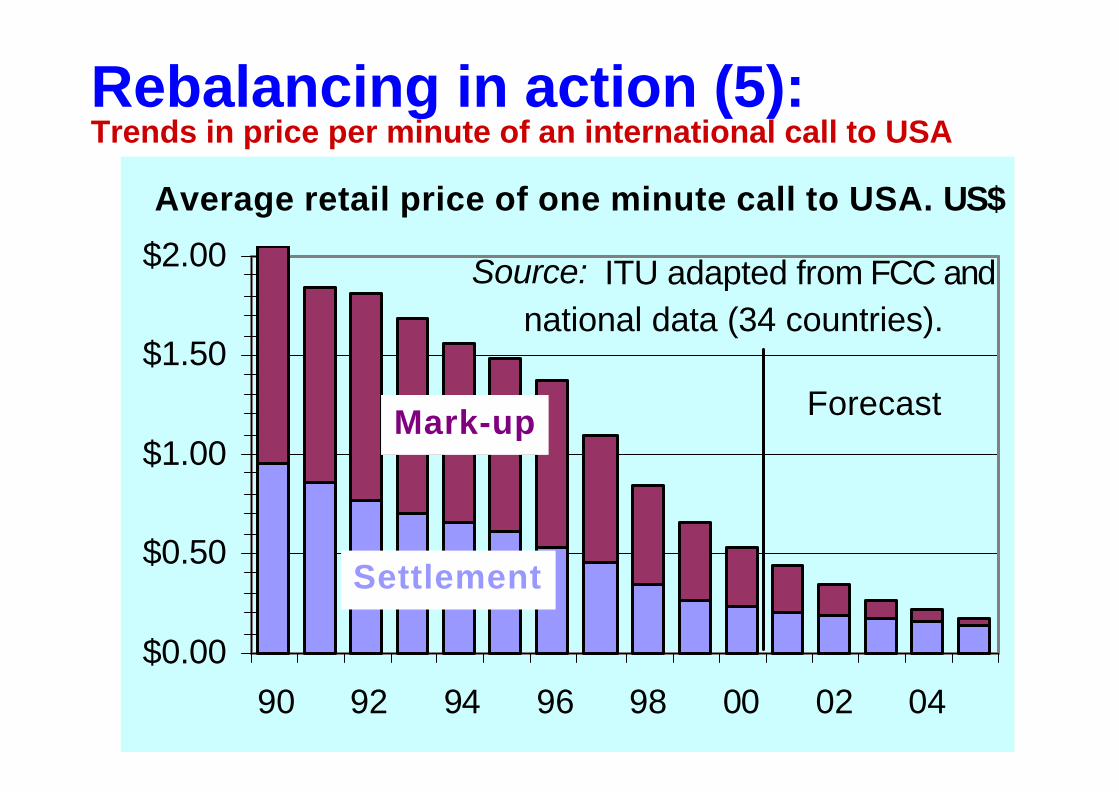
Rebalancing in action (5): Trends in price per minute of an international call to USA
$0.00
$0.50
$1.00
$1.50
$2.00
90 92 94 96 98 00 02 04
Average retail price of one minute call to USA. US$
Mark-up
Settlement
Source: ITU adapted from FCC and national data (34 countries).
Forecast
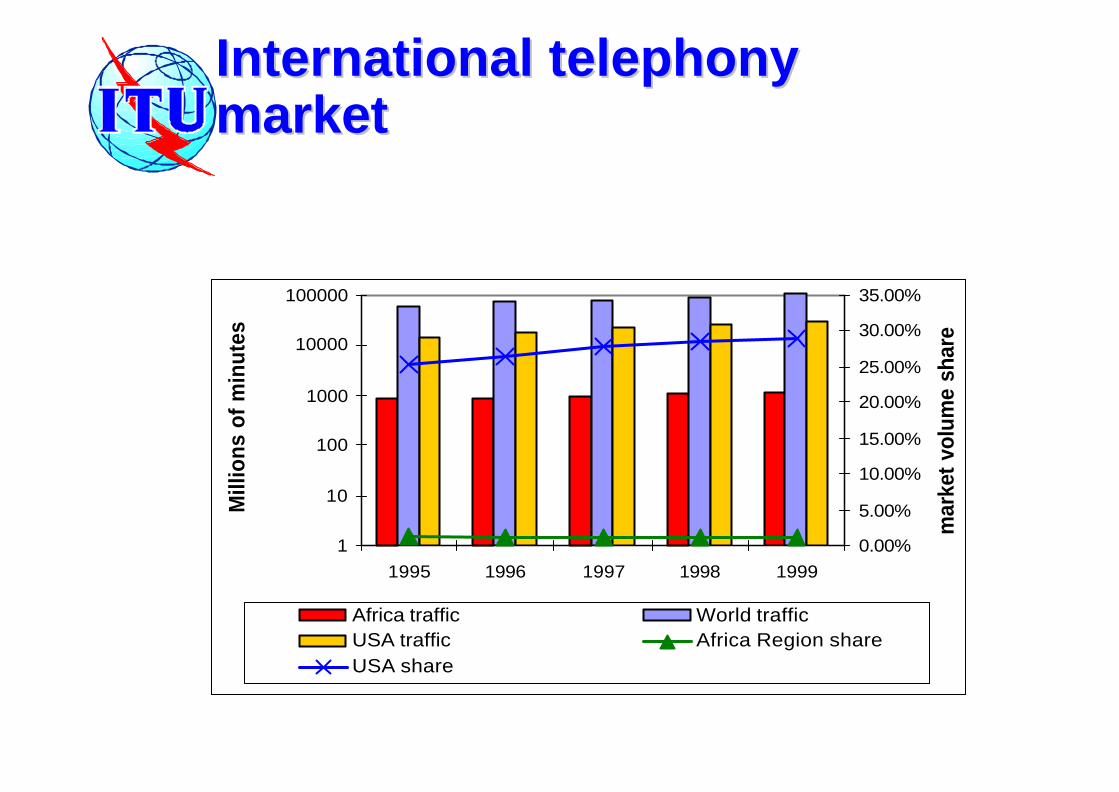
International International telephony telephony marketmarket
1
10
100
1000
10000
100000
1995 1996 1997 1998 1999
Mill
ions
of m
inut
es
0.00%
5.00%
10.00%
15.00%
20.00%
25.00%
30.00%
35.00%
mar
ket
volu
me
shar
e
Africa traffic World trafficUSA traffic Africa Region shareUSA share
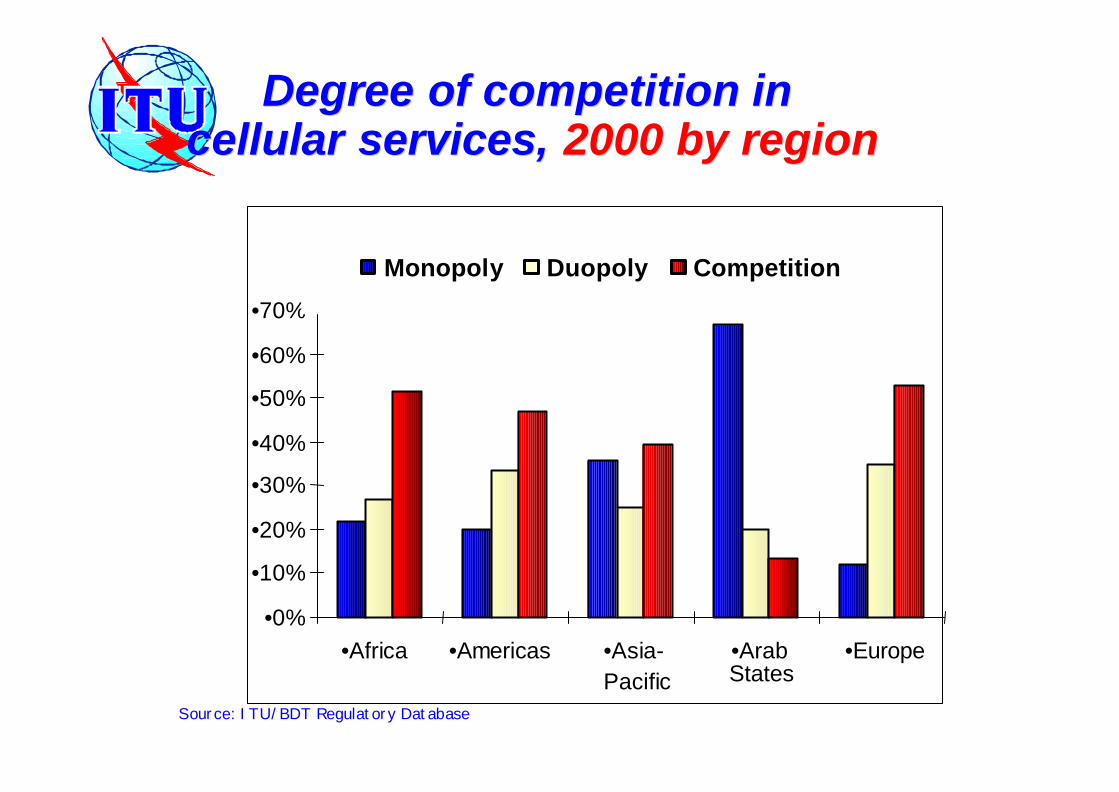
DegreeDegree of of competitioncompetition in in cellularcellular services,services, 20002000 by by regionregion
Source: ITU/BDT Regulatory Database
•0%
•10%
•20%
•30%
•40%
•50%
•60%
•70%
•Africa •Americas •Asia-Pacific
•ArabStates
•Europe
Monopoly Duopoly Competition
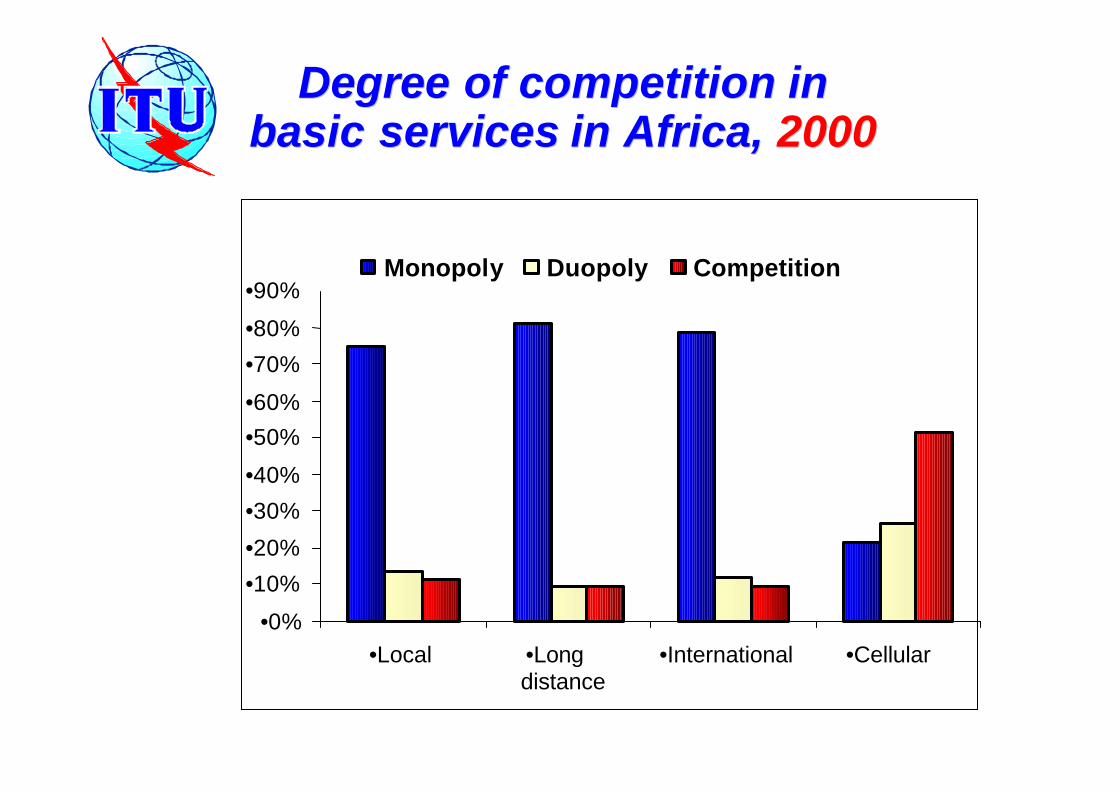
•0%
•10%
•20%
•30%
•40%
•50%
•60%
•70%
•80%
•90%
•Local •Longdistance
•International •Cellular
DegreeDegree of of competitioncompetition in in basic servicesbasic services in Africain Africa, , 20002000
Monopoly Duopoly Competition
Source: ITU/BDT Regulatory Database
Separate regulators in Separate regulators in the Worldthe World
•12•22
•30
•53
•84
•102
•1990 •1992 •1994 •1996 •1999 •2000
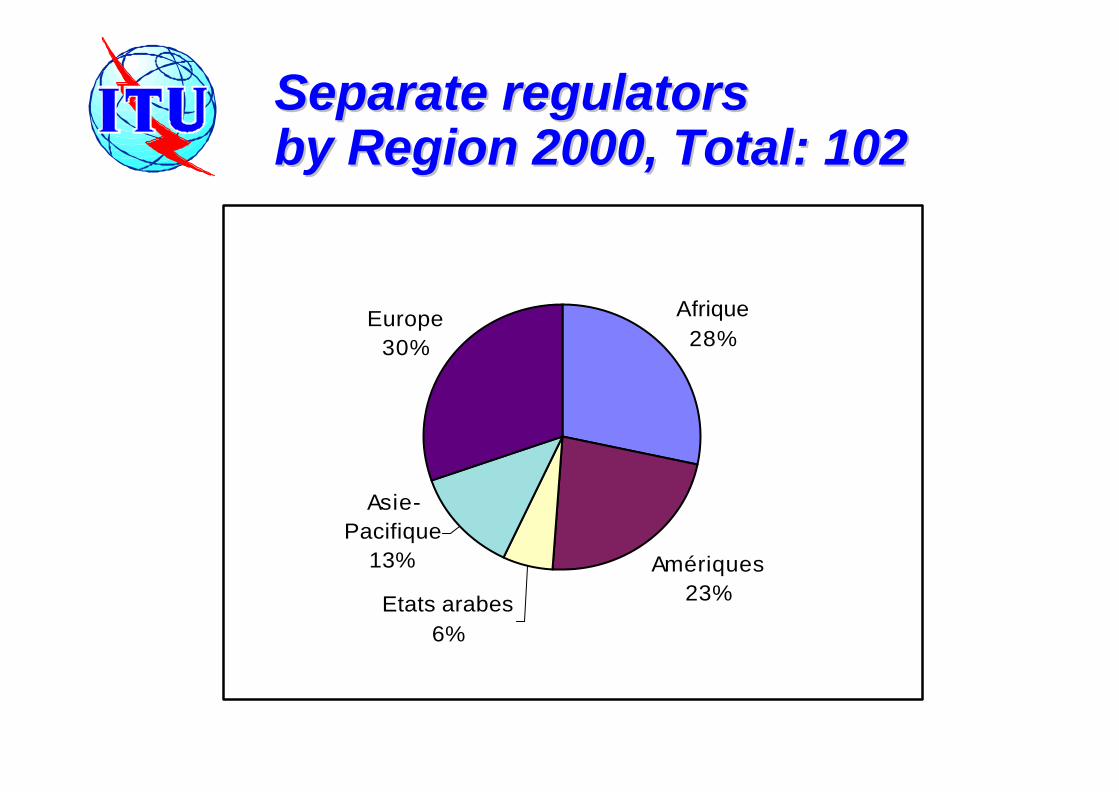
Separate regulators Separate regulators by Region 2000, Total: 102by Region 2000, Total: 102
Afrique28%
Amériques23%Etats arabes
6%
Asie-Pacifique
13%
Europe30%
Organismes séparés par région, 2000
Total: 102
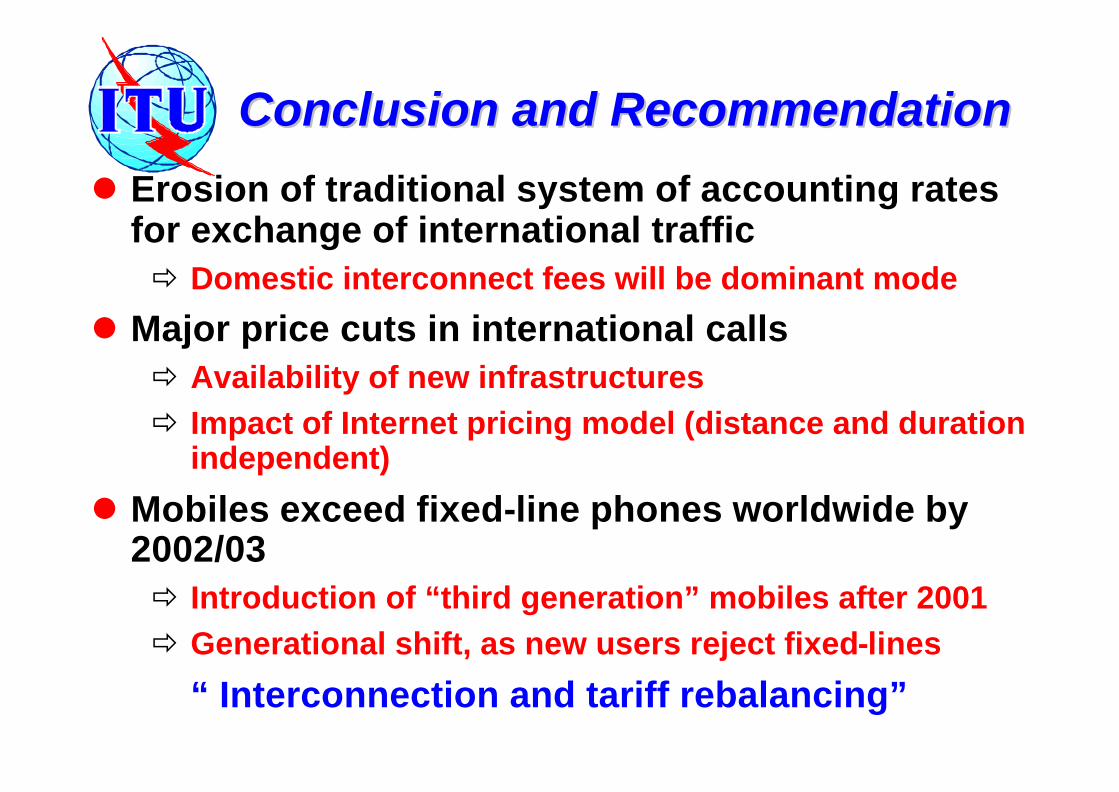
Conclusion and Recommendation Conclusion and Recommendation
l Erosion of traditional system of accounting rates for exchange of international trafficð Domestic interconnect fees will be dominant mode
l Major price cuts in international calls ð Availability of new infrastructuresð Impact of Internet pricing model (distance and duration
independent)
l Mobiles exceed fixed-line phones worldwide by 2002/03ð Introduction of “third generation” mobiles after 2001ð Generational shift, as new users reject fixed-lines
“ Interconnection and tariff rebalancing”