Global Trends in Mobile Advertising Q2 2017 -...
23
Global Trends in Mobile Advertising Q2 2017
Transcript of Global Trends in Mobile Advertising Q2 2017 -...

Global Trends in Mobile AdvertisingQ2 2017

Copyright © 2017 Smaato Inc. All Rights Reserved. 1
Q2 2017 Global Trends in Mobile AdvertisingEach quarter, Smaato offers key insights into the worldwide mobile programmatic advertising landscape based on in-depth analysis of the 1.5+ trillion ad impressions delivered on the Smaato platform in that quarter. Our platform reaches over a billion unique users globally and delivers 500+ billion ad impressions each month, which are auctioned through a network of over 450 of the world’s largest DSPs and ad network demand partners. Please note that this report is a quarterly snapshot of trends across Smaato’s global base of publishers, advertisers and mobile device users during Q2 2017; specifi c data and observations may not be comparable with previous reports.
Executive SummaryDuring Q2 2017, six global mobile advertising trends observed on the Smaato platform were:
Advertisers Continued to Follow Eyeballs — to MobileGlobal mobile ad spending on the Smaato platform saw healthy growth in Q2, as advertiser spending continued to follow consumer attention to mobile. The Americas region — most notably Brazil, Colombia, Canada and the US — experienced particularly robust mobile ad spending growth. Mobile advertising’s value to advertisers also continued its upward trend, with APAC’s mobile eCPMs more than doubling and EMEA also posting strong mobile eCPM growth.
1.
In-App Took an Even Bigger Bite of the Mobile Ad Spending PieConsumers’ appetites for mobile apps continued to grow in Q2 2017. In-app ad spending posted a record-high share of total mobile ad spending on the Smaato platform in Q2 2017 (94%) — up 13 share points in just one year. Astute advertisers are shifting media spending to in-app, driving in-app eCPMs up +79% from Q2 2016 to Q2 2017. This mobile ad spending migration towards in-app has resulted in in-app ad spaces now being +224% more valuable on average than those on mobile web.
2.
Video Was Mobile MVP & Gaming Apps Scored Big With Rewarded VideoWith its exceptionally high user engagement, conversion rates and advertising effectiveness, video was the fastest-growing mobile ad format in Q2 2017, as video mobile ad spending more than doubled (+142%) in one quarter alone. Rewarded video was the fastest-growing format within video, particularly in gaming apps.
3.
Android Ruled Mobile Ad Spending as iOS Reigned Over eCPMsAndroid captured the majority of mobile ad spending on the Smaato platform this quarter (55%), but iOS ad space was +18% more valuable to advertisers. The average iOS user also generated 2X more ad spending, received +72% more ads driven by their smartphone behavior differences vs. Android users and viewed 2X more ads than the average Android user.
4.
Gender Data Had Advertisers Seeing DoubleThe availability of gender data can massively boost mobile ad values — on the Smaato platform, ad requests including gender data earned eCPMs 2.5X higher on average than requests without this data. Analysis of ad requests that provided gender data revealed that while men garnered the majority (56%) of mobile ad spending on the Smaato platform in Q2 2017, female users’ brought the highest eCPMs (+25% higher than male eCPMs).
China’s App Addiction: A Land of Mobile Advertising OpportunityChina is currently home to more smartphone users than the US and all of Europe (including Russia) combined. Furthermore, China is the most app-centric mobile market in the world — Chinese consumers spend 99% of their mobile time in-app and use more apps each month than mobile users from any other country. On the Smaato platform, 98% of mobile ad spending in China was spent in-app in Q2 2017, and in-app eCPMs were more than 3X higher than those of mobile web.
5.
6.
Copyright © 2017 Smaato Inc. All Rights Reserved. 2
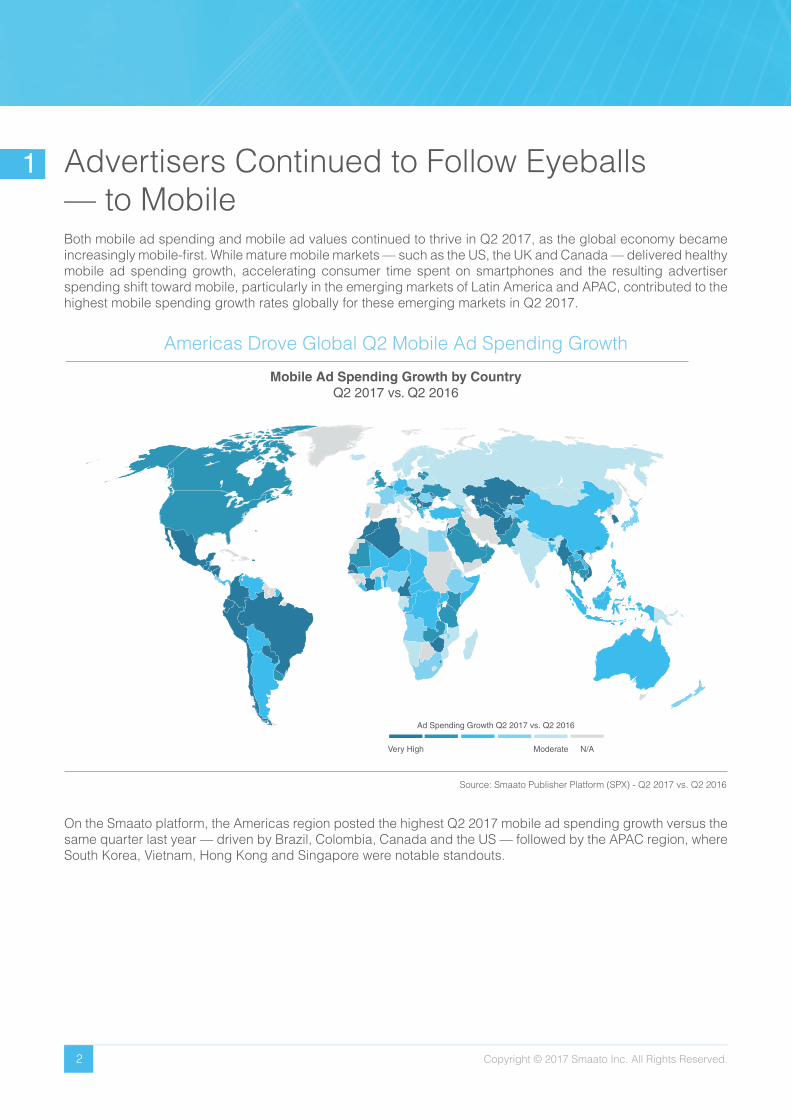
Advertisers Continued to Follow Eyeballs — to MobileBoth mobile ad spending and mobile ad values continued to thrive in Q2 2017, as the global economy became increasingly mobile-fi rst. While mature mobile markets — such as the US, the UK and Canada — delivered healthy mobile ad spending growth, accelerating consumer time spent on smartphones and the resulting advertiser spending shift toward mobile, particularly in the emerging markets of Latin America and APAC, contributed to the highest mobile spending growth rates globally for these emerging markets in Q2 2017.
On the Smaato platform, the Americas region posted the highest Q2 2017 mobile ad spending growth versus the same quarter last year — driven by Brazil, Colombia, Canada and the US — followed by the APAC region, where South Korea, Vietnam, Hong Kong and Singapore were notable standouts.
Source: Smaato Publisher Platform (SPX) - Q2 2017 vs. Q2 2016
Americas Drove Global Q2 Mobile Ad Spending Growth
Mobile Ad Spending Growth by CountryQ2 2017 vs. Q2 2016
Very High Moderate N/A
Ad Spending Growth Q2 2017 vs. Q2 2016
1

Copyright © 2017 Smaato Inc. All Rights Reserved. 3
In terms of eCPM growth, APAC was the top-performing region in Q2 2017. APAC’s average eCPM more than doubled (+105%) versus the same quarter last year, with the largest eCPM increases coming in South Korea, Japan, Vietnam and Indonesia. EMEA also delivered strong overall eCPM growth (+74%), with Norway, Poland, Switzerland, Russia, Sweden, Denmark, Netherlands and Italy leading the way.
Source: Smaato Publisher Platform (SPX) - Q2 2017 vs. Q2 2016
APAC Markets Led Global eCPM Growth
Top Global Markets by Absolute eCPM and eCPM GrowthQ2 2017 vs. Q2 2016
USA
Russia
Poland
Switzerland
Sweden
Italy
Netherlands
Denmark
Hong Kong
Canada
ArgentinaBrazil
Colombia
JapanJapan
India
SingaporeSingapore
South Korea
Indonesia
Vietnam
Norway
Mexico
Ab
solu
te Q
2 20
17 e
CP
M
UK
Germany
China
Very HighModerate
Mo
der
ate
Ver
y H
igh
eCPM Growth: Q2 2017 vs. Q2 2016
Americas
EMEA
APAC
Copyright © 2017 Smaato Inc. All Rights Reserved. 4
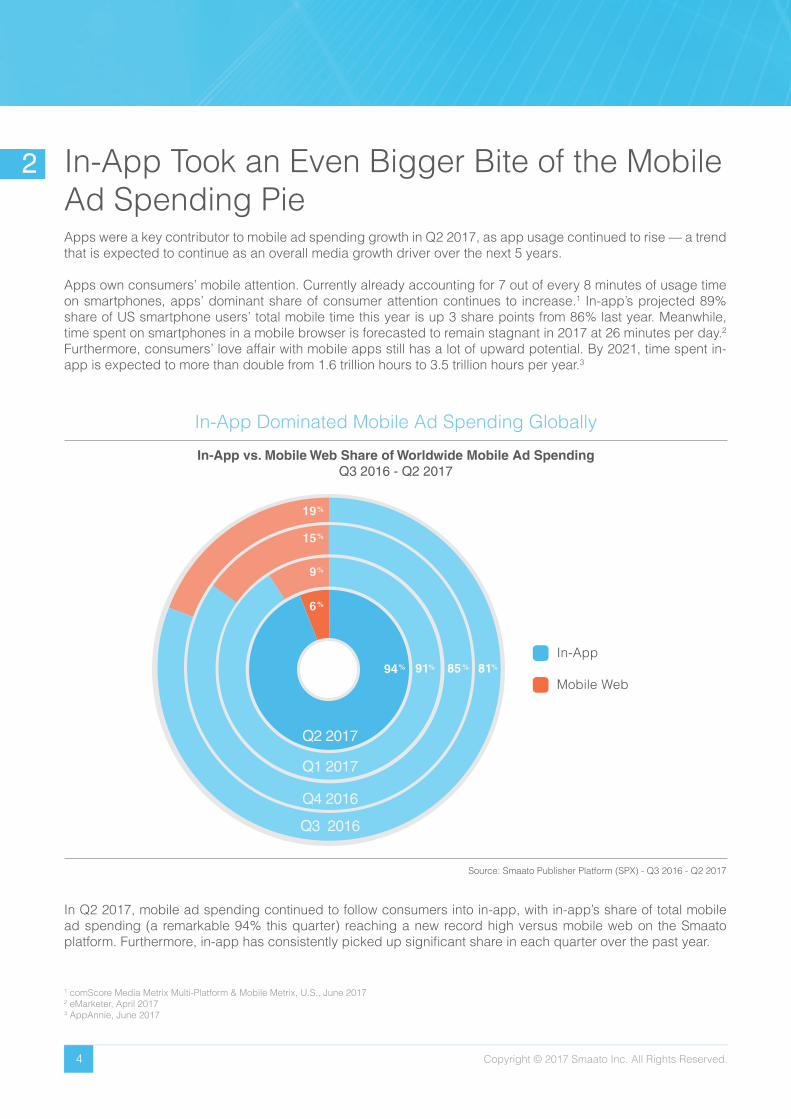
In-App Took an Even Bigger Bite of the Mobile Ad Spending PieApps were a key contributor to mobile ad spending growth in Q2 2017, as app usage continued to rise — a trend that is expected to continue as an overall media growth driver over the next 5 years.
Apps own consumers’ mobile attention. Currently already accounting for 7 out of every 8 minutes of usage time on smartphones, apps’ dominant share of consumer attention continues to increase.1 In-app’s projected 89% share of US smartphone users’ total mobile time this year is up 3 share points from 86% last year. Meanwhile, time spent on smartphones in a mobile browser is forecasted to remain stagnant in 2017 at 26 minutes per day.2 Furthermore, consumers’ love affair with mobile apps still has a lot of upward potential. By 2021, time spent in-app is expected to more than double from 1.6 trillion hours to 3.5 trillion hours per year.3
Source: Smaato Publisher Platform (SPX) - Q3 2016 - Q2 2017
In-App Dominated Mobile Ad Spending Globally
In-App vs. Mobile Web Share of Worldwide Mobile Ad SpendingQ3 2016 - Q2 2017
Mobile Web
In-App
Q2 2017
Q1 2017
Q4 2016
Q3 2016
1 comScore Media Metrix Multi-Platform & Mobile Metrix, U.S., June 20172 eMarketer, April 20173 AppAnnie, June 2017
In Q2 2017, mobile ad spending continued to follow consumers into in-app, with in-app’s share of total mobile ad spending (a remarkable 94% this quarter) reaching a new record high versus mobile web on the Smaato platform. Furthermore, in-app has consistently picked up signifi cant share in each quarter over the past year.
2
Copyright © 2017 Smaato Inc. All Rights Reserved. 5
Source: Smaato Publisher Platform (SPX) - Q2 2017
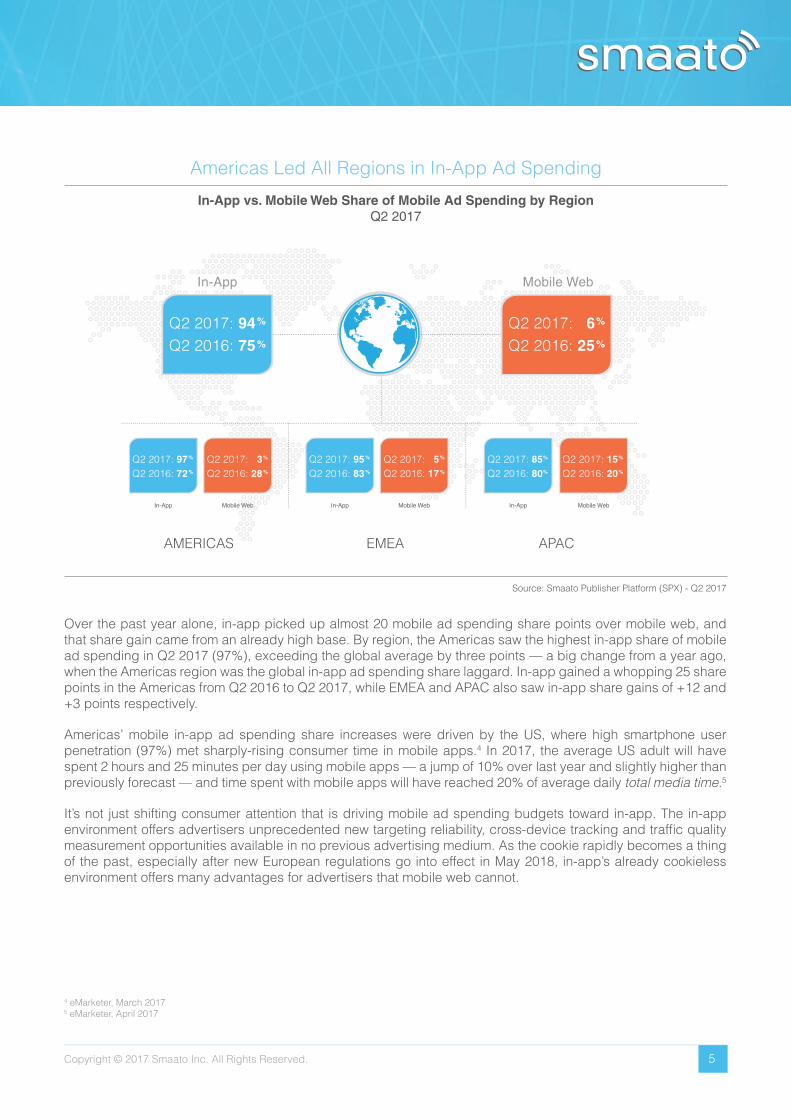
Over the past year alone, in-app picked up almost 20 mobile ad spending share points over mobile web, and that share gain came from an already high base. By region, the Americas saw the highest in-app share of mobile ad spending in Q2 2017 (97%), exceeding the global average by three points — a big change from a year ago, when the Americas region was the global in-app ad spending share laggard. In-app gained a whopping 25 share points in the Americas from Q2 2016 to Q2 2017, while EMEA and APAC also saw in-app share gains of +12 and +3 points respectively.
Americas’ mobile in-app ad spending share increases were driven by the US, where high smartphone user penetration (97%) met sharply-rising consumer time in mobile apps.4 In 2017, the average US adult will have spent 2 hours and 25 minutes per day using mobile apps — a jump of 10% over last year and slightly higher than previously forecast — and time spent with mobile apps will have reached 20% of average daily total media time.5
It’s not just shifting consumer attention that is driving mobile ad spending budgets toward in-app. The in-app environment offers advertisers unprecedented new targeting reliability, cross-device tracking and traffi c quality measurement opportunities available in no previous advertising medium. As the cookie rapidly becomes a thing of the past, especially after new European regulations go into effect in May 2018, in-app’s already cookieless environment offers many advantages for advertisers that mobile web cannot.
Americas Led All Regions in In-App Ad Spending
In-App vs. Mobile Web Share of Mobile Ad Spending by RegionQ2 2017
Q2 2017: 94Q2 2016: 75
Q2 2017: 6Q2 2016: 25
In-App Mobile Web In-App Mobile Web In-App Mobile Web
AMERICAS EMEA APAC
In-App Mobile Web
Q2 2017: 97Q2 2016: 72
Q2 2017: 3Q2 2016: 28
Q2 2017: 95Q2 2016: 83
Q2 2017: 5Q2 2016: 17
Q2 2017: 85Q2 2016: 80
Q2 2017: 15Q2 2016: 20
%
%
%
%
%
%
%
%
%
%
%
%
%
%
%
%
4 eMarketer, March 20175 eMarketer, April 2017

Copyright © 2017 Smaato Inc. All Rights Reserved. 6
Of the Top 20 mobile ad spending markets worldwide, in-app held at least a 90% share of ad spending in 18 of them. Japan and South Korea are notable exceptions, where users’ daily time spent on mobile web still outpaced time spent in-app by 16 minutes.6 The development of country-specifi c mobile devices and applications in Japan and South Korea may explain this unique mobile behavior, as many consumers in these countries prefer feature phones that do not provide the typical app experience.
Source: Smaato Publisher Platform (SPX) - Q2 2017, eMarketer - March 2017 (Ranking)
In-App Drove Ad Spending in Top Mobile Markets
In-App vs. Mobile Web Share of Mobile Ad Spending for Top 20 Global MarketsRanked by Mobile Ad Spending
Q2 2017
Mobile WebIn-App
USA
China
UK
Japan
Germany
Australia
Canada
South Korea
Brazil
France
Netherlands
Italy
Sweden
Denmark
Russia
Argentina
India
Norway
Spain
Mexico
1
2
3
4
5
6
7
8
9
10
11
12
14
18
15
19
20
17
16
13
6 eMarketer, October 2016

Copyright © 2017 Smaato Inc. All Rights Reserved. 7
Not surprisingly, these two factors — increased share of consumer attention and astute advertisers’ increasing understanding of mobile in-app’s unique capabilities — drove up the value of in-app ads. In-app eCPMs rose +79% from Q2 2016 to Q2 2017, and in-app ad spaces were three times more valuable (+224%) on average than those in mobile web in the second quarter of 2017.
The premium advertisers place on in-app advertising was most notable in the Americas region, where in-app eCPMs were 3X higher than those of mobile web on average — a fi gure that is driven by US consumers’ rampant app usage. While in-app is on the rise in APAC, this region is still home to the largest proportion of mobile web traffi c and ad spending. As a result, APAC yielded the smallest difference between in-app and mobile web ad values (2.2X). However, as APAC’s mobile ad spending shifts in-app, this will certainly change — mobile-fi rst APAC users already spend more money on in-app purchases than mobile users from any other region.7
Source: Smaato Publisher Platform (SPX) - Q2 2017
Americas’ In-App eCPM Topped the Charts
In-App vs. Mobile Web eCPM by RegionQ2 2017
AMERICAS EMEA
558
183
100
APAC
120
Inde
xed
eCPM
0
300
200
100
400
500
600
286 267
3.0X
2.9X 2.2X Mobile Web
In-App
7 AppsFlyer, July 2016
While absolute in-app eCPMs were highest globally in the Americas in Q2 2017, EMEA and APAC may soon catch up. In-app eCPM growth rates for APAC and EMEA towered over that of the Americas. Both EMEA (+98%) and APAC (+93%) in-app eCPMs almost doubled from Q2 2016 to Q2 2017.
Source: Smaato Publisher Platform (SPX) - Q2 2017 vs. Q2 2016
EMEA & APAC Spearheaded Global In-App eCPM Growth
In-App eCPM Growth by RegionQ2 2017 vs. Q2 2016
GLOBAL
AMERICAS EMEA APAC

Copyright © 2017 Smaato Inc. All Rights Reserved. 8
Video Was Mobile MVP & Gaming Apps Scored Big With Rewarded VideoMobile video ads are the darlings of brand marketers, who reported in a recent US survey that they choose mobile video ad formats because of their ability to increase brand awareness (44%), reach more targeted audiences (34%) and increase the favorability of their brand (26%).8 As mobile video ads take full advantage of the interactivity of mobile and offer high consumer engagement, it’s not surprising that mobile video took off in Q2 2017, showing phenomenal acceleration in ad spending growth.
In the last quarter alone, mobile video ad spending more than doubled (+142%) on the Smaato platform, making video the fastest-growing ad format, followed by Native with +50% ad spending growth from Q1 to Q2 2017. Given its high engagement factor and advertiser utility, we expect mobile video to continue its high growth throughout the quarters (and years) ahead.
Source: Smaato Publisher Platform (SPX) - Q4 2016 - Q2 2017
Mobile Video Ad Spending Surged in Q2
Total Mobile Video Ad Spending Growth WorldwideQ4 2016 - Q2 2017
Q4 2016 Q1 2017 Q2 2017
Vide
o A
d Sp
endi
ng
8 eMarketer, September 2016
3

Copyright © 2017 Smaato Inc. All Rights Reserved. 9
Advertisers Hit Play on Full-Screen Video
Share of Video Ad Spending by Ad SizeQ2 2017
Source: Smaato Publisher Platform (SPX) - Q2 2017
Of the many mobile video ad sizes, full-screen interstitials (320x480, 480x320, 768x1024) were by far the most popular among advertisers on the Smaato platform, accounting for almost two thirds of total mobile video ad spending in Q2 2017. Full-screen video ads were particularly popular among advertisers because of their high viewability rates and their ability to drive user engagement.
320x480
768x1024
Other
480x320
300x250
3%
11%
10%
51%
25%
Rewarded Video Ads Reached New Heights
Rewarded Mobile Video eCPM, Ad Impression & Ad Spending GrowthQ2 2017 vs. Q1 2017
Source: Smaato Publisher Platform (SPX) - Q2 2017 vs. Q1 2017
Particularly popular and user-relevant in gaming apps, high-engagement/rewarded video ad formats saw impressive growth on the Smaato platform this year. In the past quarter alone, rewarded video ad impressions almost doubled (+96%), ad spending increased an impressive +153% and eCPMs grew +48%.
eCPM
+10%
Ad Impressions
+28%
Ad Spending
+48%
+96%
+153%

Copyright © 2017 Smaato Inc. All Rights Reserved. 10
Rewarded Video Scored High in Gaming Apps
Rewarded Video Ad Spending Growth in Gaming AppsQ2 2017 vs. Q1 2017
Source: Smaato Publisher Platform (SPX) - Q2 2017 vs. Q1 2017
Rewarded video ads’ positive user experience has led gaming app publishers to embrace this format quickly. Gaming apps that utilize rewarded video ads see up to 4X higher user retention than apps that do not utilize this ad format.9 It is no wonder that rewarded video ad spending in gaming apps increased +242% from Q1 to Q2 2017 on the Smaato platform, as advertisers and publishers alike recognize the value of this highly engaging format.
9 Tapjoy, May 2017
Rewarded Video Growth Outpaced Interstitial in Gaming Apps
Video Ad Spending Growth in Gaming Apps by Ad FormatQ2 2017 vs. Q1 2017
Source: Smaato Publisher Platform (SPX) - Q2 2017 vs. Q1 2017
Non-rewarded interstitial saw higher overall ad spending in Q2 2017, but rewarded video’s growth in gaming apps outpaced non-rewarded interstitial by +74% from Q1 2017 to Q2 2017.
0
200
300
100
500
400+139%
Q1 2017 Q2 2017 Q1 2017 Q2 2017
100
342
Inde
xed
Ad
Spen
ding
175
418
Interstitial
Rewarded
Copyright © 2017 Smaato Inc. All Rights Reserved. 11
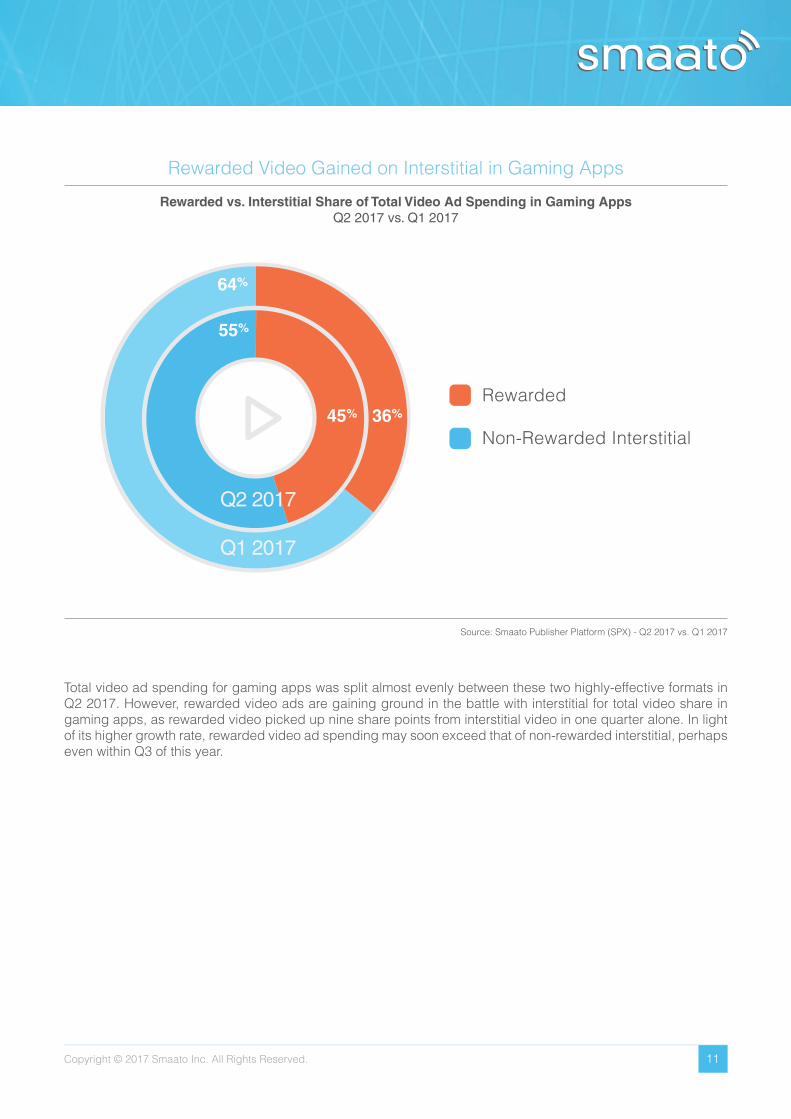
Rewarded Video Gained on Interstitial in Gaming Apps
Rewarded vs. Interstitial Share of Total Video Ad Spending in Gaming AppsQ2 2017 vs. Q1 2017
Source: Smaato Publisher Platform (SPX) - Q2 2017 vs. Q1 2017
Total video ad spending for gaming apps was split almost evenly between these two highly-effective formats in Q2 2017. However, rewarded video ads are gaining ground in the battle with interstitial for total video share in gaming apps, as rewarded video picked up nine share points from interstitial video in one quarter alone. In light of its higher growth rate, rewarded video ad spending may soon exceed that of non-rewarded interstitial, perhaps even within Q3 of this year.
Q2 2017
Q1 2017
Rewarded
Non-Rewarded Interstitial45% 36%
55%
64%
Copyright © 2017 Smaato Inc. All Rights Reserved. 12
In a quarter that marked the 10th anniversary of the iPhone, differences stemming from early decisions Apple and Google made about their respective mobile operating systems are still clearly visible today — even ten years later. iOS was originally created for selling (conversion), while Android was created for advertising (reach).
From the start, Google built Android to maximize reach. The OS was free, and any OEM could customize and release Android-based devices. Why? Because more people with mobile internet access meant more searches from which Google, as the default search service, benefi tted by gathering more data and selling more ads against those searches. Reach and advertising were Google’s primary objectives from the start.
In contrast to Android, which sought to monetize with ads, the iOS and iPhone/iPad ecosystem profi ted from selling its users (premium-priced) devices, accessories and apps. In the iOS App Store, users couldn’t even download a free app without verifying a credit card, which meant that the Apple ecosystem was set up for higher-income individual purchasing from its inception. Apple’s strategy was about exclusivity and conversion.
Current consumer purchase and usage behavior on each OS shows that even now, Android has much more reach, commanding over 70% of the overall worldwide mobile OS market share10 — and that reach advantage is only getting bigger. Of the 432 million smartphones sold in Q4 2016, for example, 352 million ran Android (82%) and 77 million ran iOS (18%).11
Android Ruled Mobile Ad Spending as iOS Reigned Over eCPMs
10 StatCounter, July 201711 Gartner, February 2017
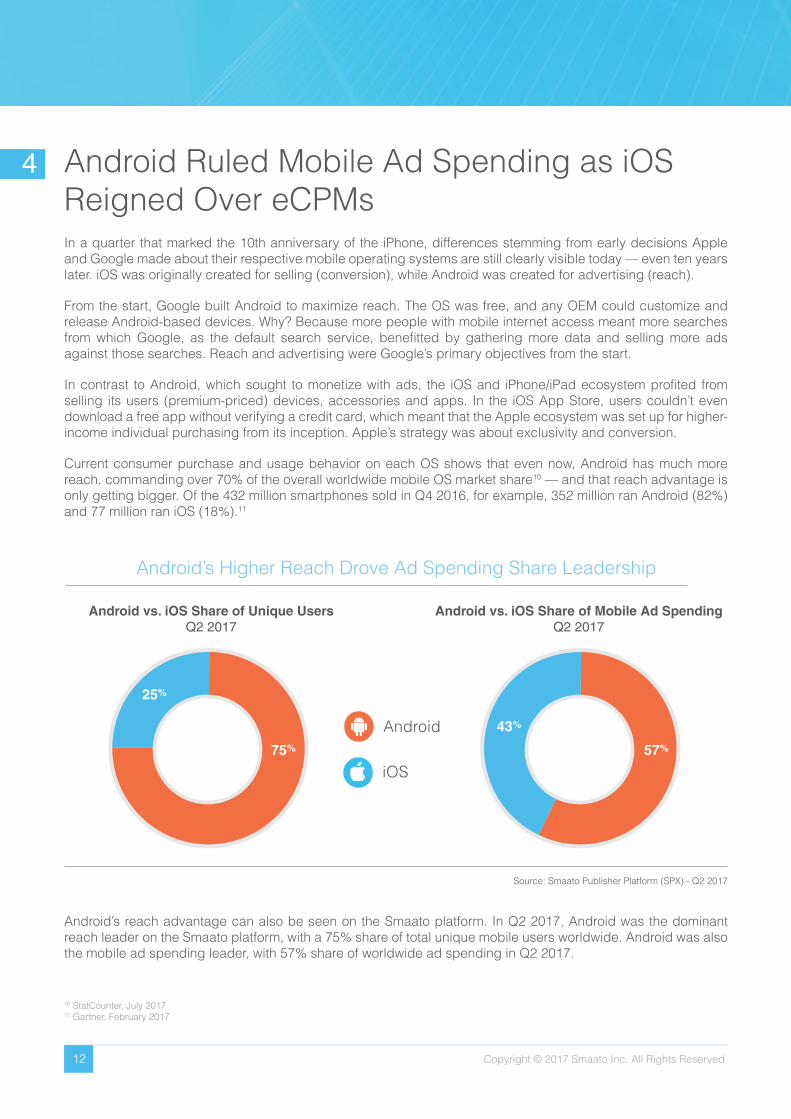
Android’s reach advantage can also be seen on the Smaato platform. In Q2 2017, Android was the dominant reach leader on the Smaato platform, with a 75% share of total unique mobile users worldwide. Android was also the mobile ad spending leader, with 57% share of worldwide ad spending in Q2 2017.
Source: Smaato Publisher Platform (SPX) - Q2 2017
Android’s Higher Reach Drove Ad Spending Share Leadership
Android vs. iOS Share of Unique UsersQ2 2017
Android vs. iOS Share of Mobile Ad SpendingQ2 2017
Android
iOS75% 57%
25%
43%
4
Copyright © 2017 Smaato Inc. All Rights Reserved. 13
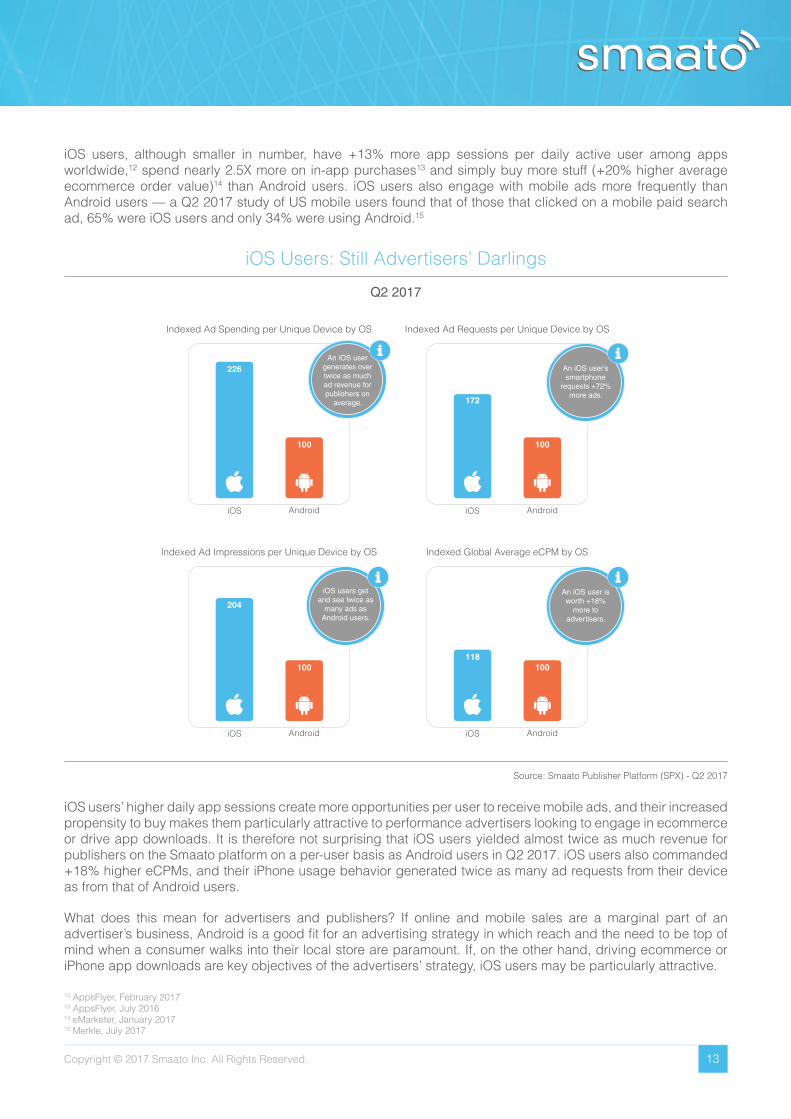
iOS users’ higher daily app sessions create more opportunities per user to receive mobile ads, and their increased propensity to buy makes them particularly attractive to performance advertisers looking to engage in ecommerce or drive app downloads. It is therefore not surprising that iOS users yielded almost twice as much revenue for publishers on the Smaato platform on a per-user basis as Android users in Q2 2017. iOS users also commanded +18% higher eCPMs, and their iPhone usage behavior generated twice as many ad requests from their device as from that of Android users.
What does this mean for advertisers and publishers? If online and mobile sales are a marginal part of an advertiser’s business, Android is a good fi t for an advertising strategy in which reach and the need to be top of mind when a consumer walks into their local store are paramount. If, on the other hand, driving ecommerce or iPhone app downloads are key objectives of the advertisers’ strategy, iOS users may be particularly attractive.
iOS users, although smaller in number, have +13% more app sessions per daily active user among apps worldwide,12 spend nearly 2.5X more on in-app purchases13 and simply buy more stuff (+20% higher average ecommerce order value)14 than Android users. iOS users also engage with mobile ads more frequently than Android users — a Q2 2017 study of US mobile users found that of those that clicked on a mobile paid search ad, 65% were iOS users and only 34% were using Android.15
Source: Smaato Publisher Platform (SPX) - Q2 2017
iOS Users: Still Advertisers’ Darlings
Q2 2017
Indexed Ad Spending per Unique Device by OS
iOS Android
100
226An iOS user
generates over twice as much ad revenue for publishers on
average.
Indexed Ad Impressions per Unique Device by OS
iOS Android
100
204
iOS users get and see twice as
many ads as Android users.
Indexed Ad Requests per Unique Device by OS
iOS Android
100
172
An iOS user’s smartphone
requests +72% more ads.
Indexed Global Average eCPM by OS
iOS Android
100118
An iOS user is worth +18%
more to advertisers.
12 AppsFlyer, February 201713 AppsFlyer, July 201614 eMarketer, January 201715 Merkle, July 2017
Copyright © 2017 Smaato Inc. All Rights Reserved. 14
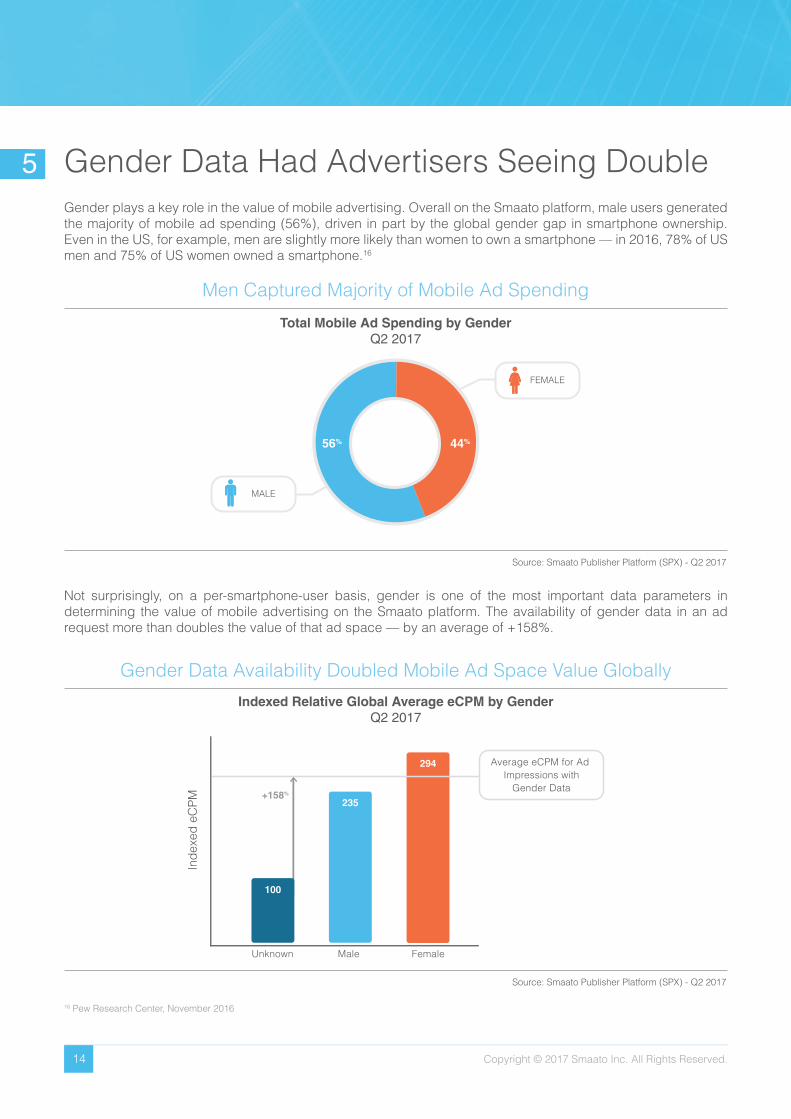
Gender Data Had Advertisers Seeing DoubleGender plays a key role in the value of mobile advertising. Overall on the Smaato platform, male users generated the majority of mobile ad spending (56%), driven in part by the global gender gap in smartphone ownership. Even in the US, for example, men are slightly more likely than women to own a smartphone — in 2016, 78% of US men and 75% of US women owned a smartphone.16
Source: Smaato Publisher Platform (SPX) - Q2 2017
Men Captured Majority of Mobile Ad Spending
Total Mobile Ad Spending by GenderQ2 2017
FEMALE
MALE
Not surprisingly, on a per-smartphone-user basis, gender is one of the most important data parameters in determining the value of mobile advertising on the Smaato platform. The availability of gender data in an ad request more than doubles the value of that ad space — by an average of +158%.
Source: Smaato Publisher Platform (SPX) - Q2 2017
Gender Data Availability Doubled Mobile Ad Space Value Globally
Indexed Relative Global Average eCPM by GenderQ2 2017
Unknown Male Female
Inde
xed
eCPM
Average eCPM for Ad Impressions with
Gender Data
100
235
294
16 Pew Research Center, November 2016
5

Copyright © 2017 Smaato Inc. All Rights Reserved. 15
Source: Smaato Publisher Platform (SPX) - Q2 2017
Who’s Worth More: Men or Women?
eCPM Percentage Premium Paid for Men or Womenfor Top 20 Global Markets Ranked by Mobile Ad Spending
Q2 2017
+74%
Sweden
+69%
Netherlands
+65%
Brazil
+78%
Australia
+27%
Germany
+161%
Argentina
+42%
Denmark
+163%
Norway
+39%
Spain
+48%
Russia
+1%
Canada
+90%
Japan
+10%
UK
+219%
China
+17%
USA
+312%
India
+106%
Mexico
+2%
Italy
+52%
France
+12%
South Korea
Markets Where Advertisers Paid Higher eCPMs for Men Markets Where Advertisers Paid Higher eCPMs for Women
Female smartphone users were more valuable to advertisers than men in all of the Top 3 markets — US, UK and China. However, China was a notable standout. While average global eCPMs for female smartphone users were +25% higher than those for males in Q2 2017 on the Smaato platform, advertisers were willing to pay a whopping +219% eCPM premium for female versus male smartphone users in China. India also stood out among all top markets with the highest eCPM premium (+312%) for women. Canada and Italy (+1% and +2% respectively in favor of women) had the most gender parity in terms of advertiser valuation, and the top Latin American markets Brazil and Argentina, as well as Australia and the Scandinavian countries, all placed more advertiser value on men.
Although women’s mobile devices held a minority share of total ad spending on the Smaato platform, ad space on women’s devices was decidedly more valuable. eCPMs for female users were +25% higher than for male users — a fi nding that is likely helped by women’s affi nity for smartphone shopping.
There are, however, distinct geographical differences in the value to advertisers of men versus women. Of the Top 20 global advertising markets ranked by eMarketer mobile ad spending, men were worth more to advertisers (as measured by Q2 2017 eCPM on the Smaato platform) in half of the world’s top markets — and women were more valuable in the other half.

Copyright © 2017 Smaato Inc. All Rights Reserved. 16
Besides geographical differences, there are also distinct gender differences by operating system. When looking at the operating systems of 1.5+ billion unique users globally on the Smaato platform in Q2 2017, an Android device has a 74% chance of belonging to a male and a 26% chance of belonging to a female. iOS devices are more evenly split among unique users — 51% female and 49% male. However, because female iOS users tend to command the higher eCPMs from advertisers, iOS ad spending skewed female (60%), whereas Android spending skewed male (66%).
By category, Q2 2017 mobile ad spending on the Smaato platform split along stereotypical gender lines — women love fashion and men love sports. There was, however, one notable exception. Although gaming has long been a male-dominated hobby, with males making up 59% of computer and video game users,17 mobile has changed the game by attracting an infl ux of females. In gaming apps, which make up the majority of the Hobbies & Interests (IAB9) category on the Smaato platform, female users generated 75% of ad spending — a fi gure that was largely driven by female casual gamers, as females accounted for 94% of the ad spending in the subcategory Board Games/Puzzles (IAB9-5).
Source: Smaato Publisher Platform (SPX) - Q2 2017
iOS Loved Ladies, Android Was Man’s World
Global Mobile Ad Spending by Gender and OSQ2 2017
Android
iOS
17 Statista, 2017Source: Smaato Publisher Platform (SPX) - Q2 2017
Wanted by Advertisers: Fashionable Females & Male Sports Fans
Total Mobile Ad Spending in Top App Categories by GenderQ2 2017
Sports (IAB17)
Society (IAB14)
Arts & Entertainment (IAB1)
News (IAB12)
Hobbies & Interests (IAB9)
Family & Parenting (IAB6)
Health & Fitness (IAB7)
Style & Fashion (IAB18)
Technology & Computing (IAB19)
Female
Male
64 36
Copyright © 2017 Smaato Inc. All Rights Reserved. 17
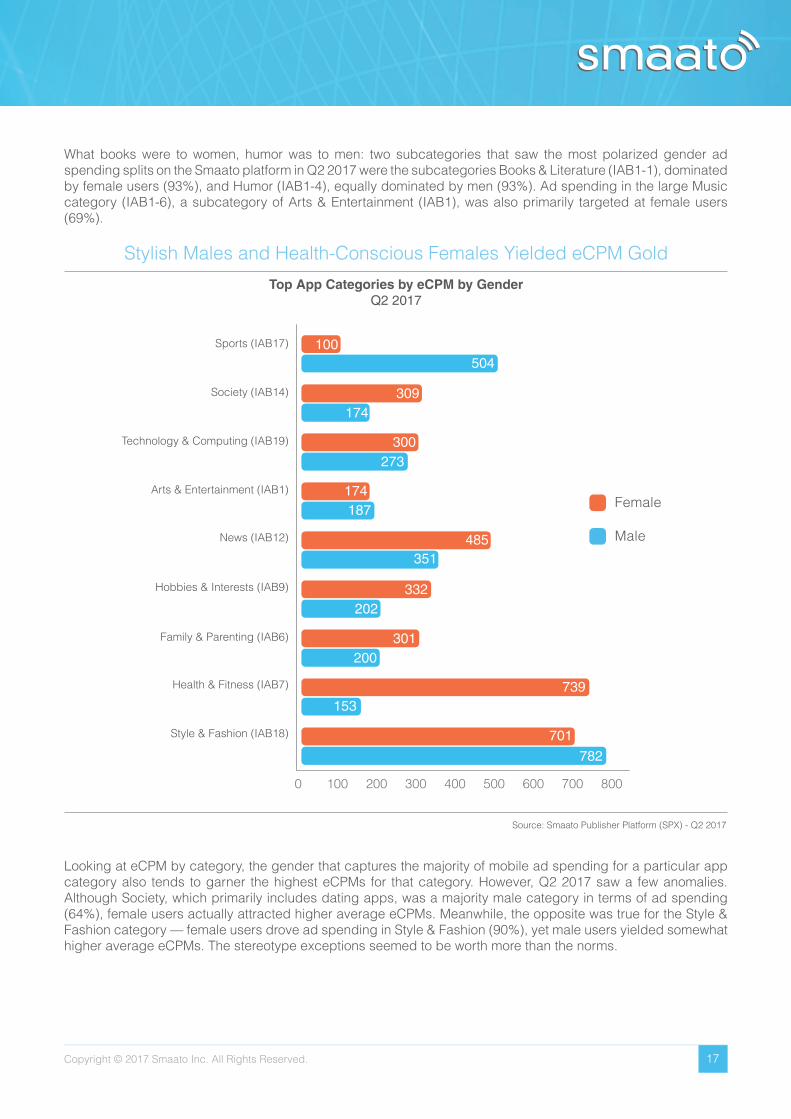
Looking at eCPM by category, the gender that captures the majority of mobile ad spending for a particular app category also tends to garner the highest eCPMs for that category. However, Q2 2017 saw a few anomalies. Although Society, which primarily includes dating apps, was a majority male category in terms of ad spending (64%), female users actually attracted higher average eCPMs. Meanwhile, the opposite was true for the Style & Fashion category — female users drove ad spending in Style & Fashion (90%), yet male users yielded somewhat higher average eCPMs. The stereotype exceptions seemed to be worth more than the norms.
Source: Smaato Publisher Platform (SPX) - Q2 2017
Stylish Males and Health-Conscious Females Yielded eCPM Gold
Top App Categories by eCPM by GenderQ2 2017
Sports (IAB17)
Society (IAB14)
Arts & Entertainment (IAB1)
News (IAB12)
Hobbies & Interests (IAB9)
Family & Parenting (IAB6)
Health & Fitness (IAB7)
Style & Fashion (IAB18)
Technology & Computing (IAB19)
100504
309174
187
300273
485351
332202
301200
701
782
739153
174
0 100 200 300 400 500 600 700 800
Male
Female
What books were to women, humor was to men: two subcategories that saw the most polarized gender ad spending splits on the Smaato platform in Q2 2017 were the subcategories Books & Literature (IAB1-1), dominated by female users (93%), and Humor (IAB1-4), equally dominated by men (93%). Ad spending in the large Music category (IAB1-6), a subcategory of Arts & Entertainment (IAB1), was also primarily targeted at female users (69%).

Copyright © 2017 Smaato Inc. All Rights Reserved. 18
Source: eMarketer, 2017
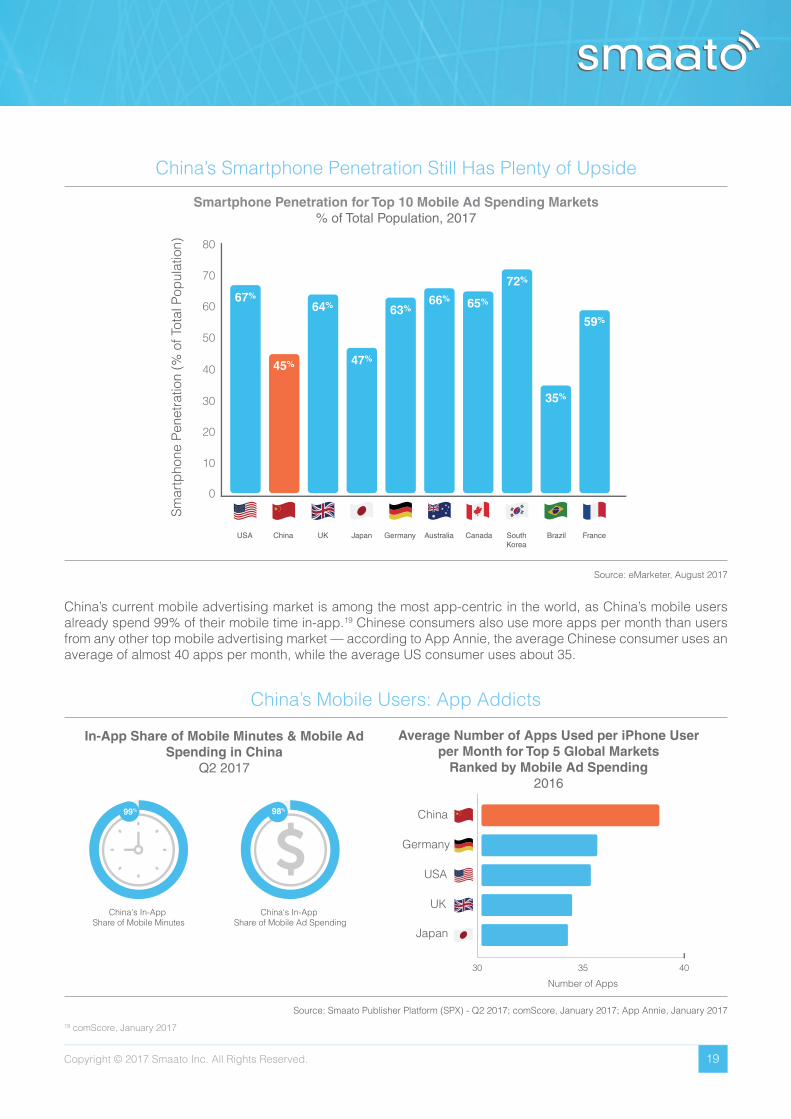
China is already home to almost as many smartphone users (625 million) as there are in the US and Europe (including Russia) combined (669 million). However, China is now at the tipping point of overtaking this large combined group of many of the world’s top markets, as smartphone penetration is still relatively low in China compared to most of the other Top 10 mobile advertising markets globally. Only 47% of the Chinese population currently owns a smartphone, compared to 67% smartphone penetration in the US, 64% in the UK and 72% in South Korea.18
Smartphone User Math: China = US + All of Europe (Almost)
Number of Smartphone Users in China vs. US & Europe2017
China’s App Addiction: A Land of Mobile Advertising OpportunityAs the second-largest mobile advertising market worldwide, China is a land of opportunity for mobile publishers and advertisers alike — and these opportunities will only continue to grow as smartphones increasingly penetrate China’s already-mobile-fi rst market.
625 MillionSmartphone Users in China in 2017
669 MillionSmartphone Users
in US + Europe in 2017
China
USA
Russia
Belgium
UK
Turkey
Austria
Germany
Poland
Switzerland
France
Sweden
Ukraine
Italy
Norway
Netherlands
Spain
Denmark
Greece
18 eMarketer, August 2017
6
Copyright © 2017 Smaato Inc. All Rights Reserved. 19
19 comScore, January 2017
China’s current mobile advertising market is among the most app-centric in the world, as China’s mobile users already spend 99% of their mobile time in-app.19 Chinese consumers also use more apps per month than users from any other top mobile advertising market — according to App Annie, the average Chinese consumer uses an average of almost 40 apps per month, while the average US consumer uses about 35.
Source: eMarketer, August 2017
China’s Smartphone Penetration Still Has Plenty of Upside
Smartphone Penetration for Top 10 Mobile Ad Spending Markets% of Total Population, 2017
0
20
30
40
50
60
70
80
10
Smar
tpho
ne P
enet
ratio
n (%
of T
otal
Pop
ulat
ion)
67%
45%
64%
47%
63%66% 65%
72%
35%
59%
USA China UK Japan Germany Australia Canada SouthKorea
Brazil France
In-App Share of Mobile Minutes & Mobile Ad Spending in China
Q2 2017
China's In-App Share of Mobile Minutes
China's In-App Share of Mobile Ad Spending
Source: Smaato Publisher Platform (SPX) - Q2 2017; comScore, January 2017; App Annie, January 2017
China’s Mobile Users: App Addicts
Average Number of Apps Used per iPhone User per Month for Top 5 Global Markets
Ranked by Mobile Ad Spending2016
Number of Apps
30 35 40
China
Germany
USA
UK
Japan

Copyright © 2017 Smaato Inc. All Rights Reserved. 20
During all of this time spent in-app, Chinese mobile users are conducting a remarkable amount of in-app purchases and transactions. Compared to those in the US, Chinese consumers are 3X more likely to buy food and groceries via mobile devices, 2X more likely to transfer money using apps and 4X more likely to spend a majority of disposable income on mobile.20
Not surprisingly, advertising dollars follow eyeballs. In-app’s 98% share of mobile ad spending on the Smaato platform in Q2 2017 — fi ve share points above the global average — was in line with China’s consumer share of smartphone time spent in-app versus on mobile web.
Source: Smaato Publisher Platform (SPX) - Q2 2017
In-App vs. Mobile Web eCPM in ChinaQ2 2017
This substantial amount of in-app usage and consumer spending leads to high valuations of in-app ad space in China. In-app eCPMs in China were more than 3X higher on average than mobile web eCPMs on the Smaato platform in Q2 2017. As the number of mobile users in China is expected to increase by at least 37 million by 2021,21 we predict that in-app advertising in China will continue its upward trajectory in the coming years.
In-App Ads 3X More Valuable Than Mobile Web in China
50
0
100
150
300
250
200
350
100
Inde
xed
eCPM
304
100
Mobile Web
In-App
20 AppAnnie, June 201721 eMarketer, March 2017

Copyright © 2017 Smaato Inc. All Rights Reserved. 21
Thank You
About Smaato
We hope you’ve enjoyed Smaato’s report on Q2 2017 Global Trends in Mobile Advertising. To download white papers, read case studies and subscribe to our monthly publisher & app developer newsletter, visit us online at www.smaato.com.
Smaato is the leading global real-time advertising platform for mobile publishers and app developers. Smaato runs the world’s largest independent mobile ad exchange and has been pioneering innovative, mobile-fi rst solutions for publishers since 2005.
The Smaato Publisher Platform (SPX) is a global, intelligent and free-to-use self-service platform and ad server that brings native, video and real-time advertising to over 90,000 app developers and mobile publishers. The company’s worldwide reach and extensive network of 450+ demand partners provide a massive variety of advertisers with one single integration. Smaato manages up to 19 billion ads every day around the world, across over 1 billion unique mobile users each month.

www.smaato.com
San Francisco240 Stockton St10th FloorSan Francisco, CA 94108T: +1 (650) 286 1198
HamburgValentinskamp 70Emporio 19th Floor20355 HamburgT: +49 (40) 3480 9490
New YorkEmpire State Building 350 Fifth Avenue, Suite 4210New York, NY 10118T: +1 (646) 650 5030
Singapore12 Marina Boulevard, #35-01Marina Bay Financial Centre Tower 3 Singapore 018982T: +65 6336 6815
Shanghai1018 Changning Road21F Cloud Nine Plaza, Changning DistrictShanghai, China 200042T: +65 6336 6815