Global trends in low cost vehicles and implications for indonesia
24
Global Trends in Low Cost Vehicles and Implications for Indonesia Indonesia May 2010
-
Upload
frost-sullivan -
Category
Business
-
view
2.820 -
download
0
Transcript of Global trends in low cost vehicles and implications for indonesia

Global Trends in Low Cost Vehicles and Implications for Indonesia
IndonesiaMay 2010

2
Frost & Sullivan is a global Growth Consulting Company
The Growth Consulting Company
• Founded in 1961
• Over 1,700 Consultants / Analysts across 38 global
locations
• 10,000+ clients worldwide including emerging
companies, the global 1000, and the investment
community
• Offer the exclusive Growth System including:
Growth Partnership Services, Growth Consulting
and Growth Team Membership
• Developers of the Growth Excellence Matrix –
industry leading growth positioning tool for corporate
executives
• Developers of T.E.A.M. Methodology, proprietary
process to ensure that clients receive a 360o
perspective of technology, markets and growth
opportunities

3
Frost & Sullivan: The Global Growth Consulting Company
Growth Partnership Subscription
Growth Consulting
Best
Practices
Key Clients
Founded in 1961 in US, now operating in all continents
Over 10,000+ clients, 1,700 Consultants / Analysts across 35 global locations
Offer the exclusive Growth System including: Growth Partnership Services, Growth Consulting and Growth Team Membership
Developers of T.E.A.M. Methodology, proprietary process covering technology, economics, application and marketing behind Growth Opportunities

4
Frost & Sullivan’s Positioning & Thought Leadership
Frost & Sullivan
Automotive Domain knowledge
Research Capabilities
HighLow
Low
High
Consumer research
companies
Automotive data and
forecast providers
General Consulting
Companies
Coverage
Global
Local
Balance of domain
knowledge and research
capabilities across the
globe
Sought after by media across
the globe

5
Low Cost Cars : Top level strategic fact sheet
• Global suppliers are partnering increasingly with local regional suppliers for low-cost
competence and understanding of local market know-how
• In addition to local players, all key European, Japanese and American VMs are planning on
huge investments to make India as a low-cost car hub
0.00
1.25
2.50
3.75
5.00
Africa Asia Eastern
Europe
Middle
East
North
America
South
America
Western
Europe
2005 2013
Millio
n u
nit
s
Base Year is 2007. Source: Frost & Sullivan
Global Production of Low-cost cars – by Country, 2007
Regional Presence Global Presence
Lo
w-c
ost
tech
no
log
y e
xp
erti
se
Renault Group
Lo
wH
igh
Global Market Position of Low-cost cars VMs, 2007
Tata Motors
Maruti
Suzuki
Chery
BYD
Hyundai Group
Note: Arrows represent future direction of the VM’s business
Sourc
e:
Fro
st
& S
ulliv
an
Toyota Group
Volkswagen Group
General Motors
Ford

6
0
12,500
25,000
37,500
50,000
0 200 400 600
Passenger Cars (Per 1,000 people)
GD
P b
ase
d o
n P
PP
- P
er
ca
pit
a
Source: Key Development Data & Statistics, The World Bank World
Economic Outlook Database, October 2007
• Emerging economies have a very low
penetration of cars – India and China have
tremendous opportunities, with less than
10 people per 1,000 owing a car
• The Indian and Chinese automotive
industries have been growing at an above
average CAGR of more than 15% and 30%
respectively between 2004 and 2006
(growth of vehicle unit volumes)
• Many global vehicle manufacturers (VMs)
have planned capacity expansions in India
by 2010, while China has already witnessed
a huge surge in production capacity
United States
UK
Germany
Poland
Russia
Brazil
India
China
Opportunity for VMs
Price Range for Low-cost cars – by Country, 2007
BRIC, Eastern Europe and Asia will be the growth engines for automotive production in the next 10 years
Vehicle Purchasing Patterns in Developing countries
7
Definition of Low-cost Vehicles
“ Low cost cars are seen as vehicles with a niche focus catering to the end-user preferences of a specific region or segment ”
• A low-cost vehicle is built for an audience that has similar consumer behavior and
purchasing power
• Expectations are far different for a consumer base of first-time car-buyers in emerging
countries, compared to those of a buyer in developed economy
• For example, the target segment of the Tata Nano, priced at roughly $2,500 is a first-time
car buyer who are up-grading from a motorcycle to a car
• Demand for low-cost cars is a niche market in developed markets especially taking into
account the needs and purchasing power of the consumers in these countries
Manufacturer & Model Country Built Target Group Price Range
Tata Nano IndiaIndian middle class – First time car buyer owning a motorbike
< US$ 5,000
Dacia Logan – Renault Romania Eastern European buyers < US$ 10,000
Chery QQ3 China Chinese buyers < US$ 7,500

8
Definition of Low-cost Vehicles
The cost range of low-cost cars differs by geography
with higher costs in developed economies such as Japan, Europe and North
America
0
3000
6000
9000
12000
India China Eastern
Europe
Europe Japan North
America
Price Range for Low-cost cars – by Country, 2007
Note: Price ranges are indications based on existing /
future planned car models in respective regions
So
urc
e:
Fro
st
& S
ulliv
an
Tata Nano
Maruti 800
Chery QQ3
GM Spark
BYD F1
Dacia
Logan Kei
Daihatsu Sonica
Mitsubishi I
Suzuki Cervo
GM Spark
Dacia Logan
Hyundai Accent
Chevy Aveo
Kia Rio
Price Ceiling for Low-cost cars

9
Definition of Low-cost Vehicles
€ 0
€ 2,500
€ 5,000
€ 7,500
€ 10,000
INDIA CHINAEASTERNEUROPE
JAPAN
Maruti 800
Hyundai Santro
Tata Indica
Maruti AltoChery QQ3
GM Spark
Xiali Wei Zhi
Fiat Panda **
Renault Clio #
Dacia Logan *
Suzuki Wagon R
LOW-COST CARS
Source: Frost & Sullivan
Reta
il P
ric
e o
f V
eh
icle
Mod
els
Note: Bubble Size represents the production volumes of the vehicle models in 2007.$ - For Future vehicles, bubble size does not represent production volumes
* - Does not include Iran
** - Price in Poland
# - Price in Slovenia (Although a basic Clio is priced relatively less in Slovenia, <10,000 cars are sold in
Slovenia and most of the volumes are exported to Western Europe, where it is much more expensive)
Price positioning of vehicle models and their production estimates – by Country, 2007
FUTURE VEHICLES$
Tata Nano
Hyundai LCC
VW Low-cost car
ToyotaLow-cost car
BYD F1
Price Ceiling for Low-cost cars

10
Drivers and Restraints for Low cost carsM
ark
et
Dri
ve
rsM
ark
et
Re
str
ain
ts
New vehicle segment constituting first-
time car buyers and people switching
from two-wheelers to cars
Increasing purchasing power of
a growing middle class in emerging
markets –increasing demand for affordable cars
Government policy encouraging small-displacement and low-emission cars
Low-margins and fear of bleak chances for profitability
So
urc
e:
Fro
st
& S
ulliv
an
Increase in vehicle costs due to
legislations on safety and
emission standards
Limited public transportation infrastructure
and a demand for affordable
transportation
Increasing interest of global
automakers to tap the low-cost car segment and
create new products
Brand image erosion
Competition from used-car market
Lack of infrastructure to support growing
vehicle population
11
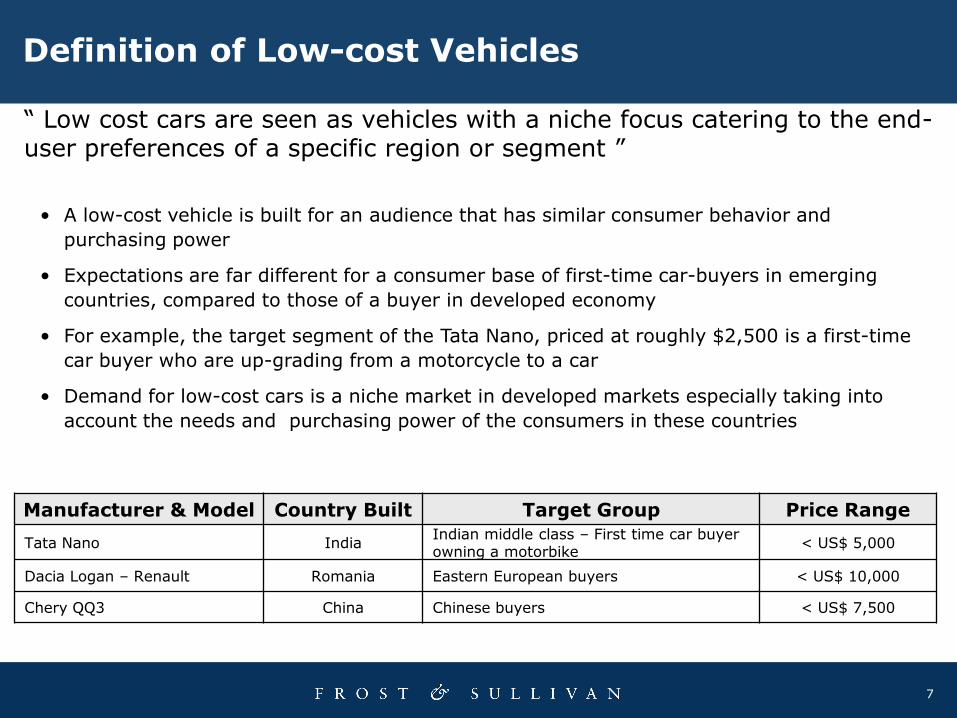
Competitive Landscape
Tata’s $2,500 Nano and Renault’s Logan have propelled many other global VMs to re-look at their model line-ups and consider Low-cost cars seriously
Tata:
- Developed the world’s cheapest car, Nano for US$2,500
targeting the Indian middle class
- Using design-to-cost & engineering innovation for low
cost
Renault:
- Developed Europe’s first low-cost car, Logan, through
its European subsidiary Dacia of Romania
- The group plans to develop a low-cost car for India by
2010, partnering with Indian two-wheeler maker, Bajaj
Suzuki / Maruti Suzuki:
- Two key markets – as Maruti Suzuki in India, as Suzuki
in Japan targeting Kei car segment
- Maruti 800 /Alto is currently the cheapest car in India
- Suzuki is the leading player for Kei car sales in Japan
such as Cervo, Alto, Wagon etc.
Volkswagen:
- Volkswagen produces its low-cost cars at present in
Brazil – namely the Fox and Gol
- The company is developing a low-cost car priced below
€7,000 for Europe based on the “UP” concept car, and
another car for India, based on the Polo platform
Chery:
- Chery is the second largest Chinese manufacturer with
an active interest in global expansion
- The company is planning to assemble cars in Russia and
partnering with Chrysler for small cars
- The company already sells its QQ3, low-cost car in China
Toyota:
- Toyota’s Daihatsu brand is the second largest Kei car
manufacturer with models such as its Daihatsu Cuore,
Sirion, Sonica etc.
- Toyota also plans a low-cost car for India and for
Europe (possibly assembled in Russia), by 2010

12
Competitive Landscape
Hyundai:
- Hyundai manufactures a few models such as the Atos
and Picanto which are low-cost in South Korea
- The company is also evaluating to produce a model
priced at $3,500 in India, to compete against other
models such as Tata Nano and Renault – Bajaj’s car
Fiat Auto:
- Fiat has produced some global car models, especially its
successful Palio and Uno global platforms
- The company has plans to develop a US$ 7,000 car to
be built in South America
- Fiat also has plans to build a LCC for Europe through its
partnership with its Turkish partner Tofas
Other Car Makers:
- Geely offers its CK1 sedan starting at a price of €4,000
- BYD is expected to replace its existing low-cost car,
Flyer with the F1 in mid-2008 priced at around €3,500
- Ford is investing 500 million in its plant in Chennai,
India for a small car plant with capacity of 150,000

13
Suzuki Group,
13.7%
Others, 33.3%
Hyundai Group,
10.4%
Indian
Manufacturers,
17.1%
Chinese
Manufacturers,
8.7%
Renault-Nissan
Group, 16.9%
Estimated Market Share of Low-cost car Manufacturers, 2013
Units: 560,155
Key VMs: Chery, BYD, Changan, Hafei
Regions: Eastern Europe/Russia, China
Units: 664,454
Key VMs: Kia, Hyundai
Regions: India, South Korea
Units: 878,474
Key VMs: Maruti, Suzuki
Regions: India, Japan (Suzuki-Kei cars)
Units: 1,082,795
Key VMs: Renault, Dacia & Nissan
Regions: Eastern EU / Russia, Japan (Nissan-Kei), South America, S. Africa
Units: 2,135,731
Key VMs: GM, VW, Toyota, Fiat and Honda (Kei cars)
Regions: Across all geographies
Units: 1,094,499
Key VMs: TATA, Bajaj + Renault
Regions: India, South Africa
Tata, Renault and Suzuki are expected to account for about 50% of the global Low-cost car production by 2013
Competitive Landscape

14
Global Vehicle Production Forecasts and Trends for Low-cost Vehicles
Low
Medium
High
Low-cost car
Production
India, China, Thailand, Romania, Turkey to emerge as key low-cost production hubs in the future
Asia
2007: 2.14 million
2013: 4.41 million
CAGR: 12.9%
South America
2007: 0.34 million
2013: 0.65 million
CAGR: 11.2%
Eastern EU & Russia
2007: 0.26 million
2013: 0.96 million
CAGR: 24.6%
Africa
2007: 0.01 million
2013: 0.14 million
CAGR: 57.7%
• Tata Motors
• Renault + Bajaj
• Maruti Suzuki
• Hyundai
• Chery
• GM – WULING
• Chang’an
• Geely
• BYD
• Tianjin-FAW
• Renault – Dacia
Middle East
2007: 0.12 million
2013: 0.26 million
CAGR: 13.1%

15
0.0
1.0
2.0
3.0
4.0
5.0
Africa Asia Eastern
Europe
Middle East North
America
South
America
Western
Europe
Units
Global Vehicle Production Forecasts and Trends for Low-cost Vehicles
2007 2013
Unit Shipments in 2013
2.9 million
6.4 million
CAGR : 14.4%
Global Production of Low-cost cars – by Country, 2007 – 2013
Millio
n u
nit
s
Note: Base Year is 2007. CAGR calculated only for the forecast period between 2007 and 2013
More than 4.4 million vehicles to be produced in Asia by 2013 – India to emerge as the low-cost car production hub
0.14 m
4.41 m
0.96 m
0.26 m
0.65 m

16
Indonesia is the most populous country in ASEAN
Historic Trend 2004 2007 2010
(F)
Population (million) 217.5 228.1 235.8
Real GDP Growth (%) 5.1 6.3 6.0
GDP (USD Billion) 257.3 428.8 587.8
GDP Per capita (USD) 1,187 1,880 2,493
Exchange rate (v/s USD) 8,937 9,393 9,830
• Capital : Jakarta
• Languages: Bahasa Indonesia, English, Dutch and local dialects
• Ethnicity: Javanese 45%, Sundanese 14%, Madurese 7.5%, coastal
Malays 7.5%, other 26%
• Population: 228.1 Million. Sumatra 17.9%, Java 39.4%, Sulawesi
7.2%, Kalimantan 33.6%, Sunda Islands 1.1%, Maluku Islands 0.8%
• Indonesia is the largest, most populous and
fastest growing economy in the region
• It is one of the largest exporter of natural gas,
manufacturing contributes to about 45% of
GDP
• Under current regime Indonesia has made
progress in attracting investments but
infrastructure bottlenecks still remain key
problems
17
Brunei
Singapore
Malayasia
Thailand
Indonesia
Philippines
0
50
100
150
200
250
300
350
400
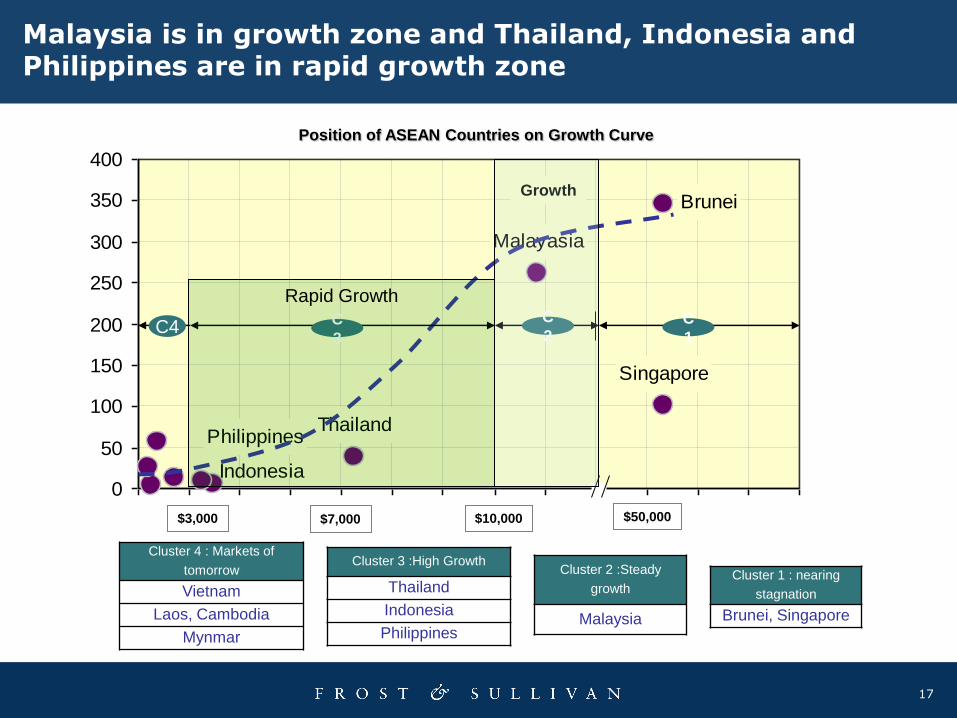
Malaysia is in growth zone and Thailand, Indonesia and Philippines are in rapid growth zone
$50,000$10,000$7,000$3,000
C4 C
3
C
2C
1
Position of ASEAN Countries on Growth Curve
Cluster 1 : nearing
stagnation
Brunei, Singapore
Cluster 2 :Steady
growth
Malaysia
Cluster 3 :High Growth
Thailand
Indonesia
Philippines
Cluster 4 : Markets of
tomorrow
Vietnam
Laos, Cambodia
Mynmar
Rapid Growth
Growth
18
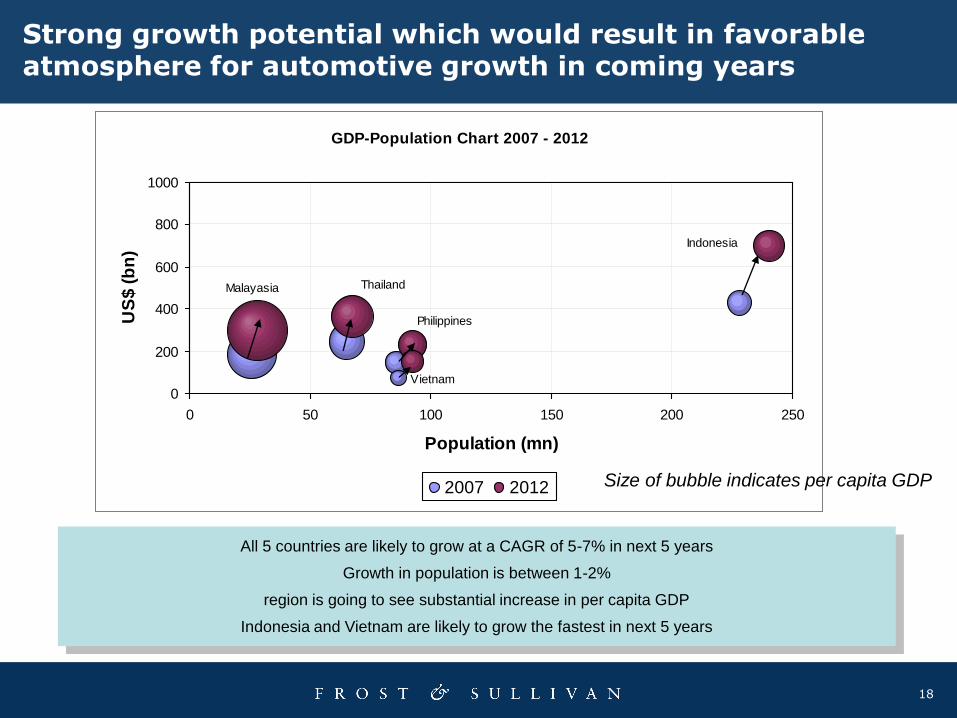
GDP-Population Chart 2007 - 2012
Vietnam
Thailand
Philippines
Malayasia
Indonesia
0
200
400
600
800
1000
0 50 100 150 200 250
Population (mn)
US
$ (
bn
)
2007 2012
Strong growth potential which would result in favorable atmosphere for automotive growth in coming years
All 5 countries are likely to grow at a CAGR of 5-7% in next 5 years
Growth in population is between 1-2%
region is going to see substantial increase in per capita GDP
Indonesia and Vietnam are likely to grow the fastest in next 5 years
Size of bubble indicates per capita GDP

19
Significant young population and large number of middle income households
Source: Asian Development Bank (ADB)
• Significant young population
• Average 5 members per family
• About 45% falls under the age bracket of
first time car buyers (20 to 39)
• Income skewed towards extremely lower
end leaving very small number of buyers
out of the whole population
Indonesia Population by age group
69.3
57.2
45.1
28.7
17.1
10.5
0
20
40
60
80
0 - 19 20 - 29 30 - 39 40 - 49 50 - 59 60 +
Millio
ns
30.3%
25%
19.7%
12.5%
7.4%4.6%74%
Annual HH income Indonesia
0%
3%
8%
12%
29%
19%
27%
0.00%
5.00%
10.00%
15.00%
20.00%
25.00%
30.00%
35.00%
> Rp27mRp21m-27mRp15m-21mRp9.6m-15mRp7.2m-9.6mRp4.8m-Rp7.2m<Rp4.8m
Vehicle Parc & Density 2004 2007 2010
Car Parc (‘000) 1,005 1,169 1,442
Car Density (‘000) 4.6 5.2 6.2
LCV (incl MUV) 4,737 5,766 6,992
LCV Density 21.4 25.27 29.65
Two wheeler parc (‘000) 28,400 42,247 50,700
Two wheeler density (‘000) 133 185 215

20
High fuel prices resulted in increase in Transportation expense
• Continuous fuel price increase has taken
a toll on transportation expenses
• Transportation is the only major expense
head that has increased in top 5 expense
heads
• Diesel prices are growing faster than
Petrol prices and catching up with Petrol
Fuel Price Movement
0
0.1
0.2
0.3
0.4
0.5
0.6
0.7
2000 2002 2004 2006 2007
US
$ c
en
ts /
lit
Diesel
Petrol
38%
21%
21
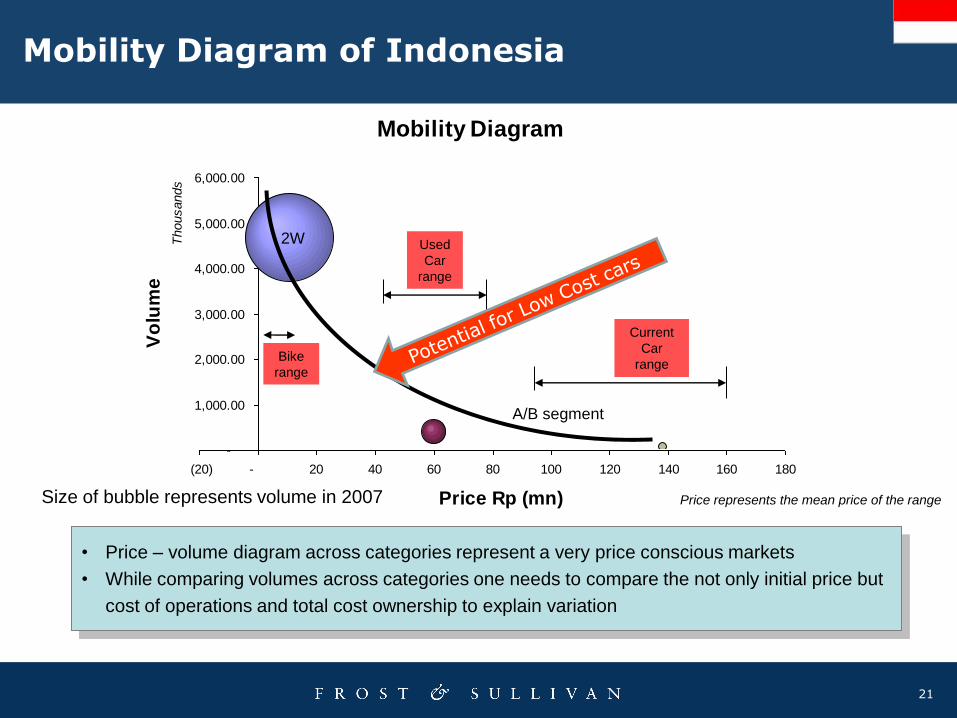
Mobility Diagram
-
1,000.00
2,000.00
3,000.00
4,000.00
5,000.00
6,000.00
(20) - 20 40 60 80 100 120 140 160 180
Thousands
Price Rp (mn)
Vo
lum
e
Mobility Diagram of Indonesia
Bike
range
Used
Car
range
Current
Car
range
Size of bubble represents volume in 2007
• Price – volume diagram across categories represent a very price conscious markets
• While comparing volumes across categories one needs to compare the not only initial price but
cost of operations and total cost ownership to explain variation
A/B segment
Price represents the mean price of the range
2W

22
• Low cost cars sold in developed economies
need to conform to a higher standard of
safety, emission and advanced technology
required in these markets
• Value-for money is the success factor rather
than price in these markets
Industry Challenges for Low cost cars
• Eg., Chinese manufacturer, ChangAn
estimates its profit margin at less than 5
per cent for a single car due to increasing
production costs and price competition
Cannibalization
Brand image
erosion – low-cost
image
Price competition
– Reduced profit
per car sold
• Sales cannibalization is especially a problem for Indian
and Chinese VMs who already sell low-cost cars at present
• For example, sales of the Maruti 800 was severely hit
when Maruti Suzuki launched its Alto model in India
Challenges for
Low-cost cars
• Consumers sometimes consider low-cost cars as a product
with low price, low technology and low safety quotient
• For example, consumers attribute some low-cost Chinese
brands to low safety and emission standards
Providing low-cost
products with
acceptable quality
and performance
• Low margins is definitely the norm
with Low-cost cars and chances of
profitability would depend solely on
the sales volumes generated
• Suppliers and OEMs need to generate
innovative design concepts to reduce
system costs without loss of quality
and offering the same functionality
Keeping prices low in
developed markets in
spite of offering
advanced features
23
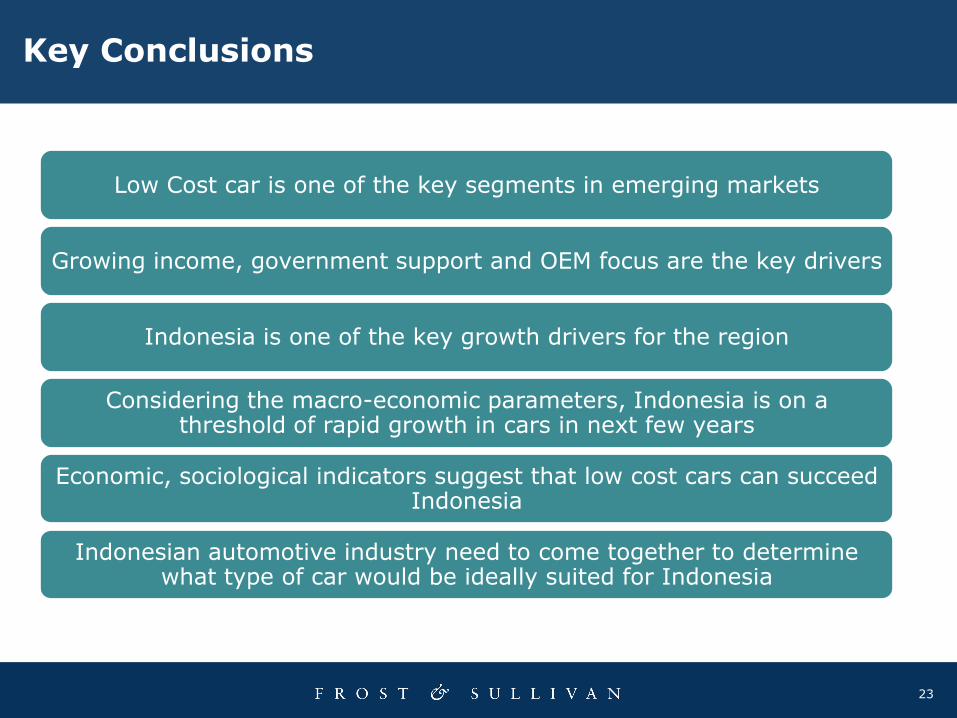
Key Conclusions
Low Cost car is one of the key segments in emerging markets
Growing income, government support and OEM focus are the key drivers
Indonesia is one of the key growth drivers for the region
Considering the macro-economic parameters, Indonesia is on a threshold of rapid growth in cars in next few years
Economic, sociological indicators suggest that low cost cars can succeed Indonesia
Indonesian automotive industry need to come together to determine what type of car would be ideally suited for Indonesia

24
Dewi NurainiCorporate Communications
Indonesia
Phone : (021) 571.0838 / 571.3246
Email : [email protected]
For Additional Information
www.frost.com