Global trade governance & 21 century trade
23
Global trade governance & 21 st century trade Richard Baldwin Graduate Institute, Geneva & University of Oxford
Transcript of Global trade governance & 21 century trade

Global trade governance & 21st century trade
Richard Baldwin Graduate Institute, Geneva &
University of Oxford
Misthinking globalisation • Conventional: Globalisation = Autarky to free
trade, slowly. • But pervasive sense that today’s globalisation
is different …

1870 – 1980: Globalisation is all about trade costs
1870 1880 1890 1900 1910 1920 1930 1940 1950 1960 1970 1980
16
1.1 10
12
14
1.2 1.3 1.4 1.5 1.6 1.7 1.8 1.9
1912
1870-1914: Falling trade costs dominant
1914- 1940: Rising tariffs dominant
1950
1980
1950-1980: Falling tariffs & transport costs dominant
Source: Gravity model based estimates of trade costs (Jacks, Meissner, Novy 2011).
Estimates trade costs (global average)

1870 1880 1890 1900 1910 1920 1930 1940 1950 1960 1970 1980
16
1.1 10
12
14
1.2 1.3 1.4 1.5 1.6 1.7 1.8 1.9
1912
1950
1980
World trade flows (in logs)
Classical trade theory developed
Neoclassical trade theory developed
Add trade flows Globalisation = lower trade costs & more trade in goods

Big picture impact, 1870-1980s • G7’s share of world exports & income
Globalisation = G7’s trade & income share rises

New RTAsNew WTO members
GATT Rounds
World average tariff (right scale)
0%
2%
4%
6%
8%
10%
12%
14%
16%
0
5
10
15
20
25
30
35
40
45
50
1947
1952
1957
1962
1967
1972
1977
1982
1987
1992
1997
2002
2007
GATT does a great job Globalisation = • Tariff cutting by reciprocal negotiation. • Rich nations cut tariffs; developing nations
don’t. • GATT attracts new members.

Something changed: Trade costs fell little; trade kept growing
• ‘Distance puzzle’! • Hummel cannot find the drop in transport costs!
1912
1950
19741980
10
12
14
16
1.1
1.2
1.3
1.4
1.5
1.6
1.7
1.8
1.918
70
1880
1890
1900
1910
1920
1930
1940
1950
1960
1970
1980
1990
2000

Something changed: G7 world shares drop
• “Emerging economies”! • “East Asian miracle”!
1991, 52%
20%
30%
40%
50%
60%19
4819
5319
5819
6319
6819
7319
7819
8319
8819
9319
9820
0320
08Source: WTO database
G7 world export share
1950, 55%
1988, 67%
45%
50%
55%
60%
65%
70%
1948 1958 1968 1978 1988 1998 2008Source: World Databank from 1960; Maddison pre-1960
G7 world GDP share

Something changed: Nature of North-South trade changes
1990
1986
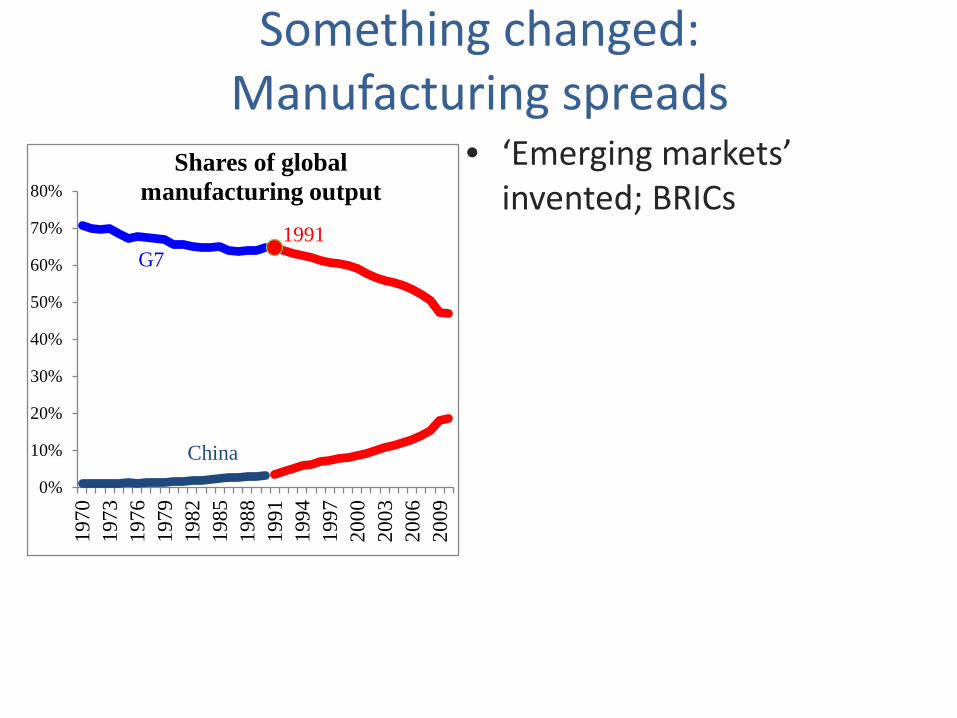
Something changed: Manufacturing spreads
• ‘Emerging markets’ invented; BRICs
1991G7
China0%
10%
20%
30%
40%
50%
60%
70%
80%
1970
1973
1976
1979
1982
1985
1988
1991
1994
1997
2000
2003
2006
2009
Shares of global manufacturing output
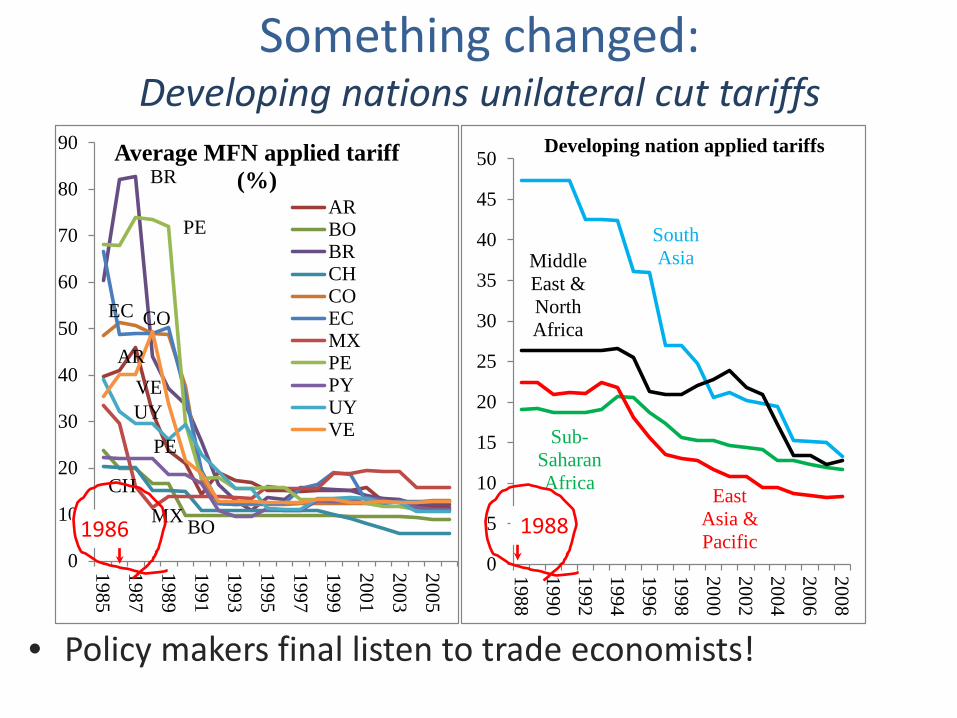
Something changed: Developing nations unilateral cut tariffs
• Policy makers final listen to trade economists!
AR
BO
BR
CH
COEC
MX
PE
PE
UYVE
0
10
20
30
40
50
60
70
80
90
1985
1987
1989
1991
1993
1995
1997
1999
2001
2003
2005
Average MFN applied tariff (%)
ARBOBRCHCOECMXPEPYUYVE
South Asia
Sub-Saharan Africa
Middle East & North Africa
East Asia & Pacific
0
5
10
15
20
25
30
35
40
45
50
19881990199219941996199820002002200420062008
Developing nation applied tariffs
1986 1988

Something changed: FDI and BITs boom
• FDI popularity booms with developing nations! • They agree concessions to attract FDI (BITs)!
New BITs signed
Cumulative BITs
FDI ($ billion)
-
500
1,000
1,500
2,000
2,500
-
50
100
150
200
25019
5919
6119
6319
6519
6719
6919
7119
7319
7519
7719
7919
8119
8319
8519
8719
8919
9119
9319
9519
9719
9920
0120
0320
0520
07

Something changed: RTAs ‘deep’ provisions
• RTAs include beyond WTO provisions: – Competition policy, IPR, investment, capital movements, etc.
0
5
10
15
20
25
30
35
40
4519
58
1963
1968
1973
1978
1983
1988
1993
1998
2003
2008
Deep RTA provisions

Globalisation as 2 unbundlings • 1st unbundling = traditional view • 2nd unbundling = ’21st century globalisation’
14

Global dispersion of production, but local clustering into factories: due to Coordination costs not trade costs
1st unbundling
Bay B Bay A
Bay C
Steam revolution

Relaxing the coordination constraint
• ICT revolution seems to start between 1985 & 1995.
1995
Phones
1995
Internet Users
1985
Internet Hosts (right
scale, in logs)
-
5
10
15
20
25
-
1
2
3
4
5
6
1975
1980
1985
1990
1995
2000
2005
2010
billions
Source: WDI for phone and internet users; www.isc.org for internet hosts

Bay B
Bay A
Bay C
ICT revolution
Dispersion of production stages, but regional clustering (‘factory Asia’, ‘factory EU’, etc.)
2nd unbundling
Bay B Bay A
Bay C
Global dispersion of production, but local clustering into factories: Coordination costs not trade costs
1st unbundling
Bay B Bay A
Bay C
Steam revolution

#1. International commerce transformed
Bay B
Bay A
Bay C
Bay B
Bay A
Bay C
Bay B
Bay A
Bay C
1) Two-way flows of goods, ideas, technology, capital, and technicians.
2) Investment and application of technical, managerial and market know-how abroad.
Connecting factory & doing business abroad: The “trade-investment-services nexus”

#2. New governance demands
19
Bay B
1) Necessary trade & service links Connecting factories - Trade policy barriers; - Transportation services; - Business mobility; - Communication services.
2) Necessary “Behind the border barriers” (BBB) reform Doing business abroad - International investment; - Application of home’s technology abroad; - Local availability of business services.

#3. Different political economy • 1st unbundling political economy logic =
exchange of market access. • 2nd unbundling political economy logic =
Northern factories for Southern reform. – Supply chains mostly regional, so deeper
integration mostly regional. • No factories on offer in Geneva

Implications: Trade governance • ‘Fact’ 1: Doha won’t finish this decade. • Fact 2: Demand & supply for deeper discipline
is huge. – Being filled outside the WTO.
• Implication: The WTO will not be involved in setting these ‘21st century trade’ rules.
• Plurilaterals: Services? Investment? • Mega-regionals:
– TPP may fail, but if not will be the template.
21

WTO scenarios • HOT: WTO concludes DDA & turns to TPP-like
discipline after 2020. – WTO centrality restored as rule keeper & judge.
• WARM: WTO continues central to 20th century disciplines, but irrelevant to 21st century disciplines. – “Marrakesh pillar” in multi-pillar global governance.
• COLD: WTO fails to update 20th century rules; fails to multilateralise 21st century rules & bicycle falls over. – Great Powers global trade governance: TPP,
TransAtlantic Partnership? China bloc? 22
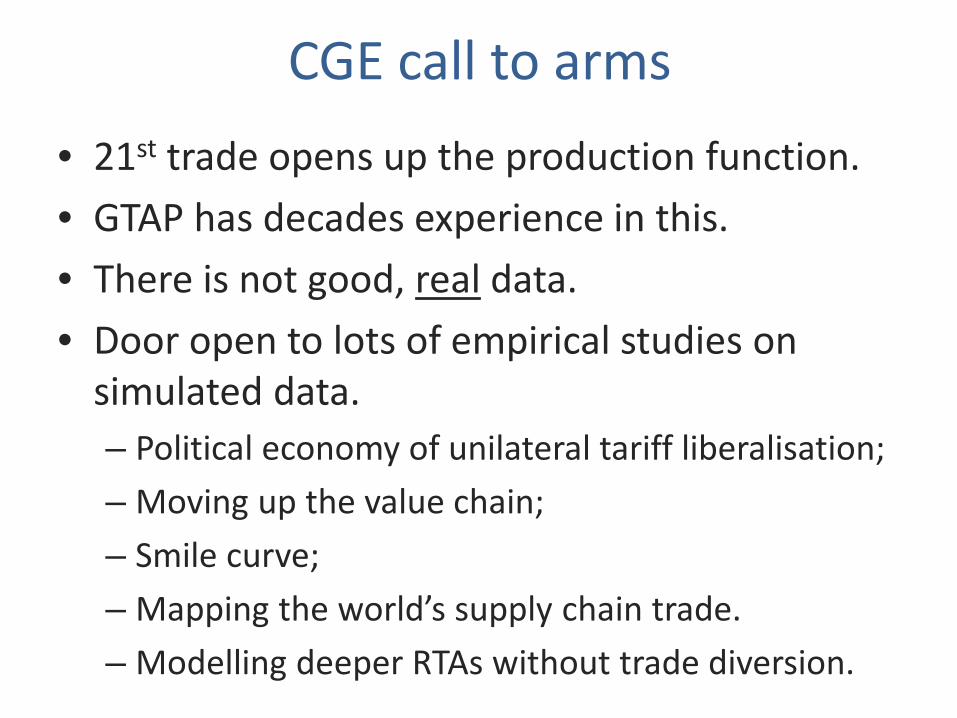
CGE call to arms • 21st trade opens up the production function. • GTAP has decades experience in this. • There is not good, real data. • Door open to lots of empirical studies on
simulated data. – Political economy of unilateral tariff liberalisation; – Moving up the value chain; – Smile curve; – Mapping the world’s supply chain trade. – Modelling deeper RTAs without trade diversion.