Global Tissue Business Outlook
52
Global Tissue Business Outlook With Special Focus on European Developments European Paper Week, Brussels, Belgium November 17-19, 2015 Esko Uutela, Principal, Tissue, RISI 1 © Copyright 2015 RISI, Inc. | Proprietary Information
Transcript of Global Tissue Business Outlook

Global Tissue Business Outlook With Special Focus on European Developments
European Paper Week, Brussels, BelgiumNovember 17-19, 2015
Esko Uutela, Principal, Tissue, RISI
1 © Copyright 2015 RISI, Inc. | Proprietary Information

Agenda
• Recent Global Trends
• North American Outlook
• Latin American Outlook
• Asian Outlook
• European Outlook
• Summary of Global Outlook
• Concluding Remarks
© Copyright 2015 RISI, Inc. | Proprietary Information2

RECENT GLOBAL TRENDS
© Copyright 2015 RISI, Inc. | Proprietary Information3
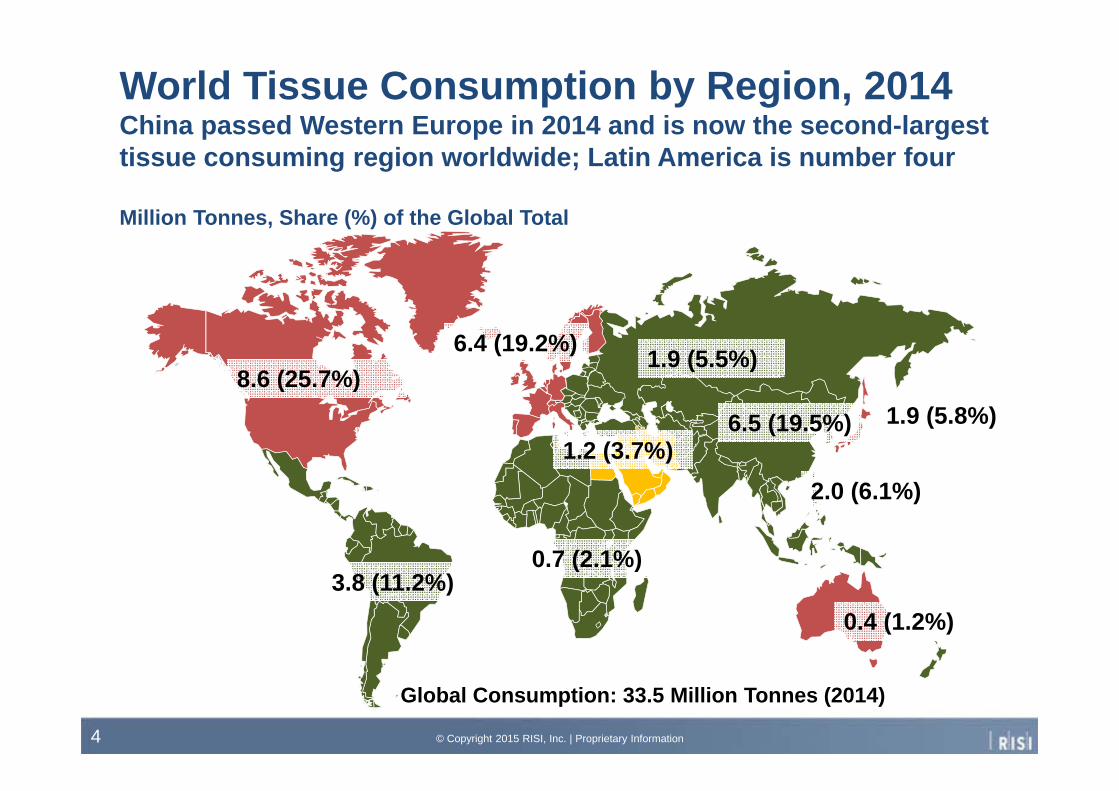
World Tissue Consumption by Region, 2014China passed Western Europe in 2014 and is now the second-largest tissue consuming region worldwide; Latin America is number four
Million Tonnes, Share (%) of the Global Total
© Copyright 2015 RISI, Inc. | Proprietary Information4
Global Consumption: 33.5 Million Tonnes (2014)
1.2 (3.7%)
6.4 (19.2%)
1.9 (5.8%)
0.7 (2.1%)
1.9 (5.5%)
0.4 (1.2%)
8.6 (25.7%)
3.8 (11.2%)
6.5 (19.5%)
2.0 (6.1%)

Annual Growth in the Global Tissue MarketRelatively stable growth with the exception of the Great Recession in 2009, volume growth slightly above 1.0 million tonnes per year
0
1
2
3
4
5
6
0
200
400
600
800
1,000
1,200
2001 2002 2003 2004 2005 2006 2007 2008 2009 2010 2011 2012 2013 2014
Rela
tive
Gro
wth
, Per
cent
per
Yea
r
Thou
sand
Ton
nes
Volume Growth Relative Growth
© Copyright 2015 RISI, Inc. | Proprietary Information5
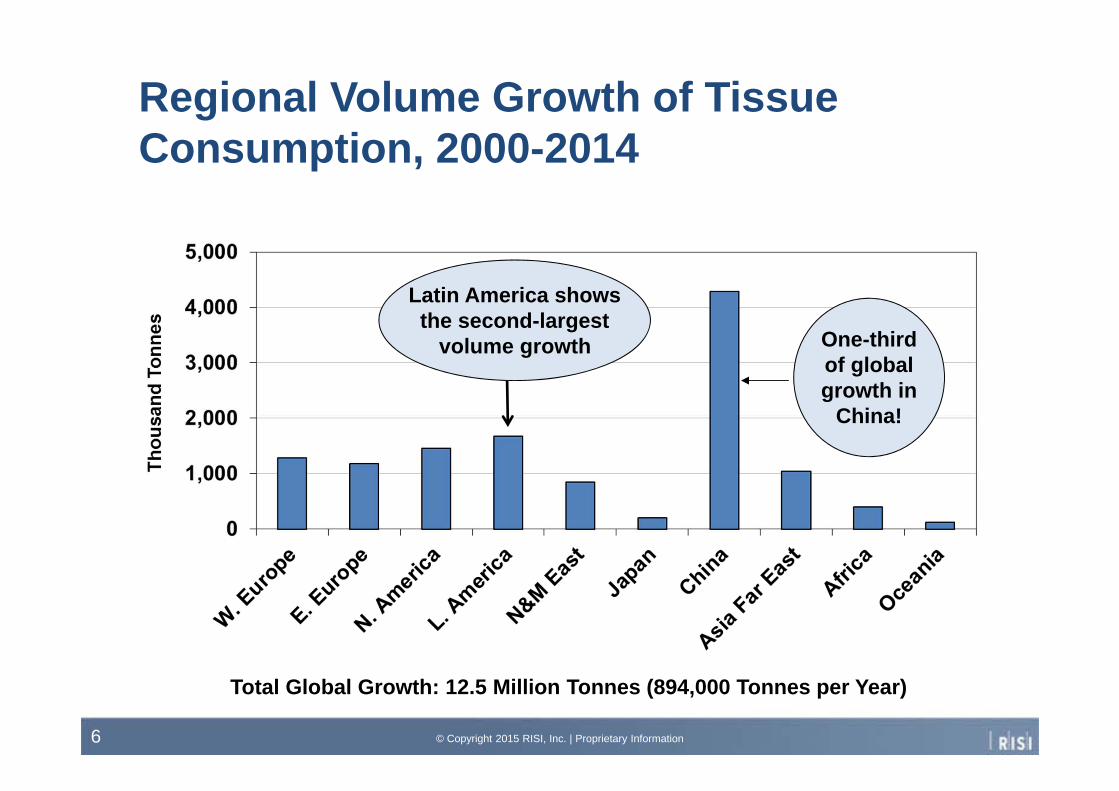
Regional Volume Growth of Tissue Consumption, 2000-2014
© Copyright 2015 RISI, Inc. | Proprietary Information6
One-third of global growth in
China!
Total Global Growth: 12.5 Million Tonnes (894,000 Tonnes per Year)
Latin America shows the second-largest
volume growth
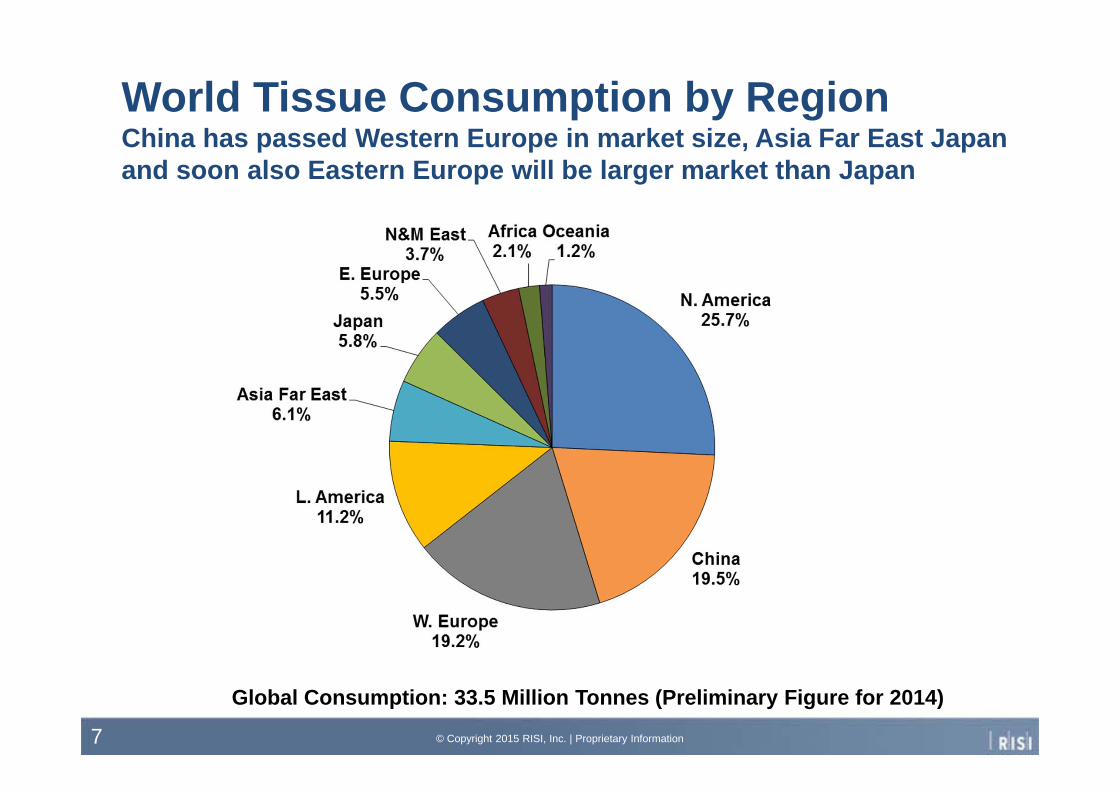
World Tissue Consumption by RegionChina has passed Western Europe in market size, Asia Far East Japan and soon also Eastern Europe will be larger market than Japan
Global Consumption: 33.5 Million Tonnes (Preliminary Figure for 2014)
© Copyright 2015 RISI, Inc. | Proprietary Information7
NORTH AMERICAN OUTLOOK
© Copyright 2015 RISI, Inc. | Proprietary Information8
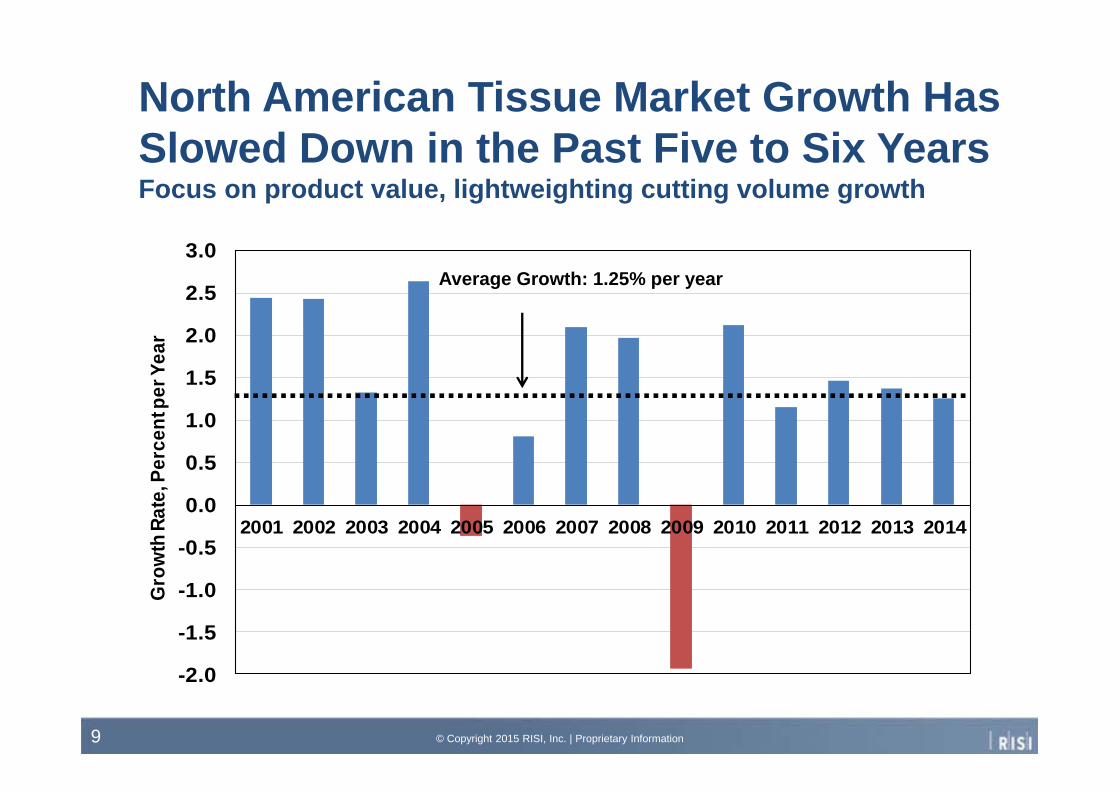
North American Tissue Market Growth Has Slowed Down in the Past Five to Six YearsFocus on product value, lightweighting cutting volume growth
-2.0
-1.5
-1.0
-0.5
0.0
0.5
1.0
1.5
2.0
2.5
3.0
2001 2002 2003 2004 2005 2006 2007 2008 2009 2010 2011 2012 2013 2014
Gro
wth
Rat
e, P
erce
nt p
er Y
ear
© Copyright 2015 RISI, Inc. | Proprietary Information9
Average Growth: 1.25% per year
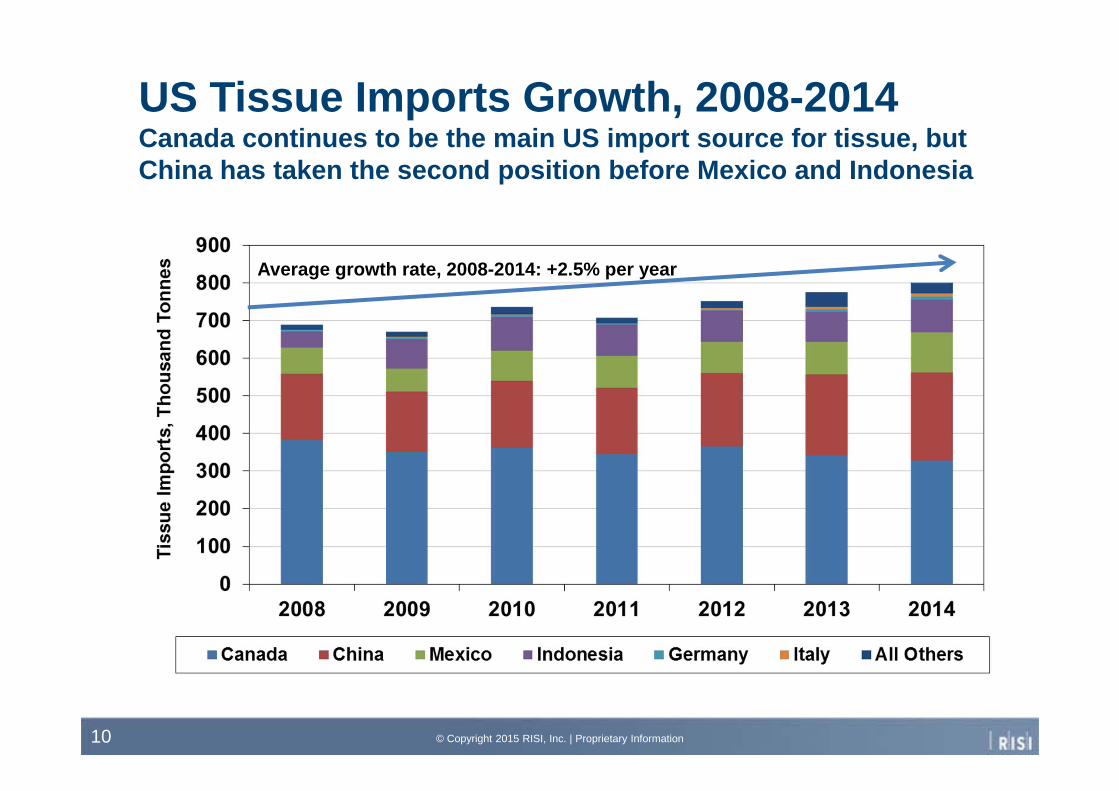
US Tissue Imports Growth, 2008-2014Canada continues to be the main US import source for tissue, but China has taken the second position before Mexico and Indonesia
© Copyright 2015 RISI, Inc. | Proprietary Information10
Average growth rate, 2008-2014: +2.5% per year

Main US Tissue Import Sources Relative Shares of Total Imports, 2014
© Copyright 2015 RISI, Inc. | Proprietary Information11
Total Imports: 299,400 Tonnes Total Imports: 502,100 Tonnes
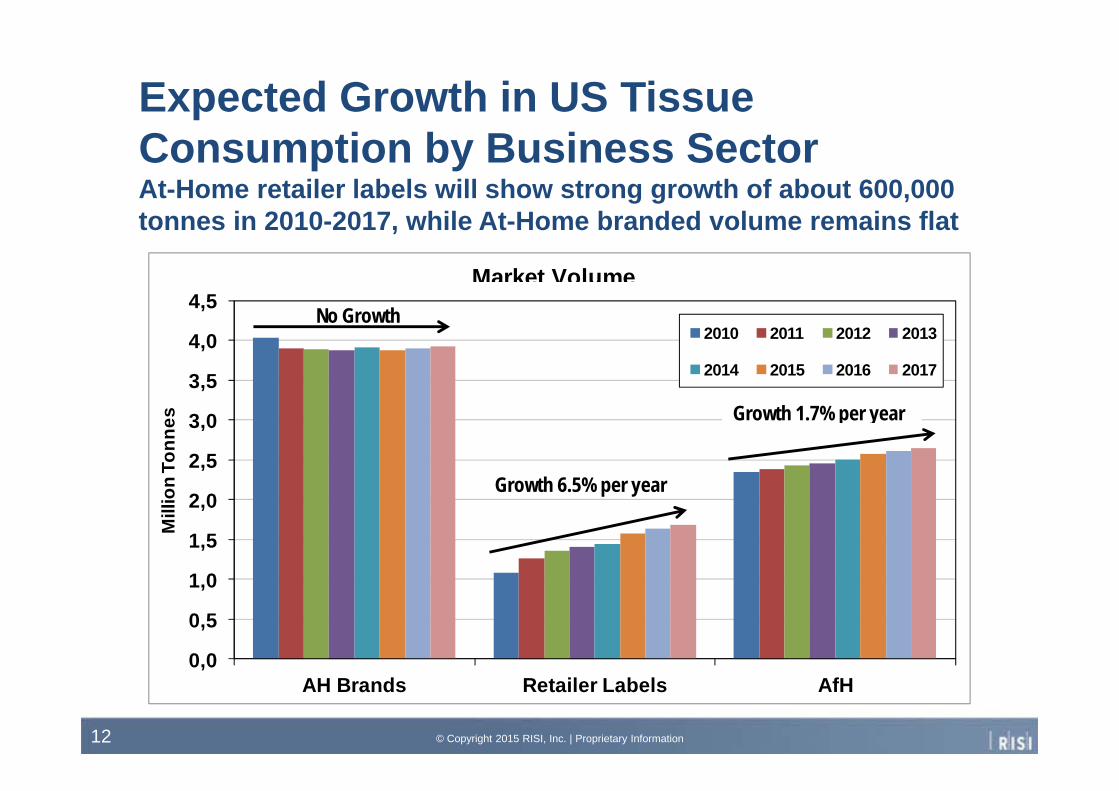
Expected Growth in US Tissue Consumption by Business SectorAt-Home retailer labels will show strong growth of about 600,000 tonnes in 2010-2017, while At-Home branded volume remains flat
0,0
0,5
1,0
1,5
2,0
2,5
3,0
3,5
4,0
4,5
AH Brands Retailer Labels AfH
Mill
ion
Tonn
es
2010 2011 2012 2013
2014 2015 2016 2017
Market VolumeNo Growth
Growth 6.5% per year
Growth 1.7% per year
© Copyright 2015 RISI, Inc. | Proprietary Information12
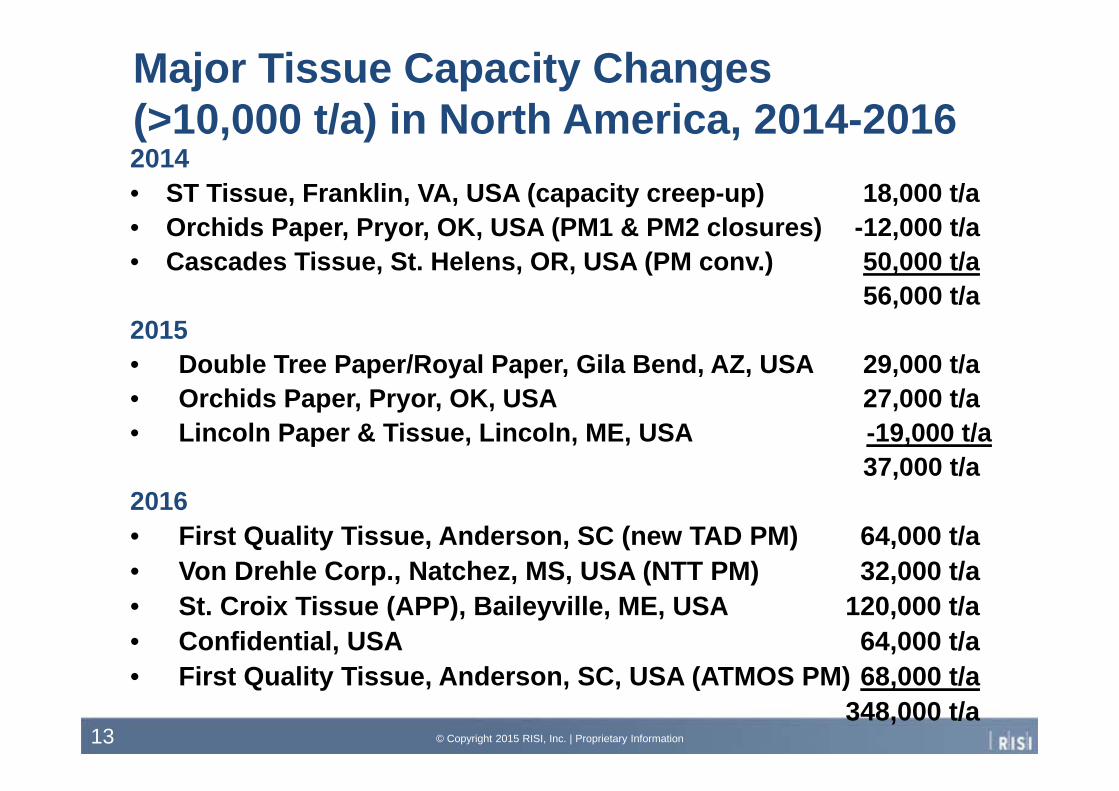
Major Tissue Capacity Changes (>10,000 t/a) in North America, 2014-20162014• ST Tissue, Franklin, VA, USA (capacity creep-up) 18,000 t/a• Orchids Paper, Pryor, OK, USA (PM1 & PM2 closures) -12,000 t/a• Cascades Tissue, St. Helens, OR, USA (PM conv.) 50,000 t/a
56,000 t/a2015• Double Tree Paper/Royal Paper, Gila Bend, AZ, USA 29,000 t/a• Orchids Paper, Pryor, OK, USA 27,000 t/a• Lincoln Paper & Tissue, Lincoln, ME, USA -19,000 t/a
37,000 t/a2016• First Quality Tissue, Anderson, SC (new TAD PM) 64,000 t/a• Von Drehle Corp., Natchez, MS, USA (NTT PM) 32,000 t/a• St. Croix Tissue (APP), Baileyville, ME, USA 120,000 t/a• Confidential, USA 64,000 t/a• First Quality Tissue, Anderson, SC, USA (ATMOS PM) 68,000 t/a
348,000 t/a© Copyright 2015 RISI, Inc. | Proprietary Information13
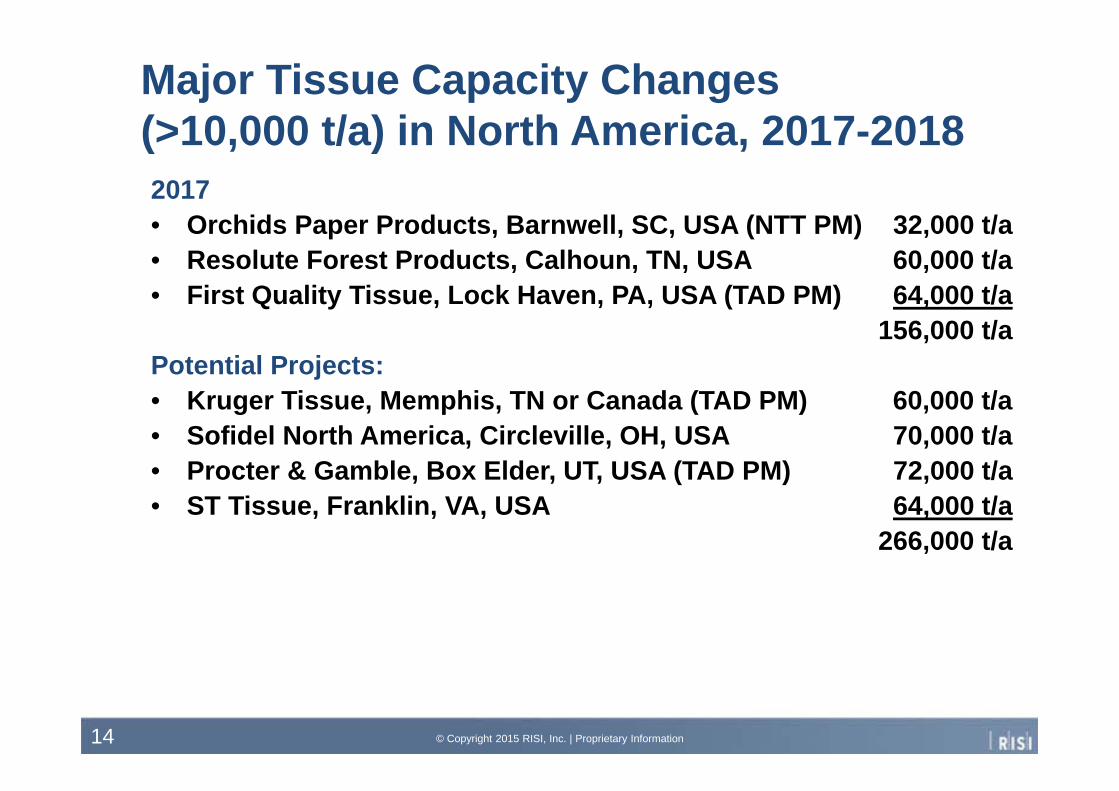
Major Tissue Capacity Changes (>10,000 t/a) in North America, 2017-20182017• Orchids Paper Products, Barnwell, SC, USA (NTT PM) 32,000 t/a• Resolute Forest Products, Calhoun, TN, USA 60,000 t/a• First Quality Tissue, Lock Haven, PA, USA (TAD PM) 64,000 t/a
156,000 t/aPotential Projects:• Kruger Tissue, Memphis, TN or Canada (TAD PM) 60,000 t/a• Sofidel North America, Circleville, OH, USA 70,000 t/a• Procter & Gamble, Box Elder, UT, USA (TAD PM) 72,000 t/a• ST Tissue, Franklin, VA, USA 64,000 t/a
266,000 t/a
© Copyright 2015 RISI, Inc. | Proprietary Information14
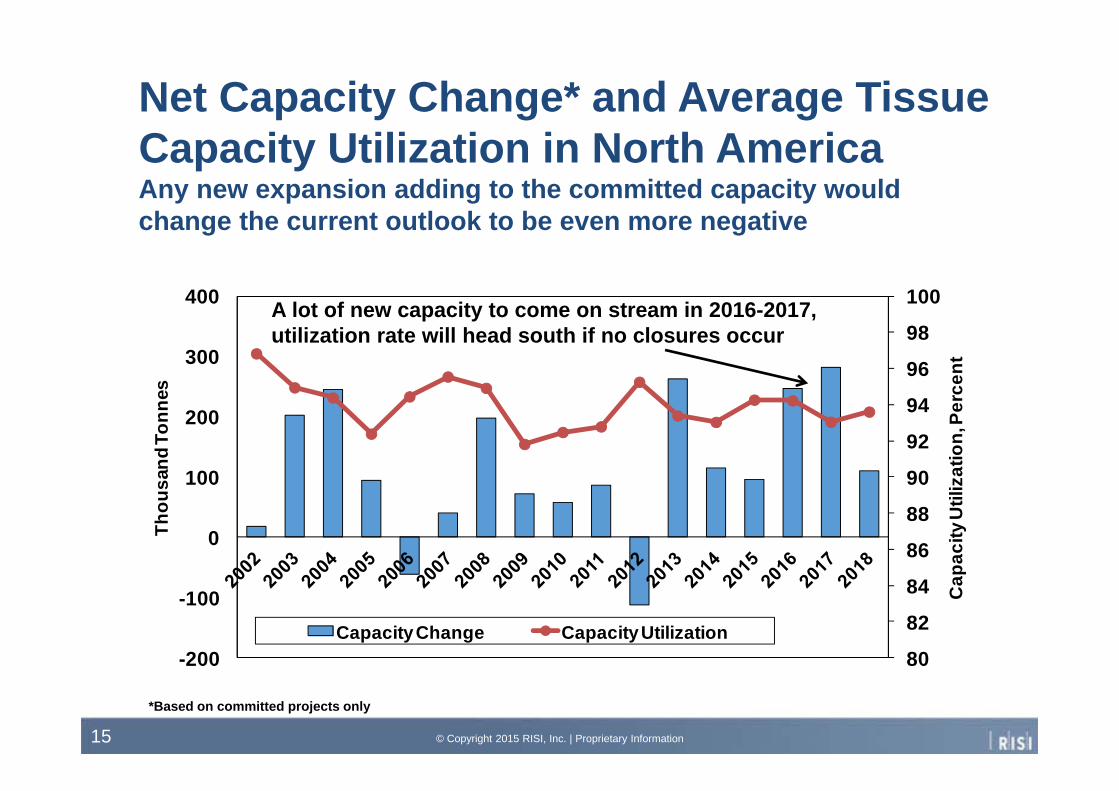
Net Capacity Change* and Average Tissue Capacity Utilization in North AmericaAny new expansion adding to the committed capacity would change the current outlook to be even more negative
80
82
84
86
88
90
92
94
96
98
100
-200
-100
0
100
200
300
400
Cap
acity
Util
izat
ion,
Per
cent
Thou
sand
Ton
nes
Capacity Change Capacity Utilization
© Copyright 2015 RISI, Inc. | Proprietary Information15
*Based on committed projects only
A lot of new capacity to come on stream in 2016-2017, utilization rate will head south if no closures occur
LATIN AMERICAN OUTLOOK
© Copyright 2015 RISI, Inc. | Proprietary Information16

© Copyright 2015 RISI, Inc. | Proprietary Information17
Main Latin American Tissue Markets, 2014The five largest markets accounted for 77% of total consumption
Brazil30%
Mexico27%
Argentina8%
Colombia6%
Chile6%
Venezuela4%
Peru4%
Guatemala2%
Ecuador2%
Costa Rica2%
All Others9%
Total Market Size: 3.7 Million Tonnes

Latin American Tissue Market Shows Varying Annual Growth but a Positive TrendEconomic turbulences and political instability causing problems, dissappointing growth in 2014
© Copyright 2015 RISI, Inc. | Proprietary Information18
-2
0
2
4
6
8
10
12
2001 2002 2003 2004 2005 2006 2007 2008 2009 2010 2011 2012 2013 2014
Grow
th R
ate,
Per
cent
per Y
ear Average Growth, 4.5%/a
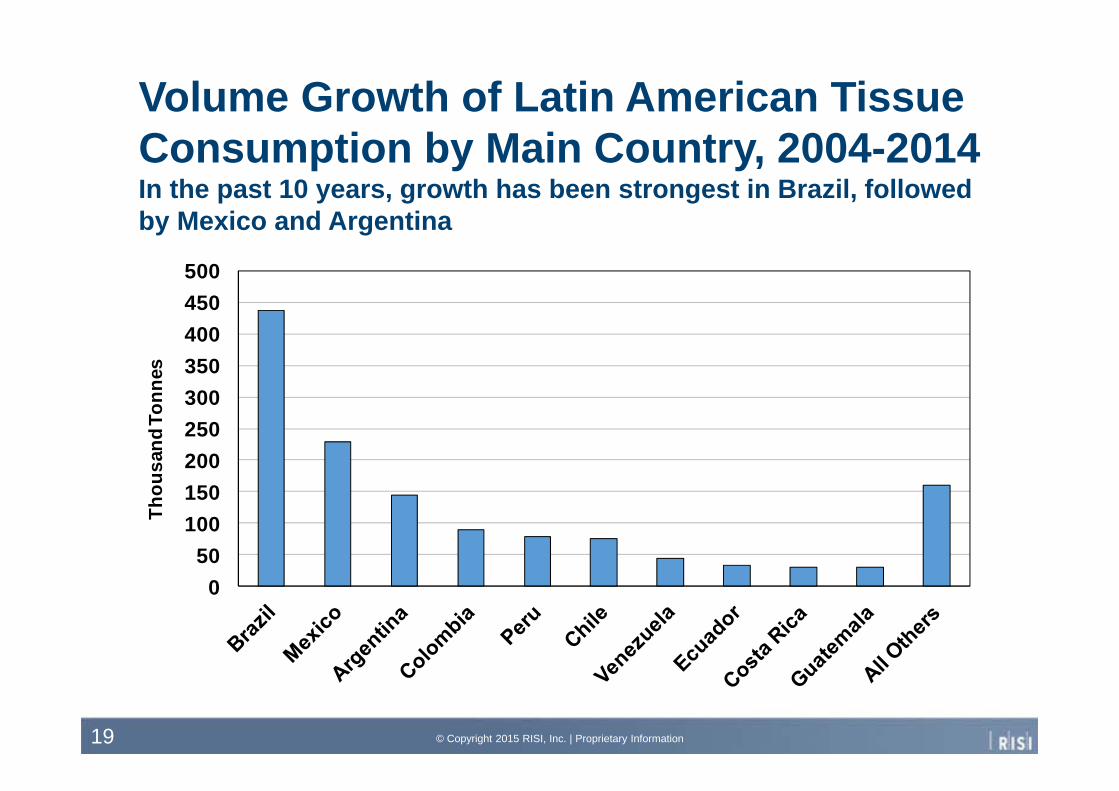
Volume Growth of Latin American Tissue Consumption by Main Country, 2004-2014In the past 10 years, growth has been strongest in Brazil, followed by Mexico and Argentina
050
100150200250300350400450500
Thou
sand
Ton
nes
© Copyright 2015 RISI, Inc. | Proprietary Information19
© Copyright 2015 RISI, Inc. | Proprietary Information20
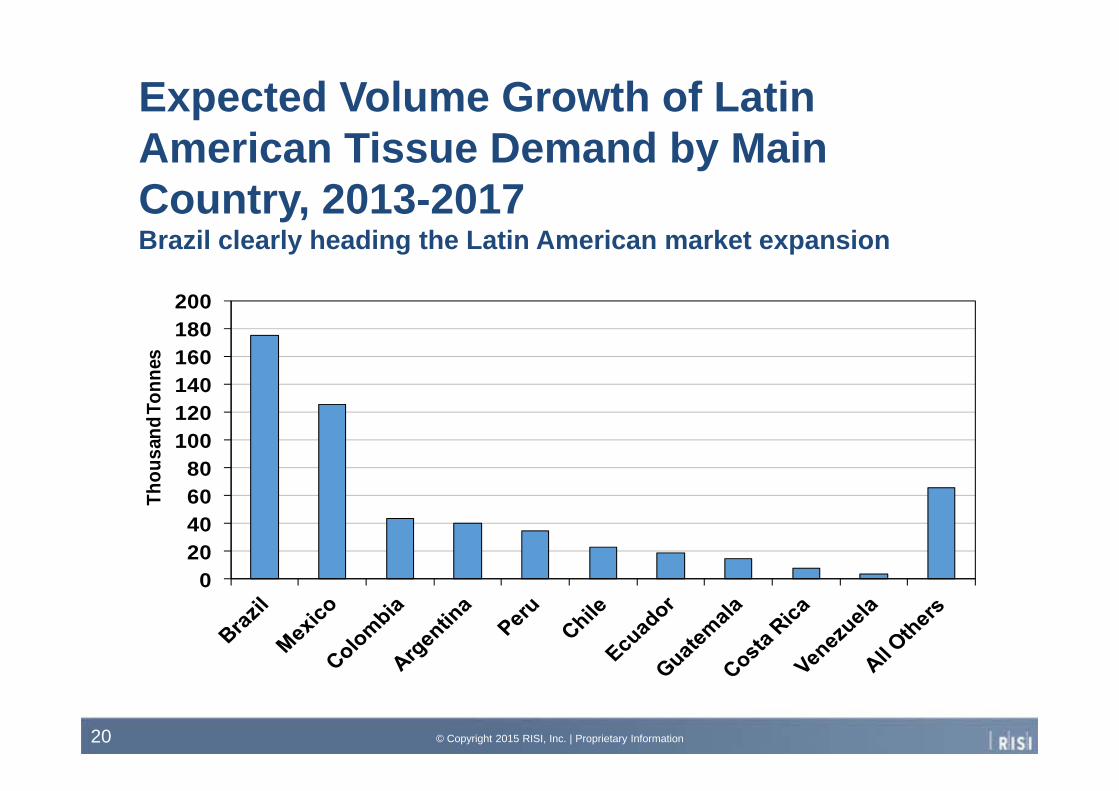
Expected Volume Growth of Latin American Tissue Demand by Main Country, 2013-2017Brazil clearly heading the Latin American market expansion
020406080
100120140160180200
Thou
sand
Tonn
es
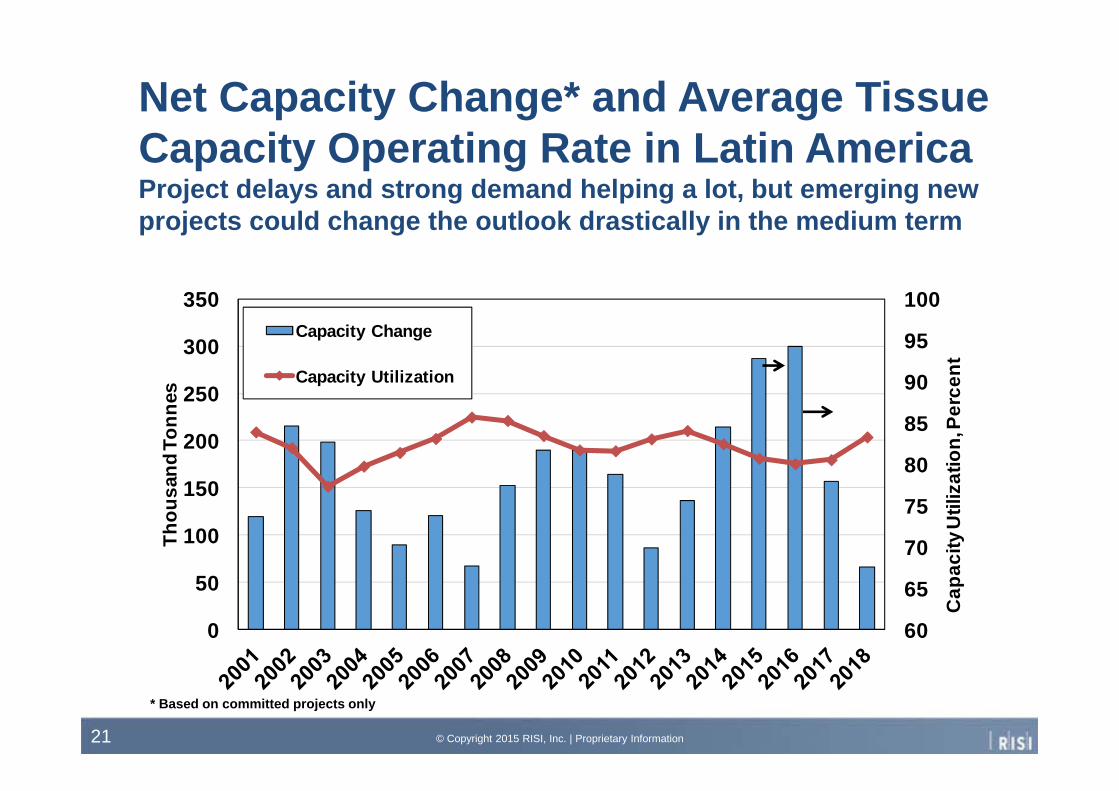
Net Capacity Change* and Average Tissue Capacity Operating Rate in Latin America Project delays and strong demand helping a lot, but emerging new projects could change the outlook drastically in the medium term
60
65
70
75
80
85
90
95
100
0
50
100
150
200
250
300
350
Cap
acity
Util
izat
ion,
Per
cent
Thou
sand
Ton
nes
Capacity Change
Capacity Utilization
© Copyright 2015 RISI, Inc. | Proprietary Information21
* Based on committed projects only

ASIAN OUTLOOK
© Copyright 2015 RISI, Inc. | Proprietary Information22
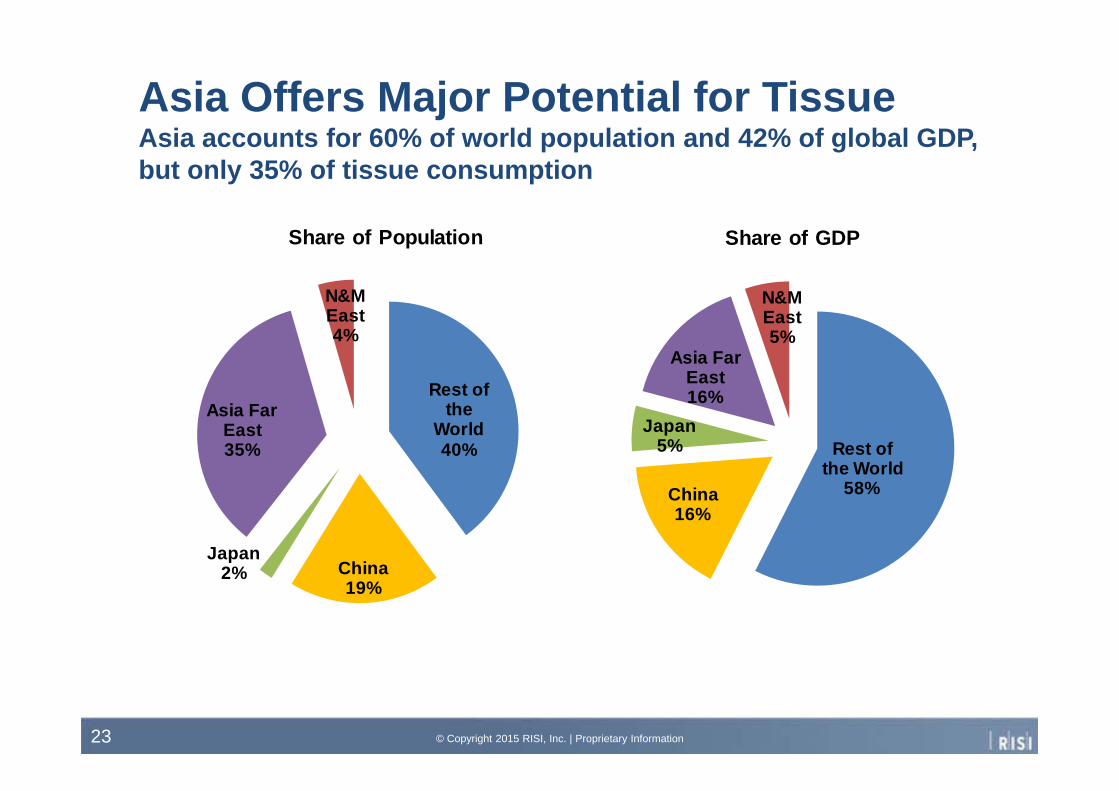
Asia Offers Major Potential for Tissue Asia accounts for 60% of world population and 42% of global GDP, but only 35% of tissue consumption
Rest of the
World40%
China19%
Japan2%
Asia Far East35%
N&M East4%
Share of Population
Rest of the World
58%China16%
Japan5%
Asia Far East16%
N&M East5%
Share of GDP
© Copyright 2015 RISI, Inc. | Proprietary Information23
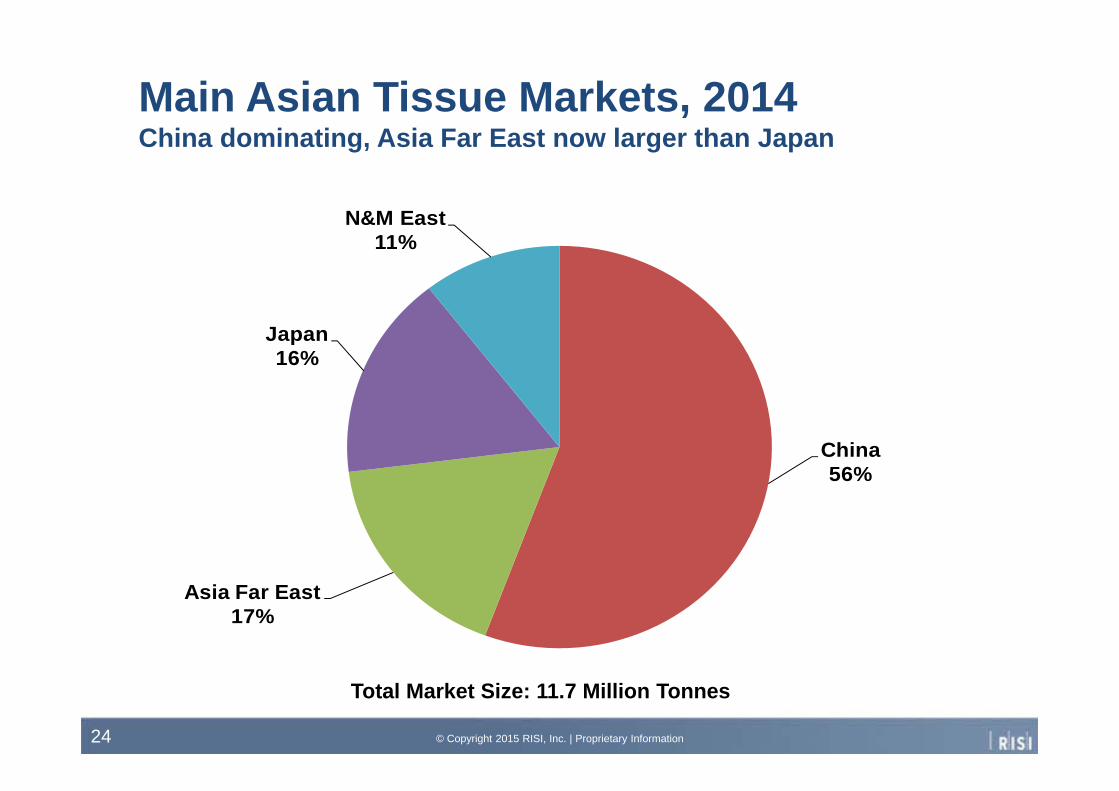
Main Asian Tissue Markets, 2014China dominating, Asia Far East now larger than Japan
China56%
Asia Far East17%
Japan16%
N&M East11%
© Copyright 2015 RISI, Inc. | Proprietary Information24
Total Market Size: 11.7 Million Tonnes
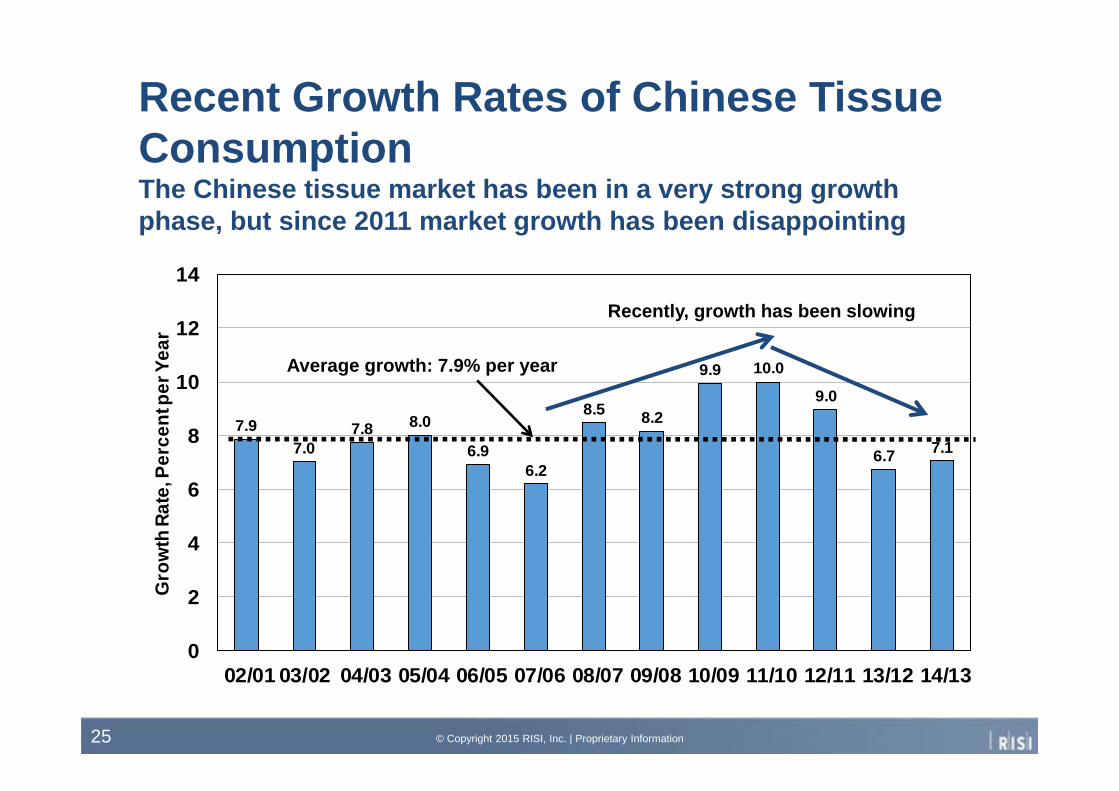
7.97.0
7.8 8.0
6.96.2
8.5 8.2
9.9 10.0
9.0
6.7 7.1
0
2
4
6
8
10
12
14
02/01 03/02 04/03 05/04 06/05 07/06 08/07 09/08 10/09 11/10 12/11 13/12 14/13
Gro
wth
Rat
e, P
erce
nt p
er Y
ear
Recent Growth Rates of Chinese Tissue Consumption The Chinese tissue market has been in a very strong growth phase, but since 2011 market growth has been disappointing
© Copyright 2015 RISI, Inc. | Proprietary Information25
Average growth: 7.9% per year
Recently, growth has been slowing

Estimated Regional Division of Tissue Consumption in China, 2013 Thousand Tonnes
© Copyright 2015 RISI, Inc. | Proprietary Information26
Western Economic Zone
Cheng Yu Economic Zone
Pearl River Delta Economic Zone
Yangtze River Delta Economic Zone
Bohai Bay Rim Economic Zone
Northeastern Economic Zone
North Central Region
South Central Region
1,252
798
1,019
502
181
1,094
917
347
© Copyright 2015 RISI, Inc. | Proprietary Information27
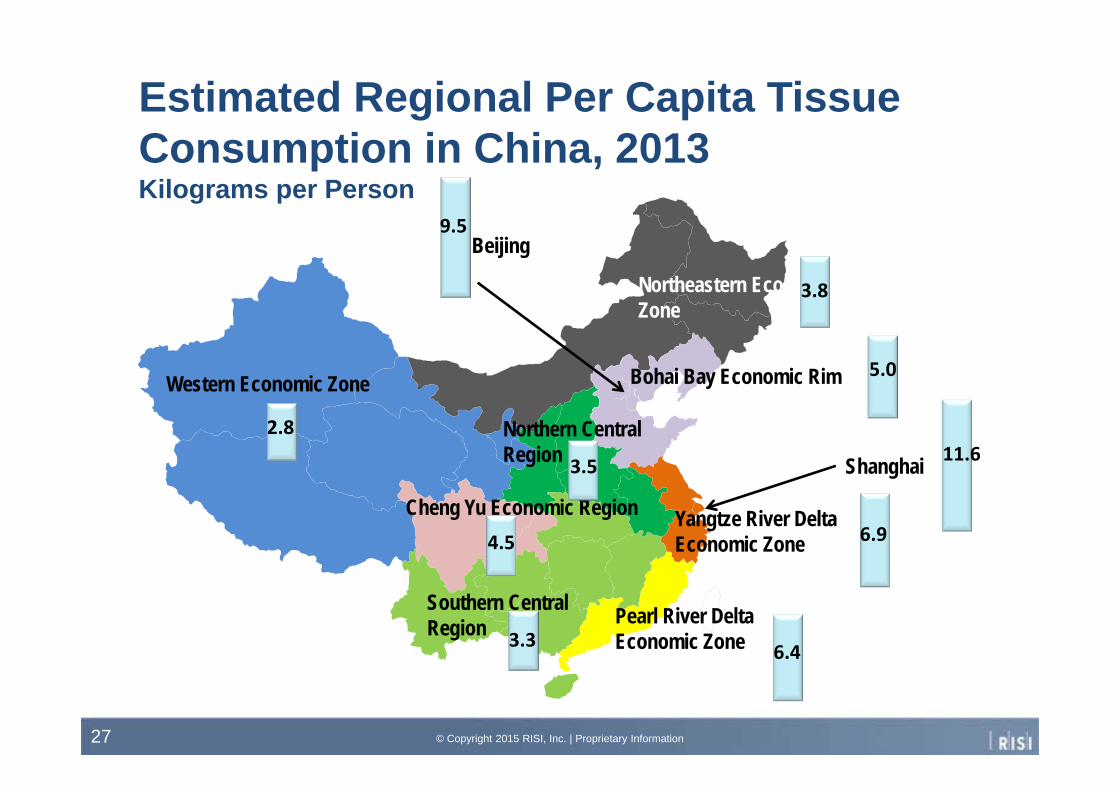
Western Economic Zone
Cheng Yu Economic Region
Pearl River Delta Economic Zone
Yangtze River Delta Economic Zone
Bohai Bay Economic Rim
Northeastern Economic Zone
Northern Central Region
Southern Central Region
Beijing
Shanghai
2.8
6.94.5
3.5
3.3
5.0
3.8
9.5
Estimated Regional Per Capita Tissue Consumption in China, 2013Kilograms per Person
11.6
6.4
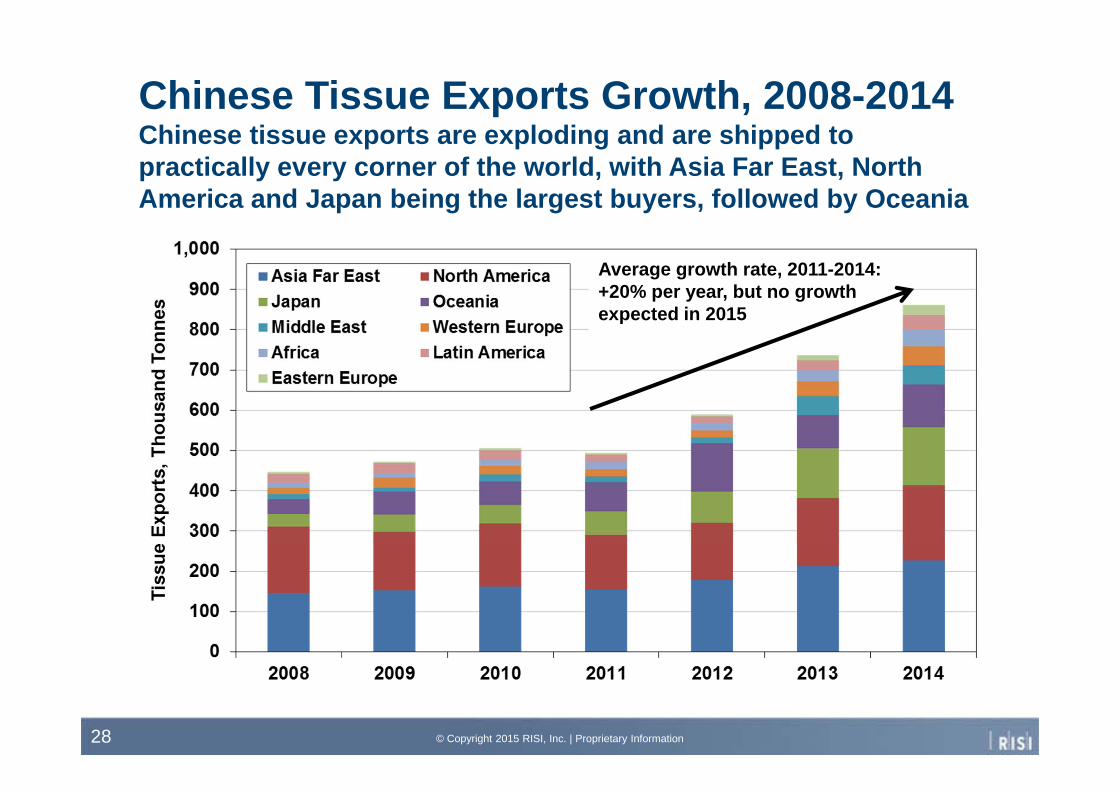
Chinese Tissue Exports Growth, 2008-2014Chinese tissue exports are exploding and are shipped to practically every corner of the world, with Asia Far East, North America and Japan being the largest buyers, followed by Oceania
© Copyright 2015 RISI, Inc. | Proprietary Information28
Average growth rate, 2011-2014: +20% per year, but no growth expected in 2015
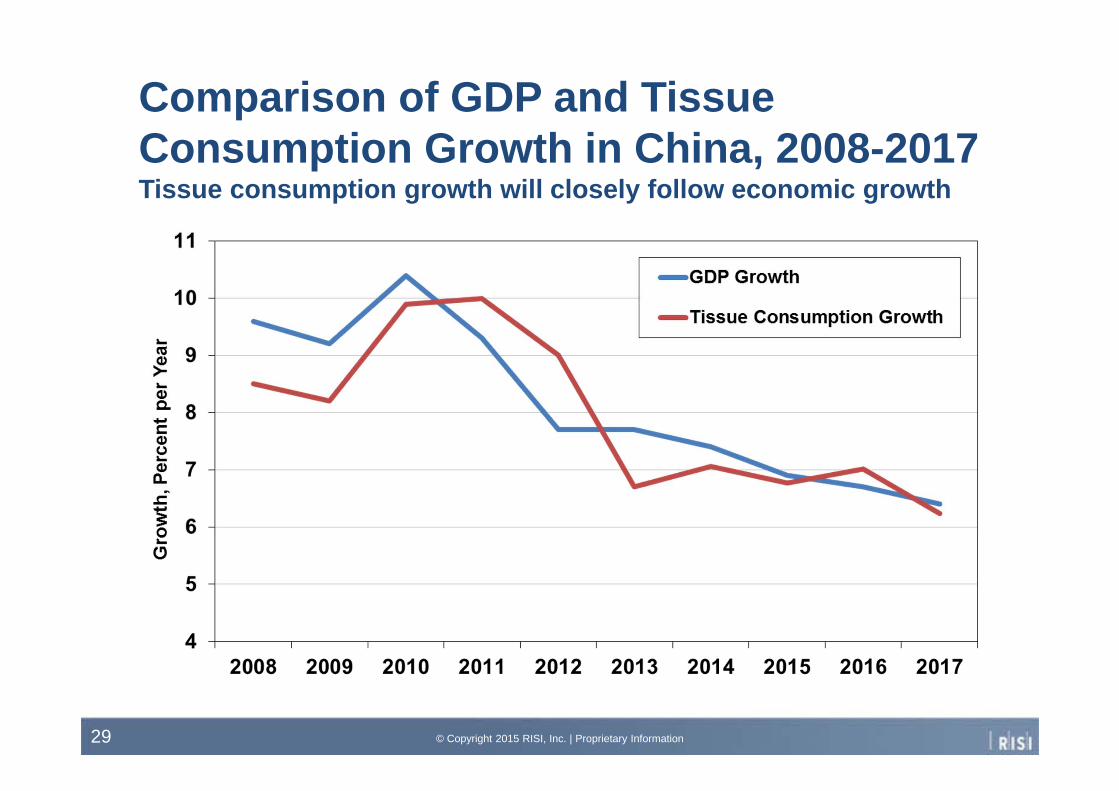
Comparison of GDP and Tissue Consumption Growth in China, 2008-2017Tissue consumption growth will closely follow economic growth
© Copyright 2015 RISI, Inc. | Proprietary Information29

Expected Growth Rates of Asian Tissue Consumption, 2014-2017 Strong growth in major markets with Japan, South Korea and Taiwan being exceptions, India to gradually take off, China slowing
0
2
4
6
8
10
Gro
wth
Rat
e, P
erce
nt p
er Y
ear
© Copyright 2015 RISI, Inc. | Proprietary Information30
Average Growth: 5.4% per year

© Copyright 2015 RISI, Inc. | Proprietary Information31
Chinese Investments Exploding, but Closures and Project Delays Expected There is a real investment peak with too much capacity being built, but currently also a wave of capacity closures in the industry
-1,000-750-500-250
0250500750
1,0001,2501,5001,7502,000
2012 2013 2014 2015 2016 2017Thou
sand
Ton
nes
per Y
ear
Effective Capacity Change*
New ProjectsClosuresNet Capacity Change
* PM start-up/learning curves considered

© Copyright 2015 RISI, Inc. | Proprietary Information32
Net Capacity Change* and Average Capacity Utilization in the Asian Tissue IndustryOvercapacity is obvious, although project delays may help
70
75
80
85
90
95
100
0
500
1,000
1,500
2,000
2,500
Cap
acity
Util
izat
ion,
Per
cent
Thou
sand
Ton
nes
Capacity Change
Capacity Utilization
*Based on committed projects only, learning curves considered

EUROPEAN OUTLOOK
© Copyright 2015 RISI, Inc. | Proprietary Information33

© Copyright 2015 RISI, Inc. | Proprietary Information34
Main European Tissue Markets, 2014The four largest markets account for exactly half of European tissue consumption
Germany17% UK
13%
France10%
Italy10%Iberian Peninsula
10%Russia7%
Nordic Countries6%
Benelux5%
Poland5%
Greece2%
All Others15%
Total Market Size: 8.3 Million Tonnes

Eastern European Importance Increasing Rapidly in the European Tissue Business
WE88%
Other EE9%
Russia3%
2000
WE78%
Other EE
15%
Russia7%
2014e
© Copyright 2015 RISI, Inc. | Proprietary Information35
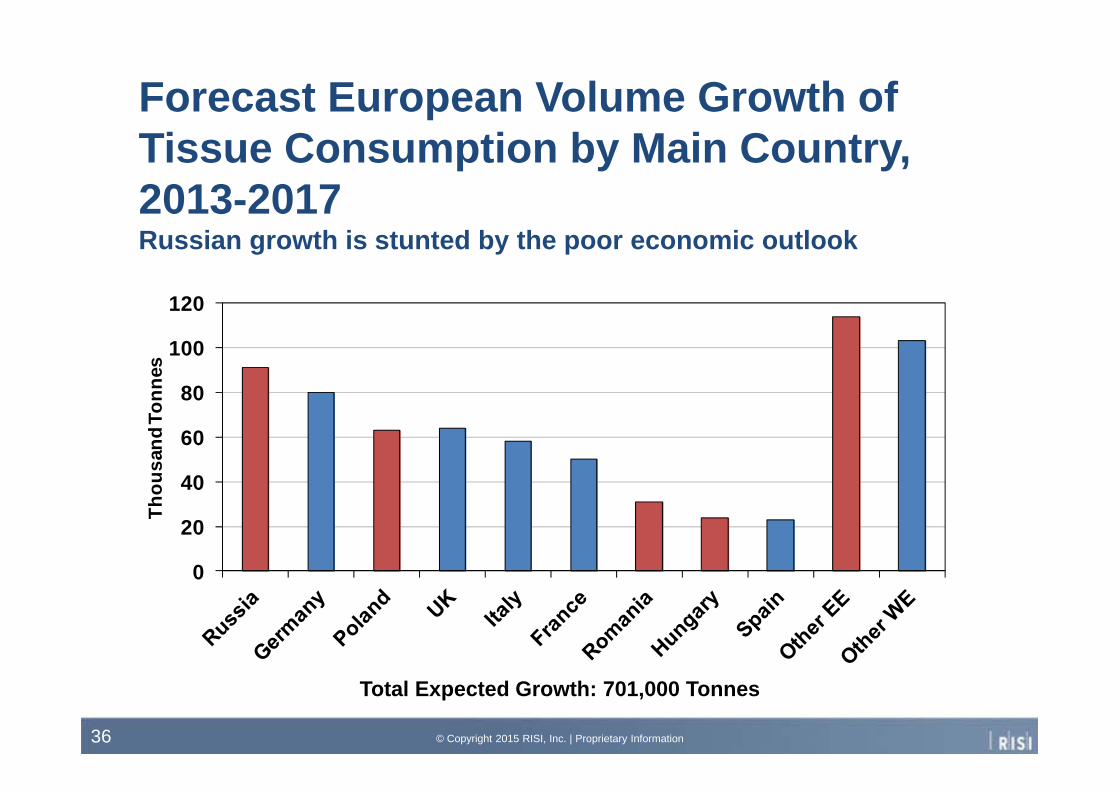
Forecast European Volume Growth of Tissue Consumption by Main Country, 2013-2017Russian growth is stunted by the poor economic outlook
0
20
40
60
80
100
120
Thou
sand
Ton
nes
© Copyright 2015 RISI, Inc. | Proprietary Information36
Total Expected Growth: 701,000 Tonnes

Tissue Trade Balance in Western Europe by Country, 2014 vs. 2004 (+ Net Exports, - Net Imports) The UK is the by far largest regional tissue net importer, followed by the Benelux, Spain is small net exporter, Portugal small net importer
© Copyright 2015 RISI, Inc.Proprietary Information
37
… a lot of characteristics remain similar …
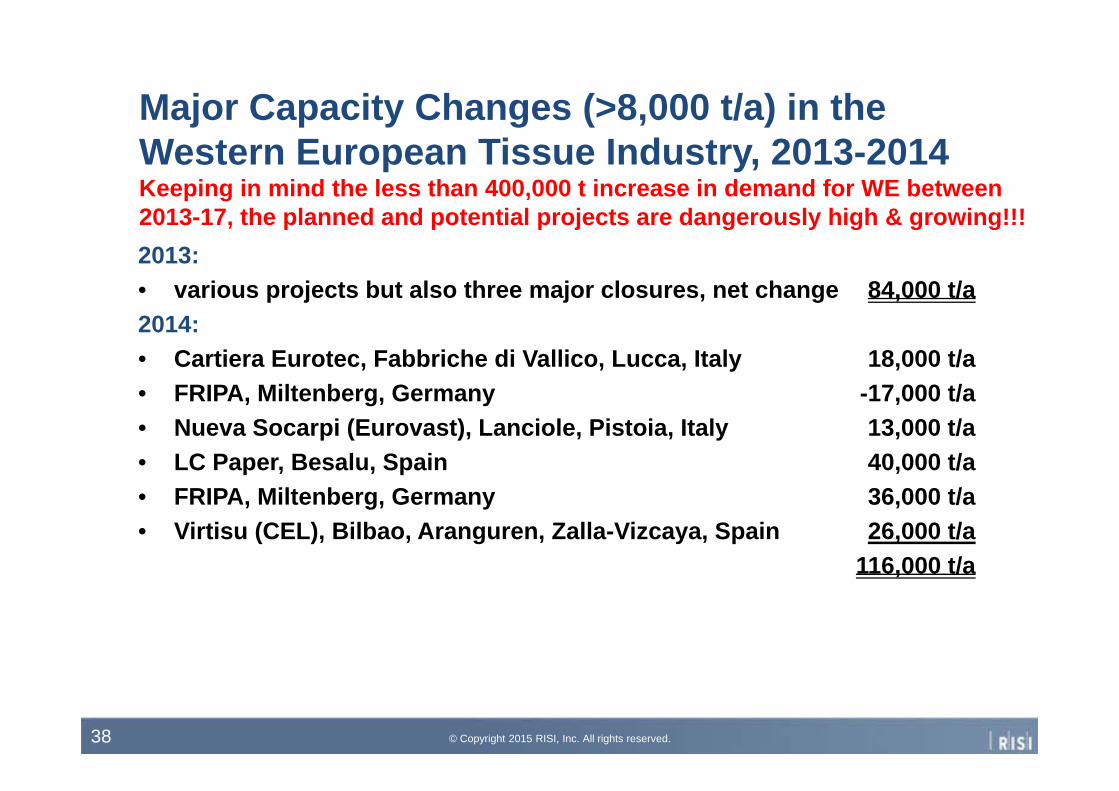
Major Capacity Changes (>8,000 t/a) in the Western European Tissue Industry, 2013-2014Keeping in mind the less than 400,000 t increase in demand for WE between 2013-17, the planned and potential projects are dangerously high & growing!!!2013:• various projects but also three major closures, net change 84,000 t/a2014:• Cartiera Eurotec, Fabbriche di Vallico, Lucca, Italy 18,000 t/a• FRIPA, Miltenberg, Germany -17,000 t/a• Nueva Socarpi (Eurovast), Lanciole, Pistoia, Italy 13,000 t/a• LC Paper, Besalu, Spain 40,000 t/a• FRIPA, Miltenberg, Germany 36,000 t/a• Virtisu (CEL), Bilbao, Aranguren, Zalla-Vizcaya, Spain 26,000 t/a
116,000 t/a
© Copyright 2015 RISI, Inc. All rights reserved.38
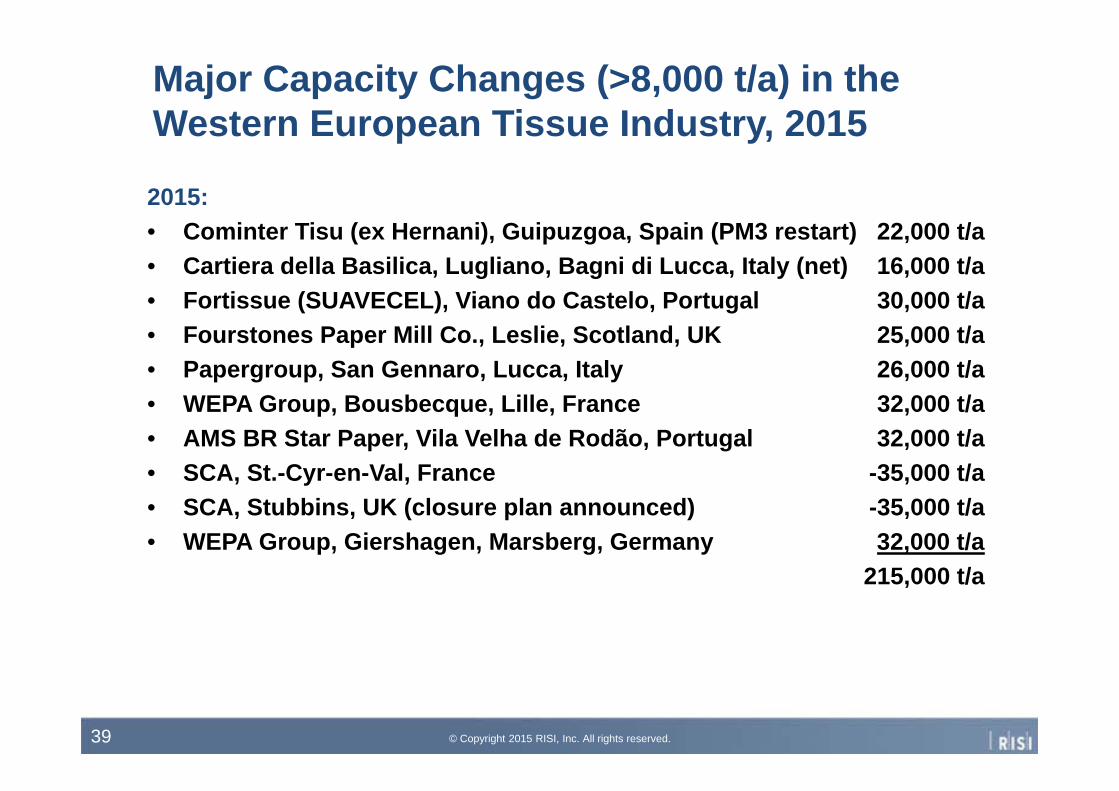
Major Capacity Changes (>8,000 t/a) in the Western European Tissue Industry, 2015
2015:• Cominter Tisu (ex Hernani), Guipuzgoa, Spain (PM3 restart) 22,000 t/a• Cartiera della Basilica, Lugliano, Bagni di Lucca, Italy (net) 16,000 t/a• Fortissue (SUAVECEL), Viano do Castelo, Portugal 30,000 t/a• Fourstones Paper Mill Co., Leslie, Scotland, UK 25,000 t/a• Papergroup, San Gennaro, Lucca, Italy 26,000 t/a• WEPA Group, Bousbecque, Lille, France 32,000 t/a• AMS BR Star Paper, Vila Velha de Rodão, Portugal 32,000 t/a• SCA, St.-Cyr-en-Val, France -35,000 t/a• SCA, Stubbins, UK (closure plan announced) -35,000 t/a• WEPA Group, Giershagen, Marsberg, Germany 32,000 t/a
215,000 t/a
© Copyright 2015 RISI, Inc. All rights reserved.39
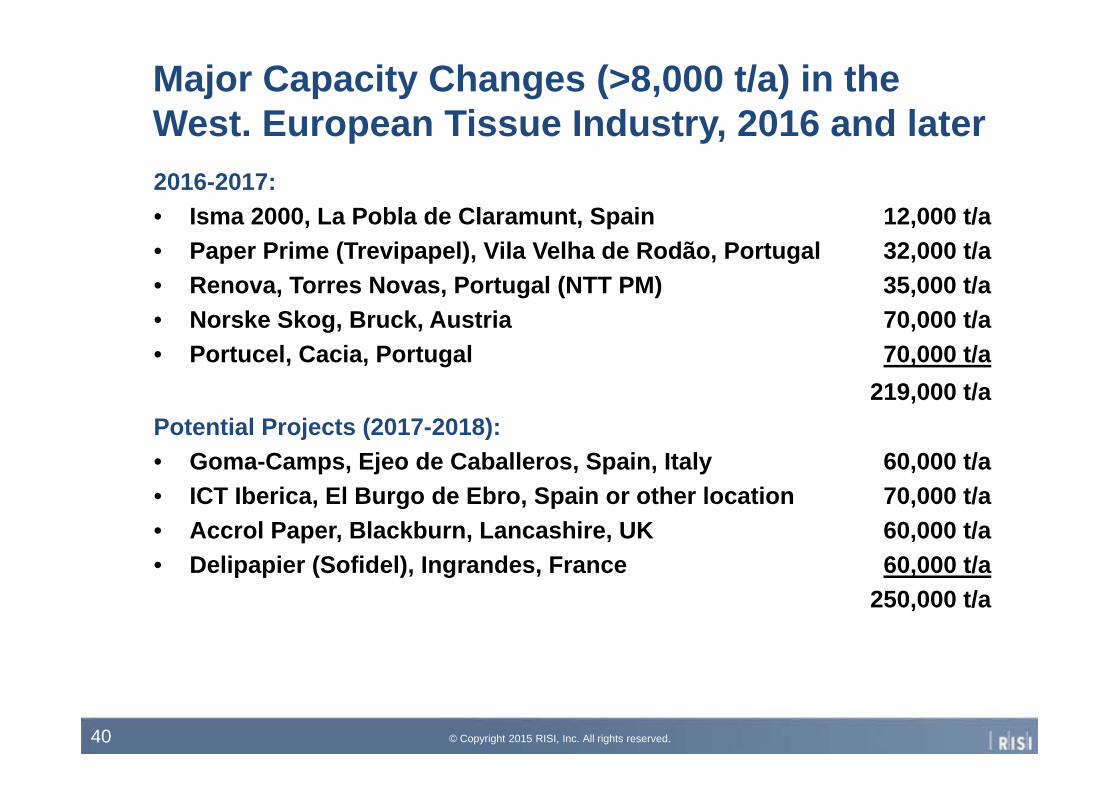
Major Capacity Changes (>8,000 t/a) in the West. European Tissue Industry, 2016 and later2016-2017:• Isma 2000, La Pobla de Claramunt, Spain 12,000 t/a• Paper Prime (Trevipapel), Vila Velha de Rodão, Portugal 32,000 t/a• Renova, Torres Novas, Portugal (NTT PM) 35,000 t/a • Norske Skog, Bruck, Austria 70,000 t/a• Portucel, Cacia, Portugal 70,000 t/a
219,000 t/aPotential Projects (2017-2018):• Goma-Camps, Ejeo de Caballeros, Spain, Italy 60,000 t/a• ICT Iberica, El Burgo de Ebro, Spain or other location 70,000 t/a• Accrol Paper, Blackburn, Lancashire, UK 60,000 t/a• Delipapier (Sofidel), Ingrandes, France 60,000 t/a
250,000 t/a
© Copyright 2015 RISI, Inc. All rights reserved.40
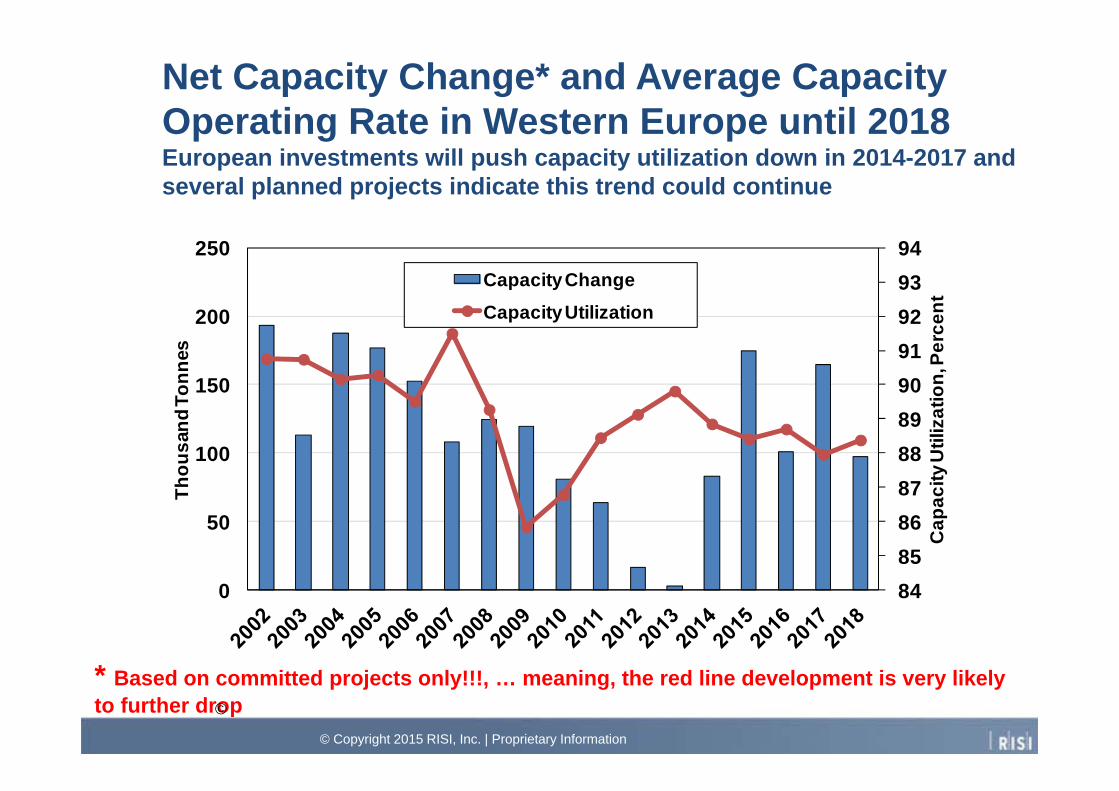
Net Capacity Change* and Average Capacity Operating Rate in Western Europe until 2018European investments will push capacity utilization down in 2014-2017 and several planned projects indicate this trend could continue
8485868788899091929394
0
50
100
150
200
250
Cap
acity
Util
izat
ion,
Per
cent
Thou
sand
Ton
nes
Capacity ChangeCapacity Utilization
©41* Based on committed projects only!!!, … meaning, the red line development is very likely to further drop©
© Copyright 2015 RISI, Inc. | Proprietary Information

Major Capacity Changes (>8,000 t/a) in the Eastern European Tissue Industry, 2014-20152014:• Hanke Tissue, Kostrzyn, Poland 15,000 t/a• Petrocart, Piatra Neamt, Romania -10,000 t/a• Petrocart, Piatra Neamt, Romania 25,000 t/a• SCA, Sovetsk, Tula, Russia 60,000 t/a• Paperka, Muniks, Smolevichi, Belarus 14,000 t/a• Syktyvkar Tissue Group, Semibratovo, Russia 30,000 t/a• Fabryka Papieru Kaczory, Margonin, Poland 21,000 t/a• Hayat Kimya Group, Alabuga, Tatarstan, Russia 70,000 t/a
225,000 t/a2015:• AB Grigiskes, Traku, Vilnius, Lithuania (new PM + closures) 21,000 t/a• Fabryka Papieru i Textury Beskidy, Wadovice, Poland 17,000 t/a• LLC Pulp Invest, Kazan, Tatarstan, Russia 27,000 t/a• Claire's, Nikopol,Bulgaria 16,000 t/a• Syassky, Syasstroy, Russia -20,000 t/a• SC Metalicplas Impex, Dej, Romania 30,000 t/a• ICT Poland, Kostrzyn, Poland 70,000 t/a
161,000 t/a© Copyright 2015 RISI, Inc. All rights reserved.42

Major Capacity Changes (>8,000 t/a) in the European Tissue Industry, 2016-2017
2016-2017:• Firma W. Lewandovski, Wloclawek, Poland 20,000 t/a• Firma W. Lewandovski, Wloclawek, Poland -15,000 t/a• Wolma/Paper Recycling, Russia 21,000 t/a• Syassky, Syasstroy, Russia 38,000 t/a• Arkhbum Tissue Group (APPM), Vorsino, Russia 70,000 t/a
134,000 t/a
In addition, there is a number of potential projects still under consideration
© Copyright 2015 RISI, Inc. All rights reserved.43
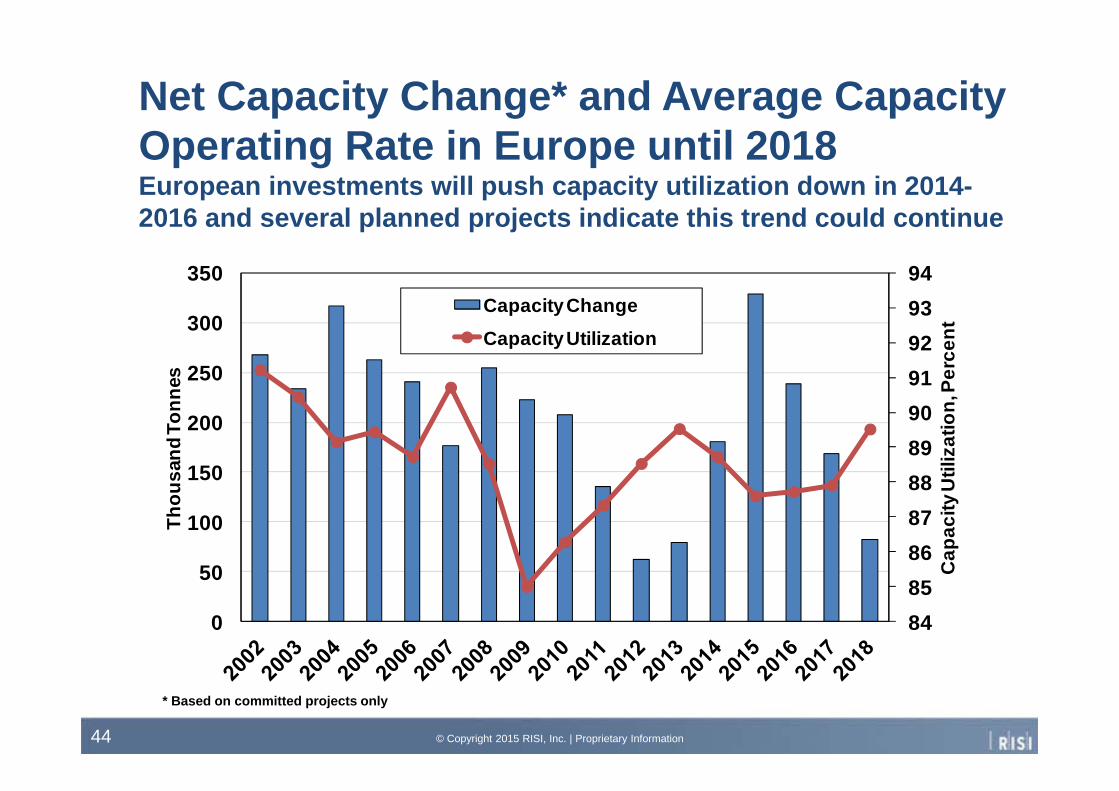
Net Capacity Change* and Average Capacity Operating Rate in Europe until 2018European investments will push capacity utilization down in 2014-2016 and several planned projects indicate this trend could continue
8485868788899091929394
0
50
100
150
200
250
300
350
Cap
acity
Util
izat
ion,
Per
cent
Thou
sand
Ton
nes
Capacity ChangeCapacity Utilization
© Copyright 2015 RISI, Inc. | Proprietary Information44
* Based on committed projects only
SUMMARY OF GLOBAL OUTLOOK
© Copyright 2015 RISI, Inc. | Proprietary Information45

Anticipated Growth in the Global Tissue MarketTissue consumption is expected to benefit from improving global economic growth
© Copyright 2015 RISI, Inc. | Proprietary Information46
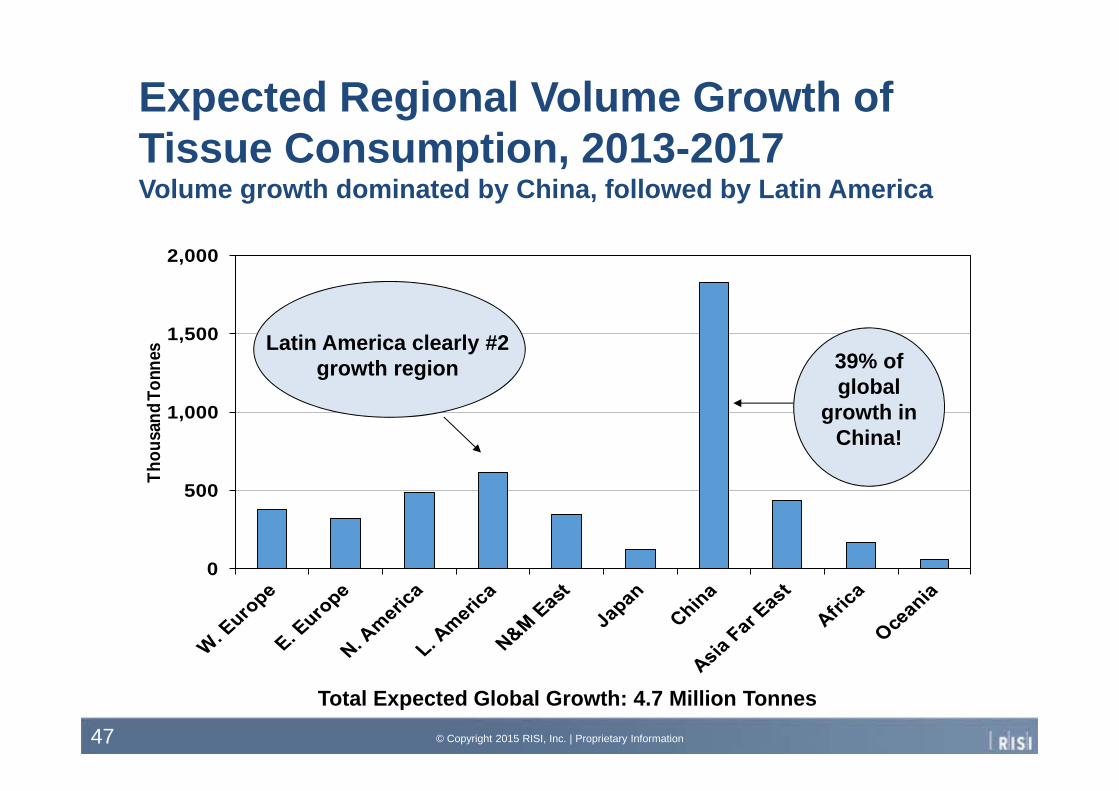
Expected Regional Volume Growth of Tissue Consumption, 2013-2017Volume growth dominated by China, followed by Latin America
0
500
1,000
1,500
2,000
Thou
sand
Ton
nes Latin America clearly #2
growth region 39% of global
growth in China!
Total Expected Global Growth: 4.7 Million Tonnes © Copyright 2015 RISI, Inc. | Proprietary Information47
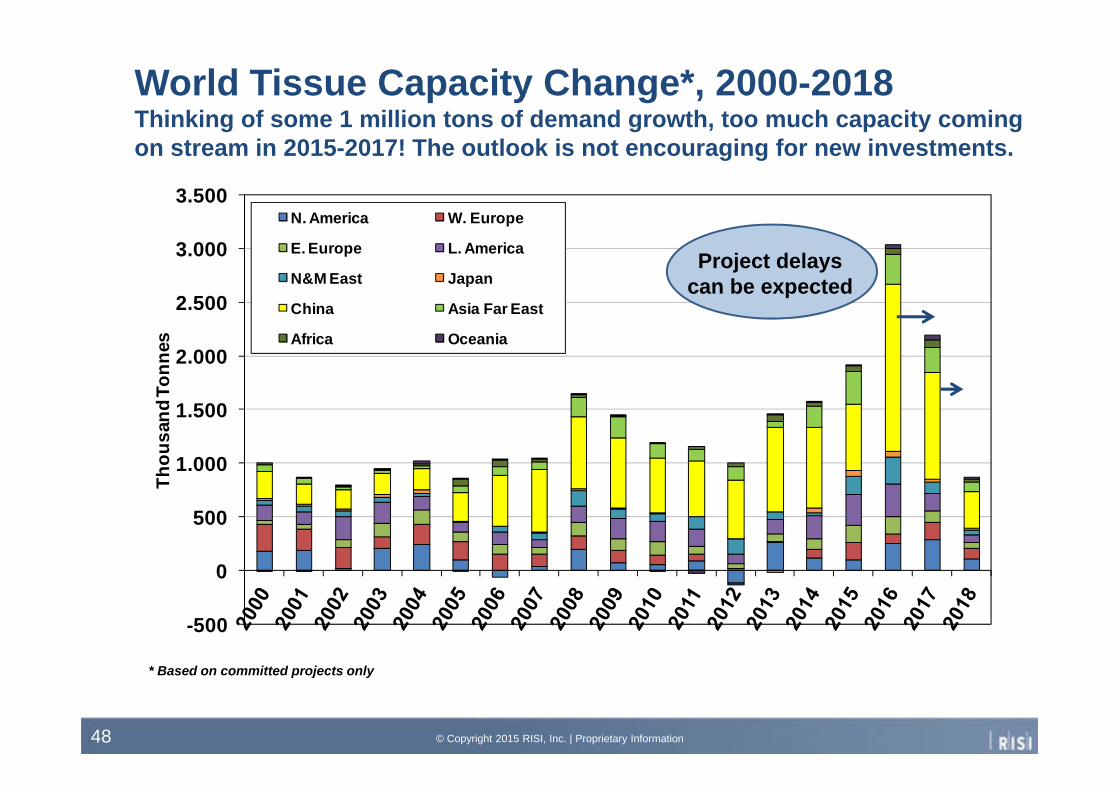
World Tissue Capacity Change*, 2000-2018Thinking of some 1 million tons of demand growth, too much capacity coming on stream in 2015-2017! The outlook is not encouraging for new investments.
-500
0
500
1.000
1.500
2.000
2.500
3.000
3.500Th
ousa
nd T
onne
s
N. America W. Europe
E. Europe L. America
N&M East Japan
China Asia Far East
Africa Oceania
© Copyright 2015 RISI, Inc. | Proprietary Information48
* Based on committed projects only
Project delays can be expected

Net Capacity Change* and Average Capacity Utilization in the Global Tissue IndustryMajor capacity closures could improve outlook, but only marginally. Global overcapacity is the name of the game!
76
78
80
82
84
86
88
90
92
0
500
1.000
1.500
2.000
2.500
3.000
3.500
Cap
acity
Util
izat
ion,
Per
cent
Thou
sand
Ton
nes
Capacity Change Capacity Utilization
© Copyright 2015 RISI, Inc. | Proprietary Information49
* Based on committed projects only
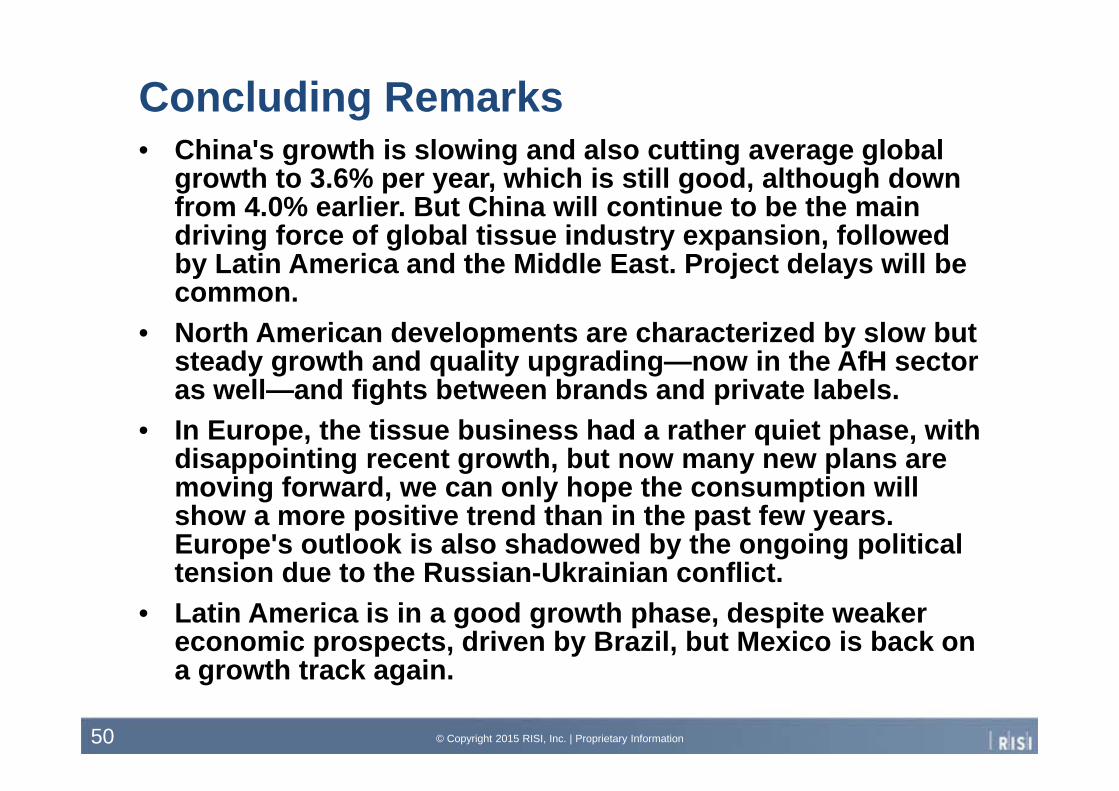
Concluding Remarks• China's growth is slowing and also cutting average global
growth to 3.6% per year, which is still good, although down from 4.0% earlier. But China will continue to be the main driving force of global tissue industry expansion, followed by Latin America and the Middle East. Project delays will be common.
• North American developments are characterized by slow but steady growth and quality upgrading—now in the AfH sector as well—and fights between brands and private labels.
• In Europe, the tissue business had a rather quiet phase, with disappointing recent growth, but now many new plans are moving forward, we can only hope the consumption will show a more positive trend than in the past few years. Europe's outlook is also shadowed by the ongoing political tension due to the Russian-Ukrainian conflict.
• Latin America is in a good growth phase, despite weaker economic prospects, driven by Brazil, but Mexico is back on a growth track again.
© Copyright 2015 RISI, Inc. | Proprietary Information50
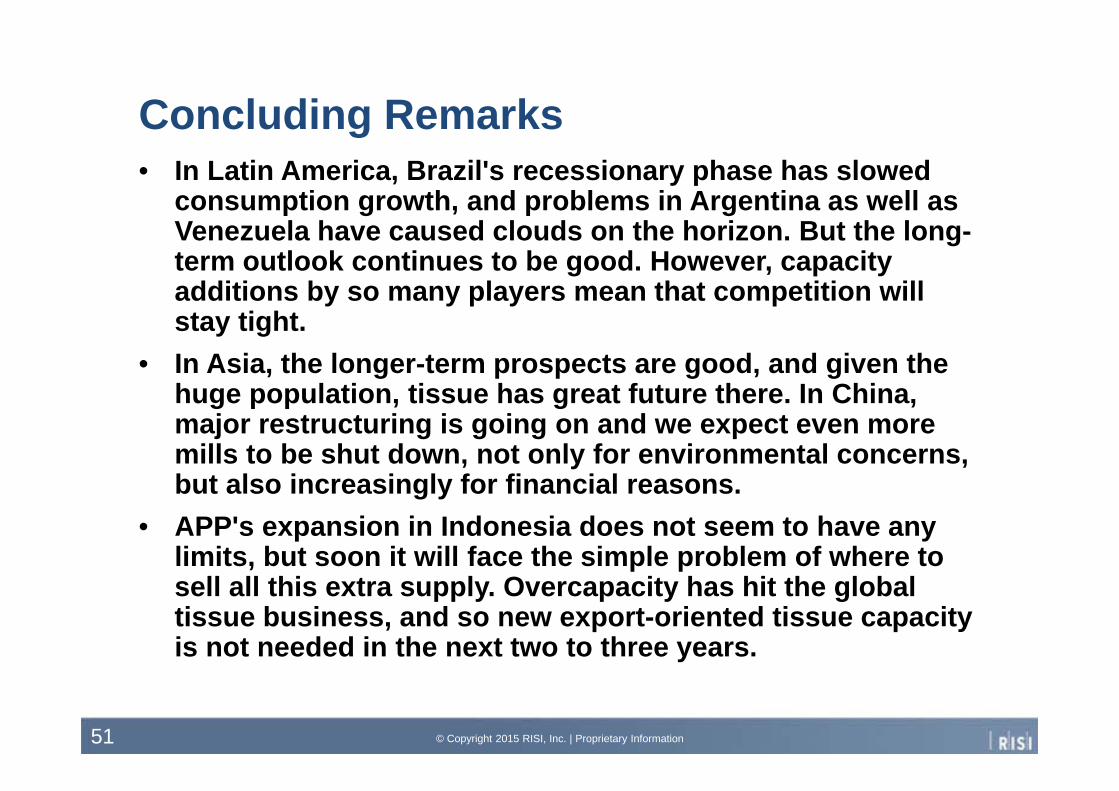
• In Latin America, Brazil's recessionary phase has slowed consumption growth, and problems in Argentina as well as Venezuela have caused clouds on the horizon. But the long-term outlook continues to be good. However, capacity additions by so many players mean that competition will stay tight.
• In Asia, the longer-term prospects are good, and given the huge population, tissue has great future there. In China, major restructuring is going on and we expect even more mills to be shut down, not only for environmental concerns, but also increasingly for financial reasons.
• APP's expansion in Indonesia does not seem to have any limits, but soon it will face the simple problem of where to sell all this extra supply. Overcapacity has hit the global tissue business, and so new export-oriented tissue capacity is not needed in the next two to three years.
© Copyright 2015 RISI, Inc. | Proprietary Information51
Concluding Remarks
World Tissue Business Monitorwww.risi.com/wtbm
Thank you for your attention!For more information:
© Copyright 2015 RISI, Inc. | Proprietary Information52
Outlook for World Tissue Businesswww.risi.com/owtb
Special Study Recently Published:Exploding Chinese Tissue Business – Opportunities and Challengeswww.risi.com/chinatissue
US Tissue Monthly Datawww.risi.com/ustm