Global Tax Review 2 0 - GSMA · Deloitte refers to one or more of Deloitte Touche Tohmatsu Limited...
75
Global Mobile Tax Review 2011
-
Upload
truonglien -
Category
Documents
-
view
214 -
download
0
Transcript of Global Tax Review 2 0 - GSMA · Deloitte refers to one or more of Deloitte Touche Tohmatsu Limited...

Global Mobile Tax Review 2011

Deloitte refers to one or more of Deloitte Touche Tohmatsu Limited (“DTTL”), a UK private company limited by guarantee,
and its network of member firms, each of which is a legally separate and independent entity. Please see
www.deloitte.co.uk/about for a detailed description of the legal structure of DTTL and its member firms. Deloitte LLP is a
limited liability partnership registered in England and Wales with registered number OC303675 and its registered office at 2
New Street Square, London, EC4A 3BZ, United Kingdom. Deloitte LLP is the United Kingdom member firm of DTTL.
© 2011 Deloitte LLP

Global Mobile Tax Review 2011
© 2011 Deloitte LLP.
Contents
Important notice from Deloitte ......................................................................................... 4
Executive summary ............................................................................................................ 5
1 Introduction ........................................................................................................ 16
1.1 Background ................................................................................................................................... 16
1.2 Methodology and scope of the study ........................................................................................ 17
1.3 This report ..................................................................................................................................... 19
2 Tax and the cost of mobile ownership ............................................................ 21
3 Tax and the cost of mobile usage ..................................................................... 28
4 Taxes on handsets .............................................................................................. 31
5 Mobile specific taxes on consumers ................................................................ 34
6 Other taxes and charges paid by MNOs ......................................................... 39
6.1 Corporate taxes ............................................................................................................................. 39
6.2 Regulatory charges....................................................................................................................... 40
7 Regional analysis ................................................................................................ 42
7.1 Europe ............................................................................................................................................ 45
7.2 Central and Eastern Europe ........................................................................................................ 47
7.3 Africa .............................................................................................................................................. 49
7.4 Maghreb and Middle East ........................................................................................................... 53
7.5 Asia and Pacific ............................................................................................................................ 55
7.6 Latin America ............................................................................................................................... 56
8 Conclusions and implications .......................................................................... 59
Appendix A Methodology and assumptions ......................................................... 61
A.1 Methodology ................................................................................................................................. 61
A.2 Data Sources and Assumptions.................................................................................................. 64
Appendix B Country ranking ................................................................................... 68
Appendix C Mobile specific charges applying to MNOs ..................................... 71

Global Mobile Tax Review 2011
© 2011 Deloitte LLP. 4
Important notice from Deloitte
This report (the “Report”) has been prepared by Deloitte LLP (“Deloitte”) for the GSM Association in accordance with
the contract with them dated 1 July 2011 (“the Contract”) and on the basis of the scope and limitations set out below.
The Report has been prepared solely for the purposes of assessing global mobile-specific taxation rates across a panel of
111 countries, in order to support the GSMA and its members in representations to public bodies and industry
stakeholders (domestic and international), as set out in the Contract. It should not be used for any other purpose or in
any other context, and Deloitte accepts no responsibility for its use in either regard.
The Report is provided exclusively for the GSM Association’s use under the terms of the Contract. No party other than
the GSM Association is entitled to rely on the Report for any purpose whatsoever and Deloitte accepts no responsibility
or liability to any party other than the GSM Association in respect of the Report and/or any of its contents.
As set out in the Contract, the scope of our work has been limited by the time, information and explanations made
available to us. The information contained in the Report has been obtained from the GSMA, its members and third party
sources that are clearly referenced in the appropriate sections of the Report. Deloitte has neither sought to corroborate
this information nor to review its overall reasonableness. Further, any results from the analysis contained in the Report
are reliant on the information available at the time of writing the Report and should not be relied upon in subsequent
periods.
Accordingly, no representation or warranty, express or implied, is given and no responsibility or liability is or will be
accepted by or on behalf of Deloitte or by any of its partners, employees or agents or any other person as to the accuracy,
completeness or correctness of the information contained in this document or any oral information made available and
any such liability is expressly disclaimed.
All copyright and other proprietary rights in the Report remain the property of Deloitte LLP and any rights not expressly
granted in these terms or in the Contract are reserved.
This Report and its contents do not constitute financial or other professional advice, and specific advice should be sought
about your specific circumstances. In particular, the Report does not constitute a recommendation or endorsement by
Deloitte to invest or participate in, exit, or otherwise use any of the markets or companies referred to in it. To the fullest
extent possible, both Deloitte and the GSM Association disclaim any liability arising out of the use (or non-use) of the
Report and its contents, including any action or decision taken as a result of such use (or non-use).

Global Mobile Tax Review 2011
© 2011 Deloitte LLP. 5
Executive summary
Previous work by Deloitte and the GSMA has highlighted the wide international variation in taxation levied
on consumers’ usage and access to mobile telephony. This tax base includes differences in taxation regimes
across countries and regions of the world and countries which tax mobile telephony over and above other
goods and services. Such mobile specific taxation has been linked to the adoption of mobile telephony in
developing countries.
In line with the 2007 study carried out by Deloitte and the GSMA, this study calculates how much of a
consumer’s Total Cost of Mobile Ownership
(“TCMO”, consisting of handset,
connection, rental and usage costs), Total
Cost of Mobile Usage (“TCMU”, consisting
of rental and usage) and of Total Cost of
Handsets is made up of taxes.
To do so, consumption profiles, prices and
taxes were analysed in 111 countries in
Europe, Central and Eastern Europe, Africa, Latin America and Asia for pre-pay and post-pay mobile users.
Taxes that typically apply to mobile telephony are Values Added Tax / General Sale Taxes on all
components, custom excises and luxury
taxes on imported handsets, as well as
host of mobile-specific taxes ranging from
airtime excises applying to usage, to fixed
contributions on connection, handsets,
and rental. These taxes discriminate
mobile telephony against other services,
and contribute to reduce access to mobile
services as well as service consumption.
“Taxation as a proportion of the total cost of mobile ownership has
increased since 2007.”
As shown in Figure 1 overleaf, the analysis of taxation as a proportion of TCMO indicates that this has
increased since 2007, up to 18.14% from 17.44%.
TCMO
Handset Connection Rental Calls SMS
Handset Cost TaxConnection
CostTax Rental Cost Tax
Call Usage Price
TaxSMS Usage
PriceTax
VAT( $)
Customs Duty
VAT( $) VAT( $) VAT( $)
Telecoms Specific Tax
Telecoms Specific Tax
Telecoms Specific Tax
Telecoms Specific Tax
Telecoms Specific Tax
VAT( $)
Total TaxesVAT ($), Customs Duty, Telecoms Specific Tax
Total Taxes as a proportion of service costs
Service cost without tax

Global Mobile Tax Review 2011
© 2011 Deloitte LLP. 6
Figure 1 Tax as a proportion of TCMO
Source: Deloitte Analysis
The top five countries that exhibit the highest taxation as a proportion of mobile ownership include Turkey,
Gabon, Pakistan, Greece and the Democratic Republic of Congo (“DRC”) and in each of these countries
48.23%37.20%
31.61%30.44%
29.14%28.33%28.17%27.93%27.80%27.68%
26.23%25.15%25.00%25.00%25.00%25.00%
24.47%24.38%
23.82%23.40%23.29%23.00%
22.49%22.01%22.00%
21.21%21.00%21.00%21.00%21.00%21.00%20.68%20.53%20.37%20.21%20.18%20.04%20.00%20.00%20.00%20.00%20.00%20.00%20.00%20.00%
19.60%19.19%19.07%19.00%19.00%19.00%19.00%18.90%18.89%18.76%18.75%18.74%18.59%18.41%18.14%18.00%18.00%18.00%18.00%17.84%17.58%
17.00%17.00%16.97%16.96%
16.15%16.01%15.95%15.73%15.54%
15.00%15.00%15.00%15.00%15.00%15.00%15.00%
14.00%14.00%
13.37%12.77%12.50%12.43%12.42%12.40%12.26%12.00%11.80%
10.67%10.35%10.29%10.26%10.22%10.10%10.00%10.00%10.00%10.00%10.00%10.00%
8.00%7.10%
6.20%6.02%5.95%
5.40%3.30%
0% 10% 20% 30% 40% 50%
TurkeyGabon
PakistanGreece
Dem Rep. CongoMadagascar
UgandaCroatia
TanzaniaDominican Republic
ZambiaBrazil
SwedenNorway
DenmarkHungaryRwanda
ItalySierra Leone
JordanNiger
FinlandArgentina
GhanaPoland
SenegalPortugal
IrelandBelgium
LithuaniaLatvia
UzbekistanKenya
CameroonBangladesh
Congo BMorocco
United KingdomAustria
UkraineSloveniaEstonia
Czech RepublicBulgariaAlbaniaFrance
PeruChile
The NetherlandsGermanySlovakiaRomania
Cote d'IvoireAzerbaijan
Russian FederationGeorgiaGuinea
ChadNepal
AverageTunisia
SpainSerbiaMalta
Burkina FasoMozambique
AlgeriaMontenegro
MalawiEthiopia
ColombiaMexico
MalaysiaTrinidad and Tobago
MauritaniaNew Zealand
ZimbabweMauritius
Egypt Arab Rep.Nicaragua
LuxembourgCyprus
SwazilandSouth Africa
BoliviaEcuadorSamoa
PhilippinesGuatemala
Venezuela RBSri Lanka
KazakhstanGambia The
Syrian Arab RepublicIndia
Lao PDRCambodiaIndonesiaParaguayAustralia
BotswanaAngola
VietnamPapua New Guinea
BhutanSwitzerland
ThailandIran Islamic Rep.
YemenLesothoNigeriaChina

Global Mobile Tax Review 2011
© 2011 Deloitte LLP. 7
mobile specific taxation exists. Figure 2 illustrates how the taxation suffered by consumers is divided
between the different components of mobile telephony ownership.
Figure 2 Tax as proportion of TCMO, top five countries in the ranking
Source: Deloitte analysis
“More countries have increased taxation as a proportion of mobile
ownership costs than they have reduced it.”
As shown in Figure 3 and Figure 4, 56 countries in the sample have shown an increase in mobile taxation
relative to 2007 while only 42 countries have shown reductions in tax as a proportion of TCMO. Countries
where taxation has increased include the top five countries showing the highest proportion of tax on TCMO.
0% 5% 10% 15% 20% 25% 30% 35% 40% 45% 50%
Turkey
Gabon
Pakistan
Greece
Dem Rep. Congo
Usage
Handset
Connection
Rental

Global Mobile Tax Review 2011
© 2011 Deloitte LLP. 8
Figure 3 Countries where tax as a proportion of TCMO has increased since the 2007 study
Source: Deloitte analysis
48%
37%
32%
30%
29%
28%
28%
25%
25%
25%
24%
24%
24%
23%
23%
22%
22%
21%
21%
21%
21%
21%
20%
20%
20%
20%
20%
20%
20%
20%
20%
19%
19%
19%
19%
19%
19%
19%
18%
18%
18%
17%
16%
16%
15%
15%
15%
15%
15%
14%
12%
12%
11%
10%
10%
10%
45%
19%
15%
26%
21%
18%
26%
25%
25%
20%
21%
22%
10%
19%
22%
17%
22%
21%
21%
18%
18%
20%
19%
18%
20%
20%
18%
19%
20%
19%
20%
19%
19%
16%
19%
19%
19%
18%
18%
16%
18%
16%
5%
14%
15%
14%
15%
15%
15%
1%
12%
12%
6%
10%
10%
4%
0% 5% 10% 15% 20% 25% 30% 35% 40% 45% 50%
Turkey
Gabon
Pakistan
Greece
Dem Rep. Congo
Madagascar
Dominican Republic
Sweden
Denmark
Hungary
Rwanda
Italy
Sierra Leone
Jordan
Finland
Ghana
Poland
Portugal
Ireland
Lithuania
Latvia
Uzbekistan
Bangladesh
United Kingdom
Austria
Slovenia
Estonia
Czech Republic
Bulgaria
Albania
France
Peru
The Netherlands
Germany
Slovakia
Romania
Cote d'Ivoire
Russian Federation
Tunisia
Spain
Malta
Ethiopia
Malaysia
Mauritania
Mauritius
Egypt Arab Rep.
Nicaragua
Luxembourg
Cyprus
Swaziland
Philippines
Guatemala
Syrian Arab Republic
Paraguay
Papua New Guinea
Bhutan
2011 2007

Global Mobile Tax Review 2011
© 2011 Deloitte LLP. 9
Figure 4 Countries where tax as a proportion of TCMO has decreased since the 2007 study
Source: Deloitte analysis
28%
28%
26%
25%
22%
21%
21%
20%
20%
20%
19%
19%
19%
19%
19%
18%
18%
18%
16%
16%
16%
15%
14%
13%
13%
13%
12%
12%
12%
12%
10%
10%
10%
10%
10%
10%
7%
6%
6%
6%
5%
3%
29%
29%
26%
28%
25%
21%
25%
22%
20%
27%
19%
19%
19%
19%
21%
23%
19%
23%
20%
16%
17%
22%
14%
14%
26%
14%
15%
15%
15%
20%
12%
11%
13%
11%
11%
11%
17%
11%
10%
6%
6%
5%
0% 5% 10% 15% 20% 25% 30% 35%
Uganda
Tanzania
Zambia
Brazil
Argentina
Senegal
Kenya
Cameroon
Morocco
Ukraine
Chile
Azerbaijan
Georgia
Guinea
Chad
Nepal
Burkina Faso
Mozambique
Colombia
Mexico
Trinidad and Tobago
Zimbabwe
South Africa
Bolivia
Ecuador
Samoa
Venezuela RB
Sri Lanka
Kazakhstan
Gambia The
India
Lao PDR
Cambodia
Indonesia
Botswana
Vietnam
Thailand
Iran Islamic Rep.
Yemen
Lesotho
Nigeria
China
2011 2007

Global Mobile Tax Review 2011
© 2011 Deloitte LLP. 10
“Countries imposing mobile specific taxes on usage have increased
significantly, especially in Africa.”
Consumers now pay on average 17.97% of their mobile usage cost as tax, an increase from 16.91% in 2007.
A key driver of this result has been that 21 countries out of the 111 in the study now impose a special tax
on usage, as shown in Figure 5.
Taxes on the cost of usage can represent a barrier to development of services as they act to reduce usage by
consumers. This is particularly the case in developing countries, where lower income levels mean that
taxation of usage may impact upon the adoption of mobile by consumers.
12 of the countries imposing special taxes on usage are African, while in 2007 only six African countries
levied such tax. Since the 2007 study, DRC, Gabon, Madagascar and Sierra Leone Rwanda and Senegal
have introduced airtime excises.
Figure 5 Countries that impose an airtime excise
Source: Deloitte analysis
18.00%
18.00%
19.50%
19.00%
18.00%
23.00%
18.00%
16.00%
18.00%
20.00%
16.00%
16.00%
15.00%
16.00%
18.00%
18.00%
19.00%
15.00%
0.00%
13.00%
10.00%
25.00%
18.00%
11.50%
12.00%
12.00%
6.00%
10.00%
12.00%
10.00%
7.00%
10.00%
10.00%
10.00%
8.00%
5.00%
5.00%
3.00%
6.00%
20.00%
5.00%
6.00%
0% 10% 20% 30% 40% 50%
TurkeyGabon
PakistanGreece
UgandaCroatia
TanzaniaDominican Republic
Dem Rep. CongoMadagascar
KenyaZambia
Sierra LeoneJordan
SenegalRwanda
NigerGhana
Sri LankaNepal
Malaysia
VAT
Airtime Excise

Global Mobile Tax Review 2011
© 2011 Deloitte LLP. 11
“Tax represents over a third of the cost of a handset in 20 countries.”
Tax as a proportion of handset costs is much higher than tax on total mobile ownership or usage costs,
standing at an average level of 23.29%, and in 11 countries in the sample tax represents over 40% of handset
costs.
This high share of tax on handset costs is due to custom duties on imported handsets, which are imposed 50
countries in the panel, and to a number of other handset specific taxes imposed in 11 countries. These
include luxury taxes in countries where handsets are still treated as luxury goods, such as Gabon where
mobile handsets incur a special $5 fixed tax. Other countries such as Zambia, Pakistan and Bangladesh apply
a special tax on handset acquisition.
Figure 6 Countries where tax as a proportion of handset costs is above global average
Source: Deloitte analysis
“Mobile specific taxes disproportionately impacting mobile services are now
imposed in 28 countries.”

Global Mobile Tax Review 2011
© 2011 Deloitte LLP. 12
Mobile specific taxes discriminate mobile telephony against fixed telephony and other services, are often
regressive in nature and may reduce both access to services and usage.
When considering mobile specific taxes as well as customs duties on imported handsets, in total 63
countries charge a form of taxation on mobile handsets above standard taxation and of these, 24 are African.
The level of such mobile specific taxation is illustrated in Figure 71. Turkey, Gabon and Pakistan have the
highest proportion of TCMO accounted for by taxation. There are a significant number of African countries
that impose such mobile service specific taxation and, of the top 20 countries in which mobile-specific tax as
a proportion of TCMO is highest, ten are African.
Figure 7 Mobile specific taxation, excluding VAT
Source: Deloitte analysis
1 This analysis is obtained by removing VAT and other sales taxes, such that only mobile specific taxation and custom
duties on imported handsets are considered.
29.34%
19.08%
15.35%
12.26%
11.68%
11.51%
11.12%
10.23%
10.14%
9.79%
8.80%
8.38%
8.30%
7.40%
6.99%
6.43%
5.95%
5.41%
5.09%
5.00%
4.77%
4.69%
4.63%
4.22%
3.75%
2.27%
1.94%
1.78%
1.44%
1.23%
1.08%
1.02%
0.88%
0.88%
0.76%
0.74%
0.71%
0.71%
0.66%
0.66%
0.66%
0.58%
0.58%
0.57%
0.53%
0.51%
0.46%
0.43%
0.42%
0.40%
0.39%
0.37%
0.29%
0.26%
0.22%
0.19%
0.15%
0.15%
0.10%
0.10%
0.07%
0.04%
0.02%
0.01%
0% 5% 10% 15% 20% 25% 30%
Turkey
Gabon
Pakistan
Sri Lanka
Dominican Republic
Greece
Dem Rep. Congo
Zambia
Uganda
Tanzania
Sierra Leone
Kenya
Madagascar
Jordan
Ghana
Rwanda
Malaysia
Nepal
Croatia
Egypt Arab Rep.
Bangladesh
Iran Islamic Rep.
Senegal
Niger
Italy
Average
Ethiopia
Gambia The
Argentina
Congo B
Cameroon
Yemen
Cote d'Ivoire
Azerbaijan
Ecuador
Georgia
Trinidad and Tobago
Guinea
Uzbekistan
Syrian Arab Republic
Russian Federation
Chad
Mozambique
Burkina Faso
Mauritania
Lesotho
Malawi
Philippines
Guatemala
Venezuela RB
Nigeria
Bolivia
Lao PDR
Cambodia
Indonesia
Peru
Colombia
Brazil
Thailand
Paraguay
Chile
Morocco
India
Mexico
Global Mobile Tax Review 2011
© 2011 Deloitte LLP. 13
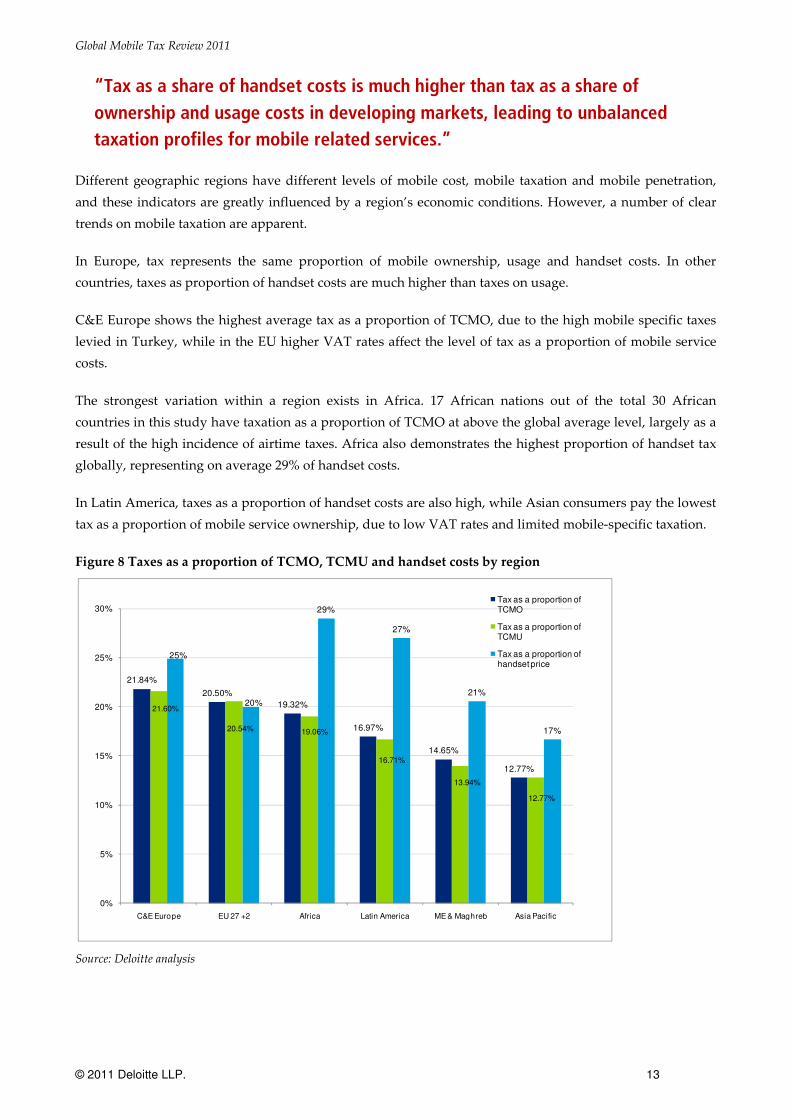
“Tax as a share of handset costs is much higher than tax as a share of
ownership and usage costs in developing markets, leading to unbalanced
taxation profiles for mobile related services.”
Different geographic regions have different levels of mobile cost, mobile taxation and mobile penetration,
and these indicators are greatly influenced by a region’s economic conditions. However, a number of clear
trends on mobile taxation are apparent.
In Europe, tax represents the same proportion of mobile ownership, usage and handset costs. In other
countries, taxes as proportion of handset costs are much higher than taxes on usage.
C&E Europe shows the highest average tax as a proportion of TCMO, due to the high mobile specific taxes
levied in Turkey, while in the EU higher VAT rates affect the level of tax as a proportion of mobile service
costs.
The strongest variation within a region exists in Africa. 17 African nations out of the total 30 African
countries in this study have taxation as a proportion of TCMO at above the global average level, largely as a
result of the high incidence of airtime taxes. Africa also demonstrates the highest proportion of handset tax
globally, representing on average 29% of handset costs.
In Latin America, taxes as a proportion of handset costs are also high, while Asian consumers pay the lowest
tax as a proportion of mobile service ownership, due to low VAT rates and limited mobile-specific taxation.
Figure 8 Taxes as a proportion of TCMO, TCMU and handset costs by region
Source: Deloitte analysis
21.84%
20.50%
19.32%
16.97%
14.65%
12.77%
21.60%
20.54% 19.06%
16.71%
13.94%
12.77%
25%
20%
29%
27%
21%
17%
0%
5%
10%
15%
20%
25%
30%
C&E Europe EU 27 +2 Africa Latin America ME & Maghreb Asia Pacific
Tax as a proportion of TCMO
Tax as a proportion of TCMU
Tax as a proportion of handset price
Global Mobile Tax Review 2011
© 2011 Deloitte LLP. 14
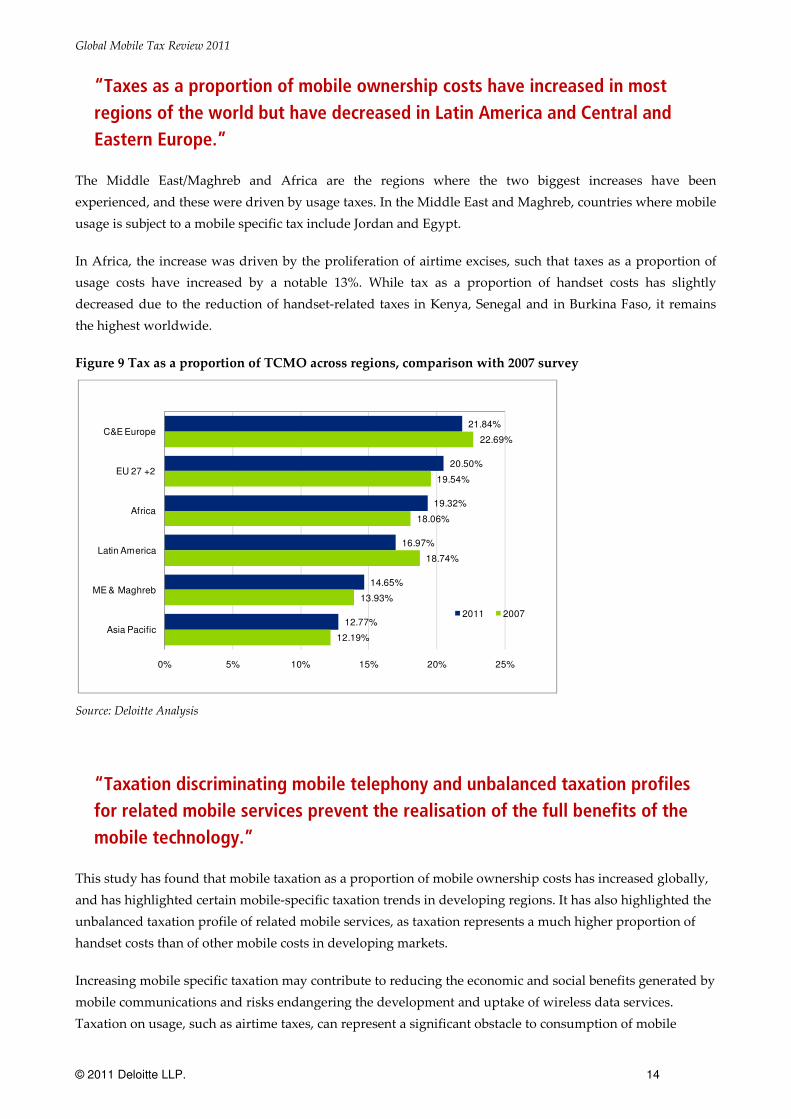
“Taxes as a proportion of mobile ownership costs have increased in most
regions of the world but have decreased in Latin America and Central and
Eastern Europe.”
The Middle East/Maghreb and Africa are the regions where the two biggest increases have been
experienced, and these were driven by usage taxes. In the Middle East and Maghreb, countries where mobile
usage is subject to a mobile specific tax include Jordan and Egypt.
In Africa, the increase was driven by the proliferation of airtime excises, such that taxes as a proportion of
usage costs have increased by a notable 13%. While tax as a proportion of handset costs has slightly
decreased due to the reduction of handset-related taxes in Kenya, Senegal and in Burkina Faso, it remains
the highest worldwide.
Figure 9 Tax as a proportion of TCMO across regions, comparison with 2007 survey
Source: Deloitte Analysis
“Taxation discriminating mobile telephony and unbalanced taxation profiles
for related mobile services prevent the realisation of the full benefits of the
mobile technology.”
This study has found that mobile taxation as a proportion of mobile ownership costs has increased globally,
and has highlighted certain mobile-specific taxation trends in developing regions. It has also highlighted the
unbalanced taxation profile of related mobile services, as taxation represents a much higher proportion of
handset costs than of other mobile costs in developing markets.
Increasing mobile specific taxation may contribute to reducing the economic and social benefits generated by
mobile communications and risks endangering the development and uptake of wireless data services.
Taxation on usage, such as airtime taxes, can represent a significant obstacle to consumption of mobile
21.84%
20.50%
19.32%
16.97%
14.65%
12.77%
22.69%
19.54%
18.06%
18.74%
13.93%
12.19%
0% 5% 10% 15% 20% 25%
C&E Europe
EU 27 +2
Africa
Latin America
ME & Maghreb
Asia Pacific
2011 2007

Global Mobile Tax Review 2011
© 2011 Deloitte LLP. 15
services by the poorer sectors of the population while taxes on handsets increase the access barriers to
mobile services, and may lead to underconsumption of wireless data. Unbalanced taxation profiles for
related services may also give inefficient buying incentives to consumers, and further limit access to mobile
services.
Conversely, removing mobile-specific taxation and imposing a balanced taxation profile for mobile related
services provides more efficient incentives to consumers for their consumption choices, and can enhance the
evolution from basic mobile consumption, such as access and usage, to more advanced services driven by
the potential of wireless data and internet through mobile devices.
Governments, particularly in developing countries, could consider focussing their taxation strategies to
increase economic development rather than adopt policies that may create barriers to more people owning
and using a mobile phone.
Global Mobile Tax Review 2011
© 2011 Deloitte LLP. 16
1 Introduction
This paper was commissioned by the GSM Association (“the GSMA”) and follows two previous studies on
taxation on mobile services undertaken by the GSMA.
In 2005, the GSMA developed its first study on tax and the Digital Divide2, seeking to understand more fully
the tax rates affecting telecommunications in developing countries and the impact that cutting taxes may
have on mobile handsets and new services. The study’s key findings showed that telecommunication taxes
were disproportionately high in many developing countries and that even small cuts in taxes many attract
significantly more mobile users.
In 2007, the analysis was extended to include a larger set of countries – in particular adding the transitional
Eastern European countries3. The link between lower taxes and revenue opportunities for governments in
the long term was also investigated, showing that cutting taxes may lead to increased economic growth in
the least developed countries.
This third report reviews mobile telecommunication taxes paid by consumers in 2010/11 in an increased
number of jurisdictions in Europe, Africa, Asia, Middle East, Latin America and in the Pacific region.
This report is part of a wider Deloitte/GSMA study on global mobile taxation trends4.
1.1 Background
Mobile telecommunications have become paramount to a country’s economic and social development, and
have had a profound effect on people’s lives and on the global economies. The scale of technology and of the
industry has made mobile phones affordable worldwide, and currently mobile connections stand at over 5.5
billion.
A significant wave of investment is now under way from MNOs worldwide to bring affordable mobile data
services and internet connectivity to consumers. Wireless broadband is seen a key factor to bridge the Digital
Dividend. In developed markets, governments are looking at mobile broadband networks to increase fast
internet penetration, especially in rural areas. In developing markets, widespread internet access has been
identified as a key issue for growth in education and businesses and the reduced presence of fixed networks
makes wireless broadband a crucial component of internet penetration and development.
In developing countries, wireless broadband will be crucial for economic development. Based on an analysis
of 120 countries, the World Bank has indicated that for every 10% increase in the penetration of broadband
services, there is an increase in economic growth of 1.3%5. Additional research indicated countries with 80%
2 GSMA, “Tax and the Digital Divide - How new approaches to mobile taxation can connect the unconnected”, 2005.
3 GSMA/Deloitte, “Global Mobile Tax Review 2006/7”, 2007.
4 Separate Deloitte/GSMA reports on the Surcharge on International Inbound Termination in Africa and on mobile telephony and taxation in Kenya, Croatia and Bangladesh will be published in parallel to this report.
5 World Bank, Qiang, 2009.

Global Mobile Tax Review 2011
© 2011 Deloitte LLP. 17
broadband penetration are more than twice as innovative as countries with 40% penetration, and that
increasing broadband penetration by 10% translates into a 1.5% increase in a country’s labour productivity6.
However, a number of high barriers still act to constrain penetration, which in numerous African and Asian
countries remains low, generating concerns for the uptake of wireless broadband. Low penetration and low
usage prevent the realisation of the full benefits of mobile telephony. Low wireless broadband uptake may
act as a barrier to economic development and foreign direct investment, especially in countries with low
internet penetration.
1.2 Methodology and scope of the study
This study describes consumer taxation globally, and focuses on special mobile-specific taxes on access, e.g.
handset, and usage, e.g. airtime, that contribute to reduce penetration and consumption of mobile services.
As such, the objective of this study is to measure the taxes paid by consumers as a proportion of ownership
and usage costs of mobile services.
In line with the methodology developed for the 2007 study7, consumer taxes on mobile services have been
measured as a proportion of the Total Cost of Mobile Ownership (“TCMO”) and the Total Cost of Mobile
Usage (“TCMU”) in a panel of 111 countries worldwide, identified in Table 1.
Table 1 Countries included in the study
Sub Saharan Africa Maghreb and
Middle East
Latin
America Asia Pacific
Central
Eastern Europe EU27 (+2)
Angola
Botswana
Burkina Faso
Cameroon
Chad
Congo B.
Cote d'Ivoire
Dem. Rep. Of
Congo
Ethiopia
Gabon
Gambia
Ghana
Guinea
Kenya
Lesotho
Madagascar
Malawi
Mauritius
Niger
Nigeria
Rwanda
Senegal
Sierra
Leone
South
Africa
Swaziland
Tanzania
Uganda
Zambia
Zimbabwe
Algeria
Egypt
Iran
Jordan
Mauritania
Morocco
Syria
Tunisia
Yemen
Argentina
Bolivia
Brazil
Chile
Colombia
Dominican
Republic
Ecuador
Guatemala
Mexico
Nicaragua
Paraguay
Peru
Trinidad and
Tobago
Venezuela
Australia
Bangladesh
Bhutan
Cambodia
China
India
Indonesia
Lao PDR
Malaysia
Nepal
New Zealand
Pakistan
Papua New
Guinea
Philippines
Samoa
Sri Lanka
Thailand
Vietnam
Albania
Azerbaijan
Croatia
Georgia
Kazakhstan
Montenegro
Russian
Federation
Serbia
Turkey
Ukraine
Uzbekistan
Austria
Belgium
Bulgaria
Cyprus
Czech
Republic
Denmark
Estonia
Finland
France
Germany
Greece
Hungary
Ireland
Italy
Latvia
Lithuania
Luxembourg
Malta
Portugal
Romania
Slovakia
Slovenia
Spain
Sweden
Netherlands
United
Kingdom
Norway*
Switzerland*
6 Booz & Company, Enabling Sustainable Digital Highways; Strategies for Next‐Generation Broadband.
7 GSMA/Deloitte, “Global Mobile Tax Review 2006/7”, 2007.

Global Mobile Tax Review 2011
© 2011 Deloitte LLP. 18
Sub Saharan Africa Maghreb and
Middle East
Latin
America Asia Pacific
Central
Eastern Europe EU27 (+2)
Mozambique Poland
* Norway and Switzerland are included in the same group as the other EU27 countries due to market and geographic similarities
Source: Deloitte analysis
The TCMO is a useful concept to measure the total cost to an average consumer of owning and using a
mobile phone as it considers all the typical components that mobile consumers require. These components
include handset costs, connection costs8, rental costs (typically for post-pay services) and call and SMS usage
costs9. The TCMU focuses on service usage and does not include handset and connection costs.
Each of the cost components identified above includes the actual component price as well taxes paid by
consumers. Typical consumer taxes that apply to mobile services include:
• Value Added Tax (“VAT”) or General Sales Tax (“GST”): these are consumer taxes incurred when
purchasing every component of owning and using a mobile phone. These taxes are ‘ad valorem’ and
are often expressed as a proportion of the value of the good or service. Mobile services sometimes
attract higher VAT, e.g. in Pakistan the VAT rate for telecoms is 3.5% higher than VAT on other
goods.
• Custom duty and excise taxes on imported goods. In mobile telephony, users in developing
countries typically pay import taxes on handsets and other mobile devices. These can either be
expressed as a proportion of the handset value or as a fixed sum or both. These also typically apply
to imports of SIM cards, which are paid for by MNOs and sold as part of the initial connection
service.
• Special taxes on handsets, which in certain countries are still treated as luxury items and often attract
high custom duty rates and other special contributions, e.g. in Gabon mobile handsets are subject to
a 30% custom duty and a $5 fixed fee.
• Special communication taxes on mobile usage: a number of countries still impose specific taxes on
consumers for using mobile services. For example, airtime excise apply in a number of African
countries, impacting calls and SMS usage in addition to VAT.
• Other telecoms specific taxes, such as SIM activation taxes or other taxes on connection, e.g. in
Bangladesh and Turkey, and monthly contributions for post-pay customers.
• Other special taxes, for example a tax on mobile operators’ gross revenues in Croatia, introduced in
response to the financial crisis, and a health insurance tax levied on mobile services in Ghana.
Data on average retail handset, connection, rental, call and SMS costs for both pre-pay and post-pay
customers was collected to calculate TCMO and TCMU in each of the countries in the panel. Data on the
8 Handset and connection costs are amortised over an appropriate period of time.
9 TCMO should also include internet data usage, in particular in developed markets. However we were not able to
obtain sufficient data on internet usage and prices.

Global Mobile Tax Review 2011
© 2011 Deloitte LLP. 19
level of taxes that apply to each of the consumer’s mobile consumption bundle was also collected with the
help of the MNOs and of the Deloitte Global Network
The tax incurred on each mobile component was then calculated by extrapolating the tax value based on a
research on tax rates. TCMO, TCMU and taxes as a proportion of service costs were calculated. Figure 10
illustrates the approach to calculate total taxes incurred by consumers as a proportion of TCMO and TCMU.
The methodology is described in greater detail in Appendix A to this paper.
Figure 10 Methodology applied
Source: Deloitte analysis
1.3 This report
This report presents the results of the updated analysis on global mobile-specific taxation, by calculating the
proportion of taxes paid by consumers when acquiring mobile services in a panel of 111 countries
worldwide and is structured as follows:
• Section 2 to 4 present the global results on taxation and TCMO, TCMU and handset costs
respectively.
• Section 5 discusses mobile specific-taxation.
• Section 6 discusses taxation issues affecting MNOs worldwide.
• Section 7 describes in more detail how mobile taxes vary globally by geographic region.
• Section 8 presents the conclusions and implications of this work.
The appendices at the end of this report provide:
• More detail on the methodology and assumptions employed in this study and on the data sources
used.
TCMO
Handset Connection Rental Calls SMS
Handset Cost TaxConnection
CostTax Rental Cost Tax
Call Usage Price
TaxSMS Usage
PriceTax
VAT( $)
Customs Duty
VAT( $) VAT( $) VAT( $)
Telecoms Specific Tax
Telecoms Specific Tax
Telecoms Specific Tax
Telecoms Specific Tax
Telecoms Specific Tax
VAT( $)
Total TaxesVAT ($), Customs Duty, Telecoms Specific Tax
Total Taxes as a proportion of service costs
Service cost without tax

Global Mobile Tax Review 2011
© 2011 Deloitte LLP. 20
• Country rankings for tax as a proportion of proportion of TCMO.
• Examples of regulatory charges and other accounting practices applying to MNOs in a selected
number of countries.
Global Mobile Tax Review 2011
© 2011 Deloitte LLP. 21
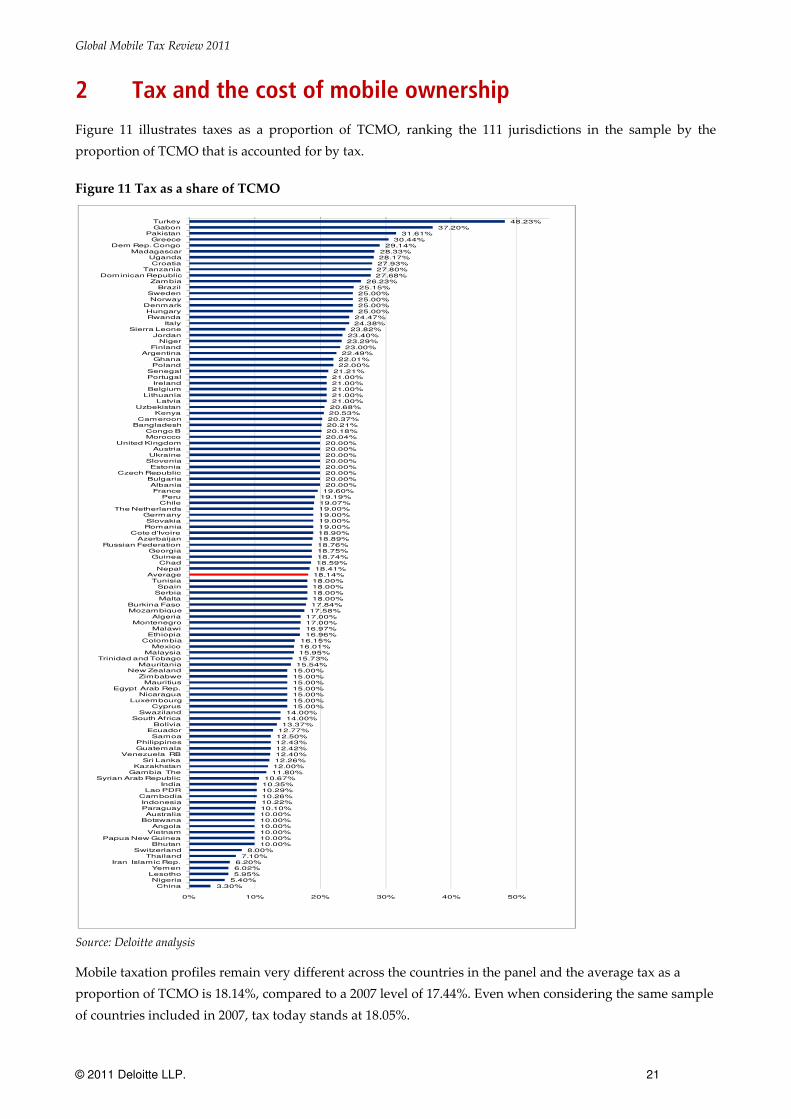
2 Tax and the cost of mobile ownership
Figure 11 illustrates taxes as a proportion of TCMO, ranking the 111 jurisdictions in the sample by the
proportion of TCMO that is accounted for by tax.
Figure 11 Tax as a share of TCMO
Source: Deloitte analysis
Mobile taxation profiles remain very different across the countries in the panel and the average tax as a
proportion of TCMO is 18.14%, compared to a 2007 level of 17.44%. Even when considering the same sample
of countries included in 2007, tax today stands at 18.05%.
48.23%37.20%
31.61%30.44%
29.14%28.33%28.17%27.93%27.80%27.68%
26.23%25.15%25.00%25.00%25.00%25.00%
24.47%24.38%
23.82%23.40%23.29%23.00%
22.49%22.01%22.00%
21.21%21.00%21.00%21.00%21.00%21.00%20.68%20.53%20.37%20.21%20.18%20.04%20.00%20.00%20.00%20.00%20.00%20.00%20.00%20.00%
19.60%19.19%19.07%19.00%19.00%19.00%19.00%18.90%18.89%18.76%18.75%18.74%18.59%18.41%18.14%18.00%18.00%18.00%18.00%17.84%17.58%
17.00%17.00%16.97%16.96%
16.15%16.01%15.95%15.73%15.54%
15.00%15.00%15.00%15.00%15.00%15.00%15.00%
14.00%14.00%
13.37%12.77%12.50%12.43%12.42%12.40%12.26%12.00%11.80%
10.67%10.35%10.29%10.26%10.22%10.10%10.00%10.00%10.00%10.00%10.00%10.00%
8.00%7.10%
6.20%6.02%5.95%
5.40%3.30%
0% 10% 20% 30% 40% 50%
TurkeyGabon
PakistanGreece
Dem Rep. CongoMadagascar
UgandaCroatia
TanzaniaDominican Republic
ZambiaBrazil
SwedenNorway
DenmarkHungaryRwanda
ItalySierra Leone
JordanNiger
FinlandArgentina
GhanaPoland
SenegalPortugal
IrelandBelgium
LithuaniaLatvia
UzbekistanKenya
CameroonBangladesh
Congo BMorocco
United KingdomAustria
UkraineSloveniaEstonia
Czech RepublicBulgariaAlbaniaFrance
PeruChile
The NetherlandsGermanySlovakiaRomania
Cote d'IvoireAzerbaijan
Russian FederationGeorgiaGuinea
ChadNepal
AverageTunisia
SpainSerbiaMalta
Burkina FasoMozambique
AlgeriaMontenegro
MalawiEthiopia
ColombiaMexico
MalaysiaTrinidad and Tobago
MauritaniaNew Zealand
ZimbabweMauritius
Egypt Arab Rep.Nicaragua
LuxembourgCyprus
SwazilandSouth Africa
BoliviaEcuadorSamoa
PhilippinesGuatemala
Venezuela RBSri Lanka
KazakhstanGambia The
Syrian Arab RepublicIndia
Lao PDRCambodiaIndonesiaParaguayAustralia
BotswanaAngola
VietnamPapua New Guinea
BhutanSwitzerland
ThailandIran Islamic Rep.
YemenLesothoNigeriaChina
Global Mobile Tax Review 2011
© 2011 Deloitte LLP. 22
Turkey remains the highest ranking country with tax as a proportion of TCMO of over 48%, compared to a
44% value in 2007, while Gabon ranks second with tax as a proportion of TCMO of 37%. This is a significant
increase from a value of 19% in 2007. Pakistan ranks third with a tax as a proportion of TCMO of 32%, due to
high fixed and variable taxes on mobile ownership and usage. Of the ten countries with the highest tax as a
proportion of TCMO, five are African nations.
Countries with the lowest taxation as a share of mobile costs are those with low VAT levels and no other tax
such as China, Nigeria and Lesotho. In Lesotho, mobile services attract a lower VAT as the government here
has recognised the social importance of mobile communications.
Telecom specific and special taxes such as airtime excises and special handset taxes remain the main tax
elements in the most heavily taxed countries. Figure 12 below identifies the top five countries that exhibit the
highest taxation on mobile ownership:
• Consumers in Turkey suffer a 20% special consumption tax on handsets in addition to VAT of 18%.
A special communications tax of 25% applies to usage. A fixed communication tax of 34TL applies to
connection in addition to a wireless charge of 13.2TL.
• Gabon imposes an 18% VAT on mobile handsets in addition to a special telecoms tax of $5 per
handset, and a custom duty of 30% on each handset imported into the country. An airtime excise on
usage also applies at a rate of 18%, leading to total taxes of 37%.
• In Pakistan, both handsets and connection suffer a fixed Rs 250 tax. An 11.5% withholding tax
(equivalent to an airtime excise) applies to prepaid calling cards. This has recently increased from
10%. The telecoms sector also suffers a 19.5% VAT rate, which is 3.5% higher than other sectors of
the economy.
• In Greece, a 12% airtime excise applies on usage of calls and SMS in addition to VAT.
• In the DRC, an airtime excise of 10% applies in addition to a custom duty rate on handsets of 26.5%.

Global Mobile Tax Review 2011
© 2011 Deloitte LLP. 23
Figure 12 Tax as proportion of TCMO with breakdown of service components, top five countries in the
ranking
Source: Deloitte analysis
Further disaggregation showing taxes as a proportion of usage, handset connection and rental costs is
provided by Figure 13, which shows for each country in the study how taxes are divided between service
components. This shows, on average, that taxes on usage make up the largest component of total taxes,
followed by handset taxes, taxes on connection and taxes on rental. Taxes on usage and handsets are
discussed in further detail later in the report.
0% 5% 10% 15% 20% 25% 30% 35% 40% 45% 50%
Turkey
Gabon
Pakistan
Greece
Dem Rep. Congo
Usage
Handset
Connection
Rental

Global Mobile Tax Review 2011
© 2011 Deloitte LLP. 24
Figure 13 Tax as proportion of the TCMO by service components
Source: Deloitte analysis
Pre-pay services are taxed slightly less than post pay. On average, tax as a proportion of TCMO for pre pay
services is 18.08% compared to the 18.44% for post pay services. In addition to the same taxes that apply to
pre-pay services, post-pay services are still in some countries subject to further specific taxation. For
0% 5% 10% 15% 20% 25% 30% 35% 40% 45% 50%
Turkey
Gabon
Pakistan
Greece
Dem Rep. Congo
Madagascar
Uganda
Croatia
Tanzania
Dominican Republic
Zambia
Brazil
Sweden
Norway
Denmark
Hungary
Rwanda
Italy
Sierra Leone
Jordan
Niger
Finland
Argentina
Ghana
Poland
Senegal
Portugal
Ireland
Belgium
Lithuania
Latvia
Uzbekistan
Kenya
Cameroon
Bangladesh
Congo B
Morocco
United Kingdom
Austria
Ukraine
Slovenia
Estonia
Czech Republic
Bulgaria
Albania
France
Peru
Chile
The Netherlands
Germany
Slovakia
Romania
Cote d'Ivoire
Azerbaijan
Russian Federation
Georgia
Guinea
Chad
Nepal
Spain
Serbia
Malta
Burkina Faso
Mozambique
Algeria
Montenegro
Malawi
Ethiopia
Colombia
Mexico
Malaysia
Trinidad and Tobago
Mauritania
New Zealand
Zimbabwe
Mauritius
Egypt Arab Rep.
Nicaragua
Luxembourg
Cyprus
Swaziland
South Africa
Bolivia
Ecuador
Samoa
Philippines
Guatemala
Venezuela RB
Sri Lanka
Kazakhstan
Gambia The
Syrian Arab Republic
India
Lao PDR
Cambodia
Indonesia
Paraguay
Australia
Botswana
Angola
Vietnam
Papua New Guinea
Bhutan
Switzerland
Thailand
Iran Islamic Rep.
Yemen
Lesotho
Nigeria
China
Usage
Handset
Connection
Rental

Global Mobile Tax Review 2011
© 2011 Deloitte LLP. 25
example, in Italy a special tax of €5.16 to €12.91 is applied to monthly rental, while in Argentina a special tax
of 12.9% applies.
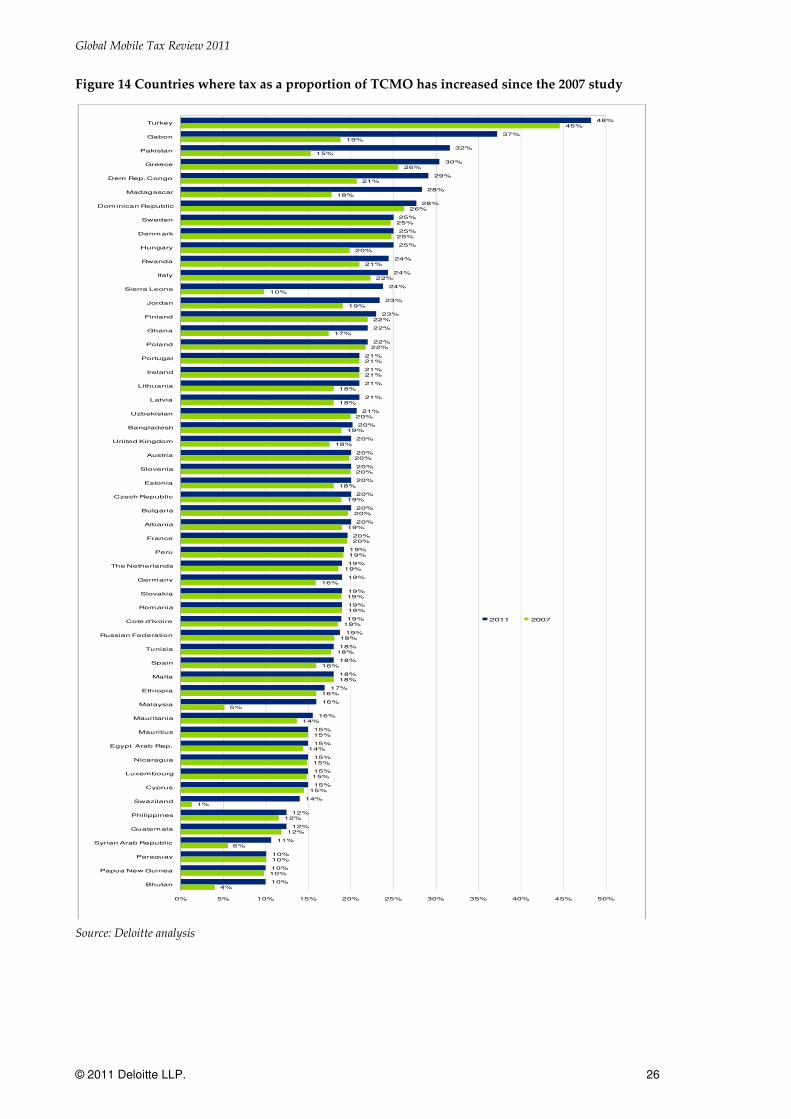
Figure 14 and Figure 15 show the movement in tax as a proportion of TCMO in all countries captured in the
survey in 2007 and in 2011, which is also summarised in Appendix B to this paper.
56 countries in the sample have shown an increase in mobile taxation relative to 2007: these include the top 5
countries with the highest tax as a proportion of TCMO in 2011, i.e. Turkey, Gabon, Pakistan, Greece and
DRC.
At the other end of the spectrum, 42 countries have shown reductions in tax as a proportion of TCMO. In
Latin America, Ecuador shows the biggest reduction: the government has removed a general excise duty of
20% on all service components, such that a 12% custom duty and a 20% VAT apply today. This policy has
reduced the tax as a proportion of TCMO in Ecuador from 26% to 13% from 2007 to 2011.
Global Mobile Tax Review 2011
© 2011 Deloitte LLP. 26
Figure 14 Countries where tax as a proportion of TCMO has increased since the 2007 study
Source: Deloitte analysis
48%
37%
32%
30%
29%
28%
28%
25%
25%
25%
24%
24%
24%
23%
23%
22%
22%
21%
21%
21%
21%
21%
20%
20%
20%
20%
20%
20%
20%
20%
20%
19%
19%
19%
19%
19%
19%
19%
18%
18%
18%
17%
16%
16%
15%
15%
15%
15%
15%
14%
12%
12%
11%
10%
10%
10%
45%
19%
15%
26%
21%
18%
26%
25%
25%
20%
21%
22%
10%
19%
22%
17%
22%
21%
21%
18%
18%
20%
19%
18%
20%
20%
18%
19%
20%
19%
20%
19%
19%
16%
19%
19%
19%
18%
18%
16%
18%
16%
5%
14%
15%
14%
15%
15%
15%
1%
12%
12%
6%
10%
10%
4%
0% 5% 10% 15% 20% 25% 30% 35% 40% 45% 50%
Turkey
Gabon
Pakistan
Greece
Dem Rep. Congo
Madagascar
Dominican Republic
Sweden
Denmark
Hungary
Rwanda
Italy
Sierra Leone
Jordan
Finland
Ghana
Poland
Portugal
Ireland
Lithuania
Latvia
Uzbekistan
Bangladesh
United Kingdom
Austria
Slovenia
Estonia
Czech Republic
Bulgaria
Albania
France
Peru
The Netherlands
Germany
Slovakia
Romania
Cote d'Ivoire
Russian Federation
Tunisia
Spain
Malta
Ethiopia
Malaysia
Mauritania
Mauritius
Egypt Arab Rep.
Nicaragua
Luxembourg
Cyprus
Swaziland
Philippines
Guatemala
Syrian Arab Republic
Paraguay
Papua New Guinea
Bhutan
2011 2007

Global Mobile Tax Review 2011
© 2011 Deloitte LLP. 27
Figure 15 Countries where tax as a proportion of TCMO has decreased since the 2007 study
Source: Deloitte analysis
28%
28%
26%
25%
22%
21%
21%
20%
20%
20%
19%
19%
19%
19%
19%
18%
18%
18%
16%
16%
16%
15%
14%
13%
13%
13%
12%
12%
12%
12%
10%
10%
10%
10%
10%
10%
7%
6%
6%
6%
5%
3%
29%
29%
26%
28%
25%
21%
25%
22%
20%
27%
19%
19%
19%
19%
21%
23%
19%
23%
20%
16%
17%
22%
14%
14%
26%
14%
15%
15%
15%
20%
12%
11%
13%
11%
11%
11%
17%
11%
10%
6%
6%
5%
0% 5% 10% 15% 20% 25% 30% 35%
Uganda
Tanzania
Zambia
Brazil
Argentina
Senegal
Kenya
Cameroon
Morocco
Ukraine
Chile
Azerbaijan
Georgia
Guinea
Chad
Nepal
Burkina Faso
Mozambique
Colombia
Mexico
Trinidad and Tobago
Zimbabwe
South Africa
Bolivia
Ecuador
Samoa
Venezuela RB
Sri Lanka
Kazakhstan
Gambia The
India
Lao PDR
Cambodia
Indonesia
Botswana
Vietnam
Thailand
Iran Islamic Rep.
Yemen
Lesotho
Nigeria
China
2011 2007

Global Mobile Tax Review 2011
© 2011 Deloitte LLP. 28
3 Tax and the cost of mobile usage
The TCMU reflects the cost of using a mobile phone once the “access” investment of purchasing a handset
and a connection have been made, and therefore indicate spend on calls and SMS.
The results of the country-by-country analysis on taxes as a proportion of mobile usage costs are shown in
Figure 16. Consumers now pay on average 17.97% of their mobile usage cost as tax, an increase from 16.91%
in 2007.
Figure 16 Tax as a proportion of TCMU
Source: Deloitte analysis
Taxes on usage typically include VAT and other general sales taxes. However, a number of countries,
especially in Africa, continue to charge an airtime excise that is imposed in addition to VAT. Some
47.61%36.00%
31.00%31.00%
30.00%29.00%
28.00%28.00%28.00%
27.00%26.00%26.00%
25.20%25.00%25.00%25.00%25.00%25.00%25.00%
24.00%23.00%23.00%23.00%
22.00%22.00%21.92%
21.00%21.00%21.00%21.00%21.00%21.00%
20.00%20.00%20.00%20.00%20.00%20.00%20.00%20.00%20.00%20.00%20.00%
19.60%19.25%19.00%19.00%19.00%19.00%19.00%19.00%18.90%
18.00%18.00%18.00%18.00%18.00%18.00%18.00%18.00%18.00%18.00%18.00%18.00%17.97%
17.00%17.00%17.00%
16.50%16.00%16.00%16.00%
15.00%15.00%15.00%15.00%15.00%15.00%15.00%15.00%15.00%15.00%15.00%
14.00%14.00%
13.00%12.50%
12.00%12.00%12.00%12.00%12.00%
10.30%10.00%10.00%10.00%10.00%10.00%10.00%10.00%10.00%10.00%10.00%10.00%10.00%
8.00%7.00%
5.00%5.00%5.00%
3.00%1.50%
0% 5% 10% 15% 20% 25% 30% 35% 40% 45% 50%
TurkeyGabon
GreecePakistanUgandaCroatia
TanzaniaDem Rep. Congo
Dominican RepublicMadagascar
ZambiaKenya
ItalySierra Leone
BrazilSwedenNorway
DenmarkHungary
JordanSenegalRwandaFinland
NigerPoland
ArgentinaGhana
PortugalIreland
BelgiumLithuania
LatviaMorocco
United KingdomAustria
UzbekistanUkraine
SloveniaEstonia
Czech RepublicBulgariaAlbania
Sri LankaFrance
CameroonPeruChile
The NetherlandsGermanySlovakia
RomaniaCongo B
GuineaCote d'Ivoire
ChadBurkina Faso
TunisiaSpain
SerbiaRussian Federation
MaltaGeorgia
AzerbaijanNepal
AverageMozambique
AlgeriaMontenegro
MalawiMexico
ColombiaMalaysia
New ZealandZimbabwe
MauritiusEthiopia
MauritaniaEgypt Arab Rep.
Trinidad and TobagoNicaragua
LuxembourgCyprus
BangladeshSwaziland
South AfricaBoliviaSamoa
Venezuela RBGuatemala
EcuadorKazakhstanPhilippines
IndiaAustralia
Gambia TheBotswana
AngolaSyrian Arab Republic
ParaguayVietnam
Papua New GuineaLao PDR
IndonesiaCambodia
BhutanSwitzerland
ThailandNigeria
LesothoYemenChina
Iran Islamic Rep.
Global Mobile Tax Review 2011
© 2011 Deloitte LLP. 29
governments, e.g. in Croatia10 and Serbia11, have resorted to this additional taxation on usage as a direct
response to the 2008 financial crisis, leading to further margin erosion for MNOs.
In the 12 countries where tax as a share of usage costs is the highest, an airtime excise applies. This stands at
25% in Turkey, at 18% in Gabon, at 12% in Greece, at 11.5% in Pakistan and at 12% in Uganda, the top five
countries in the panel for taxes as a proportion of TCMU.
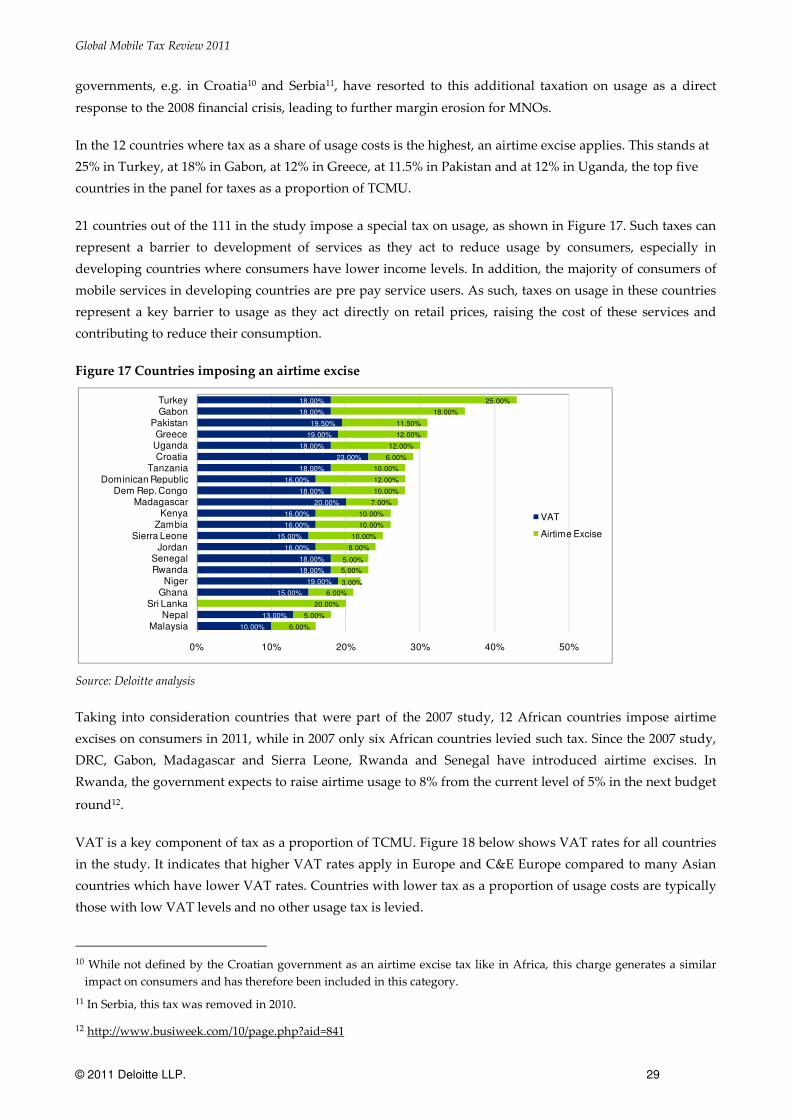
21 countries out of the 111 in the study impose a special tax on usage, as shown in Figure 17. Such taxes can
represent a barrier to development of services as they act to reduce usage by consumers, especially in
developing countries where consumers have lower income levels. In addition, the majority of consumers of
mobile services in developing countries are pre pay service users. As such, taxes on usage in these countries
represent a key barrier to usage as they act directly on retail prices, raising the cost of these services and
contributing to reduce their consumption.
Figure 17 Countries imposing an airtime excise
Source: Deloitte analysis
Taking into consideration countries that were part of the 2007 study, 12 African countries impose airtime
excises on consumers in 2011, while in 2007 only six African countries levied such tax. Since the 2007 study,
DRC, Gabon, Madagascar and Sierra Leone, Rwanda and Senegal have introduced airtime excises. In
Rwanda, the government expects to raise airtime usage to 8% from the current level of 5% in the next budget
round12.
VAT is a key component of tax as a proportion of TCMU. Figure 18 below shows VAT rates for all countries
in the study. It indicates that higher VAT rates apply in Europe and C&E Europe compared to many Asian
countries which have lower VAT rates. Countries with lower tax as a proportion of usage costs are typically
those with low VAT levels and no other usage tax is levied.
10 While not defined by the Croatian government as an airtime excise tax like in Africa, this charge generates a similar
impact on consumers and has therefore been included in this category.
11 In Serbia, this tax was removed in 2010.
12 http://www.busiweek.com/10/page.php?aid=841
18.00%
18.00%
19.50%
19.00%
18.00%
23.00%
18.00%
16.00%
18.00%
20.00%
16.00%
16.00%
15.00%
16.00%
18.00%
18.00%
19.00%
15.00%
0.00%
13.00%
10.00%
25.00%
18.00%
11.50%
12.00%
12.00%
6.00%
10.00%
12.00%
10.00%
7.00%
10.00%
10.00%
10.00%
8.00%
5.00%
5.00%
3.00%
6.00%
20.00%
5.00%
6.00%
0% 10% 20% 30% 40% 50%
TurkeyGabon
PakistanGreeceUgandaCroatia
TanzaniaDominican Republic
Dem Rep. CongoMadagascar
KenyaZambia
Sierra LeoneJordan
SenegalRwanda
NigerGhana
Sri LankaNepal
Malaysia
VAT
Airtime Excise

Global Mobile Tax Review 2011
© 2011 Deloitte LLP. 30
Figure 18 VAT or GST levels
Source: Deloitte analysis
25.00%
25.00%
25.00%
25.00%
25.00%
23.00%
23.00%
22.00%
21.00%
21.00%
21.00%
21.00%
21.00%
21.00%
20.00%
20.00%
20.00%
20.00%
20.00%
20.00%
20.00%
20.00%
20.00%
20.00%
20.00%
20.00%
19.60%
19.50%
19.25%
19.00%
19.00%
19.00%
19.00%
19.00%
19.00%
19.00%
19.00%
18.90%
18.00%
18.00%
18.00%
18.00%
18.00%
18.00%
18.00%
18.00%
18.00%
18.00%
18.00%
18.00%
18.00%
18.00%
18.00%
18.00%
18.00%
18.00%
17.00%
17.00%
17.00%
16.50%
16.00%
16.00%
16.00%
16.00%
16.00%
16.00%
15.00%
15.00%
15.00%
15.00%
15.00%
15.00%
15.00%
15.00%
15.00%
15.00%
15.00%
15.00%
15.00%
14.00%
14.00%
13.00%
13.00%
12.50%
12.00%
12.00%
12.00%
12.00%
12.00%
10.30%
10.00%
10.00%
10.00%
10.00%
10.00%
10.00%
10.00%
10.00%
10.00%
10.00%
10.00%
10.00%
10.00%
8.00%
7.00%
5.00%
5.00%
5.00%
3.00%
1.50%
0.00%
0% 5% 10% 15% 20% 25% 30%
Hungary
Denmark
Norway
Sweden
Brazil
Croatia
Finland
Poland
Latvia
Lithuania
Belgium
Ireland
Portugal
Argentina
Albania
Bulgaria
Czech Republic
Estonia
Slovenia
Ukraine
Uzbekistan
Austria
Italy
United Kingdom
Morocco
Madagascar
France
Pakistan
Cameroon
Romania
Slovakia
Germany
Greece
The Netherlands
Chile
Peru
Niger
Congo B
Azerbaijan
Georgia
Malta
Russian Federation
Serbia
Turkey
Spain
Tunisia
Burkina Faso
Chad
Cote d'Ivoire
Gabon
Guinea
Rwanda
Tanzania
Uganda
Dem Rep. Congo
Senegal
Montenegro
Algeria
Mozambique
Malawi
Colombia
Dominican Republic
Mexico
Jordan
Kenya
Zambia
Bangladesh
Cyprus
Luxembourg
Nicaragua
Trinidad and Tobago
Egypt Arab Rep.
Mauritania
Ethiopia
Ghana
Mauritius
Sierra Leone
Zimbabwe
New Zealand
South Africa
Swaziland
Nepal
Bolivia
Samoa
Philippines
Kazakhstan
Ecuador
Guatemala
Venezuela RB
India
Bhutan
Cambodia
Indonesia
Lao PDR
Malaysia
Papua New Guinea
Vietnam
Paraguay
Syrian Arab Republic
Angola
Botswana
Gambia The
Australia
Switzerland
Thailand
Yemen
Lesotho
Nigeria
China
Iran Islamic Rep.
Sri Lanka
Global Mobile Tax Review 2011
© 2011 Deloitte LLP. 31
4 Taxes on handsets
Taxes on mobile handsets are another significant component of the TCMO and include:
• Import duties, in particular applying in developing countries, affecting the retail price of a handset.
• Special custom duties: on some occasions, handsets are treated as luxury goods and a special custom
duty is applied, for example in Gabon mobile handsets incur a special $5 tax.
• Other special taxes: a number of countries, for example Gabon, Zambia, Pakistan and Bangladesh
apply a special tax on handset acquisition.
• Copyright fees: certain governments in developed markets, e.g. Italy, have imposed a fixed fee on
smartphones, arguing that consumption of media content should be taxed. The proceeds from this
tax are used to subsidise the national Copyright Protection Agency.
Handset costs represent the most significant barrier to the consumption of mobile services, particularly in
developing markets. Taxes on handsets therefore contribute to increase the cost barrier to first-time handset
users, thus negatively impacting penetration, in particular on low-income users.
Today, tax as a proportion of handset costs stands at 23.29%. While this is a slight reduction on the 2007 level
of 24.24%, tax as a proportion of handset cost is much higher than on total ownership or usage costs. Tax
represents over a third of the cost of a handset in 20 countries, while in 11 countries worldwide, of which
seven are in Africa, 40% of handset costs is now spent on tax, as shown in Figure 19.
The three countries showing the highest tax as a proportion of total handset cost are Gabon, Niger and
Argentina:
• In Gabon, tax as a proportion of handset cost stands at 80%. This is due to a $5 special tax imposed
on each handset purchased. Consumers also pay a high custom duty tax on imported handsets at
30%, in addition to a VAT of 18%.
• In Niger, a 46.99% custom duty applies on all handsets imported into the country.
• In Argentina, a special handset tax of 25.2% of the handset value applies.
At the low end of the taxation spectrum are Sri Lanka and Switzerland, whose governments do not impose
any taxes (such as custom duties) on the import of mobile handsets, and have low VAT rates. Kenya and
Senegal also rank amongst the lowest countries in the study, as a result of a government’s decision to abolish
VAT on handsets in 2009.
The majority of European jurisdictions have no custom duty for imported handsets, and neither do countries
such as Vietnam, Australia and New Zealand.

Global Mobile Tax Review 2011
© 2011 Deloitte LLP. 32
Figure 19 Tax as a proportion of handset cost
Source: Deloitte analysis
Import duties are an important component of handset taxes, and 50 countries impose duties on imported
handsets, as shown in Figure 20. Of these, 20 are in Africa. Additionally, 11 countries impose a specific tax
on handset purchase, as discussed in more detail in the next section of this report.
79.86%65.99%
62.21%49.25%48.90%
48.00%48.00%
46.00%44.50%
41.00%40.00%
39.00%38.00%
37.60%36.08%
35.00%35.00%35.00%
33.75%33.00%
32.00%31.00%31.00%
30.00%30.00%
28.00%27.00%27.00%
26.50%26.50%
25.00%25.00%25.00%25.00%25.00%25.00%
24.50%23.29%23.00%23.00%23.00%23.00%23.00%23.00%
22.50%22.20%22.00%22.00%
21.00%21.00%21.00%21.00%21.00%
20.32%20.00%20.00%20.00%20.00%20.00%20.00%20.00%20.00%20.00%20.00%
19.60%19.50%
19.00%19.00%19.00%19.00%19.00%
18.00%18.00%18.00%18.00%18.00%
17.50%17.00%17.00%17.00%16.80%
16.00%16.00%
15.00%15.00%15.00%15.00%15.00%15.00%15.00%15.00%15.00%
14.50%14.00%14.00%
13.56%12.50%12.50%
12.00%12.00%12.00%
10.00%10.00%10.00%10.00%10.00%10.00%10.00%
8.00%2.25%
0.00%0.00%
0% 10% 20% 30% 40% 50% 60% 70% 80% 90%
GabonNiger
ArgentinaCameroon
Congo BRwandaGuinea
MadagascarDem Rep. Congo
BrazilUzbekistan
Cote d'IvoireTurkey
ChadPakistan
GhanaMauritania
Trinidad and TobagoBangladeshAzerbaijan
EcuadorZambia
PeruGambia The
GeorgiaTanzaniaEthiopia
Venezuela RBMalawi
Iran Islamic Rep.Chile
SwedenNorway
DenmarkHungary
CambodiaMozambique
AverageLesothoBolivia
FinlandRussian Federation
CroatiaNepal
MoroccoColombia
PolandPhilippines
PortugalIreland
BelgiumLithuania
LatviaItaly
Syrian Arab RepublicUnited Kingdom
AustriaUkraine
SloveniaEstonia
Czech RepublicBulgariaAlbania
Lao PDRFrance
GuatemalaThe Netherlands
GreeceGermanySlovakiaRomaniaUgandaTunisia
SpainSerbiaMalta
IndonesiaAlgeria
MontenegroChina
MexicoJordan
Dominican RepublicNew Zealand
ZimbabweSierra Leone
MauritiusYemen
Egypt Arab Rep.Nicaragua
LuxembourgCyprus
Burkina FasoSwaziland
South AfricaIndia
SamoaMalaysia
ParaguayKazakhstan
ThailandAustralia
NigeriaBotswana
AngolaVietnam
Papua New GuineaBhutan
SwitzerlandKenya
SenegalSri Lanka

Global Mobile Tax Review 2011
© 2011 Deloitte LLP. 33
Figure 20 Countries imposing a duty on imported handsets
Source: Deloitte analysis
46.99%
30.00%
30.00%
30.00%
30.00%
30.00%
26.50%
25.00%
25.00%
21.00%
20.00%
20.00%
20.00%
20.00%
20.00%
20.00%
16.00%
16.00%
15.00%
15.00%
15.00%
12.00%
12.00%
12.00%
12.00%
10.00%
10.00%
10.00%
10.00%
10.00%
10.00%
10.00%
10.00%
10.00%
10.00%
9.00%
7.50%
7.50%
7.50%
6.00%
5.00%
5.00%
5.00%
5.00%
2.50%
2.50%
2.25%
2.00%
1.06%
0.80%
0% 10% 20% 30% 40% 50%
Niger
Cameroon
Gabon
Guinea
Rwanda
Congo B
Dem Rep. …
Iran Islamic …
Madagascar
Cote d'Ivoire
Uzbekistan
Ecuador
Trinidad and …
Mauritania
Gambia The
Ghana
Argentina
Brazil
Cambodia
Azerbaijan
Venezuela RB
Bangladesh
Georgia
Peru
Ethiopia
Lao PDR
Nepal
Philippines
Bolivia
Syrian Arab …
Yemen
Chad
Tanzania
Zambia
Malawi
Lesotho
Indonesia
Guatemala
Mozambique
Chile
Thailand
Russian …
Colombia
Nigeria
Malaysia
Morocco
Kenya
Paraguay
India
Mexico

Global Mobile Tax Review 2011
© 2011 Deloitte LLP. 34
5 Mobile specific taxes on consumers
The results of the taxation analysis have illustrated the impact of taxes on the cost mobile ownership and
usage. This included taxation that applies uniformly to all goods and services in an economy as well as
taxation that is specific to mobile services. In this section, we focus on the latter.
Most countries do not impose taxation that is specific to mobile services, recognising the economic and social
benefits of mobile telephony and supporting the principle that mobile telephony should not be
discriminated against other services.
However, a number of countries do impose mobile specific taxation on either handsets or mobile usage, or
on both. This type of taxation often discriminates mobile telephony against fixed telephony, despite mobile
services being recognised as providers of universal telecom services, especially in developing countries. In
addition, mobile specific taxes are often regressive in nature and contribute to reduce both
access/penetration and usage. By acting regressively, these taxes can generate perverse consequences on the
poorer sectors of the population that taxation intended to benefit.
In the results presented in the sections above, VAT (or GST) represented the most important source of
taxation in all countries in the panel. The rankings, which showed final impact on consumers, reflected the
impact of VAT, which is usually applied on handset, connection, rental and usage costs. However, VAT is
applied uniformly on all goods and services and in this sense it does not discriminate against mobile
telephony usage, except in countries such as Pakistan and Egypt where a higher than normal VAT rate
applies to mobile telephony.
If the effect of VAT and other sales taxes is removed from the analysis, such that only mobile specific
taxation and custom duties on imported handsets are considered, it is possible to rank countries that impose
specific taxation to mobile services beyond standard service taxation, as indicated in Figure 21.
In total, 63 countries charge a form of specific taxation, including custom duties, on mobile handsets and
services. Of these, 24 are African countries, and ten African countries rank within the top 20 countries where
mobile specific taxation as a proportion of TCMO is the highest.
Turkey, Gabon, and Pakistan are the countries with the highest proportion of taxation on TCMO due to the
numerous mobile-specific taxes described previously in this report. Sri Lanka and the Dominican Republic
rank fourth and fifth, due to their high airtime excises, amounting respectively to 20% and 12%.

Global Mobile Tax Review 2011
© 2011 Deloitte LLP. 35
Figure 21 Mobile specific taxation (including import duties on handsets) as a proportion of TCMO,
excluding VAT
Source: Deloitte analysis
Table 2 describes in detail the mobile specific taxation (excluding custom duties on imported handsets) for
the countries where it is imposed. Mobile specific taxation is currently imposed in 28 countries in the panel
and of these, 14 are in Africa.
29.34%
19.08%
15.35%
12.26%
11.68%
11.51%
11.12%
10.23%
10.14%
9.79%
8.80%
8.38%
8.30%
7.40%
6.99%
6.43%
5.95%
5.41%
5.09%
5.00%
4.77%
4.69%
4.63%
4.22%
3.75%
2.27%
1.94%
1.78%
1.44%
1.23%
1.08%
1.02%
0.88%
0.88%
0.76%
0.74%
0.71%
0.71%
0.66%
0.66%
0.66%
0.58%
0.58%
0.57%
0.53%
0.51%
0.46%
0.43%
0.42%
0.40%
0.39%
0.37%
0.29%
0.26%
0.22%
0.19%
0.15%
0.15%
0.10%
0.10%
0.07%
0.04%
0.02%
0.01%
0% 5% 10% 15% 20% 25% 30%
Turkey
Gabon
Pakistan
Sri Lanka
Dominican Republic
Greece
Dem Rep. Congo
Zambia
Uganda
Tanzania
Sierra Leone
Kenya
Madagascar
Jordan
Ghana
Rwanda
Malaysia
Nepal
Croatia
Egypt Arab Rep.
Bangladesh
Iran Islamic Rep.
Senegal
Niger
Italy
Average
Ethiopia
Gambia The
Argentina
Congo B
Cameroon
Yemen
Cote d'Ivoire
Azerbaijan
Ecuador
Georgia
Trinidad and Tobago
Guinea
Uzbekistan
Syrian Arab Republic
Russian Federation
Chad
Mozambique
Burkina Faso
Mauritania
Lesotho
Malawi
Philippines
Guatemala
Venezuela RB
Nigeria
Bolivia
Lao PDR
Cambodia
Indonesia
Peru
Colombia
Brazil
Thailand
Paraguay
Chile
Morocco
India
Mexico

Global Mobile Tax Review 2011
© 2011 Deloitte LLP. 36
Table 2 Mobile specific taxes on consumers by country
Country Consumer Tax Practices
Argentina • Pending legislation in Argentina, the government is seeking to increase internal
taxes on mobile handsets to a nominal rate of 17% for mobile devices not produced
in the Tierra de Fuego special economic area
• This is expected to affect 98% of the mobile devices in Argentina, as the vast
majority are imported into the country
• Mobile handsets suffer a 25.2% tax
• Post-pay rental suffers from a 12.9% tax
Bangladesh • The government in Bangladesh imposes a 100 Taka tax on each new handset
• Additionally, an 800 Taka tax is also imposed on each SIM activation
Burkina Faso • A statistic tax of 1%, a community solidarity tax of 1% and a community tax of 0.5%
apply to imported mobile handsets
• In addition, intellectual property tax of 10% and income tax of 2% also apply to
imported mobile handsets in Burkina Faso
Chad • A 9.6% special tax applies on all handsets
Colombia • A special handset tax of 1.2%applies
Croatia • In August 2009, a mobile-specific 6% fee on operator’s gross revenues on invoiced
services for mobile SMS, MMS and voice services including roaming services was
introduced, indirectly impacting retail prices
Democratic
Republic of Congo
• A 10% airtime excise applies on usage of calls and SMS
Dominican
Republic
• A 12% special telecom tax is imposed on usage of calls and SMS
Egypt • Mobile telecom services VAT is applied at a higher rate than standard rate for other
goods & services
• Mobile VAT is 15%, landline VAT is 5% and standard VAT is 10%
Gabon • An airtime excise of 18% applies
• In addition, a special tax of $5 applies to imported handsets
Ghana • MNOs pay 2.5% of their revenues to the government as a Health Insurance tax
which is used to fund investment in Ghana’s health services
• This is applied on top of a normal VAT rate of 12.5% across all service components
(handset, connection rental and usage) bringing the VAT rate to 15% for mobile
services
• In addition, Ghana imposes an airtime excise of 6% on usage of calls and SMS
Greece • Since 1998, a tax has been applied to the monthly bills of post-paid mobile
subscribers. Until 2009, there were three different rates (€2, € 5, and € 10)
depending on the amount of the total monthly bill. Pre-paid subscribers did not
pay this tax
• In July 2009, a new law introduced a 12% tax on prepaid mobile subscriptions and
also increased the tax rates on post-paid subscriptions to 12%, 15%, 18%, and 20%,
depending on the amount of the total monthly bill
Italy • Post-paid mobile services for non business consumers are taxed at the rate of €5.16
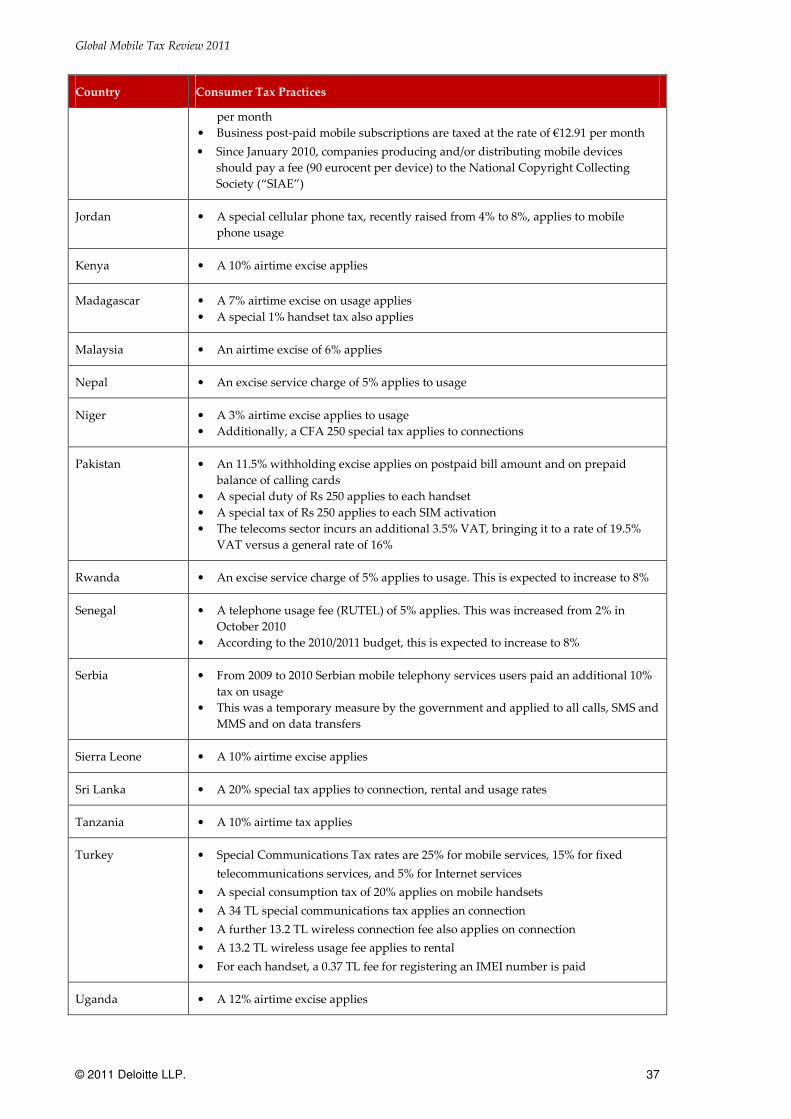
Global Mobile Tax Review 2011
© 2011 Deloitte LLP. 37
Country Consumer Tax Practices
per month
• Business post-paid mobile subscriptions are taxed at the rate of €12.91 per month
• Since January 2010, companies producing and/or distributing mobile devices
should pay a fee (90 eurocent per device) to the National Copyright Collecting
Society (“SIAE”)
Jordan • A special cellular phone tax, recently raised from 4% to 8%, applies to mobile
phone usage
Kenya • A 10% airtime excise applies
Madagascar • A 7% airtime excise on usage applies
• A special 1% handset tax also applies
Malaysia • An airtime excise of 6% applies
Nepal • An excise service charge of 5% applies to usage
Niger • A 3% airtime excise applies to usage
• Additionally, a CFA 250 special tax applies to connections
Pakistan • An 11.5% withholding excise applies on postpaid bill amount and on prepaid
balance of calling cards
• A special duty of Rs 250 applies to each handset
• A special tax of Rs 250 applies to each SIM activation
• The telecoms sector incurs an additional 3.5% VAT, bringing it to a rate of 19.5%
VAT versus a general rate of 16%
Rwanda • An excise service charge of 5% applies to usage. This is expected to increase to 8%
Senegal • A telephone usage fee (RUTEL) of 5% applies. This was increased from 2% in
October 2010
• According to the 2010/2011 budget, this is expected to increase to 8%
Serbia • From 2009 to 2010 Serbian mobile telephony services users paid an additional 10%
tax on usage
• This was a temporary measure by the government and applied to all calls, SMS and
MMS and on data transfers
Sierra Leone • A 10% airtime excise applies
Sri Lanka • A 20% special tax applies to connection, rental and usage rates
Tanzania • A 10% airtime tax applies
Turkey • Special Communications Tax rates are 25% for mobile services, 15% for fixed
telecommunications services, and 5% for Internet services
• A special consumption tax of 20% applies on mobile handsets
• A 34 TL special communications tax applies an connection
• A further 13.2 TL wireless connection fee also applies on connection
• A 13.2 TL wireless usage fee applies to rental
• For each handset, a 0.37 TL fee for registering an IMEI number is paid
Uganda • A 12% airtime excise applies

Global Mobile Tax Review 2011
© 2011 Deloitte LLP. 38
Country Consumer Tax Practices
Zambia • A 10% airtime excise applies
• A special handset tax of 5% is imposed
Source: Deloitte Analysis
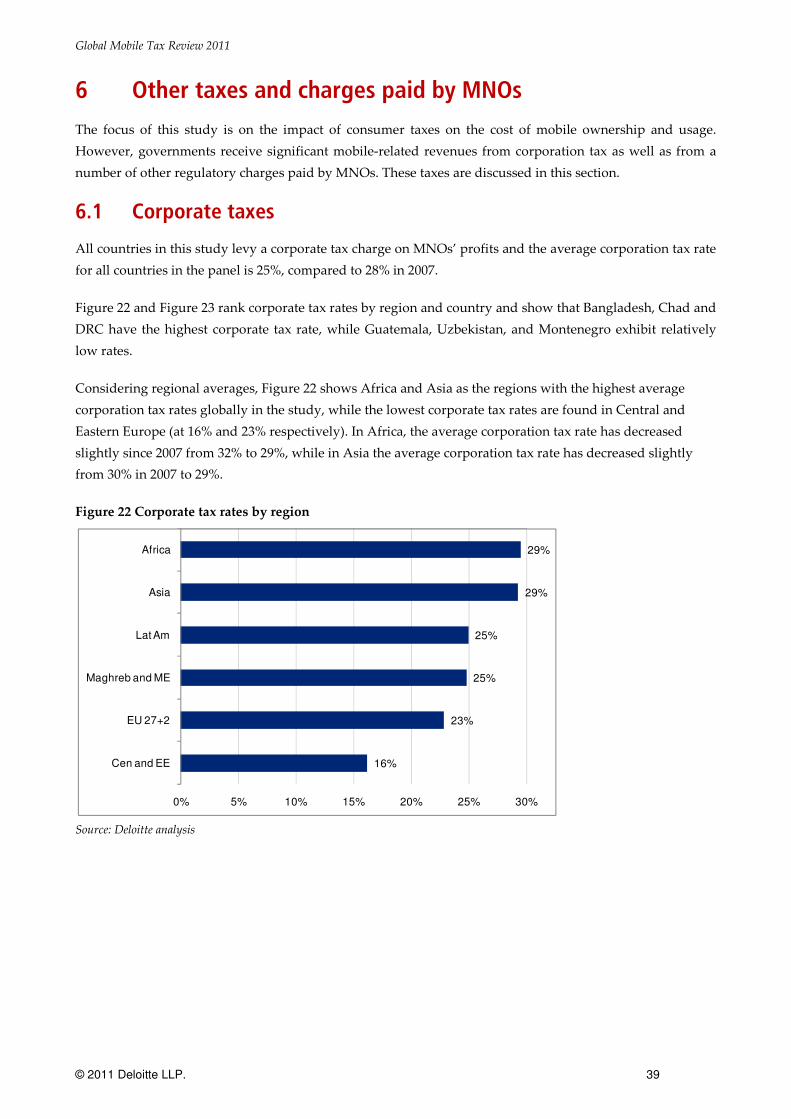
Global Mobile Tax Review 2011
© 2011 Deloitte LLP. 39
6 Other taxes and charges paid by MNOs
The focus of this study is on the impact of consumer taxes on the cost of mobile ownership and usage.
However, governments receive significant mobile-related revenues from corporation tax as well as from a
number of other regulatory charges paid by MNOs. These taxes are discussed in this section.
6.1 Corporate taxes
All countries in this study levy a corporate tax charge on MNOs’ profits and the average corporation tax rate
for all countries in the panel is 25%, compared to 28% in 2007.
Figure 22 and Figure 23 rank corporate tax rates by region and country and show that Bangladesh, Chad and
DRC have the highest corporate tax rate, while Guatemala, Uzbekistan, and Montenegro exhibit relatively
low rates.
Considering regional averages, Figure 22 shows Africa and Asia as the regions with the highest average
corporation tax rates globally in the study, while the lowest corporate tax rates are found in Central and
Eastern Europe (at 16% and 23% respectively). In Africa, the average corporation tax rate has decreased
slightly since 2007 from 32% to 29%, while in Asia the average corporation tax rate has decreased slightly
from 30% in 2007 to 29%.
Figure 22 Corporate tax rates by region
Source: Deloitte analysis
29%
29%
25%
25%
23%
16%
0% 5% 10% 15% 20% 25% 30%
Africa
Asia
Lat Am
Maghreb and ME
EU 27+2
Cen and EE
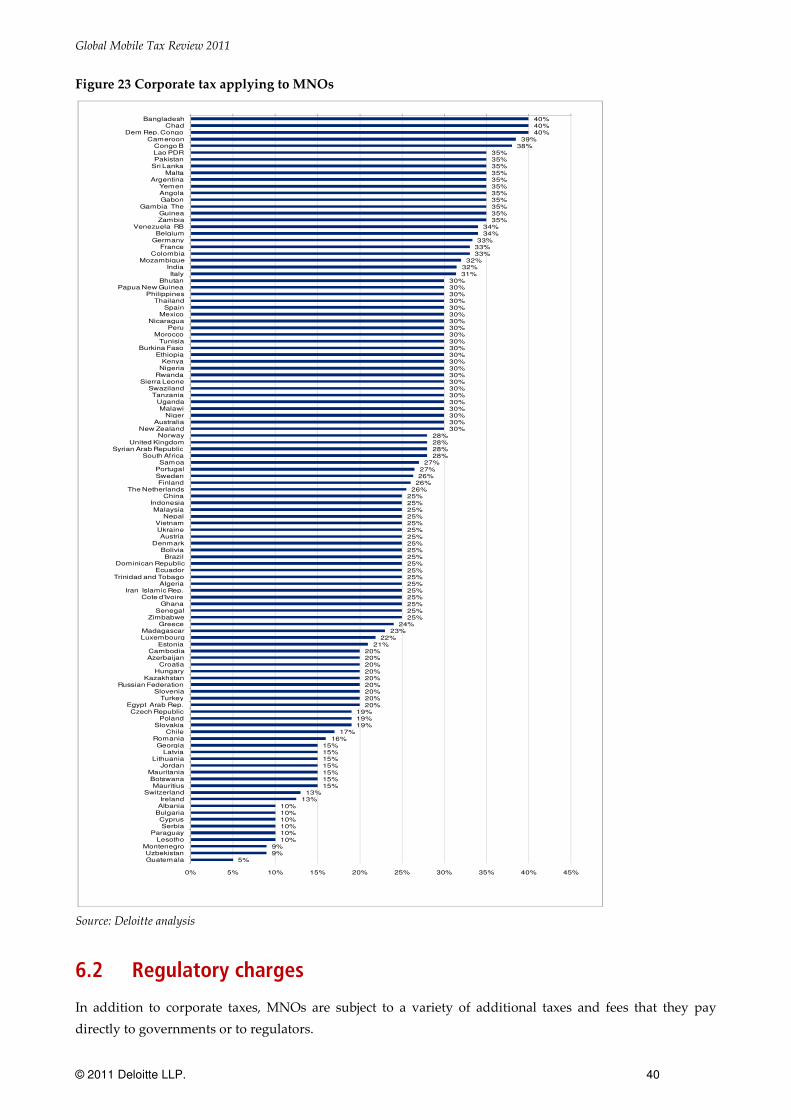
Global Mobile Tax Review 2011
© 2011 Deloitte LLP. 40
Figure 23 Corporate tax applying to MNOs
Source: Deloitte analysis
6.2 Regulatory charges
In addition to corporate taxes, MNOs are subject to a variety of additional taxes and fees that they pay
directly to governments or to regulators.
40%40%40%
39%38%
35%35%35%35%35%35%35%35%35%35%35%
34%34%
33%33%33%
32%32%31%
30%30%30%30%30%30%30%30%30%30%30%30%30%30%30%30%30%30%30%30%30%30%30%
28%28%28%28%
27%27%26%
26%26%
25%25%25%25%25%25%25%25%25%25%25%25%25%25%25%25%25%25%25%
24%23%
22%21%
20%20%20%20%20%20%20%20%20%
19%19%19%
17%16%
15%15%15%15%15%15%15%
13%13%
10%10%10%10%10%10%
9%9%
5%
0% 5% 10% 15% 20% 25% 30% 35% 40% 45%
BangladeshChad
Dem Rep. CongoCameroon
Congo BLao PDRPakistan
Sri LankaMalta
ArgentinaYemenAngolaGabon
Gambia TheGuineaZambia
Venezuela RBBelgium
GermanyFrance
ColombiaMozambique
IndiaItaly
BhutanPapua New Guinea
PhilippinesThailand
SpainMexico
NicaraguaPeru
MoroccoTunisia
Burkina FasoEthiopia
KenyaNigeria
RwandaSierra Leone
SwazilandTanzania
UgandaMalawi
NigerAustralia
New ZealandNorway
United KingdomSyrian Arab Republic
South AfricaSamoa
PortugalSwedenFinland
The NetherlandsChina
IndonesiaMalaysia
NepalVietnamUkraineAustria
DenmarkBoliviaBrazil
Dominican RepublicEcuador
Trinidad and TobagoAlgeria
Iran Islamic Rep.Cote d'Ivoire
GhanaSenegal
ZimbabweGreece
MadagascarLuxembourg
EstoniaCambodiaAzerbaijan
CroatiaHungary
KazakhstanRussian Federation
SloveniaTurkey
Egypt Arab Rep.Czech Republic
PolandSlovakia
ChileRomaniaGeorgia
LatviaLithuania
JordanMauritaniaBotswanaMauritius
SwitzerlandIreland
AlbaniaBulgariaCyprusSerbia
ParaguayLesotho
MontenegroUzbekistanGuatemala
Global Mobile Tax Review 2011
© 2011 Deloitte LLP. 41
These include regulatory fees for the operation of regulatory authorities, often calculated as a proportion of
revenues. In developing countries these represent up to 3% of revenues, e.g. in Chad and Congo B.
Other regulatory charges include:
• Numbering fees are also often charged, and set as a proportion to revenues, e.g. 2% in the
Democratic Republic of Congo.
• Universal Service Fund contributions: these take numerous forms, e.g. technology taxes, investment
funds, funding for public broadcasters. These are usually charged as a share of revenues, e.g. up to
2% in Gabon.
• Spectrum fees, which represent a de facto tax on an essential resource for MNOs. Often spectrum
fees discourage investment, e.g. in Kenya, where a fixed spectrum contribution is paid for every base
station added.
• Special fees such as Health Insurance Tax, e.g. in Ghana.
Examples of these charges in a selected number of countries are reported in Appendix C to this paper.
Regulatory taxes, spectrum and licence fees are charged by governments in many countries as a proportion
of the MNOs’ revenue. As such, these taxes can have a similar counter balancing impact on total government
revenues (albeit often paid to the regulatory authority rather than directly to the government) following a
reduction in consumer taxation. Therefore, the combination of special mobile consumer taxes and corporate
taxes acts to reduce not only MNOs’ profitability but also revenues for government.
When added together, these contributions represent a significant burden for MNOs and may act as a
constraint to network and service investment at a time when LTE network expansion requires funds to
upgrade the existing networks and provide valuable wireless mobile services to consumers. In addition, as a
result of the global financial crisis, Foreign Direct Investment becomes more sensitive to taxation burdens,
and high corporate taxation risks reducing investment inflows in developing countries.

Global Mobile Tax Review 2011
© 2011 Deloitte LLP. 42
7 Regional analysis
Mobile services have developed at a fast pace throughout the world and there are now over 5.5 billion
mobile connections worldwide. However, penetration levels and cost of mobile services remain different
across regions, as indicated in Figure 24 and Figure 25.
Figure 24 Penetration across regions
Source: Wireless Intelligence
Figure 25 Average TCMO values by region ($)
Source: Deloitte Analysis
Market penetration is the highest in the European markets and in C&E Europe, where levels are well above
100% due to consumers owning more than one SIM card or handset. The EU has also the highest TCMO, due
to high usage of mobile services and to the higher incidence of smartphones, which are more expensive than
standard handsets. Africa, in contrast, shows the lowest mobile penetration worldwide along with the
lowest TCMO levels, as usage is lower and handsets cheaper.
Figure 26 illustrates tax as a share of TCMO, TCMU and handset costs across these geographic regions. As
with penetration and TCMO, taxation profiles are different.
132% 130%
100%95%
74%
60%
0%
20%
40%
60%
80%
100%
120%
140%
EU 27 +2 C&E Europe Latin America ME & Maghreb
Asia Pacific Africa
769
486
426
317
210
141
0 100 200 300 400 500 600 700 800
EU 27
Latin America
Asia
C&E Europe
ME & Maghreb
Africa
$

Global Mobile Tax Review 2011
© 2011 Deloitte LLP. 43
In Europe, tax represents the same proportion of mobile ownership, usage and handset costs. In other
countries, taxes as proportion of handset costs are much higher than taxes on usage.
C&E Europe shows the highest average tax as a proportion of TCMO, due to the high mobile specific taxes
levied in Turkey and Croatia in particular. The EU is the region with the second highest tax as a proportion
of TCMO and TCMU; this is driven by higher VAT rates.
Figure 26 Tax as a proportion of TCMO, TCMU and handset costs across all regions
Source: Deloitte Analysis
The strongest variation within a region exists in Africa. While Africa ranks third for tax as a proportion of
ownership and usage, 17 African nations out of the total 30 African countries in this study have taxation as a
proportion of TCMO at above the global average level, largely as a result of the high incidence of airtime
taxes.
Africa has also the highest proportion of handset tax globally, representing on average 29% of handset costs.
This is due to a number of handset-specific taxes, and to the level custom duties that are levied on imported
handset. While movements have been observed in Kenya, and Senegal, where governments have abolished
VAT and custom duties on handsets to encourage access to mobile services, other countries still retain higher
than average levels of handset taxation.
In Latin America, taxes as a proportion of handset costs are also remarkably high, due to custom duties on
imported handsets and to mobile specific taxation on handsets in Argentina and Colombia.
Asian consumers pay the lowest tax as a proportion of mobile service ownership, due to low VAT rates and
limited mobile-specific taxation.
21.84%
20.50%
19.32%
16.97%
14.65%
12.77%
21.60%
20.54% 19.06%
16.71%
13.94%
12.77%
25%
20%
29%
27%
21%
17%
0%
5%
10%
15%
20%
25%
30%
C&E Europe EU 27 +2 Africa Latin America ME & Maghreb Asia Pacific
Tax as a proportion of TCMO
Tax as a proportion of TCMU
Tax as a proportion of handset price

Global Mobile Tax Review 2011
© 2011 Deloitte LLP. 44
While there is no clear relationship between mobile taxation and penetration, lower taxes on mobile services
are likely to encourage greater adoption of mobile communications in developing countries. Whilst handsets
are the cheapest in Africa, almost a third of the handset cost is composed of taxes. With handsets being the
largest barrier to mobile penetration in this developing region, the high incidence of tax plays a significant
role in increasing this barrier.
As shown in Figure 27 and Figure 28, compared to 2007, the average tax as a proportion of mobile ownership
has increased in EU, Africa, ME and Maghreb and Asia, while there has been a slight decline in average tax
as a proportion of TCMO in C&E Europe and Latin America. Taxes as a proportion of usage costs have
increased by a notable 13% in Africa, and the increase has been driven mainly by airtime excise taxes. Taxes
as a proportion of usage cost have decreased in Asia and Latin America.
Figure 27 Tax as a proportion of TCMO across regions, comparison with 2007 survey
Source: Deloitte Analysis
Figure 28 Tax as a proportion of TCMU across regions, comparison with 2007 survey
Source: Deloitte Analysis
21.84%
20.50%
19.32%
16.97%
14.65%
12.77%
22.69%
19.54%
18.06%
18.74%
13.93%
12.19%
0% 5% 10% 15% 20% 25%
C&E Europe
EU 27 +2
Africa
Latin America
ME & Maghreb
Asia Pacific
2011 2007
21.60%
20.54%
19.06%
16.71%
13.94%
12.77%
19.69%
19.69%
16.81%
18.59%
13.25%
18.59%
0% 5% 10% 15% 20% 25%
C&E Europe
EU 27 +2
Africa
Latin America
ME & Maghreb
Asia Pacific
2011 2007

Global Mobile Tax Review 2011
© 2011 Deloitte LLP. 45
Finally, Figure 29 indicates that tax as a proportion of handset costs has decreased in Africa, largely due to
the policies of countries such as Kenya and Senegal where handset specific taxes have been reduced.
Figure 29 Tax as a proportion of handset cost across regions, comparison with 2007 survey
Source: Deloitte Analysis
7.1 Europe
In Europe, the countries with a higher taxation as a proportion of TCMO include Greece, Norway, Sweden
Denmark, Hungary and Italy, as shown in Figure 30, Figure 31 and Figure 32. While in Greece (and to a
lower degree in Italy) mobile specific taxes apply, the Nordic countries suffer from higher levels of VAT on
usage and handsets.
29.00%
26.98%
24.91%
20.56%
19.96%
16.66%
30.76%
26.18%
24.84%
28.78%
19.25%
18.28%
0% 5% 10% 15% 20% 25% 30% 35%
Africa
Latin America
C&E Europe
ME & Maghreb
EU 27 +2
Asia Pacific
2011 2007
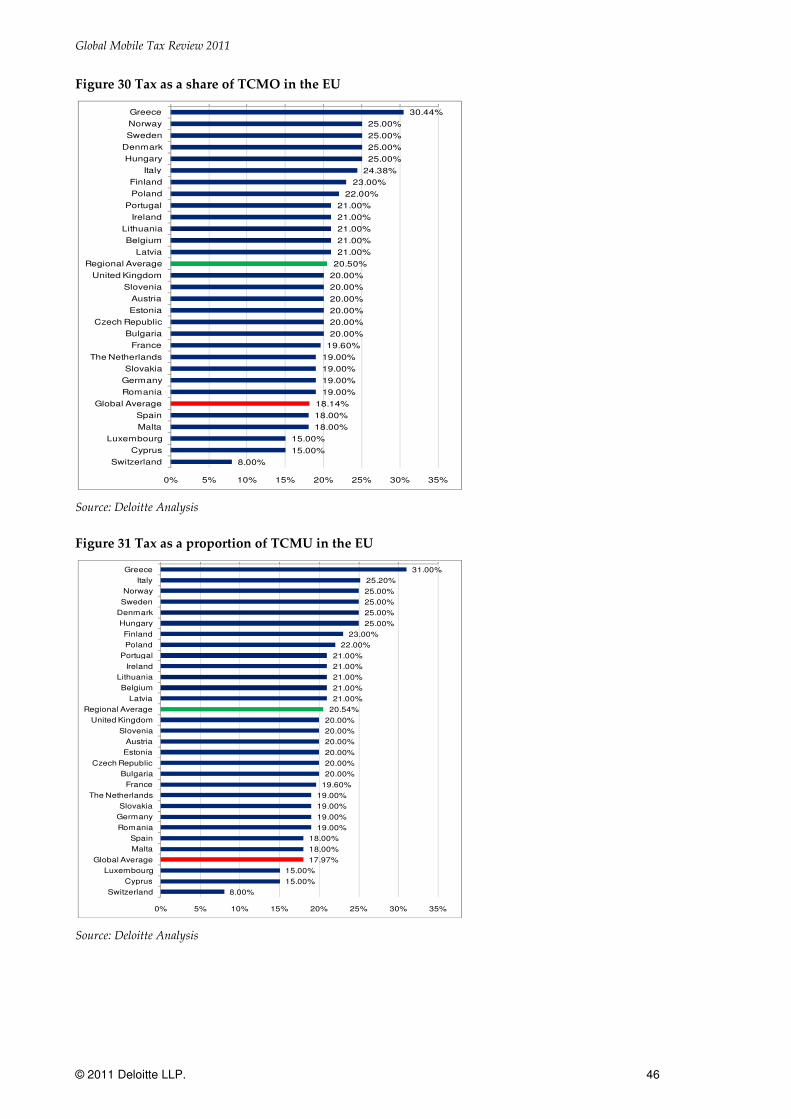
Global Mobile Tax Review 2011
© 2011 Deloitte LLP. 46
Figure 30 Tax as a share of TCMO in the EU
Source: Deloitte Analysis
Figure 31 Tax as a proportion of TCMU in the EU
Source: Deloitte Analysis
30.44%
25.00%
25.00%
25.00%
25.00%
24.38%
23.00%
22.00%
21.00%
21.00%
21.00%
21.00%
21.00%
20.50%
20.00%
20.00%
20.00%
20.00%
20.00%
20.00%
19.60%
19.00%
19.00%
19.00%
19.00%
18.14%
18.00%
18.00%
15.00%
15.00%
8.00%
0% 5% 10% 15% 20% 25% 30% 35%
Greece
Norway
Sweden
Denmark
Hungary
Italy
Finland
Poland
Portugal
Ireland
Lithuania
Belgium
Latvia
Regional Average
United Kingdom
Slovenia
Austria
Estonia
Czech Republic
Bulgaria
France
The Netherlands
Slovakia
Germany
Romania
Global Average
Spain
Malta
Luxembourg
Cyprus
Switzerland
31.00%
25.20%
25.00%
25.00%
25.00%
25.00%
23.00%
22.00%
21.00%
21.00%
21.00%
21.00%
21.00%
20.54%
20.00%
20.00%
20.00%
20.00%
20.00%
20.00%
19.60%
19.00%
19.00%
19.00%
19.00%
18.00%
18.00%
17.97%
15.00%
15.00%
8.00%
0% 5% 10% 15% 20% 25% 30% 35%
Greece
Italy
Norway
Sweden
Denmark
Hungary
Finland
Poland
Portugal
Ireland
Lithuania
Belgium
Latvia
Regional Average
United Kingdom
Slovenia
Austria
Estonia
Czech Republic
Bulgaria
France
The Netherlands
Slovakia
Germany
Romania
Spain
Malta
Global Average
Luxembourg
Cyprus
Switzerland
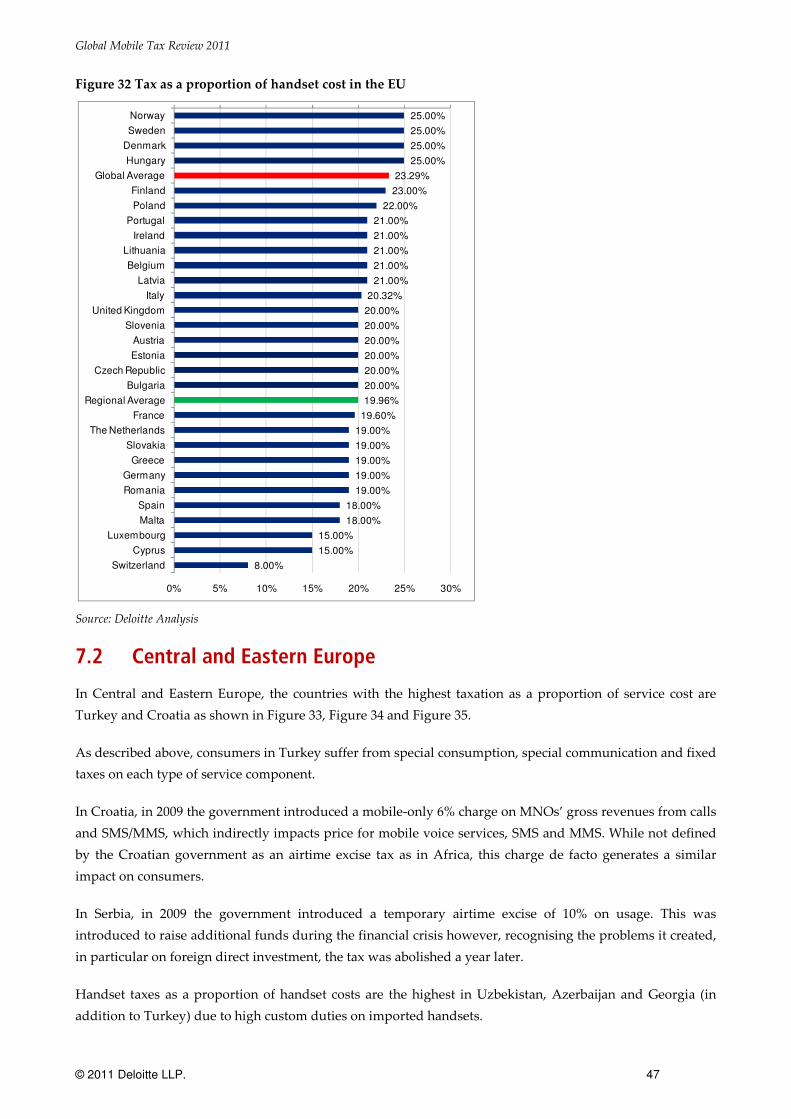
Global Mobile Tax Review 2011
© 2011 Deloitte LLP. 47
Figure 32 Tax as a proportion of handset cost in the EU
Source: Deloitte Analysis
7.2 Central and Eastern Europe
In Central and Eastern Europe, the countries with the highest taxation as a proportion of service cost are
Turkey and Croatia as shown in Figure 33, Figure 34 and Figure 35.
As described above, consumers in Turkey suffer from special consumption, special communication and fixed
taxes on each type of service component.
In Croatia, in 2009 the government introduced a mobile-only 6% charge on MNOs’ gross revenues from calls
and SMS/MMS, which indirectly impacts price for mobile voice services, SMS and MMS. While not defined
by the Croatian government as an airtime excise tax as in Africa, this charge de facto generates a similar
impact on consumers.
In Serbia, in 2009 the government introduced a temporary airtime excise of 10% on usage. This was
introduced to raise additional funds during the financial crisis however, recognising the problems it created,
in particular on foreign direct investment, the tax was abolished a year later.
Handset taxes as a proportion of handset costs are the highest in Uzbekistan, Azerbaijan and Georgia (in
addition to Turkey) due to high custom duties on imported handsets.
25.00%
25.00%
25.00%
25.00%
23.29%
23.00%
22.00%
21.00%
21.00%
21.00%
21.00%
21.00%
20.32%
20.00%
20.00%
20.00%
20.00%
20.00%
20.00%
19.96%
19.60%
19.00%
19.00%
19.00%
19.00%
19.00%
18.00%
18.00%
15.00%
15.00%
8.00%
0% 5% 10% 15% 20% 25% 30%
Norway
Sweden
Denmark
Hungary
Global Average
Finland
Poland
Portugal
Ireland
Lithuania
Belgium
Latvia
Italy
United Kingdom
Slovenia
Austria
Estonia
Czech Republic
Bulgaria
Regional Average
France
The Netherlands
Slovakia
Greece
Germany
Romania
Spain
Malta
Luxembourg
Cyprus
Switzerland

Global Mobile Tax Review 2011
© 2011 Deloitte LLP. 48
Figure 33 Tax as a share of TCMO in C&E Europe
Source: Deloitte Analysis
Figure 34 Tax as a share of TCMU in C&E Europe
Source: Deloitte Analysis
48.23%
27.93%
21.84%
20.68%
20.00%
20.00%
18.89%
18.76%
18.75%
18.14%
18.00%
17.00%
12.00%
0% 10% 20% 30% 40% 50%
Turkey
Croatia
Regional Average
Uzbekistan
Ukraine
Albania
Azerbaijan
Russian Federation
Georgia
Global Average
Serbia
Montenegro
Kazakhstan
47.61%
29.00%
21.60%
20.00%
20.00%
20.00%
18.00%
18.00%
18.00%
18.00%
17.97%
17.00%
12.00%
0% 5% 10% 15% 20% 25% 30% 35% 40% 45% 50%
Turkey
Croatia
Regional Average
Uzbekistan
Ukraine
Albania
Serbia
Russian Federation
Georgia
Azerbaijan
Global Average
Montenegro
Kazakhstan

Global Mobile Tax Review 2011
© 2011 Deloitte LLP. 49
Figure 35 Tax as a proportion of handset cost in C&E Europe
Source: Deloitte Analysis
7.3 Africa
In Africa, tax as a proportion of TCMO has increased from 18.06% in 2007 to 19.32% in 2011, as indicated in
Figure 27 above. Taxes as a proportion of TCMO in Africa are reported in Figure 36, while Figure 37 shows
that mobile taxation is higher than the global average in 17 African countries.
Figure 36 Tax as a proportion of TCMO in Africa
Source: Deloitte Analysis
40.00%
38.00%
33.00%
30.00%
24.91%
23.29%
23.00%
23.00%
20.00%
20.00%
18.00%
17.00%
12.00%
0% 5% 10% 15% 20% 25% 30% 35% 40% 45%
Uzbekistan
Turkey
Azerbaijan
Georgia
Regional Average
Global Average
Russian Federation
Croatia
Ukraine
Albania
Serbia
Montenegro
Kazakhstan
37.20%29.14%
28.33%28.17%27.80%
26.23%24.47%
23.82%23.29%
22.01%21.21%
20.53%20.37%20.18%
19.32%18.90%18.74%18.59%
18.14%17.84%17.58%
16.97%16.96%
15.00%15.00%
14.00%14.00%
11.80%10.00%10.00%
5.95%5.40%
0% 5% 10% 15% 20% 25% 30% 35% 40%
GabonDem Rep. Congo
MadagascarUganda
TanzaniaZambiaRwanda
Sierra LeoneNiger
GhanaSenegal
KenyaCameroon
Congo BRegional Average
Cote d'IvoireGuinea
ChadGlobal Average
Burkina FasoMozambique
MalawiEthiopia
ZimbabweMauritius
SwazilandSouth Africa
Gambia TheBotswana
AngolaLesothoNigeria

Global Mobile Tax Review 2011
© 2011 Deloitte LLP. 50
Figure 37 African countries where tax as a proportion of TCMO is above the global average level
Source: Deloitte Analysis
The top 5 countries with highest taxation burden are Gabon, the DRC, Madagascar, Uganda and Tanzania:
• In Gabon, the tax as a proportion of TCMO IS 37.20% due to a VAT rate of 18% in addition to a
custom duty of 30% imposed on imported handsets. Further, there is a $5 fixed tax on each handset
in addition to an airtime excise of 18%.
• In the DRC, an airtime excise of 10% applies in addition to a custom duty rate on handsets of 26.5%.
• In Madagascar, consumers pay 28% of TCMO as tax, due to an airtime excise of 7% and a 1% special
tax on handsets. In addition, a 25% custom duty applies.
• In Uganda, the tax as a proportion of TCMO is 28%. This is a result of an airtime excise of 12% on
usage, in addition to an 18% VAT.
• Tanzania imposes a 10% airtime excise, in addition to a custom duty on handsets at 10%.
Figure 38 shows levels of taxation on mobile usage in Africa. Of the ten countries worldwide with the
highest usage taxation, five are in Africa. Taking into consideration the countries that were part of the 2007
study, 12 African countries impose airtime excises on consumers in 2011, while in 2007 only six African
countries had such tax. Since the 2007 study, DRC, Gabon, Madagascar and Sierra Leone and Senegal have
introduced airtime excises. In Rwanda, the government expects to raise airtime usage to 8% from the current
level of 5% in the next budget round. Airtime excises in Africa are illustrated in Figure 39.
37.20%
29.14%
28.33%
28.17%
27.80%
26.23%
24.47%
23.82%
23.29%
22.01%
21.21%
20.53%
20.37%
20.18%
18.90%
18.74%
18.59%
18.14%
0% 5% 10% 15% 20% 25% 30% 35% 40%
Gabon
Dem Rep. Congo
Madagascar
Uganda
Tanzania
Zambia
Rwanda
Sierra Leone
Niger
Ghana
Senegal
Kenya
Cameroon
Congo B
Cote d'Ivoire
Guinea
Chad
Average

Global Mobile Tax Review 2011
© 2011 Deloitte LLP. 51
Figure 38 Tax as a proportion of TCMU in Africa
Source: Deloitte Analysis
Figure 39 African countries where an airtime tax applies
Source: Deloitte Analysis
Finally, as discussed above, handset taxation is of particular concern in Africa, which shows the highest level
of handset taxation globally. Tax as a proportion of handset costs in Africa is indicated in Figure 40. This
shows that tax represents over 30% of handset costs in 13 countries in Africa.
36.00%30.00%
28.00%28.00%
27.00%26.00%26.00%
25.00%23.00%23.00%
22.00%21.00%
19.25%19.06%18.90%
18.00%18.00%18.00%18.00%17.97%
17.00%16.50%
15.00%15.00%15.00%
14.00%14.00%
10.00%10.00%10.00%
5.00%5.00%
0% 5% 10% 15% 20% 25% 30% 35% 40%
GabonUganda
TanzaniaDem Rep. Congo
MadagascarZambiaKenya
Sierra LeoneSenegalRwanda
NigerGhana
CameroonRegional Average
Congo BGuinea
Cote d'IvoireChad
Burkina FasoGlobal Average
MozambiqueMalawi
ZimbabweMauritiusEthiopia
SwazilandSouth Africa
Gambia TheBotswana
AngolaNigeria
Lesotho
18.00%
12.00%
10.00%
10.00%
10.00%
10.00%
10.00%
7.00%
6.00%
5.00%
5.00%
3.00%
0% 5% 10% 15% 20%
Gabon
Uganda
Dem Rep. Congo
Kenya
Sierra Leone
Tanzania
Zambia
Madagascar
Ghana
Rwanda
Senegal
Niger

Global Mobile Tax Review 2011
© 2011 Deloitte LLP. 52
Figure 40 Tax as a proportion of handset cost in Africa
Source: Deloitte Analysis
This high level is driven by a number of handset-specific taxes and fees, which are currently imposed in
Burkina Faso, Chad, Gabon, Madagascar, and Zambia. It is also driven by custom duties that apply to
handset imports in 20 African countries (out of the 30 in the study), as shown in Figure 41. Of these 20, six
impose import duties of 30% or higher.
Positive movements have been observed in Kenya and Senegal, where governments have abolished VAT
and custom duties on handsets to encourage access to mobile services, other countries still retain higher than
average levels of handset taxation. In Kenya, an analysis of the impact of the removal of handset tax has
found that penetration, handset volumes and usage have increased notably13 after handset taxes were
removed. This may indicate that consumers, particularly in developing countries, are price sensitive in
relation to their uptake and usage and that tax reductions may therefore boost consumption of mobile
services.
13
See Deloitte/GSMA. “Mobile telephony and taxation in Kenya”, 2011
79.86%65.99%
49.25%48.90%
48.00%48.00%
46.00%44.50%
39.00%37.60%
35.00%31.00%
30.00%29.00%
28.00%27.00%26.50%
24.50%23.29%23.00%
18.00%15.00%15.00%15.00%14.50%14.00%14.00%
10.00%10.00%10.00%
2.25%0.00%
0% 10% 20% 30% 40% 50% 60% 70% 80%
GabonNiger
CameroonCongo BRwandaGuinea
MadagascarDem Rep. Congo
Cote d'IvoireChad
GhanaZambia
Gambia TheRegional Average
TanzaniaEthiopiaMalawi
MozambiqueGlobal Average
LesothoUganda
ZimbabweSierra Leone
MauritiusBurkina Faso
SwazilandSouth Africa
NigeriaBotswana
AngolaKenya
Senegal
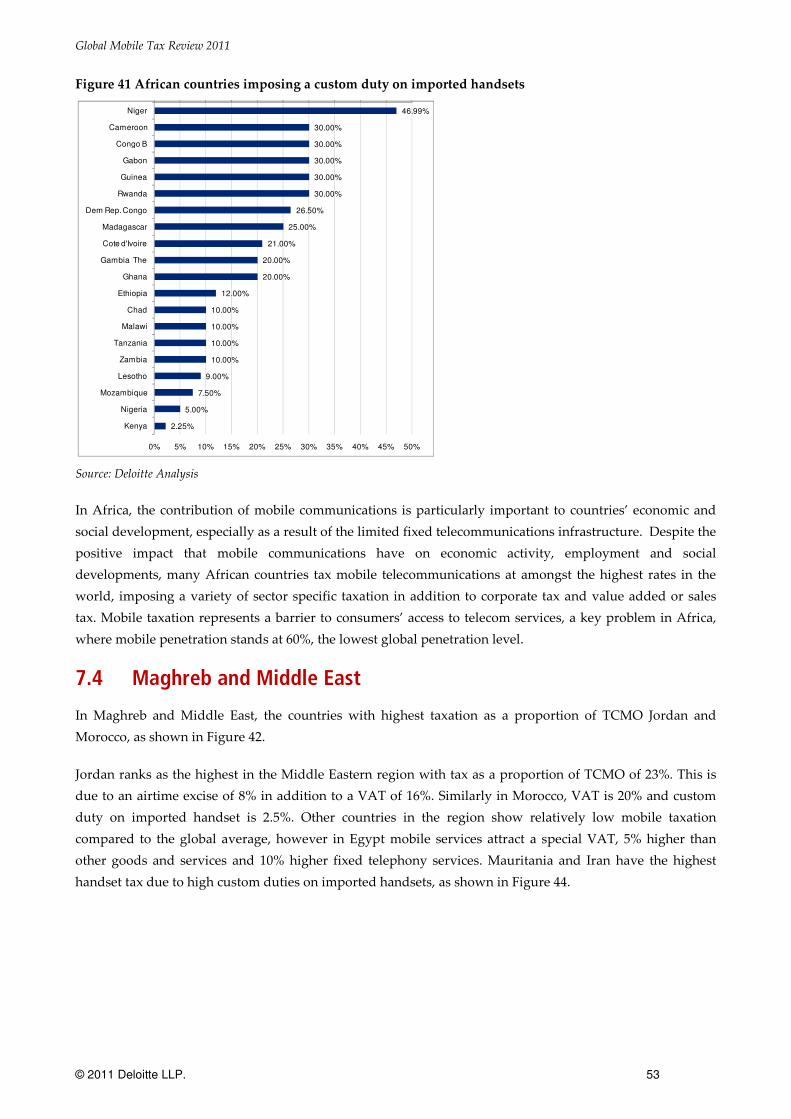
Global Mobile Tax Review 2011
© 2011 Deloitte LLP. 53
Figure 41 African countries imposing a custom duty on imported handsets
Source: Deloitte Analysis
In Africa, the contribution of mobile communications is particularly important to countries’ economic and
social development, especially as a result of the limited fixed telecommunications infrastructure. Despite the
positive impact that mobile communications have on economic activity, employment and social
developments, many African countries tax mobile telecommunications at amongst the highest rates in the
world, imposing a variety of sector specific taxation in addition to corporate tax and value added or sales
tax. Mobile taxation represents a barrier to consumers’ access to telecom services, a key problem in Africa,
where mobile penetration stands at 60%, the lowest global penetration level.
7.4 Maghreb and Middle East
In Maghreb and Middle East, the countries with highest taxation as a proportion of TCMO Jordan and
Morocco, as shown in Figure 42.
Jordan ranks as the highest in the Middle Eastern region with tax as a proportion of TCMO of 23%. This is
due to an airtime excise of 8% in addition to a VAT of 16%. Similarly in Morocco, VAT is 20% and custom
duty on imported handset is 2.5%. Other countries in the region show relatively low mobile taxation
compared to the global average, however in Egypt mobile services attract a special VAT, 5% higher than
other goods and services and 10% higher fixed telephony services. Mauritania and Iran have the highest
handset tax due to high custom duties on imported handsets, as shown in Figure 44.
46.99%
30.00%
30.00%
30.00%
30.00%
30.00%
26.50%
25.00%
21.00%
20.00%
20.00%
12.00%
10.00%
10.00%
10.00%
10.00%
9.00%
7.50%
5.00%
2.25%
0% 5% 10% 15% 20% 25% 30% 35% 40% 45% 50%
Niger
Cameroon
Congo B
Gabon
Guinea
Rwanda
Dem Rep. Congo
Madagascar
Cote d'Ivoire
Gambia The
Ghana
Ethiopia
Chad
Malawi
Tanzania
Zambia
Lesotho
Mozambique
Nigeria
Kenya

Global Mobile Tax Review 2011
© 2011 Deloitte LLP. 54
Figure 42 Tax as a share of TCMO in Maghreb and Middle East
Source: Deloitte Analysis
Figure 43 Tax as a share of TCMU in Maghreb and Middle East
Source: Deloitte Analysis
Figure 44 Tax as a proportion of handset cost in Middle East and Maghreb
Source: Deloitte Analysis
23.40%
20.04%
18.14%
18.00%
17.00%
15.54%
15.00%
14.65%
10.67%
6.20%
6.02%
0% 5% 10% 15% 20% 25%
Jordan
Morocco
Global Average
Tunisia
Algeria
Mauritania
Egypt Arab Rep.
Regional Average
Syrian Arab Republic
Iran Islamic Rep.
Yemen
24.00%
20.00%
18.00%
17.97%
17.00%
15.00%
15.00%
13.94%
10.00%
5.00%
1.50%
0% 5% 10% 15% 20% 25%
Jordan
Morocco
Tunisia
Global Average
Algeria
Mauritania
Egypt Arab Rep.
Regional Average
Syrian Arab Republic
Yemen
Iran Islamic Rep.
35.00%
26.50%
23.29%
22.50%
20.56%
20.00%
18.00%
17.00%
16.00%
15.00%
15.00%
0% 5% 10% 15% 20% 25% 30% 35% 40%
Mauritania
Iran Islamic Rep.
Global Average
Morocco
Regional Average
Syrian Arab Republic
Tunisia
Algeria
Jordan
Yemen
Egypt Arab Rep.

Global Mobile Tax Review 2011
© 2011 Deloitte LLP. 55
7.5 Asia and Pacific
In Asia and Pacific, tax as a proportion of TCMO has increased from 12.19% in 2007 to 12.77% in 2011, as
indicated in Figure 27 above. The countries with highest taxation as a proportion of TCMO are Pakistan,
Bangladesh and Nepal, as shown in Figure 45. In all other Asian countries tax as a proportion of TCMO
ranked below the global average value.
Pakistan, as discussed above, imposes several special taxes on mobile services and handset. In Bangladesh, a
100 Taka special handset tax applies in addition to an 800 Taka connection tax. This is in addition to a 12%
custom duty on all imported handsets and a VAT rate of 15%. In Nepal, a 5% airtime excise applies.
Other high ranking countries within the region include Malaysia, where a 6% airtime excise applies, Sri
Lanka, where taxation as a proportion of usage is affected by a 20% usage tax (but here no VAT applies) and
Cambodia, where handset tax is higher than the global average due to a 15% custom duty on imported
handsets.
Figure 45 Tax as a share of TCMO in Asia and Pacific
Source: Deloitte Analysis
Figure 46 Tax as a share of TCMU in Asia and Pacific
Source: Deloitte Analysis
31.61%20.21%
18.41%18.14%
15.95%15.00%
12.77%12.50%12.43%12.26%
10.35%10.29%10.26%10.22%10.00%10.00%10.00%10.00%
7.10%3.30%
0% 5% 10% 15% 20% 25% 30% 35%
PakistanBangladesh
NepalGlobal Average
MalaysiaNew Zealand
Regional AverageSamoa
PhilippinesSri Lanka
IndiaLao PDR
CambodiaIndonesiaAustraliaVietnam
Papua New GuineaBhutan
ThailandChina
31.00%
20.00%
18.00%
17.97%
16.00%
15.00%
15.00%
12.77%
12.50%
12.00%
10.30%
10.00%
10.00%
10.00%
10.00%
10.00%
10.00%
10.00%
7.00%
3.00%
0% 5% 10% 15% 20% 25% 30% 35%
Pakistan
Sri Lanka
Nepal
Global Average
Malaysia
New Zealand
Bangladesh
Regional Average
Samoa
Philippines
India
Australia
Vietnam
Papua New Guinea
Lao PDR
Indonesia
Cambodia
Bhutan
Thailand
China

Global Mobile Tax Review 2011
© 2011 Deloitte LLP. 56
Figure 47 Tax as a proportion of handset cost in Asia and Pacific
Source: Deloitte Analysis
7.6 Latin America
In Latin America, tax as a proportion of TCMO has decreased from 18.74% in 2007 to 16.97% in 2011, as
indicated in Figure 27 above.
As illustrated in Figure 48 and Figure 49, the countries where taxation as a proportion of TCMO and TCMU
is above global average include the Dominican Republic, where an airtime excise of 12% on usage is imposed
in addition to a VAT of 16%; Brazil, where a custom duty of 16% applies on imported handsets in addition to
a VAT of 25%; Argentina, where a special tax on imported handsets of 25.21% applies in addition to a
custom duty of 16%; Peru, where a custom duty of 12% applies on imported handsets in addition to VAT of
19%; and Chile, where a custom duty of 6% applies on imported handsets in addition to a VAT of 19%.
In Trinidad, Ecuador and Venezuela high custom duties on imported handsets contribute to these countries
showing a higher than global average handset tax, as illustrated in Figure 50.
36.08%
33.75%
25.00%
23.29%
23.00%
22.00%
20.00%
17.50%
17.00%
16.66%
15.00%
13.56%
12.50%
12.50%
12.00%
10.00%
10.00%
10.00%
10.00%
0.00%
0% 5% 10% 15% 20% 25% 30% 35% 40%
Pakistan
Bangladesh
Cambodia
Global Average
Nepal
Philippines
Lao PDR
Indonesia
China
Regional Average
New Zealand
India
Samoa
Malaysia
Thailand
Australia
Vietnam
Papua New Guinea
Bhutan
Sri Lanka
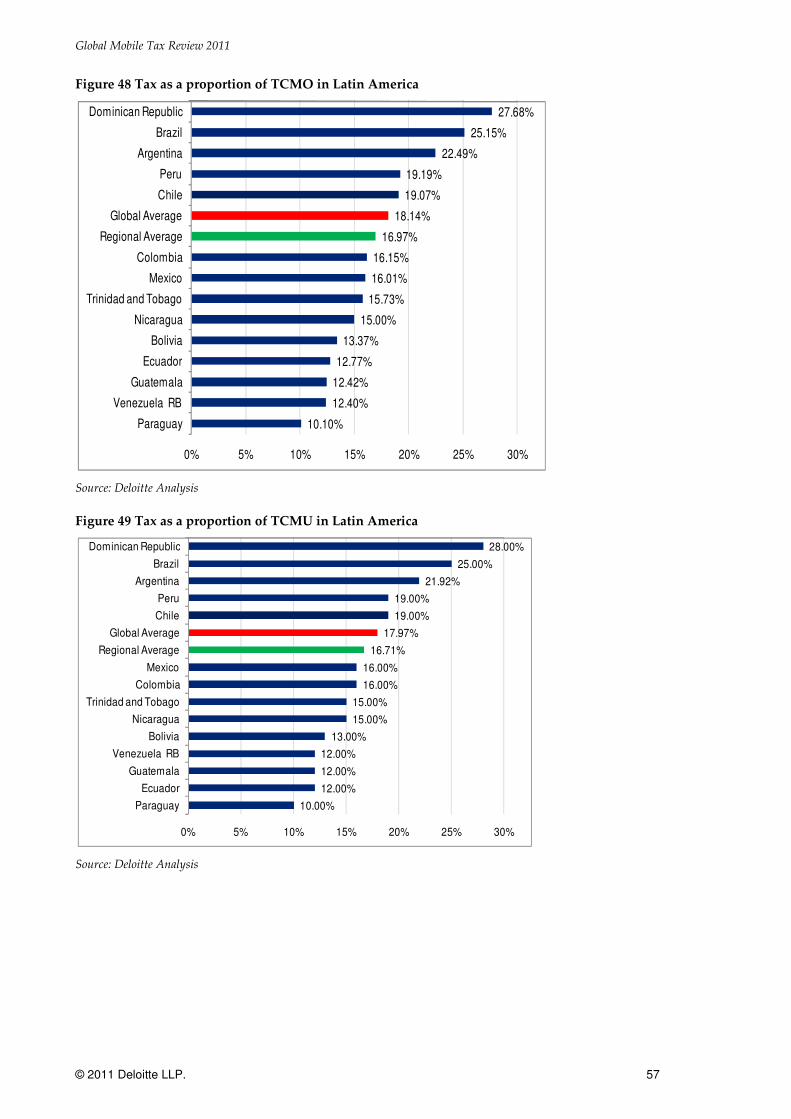
Global Mobile Tax Review 2011
© 2011 Deloitte LLP. 57
Figure 48 Tax as a proportion of TCMO in Latin America
Source: Deloitte Analysis
Figure 49 Tax as a proportion of TCMU in Latin America
Source: Deloitte Analysis
27.68%
25.15%
22.49%
19.19%
19.07%
18.14%
16.97%
16.15%
16.01%
15.73%
15.00%
13.37%
12.77%
12.42%
12.40%
10.10%
0% 5% 10% 15% 20% 25% 30%
Dominican Republic
Brazil
Argentina
Peru
Chile
Global Average
Regional Average
Colombia
Mexico
Trinidad and Tobago
Nicaragua
Bolivia
Ecuador
Guatemala
Venezuela RB
Paraguay
28.00%
25.00%
21.92%
19.00%
19.00%
17.97%
16.71%
16.00%
16.00%
15.00%
15.00%
13.00%
12.00%
12.00%
12.00%
10.00%
0% 5% 10% 15% 20% 25% 30%
Dominican Republic
Brazil
Argentina
Peru
Chile
Global Average
Regional Average
Mexico
Colombia
Trinidad and Tobago
Nicaragua
Bolivia
Venezuela RB
Guatemala
Ecuador
Paraguay

Global Mobile Tax Review 2011
© 2011 Deloitte LLP. 58
Figure 50 Tax as a proportion of handset cost in Latin America
Source: Deloitte Analysis
62.21%
41.00%
35.00%
32.00%
31.00%
27.00%
26.98%
25.00%
23.29%
23.00%
22.20%
19.50%
16.80%
16.00%
15.00%
12.00%
0% 10% 20% 30% 40% 50% 60%
Argentina
Brazil
Trinidad and Tobago
Ecuador
Peru
Venezuela RB
Regional Average
Chile
Global Average
Bolivia
Colombia
Guatemala
Mexico
Dominican Republic
Nicaragua
Paraguay

Global Mobile Tax Review 2011
© 2011 Deloitte LLP. 59
8 Conclusions and implications
Governments have a major role to play in supporting mobile communications and wireless data
developments. In particular, taxation policies have a significant impact on the value that societies derive
from mobile telecom services as they affect the key factors that determine the success of telecom.
Mobile specific taxation may have a number of social and economic impacts, especially in developing
countries, where fixed line telephony is more limited:
• Specific taxation on usage, such as airtime taxes, can represent a significant obstacle to usage of
mobile services by the poorer sectors of the population, who could derive significant benefits from
being connected.
• Taxes on handsets are particularly inefficient as they increase the access barriers to consumption of
telecommunications services, especially in developing countries. Since handsets and smartphones
may represent the only access to wireless broadband in the developing world, handset taxes may
also lead to underconsumption of internet services.
• Unbalanced taxation profiles for related mobile services, where tax represents a much higher
proportion of handset costs than of mobile ownership and usage costs, may also give inefficient
buying incentives to consumers, and further limit access to mobile services.
• Therefore, increasing mobile-specific taxation may contribute to reducing the economic and social
benefits generated by mobile communications and risks endangering the development and uptake
of wireless data services.
• Conversely, removing mobile-specific taxation and imposing a balanced taxation profile for mobile
related services provides more efficient incentives to consumers for their consumption choices, and
can enhance the evolution from basic mobile consumption, such as access and usage, to more
advanced services driven by the potential of wireless data and internet through mobile devices.
• In addition to affecting consumers, high mobile-specific taxation negatively affects MNOs’
investment plans in at least two ways: MNOs are often forced by access taxation to provide
subsidies on connections and handsets, reducing scope for network investment; secondly, usage
taxes reduce sales volumes and margins.
This study has shown that, globally, the average level of consumer taxation as a proportion of mobile service
costs has risen since 2007. It also illustrates that usage as a service component of mobile phones remains
taxed heavily in developing countries and that taxation as a proportion of handset costs in developing
markets is higher than other related mobile services, leading to unbalanced taxation profiles within the
mobile bundle.
Despite the negative effects of mobile specific taxation, tax as a proportion of mobile communications
remains high, especially in developing countries. MNOs are often seen amongst the most tax-compliant
companies and become an easy target for taxation, especially in times of financial distress such as the recent
financial crisis.

Global Mobile Tax Review 2011
© 2011 Deloitte LLP. 60
While in recent years mobile coverage has increased well over 80% of population in most developing
markets, penetration in poorer countries remains low, often as a result of high mobile-specific taxation on
connection services and on handsets. However, in times of high competition in mobile markets, where
mobile specific taxation was removed, e.g. in Kenya, penetration, handset volumes and usage have increased
notably. This may indicate that consumers, particularly in developing countries, are price sensitive in
relation to their uptake and usage.
Governments, particularly in developing countries, could consider focussing their mobile taxation strategies
to increase economic development rather than adopt policies that may create barriers to more people owning
and using a mobile phone.

Global Mobile Tax Review 2011
© 2011 Deloitte LLP. 61
Appendix A Methodology and assumptions
This appendix describes the methodology employed to calculate the proportion of taxes related to mobile
telephony usage paid by consumers in each of the countries in this study. This appendix also sets out the
approach taken to collate the tax information for each country, the other data sources used and the key
assumptions that were made in the study.
A.1 Methodology
The objective of this study is to measure the taxes paid by consumers as a proportion of ownership and
usage costs of mobile services. This approach has sought to identify the TCMO, the TCMU and the handsets
costs and to measure taxes paid as a proportion of each of these elements.
To do so, this approach has considered the two main types of mobile services available to consumers: pre
paid services, whereby users purchase mobile services on a “pay as you go” basis by paying for an
allowance of minutes/SMS upfront on a prepaid card; and post pay services, whereby consumers receive
monthly bills in arrears from their mobile operator for the use of mobile services.
This work considers, for each country, the usage and price patterns for both types of services, and a country
average was obtained by considering the relative penetration of post-pay and pre-pay services.
The total cost to an average consumer of owning and using a mobile can be defined using the concept of the
TCMO and the TCMU. These components include the handset cost, connection costs, rental costs and call
and SMS usage costs. The TCMO should also include internet data usage, in particular in developed
markets. However, we were not able to obtain sufficient data for internet usage and prices, in particular for
developing countries where little internet data usage is available. Internet usage was therefore not included
in this study.
The TCMO consists of all price components associated with owning a mobile phone and purchasing mobile
phone services. These cost components include:
• Handset cost: this relates to the cost of the mobile device required to make and receive calls. These
are assumed to have a three year lifetime and are replaced at the end of that lifetime. The handset
cost is therefore spread across the three years equally. For developed countries, the handset lifetime
is assumed to be two years as this is the type of structure that is emerging in these countries as a
result of handset proliferation and contracts.
• Connection cost: this component relates to the cost of connecting to the MNOs’ network to obtain
mobile services. For pre pay customers, this usually consists of an initial start up cost on activating
the SIM card. The connection fee is assumed to mimic the lifetime of the handset and that is spread
across the three years equally. This assumption may under reflect the churn in developing countries
with a high pre pay market share although there is limited basis for an alternative assumption. For
post pay consumers in developed countries, this is spread across two years as per handsets.
• Rental costs: this applies to post-pay mobile users only, whereby contract customers pay a monthly
rental for being able to connect to the mobile network. Rental prices were provided as monthly
prices and were therefore multiplied by 12 to obtain annual figures.

Global Mobile Tax Review 2011
© 2011 Deloitte LLP. 62
• Call and SMS usage rates: the price of making calls and sending SMS messages, expressed as a price
per minute and price per SMS respectively. These may vary between post pay and pre paid
customers.
TCMU is a similar measure to TCMO, however it does not include the handset and connection cost.
In summary, this model calculated the TCMO as follows:
TCMUnCnHTCMO ++= )/()/(
)price*SMS(Monthly *12price)*minutes(Monthly *12RentalMonthly *12 ++=TCMU
Where:
TCMO Total Cost of Mobile Ownership
TCMU Total cost of mobile usage.
H Cost of handset. We assume handsets have an n year lifetime and are replaced at the end of that lifetime.
The handset cost is therefore spread across the n years equally14.
n Lifetime of handsets and connection. This was set at 2 years for developed countries and 3 years for
developing countries.
C Connection fee. We assume that the connection fee mimics the lifetime of the handset and that the
connection fee is spread across the n years equally.
Each of the cost components identified above includes the actual component price as well taxes paid by
consumers. These taxes can vary from standard consumer taxes such as VAT, GST and custom duty, to
include telecom or mobile-specific taxes and include:
• VAT or GST: these are consumer taxes incurred when purchasing every component of owning and
using a mobile phone. These taxes are often expressed as a proportion of the value of the good or
service.
• Custom duty and excise taxes on imported goods. In mobile telephony, users in developing
countries typically pay import taxes on handsets and other mobile devices. These can either
expressed as a proportion of the handset value or as a fixed sum or both.
• Other telecoms specific taxes: as discussed in the main body of this report, a number of countries still
impose specific taxes on consumers for using mobile services. These can include luxury item duties
on handsets, SIM activation taxes or other taxes on connection, special communication taxes on
14
This analysis does not consider the impact of the black market due to a lack of available data. Discussions with handset vendors suggest that a significant proportion of new handsets come from black market sources, suggesting that this estimate would provide a potential overstatement of the total impact on handset sales. For example, in many African countries with import taxes black market handsets are regarded as the norm by MNOs. However, no reliable data was available on this issue.
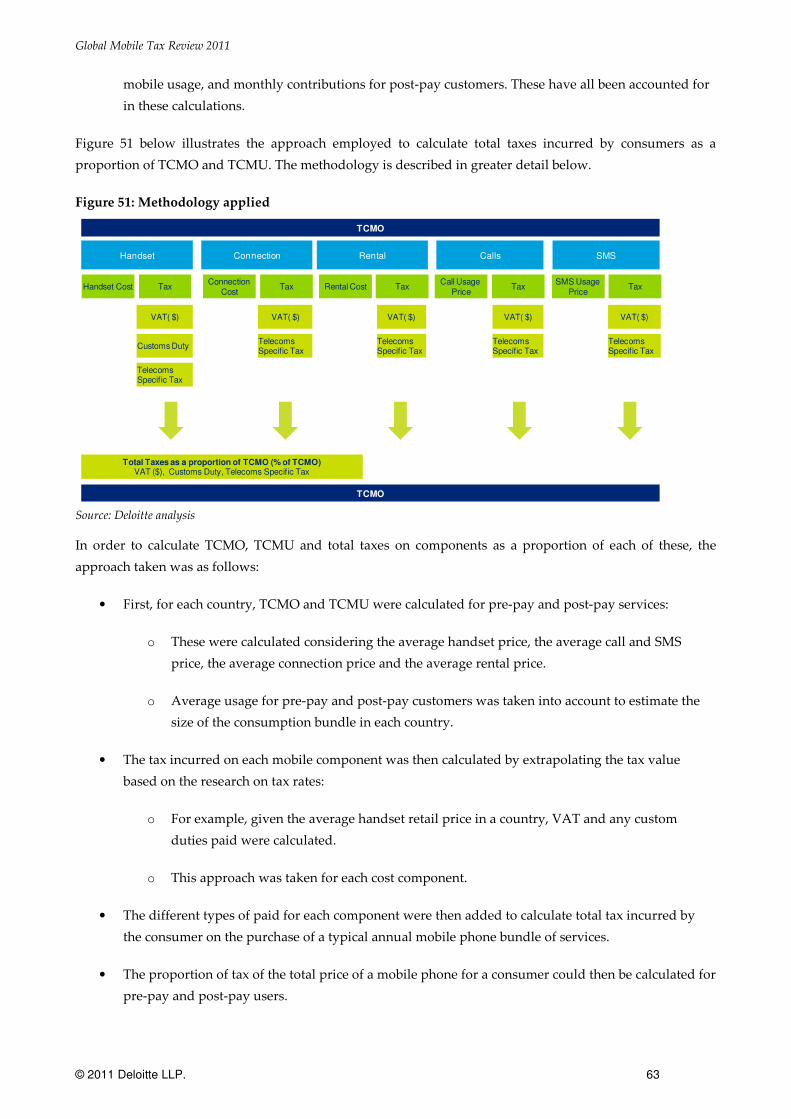
Global Mobile Tax Review 2011
© 2011 Deloitte LLP. 63
mobile usage, and monthly contributions for post-pay customers. These have all been accounted for
in these calculations.
Figure 51 below illustrates the approach employed to calculate total taxes incurred by consumers as a
proportion of TCMO and TCMU. The methodology is described in greater detail below.
Figure 51: Methodology applied
Source: Deloitte analysis
In order to calculate TCMO, TCMU and total taxes on components as a proportion of each of these, the
approach taken was as follows:
• First, for each country, TCMO and TCMU were calculated for pre-pay and post-pay services:
o These were calculated considering the average handset price, the average call and SMS
price, the average connection price and the average rental price.
o Average usage for pre-pay and post-pay customers was taken into account to estimate the
size of the consumption bundle in each country.
• The tax incurred on each mobile component was then calculated by extrapolating the tax value
based on the research on tax rates:
o For example, given the average handset retail price in a country, VAT and any custom
duties paid were calculated.
o This approach was taken for each cost component.
• The different types of paid for each component were then added to calculate total tax incurred by
the consumer on the purchase of a typical annual mobile phone bundle of services.
• The proportion of tax of the total price of a mobile phone for a consumer could then be calculated for
pre-pay and post-pay users.
TCMO
Handset Connection Rental Calls SMS
Handset Cost TaxConnection
CostTax Rental Cost Tax
Call Usage Price
TaxSMS Usage
PriceTax
VAT( $)
Customs Duty
VAT( $) VAT( $) VAT( $)
Telecoms Specific Tax
Telecoms Specific Tax
Telecoms Specific Tax
Telecoms Specific Tax
Telecoms Specific Tax
VAT( $)
Total Taxes as a proportion of TCMO (% of TCMO)VAT ($), Customs Duty, Telecoms Specific Tax
TCMO
Global Mobile Tax Review 2011
© 2011 Deloitte LLP. 64
• A weighted average of the two user categories was then calculated, using penetration rates in each
respective country as the weighting to calculate an overall TCMO and TCMU.
• A total country figure for taxes and a proportion of TCMO and TCMO was finally calculated.
A.2 Data Sources and Assumptions
This section of the methodology describes the data used as inputs for the study for each of the TCMO
components and the additional assumptions applied to these inputs.
For handset retail prices, average handset market prices for developing countries were taken from the
Nokia Index, and provided by Nokia. 2010/11 prices were provided for the majority of developing countries.
However, in a few instances, 2010/11 data was unavailable and 2009/10 prices were used as previously
provided by Nokia. For developed countries, handset price data was obtained from a detailed Deloitte
global survey entitled “Addicted to connectivity: perspectives on the global mobile consumer” carried out
for the GSMA Mobile World Congress. One of the outputs of the survey is an estimation of the market share
of the main handset brands in a set of developed markets. This data was combined with handset Average
Selling Price data for the main handset types and brands provided by Enders Analysis. All handset prices
were calibrated to represent a market average handset price excluding taxes.
Prices for other components (connection, rental, and call and SMS usage rates) were provided by Tariff
Consultancy Ltd. According to their methodology statement, all final prices are post-tax retail prices,
promotions have not been taken into account and the two main MNOs in each of the countries covered have
been selected for the relevant data. Deloitte has not verified the accuracy of this data.
Call and SMS volumes and penetration rates were obtained from the Wireless Intelligence Unit. Where
data was missing for some countries, regional average figures for the region in which the country is located
were used. Deloitte has not verified the accuracy of this data.
For taxes, a range of data sources were consulted:
• Deloitte international tax database: the Deloitte database includes information obtained from the tax
department on the general tax practices of foreign countries, many of which were included in this
study.
• Local Deloitte offices: local Deloitte offices were contacted to obtain specialist input and verification
of certain tax data collected.
• Additional desktop based search was required to collect custom duty rates. This included verifying
data on Budde reports, Forrester and Gartner.
• GSMA and MNOs: all tax data collated has been verified by the MNOs participating in the GSMA
study.
The tax values applied to each country are shown in Table 3. These reflect research undertaken in June 2011
and variations occurred since then may not be included.
Table 3 Tax rates applying to mobile telephony in each country

Global Mobile Tax Review 2011
© 2011 Deloitte LLP. 65
Countries VAT on mobile
services
Custom Duty on
imported handsets
Mobile Specific Tax Corporation
Tax Handset Connection Usage
Albania 20.00% - - - - 10.00%
Algeria 17.00% - - - - 25.00%
Angola 10.00% - - - - 35.00%
Argentina 21.00% 16.00% 25.21% -
12.90% on post
paid rental
only, no tax on
other usage
35.00%
Australia 10.00% - - - - 30.00%
Austria 20.00% - - - - 25.00%
Azerbaijan 18.00% 15.00% - - - 20.00%
Bangladesh 15.00% 12.00% $1.38 $11.03 - 40.00%
Belgium 21.00% - - - - 33.99%
Bhutan 10.00% - - - - 30.00%
Bolivia 13.00% 10.00% - - - 25.00%
Botswana 10.00% - - - - 15.00%
Brazil 25.00% 16.00% - - - 25.00%
Bulgaria 20.00% - - - - 10.00%
Burkina
Faso
18.00%
(excluding on
handsets)
- 14.50% - - 30.00%
Cambodia 10.00% 15.00% - - - 20.00%
Cameroon 19.25% 30.00% - - - 38.50%
Chad 18.00% 10.00% 9.60% - - 40.00%
Chile 19.00% 6.00% - - - 17.00%
China 3.00% - - - - 25.00%
Colombia 16.00% 5.00% 1.20% - - 33.00%
Congo B 18.90% 30.00% - - - 38.00%
Cote
d'Ivoire 18.00% 21.00% - - - 25.00%
Croatia 23.00% - - - 6.00% 20.00%
Cyprus 15.00% - - - - 10.00%
Czech
Republic 20.00% - - - - 19.00%
Dem Rep.
Congo 18.00% 26.50% - - 10.00% 40.00%
Denmark 25.00% - - - - 25.00%
Dominican
Republic 16.00% - - - 12.00% 25.00%
Ecuador 12.00% 20.00% - - - 25.00%
Egypt
15.00%
(Standard VAT
is 10%)
- - - - 20.00%
Estonia 20.00% - - - - 21.00%
Ethiopia 15.00% 12.00% - - - 30.00%
Finland 23.00% - - - - 26.00%
France 19.60% - - - - 33.00%
Gabon 18.00% 30.00% $5.00 - 18.00% 35.00%
Gambia 10.00% 20.00% - - - 35.00%
Georgia 18.00% 12.00% - - - 15.00%

Global Mobile Tax Review 2011
© 2011 Deloitte LLP. 66
Countries VAT on mobile
services
Custom Duty on
imported handsets
Mobile Specific Tax Corporation
Tax Handset Connection Usage
Germany 19.00% - - - - 33.30%
Ghana 15.00% 20.00% - - 6.00% 25.00%
Greece 19.00% - - - 12.00% 24.00%
Guatemala 12.00% 7.50% - - - 5.00%
Guinea 18.00% 30.00% - - - 35.00%
Hungary 25.00% - - - - 20.00%
India 10.30% 1.06% - - - 31.50%
Indonesia 10.00% 7.50% - - - 25.00%
Iran 1.50% 25.00% - - - 25.00%
Ireland 21.00% - - - - 12.50%
Italy 20.00% - $0.64 on
smartphones -
$12.91 on post
paid rental
only, no tax on
other usage
31.40%
Jordan 16.00% - - - 8.00% 15.00%
Kazakhstan 12.00% - - - - 20.00%
Kenya
16.00%
(excluding on
handsets)
2.25% - - 10.00% 30.00%
Lao PDR 10.00% 10.00%
- - 35.00%
Latvia 21.00% - - - - 15.00%
Lesotho 5.00% 9.00% - - - 10.00%
Lithuania 21.00% - - - - 15.00%
Luxembour
g 15.00% - - - - 21.84%
Madagascar 20.00% 25.00% 1.00% - 7.00% 23.00%
Malawi 16.50% 10.00% - - - 30.00%
Malaysia 10.00% 2.50% - - 6.00% 25.00%
Malta 18.00% - - - - 35.00%
Mauritania 15.00% 20.00% - - - 15.00%
Mauritius 15.00% - - - - 15.00%
Mexico 16.00% 0.80% - - - 30.00%
Montenegro 17.00% - - - - 9.00%
Morocco 20.00% 2.50% - - - 30.00%
Mozambiqu
e 17.00% 7.50% - - - 32.00%
Nepal 13.00% 10.00% - - 5.00% 25.00%
New
Zealand 15.00% - - - - 30.00%
Nicaragua 15.00% - - - - 30.00%
Niger 19.00% 46.99% - $0.54 3.00% 30.00%
Nigeria 5.00% 5.00% - - - 30.00%
Norway 25.00% - - - - 28.00%
Pakistan
19.50%
(Standard VAT
is 16%)
- $2.92 $2.92 11.50% 35.00%
Papua New
Guinea 10.00% - - - - 30.00%
Paraguay 10.00% 2.00% - - - 10.00%
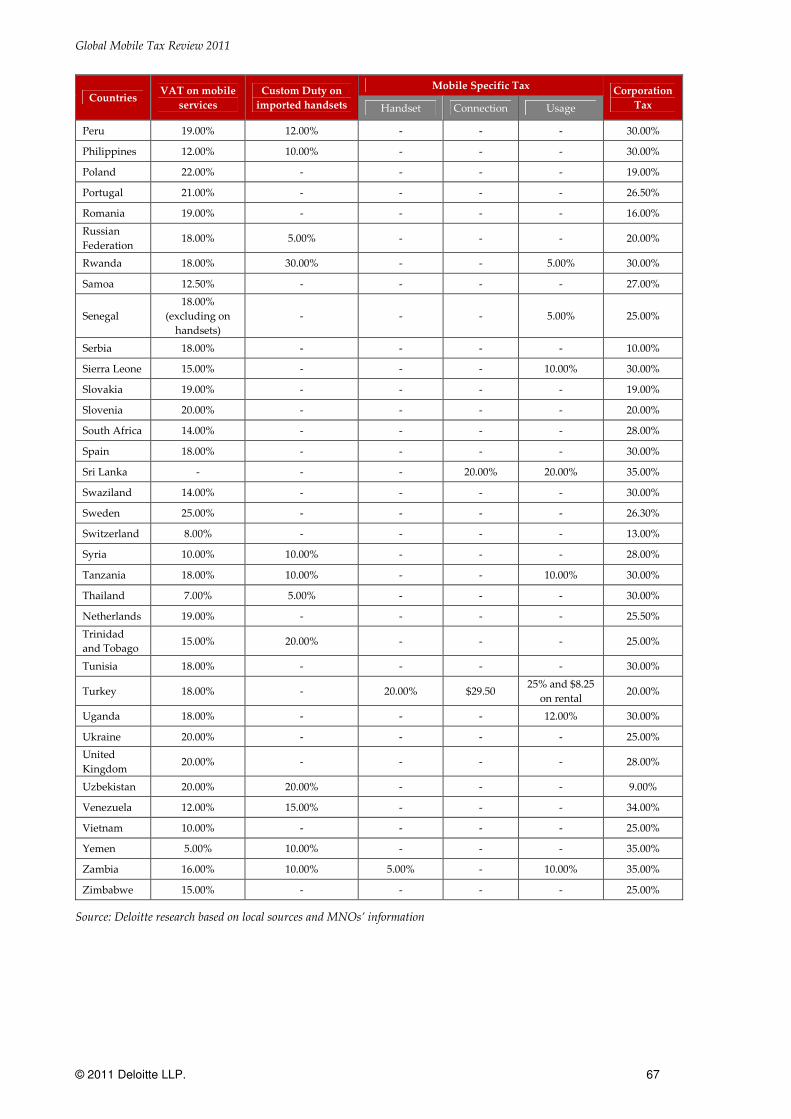
Global Mobile Tax Review 2011
© 2011 Deloitte LLP. 67
Countries VAT on mobile
services
Custom Duty on
imported handsets
Mobile Specific Tax Corporation
Tax Handset Connection Usage
Peru 19.00% 12.00% - - - 30.00%
Philippines 12.00% 10.00% - - - 30.00%
Poland 22.00% - - - - 19.00%
Portugal 21.00% - - - - 26.50%
Romania 19.00% - - - - 16.00%
Russian
Federation 18.00% 5.00% - - - 20.00%
Rwanda 18.00% 30.00% - - 5.00% 30.00%
Samoa 12.50% - - - - 27.00%
Senegal
18.00%
(excluding on
handsets)
- - - 5.00% 25.00%
Serbia 18.00% - - - - 10.00%
Sierra Leone 15.00% - - - 10.00% 30.00%
Slovakia 19.00% - - - - 19.00%
Slovenia 20.00% - - - - 20.00%
South Africa 14.00% - - - - 28.00%
Spain 18.00% - - - - 30.00%
Sri Lanka - - - 20.00% 20.00% 35.00%
Swaziland 14.00% - - - - 30.00%
Sweden 25.00% - - - - 26.30%
Switzerland 8.00% - - - - 13.00%
Syria 10.00% 10.00% - - - 28.00%
Tanzania 18.00% 10.00% - - 10.00% 30.00%
Thailand 7.00% 5.00% - - - 30.00%
Netherlands 19.00% - - - - 25.50%
Trinidad
and Tobago 15.00% 20.00% - - - 25.00%
Tunisia 18.00% - - - - 30.00%
Turkey 18.00% - 20.00% $29.50 25% and $8.25
on rental 20.00%
Uganda 18.00% - - - 12.00% 30.00%
Ukraine 20.00% - - - - 25.00%
United
Kingdom 20.00% - - - - 28.00%
Uzbekistan 20.00% 20.00% - - - 9.00%
Venezuela 12.00% 15.00% - - - 34.00%
Vietnam 10.00% - - - - 25.00%
Yemen 5.00% 10.00% - - - 35.00%
Zambia 16.00% 10.00% 5.00% - 10.00% 35.00%
Zimbabwe 15.00% - - - - 25.00%
Source: Deloitte research based on local sources and MNOs’ information
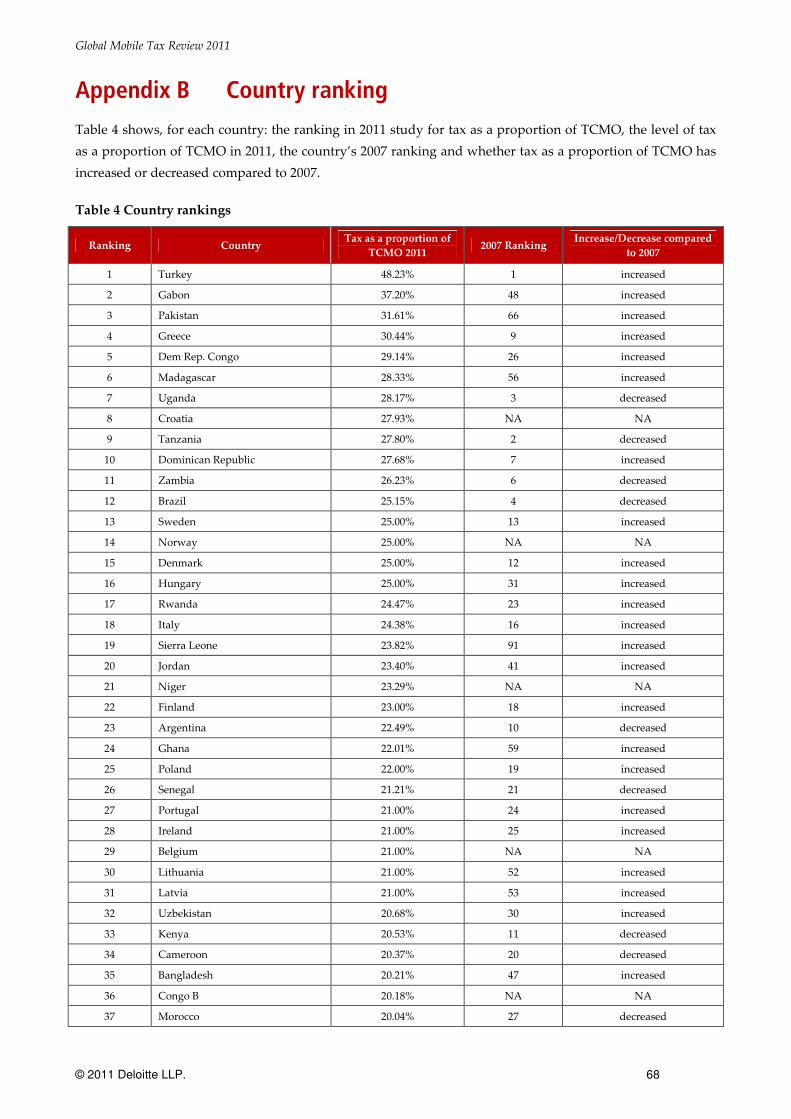
Global Mobile Tax Review 2011
© 2011 Deloitte LLP. 68
Appendix B Country ranking
Table 4 shows, for each country: the ranking in 2011 study for tax as a proportion of TCMO, the level of tax
as a proportion of TCMO in 2011, the country’s 2007 ranking and whether tax as a proportion of TCMO has
increased or decreased compared to 2007.
Table 4 Country rankings
Ranking Country Tax as a proportion of
TCMO 2011 2007 Ranking
Increase/Decrease compared
to 2007
1 Turkey 48.23% 1 increased
2 Gabon 37.20% 48 increased
3 Pakistan 31.61% 66 increased
4 Greece 30.44% 9 increased
5 Dem Rep. Congo 29.14% 26 increased
6 Madagascar 28.33% 56 increased
7 Uganda 28.17% 3 decreased
8 Croatia 27.93% NA NA
9 Tanzania 27.80% 2 decreased
10 Dominican Republic 27.68% 7 increased
11 Zambia 26.23% 6 decreased
12 Brazil 25.15% 4 decreased
13 Sweden 25.00% 13 increased
14 Norway 25.00% NA NA
15 Denmark 25.00% 12 increased
16 Hungary 25.00% 31 increased
17 Rwanda 24.47% 23 increased
18 Italy 24.38% 16 increased
19 Sierra Leone 23.82% 91 increased
20 Jordan 23.40% 41 increased
21 Niger 23.29% NA NA
22 Finland 23.00% 18 increased
23 Argentina 22.49% 10 decreased
24 Ghana 22.01% 59 increased
25 Poland 22.00% 19 increased
26 Senegal 21.21% 21 decreased
27 Portugal 21.00% 24 increased
28 Ireland 21.00% 25 increased
29 Belgium 21.00% NA NA
30 Lithuania 21.00% 52 increased
31 Latvia 21.00% 53 increased
32 Uzbekistan 20.68% 30 increased
33 Kenya 20.53% 11 decreased
34 Cameroon 20.37% 20 decreased
35 Bangladesh 20.21% 47 increased
36 Congo B 20.18% NA NA
37 Morocco 20.04% 27 decreased

Global Mobile Tax Review 2011
© 2011 Deloitte LLP. 69
Ranking Country Tax as a proportion of
TCMO 2011 2007 Ranking
Increase/Decrease compared
to 2007
38 United Kingdom 20.00% 58 increased
39 Austria 20.00% 32 increased
40 Ukraine 20.00% 5 decreased
41 Slovenia 20.00% 29 increased
42 Estonia 20.00% 55 increased
43 Czech Republic 20.00% 45 increased
44 Bulgaria 20.00% 33 increased
45 Albania 20.00% 44 increased
46 France 19.60% 35 increased
47 Peru 19.19% 39 increased
48 Chile 19.07% 38 decreased
49 The Netherlands 19.00% 49 increased
50 Germany 19.00% 65 increased
51 Slovakia 19.00% 46 increased
52 Romania 19.00% 43 increased
53 Cote d'Ivoire 18.90% 50 increased
54 Azerbaijan 18.89% 36 decreased
55 Russian Federation 18.76% 51 increased
56 Georgia 18.75% 37 decreased
57 Guinea 18.74% 42 decreased
58 Chad 18.59% 22 decreased
59 Nepal 18.41% 15 decreased
60 Tunisia 18.00% 57 increased
61 Spain 18.00% 63 increased
62 Serbia 18.00% NA NA
63 Malta 18.00% 54 increased
64 Burkina Faso 17.84% 40 decreased
65 Mozambique 17.58% 14 decreased
66 Algeria 17.00% NA NA
67 Montenegro 17.00% NA NA
68 Malawi 16.97% NA NA
69 Ethiopia 16.96% 64 increased
70 Colombia 16.15% 28 decreased
71 Mexico 16.01% 62 decreased
72 Malaysia 15.95% 96 increased
73 Trinidad and Tobago 15.73% 61 decreased
74 Mauritania 15.54% 78 increased
75 New Zealand 15.00% NA NA
76 Zimbabwe 15.00% 17 decreased
77 Mauritius 15.00% 68 increased
78 Egypt Arab Rep. 15.00% 75 increased
79 Nicaragua 15.00% 69 increased
80 Luxembourg 15.00% 70 increased
81 Cyprus 15.00% 74 increased
82 Swaziland 14.00% 100 increased
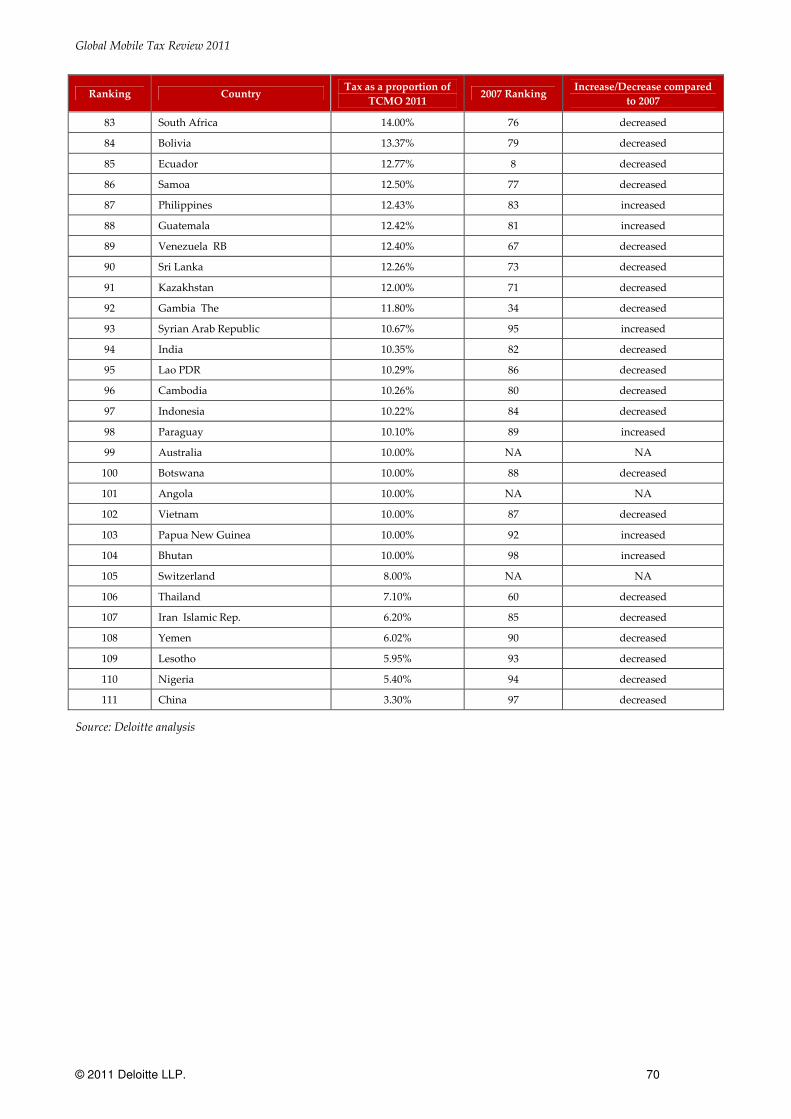
Global Mobile Tax Review 2011
© 2011 Deloitte LLP. 70
Ranking Country Tax as a proportion of
TCMO 2011 2007 Ranking
Increase/Decrease compared
to 2007
83 South Africa 14.00% 76 decreased
84 Bolivia 13.37% 79 decreased
85 Ecuador 12.77% 8 decreased
86 Samoa 12.50% 77 decreased
87 Philippines 12.43% 83 increased
88 Guatemala 12.42% 81 increased
89 Venezuela RB 12.40% 67 decreased
90 Sri Lanka 12.26% 73 decreased
91 Kazakhstan 12.00% 71 decreased
92 Gambia The 11.80% 34 decreased
93 Syrian Arab Republic 10.67% 95 increased
94 India 10.35% 82 decreased
95 Lao PDR 10.29% 86 decreased
96 Cambodia 10.26% 80 decreased
97 Indonesia 10.22% 84 decreased
98 Paraguay 10.10% 89 increased
99 Australia 10.00% NA NA
100 Botswana 10.00% 88 decreased
101 Angola 10.00% NA NA
102 Vietnam 10.00% 87 decreased
103 Papua New Guinea 10.00% 92 increased
104 Bhutan 10.00% 98 increased
105 Switzerland 8.00% NA NA
106 Thailand 7.10% 60 decreased
107 Iran Islamic Rep. 6.20% 85 decreased
108 Yemen 6.02% 90 decreased
109 Lesotho 5.95% 93 decreased
110 Nigeria 5.40% 94 decreased
111 China 3.30% 97 decreased
Source: Deloitte analysis

Global Mobile Tax Review 2011
© 2011 Deloitte LLP. 71
Appendix C Mobile specific charges applying to MNOs
Table 5 below describes in more detail the mobile-specific charges, including regulatory fees, spectrum fees,
licence fees, USF fees and other taxes incurred by MNOs in a number of selected countries in the panel. It
also discusses certain accounting procedures that MNOs have reported as particularly inefficient for their
business. Data in this table has been provided directly by MNOs.
Table 5: Other charges applying to MNOs
Country Charges
Australia • MNOs have reported that they are required to withhold tax in relation to Interest
and Royalty payments under the Pay-As-You-Go withholding regime
Argentina • A 0.5% tax is incurred by MNOs on revenues for regulatory tax purposes
Bangladesh • Separate corporate tax rate for telecommunications sector, being 10% higher than
the norm
• Mobile phone operator companies pay 45% corporation tax
• Publicly traded mobile operator companies pay a 35% corporation tax rate
• MNOs pay 5.5% of their revenue as tax, called “Revenue share tax”, which is used
by the government to pay for the lease of Bangladesh Railways’ fibre optic network
• MNOs have reported a number of unpredictable tax authority policies
• For example, MNOs have reported that bona fide business expenses are often
disallowed on an arbitrary basis
Burkina Faso • 2% of revenue paid as a universal service fee
• 1% of revenue is paid to the government in regulatory fees
• 0.5% of revenue is paid to the government’s Research and Training Fund
Cambodia • A 3% special tax applies on mobile operator revenue
Cameroon • Contribution to special telecommunications fund set at 3% of turnover
• Licence fee payable to the regulator stands at 1.5% of turnover
• MNOs have reported that often variations in licence fees are received without a
fore notice from the regulator
Chad • 3% of annual revenue paid as regulatory fees
Congo B. • 3% of domestic revenue paid as regulatory fees
• 6% of international revenue paid as regulatory fees
Democratic
Republic of Congo
• 2% of mobile operator revenue paid as an annual licence fee
• 2.4% of mobile operator revenue paid as an annual spectrum frequency fee
• 2% of mobile operator revenue paid as an annual numbering fee
• Airtime purchased by the customer is first booked on the deferred revenue account
and then accounted progressively in the revenue account when the consumption is
made
• This results in a distortion with other sectors for which ICA tax (equivalent to GST)
is calculated on the revenue account, while for telecoms companies it is based on
the deferred revenue account
• The tax authorities claim ICA on airtime discounts from both the MNOs and
indirectly also from the dealers
France • On 5 March 2009, France introduced a tax of 0.9% on electronic communication

Global Mobile Tax Review 2011
© 2011 Deloitte LLP. 72
Country Charges
service provider revenues, including telecom, mobile and internet service revenues
to fund public television following the cessation of advertising on those channels
Gabon • 0.5% of mobile operator revenue is paid towards Frequency and Spectrum fees
• 0.5% of mobile operator revenue is paid towards Numbering fees
• 2% of mobile operator revenue is paid towards Universal/Service Fees
• 2% of mobile operator revenue is paid towards Technology taxes
• 5% of mobile operator revenue paid as an annual licence fee
Ghana • As discussed above, MNOs by law are obliged to pay 2.5% of their revenues to the
government as a Health Insurance tax which is used by the government to fund
investment in and development of Ghana’s health services
• 2% of revenue is also paid in regulatory fees to the government
Greece • The Greek government is reported to be planning to impose a special levy on the
most profitable companies (which could include telecommunications companies)
for the next three years, worth € 1.8bn
• Licensing requires the involvement of 9 Public Authorities, relative to the rest of
Europe where licensing is fulfilled by only one to three Public Authorities. The
process in Greece is also lengthier, taking two years relative to an average of eight
months in the EU
Hungary • Hungary imposes a 4-6% tax on revenues of telecoms MNOs based on their
revenue size
• With regards to tax deductions following bad debt, a court decision is required to
obtain actual tax deductions. In the telecom sector bad debt may be significant, and
typically formed by many small unpaid bills. MNOs have complained that, to get a
court decision on each unsettled bill, is not realistic
• These rules, whilst not being telecommunication specific, are nevertheless not in
line with international best practice and distortionary to telecom businesses with
high volume of low payments
India • India’s levies on telecommunications services include a license fee of 6-10% of
annual gross revenue (depending on the license provided), and a spectrum charge
of 2-6% of annual revenue
• India’s regulator, TRAI, has recently recommended a uniform license fee of 6%
across all license categories, but this suggested reform has yet to be ratified by the
Indian government
Kenya • 0.5% of mobile operator revenue paid as regulatory fees
• 0.5% of mobile operator revenue paid as universal service fee to the government
Lesotho • Universal access fee is set at 1% of Net Operating Income
• This is expected to rise to 2%
New Zealand • The New Zealand government imposes a Telecommunications Service Obligation
(TSO) (formerly known as Kiwi Share) on all telecommunications companies
operating in New Zealand
• The levy is currently in the vicinity of NZD 70 million per annum
Nigeria • MNOs pay 0.14% of revenues in Frequency/Spectrum fee tax
• 0.15% of revenue is paid in Numbering fee tax by MNOs
• 0.04% of revenue is paid as a Technology tax or R&D contribution
• 2.9% of mobile operator revenue is paid as regulatory fees
Niger • 2% of revenue paid as regulatory fees to the government
• 4% of revenue paid as USO to the government
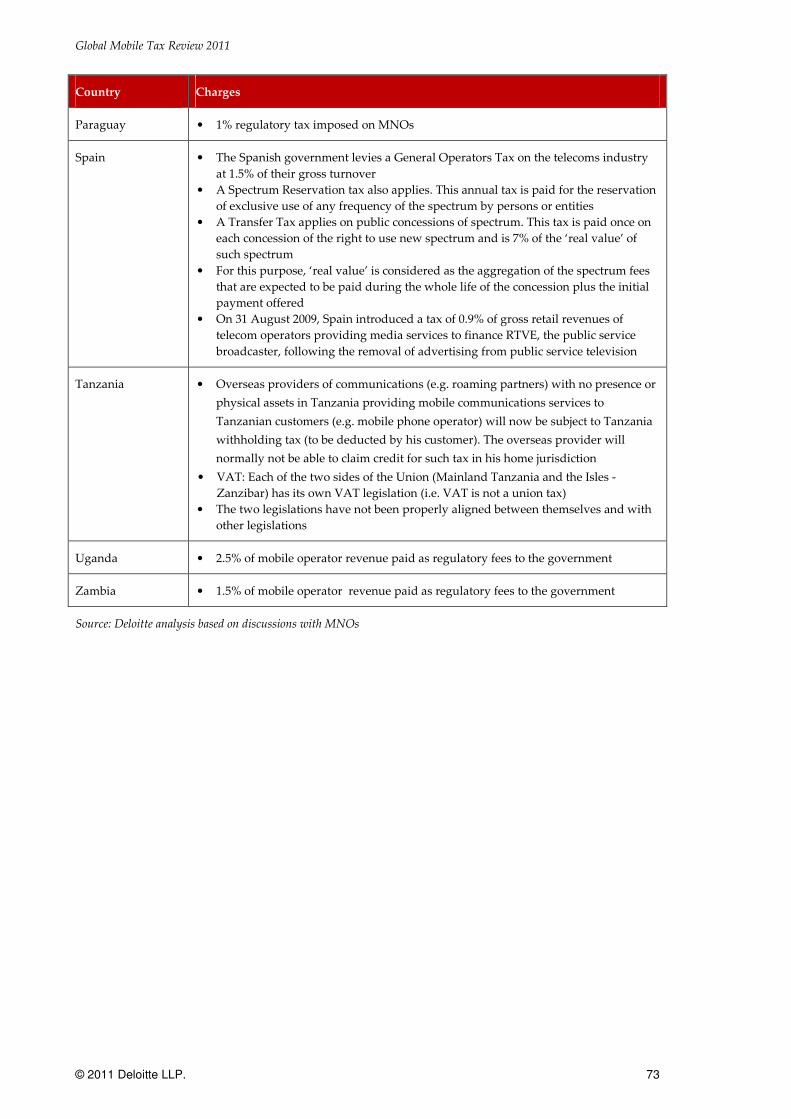
Global Mobile Tax Review 2011
© 2011 Deloitte LLP. 73
Country Charges
Paraguay • 1% regulatory tax imposed on MNOs
Spain • The Spanish government levies a General Operators Tax on the telecoms industry
at 1.5% of their gross turnover
• A Spectrum Reservation tax also applies. This annual tax is paid for the reservation
of exclusive use of any frequency of the spectrum by persons or entities
• A Transfer Tax applies on public concessions of spectrum. This tax is paid once on
each concession of the right to use new spectrum and is 7% of the ‘real value’ of
such spectrum
• For this purpose, ‘real value’ is considered as the aggregation of the spectrum fees
that are expected to be paid during the whole life of the concession plus the initial
payment offered
• On 31 August 2009, Spain introduced a tax of 0.9% of gross retail revenues of
telecom operators providing media services to finance RTVE, the public service
broadcaster, following the removal of advertising from public service television
Tanzania • Overseas providers of communications (e.g. roaming partners) with no presence or
physical assets in Tanzania providing mobile communications services to
Tanzanian customers (e.g. mobile phone operator) will now be subject to Tanzania
withholding tax (to be deducted by his customer). The overseas provider will
normally not be able to claim credit for such tax in his home jurisdiction
• VAT: Each of the two sides of the Union (Mainland Tanzania and the Isles -
Zanzibar) has its own VAT legislation (i.e. VAT is not a union tax)
• The two legislations have not been properly aligned between themselves and with
other legislations
Uganda • 2.5% of mobile operator revenue paid as regulatory fees to the government
Zambia • 1.5% of mobile operator revenue paid as regulatory fees to the government
Source: Deloitte analysis based on discussions with MNOs

Global Mobile Tax Review 2011
© 2011 Deloitte LLP. 74
List of Figures and Tables Figure 1 Tax as a proportion of TCMO ................................................................................................................................................. 6 Figure 2 Tax as proportion of TCMO, top five countries in the ranking ........................................................................................... 7 Figure 3 Countries where tax as a proportion of TCMO has increased since the 2007 study ........................................................ 8 Figure 4 Countries where tax as a proportion of TCMO has decreased since the 2007 study ........................................................ 9 Figure 5 Countries that impose an airtime excise .............................................................................................................................. 10 Figure 6 Countries where tax as a proportion of handset costs is above global average .......................................................... 11 Figure 7 Mobile specific taxation, excluding VAT ............................................................................................................................. 12 Figure 8 Taxes as a proportion of TCMO, TCMU and handset costs by region ............................................................................. 13 Figure 9 Tax as a proportion of TCMO across regions, comparison with 2007 survey ................................................................. 14 Figure 10 Methodology applied ........................................................................................................................................................... 19 Figure 11 Tax as a share of TCMO ....................................................................................................................................................... 21 Figure 12 Tax as proportion of TCMO with breakdown of service components, top five countries in the ranking ................. 23 Figure 13 Tax as proportion of the TCMO by service components .............................................................................................. 24 Figure 14 Countries where tax as a proportion of TCMO has increased since the 2007 study .................................................... 26 Figure 15 Countries where tax as a proportion of TCMO has decreased since the 2007 study .................................................... 27 Figure 16 Tax as a proportion of TCMU ............................................................................................................................................ 28 Figure 17 Countries imposing an airtime excise ................................................................................................................................ 29 Figure 18 VAT or GST levels ................................................................................................................................................................ 30 Figure 19 Tax as a proportion of handset cost .................................................................................................................................... 32 Figure 20 Countries imposing a duty on imported handsets ........................................................................................................... 33 Figure 21 Mobile specific taxation (including import duties on handsets) as a proportion of TCMO, excluding VAT ........... 35 Figure 22 Corporate tax rates by region .............................................................................................................................................. 39 Figure 23 Corporate tax applying to MNOs ....................................................................................................................................... 40 Figure 24 Penetration across regions ................................................................................................................................................... 42 Figure 25 Average TCMO values by region ($) .................................................................................................................................. 42 Figure 26 Tax as a proportion of TCMO, TCMU and handset costs across all regions ................................................................. 43 Figure 27 Tax as a proportion of TCMO across regions, comparison with 2007 survey ............................................................... 44 Figure 28 Tax as a proportion of TCMU across regions, comparison with 2007 survey ............................................................... 44 Figure 29 Tax as a proportion of handset cost across regions, comparison with 2007 survey ..................................................... 45 Figure 30 Tax as a share of TCMO in the EU ...................................................................................................................................... 46 Figure 31 Tax as a proportion of TCMU in the EU ............................................................................................................................ 46 Figure 32 Tax as a proportion of handset cost in the EU................................................................................................................... 47 Figure 33 Tax as a share of TCMO in C&E Europe ............................................................................................................................ 48 Figure 34 Tax as a share of TCMU in C&E Europe ............................................................................................................................ 48 Figure 35 Tax as a proportion of handset cost in C&E Europe......................................................................................................... 49 Figure 36 Tax as a proportion of TCMO in Africa ............................................................................................................................. 49 Figure 37 African countries where tax as a proportion of TCMO is above the global average level .......................................... 50 Figure 38 Tax as a proportion of TCMU in Africa ............................................................................................................................. 51 Figure 39 African countries where an airtime tax applies ................................................................................................................ 51 Figure 40 Tax as a proportion of handset cost in Africa .................................................................................................................... 52 Figure 41 African countries imposing a custom duty on imported handsets ................................................................................ 53 Figure 42 Tax as a share of TCMO in Maghreb and Middle East .................................................................................................... 54 Figure 43 Tax as a share of TCMU in Maghreb and Middle East .................................................................................................... 54 Figure 44 Tax as a proportion of handset cost in Middle East and Maghreb ................................................................................. 54 Figure 45 Tax as a share of TCMO in Asia and Pacific ...................................................................................................................... 55 Figure 46 Tax as a share of TCMU in Asia and Pacific ...................................................................................................................... 55 Figure 47 Tax as a proportion of handset cost in Asia and Pacific ................................................................................................... 56 Figure 48 Tax as a proportion of TCMO in Latin America ............................................................................................................... 57 Figure 49 Tax as a proportion of TCMU in Latin America ............................................................................................................... 57 Figure 50 Tax as a proportion of handset cost in Latin America ...................................................................................................... 58 Figure 51: Methodology applied .......................................................................................................................................................... 63
Table 1 Countries included in the study ............................................................................................................................................. 17 Table 2 Mobile specific taxes on consumers by country ................................................................................................................... 36 Table 3 Tax rates applying to mobile telephony in each country..................................................................................................... 64 Table 4 Country rankings ..................................................................................................................................................................... 68 Table 5: Other charges applying to MNOs ....................................................................................................................................... 71