GLOBAL SYNDICATED LOANS REVIEW - Thomson...
16
GLOBAL SYNDICATED LOANS REVIEW REUTERS / Carlo Allegri GLOBAL SYNDICATED LOANS REVIEW MANAGING UNDERWRITERS F llY 2014 Full Y ear 2014
Transcript of GLOBAL SYNDICATED LOANS REVIEW - Thomson...
GLOBAL SYNDICATED LOANS REVIEWREUTERS / Carlo Allegri
GLOBAL SYNDICATED LOANS REVIEWMANAGING UNDERWRITERS
F ll Y 2014Full Year 2014
9
8
9
9
9
Full Year 2014
MANAGING UNDERWRITERS
SYNDICATED LOANS REVIEW
Global Debt & Syndicated Loans (DL1) 2
European Leveraged Loans (P10) 8
Top Asia Syndicated Loans
EMEA Sponsored Loans (P13)
Asia Pacific (Excl. Japan) Syndicated Loans
Asia & Australia Deals Intelligence
EMEA Mandated Lead Arrangers (R19) 7
Asia Loans - Bookrunners (S5c)3
Global Scorecard 2
Global Loans Rankings - Last Ten Years
Table of Contents
Global Loans - Mandated Arrangers (R3)
Global Deals Intelligence
Top 10 Global Syndicated Loans
1
1Leading Underwriters for 2014
Asia Loans - Asian Currency (S3i)
Global Syndicated Loans
Global Loans - Bookrunners (R1) 1
2
2
9
13
Ranking Criteria Summary
11
4
Asia Loans - Mandated Arrangers (S5b)
EMEA Bookrunners (R17) 7
6
Americas Loans - Mandated Arrangers (R8c)
US Loans - Bookrunners (R11) 5
Americas Loans - Bookrunners (R7)
Latin America Loans - Mandated Lead Arrangers (R16)
Top EMEA Syndicated Loans 7
US Investment Grade Loans - Bookrunners (R11b)
North America Loans - Bookrunners (R9) 5
5
Top Australia Syndicated LoansTop Americas Syndicated Loans 4
6
Australia Loans - Bookrunners (S7)
Australia Loans - Mandated Arrangers (S6a)
Japan Deals Intelligence
Top Japan Syndicated Loans
Japan Loans - Bookrunners (S12b)
EMEA Deals Intelligence 7
Americas Deals Intelligence 4
US Leveraged Loans - Bookrunners (R11a)
Americas Syndicated Loans
EMEA Syndicated Loans
Japan Syndicated Loans
5
Thomson Reuters Solutions for the Deal Making Community
10
Syndicated Loans Criteria Summary 13
Regional Contacts
10
14
12
10
11
11
Japan Loans - Mandated Arrangers (S12a)
Full Year 2014
MANAGING UNDERWRITERS
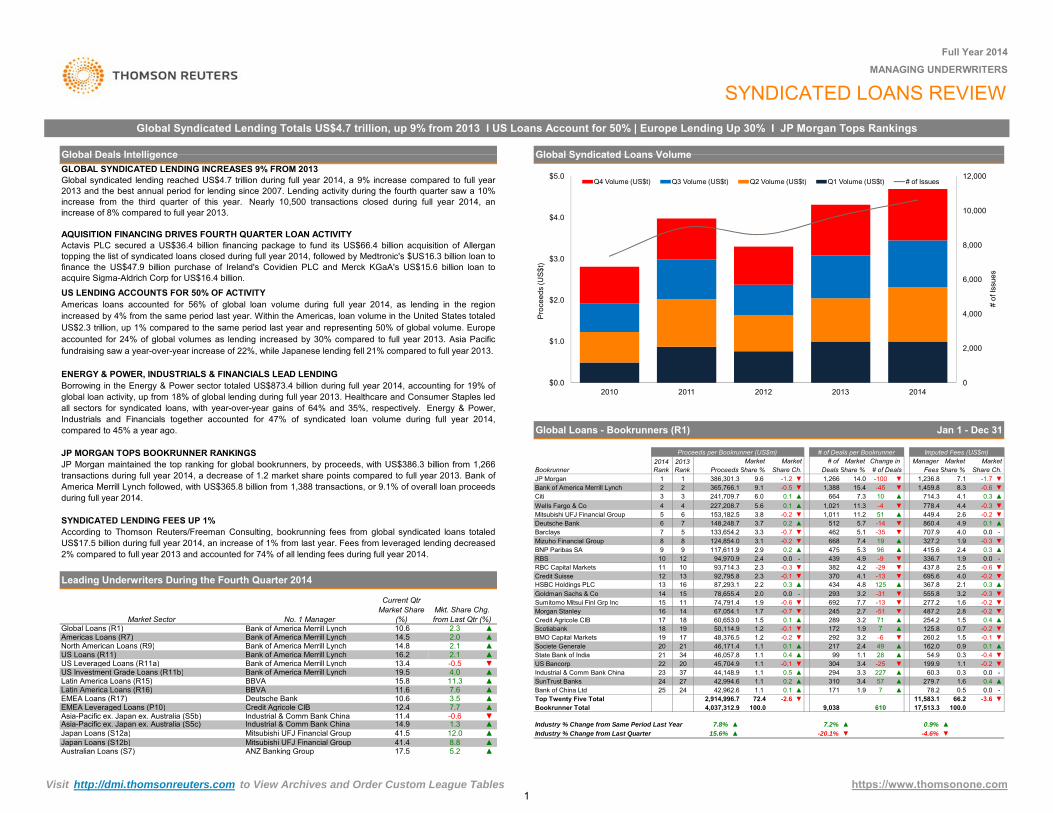
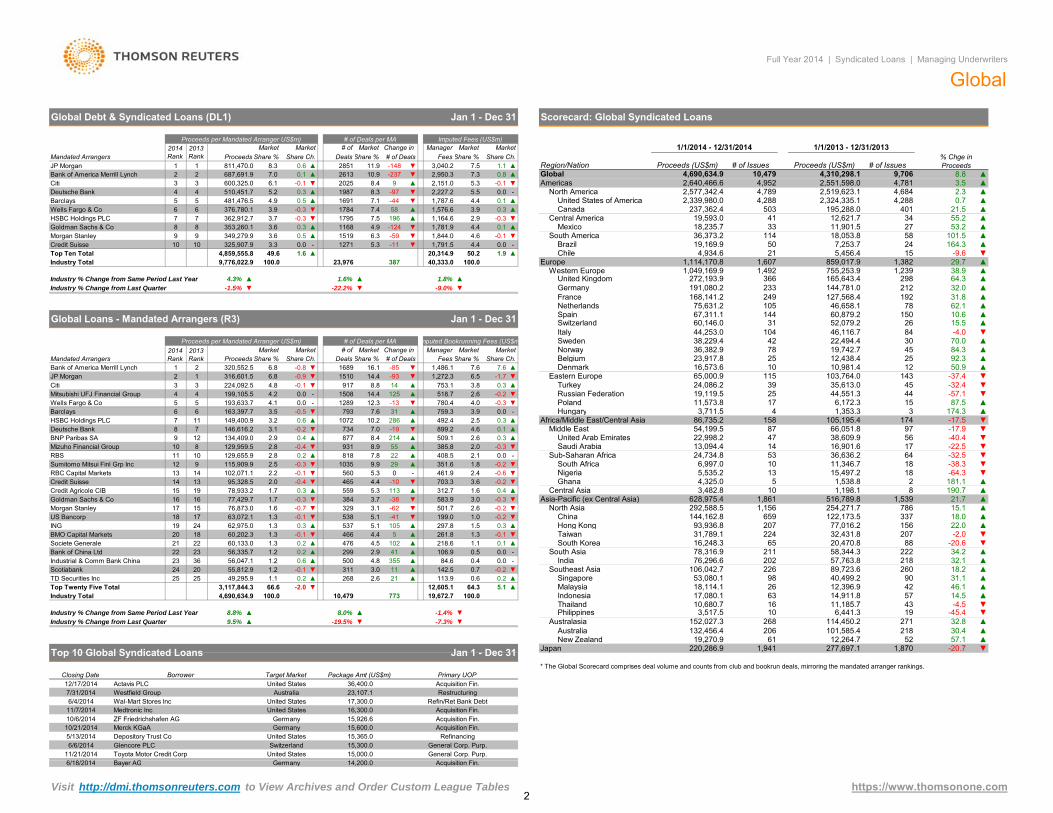
SYNDICATED LOANS REVIEWGlobal Syndicated Lending Totals US$4.7 trillion, up 9% from 2013 I US Loans Account for 50% | Europe Lending Up 30% I JP Morgan Tops Rankings
Global Syndicated Loans VolumeGlobal Deals Intelligence
US LENDING ACCOUNTS FOR 50% OF ACTIVITYAmericas loans accounted for 56% of global loan volume during full year 2014, as lending in the regionincreased by 4% from the same period last year. Within the Americas, loan volume in the United States totaledUS$2.3 trillion, up 1% compared to the same period last year and representing 50% of global volume. Europeaccounted for 24% of global volumes as lending increased by 30% compared to full year 2013. Asia Pacificfundraising saw a year-over-year increase of 22%, while Japanese lending fell 21% compared to full year 2013.
GLOBAL SYNDICATED LENDING INCREASES 9% FROM 2013Global syndicated lending reached US$4.7 trillion during full year 2014, a 9% increase compared to full year2013 and the best annual period for lending since 2007. Lending activity during the fourth quarter saw a 10%increase from the third quarter of this year. Nearly 10,500 transactions closed during full year 2014, anincrease of 8% compared to full year 2013.
AQUISITION FINANCING DRIVES FOURTH QUARTER LOAN ACTIVITYActavis PLC secured a US$36.4 billion financing package to fund its US$66.4 billion acquisition of Allergantopping the list of syndicated loans closed during full year 2014, followed by Medtronic's $US16.3 billion loan tofinance the US$47.9 billion purchase of Ireland's Covidien PLC and Merck KGaA's US$15.6 billion loan toacquire Sigma-Aldrich Corp for US$16.4 billion.
ENERGY & POWER, INDUSTRIALS & FINANCIALS LEAD LENDING0
2,000
4,000
6,000
8,000
10,000
12,000
$0 0
$1.0
$2.0
$3.0
$4.0
$5.0
# of
Issu
es
Pro
ceed
s (U
S$t
)
Q4 Volume (US$t) Q3 Volume (US$t) Q2 Volume (US$t) Q1 Volume (US$t) # of Issues
16.2
0.2▲ SunTrust Banks1.1
20
15.6% -20.1% ▼
14.5
5.2
-0.5 ▼4.0
11.610.6
14.8 ▲
11.3
2.32.02.12.1 ▲
-0.6
12.08.8
▲
10.6
78.27 ▲
▲
2,914,996.7Top Twenty Five Total
15.8
12.4 7.73.5
1.3
41.4
Industrial & Comm Bank China 44,148.9
25
1.11.1
72.4
37
7.6
22
▲
▲▲
State Bank of IndiaUS Bancorp
Industry % Change from Last Quarter
Societe Generale 20
▲▲
42,994.6
Industry % Change from Same Period Last Year
2423
Bank of China Ltd27
7.8%
Bookrunner Total 4,037,312.9▼
171
9,038
310
▼▲▲
-2.6
7.2% 0.9%
610
▲0.1
100.017,513.3
0.5▼
1.91.1
100.0
▲ -
1.1▼
24 42,962.6
343.4304
99-0.1
1.1
▲▼▼
3.2
292
11,583.1
▲
0.1
71
-0.2
0.4
294 2273.3
217
▲ 289
▲
2.7245
2.43.2
172
▼
▼-6
1.9
2849
▲-25
▲
279.757
7
-4.6%
▲
▲0.5 ▲
3.4
▲125.8254.2
▲▲▼
▼
-0.2
1.5
54.9▼-
▼
0.4
-0.4
▲▼
▲
▼-0.2
▼
▼
-0.2
-0.3
-0.11.5
2.8
0.7
0.3
1.6
0.1
60.3
-3.6
-0.2
260.2
555.8 3.2-0.2
-13
0.0
0.90.3
162.0
1.1
1.60.0
66.2
199.9
0.4
2.54.0695.6
437.8
2.1 0.3
-29 ▼▼
▼▼
▼▼
▲▼
-▲
-0.6
Share Ch.Fees# of Deals
Global Loans - Bookrunners (R1)
MarketImputed Fees (US$m)
Jan 1 - Dec 31
Proceeds per Bookrunner (US$m) # of Deals per Bookrunner2014 Rank Share Ch.Bookrunner Proceeds
2013 Rank Share %
MarketMarket Manager# of MarketMarket Change in
Bank of America Merrill Lynch
Mitsubishi UFJ Financial GroupDeutsche Bank
RBS
Credit Agricole CIB
BarclaysMizuho Financial Group
RBC Capital Markets
2 2 365,766.1
Share %Deals
1,388 ▼-45
Share %1,266JP Morgan 1 1 386,301.3 -100 ▼9.6 -1.2 ▼ 14.0 7.1 -1.71,236.8
0.37.31,459.8 -0.6
-0.311.3 -4 ▼ 4.4778.46.0 0.1 ▲
8.3664 10 ▲
15.4714.3 4.1
▲
▼Citi 3 3 241,709.7
5.6 0.1
9.1 -0.5
5 6 153,182.5148,248.7
Wells Fargo & Co 4 4 227,208.71,011 ▲ 449.411.23.8 -0.2 ▼ 511,021
-4.0 0.0
-0.2 ▼▲
2.60.15.73.7 0.26 7 -14 4.9512 ▼ 860.4▲
8 8 124,854.07 5 133,654.2
3.13.3 ▼ 462 ▼-0.7
-0.2-35
327.2 1.9 -0.30.3▲ 415.6
707.9
5.3 96▼
5.1▼668 7.4 19 ▲
11 10
BNP Paribas SA 9 9 117,611.9
382
7.7
4.910 12 94,970.9 2.493,714.3 ▼2.3
▼
3.2▲ 4.8434
370
439
293▼ 692
▲
-51
125-31
4.14.2
277.2▼
367.8
-13487.2
▼▼
1114
BMO Capital Markets 19Scotiabank
21
Sumitomo Mitsui Finl Grp Inc16
18
12HSBC Holdings PLC 16Credit Suisse
Morgan Stanley
Goldman Sachs & Co13
1514
48,376.5
1767,054.1
45,704.9
46,171.417
50,114.919
46,057.821
13
1.2
2.0
18 60,653.0
78,655.4
92,795.887,293.1
74,791.415
0.2
-0.3-0.12.3
-0.6
0.30.0
1.1
1.7 -0.70.1
-0.1
-
2.2
1.2
1.9-
1.5▼
0.0336.72.42.9
0.0 1.9-9 ▼▲ 475
▲
41.5
Current Qtr Market Share
(%)Mkt. Share Chg. from Last Qtr (%)
19.5
▲11.4
▲
Asia-Pacific ex. Japan ex. Australia (S5b)
Market SectorGlobal Loans (R1)Americas Loans (R7)North American Loans (R9)US Loans (R11)US Leveraged Loans (R11a)
Bank of America Merrill LynchBank of America Merrill Lynch
Latin America Loans (R15)
Asia-Pacific ex. Japan ex. Australia (S5c)
Latin America Loans (R16)EMEA Loans (R17)EMEA Leveraged Loans (P10)
Bank of America Merrill Lynch
Industrial & Comm Bank ChinaIndustrial & Comm Bank China
▲Mitsubishi UFJ Financial GroupANZ Banking Group
Leading Underwriters During the Fourth Quarter 2014
BBVABBVADeutsche BankCredit Agricole CIB
No. 1 ManagerBank of America Merrill Lynch
US Investment Grade Loans (R11b)
14.9
Japan Loans (S12b)Australian Loans (S7)
Mitsubishi UFJ Financial GroupJapan Loans (S12a)
17.5 ▲
Bank of America Merrill Lynch
Borrowing in the Energy & Power sector totaled US$873.4 billion during full year 2014, accounting for 19% ofglobal loan activity, up from 18% of global lending during full year 2013. Healthcare and Consumer Staples ledall sectors for syndicated loans, with year-over-year gains of 64% and 35%, respectively. Energy & Power,Industrials and Financials together accounted for 47% of syndicated loan volume during full year 2014,compared to 45% a year ago.
JP MORGAN TOPS BOOKRUNNER RANKINGSJP Morgan maintained the top ranking for global bookrunners, by proceeds, with US$386.3 billion from 1,266transactions during full year 2014, a decrease of 1.2 market share points compared to full year 2013. Bank ofAmerica Merrill Lynch followed, with US$365.8 billion from 1,388 transactions, or 9.1% of overall loan proceedsduring full year 2014.
SYNDICATED LENDING FEES UP 1%According to Thomson Reuters/Freeman Consulting, bookrunning fees from global syndicated loans totaledUS$17.5 billion during full year 2014, an increase of 1% from last year. Fees from leveraged lending decreased2% compared to full year 2013 and accounted for 74% of all lending fees during full year 2014.
Bank of America Merrill Lynch 13.4
0$0.02010 2011 2012 2013 2014
https://www.thomsonone.comVisit http://dmi.thomsonreuters.com to View Archives and Order Custom League Tables1
Switzerland
Netherlands
60,146.0
38,229.4104
78
65,000.9
44,253.0
103,764.0
France
United Kingdom
16,573.6
Spain
Norway
Global
▲
Brazil
1.1
50.2
Italy
-
Denmark23,917.8
Market
75,631.2
Belgium
Eastern Europe10
115
-1.5% ▼
6.8
-22.2%
16.1
# of
14.4-0.8
1320,552.5Proceeds
Bank of America Merrill LynchShare Ch.Mandated Arrangers
Market 36,382.9
-85
Western Europe
Sweden
-93
Market
100.0
150
12,438.4
2,577,342.4
237,362.4
25
31
Proceeds (US$m)
2,519,623.1
503
36,373.2
26
19,169.94,934.6
67,311.1
4,2884,789
23,976
Fees
▼
-9.0%
Market
387
1.6%
Industry Total
Industry % Change from Same Period Last Year
2014 Rank
Industry % Change from Last Quarter
2
4.3%
Global Loans - Mandated Arrangers (R3)
DealsMarket2013
Rank # of Deals
JP Morgan 2
4,859,555.8
1
49.6
Share % Share %
9,776,022.9
▲
-1.7
# of Deals per MA
1.9
▲
1,272.3
20,314.9
Manager
1.8%
0.1
40,333.0
▼
0.0
2,950.3
▼
Europe
Jan 1 - Dec 31
▼ 7.6 7.6
▼
Share % Share Ch.
6.5
mputed Bookrunning Fees (US$m
1,486.1
33
Germany 191,080.2272,193.9
168,141.2
▼Mexico▲
South America
1,049,169.9
North America
4.6
5.5
▲
0.3Central America
▲
▲4.4▼
Region/Nation
Full Year 2014 | Syndicated Loans | Managing Underwriters
-59 1,844.01,791.5
7.5
5.3
▲
3.9
6.3 -0.1
-44-0.0
▼
▼1,781.9
Share %
▲ 1,576.6
▼2,151.0
# of Deals Fees
2,227.2
GlobalAmericas
0.8 4,690,634.9
1/1/2014 - 12/31/2014Share Ch.
▲
2,640,466.6
42
144
114
233
1,607
366
249
2150
105
1,492
4,310,298.1
52,079.2
12,621.711,901.5
Proceeds (US$m)
4,952
41
10,981.4
19,742.7
2,339,980.0United States of America
1,114,170.8Chile
19,593.018,235.7
Canada
144,781.0
22,494.4
1/1/2013 - 12/31/2013
Scorecard: Global Syndicated Loans
4,684
25
14312
▲92.3
-37.4
84.3
▲▼
50.9
▼-4.0
▲15.5
1,382
3045
60,879.2
84
46,658.1
165,643.4
192
46,116.7
127,568.478
212
9,706# of Issues
1,239
18,053.8
859,017.9
4,781
5,456.4
# of Issues10,479
34
7,253.7
755,253.9
401
2,551,598.0
4,288
27
2,324,335.1
15
195,288.0
24
70.0
101.5
3.52.3
▲
▲
▲
▲
▲
21.5
▲
▲53.2
▲
55.2
0.7
▲
▲
▲
▲
-9.6 ▼▲▲
298
164.3
▲32.0
▲
▲64.338.929.7
62.131.8
10.6
▲
58
% Chge in Proceeds
8.8
Change in
-113.3 0.0 -
100.0
6.8
Credit Suisse 10 10 325,907.9Top Ten Total
0.5 ▲
1510-0.9316,601.5
1.6
Proceeds per Mandated Arranger US$m)
▲
▼
1689▼▼
Goldman Sachs & Co 8 8 353,260.1 3.6Morgan Stanley 9 9 349,279.9 3.6
1168-0.31,164.6 2.9
-1244.91795 7.5 ▲
4.4HSBC Holdings PLC 7 7 362,912.7 3.7 -0.3
Barclays 5Wells Fargo & Co 6 6 376,780.1 3.9 -0.3
1987 8.35.3 -0.1
5 481,476.5 4.9 0.51784 7.4
▼▲
1271
▼▲1,787.6 4.4 0.1
58196
▼
▲ 1691 7.1
1519
Citi 3
0.3
-97▼ 2025 8.4
Deutsche Bank 4 4 510,451.7 5.2 0.3 ▲▲ ▼
2613 10.9 -237 ▼ 7.3-148 ▼ 3,040.2
# ofMandated Arrangers
0.1 ▲93 600,325.0 6.1 -0.1
11.9Share %
Bank of America Merrill Lynch 2 2 687,691.9 7.0
Market2013 Rank
JP Morgan 1 1 811,470.0 8.3 0.6 ▲ 2851
Market Change in ManagerMarket Market Market
Global Debt & Syndicated Loans (DL1)
Imputed Fees (US$m)# of Deals per MA
Share Ch.Proceeds
Proceeds per Mandated Arranger US$m)
Jan 1 - Dec 31
Deals2014 Rank Share %
24,086.219,119.5
39Russian Federation
11,573.8
Turkey
Poland
268
22,998.2
224
659
Ghana
86,735.2
44,551.3
13,094.4
19,672.7
628,975.4
31,789.1
▼0.7
1,861
93,936.8
54,199.5Middle East
North Asia
Hong Kong
4,325.0
53,080.1Singapore18,114.1
Indonesia12,605.1
113.9 0.6 0.2
6/18/2014 B AG
United States
-1.4% ▼
Acquisition Fin.
14 200 0
15,365.0
10/6/2014
▲
1,941
47
Industry % Change from Last Quarter
24,734.8 53
13
Toyota Motor Credit Corp
277,697.1
6,441.3Australasia
61
10
12,264.7
United States
Depository Trust CoGermany
▼16,248.3
South Africa
1,156
77326
211▲
RefinancingSwitzerland
5/13/20146/6/2014
Acquisition Fin.
11/21/2014 15,000.0Glencore PLC
15,600.0
2517
4
12,396.9
89,723.6
516,789.8
20,470.8
561714
38,609.966,051.887 97
1,353.3105,195.4
6,172.3
174
15
931
4.1
3.2 1072
877▼
8.8
7.6163,397.7
14.4-0.0
-0.1
12.3793
12895
224,092.54.2
-0.12.2
0.6
199,105.5
▼2.0
-0.3
2.9
2.8
0.4-0.4
▲
-0.4
0.2
5.3 04.4
--10
1035560
9.9
0.3
465▲
▼-0.7
5590.3
537-0.1
-0.3
4.5 102▲
▲
2.9
▼
384▼
466
3.0
▲
500
476
2.6
4.841355
2111
-62
4.4105
8.9
5
5.3
3.1
7.8
158
22
703.3-0.6
-19▲
10,479
▲▲
214
408.5
▲
-0.0▲
0.355
899.2
2.6
1.8
▼113 312.7
-0.2
Top Twenty Five Total
0.20.2
15
329-381.7
▼
Bank of China Ltd 23 1.2
18
1.2
1.3
TD Securities Inc
36
25
1.3 -0.1
20
100.0-2.00.2
0.656,047.1
4,690,634.9
▼
▼▲
22
66.6
60,133.0
1.3
▲
23
49,295.9
8.8%
3,117,844.3
19
25 268
917
▲
299
818
▼
311
▼▲
2.6
1.2
29
583.9▲
5.1
753.1▲
1.7
1.3
5.1
1.1-0.1
2.8
4.8
-0.2
-
63,072.1
13
109
13 95,328.578,933.2
76,873.0
129,655.9
134,409.0
149,400.98
12
7
8
11
129,959.5
7
115,909.9
Citi 34 4
3
HSBC Holdings PLC
Mitsubishi UFJ Financial Group
6 6Wells Fargo & Co
102,071.114
ING 24
19
Industry Total
14
62,975.0
16Goldman Sachs & Co
Credit Suisse
BMO Capital Markets
Closing Date
Westfield Group
Top 10 Global Syndicated Loans
77,429.716Morgan Stanley 17
1718
21
US Bancorp
Deutsche Bank
Mizuho Financial Group
Sumitomo Mitsui Finl Grp Inc
BNP Paribas SA
20
11
RBC Capital Markets
Scotiabank
9.5%Industry % Change from Same Period Last Year
ZF Friedrichshafen AG
60,202.3
11/7/2014
7/31/20146/4/2014
56,335.7Societe Generale
United StatesWal-Mart Stores Inc
10
Credit Agricole CIB
146,616.2
24
-0.5193,633.7
3.5
▼
12/17/2014
5
15
22Industrial & Comm Bank China
3.1
Target Market
55,812.9
Borrower
Barclays
▼
▲
3.0
1.5 0.3
3.7
538 -41
-0.30.4
▼
509.1 2.6
1.1
-0.2
0.1
-0.2
-0.2
1.0
▲
▼
▼▲
▲492.4
▼
▲ 518.7 -0.2
0.1
Taiwan
China297.8
▼
▼
385.8
Central Asia
▼2.4
199.0
0.310.2
1253.8
31286
-13
▲
▼
8.4
4.03.92.5
2.1
4.6
2.0
▲
▲
1.3▲
14
6,997.0
▲
▼
▼
▼
▼
Africa/Middle East/Central Asia
▲ United Arab Emirates
Nigeria
292,588.5
Malaysia
IndiaSouth Asia-
South Korea
Hungary
3,482.8
144,162.8
▲5.1
-
-0.3
-▲
▼
0.0
▲
100.0
501.7
3.6
106.984.6
0.5218.6
0.4
64.3
261.8
142.5 Southeast Asia-0.2
351.6
-0.1
1.6
461.9
▲0.00.0
-0.3759.3780.4
0.3 35,613.0
1,198.1
16,901.6
10
5
Saudi Arabia
Asia-Pacific (ex Central Asia)
Sub-Saharan Africa
3,711.5
76,296.6
11,346.736,636.2
65
15,497.25,535.2
44
122,173.5207
10
78,316.9
156
63
19,270.9
218
132,456.4
Acquisition Fin.
206
98
Japan 220,286.9
-7.3%
Medtronic Inc
Primary UOPActavis PLC
▼
United States
United States
10/21/2014 Merck KGaA
* The Global Scorecard comprises deal volume and counts from club and bookrun deals, mirroring the mandated arranger rankings.
▼▲8.0%
G
Australia
Package Amt (US$m)
-19.5%Australia
3,517.5Philippines152,027.3
New Zealand
Thailand 16
57,763.8106,042.7
17,080.1
202
11,185.7
226
10,680.7
90
58,344.3
207
40,499.2260
101,585.4
32,431.8
114,450.2
5742
14,911.8
77,016.2
1,538.8
254,271.7
2
1818
1,539
▲
43
▲
19
21852
32.8
-2.0-20.6
▲▲
-20.7
32.1
▼
30.4
-45.4-4.5
▼
57.1
3
45
786
1,870
271
8
-40.4
-38.3
31.1
22.0
88
-32.5
337
222
▼
21.7
▼
190.7
64
15.1
▼
181.1
14.5
▲
▼
▲
18.0
34.2
▲
▲
46.1
18.2
▼
▲
▲
▲
174.3
▼
-17.5
-32.4
▲
▼
-22.5
-64.3
-17.9▼▼
▼
▲
▲
▲
▼
▲
▲
87.5▼-57.1
Germany
▲
1.6
2.5RBS
129
1508
▲734
0.0
7.0
▼
Jan 1 - Dec 31
17,300.0 Refin/Ret Bank Debt
▼▲
General Corp. Purp.A i iti Fi
16,300.0
General Corp. Purp.
36,400.023,107.1
Acquisition Fin.Restructuring
15,926.6
15,300.0
6/18/2014 Bayer AG 14,200.0
Visit http://dmi.thomsonreuters.com to View Archives and Order Custom League Tables
Germany
https://www.thomsonone.com
Acquisition Fin.
2
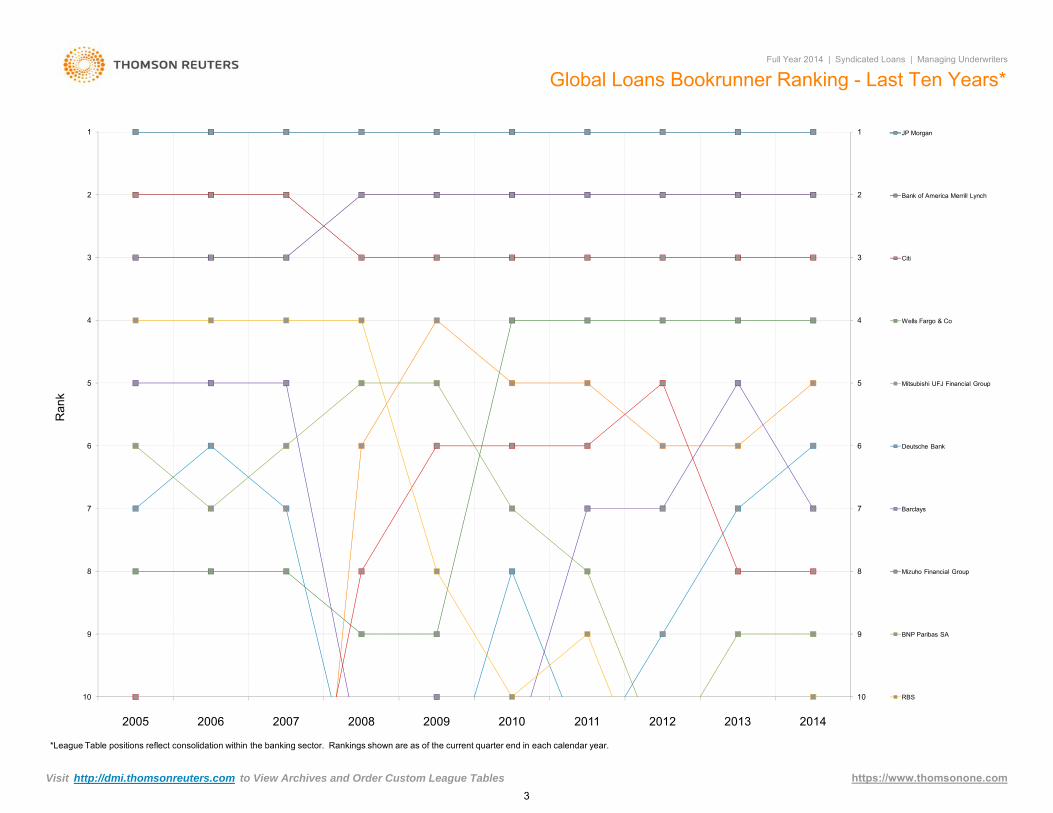
Global Loans Bookrunner Ranking - Last Ten Years*Full Year 2014 | Syndicated Loans | Managing Underwriters
1
2
3
4
5
1
2
3
4
5
JP Morgan
Bank of America Merrill Lynch
Citi
Wells Fargo & Co
5
6
7
8
9
10
5
6
7
8
9
10
2005 2006 2007 2008 2009 2010 2011 2012 2013 2014
Ran
k
Mitsubishi UFJ Financial Group
Deutsche Bank
Barclays
Mizuho Financial Group
BNP Paribas SA
RBS
*League Table positions reflect consolidation within the banking sector. Rankings shown are as of the current quarter end in each calendar year.
Visit http://dmi.thomsonreuters.com to View Archives and Order Custom League Tables https://www.thomsonone.com3
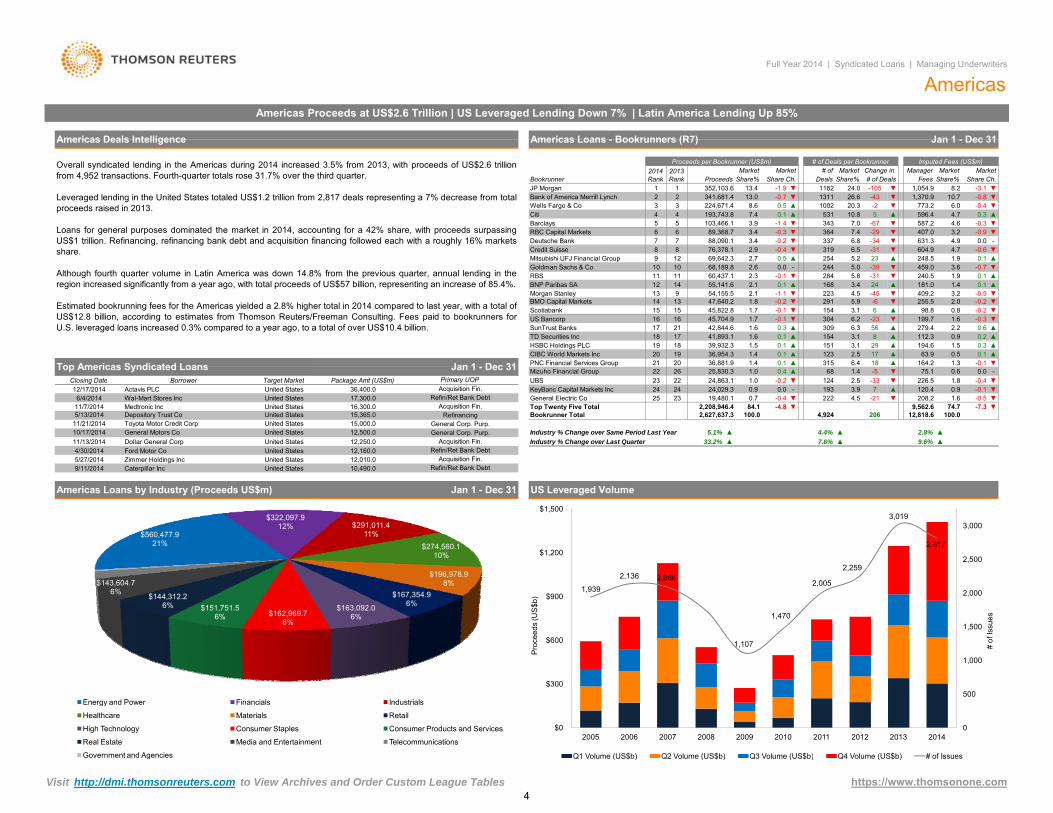
Overall syndicated lending in the Americas during 2014 increased 3.5% from 2013, with proceeds of US$2.6 trillionfrom 4,952 transactions. Fourth-quarter totals rose 31.7% over the third quarter.
Leveraged lending in the United States totaled US$1.2 trillion from 2,817 deals representing a 7% decrease from totalproceeds raised in 2013.
Loans for general purposes dominated the market in 2014, accounting for a 42% share, with proceeds surpassingUS$1 trillion. Refinancing, refinancing bank debt and acquisition financing followed each with a roughly 16% marketsshare.
Although fourth quarter volume in Latin America was down 14.8% from the previous quarter, annual lending in theregion increased significantly from a year ago, with total proceeds of US$57 billion, representing an increase of 85.4%.
Estimated bookrunning fees for the Americas yielded a 2.8% higher total in 2014 compared to last year, with a total ofUS$12.8 billion, according to estimates from Thomson Reuters/Freeman Consulting. Fees paid to bookrunners forU.S. leveraged loans increased 0.3% compared to a year ago, to a total of over US$10.4 billion.
Borrower
Jan 1 - Dec 31 Mizuho Financial Group 22 1.0 0.4 ▲ 6823 22 24 863 1 1 0 0 2 0 4UBS
26 25,830.3124 2 5▼ ▼ 226 5 1 8 ▼
18 ▲ 1.31.4 -5 ▼ 75.1
-0.1-0.6 0.0
1.4 315 6.4▲0.5
0.1 ▲ 164.2PNC Financial Services Group 21 20 36,881.9CIBC World Markets Inc 20 19 36,954.3
▼2.5 17▲ 123 0.1▲ 63.91.4 0.1
▲151 3.1 29 ▲ 194.6 1.50.2 ▲
HSBC Holdings PLC 19 18 39,932.3 1.5 0.1 ▲ 0.3
279.4 2.23.1 8 ▲ 112.3 0.9
56 ▲309 6.31.6 0.1 ▲ 154
0.3 ▲TD Securities Inc 18 17 41,893.1SunTrust Banks 17 21 42,844.6 0.6 ▲
1.7 -0.1 6.2 -23▼ 304 ▼1.6
154 3.1 6US Bancorp 16 16 45,704.9
1.7 -0.145,822.8-0.2 ▼ 291
▼98.8 0.82.0 -0.2 ▼
▼
-45 ▼ 409.2 3.2
1.6 -0.3-0.2▲
▼ 199.7
-6 ▼ 255.51.8
▲Morgan Stanley 13 9 54,155.5 2.1 -0.5 ▼223 4.5
0.1
BMO Capital Markets 14 13 47,640.2 5.9
240.5 1.93.4 24 ▲ 181.0
-31 ▼1.4
-1.1 ▼2.1 0.1 ▲ 168BNP Paribas SA 12 14 55,141.6
284 5.8▼
RBS 11 11 60,437.1 2.3 -0.1 ▼ 0.1 ▲5.0 -39- 244 3.6 -0.7▼ 459.0Goldman Sachs & Co 10 10 68,189.8 2.6 0.0
0.5 ▲ 0.1 ▲254 5.2 23 ▲ 248.5 1.9▼ 319 4.7 -0.6 ▼
Mitsubishi UFJ Financial Group 9 12 69,642.3 2.7
631.3 4.96.5 -31 ▼ 604.9
337 6.8 -34 ▼Credit Suisse 8 8 76,378.1 2.9 -0.4
▼Deutsche Bank 7 7 88,090.1 3.4 -0.2 ▼ 0.0 -
7.4 -29▼ 364 3.2 -0.9▼ 407.0RBC Capital Markets 6 6 89,368.7 3.4 -0.3-1.4 ▼ -0.3 ▼343 7.0 -67 ▼ 587.2 4.6
596.4▲ 531 4.7 0.3 ▲773.2 6.0
Citi 4 4 193,743.8 7.4 0.1 10.8 5
▼Wells Fargo & Co 3 3 224,671.4 8.6 0.5 ▲ -0.4 ▼
-0.8▼ 1,370.913.0 -0.7 26.6 -43 10.7-1.9
Share%Share%1
# of DealsShare Ch.
2 341,681.4
DealsJP Morgan 1 1182Bookrunner Proceeds
352,103.6 13.4
Full Year 2014 | Syndicated Loans | Managing Underwriters
AmericasAmericas Proceeds at US$2.6 Trillion | US Leveraged Lending Down 7% | Latin America Lending Up 85%
Americas Loans - Bookrunners (R7) Jan 1 - Dec 31
MarketMarket2014 Rank
MarketMarket
Americas Deals Intelligence
# ofImputed Fees (US$m)Proceeds per Bookrunner (US$m) # of Deals per Bookrunner
ManagerChange in Share%
1,054.9 ▼24.0 -105 8.2Fees Share Ch.
▼ -3.1
Market2013 Rank
33
1311▼
1002 20.3 -2 ▼
Scotiabank 15 15
▲Barclays 5 5 103,466.1 3.9
Bank of America Merrill Lynch ▼
Package Amt (US$m)
2
Target Market
Top Americas Syndicated LoansClosing Date Primary UOP
Actavis PLCBorrower
5/27/2014Ford Motor Co
Americas Loans by Industry (Proceeds US$m)
Caterpillar Inc United States9/11/2014Acquisition Fin.
12,160.012,010.0
▲▲4/30/2014 Refin/Ret Bank Debt
United StatesRefin/Ret Bank Debt
Zimmer Holdings IncUnited States
▲4.4% ▲9.6%
5.1% 2.8%▲
▲Industry % Change over Last Quarter
2,208,946.4
7.6%Industry % Change over Same Period Last Year
-4.8 ▼
33.2%
Bookrunner Total 4,924
United States
Top Twenty Five Total
Acquisition Fin. KeyBanc Capital Markets Inc0.7Refin/Ret Bank Debt17,300.0 General Electric Co
24 3.923
208.2
22 24,863.1 1.0 -0.2
19,480.123 -21222
Acquisition Fin.United States
-0.4-0.1
General Corp. Purp.
100.0
25
UBS
9,562.6
124 2.5
-0.4120.47
▼0.9
▼0.9 - 193
▼ 226.5 1.8▲0.0
▼-3324 24,029.3
Package Amt (US$m)36,400.0
Acquisition Fin.4.5 1.6▼ -0.5 ▼
▼
US Leveraged Volume
100.0 2062,627,637.3
▼
84.15/13/2014
United States
General Motors Co 12,500.0
-7.312,818.6
74.7
Target Market
United StatesWal-Mart Stores Inc
Depository Trust Co United States
12,250.0
United States
Jan 1 - Dec 31
United States
10,490.0
RefinancingGeneral Corp. Purp.
12/17/2014Closing Date
11/21/2014 15,000.015,365.0
Primary UOP
6/4/201411/7/2014
Dollar General Corp10/17/2014
Toyota Motor Credit Corp
11/13/2014
Medtronic Inc 16,300.0
$560,477.921%
$322,097.912% $291,011.4
11%$274,560.1
10%
$196,978.98%
$167,354.96%$163,092.0
6%$162,969.76%
$151,751.56%
$144,312.26%
$143,604.76%
$10,720.10%
Energy and Power Financials Industrials
Healthcare Materials Retail
High Technology Consumer Staples Consumer Products and Services
Real Estate Media and Entertainment Telecommunications
Government and Agencies
1,939
2,136 2,086
1,737
1,107
1,470
2,005
2,259
3,019
2,817
0
500
1,000
1,500
2,000
2,500
3,000
$0
$300
$600
$900
$1,200
$1,500
2005 2006 2007 2008 2009 2010 2011 2012 2013 2014
# of
Issu
es
Pro
ceed
s (U
S$b
)
Q1 Volume (US$b) Q2 Volume (US$b) Q3 Volume (US$b) Q4 Volume (US$b) # of Issues
https://www.thomsonone.comVisit http://dmi.thomsonreuters.com to View Archives and Order Custom League Tables4
Americas Loans - Mandated Arrangers (R8c)
208.2 1.7222 4.6 -21 ▼-
General Electric Co 25 23 19,480.1 0.8 -0.3 ▼ -0.4 ▼4.0 7- 193 1.0 0.0▲ 120.4KeyBanc Capital Markets Inc 24 24 24,029.3 0.9 0.0
0.4 ▲ 0.0 -53 1.1 -10 ▼ 71.0 0.6▼ 124 1.8 -0.4 ▼
Mizuho Financial Group 23 26 24,460.2 1.0
181.7 1.42.6 -33 ▼ 226.5
127 2.7 13 ▲UBS 22 22 24,863.1 1.0 -0.2
▼HSBC Holdings PLC 21 19 36,642.4 1.4 0.1 ▲ 0.2 ▲
6.6 18▲ 315 1.3 -0.1▲ 164.2PNC Financial Services Group 20 20 36,881.9 1.4 0.1▲ 0.0 -123 2.6 17 ▲ 63.9 0.5
154 0.9 0.2 ▲CIBC World Markets Inc 19 18 36,954.3 1.4 0.1
17 41,893.1 1.6 0.1279.4
3.2 8 ▲ 112.3▲0.4 ▲ 0.6 ▲309 6.5 56 ▲ 2.2
0.7 -0.3▲ 93.0 ▼SunTrust Banks 17 21 42,844.6 1.7
16 44,682.5 1.7 -0.1 3.1 2▼ 147304 6.3 -23 ▼ 199.7 1.6
-0.2 ▼15 15 45,704.9 1.8 0.0 - -0.3 ▼
▼ 254.4 2.03.2 11 ▲ 161.7 1.3 0.0 -
14 13 47,565.2 1.8 -0.3 ▼ 6.1 -7290
▼13 14 51,096.0 2.0 0.0 -
-47▼ -0.5▼ 408.79 53,865.5 2.1 -1.1 4.6154
▲282 5.9 -33 ▼ 239.7 1.9221 3.2
1.9 0.2 ▲11 11 60,220.5 2.3 -0.1 ▼ 0.1
▲458.9
4.9 14 ▲ 240.0236- -0.7 ▼243 5.1 -39 ▼ 3.6
-0.5▼ 604.8 ▼4.89 10 68,164.8 2.6 0.0
629.2 5.08 76,367.1 3.0 -0.3 6.6 -31▼ 318
0.07 7 87,639.7 3.4 -333 7.0 -38 ▼3.2
7.2-1.0 ▼7.6 -29 ▼ 406.4-0.3 ▼
3644.0 -1.3 ▼3.5 -0.2 ▼
▲3435 5 103,466.1 587.2 4.7
7.3 0.0 4.6 0.2574.2-65 ▼
10.5 -11 ▼-0.4 ▼
Share%
772.4 6.1-0.810.8 ▼1,364.1▼
▼-3.11,046.2 8.3Fees# of DealsShare Ch.
▼ ▼
20.8 -5 ▼27.1
Deals-1.8 1169
3 3 224,329.3 8.7503
0.5 ▲ 997-4
Mitsubishi UFJ Financial Group
6 89,368.7
12 66,026.3
8▼
Citi
▼6RBC Capital Markets
188,780.2
11▲
10
4
▲▼
12
16
TD Securities Inc 18
Credit Agricole CIB 25 29 21,842.2
2.719 26,897.6
133▲
KeyBanc Capital Markets Inc 24-0.40.0
27,658.81.023
▲ 0.134,249.0 ▲1.3Mizuho Financial Group
21 2225
CIBC World Markets Inc
# of MarketMandated Arranger
PNC Financial Services Group 4161.4 0.1
MarketShare%
Scotiabank
MarketMarketShare%Fees Share Ch.
Change in ManagerProceeds
2014 Rank
Market
26.3
Share%
12.7
▼
Market
-119 1,053.2
594.3-32
Manager
33▼
404.6
Market
▼
Bank of America Merrill LynchWells Fargo & Co
0.1
Full Year 2014 | Syndicated Loans | Managing Underwriters
Imputed Fees (US$m)
Share Ch.
▼
Proceeds per Bookrunner (US$m)2014 Rank
2013 Rank
Jan 1 - Dec 31
DealsProceeds Share Ch.
▼8.2
2013 Rank
▲194.0
▼ 455.1
-0.2
2.6 0.4-1.0
3.2▲
Market
Jan 1 - Dec 31
# of Deals per MA Imputed Fees (US$m)
Americas
▲
349,670.22 -0.6
# of Deals per Bookrunner
1300
1.7
-0.6
-0.12.0
136
▲
178
0.3
▼7.2
-1.4
▲
12
24.4 -116339,985.2 ▼
13.613.2 -48
-1.0
▲▼586.7▼
1,370.2
-0.2▲
6.04.6
10.4
2.0
770.6
4.6422
1227
▲
1300
4.1-144
2Wells Fargo & Co 3
15
Deutsche BankMitsubishi UFJ Financial GroupBarclays
JP Morgan3
TD Securities Inc 17
355
175,627.5
75,571.6Credit Suisse
15
7
4
▼
85
20▲
▲
9
-68
-45
-0.21.60.1
0.2
4.7
99.0
▲
-32
0.3
18
2
458
6.7
273,410.3
56
▼-1.4186,962.5
1
7.1
Market Market
285,705.8Share%
1477 29.8 -111 -1.1 ▼
Change in Proceeds per Mandated Arranger (US$m)
Bank of America Merrill Lynch
0.70.9
-
1-2.7
10.8 ▼
▼ ▼120.4
63.9▲ 0.6
0.5
226.2
94.8
1.8
45,101.2
17
SunTrust Banks 18
UBS
19 16
-▲
2.20.3
0.8
55,598.6HSBC Holdings PLC
24 22,557.8
20
22
0.9
0.2
-0.1
-
-0.6
0.0
-0.0
▼
▼
164.1
198.9▼1.9
408.2▼255.0
10.8
1.3
6.0
604.7▼
▲68-51
1.5
▼
0.0
3.5
2.20.9
0.8
▼
▲
49
261
4.6▲
▼417244
▲
146
5.3 25
164.9
2.9
3.6 21
5.3
▲ 8.4
8.4
2.7
268
▲
2.257,543.0
45,585.7
2.2
0.1
-0.21.70.4
0.11.1
0.3
0.10.0 -
▼-0.1
▼-1.2
2.8
47,791.8
36,737.6
10
14
13
9
▲
2118
58,825.5
2.1
62,790.8
20
5.411
13
8.039612
▼2.2
73,568.0
274
BNP Paribas SA
Goldman Sachs & Co
BMO Capital Markets2.4
-0.5
536
16
0.7
181.3112.3
77.41.8
0.3
▲261▲
▲
229
▲
1.4 0.1295
▼
8.5250.3
▲
-55
239.6
59.2
-13
-41
# of Deals
2.9
▼
▼
-0.6495400
-77459 ▲
24.8628
0.5
▲0.2 ▲
9.3
0.3
RBC Capital Markets▼7
3.5
90,887.1
91,955.3-0.23.5
▼8
510
Citi-1.4
3.2
4.9
12US Bancorp 11
8.1 -47
107,709.6
9-0.2
63.4
▼10.0
91,224.3
8RBS
Morgan Stanley57,738.2
1458,513.7
5.5
▼
▼279.4
-0.2
BMO Capital MarketsUS Bancorp
Barclays
Morgan Stanley
628.9
10.7
North America Loans - Bookrunners (R9)
Share% 1
BookrunnerJP Morgan
# of
0.4-0.8
Scotiabank
Deutsche Bank
BNP Paribas SA
Credit Suisse
-0.4
▼ RBS
Goldman Sachs & Co
-7.0%14 7%
▲▲I d t % Ch L t Q t ▲ 1 0%10 3% ▲ ▲▲
4,290
6 7%0.3%Industry % Change over Same Period Last Year ▼ -6.2% ▼
Bookrunner Total8,053.7 77.4
-186▼
10,429.6 100.0-7.7 ▼
1,157,798.4 2,817100.0Top Twenty Five Total 953,081.7 82.7 -7.1
78 0.6 0.0▲ 61.5 -2.8 24Regions Bank 25 30 6,642.4 0.6 0.2 ▲0.2 ▲ 0.1 ▲77 2.7 -1 ▼ 104.7 1.0
- 48 0.7 0.0 -Fifth Third Bancorp 24 26 7,859.2 0.7
103.9Credit Agricole CIB 23 23 8,201.3
1.01.7 -4 ▼ 69.3
121 4.3 -1 ▼0.7 0.0
▲KeyBanc Capital Markets Inc 22 20 11,228.5 1.0 0.0 - -0.1 ▼
2.3 4▲ 66 1.2 0.1▲ 127.2HSBC Holdings PLC 21 22 11,942.8 1.0 0.30.2 ▲ 0.2 ▲63 2.2 -10 ▼ 148.1 1.4
▲ 65 1.1 -0.1 ▼Mitsubishi UFJ Financial Group 20 21 12,340.6 1.1
185.7 1.82.3 -7 ▼ 117.6
169 6.0 -30 ▼BNP Paribas SA 19 19 13,818.0 1.2 0.1
▼BMO Capital Markets 18 15 15,422.0 1.3 -0.5 ▼ -0.3 ▼
5.5 -19▲ 156 1.3 -0.1▼ 131.0PNC Financial Services Group 17 18 15,602.6 1.4 0.1-0.1 ▼ -0.4 ▼135 4.8 -41 ▼ 146.1 1.4
▼ 200 1.9 -0.6 ▼US Bancorp 16 16 17,489.8 1.5
238.0 2.37.1 -31 ▼ 201.0
99 3.5 -6 ▼General Electric Co 15 11 17,879.7 1.5 -0.6
▼Jefferies LLC 14 17 18,163.1 1.6 0.1 ▲ 0.3 ▲
3.9 -34▼ 110 2.1 -0.4▼ 217.5UBS 13 12 20,289.0 1.8 -0.30.1 ▲ 0.1 ▲150 5.3 -31 ▼ 187.3 1.8
▲ 229 2.5 0.7 ▲RBS 12 14 22,539.5 2.0
374.3 3.68.1 26 ▲ 256.0
180 6.4 -54 ▼SunTrust Banks 11 13 29,668.7 2.6 0.7
▼Morgan Stanley 10 9 36,343.6 3.1 -0.7 ▼ -0.3 ▼
7.1 -43▼ 200 3.0 -1.0▼ 308.7RBC Capital Markets 9 10 37,690.4 3.3 -0.2-0.9 ▼ -0.9 ▼217 7.7 -40 ▼ 414.5 4.0
▼ 236 4.9 -0.1 ▼Goldman Sachs & Co 8 8 42,253.6 3.7
414.4 4.08.4 -67 ▼ 512.7
235 8.3 -76 ▼Barclays 7 7 51,906.8 4.5 -0.7
▼Citi 6 6 52,785.4 4.6 -0.8 ▼ -0.1 ▼
10.1 -25▼ 284 5.5 -0.6▼ 570.4Credit Suisse 5 5 53,736.0 4.6 -1.0▼ -277 9.8 -40 ▼ 582.6 5.6 0.0Deutsche Bank 4 4 61,976.1 5.4 -0.3
▼Wells Fargo & Co 3 3 110,714.5 ▼ 6.1 -0.5▲ 590 -749.6 0.1807.6JP Morgan 2 2 127,221.6 21.8
1,134.411.0 -1.912.9 -1.2
20.9▼ 614
28.3
639.2
▼ ▼-185
10.9 -0.7-3.0 ▼7.7▼
▼
# of Market Change in
Bank of America Merrill Lynch 1 1 149,366.5Deals Share%Bookrunner
Manager Market# of Deals
Imputed Fees (US$m)Market
Fees Share% Share Ch.2014 Rank
2013 Rank Proceeds
Market MarketShare% Share Ch.
0.7% ▲ 1.3%
US Leveraged Loans - Bookrunners (R11a)
Proceeds per Bookrunner (US$m) # of Deals per Bookrunner
796 -125
3 9% ▲
Bookrunner Total
I d t % Ch L t Q t 36 7%Industry % Change over Same Period Last Year
9,344.9100.028
1.1▼85.8
4877.7
12,097.6▼
0.4 -0.3 ▼-7.1
-25Scotiabank 25 23 11,875.1Top Twenty Five Total
▼ 48.2-67 1.6 1 ▲ 83.3 0.7 0.0
100 2.0 0.3 ▲Credit Agricole CIB 24 25 13,839.5 0.6 0.1
203.4 1.72.3 -5 ▼ 238.3
216 5.0 -26 ▼Jefferies LLC 23 22 18,418.1 0.8 0.0
▼General Electric Co 22 20 19,107.6 0.8 -0.4 ▼ -0.5 ▼
4.7 -23▼ 201 1.6 -0.3▼ 198.8BMO Capital Markets 21 19 21,466.3 0.9 -0.3▼191 4.5 7 ▲ 120.0 1.0
51 0.6 0.0 -KeyBanc Capital Markets Inc 20 21 24,003.8 1.0 0.0
225.4 1.91.2 -8 ▼ 67.8
122 2.8 -33 ▼Mizuho Financial Group 19 24 24,021.4 1.0 0.4
▲UBS 18 18 24,518.1 1.1 -0.2 ▼ -0.3 ▼
2.7 10- 117 1.4 0.2▲ 163.9HSBC Holdings PLC 17 17 33,581.8 1.4 0.0▲ 0.0 -314 7.3 19 ▲ 163.3 1.4PNC Financial Services Group 16 15 36,811.9 1.6 0.2
▲ 279.4▲ 309 2.3304 7.1 ▼-22
7.2SunTrust Banks 15 16 42,844.6 1.8 0.4 56
▼US Bancorp 14 14 45,704.9 2.0 0.1 ▲ -0.2
3.4 9- 148 1.3 -0.1▲ 159.3BNP Paribas SA 13 13 49,239.8 2.1 0.0▼ -1.0 ▼251 5.9 -41 ▼ 331.8 2.7RBC Capital Markets 12 11 50,699.3 2.2 -0.3
5.1 -47 ▼ 408.2▼ 220280 6.5 -31 ▼ 238.6
Morgan Stanley 11 8 53,847.8 2.3RBS 10 10 59,620.5 2.5 -0.1
5.3 18▲ 226 1.9 0.2▲ 228.1Mitsubishi UFJ Financial Group 9 12 62,202.8 2.7 0.5242 5.6 -39 ▼ 458.1 3.8Goldman Sachs & Co 8 9 68,062.3 2.9 0.1
7.3 -30 ▼ 602.2▼ 315332 7.7 -36 ▼
Credit Suisse 7 7 75,824.8 3.2 -0.3
▼Deutsche Bank 6 6 87,223.0 3.7 -0.2 ▼ 0.1 ▲
7.9 -66▼ 339 4.8 -0.3▼ 576.8Barclays 5 5 100,907.0 4.3 -1.30.0 0.2 ▲492 11.5 -15 ▼ 562.6 4.7
-9 ▼ 767.8▲ 991Citi 4 4 183,554.9 7.8Wells Fargo & Co 3 3 223,133.1 9.5 0.7
1290 30.1 -50 ▼ 1,358.5 11.2JP Morgan 1 1 345,198.5 14.7 -1.8
Market
1160Fees# of DealsDeals Share%
27.0 1,038.4-114
6.6%Industry % Change over Last Quarter 31.7%
Bookrunner Proceeds# of
Share% Share Ch.2014 Rank
▲
Jan 1 - Dec 31
▲▲
Proceeds per Bookrunner (US$m) # of Deals per Bookrunner Imputed Fees (US$m)
Industry % Change over Last Quarter ▲ 7.1% ▲ 9.4%Industry % Change over Same Period Last Year ▲ 3.1% 2.0%
33.5%4.3%
4,790 142 12,605.8 100.0▼ 75.1 -7.5 ▼
Bookrunner Total 2,580,479.4 100.09,468.2Top Twenty Five Total 2,184,981.2 84.8 -4.4
4,9522,640,466.6
▲3.5%
100.080.2
Industry Total
-1.0%
Top Twenty Five Total 2,112,053.5
3.6%▲
▼8.6
ManagerMarket
▼
171
▲7.7%
199.7
Share%
-0.7 ▼
12,846.69,433.1
Jan 1 - Dec 31
5.0
Change in
▼337,103.1
▲
US Loans - Bookrunners (R11)
Industry % Change over Same Period Last Year
Bank of America Merrill Lynch
2013 Rank
▲
▼100.0
73.7
3.4 -0.5
▼
-3.1Share Ch.
-7.1
-0.3
Market
5.2
2.0
23.1-
14.4
0.52,012,810.0
-1.2
-0.3
2.8% ▲
2,344,019.7
▲
▼
▲
100.0
-
▼
▲▲
-4.3
-
▼
-4.3
-0.4 ▼
Market
▼2 2
0.1
1.70.6
-0.1
-0.5
6.4
Market
623.0
▼-0.6▲▲▼
▼▲
▼
Visit http://dmi.thomsonreuters.com to View Archives and Order Custom League Tables https://www.thomsonone.com
14.7% ▲Industry % Change over Last Quarter ▲ 1.0%10.3% ▲ ▲ 6.7%3.9% ▲Industry % Change over Last Quarter 36.7% ▲
5

5,031.6
Fees
-0.1
▲
23 0.0
1.3
Top Twenty Five Total
Top 10 Americas Loans Use of Proceeds (US$m)
0.31.5 6.91 4
0.3
0.9
1.53.6
2.5
▲
0.9
2.1
▲
-12
-1
-1
3
-6
33.3
30.6
33.3
12.2
6
▲
▲
-6
224.1
145.8
Manager
Full Year 2014 | Syndicated Loans | Managing Underwriters
Jan 1 - Dec 31
▲
Jan 1 - Dec 31
Change in
-0.4
Barclays6 6Mitsubishi UFJ Financial Group
Wells Fargo & Co
7BNP Paribas SA
4
Credit Suisse
▼ Americas Yield Type-0.4
11,198.7 1.0 0.33.93.1
11.9129,248.0
16
8
4
92.3
▲62
0.2
▲▼
▼-0.1
▼
12.1
0.2
▲
▲
▲
-0.1
-0.1
▼
-1.70.9
-0.2
2.0
0.3
0.7
0.5
2.0
1.8
0.5
0.8
0.5
1.6
Deutsche Bank45.0
14.0
10.0
▼▼
19,624.150
US Bancorp10
JP Morgan
25,188.9
17,049.3
21,734.721,834.6
Goldman Sachs & Co
11
21,547.7
CitiBank of America Merrill Lynch
9512.2 ▲12
3.9 133
1.620
RBS
23,965.8 4.92.1
▲
12.8
5.4-
2
▲
▲
▲
11
7
US Investment Grade Loans - Bookrunners (R11b)
2
# of Deals▲
▼
▲
0.5
▲-
▲-
0.0
# of Deals per Bookrunner
7849.8
76
63.147.54
9.9
58
62.638.224.2252
103123.7
11.43
4156
22
0
▲
Share Ch.
▲
-
219.7
0.3
1.3
0.80.0
0.5
8.54.9
-0.2
0.6
0.6
27.3
0.2
2.3
0.811.10.0
0.589 9
7.00.3
0.30.2
Bank of China Ltd
Morgan Stanley
Credit Agricole CIB
PNC Financial Services Group 16
Scotiabank
SunTrust BanksRBC Capital Markets
2019KeyBanc Capital Markets Inc
1718
-0.4
93 8▲
▲
160.111
2.3241.1
-1.4 ▲
HSBC Holdings PLC
1518
13
14
10Mizuho Financial Group 14
138
BMO Capital MarketsUBSCoBank ACB
22
▲2430
1 019 860 7
3,983.527
21 21
25 3,465.2
8,427.1
12,045.6
2226
1715
9
Market
▼
-0.2
0.4
16,672.9
5,037.3
7,528.0
19
19.3
▲-2.0
0.6
2.0
10.2
0 4
42,949.9
5,799.6
35,515.2
Market
-0.5
Bookrunner2014 Rank
# of
▲
8.7
0.6▲
Share%
2.9
▼▲
▼
Americas
0.0
-1.6▲0.4
▲
-
▼
2.3
▲
36.3
-0.1
2.6
▲
-1.5
1.0
19.1
1.8
1.0
3.236.8
18.6
3.3
40.7
4.4
4.8 ▲▼2.2
4▼▲
10.812
9
10442
▼
23
23
31
37▲
3.0
22
25
0
Deals518
Share%
481
Market
46.3
6
397
2.6
4.5
56
▼
▲▲
1 283 5
0.8
▲
▲
▲
0.6
0.1
▼
1.1
48,655.6110,703.9
3.327,845.7
Proceeds
15
-2.5
126
32
112
▼▼
1.0
2.0
184,212.9210,594.9
▲16.9
Share%
Proceeds per Bookrunner (US$m)
Share Ch.
5 5
21
2013 Rank
1
33
38
▼-5
▲
▼
-0.24.01.9
5.4▼
10.2
Imputed Fees (US$m)
15.4
Market
0.7
▲ 4.4
2.3
▼
▲▼15.7 -4.6
Market $1,054,975.242%
$408,497.516%
$401,704.716%
$387,641.415%$81,510.9
3%
$62,306.13%
$52,299.22%
$32,644.91%
$28,751.31%
$23,243.51%
General Corporate Purposes Refinancing Acquisition Financing Refinance Bank Debt
Working Capital Leveraged Buyout Project Finance Export/Import Finance
Property Acquisition Capital Expenditures
600
700
800
1.3 ▲1.5 0.5 0.2 ▲
▲10.8 14 ▲
3.5 1.35.1 62425
0.8Banco do Brasil SABanco Latin Americano Export
4720
14.7%12.3%
1,089,413.3 100.0Bookrunner Total 1,429.8
▲▲
▲
▲
1.3
Industry % Change over Last Quarter
11.5%
1.4
▲Top Twenty Five Total
▲
107
▲
▲6.8
Imputed Fees (US$m)
14.9
3.91514 ▲
2.4
-2.43.0
2.2
-14.8%
277.2
▲-38.2%
100.0
▼74.4%
Industry Total
▼
▲ 2016 24 1,427.2 ▲
2.6 1.2
100.068.2 15.138,823.0
56,974.2
1,050.0
457.5427.4
784.8Societe Generale 18
59*Natixis 1.82.5China Development Bank 17
1,016.633
▲
20
18
12.7
8.31.8
11.5 4.2
2.6 1.9 16 ▲▲ 6.712.7 6.1
11.6
12.7
Scotiabank 15 15 1,463.3ING 14 22 1,490.0
▲1 1,615.8
2.8▼10.2 3 ▲ 6.8 2.5
3.3-5.3
▲ 153.0
Industrial & Comm Bank China 13 37 1,584.2Bank of America Merrill Lynch 12
202.42.8 ▼
-0.81.4
163.29.6 ▲ 8.8
10 7 1,859.8 22.3 18 ▲ 14.5JP Morgan 11 14 1,727.4Itau Unibanco
113.3 -0.3 ▼3.4
28▼
35
-
1.44.04.3
12.7 11 ▲ 9.7▲ 209 ▲ 12.5 4.5 -1.9-0.7 15.925
▲231.5
Credit Agricole CIB 9 11 1,954.1Sumitomo Mitsui Finl Grp Inc 8 2,266.4Mitsubishi UFJ Financial Group 7 5
4.4 ▲ 19.7Mizuho Financial Group2,470.62,482.5 0.72,831.0
66Santander 8HSBC Holdings PLC 4 9
3BNP Paribas SA
5
BBVA 225
2014 Rank
6.1
Share% Share Ch.
2 -1.8
Mandated Arranger
▲
2,961.419
Market
▼0.5
Proceeds
3,480.26.1 22 14.0
395.4
5.2
0.0
1.9
24.8
5.0
5.4
▲ 40.7%▲
# of DealsChange in Manager
13.3▲ 26
▲
1.41,040
▲▲
-1.4▲
▲
2.617.8 16
22.34.8
7.32.7
19 ▲
31▲ 35
36
37 23.6
17
▲ 8.4
Market# of Deals per MA
100.0
1.2%
6.531
2013 Rank
Proceeds per Mandated Arranger (US$m)
▲
# ofDeals
7.2
89.9
23.2
2.3 2.1
Americas Imputed Fees - Mandated Arrangers
▼
FeesMarket
▼
▼
▲
2.2
66.1 14.3
1.4 0.5
6.3
0.1
0.5 ‐2.2
5.2
1.2
0.9
▲
▲
▼
1.3
Share Ch.
▼
1.1
▲0.5
▼
-2.1
-0.9
93.8
Citi
Industry % Change over Last Quarter 58.7% ▲
1,019,860.7
Industry % Change over Same Period Last Year
3,681.3
▲
Latin America Loans - Mandated Lead Arrangers (R16)
4
10
3,461.2
0.4
2021
▼
Share%22.9
Market
-2.4
11.7 4.2
Share%
1,283.5
183.1
▲
20.0
▲3.5
Jan 1 - Dec 31
▲
Market
0.8 0.0
1.71.4
1.8
5.1
10 ▲▲ 0.6
▲-
8
▲
17
7▲▲
1.4 -1.0
▲1.0
▲
13
0.60.7 6
3.7
7.6
64
0
▲
1.5▲
▲
▼
157
93
12
3.8▲
4.4%68.8% ▲
0
-1
6 6
5.7
Full Year
Industry % Change over Same Period Last Year 85.4% ▲
Top Twenty Five Total
Standard Chartered PLC 7.6 -Rabobank NV 20 26 616.0 1.1 0.5
19▲
Banco Banorte SA 21 28 603.7 1.1 0.6 1.9 1 ▲ .8 0.3 ▼‐0.2Banca IMI (Intesa Sanpaolo) 22 - 582.2 1.0 ▲ 2.0 0.7 0.7 ▲Deutsche Bank 23 66* 466.8 0.8 ▲3.8 5 ▲ 2.1 0.8 0.7
0
100
200
300
400
500
600
1Q 2Q 3Q 4Q 1Q 2Q 3Q 4Q 1Q 2Q 3Q 4Q 1Q 2Q 3Q 4Q 1Q 2Q 3Q 4Q 1Q 2Q 3Q 4Q
2009 2010 2011 2012 2013 2014
Pro
ceed
s (U
S$b
)Undisclosed (US$b) Highly Leveraged (US$b) Leveraged (US$b) Near Invst Grade (US$b) Investment Grade (US$b)
4,123 4,022 4,039
3,286
2,048
3,182
4,3324,196
4,781 4,952
0
500
1,000
1,500
2,000
2,500
3,000
3,500
4,000
4,500
5,000
0
2
4
6
8
10
12
14
2005 2006 2007 2008 2009 2010 2011 2012 2013 2014
# of
Issu
es
Tota
l Im
pute
d Fe
es (U
S$b
)
Total Imputed Fees (US$b) Number of Deals
https://www.thomsonone.comVisit http://dmi.thomsonreuters.com to View Archives and Order Custom League Tables
y g Q*tie
6
`
EMEA Deals Intelligence
Full Year 2014 | Syndicated Loans | Managing Underwriters
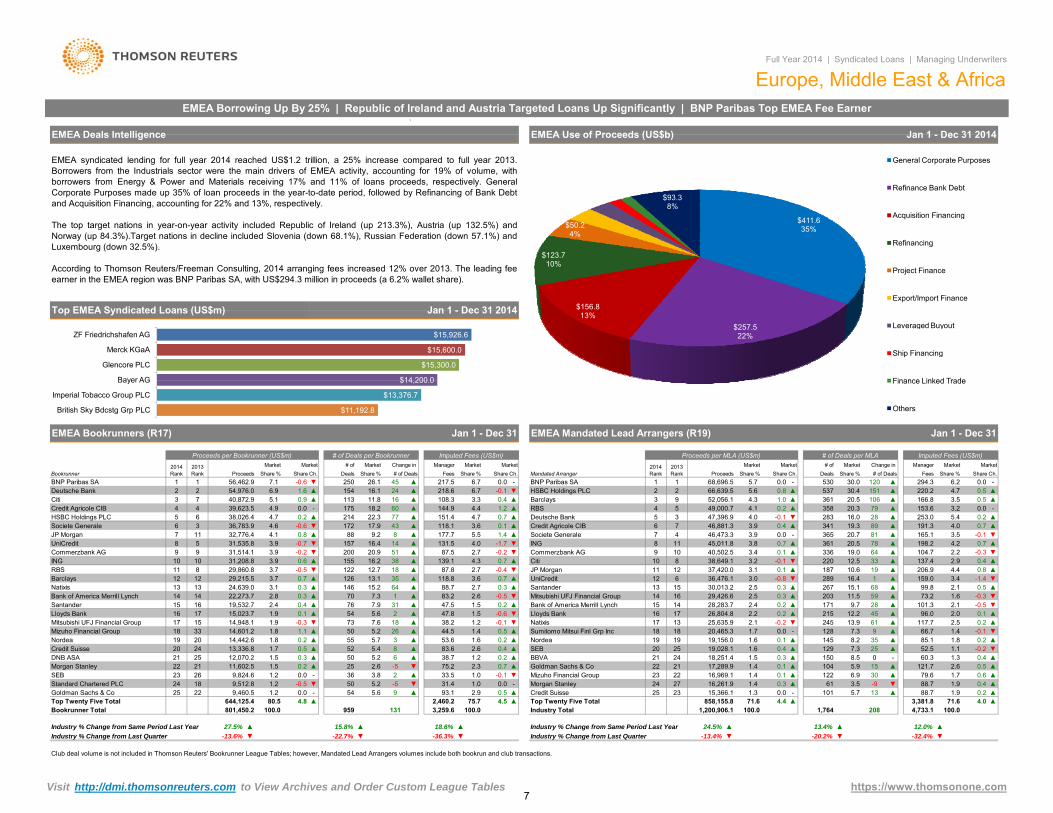
Europe, Middle East & AfricaEMEA Borrowing Up By 25% | Republic of Ireland and Austria Targeted Loans Up Significantly | BNP Paribas Top EMEA Fee Earner
EMEA Use of Proceeds (US$b) Jan 1 - Dec 31 2014
Top EMEA Syndicated Loans (US$m)
EMEA syndicated lending for full year 2014 reached US$1.2 trillion, a 25% increase compared to full year 2013.Borrowers from the Industrials sector were the main drivers of EMEA activity, accounting for 19% of volume, withborrowers from Energy & Power and Materials receiving 17% and 11% of loans proceeds, respectively. GeneralCorporate Purposes made up 35% of loan proceeds in the year-to-date period, followed by Refinancing of Bank Debtand Acquisition Financing, accounting for 22% and 13%, respectively.
The top target nations in year-on-year activity included Republic of Ireland (up 213.3%), Austria (up 132.5%) andNorway (up 84.3%).Target nations in decline included Slovenia (down 68.1%), Russian Federation (down 57.1%) andLuxembourg (down 32.5%).
According to Thomson Reuters/Freeman Consulting, 2014 arranging fees increased 12% over 2013. The leading feeearner in the EMEA region was BNP Paribas SA, with US$294.3 million in proceeds (a 6.2% wallet share).
Jan 1 - Dec 31 2014
$15,926.6
$15,600.0
$15,300.0
$14 200 0
ZF Friedrichshafen AG
Merck KGaA
Glencore PLC
Bayer AG
$411.635%
$257.522%
$156.813%
$123.710%
$50.24%
$93.38%
General Corporate Purposes
Refinance Bank Debt
Acquisition Financing
Refinancing
Project Finance
Export/Import Finance
Leveraged Buyout
Ship Financing
Finance Linked Trade
Club deal volume is not included in Thomson Reuters' Bookrunner League Tables; however, Mandated Lead Arrangers volumes include both bookrun and club transactions.
Bank of America Merrill Lynch 15 14 28,283.7Mitsubishi UFJ Financial Group 14
▲
24.5%
Morgan Stanley 24 27
18,251.4
Credit Suisse
▲150
17,289.98.5
1.6 0.4 ▲
▲
BBVA 21 24 1.5▲
-9 ▼61▲122
22 21
2516,261.9
Lloyds Bank
100.0
1.3 0.0 -15,366.1Top Twenty Five Total
▲13.4% ▲ 12.0%
1,764
215 12.2
85.1 1.8
45
-0.1
▼ -32.4%
4,733.1▲
5.7 0.23,381.8
1.988.710171.6
2.65.9
88.7
4.0
15 ▲ 121.7 ▲
208
6.90.5
30
0.2
1.4 79.63.5 1.9 0.4 ▲
1.7 0.616,969.1
1,200,906.1858,155.8
0
▲
0.3 ▲25129 ▼
1.4 0.1 1040.4 ▲
▲0.1 ▲ ▲
1.4 0.3▲
▲2.1▼
52.5
16 17
8.2 35SEB 20 25 19,028.1 7.3
1451.6 0.1Nordea 19 19 19,156.0Sumitomo Mitsui Finl Grp Inc 18 18 20,465.3Natixis 17 13 25,635.9
7.3 9
26,804.8
▲
-0.3
▲-
2.5 0.3
137.4
▲ 73.2203
4.4
2.22.1
0.2
1.7 ▼
16.4 1 ▲▼
1.611.52.1 -0.52.0 0.1
171 9.7 28 ▲ ▼▼
0.5▲▲ 267
101.396.0
▲ 206.9159.0-0.8
19 ▲
59▲ 99.8
66.7▲2.561-0.2 ▼ ▲ 117.7245 13.9
0.0 128
0.3
1.40.2
▲
3.4 -1.415.1 68Santander 13 15 30,013.2
UniCredit 12JP Morgan 11
28912 37,420.0 1876 36,476.1 3.0
2.4 0.2 ▲2.5
640.1 ▲78
220-0.1Citi 10
ING 8 11 45,011.8 361 20.5
8 38,649.1
0.7 ▲
12.5336
3.2 3319.0
▼Commerzbank AG 9
16 29,426.6
30.4 151 ▲20.5361
7 4 46,473.3 3.9▲ 191.3
165.119.3 89
9 52,056.14 5 49,000.7 4.1 0.2 ▲ 358 20.3
▲
0.0
0.70.4 ▲
-0.5
▲
3.2166.8 3.5
▲30.0
HSBC Holdings PLC 2 2 66,639.5 5.6▲▲
220.2 4.7 0.50.8294.3 6.2 0.0▲ -
RBS 153.6106
341
2.9▲
Credit Agricole CIB 6
4.3 1.0
3.9Deutsche Bank 5 3 47,396.9
46,881.3
Barclays 3
28
-0.0
2834.0 -0.1 ▼7
365 20.7Societe Generale 81
▲79 ▲
10 40,502.5 3.4
▲
13 ▲
-0.2
5.4▲▼
0.7
4.03.5
1.31.1
- 60.3
104.7198.2
▲
▲ 2.20.4
0.2▲ 253.0
-0.1▲
▲
▲▲
-0.3 ▼4.2▲
0.8
71.6 4.4
10.63.1 0.1
Market
120
-20.2%
1
16.0
56,462.9 7.1 250 45 --0.1
-537
0.188 ▲ 177.7
24 ▲154 16.1▲
▲4.7 0.7
▼
3.8
6.7
Manager Market MarketMandated Arranger
Market # of Market# of Deals Fees Share % Share Ch.
Market
Proceeds per MLA (US$m)Change in
Jan 1 - Dec 31
218.6▲
Market
Imputed Fees (US$m)
2014 Rank
▼5.1 0.96.9 1.6 ▲
# of Deals per Bookrunner
3.316
Jan 1 - Dec 31
Share Ch.
EMEA Mandated Lead Arrangers (R19)
# of Deals per MLA
530
EMEA Bookrunners (R17)
MarketShare %Bookrunner Proceeds Proceeds Share % Share Ch. Deals Share %
2013 RankFees
1 68,696.5 5.7 0.0BNP Paribas SA 1
# ofShare Ch.-0.6 ▼
Manager
Imputed Fees (US$m)Market
DealsChange in
Proceeds per Bookrunner (US$m)
# of Deals26.1
2014 Rank
2013 Rank
MarketShare % Share %
217.5 6.7
118.177
BNP Paribas SA 1
Credit Agricole CIB 4 4 39,623.5 4.9Citi 3 113
60 ▲ 144.9-0.411.8
3.6HSBC Holdings PLC 5
Deutsche Bank 2 2 54,976.00.0
0.0214
4.418.27 40,872.9
38,026.4 ▲Societe Generale 6 3 36,783.9 4.6
▲5.5 1.49.2 84.1
▲
▲ 108.3▲
17.922.34.7
1.2 ▲175
-0.6 ▼0.2 ▲6
172151.4
43 ▲
4.03.9 -0.7UniCredit 8 5 31,535.83.9 -0.2 ▼
JP Morgan-1.7 ▼157 16.4 14 ▲▼
0.8131.5
▲ 87.551
▲7 11 32,776.4
0.7 ▲2.7 -0.24.3
▼Commerzbank AG 916.20.6 ▲ING
9 200 20.931,514.1139.110 10 31,208.8 1553.9 38 ▲
▼Barclays 12 12 29,215.5 3.7
3.7 -0.5 ▼ 122RBS 11 8 29,860.8 2.7 -0.412.7 18 ▲ 87.8
13 ▲0.7 ▲126 13.1 35
88.7▲ 118.8
0.3 ▲7.30.3 -0.5
2.7 0.32.6
0.4
3.6146 15.2
0.7 ▲
83.264
22,273.7 ▼24,639.0 ▲
70▲3.12.8 1 ▲
Natixis
76 ▲Santander 15 16Bank of America Merrill Lynch 14 14
47.515,023.7
2.4 ▲1.5 0.27.9 311.9
19,532.7▲ 54 5.6 47.8Lloyds Bank 16 17 0.1 1.52 ▲
13
▲
0.5
-0.6
26 ▲ 44.5
▼▲7.6 38.218
▲1.2 -0.11.4
▼5.2
15 14,948.1Mizuho Financial Group 18 33 14,601.2Mitsubishi UFJ Financial Group 17 1.9 -0.3 ▼
501.8 1.1 ▲73
20 14,442.6 ▲ 551.8 0.2 ▲Credit Suisse 20 24 13,336.8 1.7Nordea 19 35.7
0.5 83.6▲0.21.238.7▲50▲ 5.20.40.21.6▲ 53.6
▲52 5.4 8 ▲ 2.61.5
100.0
▲6
11,602.5 0.221 2.3▼▲ 25▲
Standard Chartered PLC 240.0SEB 23 26
Morgan Stanley 22 1.5 0.72.6 75.2-5DNB ASA 21 25 12,070.2
18 9,512.8 -51.2 -1.2
0.3
3.8 2 ▲5.2▼ 50
369,824.6-0.5
Goldman Sachs & Co-0.1
-0.01.01.0 ▼
▼33.5
0.5▲75.7
Industry Total
31.4Mizuho Financial Group 23 22
23
Industry % Change from Same Period Last Year
2,460.2 4.5100.0
Industry % Change from Same Period Last Year 27.5% ▲ ▲15.8% ▲-13.4%
93.1
-36.3%
▲
▼
- 540.0 5.64.8 ▲
18.6%
131959Bookrunner Total
9,460.525
▼Industry % Change from Last Quarter -13.6%
1.2
3,259.680.5
9
801,450.2644,125.4Top Twenty Five Total
▲▼
100.0
22Goldman Sachs & Co
Industry % Change from Last Quarter
▲2.9
▼ -22.7%
$14,200.0
$13,376.7
$11,192.8
Bayer AG
Imperial Tobacco Group PLC
British Sky Bdcstg Grp PLC
Finance Linked Trade
Others
https://www.thomsonone.comVisit http://dmi.thomsonreuters.com to View Archives and Order Custom League Tables7
▼
▲▼
▼
▼-11 40.9
-1.01.1 0.6
39.39 ▲
-0.62.248.0 2.7
▼
▲
-1.92.3
2▼
30.3
-0.2-0.6-0.1-0.11.7
3.2261.72.1
5.7
-
▼
EMEA Syndicated Loans by Industry (US$b) Jan 1 - Dec 31 20140.9
25.0
15.9
20.9
1.6
1.2
▼▼
-1.328.7
▼▼
▼0.2
▼▲
▼
2,190.3 4.51.31.3 -0.5 -3
▲ 11 4.5Lloyds Bank 22 21
▲DNB ASA 23 26 0.1▼ 11
2,173.8
▲71215 6.1
-0.1-0.7
1.44.9 -7-0.80.8 ▲
1.51.7
Barclays15 3,727.4
16Citi 17 2.3 29.7
▼UBS 21 16 2,517.0Santander 20 28 2,797.6
8.5▲6.9
-1
57.2-0.3▼
12Nordea 18*
1.9
10.6 ▲
3,157.3Commerzbank AG 18*123,157.3 -0.3 ▼ 4.9 0
17-0.222
-0.71.9
▼ 21 ▼ 38.2-
9 4,914.7 3.0
19
Bank of America Merrill Lynch 15 6 4,932.27 5,066.7 20
3.1 31 12.68.13.1
▲▼
Natixis 13 20 5,161.3RBS 14
3.0 -1.2 14
Nomura 12 3.5 2211 5,781.0 0.8
▼-1
▲
17 6,101.468.213.0
▲
5,890.7 ▲
4.8
▲▲Morgan Stanley 10
Credit Suisse 113.7
4▼5.71.4
1.0 ▲
1.3
13
14 6,898.8
3.6 32
▲ 2.0
0.8
0.00.6
2.8
3.43.8
3.561.984.9
14ING
34.34.2 1.7
13.029 11.8 78
61.4
50.7
▲82.0
Societe Generale 9 18 6,447.5 ▲-4
38 ▲14
15.43.9 1.6
8.9▲ ▲7
▲0.80.24.6
JP Morgan▼4.9 -1.6▼ 17,339.74 4.4 -2.1
13.4
▲ 4.65 ▲
16.74.3
1.36.5 -0.4 ▼41UniCredit
120.8
▲ 320.3 ▲
5 ▲HSBC Holdings PLC 6 5 7,145.3
7 8 7,015.4Goldman Sachs & Co
4 3 10,757.3
83.0
87.5-0.3 ▼ 43 17.5
▲6.7 -0.3▲ 119.0
▼
▲
0.19BNP Paribas SA
8.1Credit Agricole CIB
22.0540.2 ▲-1.9
7.233
▼6.8-5
▼
▼
152.9 8.651 20.7 -41 12,344.15.1 18.3 ▲2.71645 ▲ 5.496.0
Manager
Share % # of Deals
Deutsche Bank 21 10 13,431.3 ▲
Share Ch.
# of Deals per BookrunnerMarket
Fees Share %
Market# of Market Change in Imputed Fees (US$m)Proceeds per Bookrunner (US$m)
Jan 1 - Dec 31
Proceeds
EMEA Quarterly Syndicated Loan VolumeEuropean Leveraged Loans (P10)
Europe, Middle East & AfricaFull Year 2014 | Syndicated Loans | Managing Underwriters
Share Ch.
7.511,826.83 2
Share %
Market2013 Rank
2014 Rank Deals
Market
Bookrunner
27 1,690.2 1.0 0.1 ▲ 4 1.6 1 ▲ 12.8 0.7 -0.2 ▼Rabobank NV 24 23 1,764.8 1.1 -0.6 ▼ 8 3.3 -4 ▼ 18.6 1.0 -0.9 ▼Scotiabank 25
$44 9Industrials
223276
249 264 265
341315
362
379
464
418
400300
390
315355
355 387 396420
365
511 494
394
0
100
200
300
400
500
600
$0
$50,000
$100,000
$150,000
$200,000
$250,000
$300,000
$350,000
$400,000
Q1 Q2 Q3 Q4 Q1 Q2 Q3 Q4 Q1 Q2 Q3 Q4 Q1 Q2 Q3 Q4 Q1 Q2 Q3 Q4 Q1 Q2 Q3 Q4
2009 2010 2011 2012 2013 2014
# of
Issu
es
EMEA Proceeds (US$m)Number of deals
Pro
ceed
s (U
S$m
)
19.9% ▲
8.4
2013 Rank Share Ch.
▼Deals
-0.437
Share Ch.110.4▲
7 ▲ 55.484.66.7 ▲ 24 14.7 -7 ▼
14.1 ▲
24
15 3,901.4
68.30 - 67.64
4.3
-2.3
235.1 ▲ 225.1
▲
22 13.5
Industry % Change from Same Period Last Year
37 22.7
▼▲ 15.0%
4
Market Market# of Deals
8.9Fees
91,532.5 100.0 163 24 1,239.2 100.0
▼
▼
2.9
-0.325.8
-0.6
9.5
0.0
▼
-1.22.1
▲
-
4.5
EMEA Imputed Fees Jan 1- Dec 31
▲
▲
ManagerShare %
▲
▲
-51.4%
▼
▼5.5 1.15.5
▲
4.5
▲20.6%
▲9 ▲ 1.08.0
Jan 1 - Dec 31
Imputed Fees (US$m)
EMEA Sponsored Loans (P13)
6.7Credit Agricole CIB 3 10 6,365.8JP Morgan
Bookrunner Total
4 0.86.81.4
2 6,091.97.0
Industry % Change from Last Quarter -51.3%-48.6%
# of Deals per Bookrunner
Share %Proceeds
▼
Change in Market Market
Proceeds per Bookrunner (US$m)Market
Share %# of2014
Rank
99.1
Bookrunner8,668.8Deutsche Bank 1
BNP Paribas SA 2 4 7,681.2 22.7▲1 9.5
▲ 268.4 ▲
16.07.0
Goldman Sachs & Co 518.45.5 ▲
6 5,372.7 5.9
5.5 5.58 5,060.9
5.9 ▲
▲ 19UniCredit 6 3 5,074.5 305.5Nomura 7
23
Credit Suisse 9
1,849.2
13 2,492.0HSBC Holdings PLC 12
18
Societe GeneraleNatixis 10
3.9 3.9
9 2,072.3Barclays
4.3
2.3
0.2
3,703.311 13 3,695.7 4.0
4.1
5 3,544.94.0
ING 8 11 4,652.9
17 783.4 0.9 ▼821.5
▲
▼ 9RBC Capital Markets 23 5.5Rabobank NV 24
▲Industry % Change from Last Quarter -44.5% ▼ -57.4% ▼ -46.1% ▼
8.8%▲ ▲4.6% 17.3%
14.21.20.9
Mizuho Financial Group 22▲
0
8
Nordea 17 19 1,778.7 1.9 0.1
14 1,520.6 1.7Bank of America Merrill LynchRBS 19
720.1
1.9
35 918.121 979.9
Commerzbank AG 20 12Citi 21
1,281.4
Morgan Stanley 15 16 1,964.6 2.2 2.2
4.124
UBS 14
Lloyds Bank 16 20
-0.9
21.3
1,754.6
▲513.57 ▲
▲ 2214.7 -4
-7
-
4.9 1
3.1
5
-4 ▼
-0.3
0.314.1
1.41.7
16.7
-1 ▼9 5.5
1
-0.2
5
1.7
1.72.0
-2.0
2.7 2.7
18
▼
-2.50.2
▲ 214.3
1.9
▼17.8 1.4 -0.9 ▼
44.7
20.6
3.6
1.41.1 1.1
0
1.1
▼
1.1▲ -1.0
1.6
▲
▼1.9 ▲
▲
▲
▲
▲59.1 4.8
0.7
38.9 1.6 ▲1.314.1
--14.9
6.711
25.1
8.69
-0.2
▼5
▼
-66.7118
23.0▼
▲ 56.271.413.5 5.87 ▲
4.43.1
▲ 05.59▲▲
▲
▼
54.54 ▲
0 - 3.239.114
▲
-0.8
5.52.3
▼1.2
▲
2.54-1.3
1.022
1.4▲▲3.11.0
11.7
Top Twenty Five TotalBookrunner Total 165,200.5 100.0 246 42 1,786.5 100.0
▼Industry % Change from Same Period Last Year
140,774.9 85.3 4.4 ▲ 1,442.4 80.9 3.1 ▲
Landesbank Baden-Wurttemberg 25 48* 662.6 0.7 0.6 ▲ 3 1.8 2 ▲ 7.7 0.6 0.5 ▲Top Twenty Five Total 82,030.3 89.6 -1.2 ▼ 1,062.3 85.7 1.6 ▲
1,697
1,945 2,048
1,368
1,012
1,283
1,659
1,355
1,556
1,764
0
500
1000
1500
2000
2500
$0
$1,000
$2,000
$3,000
$4,000
$5,000
$6,000
$7,000
$8,000
2005 2006 2007 2008 2009 2010 2011 2012 2013 2014
# of
Issu
es
Tota
l Im
pute
d Fe
es (U
S$m
)
Total Imputed Fees (US$m)Number of Deals
$225.319%
$202.817%
$137.111%$126.7
11%
$108.49%
$68.26%
$66.15%
$63.55%
$57.55%
$56.35%
$44.94% Energy and Power
Materials
Financials
Consumer Staples
Media and Entertainment
Healthcare
Retail
Telecommunications
Consumer Products and Services
High Technology
Real Estate
https://www.thomsonone.comVisit http://dmi.thomsonreuters.com to View Archives and Order Custom League Tables8
Jan 1 - Dec 31 2014Top Asia Syndicated Loans (Ex Japan, Ex Australia)
Proceeds per Bookrunner (US$m) # of Deals per Bookrunner Imputed Fees (US$m)Market Change in 2014
Rank
Full Year 2014 | Syndicated Loans | Managing Underwriters
Asia (ex-Japan)Asia & Australia Syndicated Loans - Highest on Record l Liaoning Hongyanhe - Largest Deal in the Fourth Quarter
Asia Loans - Bookrunners (All Currencies) (S5c) Jan 1 - Dec 31Asia & Australia Deals Intelligence
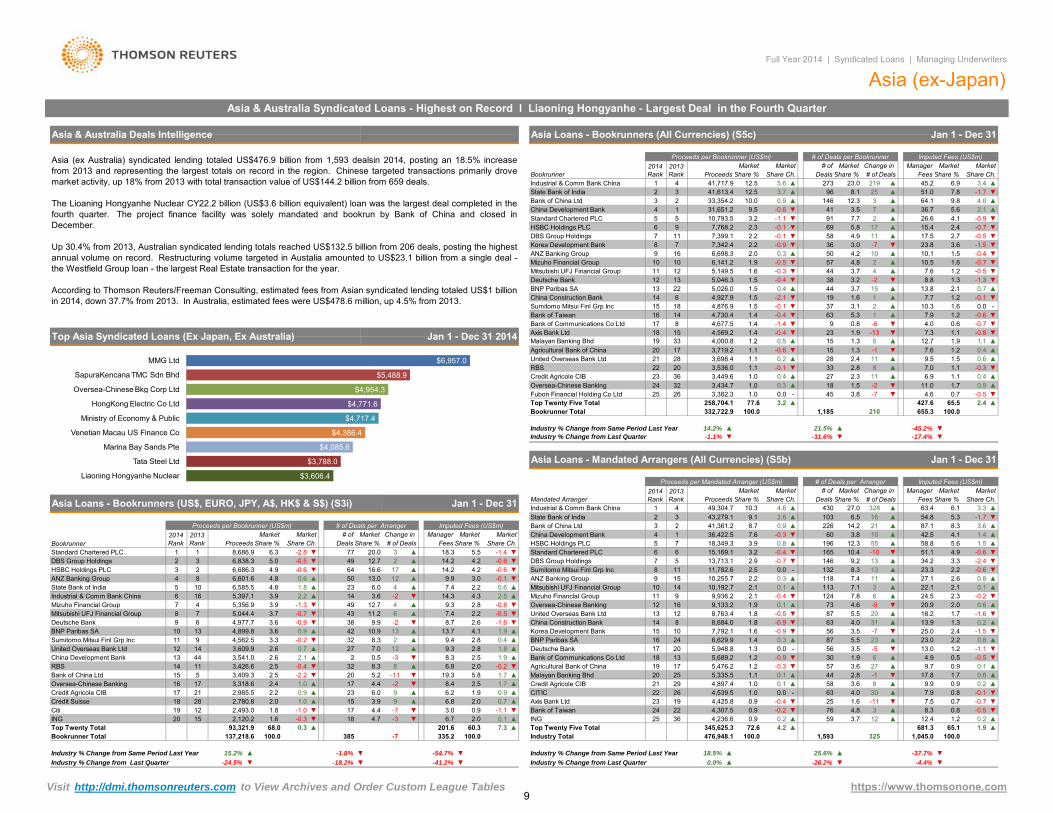
Asia (ex Australia) syndicated lending totaled US$476.9 billion from 1,593 dealsin 2014, posting an 18.5% increasefrom 2013 and representing the largest totals on record in the region. Chinese targeted transactions primarily drovemarket activity, up 18% from 2013 with total transaction value of US$144.2 billion from 659 deals.
The Lioaning Hongyanhe Nuclear CY22.2 billion (US$3.6 billion equivalent) loan was the largest deal completed in thefourth quarter. The project finance facility was solely mandated and bookrun by Bank of China and closed inDecember. Up 30.4% from 2013, Australian syndicated lending totals reached US$132.5 billion from 206 deals, posting the highestannual volume on record. Restructuring volume targeted in Austalia amounted to US$23.1 billion from a single deal -the Westfield Group loan - the largest Real Estate transaction for the year.
According to Thomson Reuters/Freeman Consulting, estimated fees from Asian syndicated lending totaled US$1 billionin 2014, down 37.7% from 2013. In Australia, estimated fees were US$478.6 million, up 4.5% from 2013.
2013 Rank
MarketManagerDeals
# of MarketShare % Share Ch.
Market
51.025 ▲273
8.1
Share Ch.
7.8 -1.7
Fees
-0.92.1
3
▲ 26.6 4.127
▲ 64.1
▼36.7
-0.515.4
▲-0.7 ▼
▼
▲9.8 4.0▲5.6▲
41,613.441,717.9 12.5 ▲5.6 ▲6.9 3.4
▼▲Industrial & Comm Bank China
MarketShare %
45.223.0 219# of Deals Share %Bookrunner Proceeds
12.5 3.7146
▲▲
960.9
1 4State Bank of India 2 3
9.510.0
1Bank of China Ltd 3
-0.6 3.512.3
▼ 4191 7.7▼
31,651.23.2
China Development Bank 42 33,354.2
2.3 -0.1Standard Chartered PLC 5 5 10,793.5 -1.1
5.8 17▼
694.9
2.411 7,399.1 17.5
▲6 9112.2
▼7,768.2-0.1 2.7
HSBC Holdings PLC
▼2.2 -0.9 ▼58DBS Group Holdings 7
▼6,698.3
36Korea Development Bank 8 7 7,342.4500.3
3.6
▲
-72.0 ▲ANZ Banking Group 9 16
Mizuho Financial Group 10 10-0.4
3.0 -1.523.810 ▲
▼6,141.2 1.9 -0.5 ▼
-0.31.611 12 5,149.5 ▼4.8 2 10.5 ▼3.7 4 ▲ 7.6
▼1.510.1
44-0.71.6
4.257
13 5,046.3 -2 ▼1.5Deutsche Bank 120.41.5
1.3▲
-0.4 ▼13.8
Mitsubishi UFJ Financial Group 1.2 -0.5
BNP Paribas SA 13 22 5,026.03.2 -1.38.8
14 6▲ 44
7.74,927.915
▼ 1.63.7
-1.6 0.0-0.1China Construction Bank
3.118 4,876.91.5 -2.1
▲▼
19 ▼
380.7
▲ 1.22.1
2 ▲ 10.31
▼ 371.51.4 -0.4
-0.1Sumitomo Mitsui Finl Grp Inc 15Bank of Taiwan 16 14 4,730.4
-6 -0.75.3 -0.67.9 1.21 ▲0.8 0.6▼
Axis Bank Ltd 1.4▼▼
▼ 4.09▼ 63
-13 -0.81.9
▼Bank of Communications Co Ltd 17 8 1.4
18 15-1.4
1.2 0.5
4,677.5-0.4
4,000.84,569.2
0.420 17 3,719.21.1
1.115
▼ 7.31.9
1.1
20
15
▼1.3 5 ▲ 12.7 ▲
2319
▲
3,536.0
1.23,698.4
2.81.1 0.2
1.32.4
1.121
RBS 22
▲-1▼
33
28
Malayan Banking Bhd
8
-0.6
6.927
▲287.6
▲33
▼▲
1.1 -0.1 ▼ ▼▲ 11 0.69.5 1.5
-0.37.011 ▲ ▲2.30.4 0.41.1▲1.0Credit Agricole CIB 3623 3,449.6
United Overseas Bank LtdAgricultural Bank of China
$6,957.0
$5,488.9
MMG Ltd
SapuraKencana TMC Sdn Bhd
Bookrunner
▲6.7 2.0
Bookrunner Total
▼ 18Top Twenty Total 60.3
0.1ING 20 15 2,120.2 1.6 -0.3 4.7 -3 ▼Citi 19 12 2,493.0 1.8 -1.0 ▼ 17 4.4 -1.1
1.96.29▲9
0.9
▼2,780.8 2.0 1.0 15 3.9
-7 ▼ 3.0 0.9
▲ 23 6.0▲
▲Credit Suisse 0.76.8 2.0
▲18 28
2.5 1.7 ▲
▲
▲ 17 4.4 -2Credit Agricole CIB 17 21 2,985.5 2.2 0.9
▼ 8.4Oversea-Chinese Banking 16 17 3,318.6 2.4 1.0-11 ▼ 19.3 5.8 1.7 ▲
▼Bank of China Ltd 15 5 3,409.3 2.5 -2.2 ▼ 20 5.2
8.3 8 ▲ 6.8 2.0 -0.22.5 1.9
RBS 14 11 3,426.6 2.5 -0.4 ▼ 32▲ 2 0.5 -3 ▼ 8.3China Development Bank 13 44 3,541.0 2.6 2.1
12 ▲ 9.3 2.8 1.8 ▲9.4 0.4
12 14 3,609.9 2.6 0.7 ▲ 27 7.0-0.2 ▼ 32 8.3 2 ▲
42 10.9 13 ▲ 13.7Sumitomo Mitsui Finl Grp Inc 11 9 4,562.5 3.3
-2 ▼ 8.7BNP Paribas SA 10 13 4,899.8 3.6 0.9 ▲
7.4Deutsche Bank 9 6 4,977.7 3.6 -0.9 ▼ 38 9.9
-0.7 ▼ 43 11.2 6 ▲49 12.7 4 ▲ 9.3
Mitsubishi UFJ Financial Group 8 7 5,044.4 3.7
-2 ▼ 14.3Mizuho Financial Group 7 4 5,356.9 3.9 -1.3 ▼
7.4Industrial & Comm Bank China 6 16 5,397.1 3.9 2.2 ▲ 14 3.6
1.8 ▲ 23 6.0 4 ▲0.6 ▲ 50 13.0 12 ▲
64 16.6 17 ▲ 14.2ANZ Banking Group 4 8 6,601.6 4.8
2 ▲ 14.2HSBC Holdings PLC 3 2 6,686.3 4.9 -0.6 ▼
▲
Market # ofDeals
▼ 77 20.0 3
2013 Rank # of Deals Fees
Market Change in
Jan 1 - Dec 31
Share %Share Ch. Share %Market MarketManager
18.3Proceeds Share %
8,686.9 6.3
2014 Rank
Asia Loans - Bookrunners (US$, EURO, JPY, A$, HK$ & S$) (S3i)
-0.5 ▼ 49 12.7-2.8
MarketProceeds per Bookrunner (US$m) # of Deals per Arranger
3 6,838.3 5.0
United Overseas Bank Ltd
State Bank of India 5 10 6,585.5 4.8
Standard Chartered PLC 1 1DBS Group Holdings 2
2.2 0.6-0.1
2.6 -1.6 ▼2.2 -0.5
4.1 1.92.8
Imputed Fees (US$m)
-0.8
▲4.3 2.5 ▲2.8
9.9
Share Ch.
3.0
4.24.2 -0.6
-0.6▼
5.5▼
-1.4 ▼
▼
▼
▲
▲
▼
▲
3.687.1 ▲21 8.3
▲3.36.5 54.8 -1.7 ▼
63.4 6.1▲ 5.3
328 ▲
10
16▲
7.614.2
2.68.7
3.8
2.9
▲
-0.3 ▼ 603.9
226
-0.7 ▼
4,425.8
13,713.1
# ofMarketMandated Arranger
2013 Rank
Industrial & Comm Bank China
MarketProceeds DealsShare Ch.
33
43,279.1Bank of China Ltd
2014 Rank
41
2 41,361.2
4.6
0.9
9.2146▼
103
6
▲
MarketShare Ch.Fees Share %
Market
27.0Share %
Malayan Banking Bhd
Bank of Communications Co Ltd
Manager
5,689.2
36,422.5
9.1
7
1
21
▲
8,763.4
19
State Bank of India 2
BNP Paribas SA
Mitsubishi UFJ Financial Group10,255.7
DBS Group Holdings
13
15,169.1
8
18
6
▲
4
10.3
18,349.3
-0.3
7
Industry % Change from Last Quarter -1.1%
Asia Loans - Mandated Arrangers (All Currencies) (S5b)
Change in MarketShare % # of Deals
49,304.7 430
15
China Development Bank
United Overseas Bank LtdOversea-Chinese Banking
Standard Chartered PLC5
Mizuho Financial Group 9
12
9 2.2
11
HSBC Holdings PLC
Sumitomo Mitsui Finl Grp Inc
5
17
Credit Agricole CIB
Imputed Fees (US$m)
Jan 1 - Dec 31
0.3 ▲ 1.7-0.5
427.6-7
0.91.5 -2
3.245
11.01.0
▲77.6
18 ▼▼0.7
65.5 ▲
-17.4%
4.6▼3.8▲
100.02.4
1,185 655.3
▼▼
▼21.5% ▲
▼-45.2%
3,434.7
Top Twenty Five Total3,382.3
24
Bookrunner Total
Fubon Financial Holding Co Ltd258,704.1
3225 26
▲ 42.5 4.10.8
Industry % Change from Same Period Last Year 14.2%
210100.0
-31.6%
Proceeds per Mandated Arranger (US$m) # of Deals per Arranger
1.0
332,722.9
Oversea-Chinese Banking0.0 -
▲12.3 55 ▲ 58.8
▼-10 ▼
1.4
10.4▲5.6
3.2 51.1165196
-0.41.5▲
132▼
4.9▲ 34.2 -2.4
-0.63.313
8.3▲▼
27.18 11 11,782.6 2.5 13 ▲0.0 -0.623.3 2.2
22.1 2.17.4 2.611
▲10,192.710 14ANZ Banking Group 0.8▲▲
▲118
-0.4 ▼ 2.3 -0.22.11132.1 0.1124
0.1
5.5
9,936.2▲
7.8 6 ▲ 24.5 ▼7.1 3
4.6 0.620.9 2.0-9 ▼73 ▲
63▲ 18.2
▲1.7 ▼20 -1.6
0.1 ▲1.81.8 -0.9 ▼
▼1.9
-7 ▼▼ 56
12 16 9,133.287-0.513
25.0China Construction Bank 14 8,684.0Korea Development Bank 15 10 7,792.1 1.6 -0.9 ▼
4.0 31 ▲ 0.2-1.5
13.9 1.32.43.5
Deutsche Bank 1.3▲2.223 ▲
3.5 1.25.5
▼0.823.0
20 5,948.816 24 6,629.9 87▲1.4 0.3
1.256
1.9-0.9 ▼-0.0
30 0.5 ▼4.96 ▲13.0 -1.1 ▼
-0.5-5
20 25 5,335.51.2 0.157-0.3 ▼ 3.6 27
▲17.8 1.7▼ 0.6▲▲ 9.7 0.9Agricultural Bank of China
-119 17 5,476.2
1.1 0.1 ▲ 2.844▲0.129 4,897.4 ▲58 0.23.6
CITIC0.98 ▲ 9.9
22 26 4,539.51.0
30 ▼1.0 0.0 - 63 4.0 ▲ 0.8 -0.17.9-0.4
▼ 76 4.80.9▼ 25 1.6
3-11
Bank of Taiwan 24 22 4,307.5Axis Bank Ltd 23
-0.20.9 ▼
-0.5▲ 8.3 ▼0.80.7 -0.7▼ 7.5
ING 25 36Top Twenty Five Total
4,236.61.9
▲▲
0.9 ▲ 120.2 0.2 ▲12.4▲
1.2
1,593
3.75965.1
1,045.0 100.0681.3
32572.6 4.2
476,948.1345,625.3
100.0
Industry % Change from Same Period Last Year 18.5% ▲ 25.6%
Industry Total
-37.7%▲▼0 0% ▲ 26 2% 4 4%
7.3 ▲
▼I d t % Ch f L t Q t-54.7% ▼ ▼
▼
385137,218.6 100.0
▼
100.0335.2201.6
▼
-70.3
15.2%
93,321.9 68.0 ▲
18 2% ▼ 41 2%-1.8%Industry % Change from Same Period Last Year ▲
I d t % Ch f L t Q t 24 5%
$4,954.3
$4,771.6
$4,717.4
$4,386.4
$4,085.6
$3,788.0
$3,606.4
Oversea-Chinese Bkg Corp Ltd
HongKong Electric Co Ltd
Ministry of Economy & Public
Venetian Macau US Finance Co
Marina Bay Sands Pte
Tata Steel Ltd
Liaoning Hongyanhe Nuclear
Visit http://dmi.thomsonreuters.com to View Archives and Order Custom League Tables
▼
https://www.thomsonone.com
0.0% ▲ -26.2% -4.4% ▼Industry % Change from Last Quarter▼▼ -18.2% ▼ -41.2%Industry % Change from Last Quarter -24.5%
9
------
3.02.1 2 ▲ 9.6 5.0 ▲
*tie
0.7 0.0 - Scotiabank1.1
Industry % Change from Same Period Last Year
Credit Agricole CIB 10 18 1,021.1 1.9
5
4
2.6 -1 ▼ -1.5
▲- 2 2.4 -2 ▼
▼1.4RBS 9 11 1,137.0 2.1 0.0
▼ 3.03.2 -1.0 ▼
5.8Sumitomo Mitsui Finl Grp Inc 8 5 1,214.2 2.3 -1.4▼ 8 3.0 1 ▲ 6.1
4.0 2.1 -1.6 ▼HSBC Holdings PLC 7 8 1,453.7 2.7 -0.3
▲ ▼
Mitsubishi UFJ Financial Group
Asian Loans by Maturity Date
89
2.9 -0.7 ▼ 7 3.3 1 ▲
11
Mitsubishi UFJ Financial Group
14.9
2 2
▲7 1,562.3
4 8,011.6
16.8
2013 Rank Proceeds
Asia (ex-Japan) & Australia
Bookrunner
1,981.15
6
9
Top Australia Syndicated Loans
53,746.4
1.0
Jan 1 - Dec 31 2014
8.266
Commonwealth Bank of Australia
0.62.7
Top Ten Total
30.4%
3.7▼
1
Credit Agricole CIB
0.8
▲-0.1 ▼
▲
206
4,896.4
10
Industry % Change from Same Period Last Year
Commonwealth Bank of AustraliaMizuho Financial Group
18▲ 1.1▼
-0.1-0.1
-28
1.8▲
17
2.1 17.817.9▼35
Share Ch.2013 Rank
Manager Market 2014 Rank
2 -1.4
# of
Australia Loans - Mandated Arrangers (All Currencies) (S6a) Jan 1 - Dec 31
▼17,261.2
Mandated Arranger # of DealsChange in
Share Ch.Manager Market
▲ 2
13
Westpac Banking
6
27.412
-1
▲
National Australia Bank12.6 ▲
16,663.13
0.5
▲
▼Industry % Change from Last Quarter -18.6%
6 ▲4.2
132,456.4
11.5
▼
12.66.1
1
4.2
▲
▼
26.75
1.44
7 ▲
Fees6.3
1.5
5.6 5
58.8
3.14.1
1.15.1
▲ 19.49
325.23
▲
0.2 ▲
0.9
▲
14.6
3.757.8
2.6
68.1
Share %# of Deals Share % Deals13.9
Market
-1.5 ▼
Full Year 2014 | Syndicated Loans | Managing Underwriters
Proceeds per Mandated Arranger (US$m)
15.0%Industry % Change from Last Quarter 99.6% ▲ 52.6% ▲ 45.5%
Industry Total 100.0
▲
-12
▼-18.4%
MarketMarket MarketShare %Proceeds
▲
▲-7 ▼
# of Deals per Arranger Imputed Fees (US$m)
90,622.4100.0
62.5
▲
▼13.1
-2.5▲▼ -0.4
0.612.3
Market
▼
12.2
-10 ▼136119 6.1
58.65
16,514.8 12.5 -0.5
-2.1
108▼
13.0
3
ANZ Banking Group 1
▼4 4 15,236.5 -0.7 ▼ 0.3104 12.1
40
37
4.5%
-1.0478.6
▼▲
-5.5%
2.9 -0.4
4.3
2.368.5
7 3.03,830.4
5
1.45
8
Sumitomo Mitsui Finl Grp Inc 3.7 -0.3 3.83,915.2
HSBC Holdings PLC 7 5,671.8 1.2 ▲
▼34.9% ▲
▲RBS 21 3,082.5 1.3 11 ▲
9
Jan 1 - Dec 31
Proceeds per Bookrunner (US$m) # of Deals per Bookrunner Imputed Fees (US$m)
Share %
Australia Loans - Bookrunners (All Currencies) (S7)
Market
ANZ Banking Group
1.010 3,550.5 1.3 12.7
Market # of MarketShare %
Change in
1 1 -0.3 ▼Share Ch.
2014 Rank
9,006.2 18.9
Deals Share % Share Ch.Fees10,871.0
36National Australia Bank 3 8,995.7 29
20.214.2Westpac Banking
22.7
1.33 ▲16.7 18.8
45
21.7 -2.2- 2.0▲0.0
▼4 ▲ 27 24.4 1.9▲16.72.5
11.3
▲Top Ten Total 53,746.4 100.0 0.7Bookrunner Total 192.7 100.0100.0
▲ 14.1% ▲ -13.7%
56.2 1.0108.4 ▲
1000
1200
1400
250.00
300.00 Proceeds (US$b)
# of Issues
$23,107.1
$7,145.1
$6 102 6
Westfield Group
Roy Hill Holdings Pty Ltd
O i i E Ltd
Australian Loans Proceeds by Industry (US$m) Full YearJan 1 - Dec 31 2014 Asian Loans by Currency (%)
$30,364.933%
$18,099.720%
$10,863.612%
$8,324.3 9%
$7,330.38%$4,641.8
5%
$2,973.53%
$2,867.83%
$2,393.73%
3278.6, 2%2893.8, 2%2292.3, 2%
Real Estate
Financials
Energy and Power
Industrials
Materials
Telecommunications
Media and Entertainment
Healthcare
Consumer Staples
Consumer Products and Services
High Technology
Retail
46.1% 44.7% 50.3% 56.0% 71.8% 68.6% 59.8% 64.1% 56.7% 59.9%
53.9% 55.3%49.7%
44.0%
28.2%31.4%
40.2%35.9%
43.3%40.1%
2005 2006 2007 2008 2009 2010 2011 2012 2013 2014
Local Currency G3
$225.7 $251.7 $212.5 $196.0 $180.70
200
400
600
800
1000
-
50.00
100.00
150.00
200.00
2014 2015 2016 2017 2018
# of
Issu
es
Pro
ceed
s (U
S$b
)$6,102.6
$4,100.0
$3,500.0
$3,070.7
$2,050.0
$1,880.6
$1,791.1
Origin Energy Ltd
APA Group
Vodafone Hutchison Finance
Stella EWL FInance Pty Ltd
Viva Energy Pty Ltd
American Express Credit Corp
Sun Group Finance Pty Ltd
https://www.thomsonone.comVisit http://dmi.thomsonreuters.com to View Archives and Order Custom League Tables
Local Currency G3
10
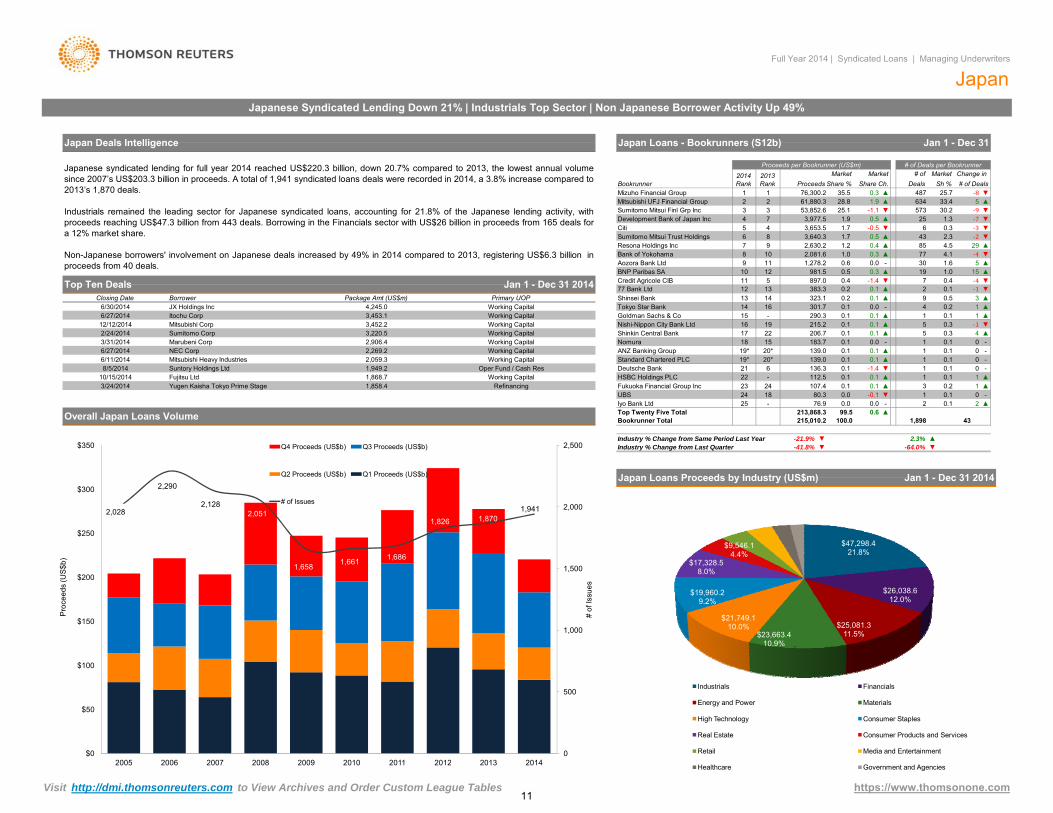
1 0.1 1 ▲0.1 0 -
HSBC Holdings PLC 22 - 112.5 0.1 0.1 ▲
0 -Deutsche Bank 21 6 136.3 0.1 -1.4 ▼ 1
139.0 0.1 0.1 ▲ 1 0.1
6/27/201412/12/20142/24/2014
Working CapitalWorking Capital
Suntory Holdings Ltd
Working CapitalMitsubishi Corp
Marubeni CorpWorking Capital
Top Ten DealsClosing Date
2,906.4
8/5/2014
2,269.2Mitsubishi Heavy Industries
Working Capital
1,949.2Working Capital
JX Holdings Inc6/30/2014 4,245.0
Sumitomo Corp
Standard Chartered PLC 19* 20*
Japan Deals Intelligence
Package Amt (US$m)Borrower
Jan 1 - Dec 31 2014
Working CapitalPrimary UOP
16
10/15/2014 1,868.7Fujitsu Ltd
2,059.36/27/20146/11/2014
14
Nomura
Tokyo Star Bank
20*
301.7
206.7
Goldman Sachs & Co
18
215.2
Working Capital
3,453.1
3/31/2014
Itochu Corp
Oper Fund / Cash Res
NEC Corp
3,452.23,220.5
383.314
981.5
290.3
897.05
Full Year 2014 | Syndicated Loans | Managing Underwriters
JapanJapanese Syndicated Lending Down 21% | Industrials Top Sector | Non Japanese Borrower Activity Up 49%
7 1.2Sumitomo Mitsui Trust Holdings
11
6
1.3
0.2
12
77 Bank Ltd 13
1.0
12Credit Agricole CIB -1.411BNP Paribas SA 10
22Shinkin Central BankNishi-Nippon City Bank Ltd
-
17
Shinsei Bank 13
1Mitsubishi UFJ Financial Group
53,852.6
12
5 4
3
Sh %Change in
0.3
# of
63425.7 ▼
▲5▲
Share %▲
2,081.6
28.8
2,630.2
Share Ch.Proceeds
3,977.5
35.561,880.3
2013 Rank
2014 Rank
Sumitomo Mitsui Finl Grp Inc 37
Bookrunner
Development Bank of Japan Inc 4
Mizuho Financial Group2
Jan 1 - Dec 31
‐8
Market Market
Japan Loans - Bookrunners (S12b)
Deals76,300.2
Proceeds per Bookrunner (US$m) # of Deals per BookrunnerMarket
1.9 0.5 ▼‐7
# of Deals
1.9487
Bank of Yokohama
1.7
9
Citi
10
89
Aozora Bank Ltd8
Resona Holdings Inc
33.430.2 ‐9
253,653.5 ▼1.7
573▼25.1
3,640.30.4
190.30.60.5
43
0.31,278.2 0.0
-1.1
▼‐2 ▼
-0.5
▼▲
▲0.5 2.3
‐36 0.3▲
‐485
5
4.5▲ 29▲
▼▼
▼7730 1.6 ▲
▲
4.1
7‐1
▼
-
▲‐4
0.1
15▲0.41.0
2
160.1
0.50.1
0.40.2
9323.1 ▲ ▲▲1
30.10.2-0.1
0.10.10.1
▲40.0
0.1▲▲
▲▼0.3 ‐1▲0.3 4
1
0-
0.1
5
1
0.110.0
50.1
0.1183.715 -0.1
-▲1 00.1
0.1
ANZ Banking Group 139.019*
1915
Japanese syndicated lending for full year 2014 reached US$220.3 billion, down 20.7% compared to 2013, the lowest annual volumesince 2007’s US$203.3 billion in proceeds. A total of 1,941 syndicated loans deals were recorded in 2014, a 3.8% increase compared to2013’s 1,870 deals.
Industrials remained the leading sector for Japanese syndicated loans, accounting for 21.8% of the Japanese lending activity, withproceeds reaching US$47.3 billion from 443 deals. Borrowing in the Financials sector with US$26 billion in proceeds from 165 deals fora 12% market share.
Non-Japanese borrowers' involvement on Japanese deals increased by 49% in 2014 compared to 2013, registering US$6.3 billion inproceeds from 40 deals.
Top Twenty Five Total215,010.2Bookrunner Total
▲0.6213,868.32 ▲Iyo Bank Ltd 25 - 76.9 0.0 0.0
UBS 24 18 80.3 0.0 -0.1
Industry % Change from Same Period Last Year -21.9% ▼ 2.3% ▲Industry % Change from Last Quarter -41.8% ▼ -64.0% ▼
43
▲ 3 0.2 1 ▲▼ 1 0.1 0 -
Fukuoka Financial Group Inc 23 24 107.4 0.1 0.1g
1,898100.0
- 2 0.199.5
Refinancing1,858.43/24/2014,j
Overall Japan Loans Volume
g pYugen Kaisha Tokyo Prime Stage
Japan Loans Proceeds by Industry (US$m) Jan 1 - Dec 31 2014
2,028
2,290
2,1282,051
1,6581,661 1,686
1,826 1,8701,941
0
500
1,000
1,500
2,000
2,500
$0
$50
$100
$150
$200
$250
$300
$350
2005 2006 2007 2008 2009 2010 2011 2012 2013 2014
# of
Issu
es
Pro
ceed
s (U
S$b
)
Q4 Proceeds (US$b) Q3 Proceeds (US$b)
Q2 Proceeds (US$b) Q1 Proceeds (US$b)
# of Issues
$47,298.421.8%
$26,038.612.0%
$25,081.311.5%$23,663.4
10.9%
$21,749.110.0%
$19,960.29.2%
$17,328.58.0%
$9,546.14.4%
Industrials Financials
Energy and Power Materials
High Technology Consumer Staples
Real Estate Consumer Products and Services
Retail Media and Entertainment
.
https://www.thomsonone.comVisit http://dmi.thomsonreuters.com to View Archives and Order Custom League Tables
2005 2006 2007 2008 2009 2010 2011 2012 2013 2014 Healthcare Government and Agencies
11
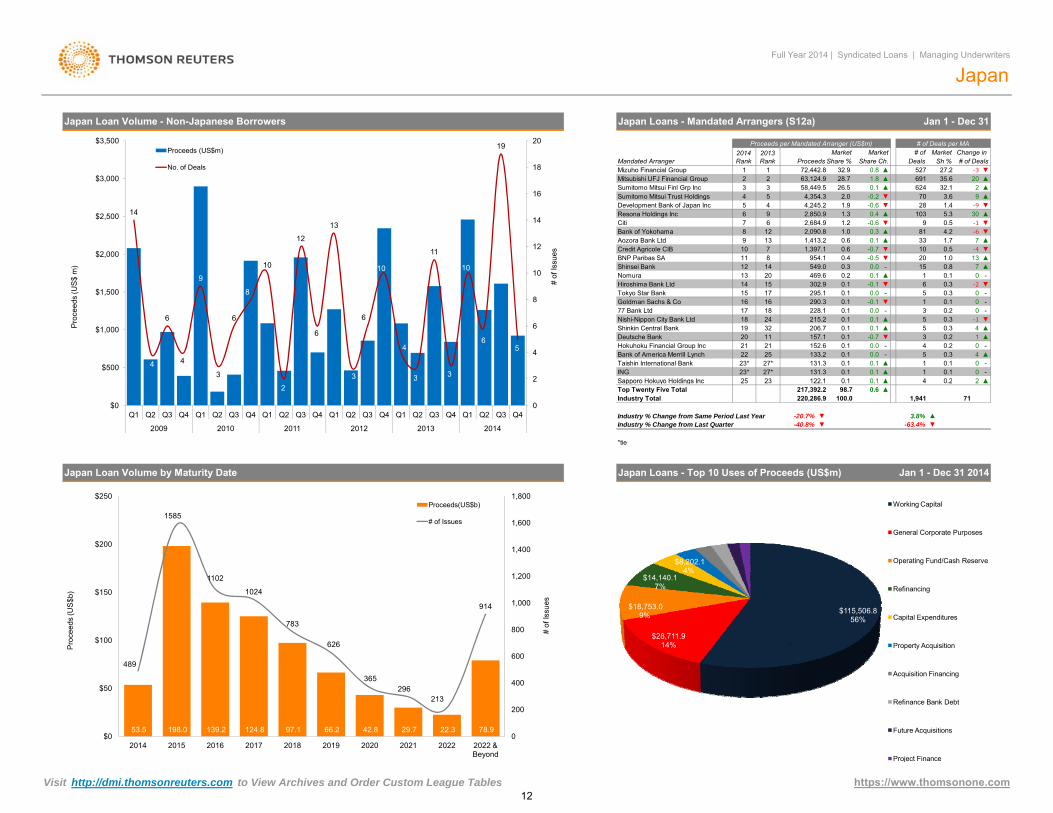
-
▲
0
5
81▼
BNP Paribas SA
Aozora Bank Ltd10
0.311
549.087
1,413.2Credit Agricole CIB
▲
Bank of Yokohama
Shinkin Central Bank 19 206.7
16
Hiroshima Bank Ltd
27*27*
Sapporo Hokuyo Holdings Inc
Goldman Sachs & Co17
24
15
18
-0.1
0.1
1677 Bank Ltd
215.2
Tokyo Star Bank
2015
Shinsei Bank 1412
23*25
157.1
0.10.1
302.9
228.10.1
0.111
469.6▼
0.0
17 18
14
0.132
290.3
13
0.1
-
Nomura
0.1Nishi-Nippon City Bank Ltd
-▼
295.10.1
0.1
▲2
▼89
0.3
-
16
ING
20
133.221
131.3
Hokuhoku Financial Group IncBank of America Merrill LynchTaishin International Bank
Deutsche Bank152.6
23* 1131.30 1 4
0.10.123 122 125 0 1
0.10 2▲
1 0.1-
0.35▲
▲4
-1
-▲
0
▲34
▲4-
0.30
001
‐1
▼
0 -
0.20.2
‐2
7
0.2 -▼
-
20
50.3
‐9
0.5
1.4
‐1
74.2
‐4
30
1.7
5.3
10 0.5
‐633
103
▲
-
13
0.10.0 ▲15 0.8
0
1.0954.1 0.41,397.1
9
1.0
1.3
▲2.0
0.4
12
▲
2,090.8
-0.6 ▼
2,684.9 -0.6
DealsChange in
32.1970 ▲3.6▲2
▲
▼28
35.6 ▲
▲▼
9
▼
624691
# of Deals per MA
Sh %Market
27.2 ‐3
0.0▼
13
6
▲
32.928.726.5
1
2,850.9
-0.1
1.2
▼
0.6 0.1
-0.7
0.6
0.1
▲▼
Proceeds
63,124.9
2013 Rank
0.1
0.2
Share %
1.9
58,449.55
Japan
▼
Full Year 2014 | Syndicated Loans | Managing Underwriters
Japan Loan Volume - Non-Japanese Borrowers
Share Ch.
Japan Loans - Mandated Arrangers (S12a)
Market
72,442.8
Jan 1 - Dec 31
2 ▲▲
20
Proceeds per Mandated Arranger (US$m)
527
# of# of Deals
Market
-0.5
3
Mandated Arranger1
4,354.3
1.8Mizuho Financial Group
2014 Rank
0.8
3Mitsubishi UFJ Financial Group 2
5
0.1
4 4,245.2
▼-0.7
Development Bank of Japan Inc-0.2
CitiResona Holdings Inc
0.3
4
7
0.0
0.13
Sumitomo Mitsui Finl Grp IncSumitomo Mitsui Trust Holdings
6
0.05
2122
0.10.10.3
▲
14
4
6
4
9
3
6
8
10
12
6
13
3
6
10
4
3
11
3
10
6
19
5
2
4
6
8
10
12
14
16
18
20
$500
$1,000
$1,500
$2,000
$2,500
$3,000
$3,500
# of
Issu
es
Pro
ceed
s (U
S$
m)
Proceeds (US$m)
No. of Deals
▼
220,286.9 100.0
▼
1,941
*tie
Industry % Change from Last Quarter -40.8% ▼ -63.4%
Japan Loan Volume by Maturity Date
Sapporo Hokuyo Holdings Inc
Japan Loans - Top 10 Uses of Proceeds (US$m)
▲20.6
Industry % Change from Same Period Last Year
0.1 4Top Twenty Five Total
23 122.125217,392.2
Industry Total
0.1
3.8%-20.7%
98.70.2▲
▲
▲71
Jan 1 - Dec 31 2014
23
0
2
$0Q1 Q2 Q3 Q4 Q1 Q2 Q3 Q4 Q1 Q2 Q3 Q4 Q1 Q2 Q3 Q4 Q1 Q2 Q3 Q4 Q1 Q2 Q3 Q4
2009 2010 2011 2012 2013 2014
53.5 198.0 139.2 124.8 97.1 66.2 42.8 29.7 22.3 78.9
489
1585
1102
1024
783
626
365296
213
914
0
200
400
600
800
1,000
1,200
1,400
1,600
1,800
$0
$50
$100
$150
$200
$250
2014 2015 2016 2017 2018 2019 2020 2021 2022 2022 & Beyond
# of
Issu
es
Pro
ceed
s (U
S$b
)
Proceeds(US$b)
# of Issues
$115,506.8 56%
$28,711.9 14%
$18,753.0 9%
$14,140.1 7%
$8,202.1 4%
Working Capital
General Corporate Purposes
Operating Fund/Cash Reserve
Refinancing
Capital Expenditures
Property Acquisition
Acquisition Financing
Refinance Bank Debt
Future Acquisitions
Project Finance
.
https://www.thomsonone.comVisit http://dmi.thomsonreuters.com to View Archives and Order Custom League Tables
Project Finance
12
-
-
-
-
-
-
Global, Americas, EMEA, Asia-Pacific and Japan bookrunner and mandated arranger league table volumes and rankings are based on general close date instead of financial close date.
Database coverage includes all loan transactions that have reached financial close by the submission deadline and of which Thomson Reuters has been made aware. All current andprevious year's data is as of 12:00pm EST on December 31, 2014.
Mandated Arranger league tables will give equal credit to the Non-Americas mandated arranger and equal credit to the Americas Tier 1 agent. In cases of consolidation, credit will be giviento the surviving/parent firm.
Bookrunner league tables will give full credit to the bookrunner, equal if joint. In cases of consolidation, credit will be given to the surviving/parent firm
All league tables are based on deal proceeds unless otherwise specified. Regional league tables are based on Target Market.
Bilateral, self-arranged, commercial and unknown loans are excluded from league tables as well as loans with a maturity of less than 90 days.
Full Year 2014 | Syndicated Loans | Managing Underwriters
Ranking Criteria Summary
E-mail: [email protected]
JapanMegumi KonoTel: +813 6441 1155
E-mail: [email protected]
Europe
If you would like to participate in the submission process, receive quarterly press releases, orhave questions about league table criteriaplease contact:
AmericasSalvatore ReresTel: +1 646 223-8455
Ewelina JareckaTel: +44 207 542 2246E-mail: [email protected]
Asia-PacificCarina Causon-IsraelTel: +632 858 7221E-mail: [email protected]
-
-
-
-
-
- Thomson Reuters Investment Banking loans data is compiled in conjunction with Loan Pricing Corporation (LPC). In combination, Thomson Reuters Investment Banking and LPC offer the most comprehensive and accurate view of the syndicated loans market available.
League table volumes for Mitsubishi UFJ Financial Group and Morgan Stanley, included herein, reflect changes after the commencement of their jointly established securities firms in Japan: (1) Mitsubishi UFJ Morgan Stanley Securities and (2) Morgan Stanley MUFG Securities. Credit for the newly established joint ventures rolls up to Morgan Stanley. For Japanese involvement league tables Morgan Stanley will be represented as "Mitsubishi UFJ Morgan Stanley".
Bookrunner league tables include club syndicate transactions that are sold down in the syndication process to firms that were not part of the original club syndicate. Mandated Arranger league tables include all club syndicate transactions, regardless of sell-down process.
Non-US dollar denominated transactions are converted to the US dollar equivalent at the time of pricing.
Imputed fees are calculated using Freeman Consulting proprietary algorithm where spreads or fees are not disclosed. Deal fees are on a gross basis before all expenses. Each underwriteror advisor is allocated its share of deal fees using Freeman & Co. allocation methodology, based on the number of underwriters or advisors on the deal and their role. No fees are allocatedto syndicated members.
Bookrunner and Mandated Arranger league tables only include amendments that require 100% lender vote for the following amendments: decrease in pricing, change in tenor if maturity is extended by a period of more than 90 days, guarantor or collateral release. An increase in deal size after syndication has ended will be reflected as an add on tranche.
While Thomson Reuters has used reasonable endeavors to ensure that the information provided in this document is accurate and up to date as at the time of issue, neither Thomson Reuters nor its third party content providers shall be liablefor any errors, inaccuracies or delays in the information, nor for any actions taken in reliance thereon, nor does it endorse any views or opinions of any third party content provider. Thomson Reuters disclaims all warranties, express orimplied, as to the accuracy or completeness of any of the content provided, or as to the fitness of the content for any purpose to the extent permitted by law. The content herein is not appropriate for the purposes of making a decision to carryout a transaction or trade and does not provide any form of advice (investment, tax, legal) amounting to investment advice, nor make any recommendations or solicitations regarding particular financial instruments, investments or products,including the buying or selling of securities. Thomson Reuters has not undertaken any liability or obligation relating to the purchase or sale of securities for or by any person in connection with this document.
© 2014 Thomson Reuters. All rights reserved.
Thomson Reuters and the Thomson Reuters logo are registered trademarks and trademarks of Thomson Reuters and its affiliated companies. Any third party name or mark herein belongs to the relevant third party.
https://www.thomsonone.com13
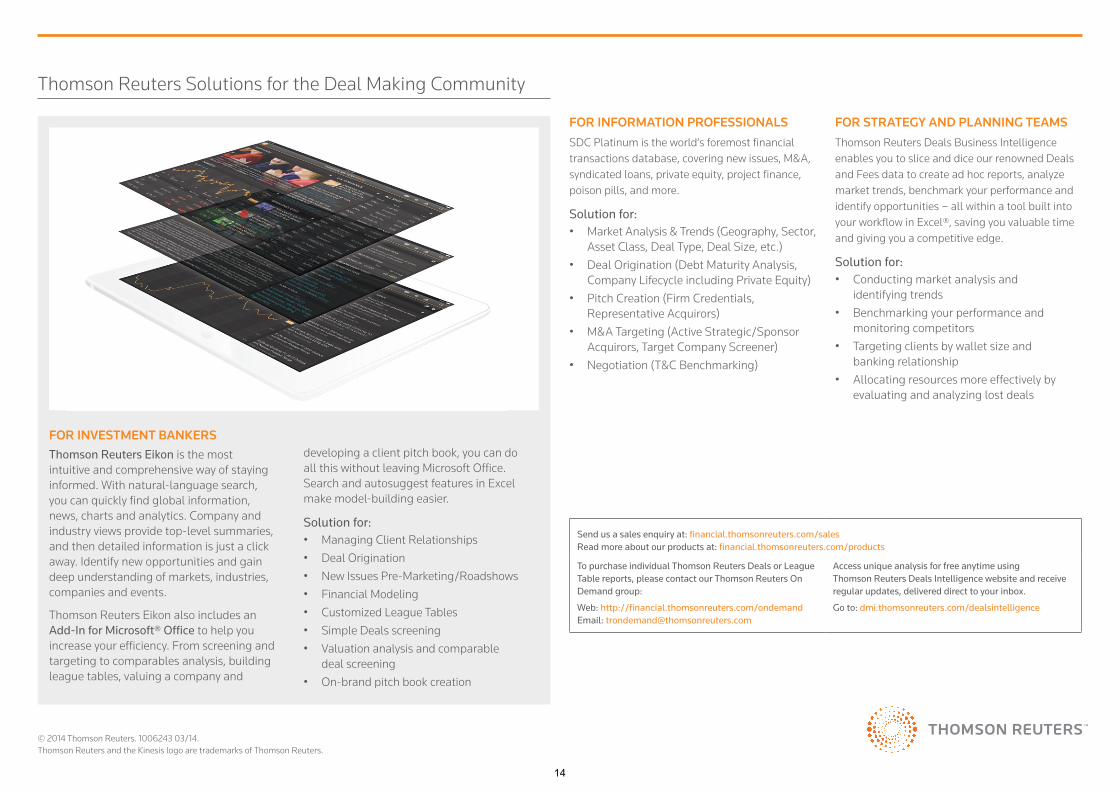
© 2014 Thomson Reuters. 1006243 03/14.Thomson Reuters and the Kinesis logo are trademarks of Thomson Reuters.
FOR INFORMATION PROFESSIONALSSDC Platinum is the world’s foremost financial transactions database, covering new issues, M&A, syndicated loans, private equity, project finance, poison pills, and more.
Solution for:• Market Analysis & Trends (Geography, Sector,
Asset Class, Deal Type, Deal Size, etc.)• Deal Origination (Debt Maturity Analysis,
Company Lifecycle including Private Equity)• Pitch Creation (Firm Credentials,
Representative Acquirors)• M&A Targeting (Active Strategic/Sponsor
Acquirors, Target Company Screener)• Negotiation (T&C Benchmarking)
FOR INVESTMENT BANKERSThomson Reuters Eikon is the most intuitive and comprehensive way of staying informed. With natural-language search, you can quickly find global information, news, charts and analytics. Company and industry views provide top-level summaries, and then detailed information is just a click away. Identify new opportunities and gain deep understanding of markets, industries, companies and events.
Thomson Reuters Eikon also includes an Add-In for Microsoft® Office to help you increase your efficiency. From screening and targeting to comparables analysis, building league tables, valuing a company and
developing a client pitch book, you can do all this without leaving Microsoft Office. Search and autosuggest features in Excel make model-building easier.
Solution for:• Managing Client Relationships• Deal Origination• New Issues Pre-Marketing/Roadshows• Financial Modeling• Customized League Tables• Simple Deals screening• Valuation analysis and comparable
deal screening• On-brand pitch book creation
FOR STRATEGY AND PLANNING TEAMSThomson Reuters Deals Business Intelligence enables you to slice and dice our renowned Deals and Fees data to create ad hoc reports, analyze market trends, benchmark your performance and identify opportunities – all within a tool built into your workflow in Excel®, saving you valuable time and giving you a competitive edge.
Solution for:• Conducting market analysis and
identifying trends• Benchmarking your performance and
monitoring competitors• Targeting clients by wallet size and
banking relationship• Allocating resources more effectively by
evaluating and analyzing lost deals
Send us a sales enquiry at: financial.thomsonreuters.com/salesRead more about our products at: financial.thomsonreuters.com/products
To purchase individual Thomson Reuters Deals or League Table reports, please contact our Thomson Reuters On Demand group:
Web: http://financial.thomsonreuters.com/ondemandEmail: [email protected]
Access unique analysis for free anytime using Thomson Reuters Deals Intelligence website and receive regular updates, delivered direct to your inbox.
Go to: dmi.thomsonreuters.com/dealsintelligence
Thomson Reuters Solutions for the Deal Making Community
14