GLOBAL SHALE GAS DEVELOPMENT Water Availability and ...
88
i Global Shale Gas Development: Water Availability and Business Risks WRI.ORG PAUL REIG, TIANYI LUO, AND JONATHAN N. PROCTOR GLOBAL SHALE GAS DEVELOPMENT Water Availability and Business Risks
Transcript of GLOBAL SHALE GAS DEVELOPMENT Water Availability and ...
iGlobal Shale Gas Development: Water Availability and Business Risks
WRI.ORG
PAUL REIG, TIANYI LUO, AND JONATHAN N. PROCTOR
GLOBAL SHALE GASDEVELOPMENTWater Availability and Business Risks
Design and layout by:Nick [email protected]

TABLE OF CONTENTSv Foreword
1 Executive Summary6 Key Findings8 Recommendations
11 Introduction
17 Shale Resources and Water18 Extraction of Shale Resources19 Water Requirements20 Freshwater Availability Risks
25 Assessing Fresh Water Availability and Business Risk
26 Methodology27 Geo-Database of Shale Basins and Plays27 Water Availability and Business Risk Indicators
31 Global Results34 Key Findings36 Country Comparisons
41 Conclusions and Recommendations42 Conclusions42 Recommendations
46 Appendix A: Country Analyses
74 Definitions
75 Endnotes

WRI.org iv
vGlobal Shale Gas Development: Water Availability and Business Risks
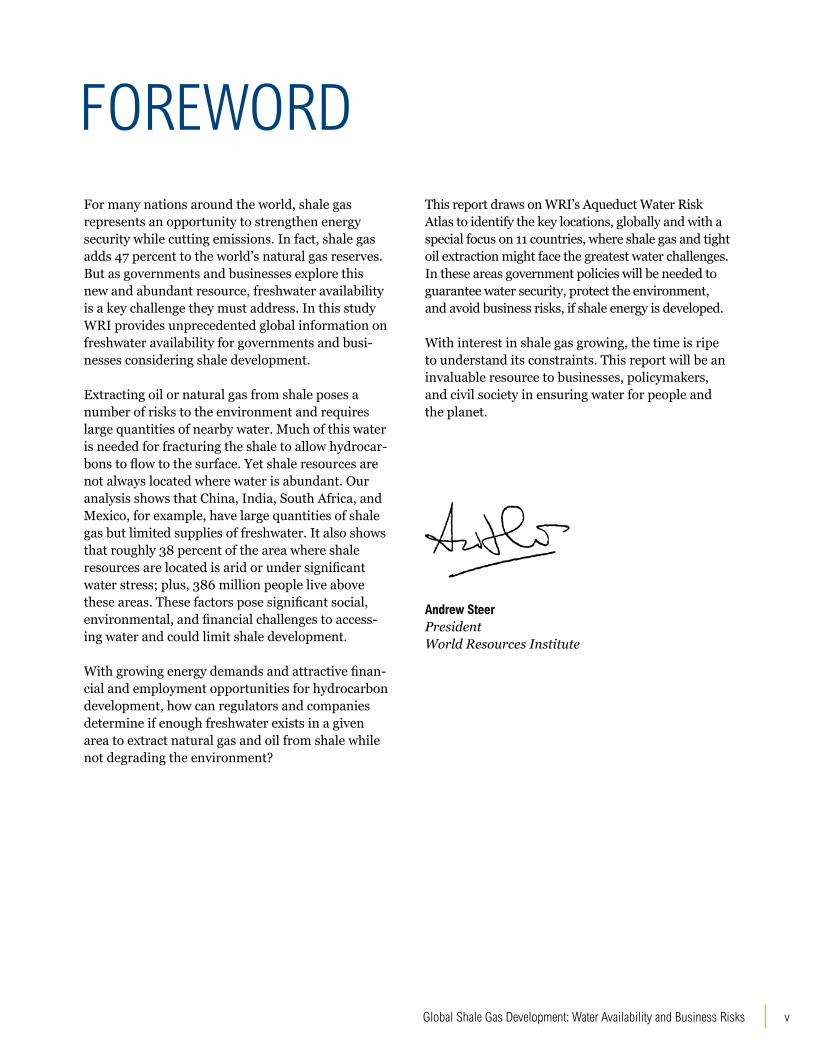
For many nations around the world, shale gas represents an opportunity to strengthen energy security while cutting emissions. In fact, shale gas adds 47 percent to the world’s natural gas reserves. But as governments and businesses explore this new and abundant resource, freshwater availability is a key challenge they must address. In this study WRI provides unprecedented global information on freshwater availability for governments and busi-nesses considering shale development.
Extracting oil or natural gas from shale poses a number of risks to the environment and requires large quantities of nearby water. Much of this water is needed for fracturing the shale to allow hydrocar-bons to flow to the surface. Yet shale resources are not always located where water is abundant. Our analysis shows that China, India, South Africa, and Mexico, for example, have large quantities of shale gas but limited supplies of freshwater. It also shows that roughly 38 percent of the area where shale resources are located is arid or under significant water stress; plus, 386 million people live above these areas. These factors pose significant social, environmental, and financial challenges to access-ing water and could limit shale development.
With growing energy demands and attractive finan-cial and employment opportunities for hydrocarbon development, how can regulators and companies determine if enough freshwater exists in a given area to extract natural gas and oil from shale while not degrading the environment?
This report draws on WRI’s Aqueduct Water Risk Atlas to identify the key locations, globally and with a special focus on 11 countries, where shale gas and tight oil extraction might face the greatest water challenges. In these areas government policies will be needed to guarantee water security, protect the environment, and avoid business risks, if shale energy is developed.
With interest in shale gas growing, the time is ripe to understand its constraints. This report will be an invaluable resource to businesses, policymakers, and civil society in ensuring water for people and the planet.
FOREWORD
Andrew SteerPresident World Resources Institute

WRI.org vi

1Global Shale Gas Development: Water Availability and Business Risks
EXECUTIVE SUMMARYLimited availability of freshwater could become a stumbling block for
rapid development of shale resources through hydraulic fracturing.
Using information from the Aqueduct Water Risk Atlas, WRI provides
the first global and country-specific resource to help stakeholders
evaluate freshwater availability across shale plays worldwide.
WRI.org 2
Innovation in hydraulic fracturing and horizontal drilling techniques is driving the rapid development of shale resources (which include shale gas, natural gas liquids, and tight oil) across the United States and Canada.1 Already, known shale deposits world-wide have significantly increased the volume of the world’s natural gas and oil resources. Governments from Argentina and the United Kingdom, to Mexico and China, have started to explore the commercial viability of their shale reserves.
The potential for expansion is huge: known shale gas deposits worldwide add 47 percent to the global technically recoverable natural gas resources, and underground stores of tight oil add 11 percent to the world’s technically recoverable oil.
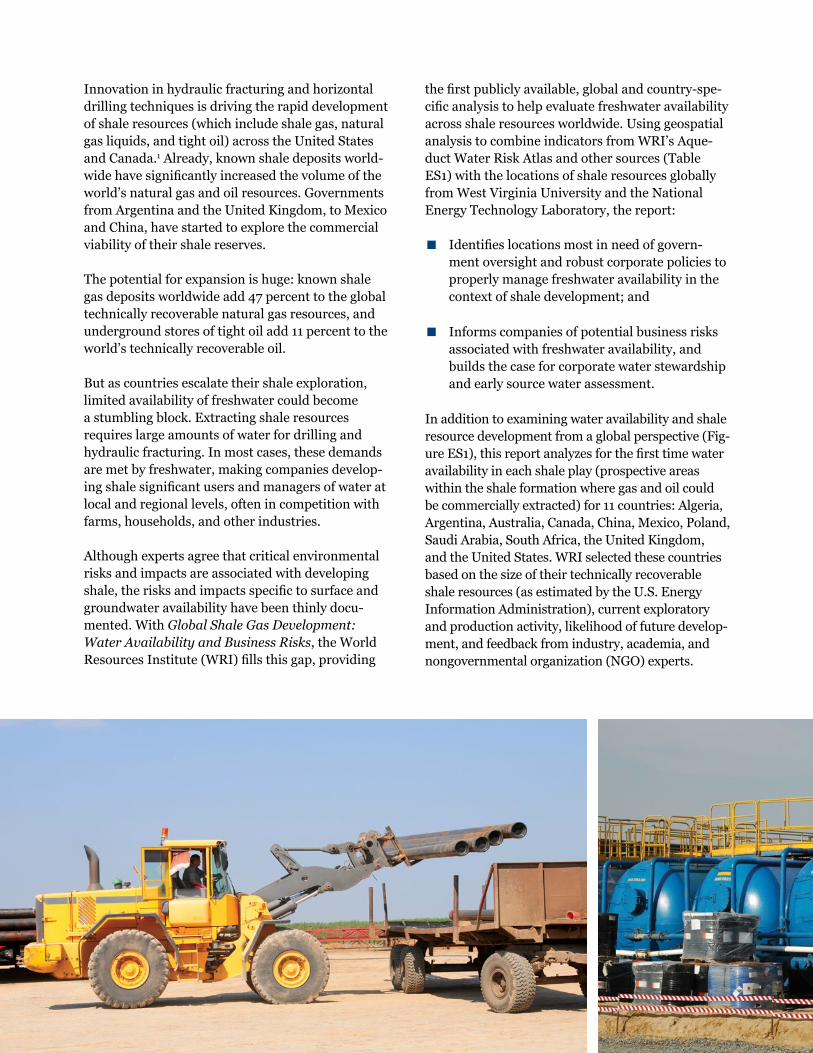
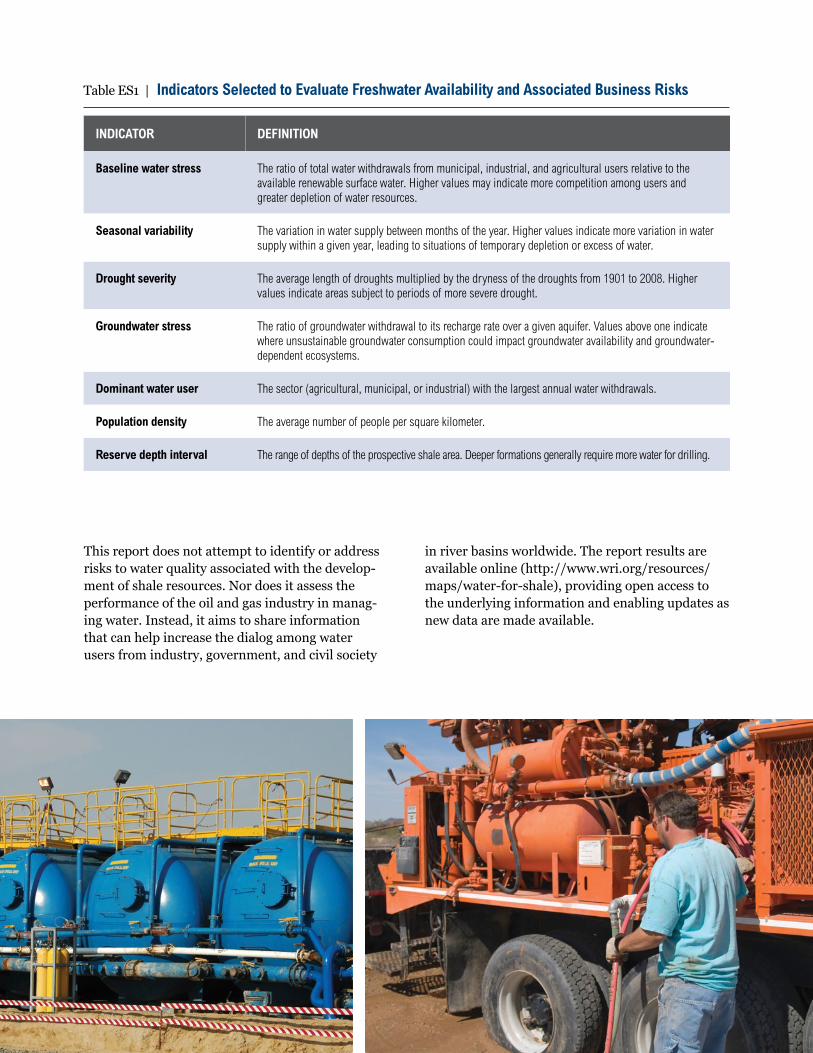
But as countries escalate their shale exploration, limited availability of freshwater could become a stumbling block. Extracting shale resources requires large amounts of water for drilling and hydraulic fracturing. In most cases, these demands are met by freshwater, making companies develop-ing shale significant users and managers of water at local and regional levels, often in competition with farms, households, and other industries.
Although experts agree that critical environmental risks and impacts are associated with developing shale, the risks and impacts specific to surface and groundwater availability have been thinly docu-mented. With Global Shale Gas Development: Water Availability and Business Risks, the World Resources Institute (WRI) fills this gap, providing
the first publicly available, global and country-spe-cific analysis to help evaluate freshwater availability across shale resources worldwide. Using geospatial analysis to combine indicators from WRI’s Aque-duct Water Risk Atlas and other sources (Table ES1) with the locations of shale resources globally from West Virginia University and the National Energy Technology Laboratory, the report:
▪ Identifies locations most in need of govern-ment oversight and robust corporate policies to properly manage freshwater availability in the context of shale development; and
▪ Informs companies of potential business risks associated with freshwater availability, and builds the case for corporate water stewardship and early source water assessment.
In addition to examining water availability and shale resource development from a global perspective (Fig-ure ES1), this report analyzes for the first time water availability in each shale play (prospective areas within the shale formation where gas and oil could be commercially extracted) for 11 countries: Algeria, Argentina, Australia, Canada, China, Mexico, Poland, Saudi Arabia, South Africa, the United Kingdom, and the United States. WRI selected these countries based on the size of their technically recoverable shale resources (as estimated by the U.S. Energy Information Administration), current exploratory and production activity, likelihood of future develop-ment, and feedback from industry, academia, and nongovernmental organization (NGO) experts.
3Global Shale Gas Development: Water Availability and Business Risks
This report does not attempt to identify or address risks to water quality associated with the develop-ment of shale resources. Nor does it assess the performance of the oil and gas industry in manag-ing water. Instead, it aims to share information that can help increase the dialog among water users from industry, government, and civil society
in river basins worldwide. The report results are available online (http://www.wri.org/resources/maps/water-for-shale), providing open access to the underlying information and enabling updates as new data are made available.
Table ES1 | Indicators Selected to Evaluate Freshwater Availability and Associated Business Risks
INDICATOR DEFINITION
Baseline water stress The ratio of total water withdrawals from municipal, industrial, and agricultural users relative to the available renewable surface water. Higher values may indicate more competition among users and greater depletion of water resources.
Seasonal variability The variation in water supply between months of the year. Higher values indicate more variation in water supply within a given year, leading to situations of temporary depletion or excess of water.
Drought severity The average length of droughts multiplied by the dryness of the droughts from 1901 to 2008. Higher values indicate areas subject to periods of more severe drought.
Groundwater stress The ratio of groundwater withdrawal to its recharge rate over a given aquifer. Values above one indicate where unsustainable groundwater consumption could impact groundwater availability and groundwater-dependent ecosystems.
Dominant water user The sector (agricultural, municipal, or industrial) with the largest annual water withdrawals.
Population density The average number of people per square kilometer.
Reserve depth interval The range of depths of the prospective shale area. Deeper formations generally require more water for drilling.

WRI.org 4
SHALE BASIN
Low
Low to medium
Medium to high
High
Extremely high
Arid & low water use
BASELINE WATER STRESS LEVEL
LEGEND
CANADA573
Country name
Average Baseline Water Stress Level
Technically recoverable shale gas resources (trillion cubic meters)
Figure ES1 | Location of World’s Shale Plays, Volume of Technically Recoverable Shale Gas in the 20 Countries with the Largest Resources, and the Level of Baseline Water Stress

5Global Shale Gas Development: Water Availability and Business Risks
Notes1. Colored polygons are areas that have been identified as shale plays: shale deposits that are viable for commercial production.2. Dark grey polygons are shale basins. While shale plays fall within basins, other shale resources within basins may not be commercially viable.3. Circle size denotes the country’s total technically recoverable shale gas resources (trillion cubic meters).4. Circle color denotes the area-weighted average of baseline water stress levels over all shale plays within a country. If more than half of the country’s shale play area is in
arid and low water use regions, the circle is colored in light grey.
Sources: Location of world’s shale basins and plays from West Virginia University and The National Energy Technology Laboratory. Estimates of total technically recoverable shale gas resources from the U.S. Energy Information Administration. Estimates of baseline water stress from WRI’s Aqueduct Water Risk Atlas.
Figure ES1 | Location of World’s Shale Plays, Volume of Technically Recoverable Shale Gas in the 20 Countries with the Largest Resources, and the Level of Baseline Water Stress
WRI.org 6
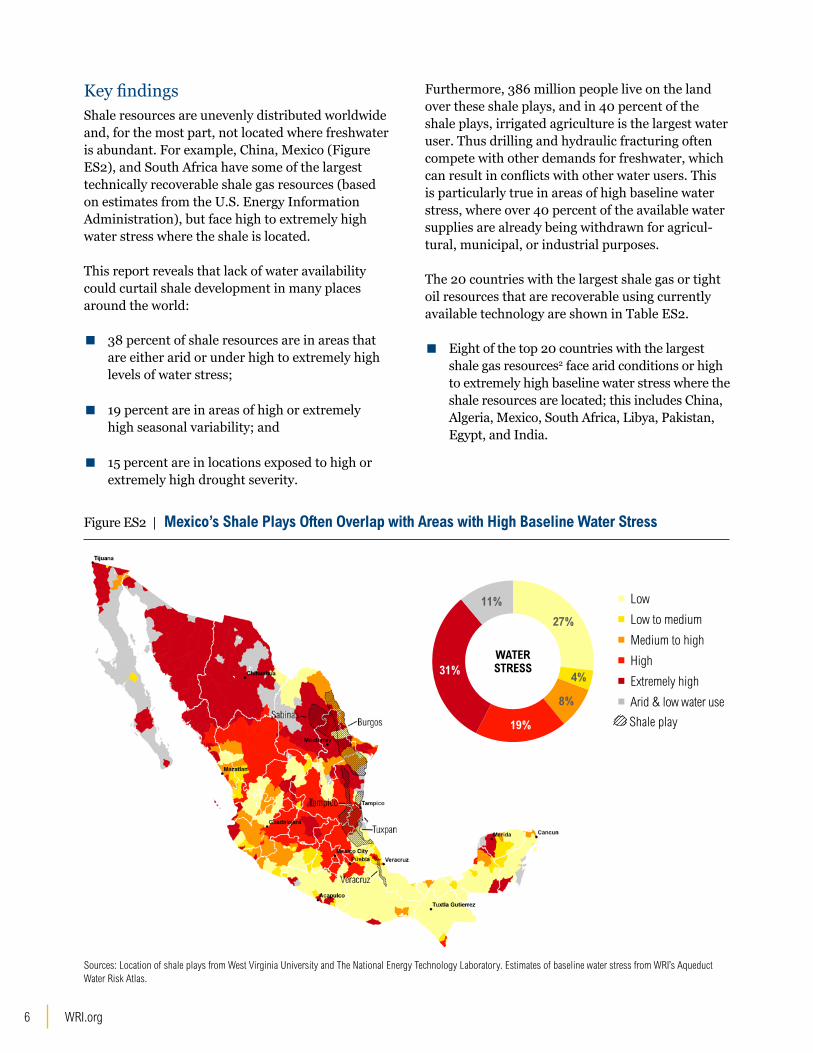
Key findingsShale resources are unevenly distributed worldwide and, for the most part, not located where freshwater is abundant. For example, China, Mexico (Figure ES2), and South Africa have some of the largest technically recoverable shale gas resources (based on estimates from the U.S. Energy Information Administration), but face high to extremely high water stress where the shale is located.
This report reveals that lack of water availability could curtail shale development in many places around the world:
▪ 38 percent of shale resources are in areas that are either arid or under high to extremely high levels of water stress;
▪ 19 percent are in areas of high or extremely high seasonal variability; and
▪ 15 percent are in locations exposed to high or extremely high drought severity.
Furthermore, 386 million people live on the land over these shale plays, and in 40 percent of the shale plays, irrigated agriculture is the largest water user. Thus drilling and hydraulic fracturing often compete with other demands for freshwater, which can result in conflicts with other water users. This is particularly true in areas of high baseline water stress, where over 40 percent of the available water supplies are already being withdrawn for agricul-tural, municipal, or industrial purposes.
The 20 countries with the largest shale gas or tight oil resources that are recoverable using currently available technology are shown in Table ES2.
▪ Eight of the top 20 countries with the largest shale gas resources2 face arid conditions or high to extremely high baseline water stress where the shale resources are located; this includes China, Algeria, Mexico, South Africa, Libya, Pakistan, Egypt, and India.
Figure ES2 | Mexico’s Shale Plays Often Overlap with Areas with High Baseline Water Stress
Low
Low to medium
Medium to high
High
Extremely high
Arid & low water use
Shale play
WATER STRESS
27%
4%
8%
19%
31%
11%
Sources: Location of shale plays from West Virginia University and The National Energy Technology Laboratory. Estimates of baseline water stress from WRI’s Aqueduct Water Risk Atlas.

7Global Shale Gas Development: Water Availability and Business Risks
Table ES2 | Average Exposure to Water Stress across Shale Plays
RANKa COUNTRYAVERAGE EXPOSURE TO WATER STRESS OVER SHALE PLAY AREA
1 China High
2 Argentina Low to Medium
3 Algeria Arid & Low Water Use
4 Canada Low to Medium
5 United States Medium to High
6 Mexico High
7 Australia Low
8 South Africa High
9 Russian Federation
Low
10 Brazil Low
11 Venezuela Low
12 Poland Low to Medium
13 France Low to Medium
14 Ukraine Low to Medium
15 Libya Arid & Low Water Use
16 Pakistan Extremely High
17 Egypt, Arab Rep. Arid & Low Water Use
18 India High
19 Paraguay Medium to High
20 Colombia Low
RANKa COUNTRYAVERAGE EXPOSURE TO WATER STRESS OVER SHALE PLAY AREA
1 Russian Federation
Low
2 United States Medium to High
3 China High
4 Argentina Low to Medium
5 Libya Arid & Low Water Use
6 Australia Low
7 Venezuela, RB Low
8 Mexico High
9 Pakistan Extremely High
10 Canada Low to Medium
11 Indonesia Low
12 Colombia Low
13 Algeria Arid & Low Water Use
14 Brazil Low
15 Turkey Medium to High
16 Egypt, Arab Rep. Arid & Low Water Use
17 India High
18 Paraguay Medium to High
19 Mongolia Extremely High
20 Poland Low to Medium
a. Based on size of estimated shale gas technically recoverable resources a. Based on size of estimated tight oil technically recoverable resources
A. TWENTY COUNTRIES WITH THE LARGEST TECHNICALLY RECOVERABLE SHALE GAS RESOURCES
B. TWENTY COUNTRIES WITH THE LARGEST TECHNICALLY RECOVERABLE TIGHT OIL RESOURCES
Sources: Estimates of total technically recoverable shale gas and tight oil resources from the U.S. Energy Information Administration. Estimates of baseline water stress from WRI’s Aqueduct Water Risk Atlas.
WRI.org 8
▪ Eight of the top 20 countries with the largest tight oil resources3 face arid conditions or high to extremely high baseline water stress where the shale resources are located; this includes China, Libya, Mexico, Pakistan, Algeria, Egypt, India, and Mongolia.
Hydrological conditions vary spatially and seasonally across shale plays, with variation among plays, within plays, and throughout the year. This variation makes companies’ ability to meet the freshwater demands for hydraulic fracturing and drilling highly unpredict-able, and estimates based on previous experience not always accurate in new shale formations. This high level of uncertainty can lead to business risks for companies exploring new areas for development. Fur-thermore, public concern over increased competition and impacts on freshwater availability can threaten a company’s social license to operate and lead to changes in government regulations that could impact both short- and long-term investments.
WRI’s findings indicate that companies developing shale resources internationally are likely to face serious challenges to accessing freshwater in many parts of the world. These challenges highlight a strong business case for strategic company engage-ment in sustainable water management at local and regional levels. They also point to a need for companies to work with governments and other sectors to minimize environmental impacts and water resources depletion.
RecommendationsBased on the report’s analysis, WRI offers a set of practical recommendations for how governments, businesses, and civil society can continue to evalu-ate and sustainably manage freshwater availability if shale resources are developed.
1. Conduct water risk assessments to understand local water availability and reduce business risk.
1.1. Companies can evaluate water-related risks. Using a combination of publicly avail-able global and asset-level tools, companies should identify water-related business risks and prioritize areas to engage with regula-tors, communities, and industry to increase water security.
1.2. Governments can increase investments in collecting and monitoring water supply and demand information. Robust baseline information and estimates of future water supply and demand and environmental conditions can help build a strong, shared knowledge base to inform the development of effective water policies and science-based targets and goals.

9Global Shale Gas Development: Water Availability and Business Risks
2. Increase transparency and engage with local regulators, communities, and industry to minimize uncertainty.
2.1. Companies can increase corporate water disclosure. By disclosing and communicating their water use and management approach, companies can build trust with financial and river basin stakeholders as they investigate water risks and opportunities. Ongoing disclosure will reduce reputational risks.
2.2. Governments and companies can engage with local and regional industry, agricul-ture, and communities. Companies should closely collaborate with local government, industry, NGOs, and civil society to under-stand the hydrological conditions and regulatory frameworks within the river basin. This information allows for more accurate estimates of the cost, technology, and processes required to access water for shale development without displacing other users or degrading the environment.
3. Ensure adequate water governance to guarantee water security and reduce regulatory and reputational risks.
3.1. Companies can engage in public water policy. Adequate water governance and environmental protection standards, coupled with predictable implementation and effective enforcement, can minimize environmental degradation and ensure fair water allocation and pricing. A stable regulatory environment allows companies and investors to evaluate long-term oppor-tunities and minimize business risks.
3.2. Governments and companies, through collective action, can develop source water protection and management plans. Gov-ernments and businesses in the early stages of developing shale resources have a unique opportunity to work collectively with key river basin stakeholders to develop source water protection and management plans that help reduce business risks; promote a shared water sourcing and recycling infrastructure; and improve the sustainable management of watersheds and aquifers.
4. Minimize freshwater use and engage in corporate water stewardship to reduce impacts on water availability.
4.1. Companies can minimize freshwater use. Using publicly available guidelines, companies can evaluate their potential for using non-freshwater sources and build a business case for investing in technology to recycle or reuse water, use brackish water, or otherwise significantly reduce freshwater withdrawals.
4.2. Companies can develop a water strategy and engage in corporate water steward-ship. Companies should embed water management at the core of their business strategy to minimize exposure to risks and ensure long-term water availability for other users, the environment, and their own operations. Corporate water steward-ship involves a progression of increasing improvements in water use and impact reductions across internal company opera-tions and the rest of the value chain.4


11Global Shale Gas Development: Water Availability and Business Risks
INTRODUCTIONRelatively little has been published on how shale development
impacts water availability in North America, and even less
worldwide. WRI fills this gap with new information describing where
in the world freshwater availability is most threatened and may limit
extraction of shale resources, should they be developed.
WRI.org 12
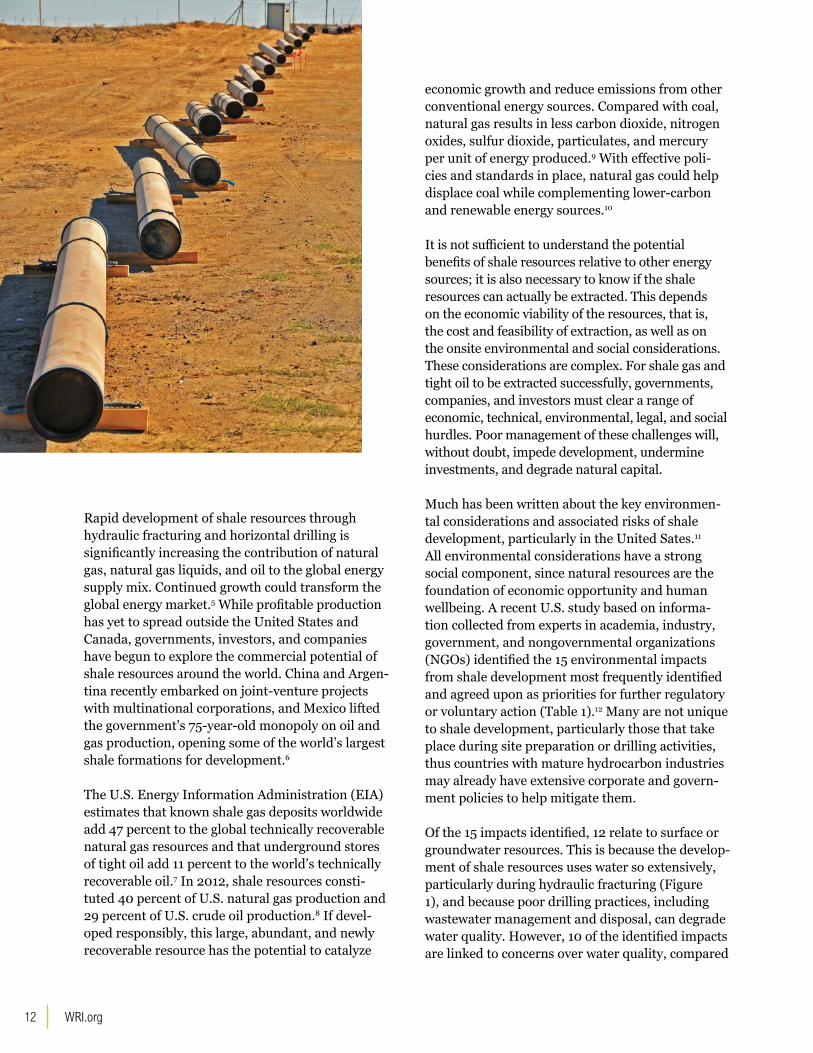
Rapid development of shale resources through hydraulic fracturing and horizontal drilling is significantly increasing the contribution of natural gas, natural gas liquids, and oil to the global energy supply mix. Continued growth could transform the global energy market.5 While profitable production has yet to spread outside the United States and Canada, governments, investors, and companies have begun to explore the commercial potential of shale resources around the world. China and Argen-tina recently embarked on joint-venture projects with multinational corporations, and Mexico lifted the government’s 75-year-old monopoly on oil and gas production, opening some of the world’s largest shale formations for development.6
The U.S. Energy Information Administration (EIA) estimates that known shale gas deposits worldwide add 47 percent to the global technically recoverable natural gas resources and that underground stores of tight oil add 11 percent to the world’s technically recoverable oil.7 In 2012, shale resources consti-tuted 40 percent of U.S. natural gas production and 29 percent of U.S. crude oil production.8 If devel-oped responsibly, this large, abundant, and newly recoverable resource has the potential to catalyze
economic growth and reduce emissions from other conventional energy sources. Compared with coal, natural gas results in less carbon dioxide, nitrogen oxides, sulfur dioxide, particulates, and mercury per unit of energy produced.9 With effective poli-cies and standards in place, natural gas could help displace coal while complementing lower-carbon and renewable energy sources.10
It is not sufficient to understand the potential benefits of shale resources relative to other energy sources; it is also necessary to know if the shale resources can actually be extracted. This depends on the economic viability of the resources, that is, the cost and feasibility of extraction, as well as on the onsite environmental and social considerations. These considerations are complex. For shale gas and tight oil to be extracted successfully, governments, companies, and investors must clear a range of economic, technical, environmental, legal, and social hurdles. Poor management of these challenges will, without doubt, impede development, undermine investments, and degrade natural capital.
Much has been written about the key environmen-tal considerations and associated risks of shale development, particularly in the United Sates.11 All environmental considerations have a strong social component, since natural resources are the foundation of economic opportunity and human wellbeing. A recent U.S. study based on informa-tion collected from experts in academia, industry, government, and nongovernmental organizations (NGOs) identified the 15 environmental impacts from shale development most frequently identified and agreed upon as priorities for further regulatory or voluntary action (Table 1).12 Many are not unique to shale development, particularly those that take place during site preparation or drilling activities, thus countries with mature hydrocarbon industries may already have extensive corporate and govern-ment policies to help mitigate them.
Of the 15 impacts identified, 12 relate to surface or groundwater resources. This is because the develop-ment of shale resources uses water so extensively, particularly during hydraulic fracturing (Figure 1), and because poor drilling practices, including wastewater management and disposal, can degrade water quality. However, 10 of the identified impacts are linked to concerns over water quality, compared

13Global Shale Gas Development: Water Availability and Business Risks
Table 1 | Environmental Impacts from Shale Gas Development Seen as Priorities by Government, Industry, Academia, and NGO Experts
Development Stage
ACTIVITIES BURDENS IMPACTS
Activities associated with the development of shale gas
Burdens that could be created by a development activity
and that would have potential impacts that people care about
Aspects of the environment that could be affected by the
shale gas development process
Site preparation Land clearing and infrastructure construction
Storm water flows Surface water quality
Habitat fragmentation Habitat disruption
Drilling
Venting of methane Methane Air quality
Casing and cementing Methane Groundwater quality
Casing accidents Methane Groundwater quality
Cementing accidentsDrilling fluids/cuttings
Fracturing fluidsFlowback and produced water
Groundwater quality
Fracturing and completion
Use of surface water and groundwater
Freshwater withdrawals
Surface water availability
Groundwater availability
Storage of fracturing fluids Fracturing fluids Surface water quality
Venting of methane Methane Air quality
Storage/disposal of
fracturing fluids and flowback
On-site pit/pond storage
Flowback and produced water
Surface water quality
Groundwater quality
Fracturing fluids Surface water quality
Treatment by municipal wastewater treatment plants
Flowback and produced water Surface water quality
Treatment by industrial wastewater treatment plants
Flowback and produced water Surface water quality
Source: Alan J Krupnick, Managing the Risks of Shale Gas: Key Findings and Further Research (Resources for the Future, 2013), http://www.rff.org/rff/documents/RFF-Rpt-ManagingRisksofShaleGas-KeyFindings.pdf.

WRI.org 14
with only 2 regarding water availability. This might explain why relatively little has been published on how shale development impacts water availability in North America,13 and even less worldwide.14
To fill this gap, the World Resources Institute (WRI) used data from the Aqueduct Water Risk Atlas, West Virginia University, the National Energy Technology Laboratory, and other sources to identify where freshwater availability might be a limiting factor to the development of shale resources. In this report, WRI provides comprehen-sive color-coded maps that:
▪ Identify locations most in need of govern-ment oversight and robust corporate policies to ensure freshwater availability for industry, communities, agriculture, and the environment over time, if shale resources are developed, and
▪ Inform companies developing shale resources of potential business risks associated with freshwater availability, and build the case for increasing water stewardship and early source water assessment in the oil and gas sector.
The results also demonstrate the application of WRI’s Aqueduct Water Risk Atlas as a robust decision-support tool to evaluate the water-energy nexus at a global scale and increase public aware-ness around water-related business risks.
This report is not intended to assess the perfor-mance of the oil and gas industry in managing water, but rather to demonstrate the usefulness of global tools like the Aqueduct Water Risk Atlas as a starting point to promote increased dialog among water users across industry, government, and civil society in river basins around the world. The results of this report are published on an interactive online platform (http://www.wri.org/resources/maps/water-for-shale) that provides open access to the data and results, and enables frequent updates of the information as new data are made available.

15Global Shale Gas Development: Water Availability and Business Risks
Figure 1 | The Hydraulic Fracturing Water Cycle
Source: Adapted from U.S. Environmental Protection Agency, “The Hydraulic Fracturing Water Cycle,” EPA’s Study of Hydraulic Fracturing and Its Potential Impact on Drinking Water Resources, March 16, 2014, http://www2.epa.gov/hfstudy/hydraulic-fracturing-water-cycle.
1Water Aquisition
2Chemical Mixing
3Well Injection
4Flowback and
Produced Water
5Wastewater Treatment
and Waste Disposal
Natural gas flows from fissures into well


17Global Shale Gas Development: Water Availability and Business Risks
SHALE RESOURCES AND WATERLarge water withdrawals during the drilling and hydraulic fracturing
stages are necessary to extract shale resources. These withdrawals
are concentrated over shale gas and tight oil production areas,
making source water availability and the associated risks a critical
consideration when evaluating the potential for shale development.

WRI.org 18
Shale is a fine-grained, fissile sedimentary rock composed primarily of clay and silt-sized particles. It is the source rock, reservoir, and seal for shale gas and some tight oil. The shale hydrocarbons considered in this study, referred to as “shale resources,” include: shale gas, natural gas liquids (NGLs), and tight oil (Box 1).
Large shale formations defined by similar geologic characteristics are often referred to as “shale basins.” The prospective areas of the shale basin where gas and oil could potentially be commercially extracted are commonly referred to as “shale plays.” Shale has extremely low permeability, equivalent to about 1 percent of an average conventional reservoir,15
an even lower permeability than tight gas or coal bed methane reservoirs.16 Thus gas and fluid pass through shale less easily than through brick, con-crete, or even granite.17 Because of its extremely low permeability, shale must be cracked apart for oil and gas to flow up to the surface at a profitable rate; this is achieved by hydraulic fracturing.
Extraction of Shale ResourcesShale can, in places, be hydraulically fractured to produce large quantities of natural gas, NGLs, and tight oil. Hydraulic fracturing entails pumping fluid composed of water, proppants, and chemicals into the ground at very high pressure. The pressurized water and chemicals create and enlarge cracks in the shale formation, which increases its permeabil-ity by 100- to 1,000-fold, allowing the hydrocarbons to flow more easily to the wellbore.18 Depending on many factors, a well might remain productive for 5 to 40 years.
After the hydraulic fracturing treatment, the water pressure in the well is reduced to allow the fracturing fluid to flow back out of the well followed by the oil and gas. As the fluid flows back to the surface, a pro-cess commonly referred to as “flowback,” the sand and other proppants pumped into the formation are left behind—like doorstops—to prop open the new and enlarged cracks. As flowback continues, the composition of the fluid carries higher and higher proportions of hydrocarbons. Within the first few weeks of flowback, some or most of the fracturing fluid returns to the surface as wastewater. In North America, estimates of the volume of flowback vary between 10 to 75 percent of the fracturing fluid origi-nally injected.19 Because of its chemical content, this wastewater is recycled and treated for reuse, placed into disposal wells, or treated and discharged into surface waters.20 If not managed properly, flowback water and other wastewater from hydraulic fractur-ing operations can cause significant degradation to surface water and groundwater that could pose serious risks to the ecosystems and communities that depend on them.21
▪ Natural gas liquids (NGLs): naturally occurring hydrocarbons found in natural gas or associated with crude oil that are considered a byproduct in the oil and gas industry and increasingly being targeted for extraction.
▪ Shale basin: large shale formation defined by similar geologic characteristics.
▪ Shale gas: natural gas deposits found in shale reservoirs.
▪ Shale play: the prospective areas of a shale basin where gas and oil could potentially be commercially extracted.
▪ Shale resource: hydrocarbon resources found in shale plays, such as natural gas, natural gas liquids, and tight oil.
▪ Tight oil: oil trapped in fine-grained sedimentary rocks with extremely low permeability, such as shale, sandstone or carbonate.
Sources: E.D. Williams and J.E. Simmons, Water in the Energy Industry. An Introduction (United Kingdom: BP International Ltd, 2013), http://www.bp.com/content/dam/bp/pdf/sustainability/group-reports/BP-ESC-water-handbook-131018.pdf. L. Biewick, G. Gunther, and C. Skinner, “USGS National Oil and Gas Assessment Online (NOGA Online) Using ArcIMS” (Denver, Colorado: U.S. Geological Survey, n.d.), http://proceedings.esri.com/library/userconf/proc02/pap0826/p0826.htm#contact.
BOX 1 | SHALE RESOURCES TERMINOLOGY

19Global Shale Gas Development: Water Availability and Business Risks
Water Requirements The life cycle of shale energy requires water during its preproduction, production, and use stages,22 as well as for refining oil to a grade fit for consumption.23 The largest water withdrawals for shale resource extrac-tion occur during the drilling and hydraulic fractur-ing stages. In 2005, water withdrawals for mining (which includes oil and gas extraction) represented only 1 percent of U. S. water withdrawals (Figure 2).24 In 2010, water withdrawals for hydraulic fracturing represented only 0.5 percent of the withdrawals in Texas.25 However, water withdrawals for drilling and hydraulic fracturing are unevenly distributed and con-centrated over areas where shale resources and tight gas are produced, potentially representing a much higher fraction of the water withdrawn in the drilling area.26 Additionally, much of the water required for
hydraulic fracturing is consumptive, thus it does not all return to the surface or groundwater from which it was abstracted.
Based on experience in the United States, drilling a single well can require between 0.2 million and 2.5 million liters of water and hydraulic fracturing a well can require between 7 million and 23 mil-lion liters of water,27 25 percent to 90 percent of which might be consumptive use.28 The wide range of values for consumptive water use indicates the high levels of uncertainty about possible impacts of hydraulic fracturing on freshwater availability. The water required by a single well can be roughly equal to the water consumed by New York City in 7 minutes, or by a 1,000-megawatt coal-fired power plant in 12 hours.29 Drilling and fracturing multiple wells, multiple times, in the same area, can rapidly escalate local water consumption. Furthermore, in many areas of the world, the location of shale plays coincides with areas of low availability and high demand for water (Box 2), making access to local water resources a challenge for companies extract-ing shale resources.
Figure 2 | Percentage of U.S Water Withdrawals by Category, 2005
Source: J.F. Kenny et al., “Estimated Use of Water in the United States in 2005,” U.S. Geological Survey Circular 1344, (2009), http://pubs.usgs.gov/fs/2009/3098/pdf/2009-3098.pdf.
49
1
42
0.51
11
31
Ther
moe
lect
ric
pow
er
With
draw
al (p
erce
nt)
Irrig
atio
n
Publ
ic s
uppl
y
Indu
stria
l
Aqua
cultu
re
Min
ing
Dom
estic
Live
stoc
k

WRI.org 20
The amount of water required to complete a well varies from well to well and play to play, making estimates of water demands for shale develop-ment uncertain for most unexplored plays around the world. The variation in water requirements depends on the geology and the well characteristics. For example, the number of horizontal segments hydraulically fractured, as well as the production type, depth and length of the well, determine the amount of water required. In turn, these well char-
acteristics vary based on the formation geology. The shale play’s depth, thickness, and porosity can also influence water requirements.30
Many companies use freshwater for drilling and fracturing, though brackish and recycled water offer significant opportunities to reduce freshwater demands.31 Information on the proportion of brack-ish, recycled, or reused water used as a substitute for freshwater in the United States is scarce.32 Avail-able data indicates that in 2011 brackish water use by the oil and gas industry in Texas ranged between 0 and 80 percent, and recycled water between 0 and 20 percent of the total water demand, depend-ing on the location.33 Additionally, although nearly all fracturing treatments use water, alternatives exist including liquefied petroleum gas and carbon dioxide fracture treatments.
One of the limitations to recycling and reusing water is that the amount of flowback returned to the surface varies between and within plays. However, new projects are underway to support increased recycling and reuse to reduce freshwater withdraw-als and consumption by the oil and gas sector.34
Aside from drilling and hydraulic fracturing (which can occur multiple times in the same well), very little water is needed to prepare the site or maintain the machinery for the well’s 5- to 40-year estimated lifespan.35
Freshwater Availability Risks Source water availability is a critical consideration when evaluating the potential for shale develop-ment. Shale resources are tied to geographic loca-tions, creating very high location-specific demands for water that must be met in order to successfully extract the resource. Yet, fresh and brackish water are natural resources that must be shared among all users, and that play a critical role in sustaining local ecosystems and socioeconomic development in the areas where shale development takes place.
Limited or unpredictable water availability can jeopardize a project’s financial viability. In areas with high demand relative to the available supply, added water withdrawals for drilling and hydraulic fracturing operations can deplete water resources, degrade the environment, and displace other users.
In the United States, water demands for hydraulic fracturing and drilling activities account for only one tenth of 1 percent of all U.S. water withdrawals. This demand, however, is concentrated around active shale plays,a 26 percent of which are in areas with high and extremely high water stress. Thus, although the national percentage of water used for fracturing may be low relative to other water demands, the water requirements for shale resources extraction in specific locations can be significant and in competition with other water uses. For example, in Johnson County, Texas, water withdrawals for shale gas development in 2008 were responsible for almost one third of the county’s freshwater use.b In three contiguous counties in Texas’s Eagle Ford shale basin, freshwater demand of hydraulic fracturing is expected to grow by 2020 to exceed the 2008 amount of all other water users combined.c
These examples indicate that shale gas development in semiarid regions, such as the southwestern United States, could have a large impact on local surface and groundwater availability and potentially displace other users if the increased demand is not adequately managed.
Sources:a. U.S. Environmental Protection Agency, “Draft Plan to Study the Potential
Impacts of Hydraulic Fracturing on Drinking Water Resources,” (Washington, DC: U.S. Environmental Protection Agency, February 7, 2011).
b. Jean-Philippe Nicot and Bridget R. Scanlon, “Water Use for Shale-Gas Production in Texas, U.S.,” Environmental Science & Technology 46, no. 6 (March 2012): 3580–86, doi:10.1021/es204602t.
c. Ibid.
BOX 2 | WATER FOR U.S. HYDRAULIC FRACTURING OPERATIONS IS A SMALL PERCENTAGE OF TOTAL USE, BUT CAN BE LOCALLY SIGNIFICANT

21Global Shale Gas Development: Water Availability and Business Risks
Table 2 | Potential Business Risks Associated with Water Availability
DESCRIPTION BUSINESS IMPACT EXAMPLES
FINANCIAL RISKS
Transportation: Water transportation costs, which can dwarf the purchase price of water, are most often the dominant financial risk.
If not accounted for at the initial stages of the project, additional costs to transport water can significantly threaten profitability.
United States: Antero Resources Inc., backed by New York private equity firms, plans to spend more than half a billion dollars on an 80-mile pipeline that will transport water from the Ohio River to extract shale gas in West Virginia and Ohio.a The pipeline will reduce water costs, mostly from trucking, by two-thirds, or around US$600,000 per well.b This implies that Antero may be spending around US$900,000 per well for water.
Pricing: High water demand and diminishing supplies drive up the price of water.
Increased operating cost to access alternative sources of water.c
United States: During the 2011 drought, oil and gas companies in parts of Colorado were paying as much as US$1,000 to US$2,000 for the same amount of treated water from city pipes that farmers would pay US$30 for on an average year or US$100 when water was scarce.d
REPUTATIONAL RISKS
Social and environmental concerns: Real or perceived concerns over freshwater availability can threaten a company’s social license to operate.
High water stress and other environmental concerns can exacerbate public opposition to hydraulic fracturing,e causing a company to lose its social license to operate and/or undergo significant project delays and asset downtime.
United Kingdom: Protests in the village of Balcombe concerning a host of hydraulic-fracturing-related environmental risks have caused the energy firm Cuadrilla to delay project development for months.f
South Africa: Shell faced significant social opposition to its plans to seek shale gas in South Africa’s semidesert Karoo region. Social concerns over water availability resulted in projected delays and a temporary government ban on hydraulic fracturing.
REGULATORY RISKS
Regulatory uncertainty: Concerns over environmental degradation, including the depletion of water, can cause governments to limit or even prohibit shale development.
Concerns over water supply availability can be one of many reasons that national and subnational governments ban or place a moratorium on hydraulic fracturing,g leading companies to lose their legal license to operate, and/or undergo significant project delays and asset downtime.
United States: Severe droughts in 2011 caused restrictions and bans on the use of water for hydraulic fracturing in the Barnett and Permian basins.h
Bulgaria: Environmental concerns led Bulgaria to ban hydraulic fracturing and revoke a shale gas permit granted to Chevron.
France: France banned hydraulic fracturing and canceled exploration licenses held by companies including Total SA and the U.S. firm Schuepbach Energy.i
a. Russell Gold, “Energy Firm Makes Costly Fracking Bet - on Water,” Wall Street Journal, August 2013, Online edition, sec. Business, http://online.wsj.com/article/SB10001424127887323420604578652594214383364.html.
b. Ibid.c. Melissa Stark et al., Water and Shale Gas Development: Leveraging the US
Experience in New Shale Developments (Accenture, 2012), http://www.accenture.com/SiteCollectionDocuments/PDF/Accenture-Water-And-Shale-Gas-Development.pdf.
d. Jack Healy, “For Farms in the West, Oil Wells Are Thirsty Rivals,” The New York Times, September 2012, http://www.nytimes.com/2012/09/06/us/struggle-for-water-in-colorado-with-rise-in-fracking.html?pagewanted=all&_r=2&.
e. Alec Tang and Kristina Ringwood, “Water Sustainability Risk Assessments: Lessons from Water Sensitive Industries,” in Offshore Technology Conference (Houston, Texas, USA: Offshore Technology Conference, 2013), 1–6, https://www.onepetro.org/conference-paper/OTC-23903-MS.
f. BBC, “Balcombe Protests: Fracking Row Village Sees Fresh Plan,” BBC News Sussex, September 4, 2013, http://www.bbc.co.uk/news/uk-england-sussex-23944344.
g. Matt Steinglass, “Fracking: Netherlands Moves Closer to Shale Gas Exploitation,” Financial Times, August 2013, http://www.ft.com/intl/cms/s/0/c20b1e24-0e66-11e3-bfc8-00144feabdc0.html#axzz2eQg9CIST.
h. Mike Lee, “Parched Texans Impose Water-Use Limits for Fracking Gas Wells,” Bloomberg Businessweek, September 2011.
i. Tara Patel and Gregory Viscusi, “France’s Fracking Ban ‘Absolute’ After Court Upholds Law,” Bloomberg News, October 11, 2013, http://www.bloomberg.com/news/2013-10-11/fracking-ban-upheld-by-french-court-as-constitutional.html.

WRI.org 22
These externalities can translate into business risks for companies developing shale resources, includ-ing: financial risks, reputational risks, and regula-tory risks (Table 2).
These risks can translate into business disruptions and impact company profitability, as well as short- and long-term investments in shale development, particularly in arid regions such as those in China’s Tarim basin and South Africa’s Karoo basin.
The technology exists to procure, treat, and transport water for nearly any shale development operation. The question is: Has the cost of the tech-nology, as well as the social, environmental, and regulatory implications, been adequately addressed in the early stages of the investment and decision-making process? Governments and companies need to answer this question, in part, by assessing source water availability and the associated risks early on. Furthermore, adequate water management policies, plans, and strategies must be in place to allow for long-term sustainable use of local water resources by all sectors, as well as by the environment.
Source water availability is a critical
consideration when evaluating the potential for shale development.
Shale resources are tied to geographic
locations, creating very high location-specific
demands for water that must be met in order to
successfully extract the resource.

23Global Shale Gas Development: Water Availability and Business Risks


25Global Shale Gas Development: Water Availability and Business Risks
ASSESSING FRESHWATER AVAILABILITY AND BUSINESS RISKCompanies selecting freshwater to supply shale development
projects need to evaluate and understand the availability of local
and regional freshwater sources. In this report WRI uses seven
indicators to assess freshwater availability and business risks
across major shale plays worldwide. The results reveal areas
with potential challenges to accessing water, and highlight the
associated financial, reputational, and regulatory risks to companies
developing shale resources.

WRI.org 26
Companies that develop shale resources need to access and handle large quantities of water, and thus are likely to be significant users and managers of water at the local and regional levels. As such, they must identify and select their potential water sources within the broader context of local or regional water management considerations.36 IPIECA, the global oil and gas industry association for environmental and social issues, recommends that in identifying and assessing potential water sources (Box 3), operators work with river basin stakeholders to evaluate the quantity and quality available for use, as well as the associated impacts, risks, and uncertainties before selecting their water sources.
Regulatory frameworks, freshwater constraints, and the economics of water treatment will determine the extent to which brackish water and wastewater are feasible substitutes for freshwater for hydraulic fracturing.37 In the meantime, companies selecting
freshwater to supply their projects need to evaluate and understand the availability of local and regional freshwater. Companies with large portfolios of assets, as well as investors, need location-specific, credible, and comprehensive information that can be compared across regions, countries, and basins, shared publicly, and understood by all stakeholders.
This report offers a set of quantitative indicators and maps to help stakeholders evaluate freshwater avail-ability across major shale plays worldwide. The results reveal areas with potential challenges to accessing freshwater, and the associated financial, reputational, and regulatory risks to companies developing those shale resources. The results also highlight the areas most in need of effective water governance to ensure sustainable management and distribution of water resources to meet the needs of communities, the environment, industry, and agriculture.
Methodology To create the maps showing areas of high shale resource potential and low water availability, WRI overlaid maps of the world’s major shale plays identified at the time this report was written with data for seven water-related indicators: baseline water stress, seasonal variability, drought severity, groundwater stress, dominant water user, popula-tion density, and reserve depth interval. The results provide a comprehensive visual resource and quantitative database to help evaluate the spatial variation in water availability and the associated business risks across shale plays.
The indicators and locations of shale plays were combined using geospatial tools. The resulting information is displayed in maps and provides coverage for each indicator, across each shale play, allowing the results to be aggregated and shared at a play, country, region, or global level. In this report, all summary results are calculated by area. For example, a result that shows 38 percent of shale resources are located in areas that are arid or under high to extremely high levels of water stress means that 38 percent of the global shale play area, not 38 percent of the global technically recoverable shale resource volume, is under high or extremely high levels of water stress.
The global oil and gas industry association for environmental and social issues (IPIECA) recommends six steps for companies to identify and assess a source of water for oil and gas operations:
▪ Step 1: Engage stakeholder and regulatory organiza-tions
▪ Step 2: Understand current and future project water requirements
▪ Step 3: Identify water sources within the project area
▪ Step 4: Evaluate the status of water quantity and quality in the area
▪ Step 5: Assess impacts, risks, and uncertainty
▪ Step 6: Select the water source
Source: Adapted from IPIECA, Identifying and Assessing Water Sources (London: IPIECA, 2014), http://www.ipieca.org/publication/identifying-and-assessing-water-sources.
BOX 3 | HOW TO IDENTIFY AND ASSESS A WATER SOURCE FOR OIL AND GAS OPERATIONS

27Global Shale Gas Development: Water Availability and Business Risks
This report summarizes the results at a global level, as well as by shale play for 11 countries. Countries were selected based on the size of their techni-cally recoverable shale resources, according to the U.S. Energy Information Administration, current exploratory and production activity, likelihood of future development, and feedback from industry, academia, and NGO experts. Countries include Algeria, Argentina, Australia, Canada, China, Mexico, Poland, Saudi Arabia, South Africa, United Kingdom, and the United States (Appendix A). All results and underlying data are available for download from the project website (http://www.wri.org/resources/maps/water-for-shale) and will be updated as new data are available.
Geo-Database of Shale Basins and PlaysThe West Virginia Geographic Information Sys-tems Technical Center (WVGISTC) and West Virginia University (WVU), in collaboration with the National Energy Technology Laboratory and WRI, compiled a digital GIS geometry and attribute geo-database of major onshore shale formations targeted for unconventional development of gas and liquid hydrocarbon resources.38 The compilation excludes offshore shale formations.
The geo-database consists of 228 shale basins and 339 shale plays in the public domain in publica-
tions by the U.S. Energy Information Administra-tion, Journal of Petroleum Technology, China University of Geosciences, Oil and Gas Journal, national and subnational geological surveys, and other academic, industry, and governmental sources. The geo-database includes a number of attributes for each shale formation, including the basin and play name, geologic age, depth interval, reservoir pressure, thermal maturity, oil and gas in place, and data source, among others. It is avail-able online (https://edx.netl.doe.gov/dataset/unconventional-resources-atlas).
The geo-database is not an all-inclusive collection of unconventional onshore formations, but rather a collection of general information on the location of shale basins and plays publicly available at the time of the analysis.
Water Availability and Business Risk IndicatorsSeven indicators are used in this assessment (Table 3). Five were obtained from WRI’s Aqueduct Water Risk Atlas, a global database of publicly available water risk indicators and maps. The Aqueduct Water Risk Atlas leverages publicly available data, to provide robust and science-based information for decision makers. The data can be compared glob-ally across political and hydrological boundaries.

WRI.org 28
This global coverage enables users to consistently evaluate exposure to water-related risks across a portfolio of current or prospective assets, suppliers, commodities, or investments. Because of this, the Aqueduct Water Risk Atlas is not designed to char-acterize water risks at any particular location; many of the local legal, social, and structural complexities associated with managing water are not included in global models. Instead, the Aqueduct Water Risk Atlas helps provide the context necessary to under-stand water-related risks at a portfolio-level, which, combined with local information and a deep under-standing of a company’s management practices, can help evaluate company risks. All indicators in the Aqueduct Water Risk Atlas were developed and published by WRI in 2013, in consultation with an external advisory group of experts from industry, academia, government and NGOs.39
One indicator, population density, was obtained from Columbia University and Centro Internacional de Agricultura Tropical. The seventh indicator, the depth interval of the shale formation, was obtained from WVGISTC. The depth of the shale formation has an impact on water requirements because deeper formations require more water for drilling.40 All indicators were selected based on their relevance for shale exploration and production and feedback from industry, academic, and NGO experts. Indicators make use of the most up-to-date and high resolution global datasets available in the public domain. The definitions, calculations, data sources, and scoring methodology are documented and publicly available for download from the cited sources and available on the project website.
Table 3 | Indicators and Business Risks
INDICATOR LEGEND BUSINESS RISKS
Baseline water stressThe ratio of total water withdrawals from municipal, industrial, and agricultural users to the available renewable surface water. Higher values may indicate more competition among users and greater depletion of water resources.
Source: F. Gassert, M. Landis, M. Luck, P. Reig, and T. Shiao, “Aqueduct Global Maps 2.0,” Working Paper,(World Resources Institute, Washington, DC, 2013), available at http://www.wri.org/publication/aqueduct-metadata-global.
Low (<10%)
Low to medium (10-20%)
Medium to high (20-40%)
High (40-80%)
Extremely high (>80%)
Arid & low water use
No data
Higher competition and depletion of water supplies are common triggers for unanticipated changes in water prices and regulations, and often lead to difficulties in accessing water and social concerns over water availability.
Seasonal variabilityThe variation in water supply between months of the year. Higher values indicate more variation in water supply within a given year, leading to situations of temporary depletion or excess of water.
Source: F. Gassert, M. Landis, M. Luck, P. Reig, and T. Shiao, “Aqueduct Global Maps 2.0,” Working Paper(World Resources Institute, Washington, DC, 2013), available at http://www.wri.org/publication/aqueduct-metadata-global.
Low (<0.33)
Low to medium (0.33-0.66)
Medium to high (0.66-1.0)
High (1.0-1.33)
Extremely high (>1.33)
Arid & low water use
No data
High levels of seasonal variability indicate potential fluctuations in competition and depletion of water, and challenges in accessing constant supplies of water over a given year. High variability in supplies can require additional transportation and storage, and unanticipated changes in pricing or regulatory requirements.
Drought severityThe average length of droughts multiplied by the dryness of the droughts from 1901 to 2008. Higher values indicate areas subject to periods of more severe drought.
Source: J. Sheffield and E. F. Wood, “Projected Changes in Drought Occurrence under Future Global Warming from Multi-Model, Multi-Scenario, IPCC AR4 Simulations,” Climate Dynamics 31 (2008): 79–105; http://link.springer.com/article/10.1007/s00382-007-0340-z
Low (<20)
Low to medium (20-30)
Medium to high (30-40)
High (40-50)
Extremely high (>50)
Arid & low water use
No data
Severe droughts often lead to unanticipated changes in water regulation and tariffs, which can make it more costly to access water, and increase social concerns over water availability.
29Global Shale Gas Development: Water Availability and Business Risks
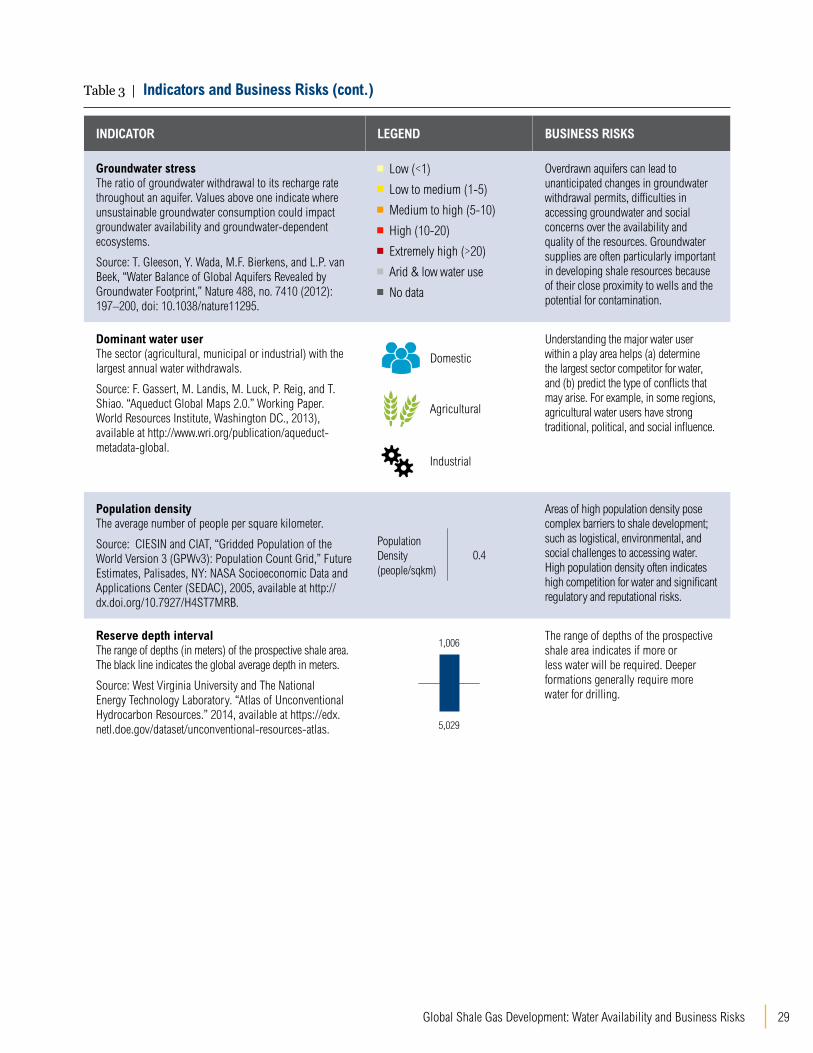
Table 3 | Indicators and Business Risks (cont.)
INDICATOR LEGEND BUSINESS RISKS
Groundwater stressThe ratio of groundwater withdrawal to its recharge rate throughout an aquifer. Values above one indicate where unsustainable groundwater consumption could impact groundwater availability and groundwater-dependent ecosystems.
Source: T. Gleeson, Y. Wada, M.F. Bierkens, and L.P. van Beek, “Water Balance of Global Aquifers Revealed by Groundwater Footprint,” Nature 488, no. 7410 (2012): 197–200, doi: 10.1038/nature11295.
Low (<1)
Low to medium (1-5)
Medium to high (5-10)
High (10-20)
Extremely high (>20)
Arid & low water use
No data
Overdrawn aquifers can lead to unanticipated changes in groundwater withdrawal permits, difficulties in accessing groundwater and social concerns over the availability and quality of the resources. Groundwater supplies are often particularly important in developing shale resources because of their close proximity to wells and the potential for contamination.
Dominant water userThe sector (agricultural, municipal or industrial) with the largest annual water withdrawals.
Source: F. Gassert, M. Landis, M. Luck, P. Reig, and T. Shiao. “Aqueduct Global Maps 2.0.” Working Paper.World Resources Institute, Washington DC., 2013), available at http://www.wri.org/publication/aqueduct-metadata-global.
Domestic
Agricultural
Industrial
Understanding the major water user within a play area helps (a) determine the largest sector competitor for water, and (b) predict the type of conflicts that may arise. For example, in some regions, agricultural water users have strong traditional, political, and social influence.
Population densityThe average number of people per square kilometer.
Source: CIESIN and CIAT, “Gridded Population of the World Version 3 (GPWv3): Population Count Grid,” Future Estimates, Palisades, NY: NASA Socioeconomic Data and Applications Center (SEDAC), 2005, available at http://dx.doi.org/10.7927/H4ST7MRB.
Population Density (people/sqkm)
Areas of high population density pose complex barriers to shale development; such as logistical, environmental, and social challenges to accessing water. High population density often indicates high competition for water and significant regulatory and reputational risks.
Reserve depth intervalThe range of depths (in meters) of the prospective shale area. The black line indicates the global average depth in meters.
Source: West Virginia University and The National Energy Technology Laboratory. “Atlas of Unconventional Hydrocarbon Resources.” 2014, available at https://edx.netl.doe.gov/dataset/unconventional-resources-atlas.
1,006
5,029
The range of depths of the prospective shale area indicates if more or less water will be required. Deeper formations generally require more water for drilling.
0.4

31Global Shale Gas Development: Water Availability and Business Risks
GLOBAL RESULTS386 million people live on the land above shale resources, and 38
percent of the world’s shale resources are in areas that face high
to extremely high water stress or arid conditions. Worldwide, but
particularly in these areas, it is necessary to understand freshwater
availability, the level of competition for water, and the risks
associated with drilling and hydraulic fracturing activities.

WRI.org 32
SHALE BASIN
Low
Low to medium
Medium to high
High
Extremely high
Arid & low water use
BASELINE WATER STRESS LEVEL
LEGEND
CANADA573
Country name
Average Baseline Water Stress Level
Technically recoverable shale gas resources (trillion cubic meters)
Figure 3 | Location of World’s Shale Plays, Volume of Technically Recoverable Shale Gas in the 20 Countries with the Largest Resources, and the Level of Baseline Water Stress

33Global Shale Gas Development: Water Availability and Business Risks
Notes1. Colored polygons are areas that have been identified as shale plays: shale deposits that are viable for commercial production.2. Dark grey polygons are shale basins. While shale plays fall within basins, other shale resources within basins may not be commercially viable.3. Circle size denotes the country’s total technically recoverable shale gas resources (trillion cubic meters).4. Circle color denotes the area-weighted average of baseline water stress levels over all shale plays within a country. If more than half of the country’s shale play area is in
arid and low water use regions, the circle is colored in light grey.
Sources: Location of world’s shale basins and plays from West Virginia University and The National Energy Technology Laboratory. Estimates of total technically recoverable shale gas resources from the U.S. Energy Information Administration. Estimates of baseline water stress from WRI’s Aqueduct Water Risk Atlas.
Figure 3 | Location of World’s Shale Plays, Volume of Technically Recoverable Shale Gas in the 20 Countries with the Largest Resources, and the Level of Baseline Water Stress

WRI.org 34
This section gives the key global findings. It high-lights where freshwater availability is most limited, might constrain shale development, and poses business risks to companies extracting the resource. Additionally, it sheds light on the level of water stress across shale formations in the 20 countries with the largest shale gas and tight oil technically recoverable resources (TRR) based on estimates from the U.S. Energy Information Administration.
Key Findings Shale resources are unevenly distributed around the globe, and most are not located where water is abundant (Figure 3). For example, China, Mexico, and South Africa have some of the world’s largest technically recoverable shale gas resources and also face high to extremely high levels of water stress in the areas where the shale is located.
The findings (Figure 4) indicate that worldwide:
▪ 38 percent of shale resources are in areas that are either arid or under high to extremely high levels of water stress
▪ 19 percent are in areas of high and extremely high seasonal variability, and
▪ 15 percent are in locations exposed to high and extremely high drought severity.
In areas of high to extremely high baseline water stress, substantial portions of the available fresh-water supply (40 to 100 percent) are already being withdrawn by agricultural, municipal, or industrial users. This situation presents significant challenges to ensuring a reliable water supply during drier years while maintaining environmental and human needs. Thus, areas of high stress are overall more vulnerable to droughts or diminishing supplies and increased competition for water.
Figure 4 | Distribution of Baseline Water Stress, Seasonal Variability, and Drought Severity over Shale Plays Worldwide
Low
Low to medium
Medium to high
High
Extremely high
Arid & low water use
41%
12%9%
6%
11%
21%
BASELINE WATER STRESS
Low
Low to medium
Medium to high
High
Extremely high
No data
17%
39%25%
13%
6%
0.2%
SEASONAL VARIABILITY
Low
Low to medium
Medium to high
High
Extremely high
No data
8%
48%28%
6%
9%
0.0%
DROUGHT SEVERITY
Source: Location of world’s shale plays from West Virginia University and The National Energy Technology Laboratory. Estimates of baseline water stress, seasonal variability, and drought severity from WRI’s Aqueduct Water Risk Atlas.

35Global Shale Gas Development: Water Availability and Business Risks
About 386 million people live on land above the identified shale plays. This estimate was obtained by overlaying population data with the shale plays worldwide. Irrigated agriculture is the largest water user in 40 percent of the shale plays, industry accounts for another 40 percent, and domestic use takes the final 20 percent (Figure 5). Competing water demands from drilling and hydraulic frac-turing activities can rapidly escalate and result in conflicts with other water users. Farmers have raised concerns or stood up against the potential for shale development in many parts of the world, includ-ing Poland, South Africa, and the United States to name a few. Similar situations may occur when shale development competes for water with domestic users, particularly in areas with ineffective or nonex-istent public water policy to protect the environment and ensure water security for all users.
Figure 5 | Percentage of Shale Plays Worldwide with the Largest Water Withdrawals by Agricultural, Industrial, and Domestic Users
Agricultural
Domestic
Industrial
40%
20%
40%
Source: Location of world’s shale plays from West Virginia University and The National Energy Technology Laboratory. Estimates of water withdrawals from WRI’s Aqueduct Water Risk Atlas.

WRI.org 36
Country Comparisons From the global assessment, we extracted key infor-mation by country and combined it with information on the size of each country’s technically recoverable resources (TRR), based on U.S. Energy Information Administration estimates. The results shed light on key freshwater availability constraints across shale plays in the 20 countries with the largest technically recoverable resources:
▪ Shale gas TRR: Eight of the top 20 countries with the largest technically recoverable shale gas resources (Table 4) face arid conditions or an average of high to extremely high baseline water stress where the shale is located. China, Mexico and South Africa stand out, ranking very highly based on the size of their resources and exposure to baseline water stress.
▪ Tight oil TRR: Eight of the top 20 countries with the largest technically recoverable tight oil resources (Table 5) face arid conditions or an average of high to extremely high baseline water stress where the shale is located. China, Mexico and Pakistan stand out, ranking very highly based on the size of the resource and exposure to baseline water stress.
In these and other countries exposed to greater water stress than the United States or Canada, companies are likely to face even more serious challenges to accessing freshwater for shale gas and tight oil extraction than they did in North America.
Global results provide useful information on the distribution of water resources across shale plays in each country. For example, the distribution of baseline water stress over shale plays (Figure 6) shows the extent to which national shale resources are exposed to different levels of competition and depletion of water resources. Understanding this type of information can help minimize environmen-tal impacts, evaluate business risks, and develop effective sustainable water sourcing strategies.
Water availability can be limited by two things: arid conditions in areas with limited precipita-tion and runoff (e.g.regions of Libya, Algeria or Egypt); or high competition for water in areas with demands close to, or exceeding, the available water supplies (e.g. Pakistan, India, Mexico). The social, environmental, and economic implications dif-fer in each case. In arid areas, operators will have difficulty finding water, particularly freshwater. In stressed areas, where users compete for water, there will be greater political and social barriers to allocating already-stressed water resources away from other users. Nevertheless, in both cases, limitations to water availability could pose business risks to companies involved in developing these resources, especially those with unsustainable water management practices.
Worldwide, but particularly in countries with shale formations in areas of high water stress (e.g. China and South Africa), the specific location of the drill-ing and hydraulic fracturing operations are critical to determining the level of water availability and understanding the associated business risks.
In-depth analyses of water availability over shale plays with high potential for development over the coming decades in 11 countries are given in Appendix A. The information includes background on national energy and shale resources, regulatory environment, and water resources, as well as water availability constraints and business risks.

37Global Shale Gas Development: Water Availability and Business Risks
Table 4 | Average Exposure to Baseline Water Stress across Shale Plays in the 20 Countries with the Largest Technically Recoverable Shale Gas Resources
RANKa EIA ESTIMATED SHALE GAS TRR (TRILLION CUBIC FEET)b COUNTRY
AVERAGE EXPOSURE TO BASELINE WATER STRESS OVER SHALE PLAY AREAc
1 1,115 China High
2 802 Argentina Low to Medium
3 707 Algeria Arid & Low Water Use
4 573 Canada Low to Medium
5 567 United States Medium to High
6 545 Mexico High
7 437 Australia Low
8 390 South Africa High
9 287 Russian Federation Low
10 245 Brazil Low
11 167 Venezuela Low
12 148 Poland Low to Medium
13 137 France Low to Medium
14 128 Ukraine Low to Medium
15 122 Libya Arid & Low Water Use
16 105 Pakistan Extremely High
17 100 Egypt, Arab Rep. Arid & Low Water Use
18 96 India High
19 75 Paraguay Medium to High
20 55 Colombia Low
a. Based on size of estimated shale gas TRRb. Vello Kuuskraa, Scott Stevens, and Keith Moodhe, Technically Recoverable
Shale Oil and Shale Gas Resources : An Assessment of 137 Shale Formations in 41 Countries Outside the United States (Washington, DC: U.S. Energy
Information Administration, June 10, 2013), http://www.eia.gov/analysis/studies/worldshalegas/.
c. WRI’s Aqueduct Water Risk Atlas.
WRI.org 38
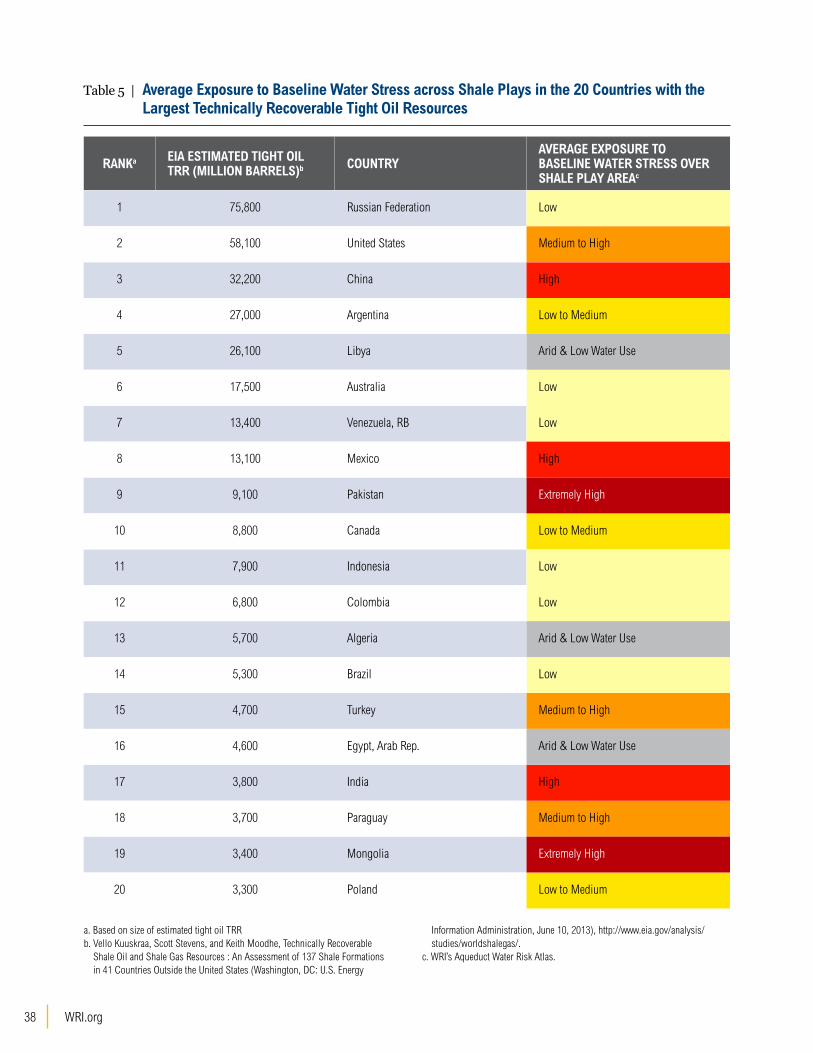
Table 5 | Average Exposure to Baseline Water Stress across Shale Plays in the 20 Countries with the Largest Technically Recoverable Tight Oil Resources
RANKa EIA ESTIMATED TIGHT OIL TRR (MILLION BARRELS)b COUNTRY
AVERAGE EXPOSURE TO BASELINE WATER STRESS OVER SHALE PLAY AREAc
1 75,800 Russian Federation Low
2 58,100 United States Medium to High
3 32,200 China High
4 27,000 Argentina Low to Medium
5 26,100 Libya Arid & Low Water Use
6 17,500 Australia Low
7 13,400 Venezuela, RB Low
8 13,100 Mexico High
9 9,100 Pakistan Extremely High
10 8,800 Canada Low to Medium
11 7,900 Indonesia Low
12 6,800 Colombia Low
13 5,700 Algeria Arid & Low Water Use
14 5,300 Brazil Low
15 4,700 Turkey Medium to High
16 4,600 Egypt, Arab Rep. Arid & Low Water Use
17 3,800 India High
18 3,700 Paraguay Medium to High
19 3,400 Mongolia Extremely High
20 3,300 Poland Low to Medium
a. Based on size of estimated tight oil TRRb. Vello Kuuskraa, Scott Stevens, and Keith Moodhe, Technically Recoverable
Shale Oil and Shale Gas Resources : An Assessment of 137 Shale Formations in 41 Countries Outside the United States (Washington, DC: U.S. Energy
Information Administration, June 10, 2013), http://www.eia.gov/analysis/studies/worldshalegas/.
c. WRI’s Aqueduct Water Risk Atlas.

39Global Shale Gas Development: Water Availability and Business Risks
For each play, the country analysis includes:
▪ Name
▪ Spatial distribution of baseline water stress, seasonal variability, drought severity, and groundwater stress
▪ Population density
▪ Dominant water user
▪ Reserve depth interval
Countries were selected based on the size of their technically recoverable shale resources as disclosed by the U.S. Energy Information Administration, current exploratory and production activity, likeli-hood of future development, and feedback from industry, academia, and NGO experts. They are:
▪ Algeria
▪ Argentina
▪ Australia
▪ Canada
▪ China
▪ Mexico
▪ Poland
▪ Saudi Arabia
▪ South Africa
▪ United Kingdom
▪ United States
25%
50%
75%
100%
Tota
l sha
le p
lay
area
Liby
a
Alge
ria
Paki
stan
Egyp
t
Sout
h Af
rica
Indi
a
Mex
ico
Chin
a
Para
guay
USA
Arge
ntin
a
Aust
ralia
Cana
da
Vene
zuel
a
Turk
ey
Pola
nd
Fran
ce
Russ
ia
Ukra
ine
Braz
il
Colo
mbi
a
Note: Countries arranged from most arid or highest water stress on the left, to lowest water stress on the right.Sources: Location of world’s shale plays from West Virginia University and The National Energy Technology Laboratory. Estimates of total technically recoverable shale gas resources from the U.S. Energy Information Administration. Estimates of baseline water stress from WRI’s Aqueduct Water Risk Atlas.
Arid & low water use Extremely high High Medium to high Low to medium Low
Figure 6 | Distribution of Baseline Water Stress across Shale Plays in the 20 Countries with the Largest Technically Recoverable Shale Gas Resources


41Global Shale Gas Development: Water Availability and Business Risks
CONCLUSIONS AND RECOMMENDATIONSThe preceding sections indicate that freshwater availability could
curtail shale development, and that extracting shale resources
could have a significant effect on local water availability. Based on
these results, WRI makes recommendations for how governments,
businesses, and others can evaluate and sustainably manage
freshwater availability in any future development of shale resources.

WRI.org 42
ConclusionsFreshwater availability could curtail shale develop-ment in many plays around the world. This finding makes a strong business case for strategic company engagement in sustainable water management at local and regional levels. WRI found that 38 percent of shale resources worldwide are located in areas that are arid or face high to extremely high water stress. Under these conditions, companies developing shale resources internationally are likely to face serious challenges to accessing freshwater in many parts of the world. The analysis also finds that worldwide roughly 386 million people live over the identified shale plays. The ability of companies to work with governments and other river basin stakeholders to identify, assess, and mitigate water availability con-straints and the associated business risks will play a key role in determining the extent of shale resource development, and ensuring long-term water avail-ability for all users and the environment.
Global and country assessments reveal large spatial and seasonal variation in hydrological conditions across shale plays, such as between the eastern and western United States, and within plays, like the Karoo in South Africa, Bowland in the United Kingdom, or Sichuan in China. Conditions also vary seasonally, with high to extremely high seasonal variability over close to 20 percent of the world’s shale formations, for example in the Beetaloo in Australia or Tampico in Mexico. During drier periods of the year, it may be far more challenging to access freshwater.
The demand for water for hydraulic fracturing and drilling is unpredictable and depends on the forma-tion geology and well characteristics. Because of this, estimates based on previous experience of the environmental impacts, cost, technology, and pro-cesses required to access sufficient water for drilling and hydraulic fracturing activities will not always be applicable in new shale formations. This increases uncertainty, and thus business risks for companies exploring new areas for development.
Finally, since much of the water use for shale development can be consumptive, the amount used can have a significant impact on local water avail-ability. In 40 percent of the shale plays—including the Utica play in Canada, Parana play in Argentina, and most plays in China—the largest water user is irrigated agriculture. In all shale resources, but particularly in these, public concern over impacts on the availability and quality of freshwater for other critical human needs may threaten a com-pany’s social license to operate and lead to changes in regulations that could impact both short- and long-term investments.
Recommendations Based on the new information and conclusions provided in this report, WRI makes the following recommendations for how governments, businesses, and other stakeholders can continue to evaluate and sustainably manage freshwater availability in any future development of shale resources:

43Global Shale Gas Development: Water Availability and Business Risks
1. Conduct water risk assessments to understand local water availability and reduce business risk.
Arid conditions and high levels of water stress over 38 percent of the world’s shale resources indicate that in these areas any additional demands for fresh-water will exacerbate an already challenging situa-tion. To minimize impacts on freshwater availability and the associated business risks, the first step is to better understand the local hydrological conditions, risks, and potential impacts prior to investing in or beginning shale development activities. To do so:
1.1. Companies can evaluate water-related risks. Using a combination of publicly available global (e.g., WRI Aqueduct Water Risk Atlas41 or WWF Water Risk Filter42) and asset-level tools (e.g. GEMI Local Water Tool43) companies can evaluate water constraints and identify business risks. The results help identify priority areas to engage with regulators, communities, and industry in search of solutions to increase water security.
1.2. Governments can increase investments in collecting and monitoring water supply and demand information. Sustainably managing water resources for all users requires robust baseline information and future estimates of water supply and demand and environmen-tal conditions in a given surface and ground watershed. Joint research and analysis can help build a strong, shared knowledge base
across sectors to inform the development of effective water policies and science-based targets and goals.
2. Increase transparency and engage with local regulators, communities, and industry to reduce uncertainty.
The variability in hydrological conditions and uncertainty in competition and demand for water between and within shale formations can create sig-nificant business risk. Because of this, it is critically important that financial, government, and river basin stakeholders trust the water management practices of the companies involved. The following actions should be taken to minimize uncertainties and increase stakeholder trust:
2.1. Companies can increase corporate water disclosure. Disclosing their water use and man-agement approaches helps companies build trust with financial and river basin stakehold-ers as they investigate water risks and opportu-nities. This approach will reduce reputational risks. Disclosure of water use and management can take place through company reports, or publicly available platforms (e.g., the CDP Water program44). The scope and content of corporate water disclosure can be determined following guidance in the UN Global Compact CEO Water Mandate Corporate Water Disclo-sure Guidelines,45 or Ceres Aqua Gauge.46

WRI.org 44
2.2. Governments and companies can engage local and regional industry, agriculture, and com-munities. Companies engaging in new shale activities should begin or continue to work in close collaboration with local government, industry, farmers, NGOs, and civil society representatives to understand the local agri-cultural, industrial, and domestic demands for water, as well as the level of depletion of the resource, ecosystem requirements, and regula-tory frameworks within the river basin. This information allows for more accurate esti-mates of the cost, technology, and processes required to access water for shale development without displacing other users or degrading the environment. Engaging local stakeholders before and throughout the project lifecycle also helps limit water-related conflicts and identify opportunities for collective action.
3. Ensure adequate water governance to guarantee water security and reduce regulatory and reputational risks.
Roughly 386 million people live on the land over the shale resources identified in this study. World-wide, but particularly in these areas, public concern over water security and impacts on water availabil-ity could escalate quickly. Community opposition or conflicts among industrial, agricultural, and domes-tic water users can drive changes in regulation that may impact both short- and long-term investments. To ensure water security, governments and compa-nies should take the following actions:
3.1. Companies can engage in public water policy. Public concern over water use for shale energy development, in many cases, stems from ineffective or nonexistent public water policy to protect the environment and ensure water security. Thus, adequate water governance and environmental protection standards coupled with predictable implementation and effective enforcement are needed to minimize envi-ronmental degradation and ensure fair water allocation and pricing. In a stable regulatory environment, companies and investors can evaluate long-term opportunities and minimize business risks. Companies pursuing shale development should actively engage in
public water policy to advance sustainable and responsible water governance that will reduce business risk. This can be done collectively with other industry and non-industry mem-bers, through international organizations, or with local NGOs. Guidance is available in the UN Global Compact CEO Water Mandate publications, Guide to Responsible Business Engagement with Water Policy,47 Framework for Responsible Business Engagement with Water Policy,48 and “Shared Water Chal-lenges and Interests: The Case for Private Sector Engagement in Water Policy and Management,”49 as well as in the World Wild-life Fund (WWF) report, Investigating Shared Risk in Water: Corporate Engagement with the Public Policy Process.50
3.2. Governments and companies, through col-lective action, can develop source water protection and management plans. Govern-ments and businesses operating in countries at the early stages of shale development have a unique opportunity to work collectively across sectors to develop source water protection and management plans that: help reduce business risks; promote shared water sourcing and recycling infrastructure; improve the sustain-able management of watersheds or aquifers; and include participation from key river basin stakeholders. For example, improving agricul-tural water efficiency can increase water supply reliability for all users and provide a win-win outcome for both industry and agriculture.51 These types of shared solutions and early engagement through water-related collective action52 can provide significant advantages to governments and companies involved and attract investor interest.
4. Minimize freshwater use and engage in corporate water stewardship to reduce impacts on water availability.
New and increasing demands for water will inten-sify the level of stress, further limiting the ability of water users to adapt to drought years and threaten-ing the health of ecosystems. To minimize impacts on water availability:

45Global Shale Gas Development: Water Availability and Business Risks
4.1. Companies can minimize freshwater use. Companies can use guidelines, such as the IPIECA guide, Identifying and Assessing Water Sources,53 and work with local govern-ments to evaluate potential non-freshwater sources and build the business case for increased investments in technology to recycle or reuse wastewater, use brackish water, or otherwise significantly reduce water with-drawals. For example, operators in the Horn River basin in British Columbia, Canada, reduced their dependence on freshwater by identifying an opportunity to use saltwater and investing in a closed-looped system.54
4.2. Companies can develop a water strategy and engage in corporate water stewardship. Oil and gas companies are significant users and managers of water at local and regional levels.55 As such, they should have water management embedded at the core of their business strategy to minimize exposure to risks and ensure long-term water availability for other users, the environment, and their own operations. This can be done by engaging in corporate water stewardship, a progression of improvements in water use and impact reduc-tions across internal company and value chain operations.56 Through water stewardship, any company can publicly commit to the sustain-able management of water resources in the public interest through collective action. A water stewardship approach helps all major operational, investment, and strategic deci-sions take water risk into account, including the future impacts of water use on business, local communities, and the environment.57 Guidance on how to strategically manage water and engage in corporate water steward-ship is available through programs such as the UN Global Compact CEO Water Mandate, IPIECA Water Working Group, Alliance for Water Stewardship, European Water Steward-ship, or WWF’s Water Stewardship Program, to name a few.
Sustainably managing water resources for all users requires robust
baseline information and future estimates of water supply and demand and
environmental conditions in a given watershed.

WRI.org 46
APPENDIX A: COUNTRY ANALYSES
Algeria
BackgroundEnergy and shale resources: Fossil fuels are the backbone of the Algerian economy; they accounted for 70 percent of government revenues and 98 percent of export revenues in 2011.58 Algeria is the largest natural gas producer and second largest oil producer in Africa,59 and holds the third largest shale gas resource in the world.60
Regulatory environment: In January 2013, the Algerian parlia-ment approved amendments to hydrocarbon laws that introduced strong fiscal incentives to attract foreign companies to explore the country’s shale resources.61 In May 2014, the Algerian cabinet announced it will move forward with the exploitation of the country’s large shale reserves.62
National water resources: More than 80 percent of the country is in the Sahara desert, and shale plays are located in areas of very low rainfall and extremely dry land. Desalination and wastewater reuse are both government priorities. Agriculture accounts for more than 60 percent of the nation’s total water withdrawal. A tripled natural gas production and a two-fold increase in oil production over the past 30 years63 has likely driven significant increases in the demand
for water by the oil and gas sector. The Algerian Ministry of Water Resources is in charge of managing the country’s water resources.
Water Availability Constraints
▪ More than 95 percent of Algeria’s shale plays are covered by the Sahara desert.
▪ The Ghadames play holds 40 percent of Algeria’s total shale resources and is located in an area that is almost entirely arid, with extremely low levels of surface water availability. Similar conditions are present over the rest of Algeria’s plays.
▪ Industry is the dominant water user in four of the seven shale plays in Algeria.
Business Risks
▪ The most prominent risk to companies developing shale resources in Algeria is the limited surface water availability and associated challenges in securing freshwater sources.
▪ High seasonal variability in freshwater supplies will make the timing of drilling and hydraulic fracturing operations critical when evaluating access to water.
Figure A1 | Shale Plays and Baseline Water Stress in Algeria
WATER STRESS
4%
96%
Low
Low to medium
Medium to high
High
Extremely high
Arid & low water use
Shale play

47Global Shale Gas Development: Water Availability and Business Risks
Table A1 | Water Availability Indicators for Shale Plays in Algeria
SHALE PLAYS Ahnet Ghadames Illizi Mouydir Reggane Timimoun Tindouf
Baseline Water Stress
Seasonal Variability
Drought Severity
Groundwater Stress
Population Density (people/sqkm)
0.4 3.0 0.5 0.7 0.9 1.3 0.3
Dominant Water User
Reserve Depth Interval (meters)
1,006
2,438
1,0061,524 1,524
1,006
2,012
4,2674,5724,877
3,0482,438
4,877
3,200
0
1,000
2,000
3,000
4,000
5,000

WRI.org 48
Argentina
BackgroundEnergy and shale resources: Argentina is the largest natural gas producer and consumer in South America, and a regionally signifi-cant producer and exporter of oil.64 It possesses the world’s second largest technically recoverable shale gas resources and fourth larg-est technical recoverable tight oil resources based on estimates from the U.S. Energy Information Administration.65 Over two thirds of the country’s resources are located in the Neuquén play, where most of the development is taking place.66
Regulatory environment: Price controls on gas caused Argentina to begin importing natural gas in 2008, and weakened the eco-nomic incentive for unconventional gas development. To encourage unconventional gas development, the Argentine government passed the “gas and oil plus programs” in 2008, and slackened tariffs in July 2013 to allow 20 percent of produced crude and natural gas to be exported tax free. These, as well as other provincial government interventions in licenses, pricing, and regulation from early 2012 indicate high regulatory uncertainty.67
National water resources: Most of the plays in Argentina are located in areas with semiarid or arid climates, except for the Parana, which has more abundant water resources feeding from the Parana River. While agriculture is still the dominant water user, accounting for more than 60 percent of the total water use, industrial withdraw-als have recently increased in both absolute value and percentage share of the national total.68 Multiple institutions operating at the national, provincial, and river basin levels manage water resources.
Water Availability Constraints
▪ The Neuquén is arguably the most prospective play in Latin America because of its favorable geologic characteristics69 and pipeline infrastructure.70 Although, similar to the national aver-age, the Neuquén has medium to low baseline water stress over nearly 70 percent of its area, parts of the play do suffer from medium to high levels of groundwater stress.
▪ In the San Jorge play, 74 percent of the area faces high to ex-tremely high drought severity, and most of the play is located in arid areas with very low water use and limited supplies.
▪ Population density in the Parana play is an order of magnitude higher than in the other plays, causing domestic water use to be the highest user of all sectors.
Business Risks
▪ High drought severity and arid conditions in the San Jorge play could lead to increased costs and competition with other users to access and secure limited freshwater supplies; this could result in financial and regulatory risks to companies developing shale resources.
▪ Stressed aquifers in the Neuquén could indicate limited access to groundwater should these underground resources not be man-aged adequately to ensure long-term availability for all users.
▪ In the Parana play, higher population density could translate to higher regulatory and reputational risks.
Figure A2 | Shale Plays and Baseline Water Stress in Argentina
Low
Low to medium
Medium to high
High
Extremely high
Arid & low water use
Shale play
WATER STRESS
28%
10%62%

49Global Shale Gas Development: Water Availability and Business Risks
Table A2 | Water Availability Indicators for Shale Plays in Argentina
SHALE PLAYS Austral- Magallanes Neuquén San Jorge Parana
Baseline Water Stress
Seasonal Variability
Drought Severity
Groundwater Stress
Population Density (people/sqkm)
2.3 6.3 2.4 37
Dominant Water User
Reserve Depth Interval (meters)
1,981
4,999
2,743
4,999
914
3,048
2,012
4,999
0
1,000
2,000
3,000
4,000
5,000

WRI.org 50
Australia
BackgroundEnergy and shale resources: Australia exports over 70 percent of its energy production. It is the second largest coal exporter and the third largest liquefied natural gas exporter worldwide.71 With the world’s seventh largest technically recoverable shale gas resources and similar geologic and industry infrastructure conditions to the United States and Canada, Australia has the potential to be one of the next countries with commercially viable shale gas and tight oil production.72 The country’s electricity price hikes of 70 percent over the past four years are likely to increase the demand for cheaper natural gas that could help displace more-polluting energy sources such as coal.73
Regulatory environment: In 2011, the first successful shale gas production test was announced in the Cooper play,74 with more exploration under way in the western and Northern provinces.75
Current international exploration interest could result in widespread shale development in Australia.76
National water resources: Australia is the world’s second driest continent, with much of its shale in extremely remote and very arid locations. The distribution of water withdrawals is highly uneven across the country. At a national level, the country uses 5 percent of its renewable freshwater; however, some regions extract more than half of the locally available water.77 The Australia Water Act of 2007 was established to achieve sustainable and integrated management of water resources across the country.78
Water Availability Constraints
▪ Most shale resources in Australia are in areas of medium to high drought severity and medium to high seasonal variability in water supplies.
▪ The Cooper play is most likely to host Australia’s first commer-cial shale well,79 and is located in an arid region with low levels of water use, limited freshwater supplies, and medium to high seasonal variability.
▪ The Maryborough play is located in an area of high to extremely high baseline water stress and much higher population density than the rest of the plays in Australia.
Business Risks
▪ Arid conditions in the Georgina, Cooper, and Canning plays could represent significant challenges for companies seeking to access surface water, leading to potential financial, regulatory, and reputational risks.
▪ Similarly, high levels of competition for water, and population density in the Maryborough play pose risks to securing freshwa-ter, particularly during dry periods, which could drive increased reputational and regulatory risks for companies competing with local agricultural and domestic water users.
▪ The Beetaloo play’s very high levels of both seasonal variability and drought demonstrate a strong seasonality in water availabil-ity. Situations of this type pose financial and reputational risks to shale development during times of increased competition for limited water resources.
Figure A3 | Shale Plays and Baseline Water Stress in Australia
WATER STRESS
80%
19%
1%
Low
Low to medium
Medium to high
High
Extremely high
Arid & low water use
Shale play

51Global Shale Gas Development: Water Availability and Business Risks
Table A3 | Water Availability Indicators for Shale Plays in Australia
SHALE PLAYS Beetaloo Canning Cooper Georgina Maryborough Perth
Baseline Water Stress
Seasonal Variability
Drought Severity
Groundwater Stress
Population Density (people/sqkm)
0.1 0.1 0.1 0.1 26.0 0.7
Dominant Water User
Reserve Depth Interval (meters)
1,006
5,029
1,524
5,029
701
3,200
1,524
3,962
1,006
5,029
1,006
2,652
0
1,000
2,000
3,000
4,000
5,000

WRI.org 52
Canada
BackgroundEnergy and shale resources: Canada is the world’s fourth largest producer of natural gas, the primary supplier of U.S. gas imports, and a net exporter of oil, natural gas, and coal.80 It has the fourth largest technical recoverable shale gas resources and tenth largest technically recoverable tight oil resources worldwide.
Regulatory environment: Canada is the only country other than the United States that is developing shale resources commercially. Hydraulic fracturing is legal in all provinces except Quebec and Newfoundland,81 and significant development is under way in the western provinces. In Quebec, home to the St. Lawrence Lowlands and Utica shale play, a de facto moratorium on hydraulic fractur-ing for gas exploitation is in effect until a strategic environmental assessment is completed. Furthermore, the Utica shale play is home to most of Quebec’s population and agricultural productivity. Quebec’s national assembly is reviewing a bill that, if passed, would formalize the current moratorium on hydraulic fracturing in the Utica shale play.82
National water resources: Canada’s abundant freshwater resources and low population density make it the country with the most water per capita worldwide.83 Nevertheless, because of heavy industrialization, many areas of Canada suffer from water stress caused by increased demand for overdrawn water resources. The energy industry in Canada accounts for nearly 70 percent of the country’s total water withdrawals.84
Water Availability Constraints
▪ The Colorado Group play, sometimes referred to as the Cardium play, is in the province of Alberta, which has the nation’s highest level of competition for freshwater, with nearly 40 percent of the play area under high or extremely high baseline water stress.
▪ The Cordova Embayment play stands out for its high levels of seasonal variability in freshwater supplies.
▪ The Utica play, between Montreal and Quebec City along the St. Lawrence River, has the highest population density of all Canadian plays.
Business Risks
▪ The Cordova Embayment and Colorado Group plays have high seasonal variability and baseline water stress indicating potential challenges for companies to access freshwater. Situations of this type could translate to higher costs and regulatory uncertainty when accessing water for hydraulic fracturing and drilling activities.
▪ If the moratorium in the Utica play was lifted, high population density and local government opposition could translate into significant social opposition and reputational risks to companies and investors engaged in shale resources development.
Figure A4 | Shale Plays and Baseline Water Stress in Canada
WATER STRESS
58%21%
11%
0.4%
5%
5%
Low
Low to medium
Medium to high
High
Extremely high
Arid & low water use
Shale play

53Global Shale Gas Development: Water Availability and Business Risks
Table A4 | Water Availability Indicators for Shale Plays in Canada
SHALE PLAYS
Albe
rta R
ocky
(Col
orad
o Gr
oup)
Bakk
en
Cord
ova
Emba
ymen
t
Doig
Pho
spha
te
Fred
eric
k Br
ook
Horn
Riv
er
Horto
n Bl
uff
Liar
d
Mon
tney
(Doi
g)
Utic
a
Baseline Water Stress
Seasonal Variability
Drought Severity
Groundwater Stress
Population Density (people/sqkm)
15.7 1.6 0.1 1.3 11.8 0.3 17.9 0.1 0.3 49.6
Dominant Water User
Reserve Depth Interval (meters)
1,219
3,353
2,012
3,962
2,073
3,322
1,920
3,109
914
1,524
1,676
1,8903,048
5,000
1,676
2,438
2,073
3,322
0
1,000
2,000
3,000
4,000
5,000
Unknown

WRI.org 54
China
BackgroundEnergy and shale resources: China is the world’s largest energy producer and consumer.85 The International Energy Agency projects China’s energy demand will grow by 60 percent and natural gas consumption by over 400 percent by 2035.86 Based on EIA informa-tion, China possesses the largest technically recoverable shale gas resources and the third largest technically recoverable tight oil resources worldwide.
Regulatory environment: The Chinese government supports shale gas as an enticing alternative to both imported gas and coal, because of its domestic availability and lower greenhouse gas and particulate emissions.87 Exploration, including the drilling of about 100 wells over the past few years, has focused on the Sichuan basin, which, along with the Tarim, holds the majority of China’s shale resources.88 The government is seeking technology and experience through strategic alliances with foreign operators and, as of Septem-ber 2012, has been encouraging foreign participation in domestic shale development through a public tender process.89
National water resources: China is the second largest water user in the world, responsible for 14 percent of water withdrawals glob-ally, almost a quarter of which are for industrial use.90 Water is more abundant in the south of China than the north. However, the north holds most of the fossil reserves and industrial activity. In response, the South-North Water Transfer Project is underway, which is designed to transfer more than 44 billion cubic meters of water from the south to the north every year.91
Water Availability Constraints
▪ Over 60 percent of China’s shale resources are in areas of high to extremely high baseline water stress or arid conditions.
▪ The Sichuan play, China’s most important shale play, combines areas of low and very high baseline water stress driven by pock-ets of high demand for water relative to the available supply.
▪ Over 95 percent of the Tarim play is subject to extremely high baseline water stress or arid conditions, including areas with extremely high groundwater stress and seasonal variability. Collectively, these conditions will pose major challenges for companies to access water.
▪ All shale resources across China are located in areas of high population density, except for the Tarim and the Junngar plays.
Business Risks
▪ Companies operating in arid areas and in areas of high or extremely high baseline water stress (60 percent of China’s shale play area) will have to compete with other users for what is already a very scarce resource. High levels of competition among agricultural, domestic, and industrial water users could represent higher costs, reputational risks, and increased regulatory uncertainty for operators trying to access water for hydraulic fracturing and drilling operations.
▪ The Tarim and Junngar plays are dominated by arid and low water use conditions, and very high surface and groundwater stress, leading oil and gas operators to potentially face significant financial risks associ-ated with the additional costs of accessing and transporting water.
▪ Developers in areas with extremely high population density and medium to high seasonal variability, such as the Sichuan and most other Chinese plays, may face significant regulatory and reputational risks if water-intensive activities are conducted irresponsibly during drier periods.
Figure A5 | Shale Plays and Baseline Water Stress in China
WATER STRESS
19%
3%
16%
13%
24%
24%
Low
Low to medium
Medium to high
High
Extremely high
Arid & low water use
Shale play

55Global Shale Gas Development: Water Availability and Business Risks
Table A5 | Water Availability Indicators for Shale Plays in China
SHALE PLAYS Greater Subei Jianghan Junggar Sichuan Songliao Tarim
Baseline Water Stress
Seasonal Variability
Drought Severity
Groundwater Stress
Population Density (people/sqkm)
1091.0 323.0 19.0 539.0 135.0 13.0
Dominant Water User
Reserve Depth Interval (meters)
2,624
4,999
1,006
2,499
1,000
4,999
1,524
4,999
1,006
4,999
1,006
4,999
0
1,000
2,000
3,000
4,000
5,000

WRI.org 56
Mexico
BackgroundEnergy and shale resources: Mexico remains the world’s eighth largest oil producer despite recent declines in production and exports; U.S. Energy Information Administration estimates that Mexico possesses the sixth largest technically recoverable shale gas resources and the eighth largest technically recoverable tight oil resources worldwide.
Regulatory environment: Mexico recently introduced a bill to change the constitution and allow private companies to partner with the government to find and produce oil and gas, ending the coun-try’s 75-year-old monopoly on oil and gas production, potentially opening up some of the world’s biggest remaining untapped oil reserves to private companies.92
National water resources: Rainfall is scarce in the north of the country where a large portion of the country’s shale is located. Overall, 50 percent of Mexico’s annual runoff is generated in the southeast, compared with only 4 percent generated in the north.93
Rapid urbanization and increasing demands for food and energy in Mexico have driven national water withdrawals to steadily increase over the past few decades, making water management a challenge in Mexico and imposing a significant cost to the country’s economy.
Water Availability Constraints
▪ In Mexico, 61 percent of the technically recoverable shale re-sources are located in areas that are arid or under high to extremely high baseline water stress. Specifically, the Tampico and Sabinas plays are located almost entirely in areas of very high water stress.
▪ The Burgos play, which forms part of the high-potential and well-explored Eagle Ford shale formation,94 has several pockets of extremely high water stress, and sits over a major aquifer already subject to depletion because of unsustainable withdrawals.
▪ The Tampico play, in which PEMEX plans to drill up to 80 ex-ploratory wells by 2015,95 is mostly in areas of high to extremely high water stress and seasonal variability in freshwater supplies, similar to the conditions in the Tuxpan play.
▪ The Veracruz play, which will likely see up to 10 exploratory wells in place by 2015,96 is located in an area of high seasonal variability in water supplies, has higher population density than other Mexican plays, and includes locations of high competition for water.
Business Risks
▪ Most of Mexico’s technically recoverable shale resources are in areas already subject to high competition for limited surface and groundwater resources. Because of this, competing with agricul-tural, domestic, and industrial demands for limited supplies of water could pose significant financial, regulatory, and reputa-tional risks to companies engaged in shale development.
▪ Strong seasonal variability in water supplies is common across the Tampico, Tuxpan, and Veracruz plays, posing additional chal-lenges to securing constant supplies of freshwater throughout the year. Strong temporal variability in water supplies, especially in areas of high population, creates additional uncertainties and reputational risks to companies extracting shale resources.
Figure A6 | Shale Plays and Baseline Water Stress in Mexico
Low
Low to medium
Medium to high
High
Extremely high
Arid & low water use
Shale play
WATER STRESS
27%
4%
8%
19%
31%
11%

57Global Shale Gas Development: Water Availability and Business Risks
Table A6 | Water Availability Indicators for Shale Plays in Mexico
SHALE PLAYS Burgos Sabinas Tampico Tuxpan Veracruz
Baseline Water Stress
Seasonal Variability
Drought Severity
Groundwater Stress
Population Density (people/sqkm)
18.0 15.0 75.0 68.0 96.0
Dominant Water User
Reserve Depth Interval (meters)
2,987
3,810
1,829
3,048
1,006
2,743
1,524
3,993
1,219
4,999
0
1,000
2,000
3,000
4,000
5,000
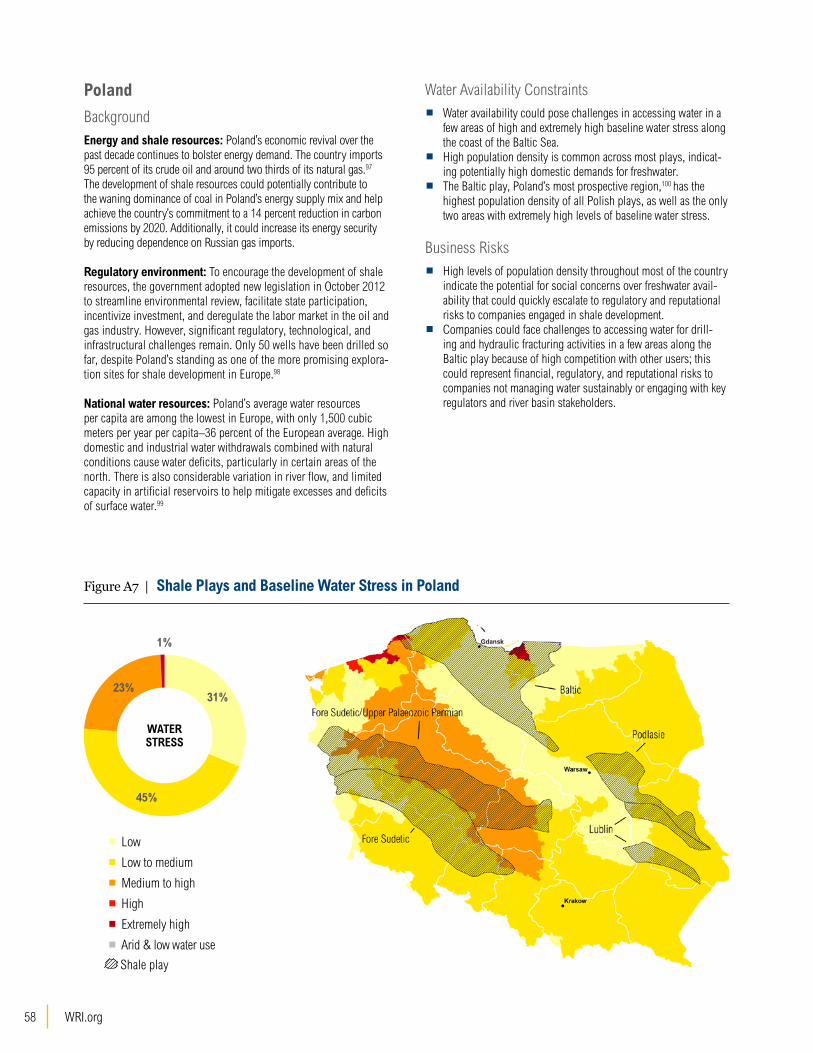
WRI.org 58
Poland
BackgroundEnergy and shale resources: Poland’s economic revival over the past decade continues to bolster energy demand. The country imports 95 percent of its crude oil and around two thirds of its natural gas.97
The development of shale resources could potentially contribute to the waning dominance of coal in Poland’s energy supply mix and help achieve the country’s commitment to a 14 percent reduction in carbon emissions by 2020. Additionally, it could increase its energy security by reducing dependence on Russian gas imports.
Regulatory environment: To encourage the development of shale resources, the government adopted new legislation in October 2012 to streamline environmental review, facilitate state participation, incentivize investment, and deregulate the labor market in the oil and gas industry. However, significant regulatory, technological, and infrastructural challenges remain. Only 50 wells have been drilled so far, despite Poland’s standing as one of the more promising explora-tion sites for shale development in Europe.98
National water resources: Poland’s average water resources per capita are among the lowest in Europe, with only 1,500 cubic meters per year per capita–36 percent of the European average. High domestic and industrial water withdrawals combined with natural conditions cause water deficits, particularly in certain areas of the north. There is also considerable variation in river flow, and limited capacity in artificial reservoirs to help mitigate excesses and deficits of surface water.99
Water Availability Constraints
▪ Water availability could pose challenges in accessing water in a few areas of high and extremely high baseline water stress along the coast of the Baltic Sea.
▪ High population density is common across most plays, indicat-ing potentially high domestic demands for freshwater.
▪ The Baltic play, Poland’s most prospective region,100 has the highest population density of all Polish plays, as well as the only two areas with extremely high levels of baseline water stress.
Business Risks
▪ High levels of population density throughout most of the country indicate the potential for social concerns over freshwater avail-ability that could quickly escalate to regulatory and reputational risks to companies engaged in shale development.
▪ Companies could face challenges to accessing water for drill-ing and hydraulic fracturing activities in a few areas along the Baltic play because of high competition with other users; this could represent financial, regulatory, and reputational risks to companies not managing water sustainably or engaging with key regulators and river basin stakeholders.
Figure A7 | Shale Plays and Baseline Water Stress in Poland
Low
Low to medium
Medium to high
High
Extremely high
Arid & low water use
Shale play
WATER STRESS
31%
45%
23%
1%
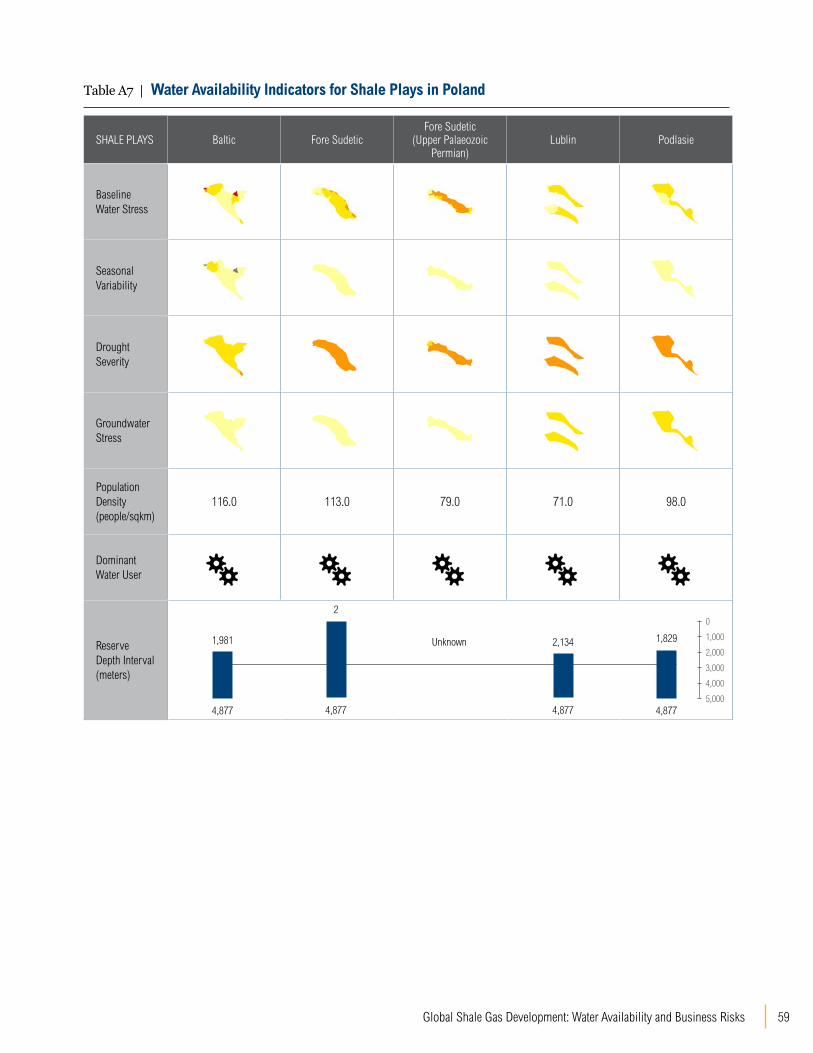
59Global Shale Gas Development: Water Availability and Business Risks
Table A7 | Water Availability Indicators for Shale Plays in Poland
SHALE PLAYS Baltic Fore SudeticFore Sudetic
(Upper PalaeozoicPermian)
Lublin Podlasie
Baseline Water Stress
Seasonal Variability
Drought Severity
Groundwater Stress
Population Density (people/sqkm)
116.0 113.0 79.0 71.0 98.0
Dominant Water User
Reserve Depth Interval (meters)
1,829
4,877
2,134
4,877
2
4,877
1,981
4,877
0
1,000
2,000
3,000
4,000
5,000
Unknown

WRI.org 60
Saudi Arabia
BackgroundEnergy and shale resources: Oil is the backbone of the Saudi Arabian economy. Saudi Arabia (officially known as the Kingdom of Saudi Arabia) has the world’s largest crude oil reserves, is the second largest oil producer and holds the fifth largest conventional gas reserves in the world (mostly associated with petroleum depos-its). In Saudi Arabia, domestic natural gas demand is projected to almost double by 2030.101 The country banned natural gas imports, so domestic supplies will be required to meet any additional demand.102 The Kingdom’s massive conventional reserves could supply its growing demand; however, given the Organization of the Petroleum Exporting Countries’ (OPEC’s) limits on oil production, the majority of this production growth will likely come from nonas-sociated reserves.
Regulatory environment: Saudi Arabia’s oil use in relation to its economic output is twice the global average, indicating possible interest in exploration and development of shale gas as an alterna-tive fuel type. However, the Kingdom’s plans to explore its vast shale reserves are likely to take years to develop. There are no political barriers at this point; instead, the success will depend on the eco-nomic feasibility, especially in regard to limited water supplies.103
National water resources: Saudi Arabia lies in a region of tropical and subtropical desert, and for the most part is arid and dry. It is the world’s largest producer of water from desalination; in 2006, more than 1 billion cubic meters of desalinated water were produced, equivalent to almost half of the country’s total annual renewable surface water resources. However, water supplied from desalination meets only a small fraction of the total demand; the remainder is sourced from deep groundwater aquifers posing significant risks to the depletion of these resources.
Water Availability Constraints
▪ Saudi Arabia shale plays are located in the Arabian Desert, in areas of extremely high surface and groundwater stress, as well as naturally occurring arid conditions.
Business Risks
▪ High costs associated with accessing water and developing ro-bust desalination capacity expansion to meet the water demands for hydraulic fracturing and drilling will be one of the largest challenges in developing shale resources in Saudi Arabia.
▪ High surface and groundwater stress and arid conditions also indi-cate the potential for competition with local users for scarce water resources. Conflicts with other users because of reallocation or depletion of water resources can rapidly escalate into reputational and regulatory risks for companies developing shale resources.
Figure A8 | Shale Plays and Baseline Water Stress in Saudi Arabia
Low
Low to medium
Medium to high
High
Extremely high
Arid & low water use
Shale play
WATER STRESS
49%51%
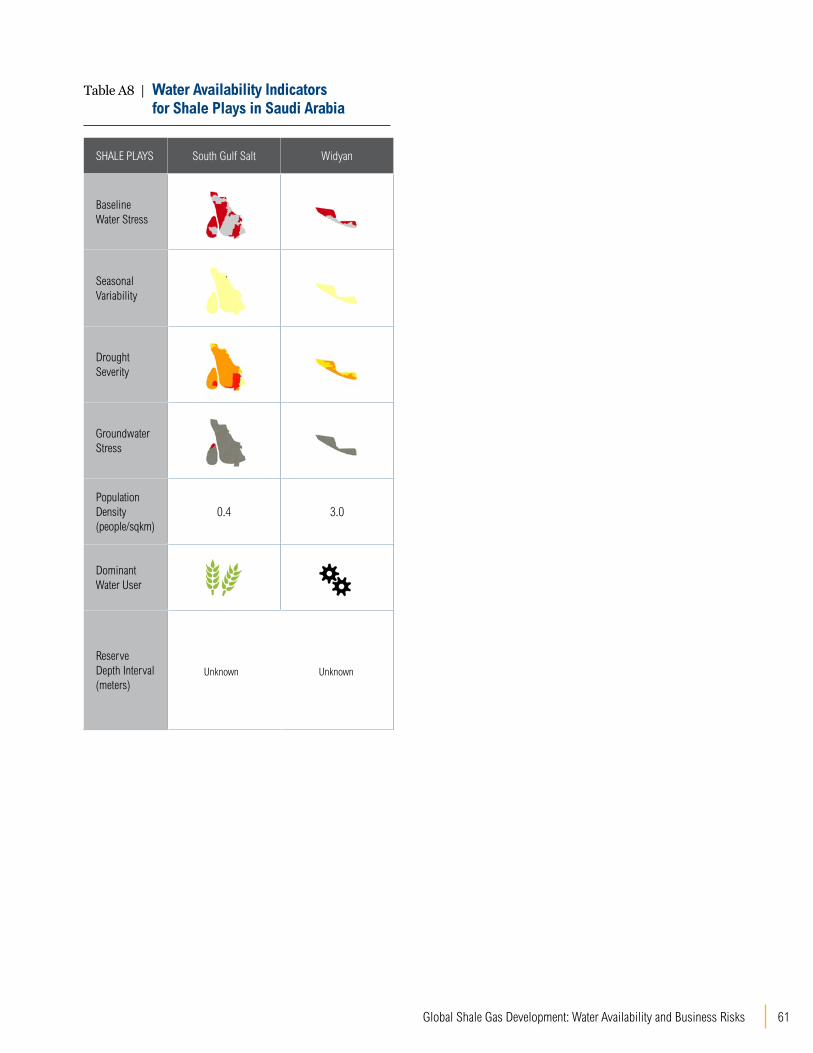
61Global Shale Gas Development: Water Availability and Business Risks
Table A8 | Water Availability Indicators for Shale Plays in Saudi Arabia
SHALE PLAYS South Gulf Salt Widyan
Baseline Water Stress
Seasonal Variability
Drought Severity
Groundwater Stress
Population Density (people/sqkm)
0.4 3.0
Dominant Water User
Reserve Depth Interval (meters)
Unknown Unknown
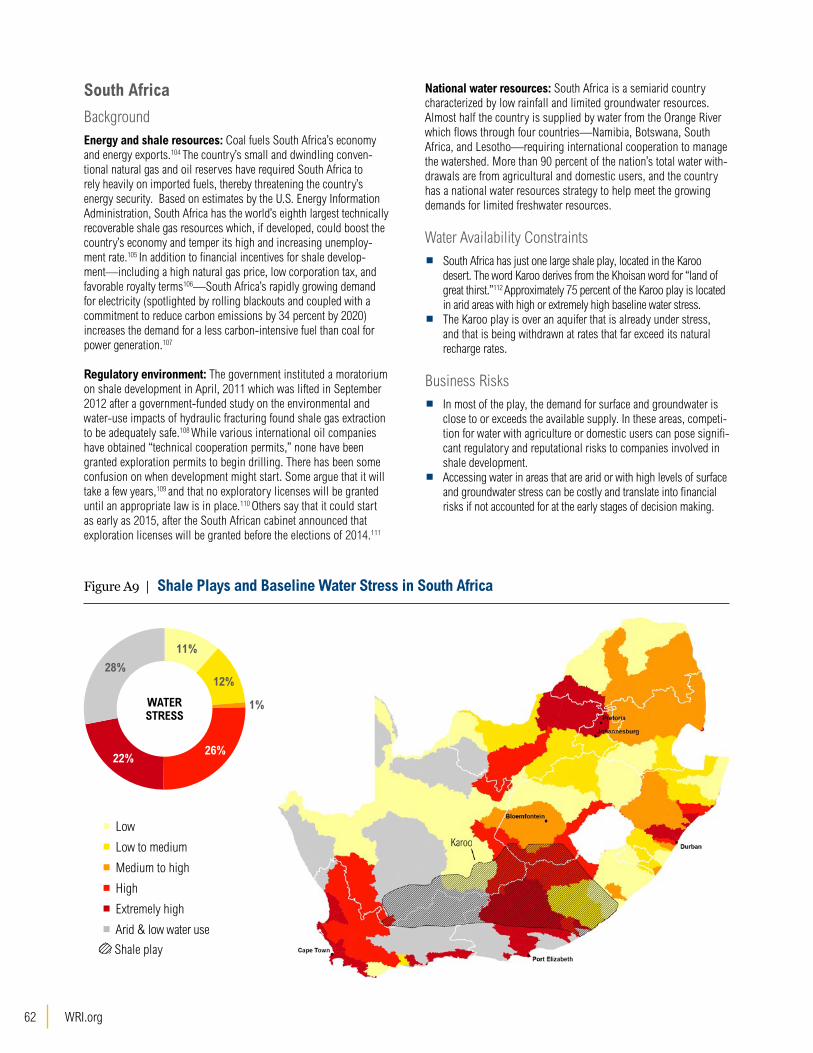
WRI.org 62
South Africa
BackgroundEnergy and shale resources: Coal fuels South Africa’s economy and energy exports.104 The country’s small and dwindling conven-tional natural gas and oil reserves have required South Africa to rely heavily on imported fuels, thereby threatening the country’s energy security. Based on estimates by the U.S. Energy Information Administration, South Africa has the world’s eighth largest technically recoverable shale gas resources which, if developed, could boost the country’s economy and temper its high and increasing unemploy-ment rate.105 In addition to financial incentives for shale develop-ment—including a high natural gas price, low corporation tax, and favorable royalty terms106—South Africa’s rapidly growing demand for electricity (spotlighted by rolling blackouts and coupled with a commitment to reduce carbon emissions by 34 percent by 2020) increases the demand for a less carbon-intensive fuel than coal for power generation.107
Regulatory environment: The government instituted a moratorium on shale development in April, 2011 which was lifted in September 2012 after a government-funded study on the environmental and water-use impacts of hydraulic fracturing found shale gas extraction to be adequately safe.108 While various international oil companies have obtained “technical cooperation permits,” none have been granted exploration permits to begin drilling. There has been some confusion on when development might start. Some argue that it will take a few years,109 and that no exploratory licenses will be granted until an appropriate law is in place.110 Others say that it could start as early as 2015, after the South African cabinet announced that exploration licenses will be granted before the elections of 2014.111
National water resources: South Africa is a semiarid country characterized by low rainfall and limited groundwater resources. Almost half the country is supplied by water from the Orange River which flows through four countries—Namibia, Botswana, South Africa, and Lesotho—requiring international cooperation to manage the watershed. More than 90 percent of the nation’s total water with-drawals are from agricultural and domestic users, and the country has a national water resources strategy to help meet the growing demands for limited freshwater resources.
Water Availability Constraints
▪ South Africa has just one large shale play, located in the Karoo desert. The word Karoo derives from the Khoisan word for “land of great thirst.”112 Approximately 75 percent of the Karoo play is located in arid areas with high or extremely high baseline water stress.
▪ The Karoo play is over an aquifer that is already under stress, and that is being withdrawn at rates that far exceed its natural recharge rates.
Business Risks
▪ In most of the play, the demand for surface and groundwater is close to or exceeds the available supply. In these areas, competi-tion for water with agriculture or domestic users can pose signifi-cant regulatory and reputational risks to companies involved in shale development.
▪ Accessing water in areas that are arid or with high levels of surface and groundwater stress can be costly and translate into financial risks if not accounted for at the early stages of decision making.
Figure A9 | Shale Plays and Baseline Water Stress in South Africa
Low
Low to medium
Medium to high
High
Extremely high
Arid & low water use
Shale play
WATER STRESS
28%
11%
12%
1%
22%26%

63Global Shale Gas Development: Water Availability and Business Risks
Table A9 | Water Availability Indicators for Shale Plays in South Africa
SHALE PLAYS Karoo
Baseline Water Stress
Seasonal Variability
Drought Severity
Groundwater Stress
Population Density (people/sqkm)
13.0
Dominant Water User
Reserve Depth Interval (meters)
1,585
3,200
0
1,000
2,000
3,000
4,000
5,000
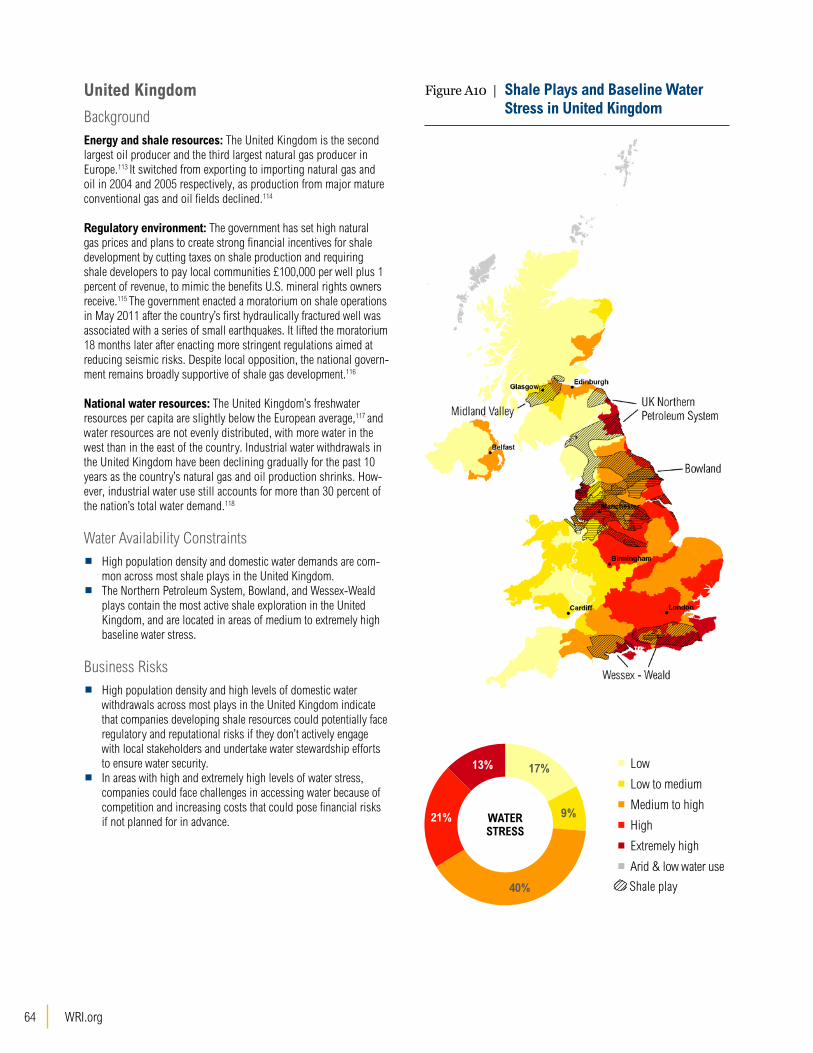
WRI.org 64
United Kingdom
BackgroundEnergy and shale resources: The United Kingdom is the second largest oil producer and the third largest natural gas producer in Europe.113 It switched from exporting to importing natural gas and oil in 2004 and 2005 respectively, as production from major mature conventional gas and oil fields declined.114
Regulatory environment: The government has set high natural gas prices and plans to create strong financial incentives for shale development by cutting taxes on shale production and requiring shale developers to pay local communities £100,000 per well plus 1 percent of revenue, to mimic the benefits U.S. mineral rights owners receive.115 The government enacted a moratorium on shale operations in May 2011 after the country’s first hydraulically fractured well was associated with a series of small earthquakes. It lifted the moratorium 18 months later after enacting more stringent regulations aimed at reducing seismic risks. Despite local opposition, the national govern-ment remains broadly supportive of shale gas development.116
National water resources: The United Kingdom’s freshwater resources per capita are slightly below the European average,117 and water resources are not evenly distributed, with more water in the west than in the east of the country. Industrial water withdrawals in the United Kingdom have been declining gradually for the past 10 years as the country’s natural gas and oil production shrinks. How-ever, industrial water use still accounts for more than 30 percent of the nation’s total water demand.118
Water Availability Constraints
▪ High population density and domestic water demands are com-mon across most shale plays in the United Kingdom.
▪ The Northern Petroleum System, Bowland, and Wessex-Weald plays contain the most active shale exploration in the United Kingdom, and are located in areas of medium to extremely high baseline water stress.
Business Risks
▪ High population density and high levels of domestic water withdrawals across most plays in the United Kingdom indicate that companies developing shale resources could potentially face regulatory and reputational risks if they don’t actively engage with local stakeholders and undertake water stewardship efforts to ensure water security.
▪ In areas with high and extremely high levels of water stress, companies could face challenges in accessing water because of competition and increasing costs that could pose financial risks if not planned for in advance.
Figure A10 | Shale Plays and Baseline Water Stress in United Kingdom
Low
Low to medium
Medium to high
High
Extremely high
Arid & low water use
Shale play
WATER STRESS
17%
9%
40%
21%
13%

65Global Shale Gas Development: Water Availability and Business Risks
Table A10 | Water Availability Indicators for Shale Plays in United Kingdom
SHALE PLAYS Bowland Midland Valley UK Northern Petroleum System Wessex - Weald
Baseline Water Stress
Seasonal Variability
Drought Severity
Groundwater Stress
Population Density (people/sqkm)
609.0 677.0 170.0 181.0
Dominant Water User
Reserve Depth Interval (meters)
1,219
3,505
1,524
3,962
1,524
3,962
Unkno wn
0
1,000
2,000
3,000
4,000
5,000

WRI.org 66
United States
BackgroundEnergy and shale resources: The United States is the world’s largest natural gas producer and the largest consumer of natural gas and oil. The United States possesses the world’s second largest tight oil and the fifth largest technically recoverable shale gas resources. Under conditions favorable to development, shale gas could contrib-ute significantly to the United States becoming an exporter of natural gas by 2019 and an exporter of liquid fuels by the mid-2030s.119
Regulatory environment: The U.S. federal government and many state governments broadly support continued development of shale resources,120 but eight local and three state moratoriums are in place, as well as one statewide ban.121 Environmental regulation is being introduced at federal122 and state levels (e.g. 14 states require disclosure of fracturing fluids; 5 require a permit, registration, and reporting for water withdrawals over 1,000 gallons a day; and 11 require a permit or approval and recordkeeping for wastewater transportation).123
National water resources: The United States possesses 7 percent of the world’s total freshwater resources124 and is the world’s third largest water user. However, with a spectrum of different geography and climates, the availability of water resources varies signifi-cantly across the country, from the water-abundant northeast and northwest to the water-scarce west and southwest. The industrial sector is the dominant water user in the United States using almost half of national water withdrawals.125 Oil and gas companies have spent approximately US$1 billion on pipelines to secure freshwater sources,126 and stressed water supplies have driven local govern-ments to ban the use of city water for hydraulic fracturing,127 causing operators to truck water from up to 75 miles away.128
Water Availability Constraints
▪ Over 35 percent of U.S. shale resources are located in areas that are either arid or under high or extremely high baseline water stress.
▪ For the most part, shale plays in the west (Texas, Colorado, and California) are located in areas of higher competition for water than those located in the more water-abundant east.
▪ For the western plays, agriculture is the dominant water user across 80 percent of the area. In the east, the dominant water user is industry.
▪ Most U.S. plays are in areas at least partially subject to high or extremely high baseline water stress and arid and low water use.
▪ Ten plays (for example the Monterey, Niobrara, Avalon-Bone Spring, and Eagle Ford) sit atop aquifers that are being withdrawn at rates that far exceed their natural recharge rate.
Business Risks
▪ The largest business risk to companies developing shale in the United States is the increasing demand and competition for freshwater, which could potentially lead to uncertainty in regulatory changes that could cause financial, regulatory, and reputational risks to companies.
▪ In plays with very high levels of competition for freshwater (such as the Monterey, Lombard, Mowry, Niobrara, Lewis, Avalon-Bone Spring, Barnett-Woodford, Antrim, or Pierre-Niobrara plays) accessing water might represent additional costs to operators and financial risks, particularly in areas where depleted groundwater resources are already facing high demand from irrigated agriculture (for example the Monterey or Avalon-Bone Spring plays).
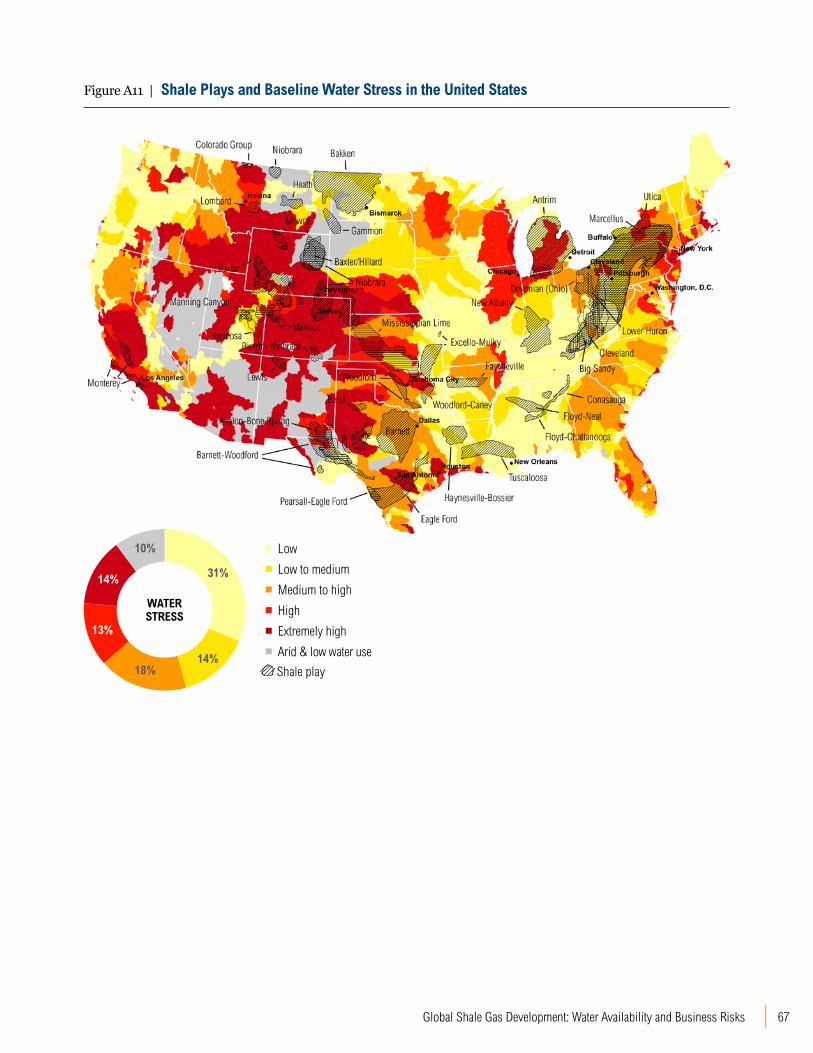
67Global Shale Gas Development: Water Availability and Business Risks
Figure A11 | Shale Plays and Baseline Water Stress in the United States
Low
Low to medium
Medium to high
High
Extremely high
Arid & low water use
Shale play
WATER STRESS
31%
14%18%
10%
14%
13%
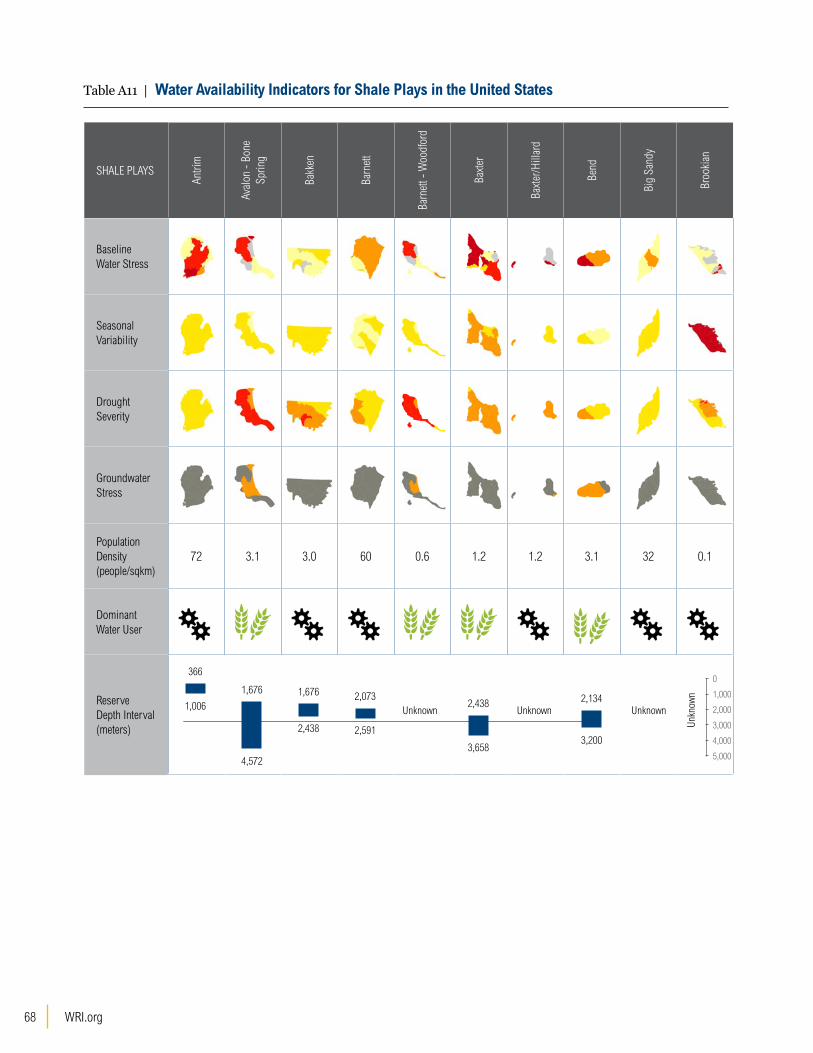
WRI.org 68
Table A11 | Water Availability Indicators for Shale Plays in the United States
SHALE PLAYS
Antri
m
Aval
on -
Bone
Sprin
g
Bakk
en
Barn
ett
Barn
ett -
Woo
dfor
d
Baxt
er
Baxt
er/H
illar
d
Bend
Big
Sand
y
Broo
kian
Baseline Water Stress
Seasonal Variability
Drought Severity
Groundwater Stress
Population Density (people/sqkm)
72 3.1 3.0 60 0.6 1.2 1.2 3.1 32 0.1
Dominant Water User
Reserve Depth Interval (meters)
2,134
3,200
2,438
3,658
1,676
2,438
366
1,006
1,676
4,572
2,073
2,591
0
1,000
2,000
3,000
4,000
5,000
UnknownUnknownUnknown
Unkn
own

69Global Shale Gas Development: Water Availability and Business Risks
Table A11 | Water Availability Indicators for Shale Plays in the United States (cont.)
SHALE PLAYS
Chat
tano
oga
Clev
elan
d
Clin
e
Cona
saug
a
Devo
nian
(Ohi
o)
Eagl
e Fo
rd
Exce
llo -
Mul
ky
Faye
ttevi
lle
Floy
d - C
hatta
noog
a
Floy
d - N
eal
Baseline Water Stress
Seasonal Variability
Drought Severity
Groundwater Stress
Population Density (people/sqkm)
24 15 5.5 119 61 11 44 23 8.5 28
Dominant Water User
Reserve Depth Interval (meters)
1,200
2,316
1,006
3,658
400
640
0
1,000
2,000
3,000
4,000
5,000
UnknownUnknownUnknownUnknownUnknownUnknownUn
know
n

WRI.org 70
Table A11 | Water Availability Indicators for Shale Plays in the United States (cont.)
SHALE PLAYS
Gam
mon
Hayn
esvi
lle- B
ossi
er
Heat
h
Herm
osa
King
ak
Lewi
s
Lom
bard
Low
er H
uron
Man
cos
Man
ning
Can
yon
Baseline Water Stress
Seasonal Variability
Drought Severity
Groundwater Stress
Population Density (people/sqkm)
0.4 40 0.2 1.1 0.1 8.1 2.4 0.7 2.4 0.7
Dominant Water User
Reserve Depth Interval (meters)
914
1,8293,505
4,267
0
1,000
2,000
3,000
4,000
5,000
UnknownUnknown UnknownUnknownUnknownUnknownUnknown
Unkn
own

71Global Shale Gas Development: Water Availability and Business Risks
Table A11 | Water Availability Indicators for Shale Plays in the United States (cont.)
SHALE PLAYS
Mar
cellu
s
Mis
siss
ippi
anLi
me
Mon
tere
y
Mow
ry
New
Alba
ny
Niob
rara
Pear
sall
- Eag
le F
ord
Pier
re -
Niob
rara
Shub
lik
Tusc
aloo
sa
Baseline Water Stress
Seasonal Variability
Drought Severity
Groundwater Stress
Population Density (people/sqkm)
34 5.8 703 1.8 27 29 2.6 3.5 0.1 23
Dominant Water User
Reserve Depth Interval (meters)
914
1,829
3,048
4,572
152
152
610
2,743
0
1,000
2,000
3,000
4,000
5,000
UnknownUnknown UnknownUnknownUnknownUnknown

WRI.org 72
Table A11 | Water Availability Indicators for Shale Plays in the United States (cont.)
SHALE PLAYS Utica WolfberryWolfcamp(Wolfbone)
Woodford Woodford - Caney
Baseline Water Stress
Seasonal Variability
Drought Severity
Groundwater Stress
Population Density (people/sqkm)
14 32 0.9 18 11
Dominant Water User
Reserve Depth Interval (meters)
1,219
3,353
3,353
3,810
1,524
6,096
Unknown
0
1,000
2,000
3,000
4,000
5,000
Unknown
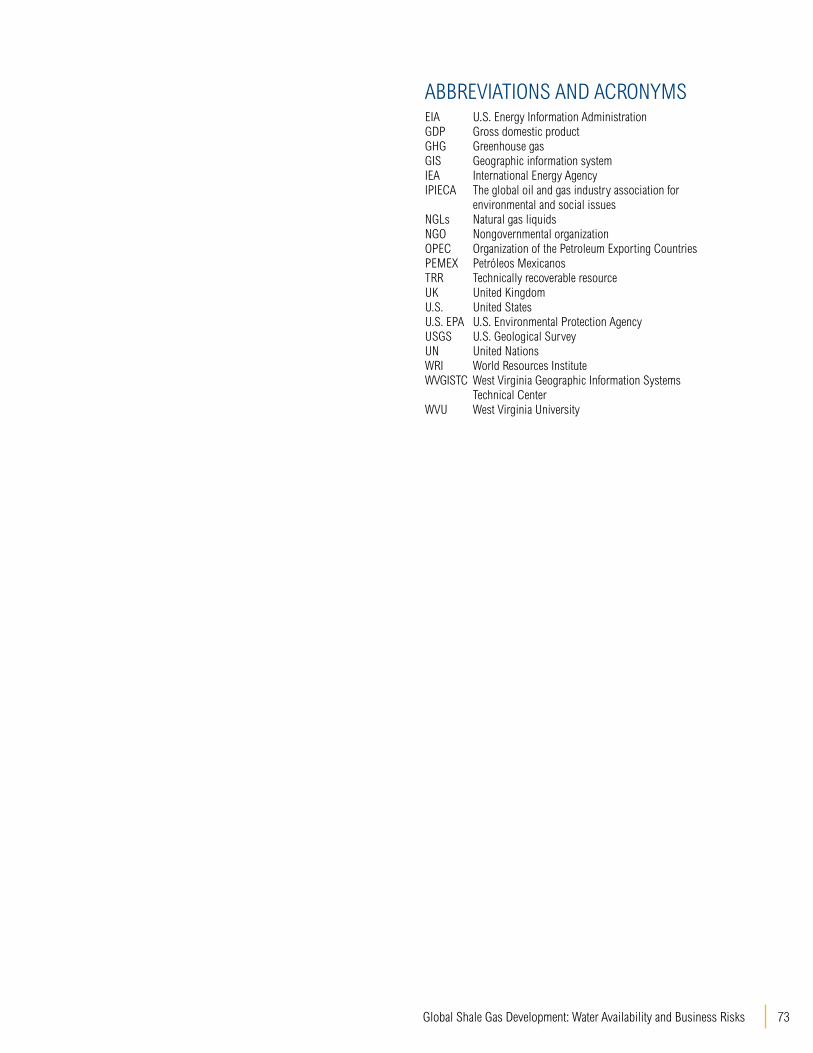
73Global Shale Gas Development: Water Availability and Business Risks
ABBREVIATIONS AND ACRONYMSEIA U.S. Energy Information AdministrationGDP Gross domestic product GHG Greenhouse gasGIS Geographic information systemIEA International Energy Agency IPIECA The global oil and gas industry association for
environmental and social issuesNGLs Natural gas liquidsNGO Nongovernmental organizationOPEC Organization of the Petroleum Exporting CountriesPEMEX Petróleos MexicanosTRR Technically recoverable resourceUK United Kingdom U.S. United StatesU.S. EPA U.S. Environmental Protection Agency USGS U.S. Geological Survey UN United NationsWRI World Resources Institute WVGISTC West Virginia Geographic Information Systems
Technical Center WVU West Virginia University

WRI.org 74
DEFINITIONSBrackish water: water that is generally saltier than freshwater, but not as salty as seawater.129
Conventional oil and gas resources: reservoirs of natural gas or oil that typically permit the oil and natural gas to flow readily into wellbores.
Flowback: water that returns to the surface directly after hydraulic fracturing. Flowback contains a mix of fracturing fluid and water originally found in the formation.
Hydraulic fracturing: treatment by which a fluid is pumped at high pressure down a wellbore to initiate and propagate cracks in low-permeability geological formations.
Natural gas liquids (NGLs): natural gas liquids are naturally occurring hydrocarbons found in natural gas or associated with crude oil that are considered a byproduct in the oil and gas industry but are increasingly being targeted for extraction.
Produced water: water that returns to the surface along with the oil or gas pumped from the well; produced water returns to the surface after the flowback and is mostly water originally found in the formation.
Recycled Water: water used a second time after undergoing treatment.
Reused Water: water used a second time with minimal treatment.
Shale basin: large shale formations defined by similar geologic characteristics.
Shale gas: natural gas deposits found in shale reservoirs, with even lower permeability than tight gas reservoirs.
Shale play: area of a shale basin where gas and oil could be commercially extracted. Oil and gas deposits within a play usually share similar geologic and geographic properties such as source rock, migration pathways, trapping mechanisms, and hydrocarbon type.130
Shale resource: hydrocarbon resources found in shale plays, such as natural gas, natural gas liquids, and tight oil.
Technically recoverable resource (TRR): resources that can be produced using current technology without reference to the economic viability.131
Tight gas: natural gas trapped in reservoir rock with a permeability that is a factor of 10 to thousands of times less permeable than conventional natural gas reservoirs.
Tight oil: oil trapped in fine-grained sedimentary rocks with extremely low permeability, such as shale, sandstone, or carbonate.
Unconventional oil or gas resources: reservoirs of natural gas or oil, in geological formations with often extremely low permeability, which are unable to flow readily to the wellbores. Examples include: heavy oil, oil sands or tar sands, tight oil, oil shales, tight gas, shale gas, and coalbed methane.
Water consumption: volume of surface or groundwater withdrawn that is not returned to the original water source and therefore is no longer available for reuse.
Water withdrawal: volume of water that is taken from a surface or groundwater source
Water stress: the ratio of total water withdrawals relative to the available renewable surface water

75Global Shale Gas Development: Water Availability and Business Risks
ENDNOTES1. In this report, shale resources (or more technically, shale hy-
drocarbons) include shale gas, natural gas liquids, and tight oil.
2. Technically recoverable resources based on estimates by the U.S. Energy Information Administration.
3. Technically recoverable resources based on estimates by the U.S. Energy Information Administration.
4. World Wildlife Fund, Water Stewardship: Perspectives on Business Risks and Responses to Water Challenges (Gland, Switzerland, 2013), http://awsassets.panda.org/downloads/ws_briefing_booklet_lr_spreads.pdf.
5. James Herron, “Shale Gas Could Fracture Energy Market,” May 2012, blog, http://blogs.wsj.com/source/2012/05/29/shale-gas-could-fracture-energy-market/.
6. Laurence Iliff and Juan Montes, “Mexico Moves to Overhaul Oil Industry,” August 2013, Wall Street Journal oline, http://online.wsj.com/article/SB10001424127887324085304579008762332445236.html.
7. Vello Kuuskraa, Scott Stevens, and Keith Moodhe, Techni-cally Recoverable Shale Oil and Shale Gas Resources : An Assessment of 137 Shale Formations in 41 Countries Outside the United States (Washington, DC: U.S. Energy Information Administration, June 10, 2013), http://www.eia.gov/analysis/studies/worldshalegas/.
8. Ibid.
9. Ian J. Laurenzi and Gilbert R. Jersey, “Life Cycle Greenhouse Gas Emissions and Freshwater Consumption of Marcellus Shale Gas.,” Environmental Science & Technology 47, no. 9 (May 2013): 4896–4903, doi:10.1021/es305162w.
10. Bradbury, J, M Obeiter, L Draucker, W Wang, and Amanda Ste-vens. “Clearing the Air: Reducing Upstream Greenhouse Gas Emissions From U.S. Natural Gas Systems.” Working Paper. Washington, DC, 2013. http://www.wri.org/sites/default/files/clearing_the_air_full_version.pdf; James Bradbury and Jen-nifer Morgan, “What Exporting U.S. Natural Gas Means for The Climate,” World Resources Institute, blog, May 2013, http://insights.wri.org/news/2013/05/what-exporting-us-natural-gas-means-climate.
11. Liroff, Richard, D Fugere, L Reusner, S Heim, and L Samuel-rich. Disclosing the Facts: Transparency and Risk in Hydrau-lic Fracturing Operations, 2013. http://disclosingthefacts.org/#download-form; Richard Liroff, Extracting the Facts: An Investor Guide to Disclosing Risks From Hydraulic Fracturing Operations, December 2011, http://iehn.org/documents/frack-guidance.pdf; Heather Cooley and Kristina Donnelly, Hydraulic Fracturing and Water Resources : Separating the Frack from the Fiction (Oakland, California: Pacific Institute, 2012), http://pacinst.org/wp-content/uploads/sites/21/2014/04/fracking-water-sources.pdf; Food & Water Watch, Fracking: The New Global Water Crisis (Washington DC, 2012), http://documents.foodandwaterwatch.org/doc/FrackingCrisisUS.pdf.
12. Alan J. Krupnick, Managing the Risks of Shale Gas: Key Find-ings and Further Research (Washington DC, Resources for the Future, 2013), http://www.rff.org/rff/documents/RFF-Rpt-ManagingRisksofShaleGas-KeyFindings.pdf.
13. Monika Freyman and Ryan Salmon, Hydraulic Fracturing & Water Stress: Growing Competitive Pressures for Water, 2013; Monika Freyman, Hydraulic Fracturing & Water Stress: Water Demand by the Numbers (Boston MA: Ceres, February 2014), http://www.ceres.org/resources/reports/hydraulic-fracturing-water-stress-water-demand-by-the-numbers/view; Cooley and Donnelly, Hydraulic Fracturing and Water Resources : Separat-ing the Frack from the Fiction.
14. Stark, M, R Allingham, J Calder, T Lennartz-Walker, K Wai, Peter Thompson, and S Zhao. Water and Shale Gas Development: Leveraging the US Experience in New Shale Developments. Accenture, 2012. http://www.accenture.com/SiteCollectionDocuments/PDF/Accenture-Water-And-Shale-Gas-Development.pdf.
15. George E. King, “Hydraulic Fracturing 101: What Every Representative, Environmentalist, Regulator, Reporter, Investor, University Researcher, Neighbor and Engineer Should Know about Estimating Frac Risk and Improving Frac Performance in Unconventional Gas and Oil Wells,” 2012, 1–80.
16. E.D. Williams and J.E. Simmons, Water in the Energy Industry. An Introduction (United Kingdom: BP International Ltd, 2013), http://www.bp.com/content/dam/bp/pdf/sustainability/group-reports/BP-ESC-water-handbook-131018.pdf.
17. Williams, E.D., and J.E. Simmons. Water in the Energy Indus-try. An Introduction. UK: BP International Ltd, 2013. http://www.bp.com/content/dam/bp/pdf/sustainability/group-reports/BP-ESC-water-handbook-131018.pdf.
18. George E. King, “Hydraulic Fracturing 101: What Every Representative, Environmentalist, Regulator, Reporter, Investor, University Researcher, Neighbor and Engineer Should Know about Estimating Frac Risk and Improving Frac Performance in Unconventional Gas and Oil Wells,” 2012, 1–80.
19. R. Hammer and J. VanBriesen, In Fracking’s Wake: New Rules Are Needed to Protect Our Health and Environment from Contaminated Wastewater (Washington DC: Natural Resources Defense Council, May 2012), http://www.nrdc.org/energy/files/fracking-wastewater-fullreport.pdf; Pam Boschee, “Produced and Flowback Water Recycling and Reuse: Economics, Limita-tions, and Technology,” Halliburton, February 2014, http://www.halliburton.com/public/multichem/contents/Papers_and_Articles/web/Feb-2014-Oil-Gas-Facilities-Article.pdf; Michigan Department of Environmental Quality and Office of Oil, Gas, and Minerals, “Hydraulic Fracturing of Oil and Gas Wells in Michigan” (Lansing, MI, n.d.), http://www.michigan.gov/docu-ments/deq/Hydraulic_Fracturing_In_Michigan_423431_7.pdf.

WRI.org 76
20. International Energy Agency, Golden Rules for a Golden Age of Gas. World Energy Outlook Special Report on Unconventional Gas (Paris, France: International Energy Agency, 2012), http://www.worldenergyoutlook.org/media/weowebsite/2012/golden-rules/weo2012_goldenrulesreport.pdf.
21. Krupnick, Managing the Risks of Shale Gas: Key Findings and Further Research.
22. Evan Branosky, Amanda Stevens, and Sarah Forbes, “Defin-ing the Shale Gas Life Cycle: A Framework for Identifying and Mitigating Environmental Impacts,” Working Paper, (World Resources Institute, Washington DC, 2012), http://www.wri.org/ publication/shale-gas-life-cycle-framework-for-impacts.
23. Chesapeake Energy, “Water Use in Deep Shale Gas Explora-tion,” Fact Sheet, (2012), https://www.springsgov.com/units/boardscomm/OilGas/Water%20Use%20in%20Deep%20Shale%20Exploration%20Fact%20Sheet.pdf. Ian J Laurenzi and Gilbert R Jersey, “Life Cycle Greenhouse Gas Emissions and Freshwater Consumption of Marcellus Shale Gas.,” Environmental Science & Technology 47, no. 9 (May 2013): 4896–4903, doi:10.1021/es305162w.
24. Kenny, J.F., N.L. Barber, S.S. Hutson, K.S. Linsey, J.K. Lovelace, and M.A. Maupin. “Estimated Use of Water in the United States in 2005.” U.S. Geological Survey Circular 1344, 2009. http://pubs.usgs.gov/fs/2009/3098/pdf/2009-3098.pdf.
25. Nicot, Jean-Philippe, Robert Reedy, Ruth Costley, and Yun Huang. Oil & Gas Water Use in Texas : Update to the 2011 Mining Water Use Report. Austin, Texas: Bureau of Economic Geology, University of Texas at Austin, September 2012. http://www.twdb.state.tx.us/publications/reports/contracted_reports/doc/0904830939_2012Update_MiningWaterUse.pdf
26. Ibid.
27. King, “Hydraulic Fracturing 101.”; U.S. Environmental Protec-tion Agency, “Hydraulic Fracturing Research Study” (Washing-ton, DC, June 2010), http://www.epa.gov/safewater/uic/pdfs/hfresearchstudyfs.pdf.
28. Michigan Department of Environmental Quality and Office of Oil, Gas, and Minerals, “Hydraulic Fracturing of Oil and Gas Wells in Michigan”; Boschee, “Produced and Flowback Water Recycling and Reuse. Economics, Limitations, and Technol-ogy”; Hammer and VanBriesen, In Fracking’s Wake: New Rules Are Needed to Protect Our Health and Environment from Contaminated Wastewater.
29. Chesapeake Energy, “Water Use in Deep Shale Gas Explora-tion.”
30. Melissa Stark et al., Water and Shale Gas Development.
31. J. A. Veil and C. E. Clark, “Produced Water Volume Estimates and Management Practices” 26, no. 03 (2011), doi:http://dx.doi.org/10.2118/125999-PA; Nicot et al., “Oil & Gas Water Use in Texas : Update to the 2011 Mining Water Use Report.”
32. Williams and Simmons, Water in the Energy Industry. An Introduction.
33. Nicot et al., Oil & Gas Water Use in Texas : Update to the 2011 Mining Water Use Report.
34. Shell Canada, “Shell and Dawson Creek to Conserve Water in British Columbia,” Shell, News Rrelease, September 7, 2012, http://www.shell.ca/en/aboutshell/media-centre/news-and-media-releases/2012/0907dawson-creek.html.
35. Stark et al., Water and Shale Gas Development; Laurenzi and Jersey, “Life Cycle Greenhouse Gas Emissions and Freshwater Consumption of Marcellus Shale Gas.”
36. IPIECA, Identifying and Assessing Water Sources (London: IPIECA, 2014), http://www.ipieca.org/publication/identifying-and-assessing-water-sources.
37. Williams and Simmons, Water in the Energy Industry. An Intro-duction; Stark et al., Water and Shale Gas Development.
38. West Virginia University and National Energy Technology Laboratory, “Atlas of Unconventional Hydrocarbon Resources,” 2014, https://edx.netl.doe.gov/dataset/unconventional-resources-atlas.
39. World Resources Institute, “Aqueduct Water Risk Atlas,” Aque-duct, November 28, 2012, wri.org/aqueduct.
40. Stark et al., Water and Shale Gas Development.
41. World Resources Institute, “Aqueduct Water Risk Atlas.”
42. World Wildlife Fund, “The Water Risk Filter,” 2014, http://wa-terriskfilter.panda.org/.
43. Global Environmental Management Initiative (GEMI) , “Local Water Tool,” February 2013, http://www.gemi.org/localwater-tool/.
44. CDP, “Water Program,” 2014, https://www.cdp.net/water.
45. United Nations Global Compact, Pacific Institute, Corporate Water Disclosure Guidelines, Toward a Common Approach to Reporting Water Issues (Oakland, CA: Pacific Institute, August 2012), http://ceowatermandate.org/files/DisclosureGuidelines-Full.pdf.
46. Brooke Barton and Berkley Adrio, The Ceres Aqua Gauge: A Framework for 21st Century Water Risk Management (Boston MA: Ceres, October 2011), http://www.ceres.org/resources/reports/aqua-gauge/view.
47. United Nations Global Compact, Pacific Institute, Guide to Responsible Business Engagement with Water Policy (Oakland, CA: Pacific Institute, November 2010), http://www.unglobalcompact.org/docs/issues_doc/Environment/ceo_wa-ter_mandate/Guide_Responsible_Business_Engagement_Wa-ter_Policy.pdf.
48. United Nations Global Compact, Pacific Institute, Framework for Responsible Business Engagement with Water Policy (Oak-land, CA: Pacific Institute, June 2010), http://ceowatermandate.org/files/responsible_business_engagement.pdf.

77Global Shale Gas Development: Water Availability and Business Risks
49. Schulte, Peter, Jason Morrison, Stuart Orr, and Gavin Power. “Shared Water Challenges and Interests: The Case for Private Sector Engagement in Water Policy and Management.” Discus-sion Paper, June 2014. http://ceowatermandate.org/files/private-sector-water-policy-engagement.pdf..
50. Guy Pegram, Stuart Orr, and Christopher Williams, Investigat-ing Shared Risk in Water: Corporate Engagement with the Public Policy Process (World Wildlife Fund and HSBC, March 2009), http://awsassets.panda.org/downloads/investigat-ing_shared_risk_final_low_res.pdf.
51. Cook, Margaret A, Ashlynn S Stillwell, Carey W King, and Michael E Webber. “Alternative Water Sources for Hydraulic Fracturing in Texas,” 2013, 2818–32
52. United Nations Global Compact, Guide to Water-Related Collective Action, September 2013, http://ceowatermandate.org/wp-content/uploads/2013/09/guide-to-water-related-ca-web-091213.pdf.
53. IPIECA, Identifying and Assessing Water Sources.
54. Apache Corporation, “Environmentally Concerned Investor Interface,” Initiatives, (2014), http://www.apachecorp.com/Operations/Innovation/Initiatives/Environmentally_concerned_investor_interface/index.aspx.
55. IPIECA, Identifying and Assessing Water Sources.
56. World Wildlife Fund, Water Stewardship: Perspectives on Business Risks and Responses to Water Challenges. Gland, Switzerland, 2013. http://awsassets.panda.org/downloads/ws_briefing_booklet_lr_spreads.pdf.
57. Ibid.
58. U.S. Energy Information Administration, “Algeria Analysis Brief,” 2013, http://www.eia.gov/countries/analysisbriefs/Alge-ria/algeria.pdf.
59. Ibid.
60. Kuuskraa, Stevens, and Moodhe, Technically Recoverable Shale Oil and Shale Gas Resources : An Assessment of 137 Shale Formations in 41 Countries Outside the United States.
61. U.S. Energy Information Administration, “Algeria Analysis Brief.”
62. Casper Star-Tribune Online, “Algeria Authorizes Shale Gas Exploitation,” Casper Star-Tribune Online, May 26, 2014, Business, http://trib.com/business/algeria-authorizes-shale-gas-exploitation/article_582e802d-7776-5096-a470-c6bb6f76000e.html.
63. International Energy Agency, “Statistics,” 2013, http://www.iea.org/statistics/statisticssearch/.
64. U.S. Energy Information Administration, “Argentina Analysis Brief,” 2012, http://www.eia.gov/countries/cab.cfm?fips=ar.
65. Kuuskraa, Stevens, and Moodhe, Technically Recoverable Shale Oil and Shale Gas Resources : An Assessment of 137 Shale Formations in 41 Countries Outside the United States.
66. Alejandro Lifschitz and Karina Grazina, “Chevron, Argentina’s YPF Sign $1.24 Billion Vaca Muerta Shale Deal,” Reuters. July 2013, http://www.reuters.com/article/2013/07/17/us-argenti-na-chevron-idUSBRE96F18X20130717.
67. Control Risks, The Global Anti-Fracking Movement: What It Wants, How It Operates, and What’s Next ,Whitepaper, (London, Control Risks, 2012), http://www.controlrisks.com/~/media/Public%20Site/Files/Oversized%20Assets/shale_gas_whitepaper.pdf.
68. Food and Agriculture Organization of the United Nations (FAO), “AQUASTAT Main Country Database,” 2014, http://www.fao.org/nr/water/aquastat/dbase/index.stm.
69. Stark et al., Water and Shale Gas Development.
70. Kuuskraa, Stevens, and Moodhe, Technically Recoverable Shale Oil and Shale Gas Resources : An Assessment of 137 Shale Formations in 41 Countries Outside the United States.
71. Ibid.
72. Ibid.
73. Australian Government: Department of Resources Energy and Tourism, “The Facts on Electricity Prices,” Factsheet, 2013, http://www.ret.gov.au/Department/Documents/clean-energy-future/ELECTRICITY-PRICES-FACTSHEET.pdf.
74. John Williams and Jamie Pittock, Unconventional Gas Produc-tion and Water Resources (Crawford School of Public Policy, Australian National University, July 2012), https://crawford.anu.edu.au/pdf/inthenews/12186-unconventional-gas-docu-ment-web-fa.PDF.
75. Control Risks, The Global Anti-Fracking Movement: What It Wants, How It Operates, and What’s Next.
76. Williams and Pittock, Unconventional Gas Production and Water Resources.
77. Australian Government Department of the Environment, “State of the Environment Report 2011,” 2011, http://www.environ-ment.gov.au/resource/state-environment-report-2011-soe-2011-contents.
78. The Murray–Darling Basin Authority, “About MDBA,” The Murray–Darling Basin Authority, 2014, http://www.mdba.gov.au/about-mdba.
79. Kuuskraa, Stevens, and Moodhe, Technically Recoverable Shale Oil and Shale Gas Resources : An Assessment of 137 Shale Formations in 41 Countries Outside the United States.
80. Ibid.
WRI.org 78
81. Atlantic Salmon Federation, “NL Gov’t Announces Moratorium on Fracking,” November 4, 2013, http://www.asf.ca/nl-gov-t-announces-moratorium-on-fracking.html.
82. Miriam Desmarais and Jean Piette, “Quebec Moves to Impose Regional Moratorium on Shale Gas Exploration and Produc-tion and Prepares to Publish a Draft Regulation to Protect Drinking Water Sources,” Legal Update, (May 2013), http://www.nortonrosefulbright.com/files/quebec-moves-to-impose-regional-moratorium-on-shale-gas-exploration-and-produc-tion-and-prepares-to-publish-a-draft-regulation-to-protect-drinking-water-sources-pdf-280kb-98892.pdf; Caroline Plante, “Quebec Wants to Block Shale Gas Development,” Global News, May 2013, http://globalnews.ca/news/565893/quebec-wants-to-block-shale-gas-development/.
83. World Bank, “Data,” 2014, http://data.worldbank.org/.
84. Statistics Canada, “The Demand for Water in Canada,” 2014, http://www.statcan.gc.ca/pub/16-201-x/2010000/part-partie3-eng.htm.
85. U.S. Energy Information Administration, “China Analysis Brief,” 2012, http://www.eia.gov/countries/cab.cfm?fips=ch.
86. International Energy Agency, World Energy Outlook 2012 (International Energy Agency, 2012), http://www.worldenergy-outlook.org/publications/weo-2012/.
87. Brian Spegele and Justin Scheck, “Energy-Hungry China Struggles to Join Shale-Gas Revolution,” Wall Street Journal online, September 2013, http://online.wsj.com/article/SB10001424127887323980604579030883246871124.html?mod=WSJ_hps_LEFTTopStories&cb=logged0.8687858839984983.
88. Stark et al., Water and Shale Gas Development.
89. Control Risks, The Global Anti-Fracking Movement: What It Wants, How It Operates, and What’s Next.
90. FAO, “AQUASTAT Main Country Database.”
91. North-to-South-Water Division, “China South-to-North Water Diversion Committee,” 2014, http://www.nsbd.gov.cn/.
92. Iliff and Montes, “Mexico Moves to Overhaul Oil Industry.”
93. FAO, “AQUASTAT Main Country Database.”
94. Kuuskraa, Stevens, and Moodhe, Technically Recoverable Shale Oil and Shale Gas Resources : An Assessment of 137 Shale Formations in 41 Countries Outside the United States.
95. Ibid.
96. Ibid.
97. International Energy Agency, Energy Policies of IEA Countries: Poland (International Energy Agency, 2011), https://www.iea.org/publications/freepublications/publication/name-34634-en.html.
98. P. Wasilewski, “Poland to Accelerate Work on Setting Regula-tions for Shale Gas Industry,” Wall Street Journal, February 5, 2014, http://online.wsj.com/news/articles/SB10001424052702303496804579364623996462420.
99. European Environment Agency, “Poland,” The European Environment – State and Outlook 2010, November 2010, http://www.eea.europa.eu/soer/countries/pl/soertopic_view?topic=freshwater.
100. Kuuskraa, Stevens, and Moodhe, Technically Recoverable Shale Oil and Shale Gas Resources : An Assessment of 137 Shale Formations in 41 Countries Outside the United States.
101. Ibid.
102. Daniel Fineren and Reem Shamseddine, “Analysis: Saudi Kings of Oil Join the Shale Gas Revolution,” Reuters, April 3, 2013, http://www.reuters.com/article/2013/04/03/us-saudi-gas-idUSBRE9320LF20130403.
103. Andres Cala, “Saudi Arabia’s Shale Gas Challenge,” Asharq Al Awsat, March 30, 2013, http://www.aawsat.net/2013/03/article55297262.
104. U.S. Energy Information Administration, “South Africa Analysis Brief,” 2013, http://www.eia.gov/countries/cab.cfm?fips=SF.
105. Statistics South Africa, “Quarterly Labor Force Survey: Quarter 1,” 2013, http://www.statssa.gov.za/keyindicators/qlfs.asp.
106. Kuuskraa, Stevens, and Moodhe, Technically Recoverable Shale Oil and Shale Gas Resources : An Assessment of 137 Shale Formations in 41 Countries Outside the United States.
107. Kings Sipho, “SA Companies Come Out Tops in Carbon Disclosure Project,” Mail & Guardian, November 22, 2012, http://mg.co.za/article/2012-11-22-carbon-disclosure-project-south-african-companies-doing-well.
108. U.S. Energy Information Administration, “South Africa Analysis Brief.”
109. Samantha Moolman, “Fracking Proponents, Opponents Agree on Need for Exploration to Determine Size of Karoo Shale Resource,” Creamer Media Mining Weekly, April 26, 2013, http://www.miningweekly.com/article/fracking-proponents-opponents-agree-move-forward-with-exploration-2013-04-26.
110. Anine Vermeulen, “Govt Statements Leave Key Shale Gas Players Confused,” Creamer Media Mining Weekly, March 21, 2014, http://www.miningweekly.com/article/govt-statements-leave-key-shale-gas-players-confused-2014-03-21-1.
111. Sapa, “Shale Gas Exploration Could Move Ahead before 2014 Elections,” Creamer Media Mining Weekly, August 22, 2013, http://www.miningweekly.com/article/shale-gas-exploration-could-move-ahead-before-2014-elections-2013-08-22.
112. J.D., “Fracking the Karoo,” Schumpeter, October 18, 2012, http://www.economist.com/

79Global Shale Gas Development: Water Availability and Business Risks
113. U.S. Energy Information Administration, “United Kingdom Analysis Brief,” 2013, http://www.eia.gov/countries/cab.cfm?fips=uk.
114. Ibid.
115. David Cameron, “We Cannot Afford to Miss Out on Shale Gas,” The Telegraph, August 2013, http://www.telegraph.co.uk/news/politics/10236664/We-cannot-afford-to-miss-out-on-shale-gas.html; Jim Pickard, “Osborne Looks to Create World’s Most Generous Shale Tax Regime,” Financial Times, July 19, 2013, http://www.ft.com/intl/cms/s/0/d1392d20-efc9-11e2-8229-00144feabdc0.html?siteedition=intl.
116. Kuuskraa, Stevens, and Moodhe, Technically Recoverable Shale Oil and Shale Gas Resources : An Assessment of 137 Shale Formations in 41 Countries Outside the United States.
117. FAO, “AQUASTAT Main Country Database.”
118. Ibid.
119. U.S. Energy Information Administration, Annual Energy Outlook 2013 (U.S. Energy Information Administration, 2013), www.eia.gov/forecasts/aeo.
120. Control Risks, The Global Anti-Fracking Movement: What It Wants, How It Operates, and What’s Next.
121. N Richardson et al., The State of State Shale Gas Regulation (Washington, DC: Resources for the Future, June 2013), http://www.rff.org/rff/documents/RFF-Rpt-StateofStateRegs_Report.pdf.
122. U.S. Environmental Protection Agency, “Hydraulic Fracturing Under the Safe Drinking Water Act,” Water: Hydraulic Fractur-ing, February 12, 2014, http://water.epa.gov/type/groundwater/uic/class2/hydraulicfracturing/hydraulic-fracturing.cfm.
123. Richardson et al., The State of State Shale Gas Regulation.
124. World Bank, “Data.”
125. FAO, “AQUASTAT Main Country Database.”
126. Russell Gold, “Energy Firm Makes Costly Fracking Bet -- on Water,” Wall Street Journal, August 2013, Online edition, Busi-ness, http://online.wsj.com/article/SB10001424127887323420604578652594214383364.html.
127. Mike Lee, “Parched Texans Impose Water-Use Limits for Frack-ing Gas Wells,” Bloomberg Businessweek, September 2011
128. Paula Dittrick, “Drought Raising Water Costs, Scarcity Converns for Shale Plays,” Oil & Gas Journal, July 30, 2012, http://www.ogj.com/articles/print/vol-110/issue-7d/general-interest/drought-raising-water-costs.html.
129. U.S. Geological Survey, “Definition of ‘Brackish,” National Brackish Groundwater Assessment, April 2, 2014, http://ne.water.usgs.gov/ogw/brackishgw/brackish.html.
130. L. Biewick, G. Gunther, and C. Skinner, “USGS National Oil and Gas Assessment Online (NOGA Online) Using ArcIMS” (Denver, Colorado: U.S. Geological Survey, n.d.), http://pro-ceedings.esri.com/library/userconf/proc02/pap0826/p0826.htm#contact.
131. U.S. Energy Information Administration, “Annual Energy Review 2011,” September 27, 2012, http://www.eia.gov/totale-nergy/data/annual/showtext.cfm?t=ptb0401.

WRI.org 80
PHOTO CREDITS Cover photo, LonnyG; table of contents, 10, grandriver; pg. iv, 2 (left), 2 (center), 9, 12, 36, 42 (center), HHakim; pg. vi, Daniel Foster; pg. 3 (right), Dr-Strangelove; pg. 8, Sarah Forbes; pg. 14, NicolasMcComber; pg. 16, Travis S.; pg. 19, milehightraveler; pg. 23, versh; pg. 24, alacatr; pg. 27, drnadig; pg. 30, jbdodane; pg. 35, mkw87; pg. 40, Rumo; pg. 42 (left), JamesBrey; pg. 43 (right), bskdesigns.
ABOUT WRIWRI is a global research organization that works closely with leaders to turn big ideas into action to sustain a healthy environment—the foundation of economic opportunity and human well-being.
Our ChallengeNatural resources are at the foundation of economic opportunity and human well-being. But today, we are depleting Earth’s resources at rates that are not sustainable, endangering economies and people’s lives. People depend on clean water, fertile land, healthy forests, and a stable climate. Livable cities and clean energy are essential for a sustainable planet. We must address these urgent, global challenges this decade.
Our VisionWe envision an equitable and prosperous planet driven by the wise management of natural resources. We aspire to create a world where the actions of government, business, and communities combine to eliminate poverty and sustain the natural environment for all people.
Our Approach
COUNT ITWe start with data. We conduct independent research and draw on the latest technology to develop new insights and recommendations. Our rigorous analysis identifies risks, unveils opportunities, and informs smart strategies. We focus our efforts on influential and emerging economies where the future of sustainability will be determined.
CHANGE ITWe use our research to influence government policies, business strategies, and civil society action. We test projects with communities, companies, and government agencies to build a strong evidence base. Then, we work with partners to deliver change on the ground that alleviates poverty and strengthens society. We hold ourselves accountable to ensure our outcomes will be bold and enduring.
SCALE ITWe don’t think small. Once tested, we work with partners to adopt and expand our efforts regionally and globally. We engage with decision-makers to carry out our ideas and elevate our impact. We measure success through government and business actions that improve people’s lives and sustain a healthy environment.
ACKNOWLEDGMENTSThis publication was made possible thanks to the support of the World Resources Institute Food, Forest, and Water Program, the Aqueduct Alliance, and MAP Royalty, Inc. The authors would like to thank the following people for providing invaluable insight and assistance: Daryl Ditz, Robert Firme, Francis Gassert, Craig Hanson, Charlie Iceland, Andrew Maddocks, Allison Meyer, Betsy Otto, Ashleigh Rich, and Tien Shiao; as well as Carole Excell, Erin Gray, James Mulligan, and Hua Wen for their review of this report. The authors would also like to thank the External Advisory Group for their extensive guidance and feedback during the design and development of this study:
Tim Carr West Virginia UniversityMonika Freyman Ceres Kristian Hardiman CDPKelly Kryc Independent Energy Consultant Richard Liroff Investors Environmental Health Network (IEHN)Courtney Lowrance CitibankBriana Mordick Natural Resources Defense Council (NRDC)Christopher Robart PacWest Consulting PartnersJhih-Shyang Shih Resources for the Future (RFF)Fernando Sierra ShellJoseph P. Smith ExxonMobil, representing IPIECAKarina de Souza CDPAnouk van der Laan Ministry of Foreign Affairs of the NetherlandsAlexander Verbeek Ministry of Foreign Affairs of the NetherlandsAlistair Wyness BP, representing IPIECA
Opinions or points of view expressed in this report are those of the authors and do not necessarily reflect the position of the External Advisory Group or the organizations they represent.
ABOUT THE AUTHORSPaul Reig is an associate II with the Water Program at WRI, where he leads the design and development of the Aqueduct project.
Contact: [email protected]
Tianyi Luo is a research analyst with the Water Program at WRI, where he leads the data collection and GIS analysis of the Aqueduct project.
Contact: [email protected]
Jonathan N. Proctor is pursuing a PhD in Environmental Science, Policy, and Management at University of California, Berkeley.
Contact: [email protected]

81Global Shale Gas Development: Water Availability and Business Risks
Copyright 2014 World Resources Institute. This work is licensed under the Creative Commons Attribution-NonCommercial-NoDerivative Works 3.0 License. To view a copy of the license, visit http://creativecommons. org/licenses/by-nc-nd/3.0/
Each World Resources Institute report represents a timely, scholarly treatment of a subject of public concern. WRI takes responsibility for choosing the study topics and guaranteeing its authors and researchers freedom of inquiry. It also solicits and responds to the guidance of advisory panels and expert reviewers. Unless otherwise stated, however, all the interpretation and findings set forth in WRI publications are those of the authors.
FPOPaper info
WRI.org 82
10 G STREET NE SUITE 800WASHINGTON, DC 20002, USA+1 (202) 729-7600WWW.WRI.ORG ISBN 978-1-56973-831-3