Global Science Challenges in the Bioeconomy Trade-offs for ... · Global Science Challenges in the...
16
11/9/2011 1 Global Science Challenges in the Bioeconomy Trade-offs for the 4Fs Michael Obersteiner Leader Ecosystems Service and Management Program International Institute for Applied Systems Analysis National Science Congress X 8-9 th November, Jakarta IIASA Science Plan
Transcript of Global Science Challenges in the Bioeconomy Trade-offs for ... · Global Science Challenges in the...

11/9/2011
1
Global Science Challenges in the Bioeconomy
Trade-offs for the 4Fs
Michael Obersteiner
Leader
Ecosystems Service and Management ProgramInternational Institute for Applied Systems Analysis
National Science Congress X8-9th November, Jakarta
IIASA Science Plan
11/9/2011
2
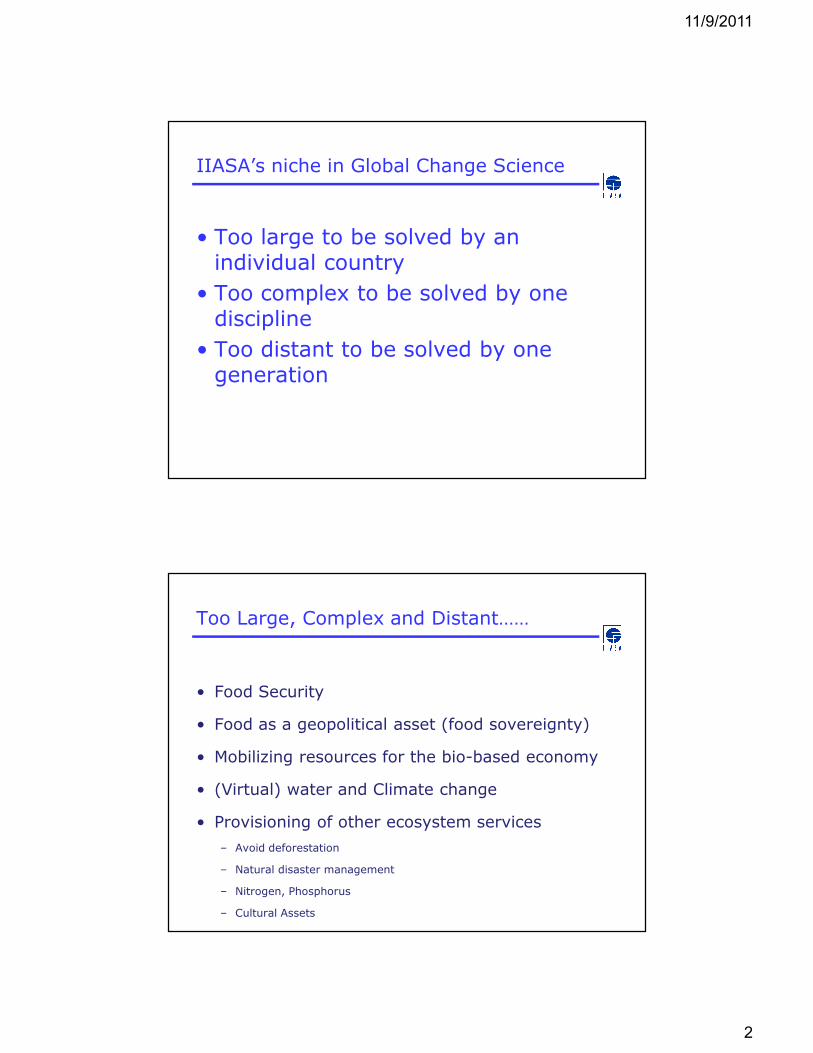
IIASA’s niche in Global Change Science
• Too large to be solved by an individual country
• Too complex to be solved by one discipline
• Too distant to be solved by one generation
Too Large, Complex and Distant……
• Food Security
• Food as a geopolitical asset (food sovereignty)
• Mobilizing resources for the bio-based economy
• (Virtual) water and Climate change
• Provisioning of other ecosystem services
– Avoid deforestation
– Natural disaster management
– Nitrogen, Phosphorus
– Cultural Assets
11/9/2011
3
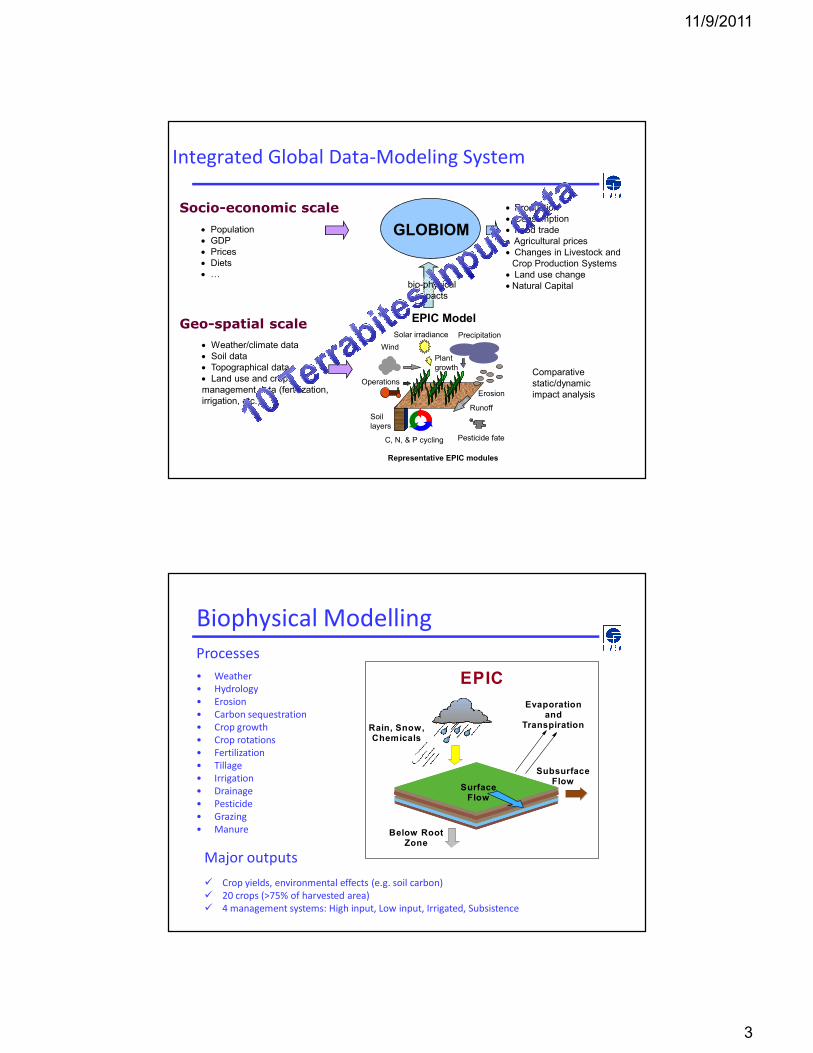
Integrated Global Data-Modeling System
• Production
• Consumption
• Food trade
• Agricultural prices
• Changes in Livestock and
Crop Production Systems
• Land use change
•Natural Capital
Geo-spatial scale
Socio-economic scale
• Weather/climate data
• Soil data
• Topographical data
• Land use and crop
management data (fertilization,
irrigation, etc.)
• Population
• GDP
• Prices
• Diets
• ,
GLOBIOM
Comparative
static/dynamic
impact analysis
EPIC Model
Erosion
C, N, & P cycling
Plant
growth
Precipitation
Soil
layers
Operations
Solar irradiance
Runoff
Wind
Representative EPIC modules
Pesticide fate
bio-physical
impacts
Biophysical Modelling
EPIC
Rain, Snow, Chemicals
Subsurface Flow
Surface Flow
Below Root Zone
Evaporation and
Transpiration
• Weather
• Hydrology
• Erosion
• Carbon sequestration
• Crop growth
• Crop rotations
• Fertilization
• Tillage
• Irrigation
• Drainage
• Pesticide
• Grazing
• Manure
Processes
Major outputs
� Crop yields, environmental effects (e.g. soil carbon)
� 20 crops (>75% of harvested area)
� 4 management systems: High input, Low input, Irrigated, Subsistence

11/9/2011
4
Global water use for food production
Irrigation depth (wheat)

11/9/2011
5
IrelandUK
DenmarkSweden
Netherlands
Belgium
Germany
France
Rwanda
Zimbabwe
Namibia
Zambia
Egypt
R2 = 0.8788
0
0.5
1
1.5
2
2.5
3
0 2000 4000 6000 8000 10000
Yield (kg ha-1)
Cro
p W
ate
r P
rod
ucti
vit
y (
kg
m-3
)
Asia
Europe
North America
South America
Africa
Oceania
Ireland
UK
DenmarkSweden
Eritrea
Chad
Sudan
Mali
R2 = 0.7859
0
0.5
1
1.5
2
2.5
3
0 2000 4000 6000 8000 10000 12000 14000
Yield (kg ha -1)
Cro
p W
ate
r P
rod
uc
tiv
ity (
kg
m-3
)
Asia
Europe
North America
South America
Africa
Oceania
Potential yield and yield gap at a global scale
Climate Change – Yield Impacts
Relative Difference in Means (2050/2100) in Wheat Yields
[Data: Tyndall, Afi Scenario, simulation model: EPIC]
11/9/2011
6
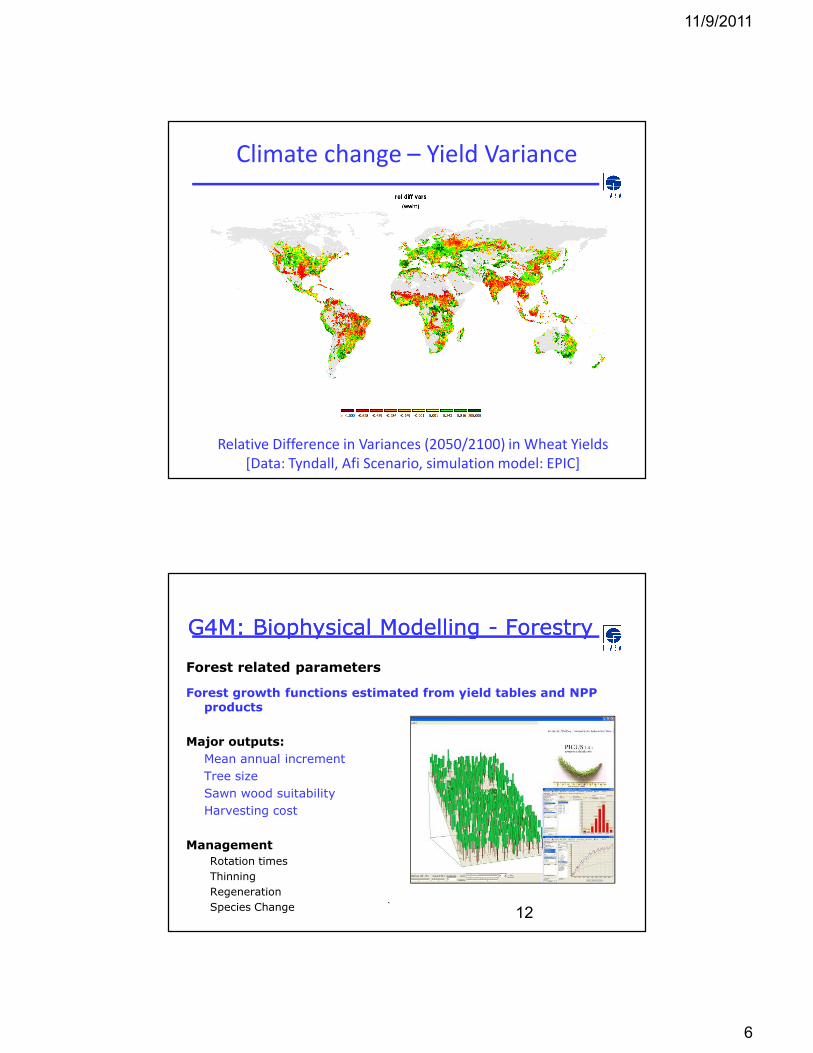
Relative Difference in Variances (2050/2100) in Wheat Yields
[Data: Tyndall, Afi Scenario, simulation model: EPIC]
Climate change – Yield Variance
12
G4M: Biophysical Modelling G4M: Biophysical Modelling -- ForestryForestry
Forest related parameters
Forest growth functions estimated from yield tables and NPP products
Major outputs:
Mean annual increment
Tree size
Sawn wood suitability
Harvesting cost
Management
Rotation times
Thinning
Regeneration
Species Change
11/9/2011
7
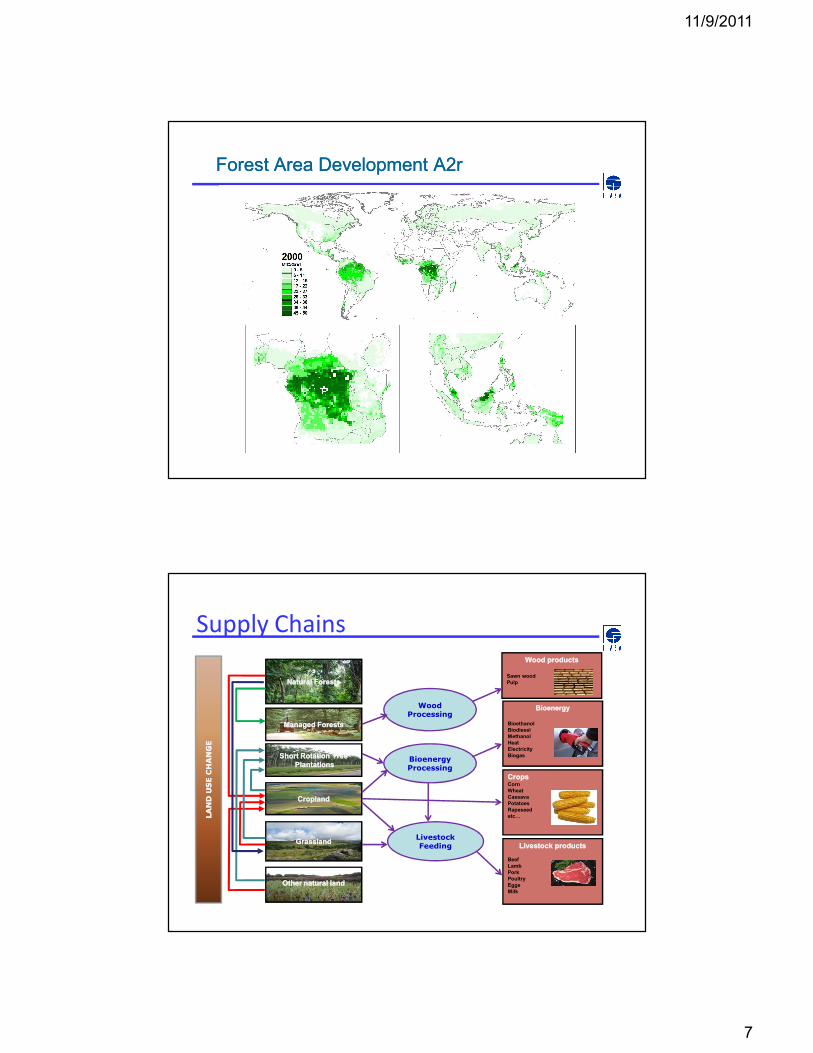
Forest Area Development A2rForest Area Development A2r
REDDREDD
Supply Chains
Natural ForestsNatural Forests
Managed ForestsManaged Forests
Short Rotation TreeShort Rotation Tree
PlantationsPlantations
CroplandCropland
GrasslandGrassland
Other natural landOther natural land
BioenergyBioenergy
Bioethanol
Biodiesel
Methanol
Heat
Electricity
Biogas
Wood productsWood products
Sawn wood
Pulp
Livestock productsLivestock products
Beef
Lamb
Pork
Poultry
Eggs
Milk
CropsCropsCorn
Wheat
Cassava
Potatoes
Rapeseed
etc0LAND USE CHANGE
LAND USE CHANGE
Wood Processing
BioenergyProcessing
Livestock Feeding

11/9/2011
8
Scenario building
Output: production Q � land use, water use, GHG, environment
consumption Q
trade flows
prices
Main exogenous drivers:
Population (IIASA projections)
Diets (FAO, 2006)
Bio-energy demand (POLES team, JRC Seville, WEO)
(GDP, technological change,…)
Urbanization
0%
10%
20%
30%
40%
50%
60%
70%
80%
90%
100%
1800 1850 1900 1950 2000 2050 2100 2150
Source: Grübler, 2007Source: Grübler, 2007

11/9/2011
9
Education
0%
10%
20%
30%
40%
50%
60%
70%
80%
90%
100%
1800 1850 1900 1950 2000 2050 2100 2150
Source: Lutz, 2007Source: Lutz, 2007
Democratization
0%
10%
20%
30%
40%
50%
60%
70%
80%
90%
100%
1800 1850 1900 1950 2000 2050 2100 2150
Source: Modelski, 2002Source: Modelski, 2002

11/9/2011
10
Food for a Week, Darfur Refugees, Chad© 2007 PETER MENZEL PHOTOGRAPHY© 2007 PETER MENZEL PHOTOGRAPHY
Food for a Week, Germany© 2005 PETER MENZEL PHOTOGRAPHY© 2005 PETER MENZEL PHOTOGRAPHY
11/9/2011
11
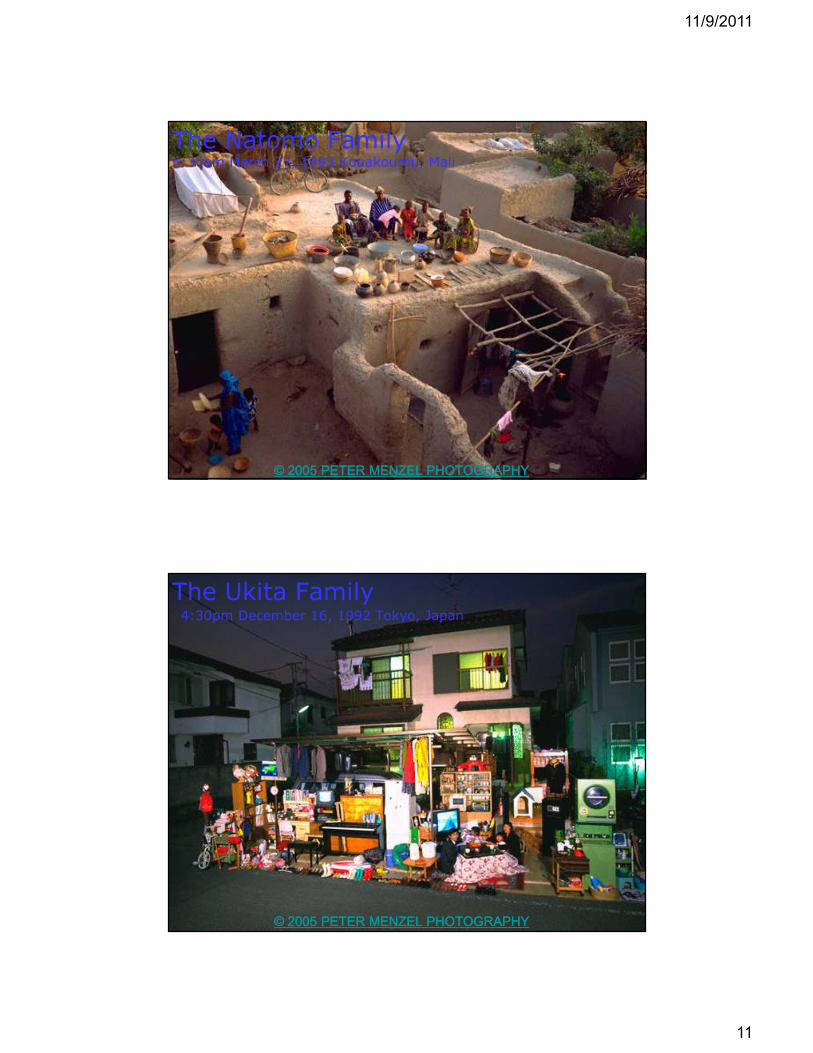
© 2005 PETER MENZEL PHOTOGRAPHY© 2005 PETER MENZEL PHOTOGRAPHY
The Natomo Family 6:30am March 27, 1993 Kouakourou, Mali
The Ukita Family4:30pm December 16, 1992 Tokyo, Japan
© 2005 PETER MENZEL PHOTOGRAPHY© 2005 PETER MENZEL PHOTOGRAPHY

11/9/2011
12
Technology & Trade & Food Security Scenarios
• BAU:
– SF0: not preventing to go hungry
– SF1: safety first, food security binding requirement
• IRR: Subsidized Irrigation projects
• TRD: Increased trade barriers - modeled as approximately a
doubling of the trade cost)
Consumption

11/9/2011
13
Average Price Index 2020 vs 2000
Fundamental Price Volatility Index in 2020
0
0.1
0.2
0.3
0.4
0.5
0.6
0.7
0.8
0.9
SF0 SF1 SF1/IRR SF1/TRD

11/9/2011
14
Environmental Impact: Deforestation
Corn Trade / Imports in 2020 in Million t
0
10
20
30
40
50
60
70
80
90
100
BAU IRR TRD
SF0
SF1

11/9/2011
15
Conclusions
• Desirable Food security constraint implies:
– Higher food prices and volatility
– Deforestation, N&P, water, GHGs….
• Adaptation Options to Mitigate Trade-offs
– Trade flexibility most effective and cheapest measure
– Yield-stabilizing management systems such as
irrigation is necessary for environmentally sustainable
food security
– Physical and Virtual Storage
Conclusion for Systems’ Science
• Integration of Agronomics with Economics&Finance
• Integration of Trade Policy
• Integration of Remotely Sensed Data for Crop Forecasting
• Integration of Environmental Policies
• Integration of Climate Science
• Integration with Energy system (Hydropower and Biofuels)
• Integration with Socio-economics and Education Systems
• Integration of…..

11/9/2011
16
Michael ObersteinerMichael Obersteiner
Ecosystems Services and Management ProgramEcosystems Services and Management Program
[email protected]@iiasa.ac.at