Global Risk Management Survey: Fifth Edition Accelerating ... · Global Risk Management Survey:...
29
Global Risk Management Survey: Fifth Edition Accelerating Risk Management Practices Global Risk Management Survey: Fifth Edition Accelerating Risk Management Practices Financial Services
Transcript of Global Risk Management Survey: Fifth Edition Accelerating ... · Global Risk Management Survey:...

�
Global Risk Management Survey: Fifth EditionAccelerating Risk Management Practices
Global Risk Management Survey: Fifth Edition
Accelerating Risk Management Practices
Financial Services

Global Risk Management Survey: Fifth EditionAccelerating Risk Management Practices
Dear Colleague:
We are pleased to present Deloitte & Touche LLP’s Global Risk Management Survey: Fifth Edition – Accelerating Risk Management Practices. The current survey, as in previous editions, is designed to provide an in-depth analysis of the full range of critical risk management issues facing financial institutions today. We believe it represents one of the most comprehensive efforts of its type conducted in the industry.
The tremendous response to this year’s survey – from 130 global financial institutions with assets totaling nearly $21 trillion – continues to underscore the substantial global interest in the topic of risk management. Industry executives face the challenge of managing risk in a dynamic business environment that includes a growing range of financial products that bring new and more complex risks.
We would like to extend our appreciation to all of the participating companies for their time. We would also like to thank our global financial services practitioners for their assistance with, and contributions to, this survey.
On behalf of our firm, we sincerely hope this report provides you with thought-provoking information that you can use to better understand the industry’s approaches in managing the critical risks of financial institutions and in benchmarking to enhance your risk management practices.
Sincerely yours,
Global Risk Management Survey: Fifth Edition
Accelerating Risk Management Practices
Owen RyanManaging PartnerCapital MarketsDeloitte & Touche LLP
Edward HidaPartner, Risk Advisory Service Line LeaderCapital MarketsDeloitte & Touche LLP

Global Risk Management Survey: Fifth EditionAccelerating Risk Management Practices
Executive Summary 3
Introduction 5
Achieving a Strategic View of Risk 8
Addressing the Full Range of Risks �0
Enterprise Risk Management – A Work in Progress ��
Looking Toward Basel II �5
Addressing Key Risks �7
Risk Systems and Technology Infrastructure ��
The Road Ahead �3
Table of Contents
Global Risk Management Survey: Fifth EditionAccelerating Risk Management Practices
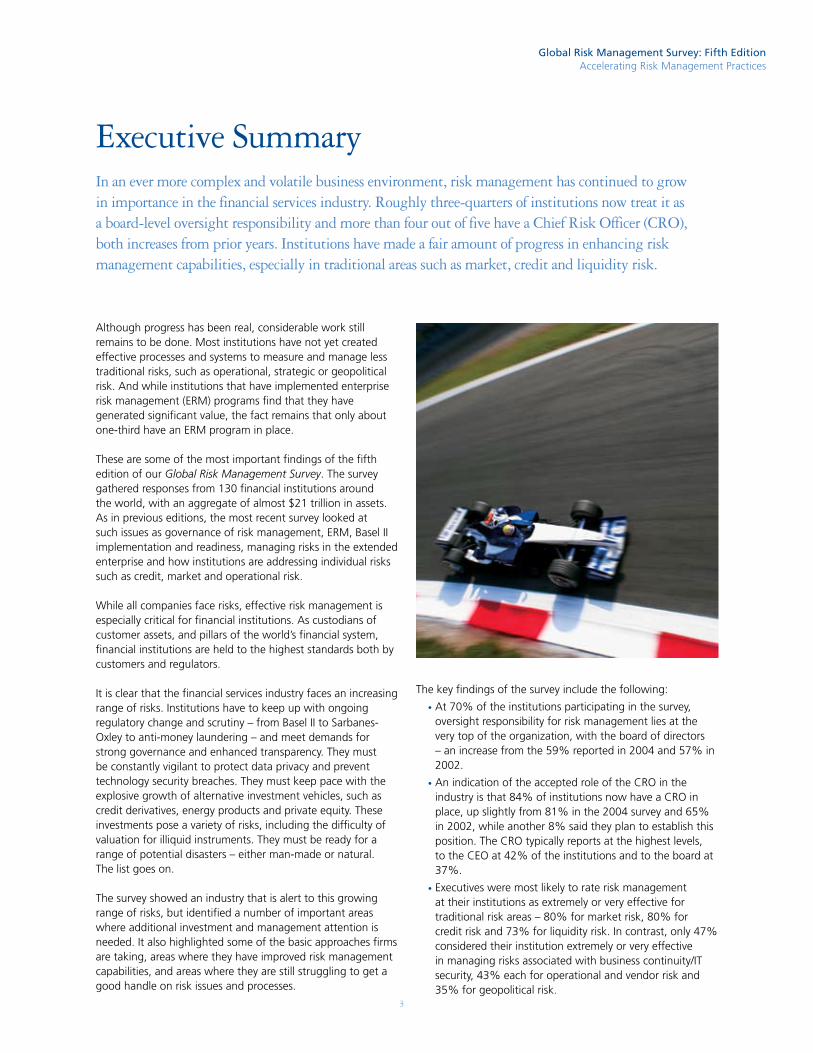
Executive SummaryIn an ever more complex and volatile business environment, risk management has continued to grow in importance in the financial services industry. Roughly three-quarters of institutions now treat it as a board-level oversight responsibility and more than four out of five have a Chief Risk Officer (CRO), both increases from prior years. Institutions have made a fair amount of progress in enhancing risk management capabilities, especially in traditional areas such as market, credit and liquidity risk.
The key findings of the survey include the following:
At 70% of the institutions participating in the survey, oversight responsibility for risk management lies at the very top of the organization, with the board of directors – an increase from the 59% reported in 2004 and 57% in 2002.
An indication of the accepted role of the CRO in the industry is that 84% of institutions now have a CRO in place, up slightly from 81% in the 2004 survey and 65% in 2002, while another 8% said they plan to establish this position. The CRO typically reports at the highest levels, to the CEO at 42% of the institutions and to the board at 37%.
Executives were most likely to rate risk management at their institutions as extremely or very effective for traditional risk areas – 80% for market risk, 80% for credit risk and 73% for liquidity risk. In contrast, only 47% considered their institution extremely or very effective in managing risks associated with business continuity/IT security, 43% each for operational and vendor risk and 35% for geopolitical risk.
•
•
•
Although progress has been real, considerable work still remains to be done. Most institutions have not yet created effective processes and systems to measure and manage less traditional risks, such as operational, strategic or geopolitical risk. And while institutions that have implemented enterprise risk management (ERM) programs find that they have generated significant value, the fact remains that only about one-third have an ERM program in place.
These are some of the most important findings of the fifth edition of our Global Risk Management Survey. The survey gathered responses from 130 financial institutions around the world, with an aggregate of almost $21 trillion in assets. As in previous editions, the most recent survey looked at such issues as governance of risk management, ERM, Basel II implementation and readiness, managing risks in the extended enterprise and how institutions are addressing individual risks such as credit, market and operational risk.
While all companies face risks, effective risk management is especially critical for financial institutions. As custodians of customer assets, and pillars of the world’s financial system, financial institutions are held to the highest standards both by customers and regulators.
It is clear that the financial services industry faces an increasing range of risks. Institutions have to keep up with ongoing regulatory change and scrutiny – from Basel II to Sarbanes-Oxley to anti-money laundering – and meet demands for strong governance and enhanced transparency. They must be constantly vigilant to protect data privacy and prevent technology security breaches. They must keep pace with the explosive growth of alternative investment vehicles, such as credit derivatives, energy products and private equity. These investments pose a variety of risks, including the difficulty of valuation for illiquid instruments. They must be ready for a range of potential disasters – either man-made or natural. The list goes on.
The survey showed an industry that is alert to this growing range of risks, but identified a number of important areas where additional investment and management attention is needed. It also highlighted some of the basic approaches firms are taking, areas where they have improved risk management capabilities, and areas where they are still struggling to get a good handle on risk issues and processes.
3

Global Risk Management Survey: Fifth EditionAccelerating Risk Management Practices
Only 35% of executives reported that their institutions have already implemented an ERM program. However, 32% said they are in the process of establishing one and 18% said they are planning to create one.
Where ERM programs have been created, they have yielded benefits – roughly three-quarters of executives from companies with ERM initiatives said the total value of their programs had exceeded the costs. However, this assessment of value is only qualitative – only 4% of executives said their institutions quantify the benefits of their ERM programs.
More than 70% of executives reported that their firms had established formal enterprise-wide programs to implement Basel II. At the same time, many institutions still have significant work to do in reaching key Basel II qualification standards, especially in the areas of validation and testing, use test requirements, analytics and calibration and use of the Advanced Measurement Approach (AMA) for modeling operational risk under Pillar I.
Although more than 60% of executives reported that their institutions used Value at Risk (VaR) extensively for fixed income, foreign exchange and equity, less than one-third said it was used extensively for a range of other instruments including asset-backed securities, structured products, credit derivatives and energy products.
Only 42% of institutions reported using stress testing extensively as a tool to understand their risk profile, although an additional 34% used it somewhat.
•
•
•
•
•
Collateral and guarantees continue to be the most extensively used risk mitigation methods to provide support to credit facilities.
In the area of operational risk, about one-fourth of executives said their operational risk management systems were very capable in terms of reporting and data gathering, and more than two-thirds said they were at least somewhat capable in those areas. Lagging behind were exposure calculations and scenario model building.
Effective risk management is fundamental to success in the financial services industry, and a basic expectation of shareholders, regulators and customers. In a challenging and changing risk environment, however, the bar on what constitutes effective risk management is constantly being raised. As this survey shows, most institutions have an unfinished agenda when it comes to the development of sophisticated risk management capabilities, enabling an integrated, enterprise-wide approach to managing the varied and dynamic risks they face. Financial institutions that can understand risk holistically – managing the full range of risks they confront – can strategically use risk-taking as a means to strengthen their competitive position and create value.
•
•
4

Global Risk Management Survey: Fifth EditionAccelerating Risk Management Practices
IntroductionOur Global Risk Management Survey: Fifth Edition provides a snapshot of where the global financial services industry stands in the evolution of risk management and the work that remains to be accomplished. The survey addresses the key issues facing financial institutions, and many of the questions used in prior editions of the risk management survey series were retained in order to allow comparisons of how risk management approaches are evolving. In addition, some questions were added to address new developments and provide insight on risk practices from a strategic point-of-view.
Alternative investments. The rapid expansion in both the number of hedge funds and private equity firms, which are largely unregulated, and the increase in assets under management, have increased risk for financial institutions that do business with them as clients or counterparties. In addition, many major financial institutions have taken on additional risk by creating their own hedge funds and private equity funds.
Credit derivatives. Regulators have expressed concern over dramatic increases in the use of credit derivatives, including credit default swaps, and some observers see them as a source of significant systemic risk. Driven by regulatory concerns, the industry has invested significantly in improving its capabilities to process and document credit derivatives trades.
Energy markets. Energy prices have been more volatile, which increases the risk associated with many investments across the world’s economy. What’s more, some banks and securities firms are now entering or increasing their global energy trading and buying energy firms that have physical assets, contracts and operational capabilities that compound the risk exposure for these institutions.
5
As in prior editions, the current survey allows executives to benchmark their risk management practices against those used by other financial institutions, which can help executives identify practices and approaches that may improve the effectiveness and performance of their own risk management programs.
The survey garnered responses from financial institutions across a variety of regions around the world, including North America, South America, Asia-Pacific and Europe. (See the sidebar, “About the Survey.”)
Financial institutions are in the business of managing risk, but doing so has become a great deal more complicated in recent years. Institutions now confront a proliferation of more complex products, more volatile markets, increased regulatory scrutiny and external threats that include pandemics, data security breaches, identity theft and terrorism. Key developments that have made effective risk management more important, and also more complex, include the following:
Regulatory compliance. Complex and changing regulations are a growing burden, and non-compliance can bring large financial penalties and damage to institutions’ reputations. Financial institutions are facing a variety of more stringent regulations including risk management requirements from Basel II, the EU’s Markets in Financial Instruments Directive (MiFID) and Sarbanes-Oxley (for institutions listed on U.S. securities exchanges), as well as stricter anti-money laundering requirements in many jurisdictions.
Mergers and acquisitions. Consolidation among financial institutions, especially cross-border deals in Europe and elsewhere, has been on the rise. The task of integrating technology systems, business processes and corporate cultures significantly increases both strategic risk and the complexity of risk management during the transition.
Global Risk Management Survey: Fifth EditionAccelerating Risk Management Practices
working to manage all types of risk in a holistic fashion, and use risk to create value. Institutions that successfully achieve this level of risk capability will be able to manage risk proactively and with greater precision. What’s more, they will be in a better position to understand the balance of risks and rewards as they formulate strategy and pursue new opportunities.
The fifth edition of our survey assessed the progress of financial institutions in achieving a comprehensive and sophisticated approach to risk management. The most important findings of the survey are described in the remainder of this report organized around the following areas:
Achieving a Strategic View of Risk
Addressing the Full Range of Risks
Enterprise Risk Management – A Work in Progress
Looking Toward Basel II
Addressing Key Risks – Credit Risk – Market Risk – Operational Risk – Valuation Risk – Extended Enterprise Risk
Risk Systems and Technology InfrastructureThe Road Ahead
•
•
•
•
•
•
•
Expansion in emerging markets. Leading financial institutions are locating or investing in operations in emerging markets – such as Brazil, Russia, India and China – to take advantage of their enormous business potential. But with these opportunities come an array of additional risks in each country that must be managed effectively.
Geopolitical concerns. The threat of terrorism has risen significantly since 2001. In addition, political instability in a number of countries in the Middle East and the growing assertiveness of major energy producing nations – such as Venezuela, Russia and Iran – have the potential to disrupt operations and markets.
Natural disasters and epidemics. While these have always been a concern, in an increasingly interconnected world, events in one place can have a huge impact on business on the other side of the globe. Institutions have to consider potential natural disasters such as a bird flu pandemic, hurricanes and earthquakes.
In response, most financial institutions participating in the survey appropriately treat risk management as a board-level responsibility. Despite the high priority accorded risk management, however, most institutions do not yet effectively manage the full range of risks, and have not yet created an ERM program to achieve a comprehensive approach to risk management.
The current survey makes clear that many institutions still have much to accomplish before they can achieve an integrated, enterprise-wide approach to managing the varied and dynamic risks they face. As these capabilities emerge, it is becoming possible – and ultimately, necessary – to take risk management to new levels. We have noted that some institutions are
6

Global Risk Management Survey: Fifth EditionAccelerating Risk Management Practices
Exhibit 1
Exhibit 2
Exhibit 3
Some graphs do not total 100% due to rounding
Participants By Asset Size
24%
51%
18%
7%
Greater than $100 billion
$10 - $100 billion
$1 - $10 billionLess than $ 1 billion
Some graphs do not total 100% due to rounding
Participants by Primary Business
45%
18%
12%
10%
5%
4%3% 2% 1%
Commercial bankIntegrated financial organizationRetail bankOther (*)Government-related finance companyInvestment bankInvestment management firmInsurance companyBancassurance company
Participants by Headquarters Location
EuropeOther (*)North America
38%
25%
10%
5%
22%
Asia PacificSouth America
About the Survey
The Global Risk Management Survey: Fifth Edition is our most recent examination of the state of risk management in the global financial services industry. We solicited the participation of CROs or their equivalent at financial services firms around the world. Respondents included global, regional and local institutions.
Institutions participating in the survey, which was conducted online during the latter part of 2006, were primarily commercial and retail banks and diversified financial institutions. (See Exhibit 1.) Participants also came from institutions headquarters in a variety of geographic areas around the globe. (See Exhibit 2.) The institutions participating tended to be global in nature, with nearly two-thirds having operations in multiple countries.
The institutions participating in the survey had total assets of almost $21 trillion, up from a total of nearly $19 trillion in the 2004 survey. The institutions had a range of asset sizes, from smaller, regional institutions to some of the largest in the world. (See Exhibit 3.) In particular, 24% of the institutions participating in the survey had assets greater than $100 billion. In comparison to the 2004 survey, the average asset size of the institutions participating in the survey increased 38%.
(*) Other Development Bank Retail bank, insurance broker, Western Union agent, financial advisor Both retail and investment bank Holding company Stock and derivatives exchange 50% Retail / 50% Commercial Bank
Broad financial services company -- residential mortgage lending, retail banking, insurance, title, and more Mutual Fund Real Estate Global Custody Bank Payment network Real Estate Investment Trust Savings and loan bank, that finances the building, renovations, etc. purposes exclusively of its own retail customers only
7
(*) Other includes Middle East, Africa and Central America

Global Risk Management Survey: Fifth EditionAccelerating Risk Management Practices
In addition, 60% of executives in the current survey said the board takes at least a “somewhat active” role in risk management, including 18% calling the board’s role “very active.” Understandably, board risk management committees played even more active roles, with 76% of executives describing them as at least somewhat active and 32% describing them as very active. (See Exhibit 4.)
The growing strategic importance of risk management is underscored by the continuing rise of the position of the CRO, as institutions work to move away from siloed approaches and integrate the management of diverse types of risk. The CRO position has become an accepted and key role in financial institutions – 84% of executives reported that their companies have a CRO or equivalent position – up slightly from 81% in the 2004 survey and substantially from 65% in the 2002 survey – while another 8% said they plan to create one.
CROs appear to genuinely have the backing and buy-in of senior management, with 42% reporting directly to the CEO and 37% reporting to the board or a board committee. And most CROs have regular access to the board and senior management. Forty-four percent of executives said their CRO meets with the board at least quarterly, and 33% said they met at least monthly. The CROs’ interaction with the CEO appears to be even closer, with 40% of executives saying the CRO meets with the chief executive at least weekly, and 8% citing daily meetings.
Exhibit 4
Achieving a Strategic View of RiskWith the increasing variety of risks – and the potentially huge negative impact they can have in terms of both financial and reputational loss – risk management has become an ever higher priority for financial institutions. The survey found that this trend is continuing – 70% of the executives surveyed said that ultimate responsibility for risk management lies at the very top of the organization with the board of directors. That compares to 59% in the �004 survey and 57% in the �00� survey.
In terms of how the risk management function is organized, institutions took a variety of approaches. Forty-four percent of executives said their institutions had taken a centralized approach, and 35% said they used a decentralized approach – 16% saying they were organized by risk type, 14% by business unit and 5% by region. (See Exhibit 5.) The remaining 21% of executives reported using a mix of a centralized and decentralized approach.
Exhibit 5
Risk as Board Responsibility
Some graphs do not total 100% due to rounding
57% 59%
70%
2002 2004 2006
0%
10%
20%
30%
40%
50%
60%
70%
80%
90%
100%
Some graphs do not total 100% due to rounding
Risk Oversight Approach
21%
16%
14% 5%
44%
Centralized
Decentralized - Regional level
Decentralized - Business-unit level
Decentralized - Risk-type level
A combination of centralized and decentralized
8

Global Risk Management Survey: Fifth EditionAccelerating Risk Management Practices
Regional Perspective: Responsibility for Risk Management
While roughly three-quarters of institutions saw risk management as the responsibility of the board of directors, this was most common among institutions in Asia-Pacific, cited by about eight out of 10 respondents. In Europe, North America and South America, that figure dropped to six out of 10. About one-third of executives form South American institutions said the primary responsibility lay with the CRO, whereas 19% named the CRO in Europe and North America, and only 4% did in Asia Pacific.
Each approach has its advantages and disadvantages. A centralized approach offers the potential to achieve a common risk management vision across the institution, faster implementation once decisions have been made, and economies of scale. Yet, centralized risk management can face slower decision-making, difficulties in capturing data and reporting on a consistent basis and the potential to overlook risks in specific products, functions or customers. On the other hand, a decentralized approach can offer greater understanding of the risks in specific aspects of the business and the ability to respond flexibly to these risks. Yet, a purely decentralized approach may lead to inconsistent risk policies, strategies and reporting and create the potential that consolidated risks may be missed. Some institutions employ a hybrid approach in an attempt to capture the best elements of each approach.
In our experience, there is no one approach that is appropriate for all institutions. The key issue is that the organization of the risk management function should be tailored to the institution’s governance approach, organizational structure, size and overall operating philosophy.
9

Global Risk Management Survey: Fifth EditionAccelerating Risk Management Practices
When executives were asked about the likelihood of specific risks, they felt their institutions were at least somewhat likely to be affected by credit (80%), operational (71%), market (65%) and business continuity/IT security (60%) risks. In addition, areas such as liquidity, reputation, strategic, regulatory/compliance, litigation, privacy and hazard/insurable risk were each cited by a third or more of the executives as at least somewhat likely. (See Exhibit 6.)
Some aspects of traditional risks are spurring additional focus. For example, institutions are examining their liquidity risk due to what some call “crowded trades” and the related modeling of liquidity risk for their positions subject to this type of risk.
An example of another emerging risk that is increasing in industry and regulatory attention, in our experience, is model risk, which results from an institution’s dependence on models. Institutions are analyzing what are the key model assumptions, who made them, whether they have been independently tested and how these models interact in reporting and decision making, among other issues. This is a topic demanding increased scrutiny.
Exhibit 6
Although executives acknowledged their institutions faced a wide range of risks, executives were less likely to report that their institutions were effective in managing the less traditional risks. Fully 80% of executives said their institutions were extremely or very effective in managing market risk and credit risk, and 73% said the same about liquidity risk. (See Exhibit 7.)
In contrast, only 47% of executives rated their institution as extremely or very effective in managing risks associated with business continuity/IT security, 43% for operational or vendor risk and 35% for geopolitical risk. With an increasing variety of potential severe risks, many financial institutions will need to broaden their risk management horizons.
Exhibit 7
Addressing the Full Range of RisksA critical challenge facing risk management is achieving a comprehensive view of all the varied risks a financial institution faces, yet many institutions have much more to accomplish in this regard. While some institutions seem to take a broad view of managing the full range of risks, others appear to still be primarily focused on the traditional areas of market, credit and liquidity risk.
12% 27% 41% 17% 3%
10%
9%
2%
2%
2%
2%
2%
1%
1%
21%
19%
11%
14%
15%
2%
10%
15%
8%
6%
6%
5%
5%
34%
43%
26%
26%
43%
24%
35%
32%
32%
28%
25%
34%
19%
30%
28%
50%
55%
38%
52%
49%
46%
51%
51%
55%
48%
65%
6%
1%
10%
3%
2%
20%
4%
6%
7%
15%
15%
13%
11%
3%
Risk Likelihood
0% 10% 20% 30% 40% 50% 60% 70% 80% 90% 100%
Credit
Market
Operational
Liquidity
Reputation
Businesscontinuity /IT security
Geopolitical
Strategic
Regulatory /compliance
Litigation
Privacy
Vendor
Hazard orinsurable
Budgeting/Financial
Ex tremely likely Very likely Somewhat likely Not very likely Not at all likely
Some graphs do not total 100% due to rounding
26%
25%
23%
54%
48%
57%
19%
25%
18%
1%
2%
2%
15%
14%
40%
45%
43%
36%
37%
36%
7%
3%
7%
2%
1%
17%
10%
10%
7%
6%
37%
33%
36%
35%
46%
47%
43%
43%
7%
10%
13%
15% 1%
2%
13%
13%
12%
11%
30%
33%
40%
24%
43%
47%
42%
47%
12%
7%
7%
12%
2%
6%
0% 10% 20% 30% 40% 50% 60% 70% 80% 90% 100%
Risk Management EffectivenessMarket
Liquidity
Credit
Budgeting/Financial
Regulatory /Compliance
Privacy
Strategic
Reputation
Litigation
Geopolitical
Businesscontinuity/IT security
Operational
Vendor
Hazard orinsurable
Ex tremely effective Very effective Somewhat effective Not very effective Not at all effective
Some graphs do not total 100% due to rounding
�0

Global Risk Management Survey: Fifth EditionAccelerating Risk Management Practices
Some graphs do not total 100% due to rounding
Expenditures on Risk Management - Summary of Responses
0% 10% 20% 30% 40% 50% 60% 70% 80% 90% 100%
20%
23%
3%
2%26%
36%
48%
42%
1%
Past 24 months
Next 24 months
Substantial increase Some increase About the sameSome decrease Substantial decrease
Integrated, Enterprise-Wide Risk Management Program or Equivalent
35%
32%
15%
18%
Yes, program in place
Yes, currently implementing one
No, but plan to create one
No, and do not plan to create one
Some graphs do not total 100% due to rounding
Despite its appeal, however, ERM implementation is still fairly limited. Only 35% of executives surveyed reported that their institution has an ERM program in place, although an additional 32% said they are establishing an ERM program, and 18% said they are planning to create one. (See Exhibit 8.) On the other hand, executives at institutions that have or are creating ERM programs are increasing their investment – roughly three-quarters said they had increased investment in their ERM effort over the past 24 months, and a similar percentage expect increased spending over the next 24 months. (See Exhibit 9.)
There are many steps to implementing an ERM program, and in our experience each ERM program needs to be tailored to the institution. Often, organizations begin by establishing their objectives for ERM, which may lead to developing an ERM framework and ERM policy. Many institutions then develop ERM governance structures such as a risk committee, CRO position and business-unit risk champions.
Enterprise Risk Management – A Work in ProgressEnterprise risk management (ERM) continues to command a great deal of attention in the financial services industry. The appeal is clear: ERM aims to bring holistic, organization-wide and standardized risk management processes to financial institutions and provide them with an integrated view of the range of risks they face. The goal is to have consistent reporting of information across the enterprise, perhaps through a risk dashboard that provides relevant information for individuals in varying roles throughout the organization based on standardized information.
To begin to understand risk exposures, the risk function starts conducting risk assessments and looking at quantitative risk measurement tools, where available. Typically, the most challenging work then begins – attempting to roll out the risk framework to business units, consolidate risk exposures across the organization and build risk management approaches into everyday business decision making and strategic planning. This is a simplified description that provides an overview of some of the common steps to developing and implementing an ERM program.
Exhibit 8
Exhibit 9
Regional Perspective: Risk Management Expenditures
Across regions, more than two-thirds of the executives reported increases in risk management expenditures over the last 24 months. However, in looking ahead, there were significant differences from region to region. In South America, about half the executives foresaw substantial increases in expenditures in the coming 24 months, while 30% in North America expected substantial increases and only 19% each in Europe and in Asia Pacific.
��
Global Risk Management Survey: Fifth EditionAccelerating Risk Management Practices
Exhibit 11
At many institutions, ERM is not well integrated across the enterprise. Only about one-third of executives reported that risk management processes were well-integrated at the data and system levels, and only one-fifth said they were well-integrated in terms of methodologies. Less than one in 10 reported well-integrated processes at the organization level. Overall, it is clear that additional effort is needed to drive more extensive integration of risk management processes across the organization.
ERM is often not integrated with other key related programs, including other risk management initiatives. For example, less than half the institutions had integrated ERM with IT risk or strategic planning, and only about one-third had integrated it with budgeting or project management risk. (See Exhibit 12.) In terms of regulatory efforts, just 32% of executives said ERM and Basel II activities were well integrated, and 13% said the same of ERM and Sarbanes-Oxley or similar regulatory regimes.
Exhibit 12
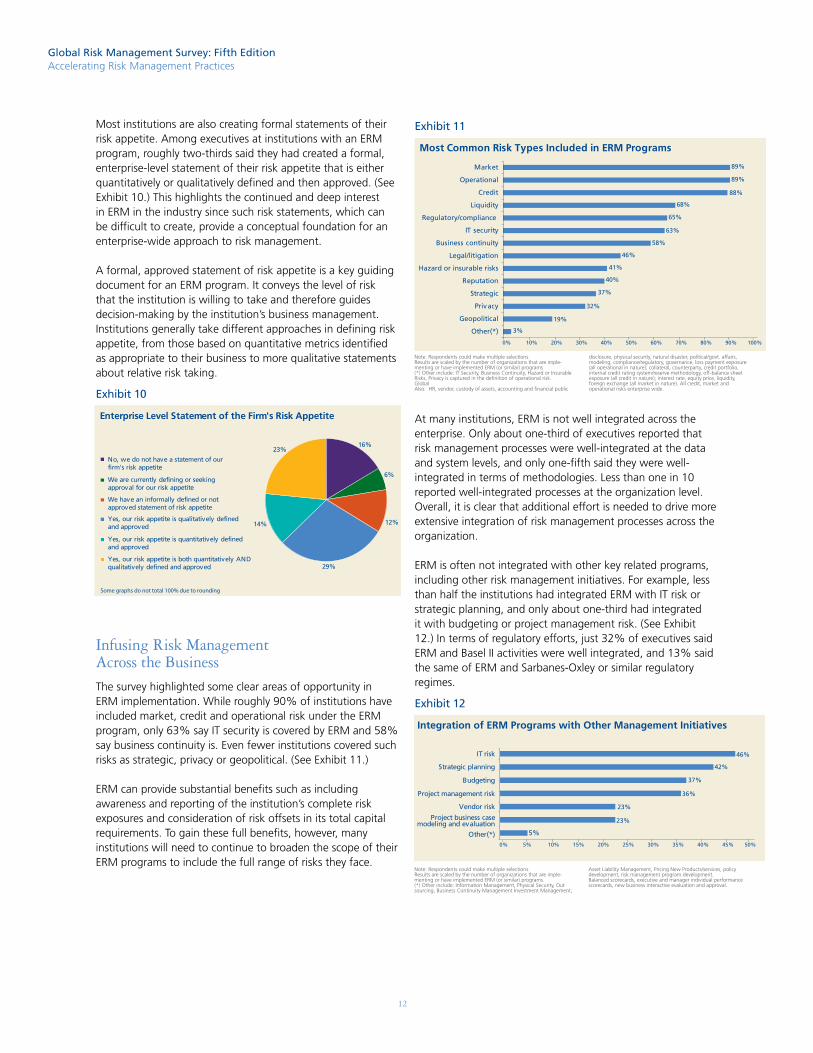
Most institutions are also creating formal statements of their risk appetite. Among executives at institutions with an ERM program, roughly two-thirds said they had created a formal, enterprise-level statement of their risk appetite that is either quantitatively or qualitatively defined and then approved. (See Exhibit 10.) This highlights the continued and deep interest in ERM in the industry since such risk statements, which can be difficult to create, provide a conceptual foundation for an enterprise-wide approach to risk management.
A formal, approved statement of risk appetite is a key guiding document for an ERM program. It conveys the level of risk that the institution is willing to take and therefore guides decision-making by the institution’s business management. Institutions generally take different approaches in defining risk appetite, from those based on quantitative metrics identified as appropriate to their business to more qualitative statements about relative risk taking.
Exhibit 10
Infusing Risk Management Across the BusinessThe survey highlighted some clear areas of opportunity in ERM implementation. While roughly 90% of institutions have included market, credit and operational risk under the ERM program, only 63% say IT security is covered by ERM and 58% say business continuity is. Even fewer institutions covered such risks as strategic, privacy or geopolitical. (See Exhibit 11.)
ERM can provide substantial benefits such as including awareness and reporting of the institution’s complete risk exposures and consideration of risk offsets in its total capital requirements. To gain these full benefits, however, many institutions will need to continue to broaden the scope of their ERM programs to include the full range of risks they face.
Some graphs do not total 100% due to rounding
16%
6%
29%
14%
23%
12%
No, we do not have a statement of our firm's risk appetite
We are currently defining or seeking approval for our risk appetite
We have an informally defined or not approved statement of risk appetite
Yes, our risk appetite is qualitatively defined and approved
Yes, our risk appetite is quantitatively defined and approved
Yes, our risk appetite is both quantitatively AND qualitatively defined and approved
Enterprise Level Statement of the Firm's Risk Appetite
3%
19%
32%
37%
40%
41%
46%
58%
63%
65%
68%
88%
89%
89%Market
Operational
Credit
Liquidity
Regulatory/compliance
IT security
Business continuity
Legal/litigation
Hazard or insurable risks
Reputation
Strategic
Privacy
Geopolitical
Other(*)
0% 10% 20% 30% 40% 50% 60% 70% 80% 90% 100%
Most Common Risk Types Included in ERM Programs
5%
23%
23%
36%
37%
42%
46%IT risk
Strategic planning
Budgeting
Project management risk
Vendor risk
Project business casemodeling and evaluation
Other(*)0% 5% 10% 15% 20% 25% 30% 35% 40% 45% 50%
Integration of ERM Programs with Other Management Initiatives
Note: Respondents could make multiple selections.Results are scaled by the number of organizations that are imple-menting or have implemented ERM (or similar) programs (*) Other include: IT Security, Business Continuity, Hazard or Insurable Risks, Privacy is captured in the definition of operational risk. Global Also: HR, vendor, custody of assets, accounting and financial public
disclosure, physical security, natural disaster, political/govt. affairs,modeling, compliance/regulatory, governance, loss payment exposure (all operational in nature); collateral, counterparty, credit portfolio, internal credit rating system/reserve methodology, off-balance sheet exposure (all credit in nature); interest rate, equity price, liquidity, foreign exchange (all market in nature). All credit, market and operational risks enterprise wide.
Note: Respondents could make multiple selections. Results are scaled by the number of organizations that are imple-menting or have implemented ERM (or similar) programs. (*) Other include: Information Management, Physical Security, Outsourcing, Business Continuity Management Investment Management,
Asset Liability Management, Pricing New Products/services, policy development, risk management program development. Balanced scorecards, executive and manager individual performance scorecards, new business interactive evaluation and approval.
��
Global Risk Management Survey: Fifth EditionAccelerating Risk Management Practices
Exhibit 14
Exhibit 15
The perception that ERM is helping firms achieve significant value is consistent with our experience, which shows that ERM can benefit organizations on several fronts. However, actually quantifying the benefits of ERM can be difficult – a reality reflected in the fact that only 13% of executives said that their firms quantify ERM costs and just 4% said they quantify ERM value. This is clearly an area where improvement is in order.
As financial services firms work to gain a clearer understanding of the value of ERM, they need to look to quantify its costs and benefits. In that effort, they should consider the full range of tangible and intangible benefits, which can include everything from reducing the costs of regulatory compliance to enabling individuals to think beyond their immediate areas of responsibility to focus on “points of intersection” between risk types. Costs are often directly measurable through the specific costs of the ERM function, but also include related costs through supporting activities by other functions and business units.
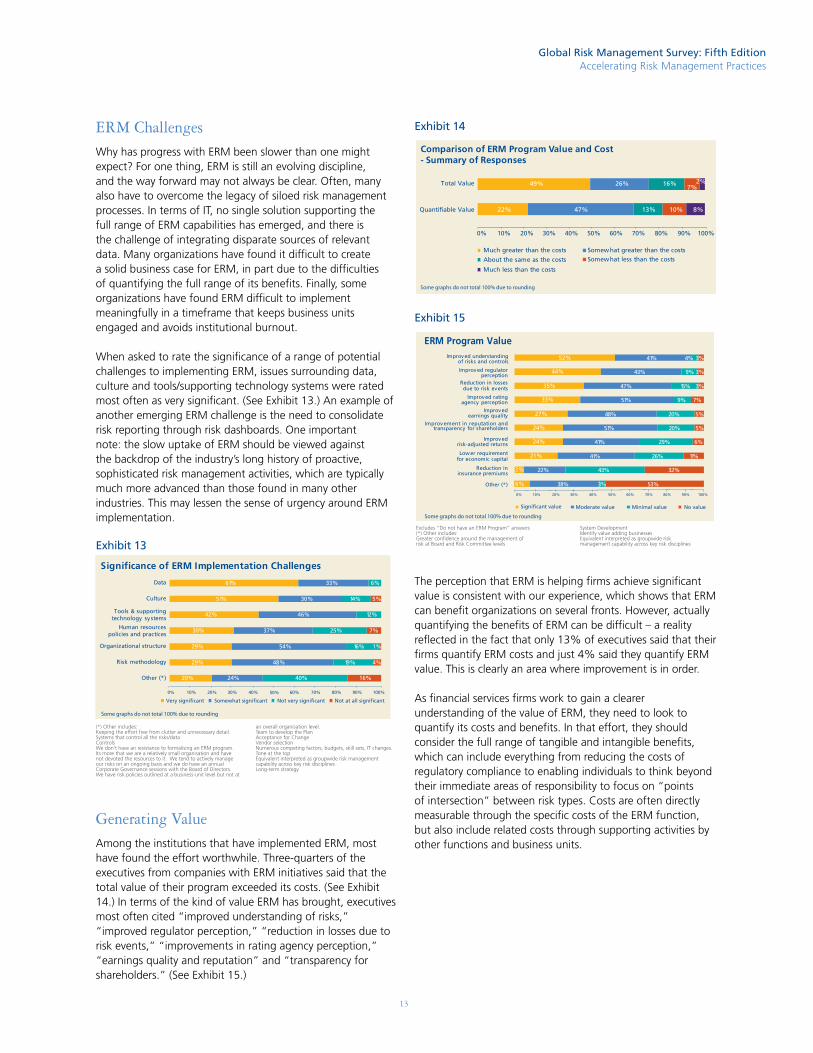
ERM ChallengesWhy has progress with ERM been slower than one might expect? For one thing, ERM is still an evolving discipline, and the way forward may not always be clear. Often, many also have to overcome the legacy of siloed risk management processes. In terms of IT, no single solution supporting the full range of ERM capabilities has emerged, and there is the challenge of integrating disparate sources of relevant data. Many organizations have found it difficult to create a solid business case for ERM, in part due to the difficulties of quantifying the full range of its benefits. Finally, some organizations have found ERM difficult to implement meaningfully in a timeframe that keeps business units engaged and avoids institutional burnout. When asked to rate the significance of a range of potential challenges to implementing ERM, issues surrounding data, culture and tools/supporting technology systems were rated most often as very significant. (See Exhibit 13.) An example of another emerging ERM challenge is the need to consolidate risk reporting through risk dashboards. One important note: the slow uptake of ERM should be viewed against the backdrop of the industry’s long history of proactive, sophisticated risk management activities, which are typically much more advanced than those found in many other industries. This may lessen the sense of urgency around ERM implementation.
Exhibit 13
Generating ValueAmong the institutions that have implemented ERM, most have found the effort worthwhile. Three-quarters of the executives from companies with ERM initiatives said that the total value of their program exceeded its costs. (See Exhibit 14.) In terms of the kind of value ERM has brought, executives most often cited “improved understanding of risks,” “improved regulator perception,” “reduction in losses due to risk events,” “improvements in rating agency perception,” “earnings quality and reputation” and “transparency for shareholders.” (See Exhibit 15.)
Some graphs do not total 100% due to rounding
Very significant Somewhat significant Not very significant Not at all significant
61%
51%
42%
29%
29%
20%
33%
30%
46%
37%
54%
48%
24%
6%
14%
12%
25%
16%
19%
40%
5%
7%
16%
30%
1%
4%
Data
Culture
Tools & supportingtechnology sy stems
Human resourcespolicies and practices
Organizational structure
Risk methodology
Other (*)
0% 10% 20% 30% 40% 50% 60% 70% 80% 90% 100%
Significance of ERM Implementation Challenges
Some graphs do not total 100% due to rounding
Comparison of ERM Program Value and Cost- Summary of Responses
0% 10% 20% 30% 40% 50% 60% 70% 80% 90% 100%
13% 10%
7%
8%22%
49%
47%
26% 16% 2%
Quantifiable Value
Total Value
Much greater than the costs Somewhat greater than the costs
About the same as the costs Somewhat less than the costs
Much less than the costs
ERM Program Value
52%
44%
35%
27%
24%
24%
21%
3%
6%
41%
43%
47%
51%
48%
51%
41%
41%
22%
38%
4%
9%
15%
9%
20%
20%
29%
26%
43%
3%
3%
3%
3%
7%
6%
11%
32%
53%
33%
5%
5%
Improved understandingof risks and controls
Improved regulatorperception
Reduction in lossesdue to risk events
Improved ratingagency perception
Improvedearnings quality
Improv ement in reputation andtransparency for shareholders
Improvedrisk-adjusted returns
Lower requirementfor economic capital
Reduction ininsurance premiums
Other (*)
0% 10% 20% 30% 50% 70%40% 60% 80% 90% 100%
Significant value Moderate value Minimal value No value
Some graphs do not total 100% due to rounding
Excludes “Do not have an ERM Program” answers(*) Other includes:Greater confidence around the management of risk at Board and Risk Committee levels
System Development Identify value adding businessesEquivalent interpreted as groupwide risk management capability across key risk disciplines
(*) Other includes: Keeping the effort free from clutter and unnecessary detail. Systems that control all the risks/data Controls We don’t have an resistance to formalising an ERM program. Its more that we are a relatively small organisation and have not devoted the resources to it. We tend to actively manage our risks on an ongoing basis and we do have an annual Corporate Governance sessions with the Board of Directors. We have risk policies outlined at a business-unit level but not at
an overall organisation level. Team to develop the Plan Acceptance for Change Vendor selectionNumerous competing factors, budgets, skill sets, IT changes. Tone at the topEquivalent interpreted as groupwide risk management capability across key risk disciplines Long-term strategy
�3
Global Risk Management Survey: Fifth EditionAccelerating Risk Management Practices
Regional Perspective: ERM
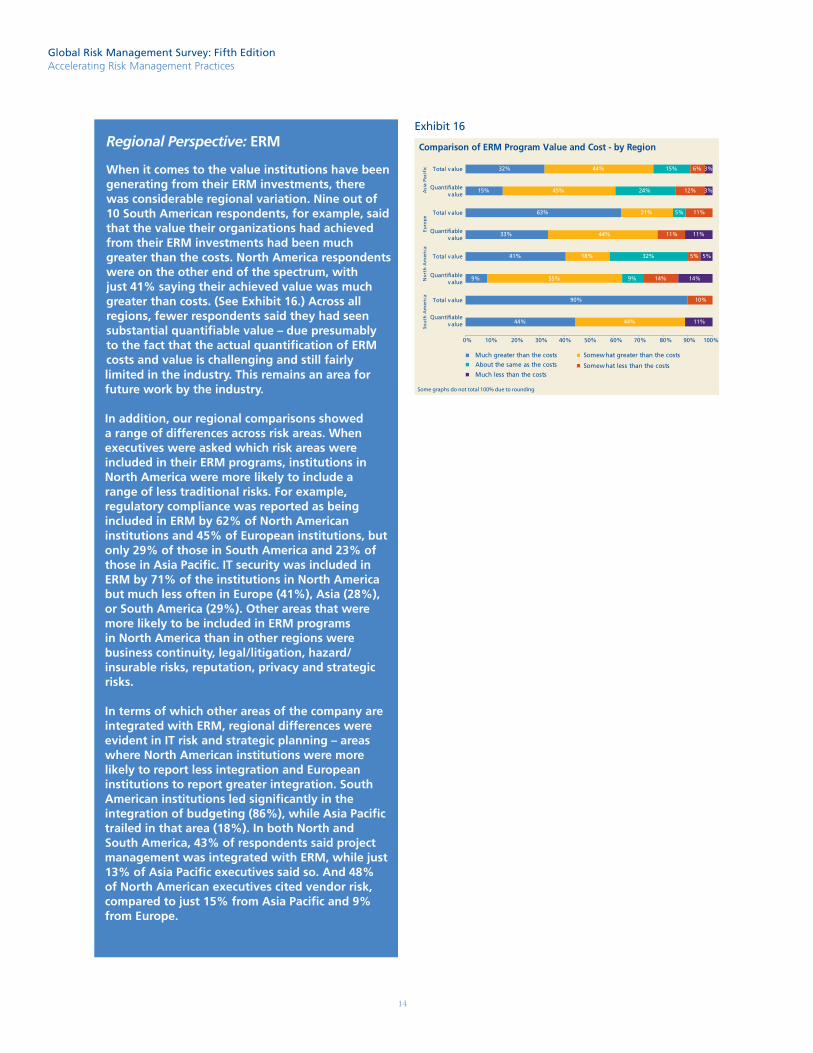
When it comes to the value institutions have been generating from their ERM investments, there was considerable regional variation. Nine out of 10 South American respondents, for example, said that the value their organizations had achieved from their ERM investments had been much greater than the costs. North America respondents were on the other end of the spectrum, with just 41% saying their achieved value was much greater than costs. (See Exhibit 16.) Across all regions, fewer respondents said they had seen substantial quantifiable value – due presumably to the fact that the actual quantification of ERM costs and value is challenging and still fairly limited in the industry. This remains an area for future work by the industry.
In addition, our regional comparisons showed a range of differences across risk areas. When executives were asked which risk areas were included in their ERM programs, institutions in North America were more likely to include a range of less traditional risks. For example, regulatory compliance was reported as being included in ERM by 62% of North American institutions and 45% of European institutions, but only 29% of those in South America and 23% of those in Asia Pacific. IT security was included in ERM by 71% of the institutions in North America but much less often in Europe (41%), Asia (28%), or South America (29%). Other areas that were more likely to be included in ERM programs in North America than in other regions were business continuity, legal/litigation, hazard/insurable risks, reputation, privacy and strategic risks.
In terms of which other areas of the company are integrated with ERM, regional differences were evident in IT risk and strategic planning – areas where North American institutions were more likely to report less integration and European institutions to report greater integration. South American institutions led significantly in the integration of budgeting (86%), while Asia Pacific trailed in that area (18%). In both North and South America, 43% of respondents said project management was integrated with ERM, while just 13% of Asia Pacific executives said so. And 48% of North American executives cited vendor risk, compared to just 15% from Asia Pacific and 9% from Europe.
0% 10% 20% 30% 40% 50% 60% 70% 80% 90% 100%
Comparison of ERM Program Value and Cost - by Region
32%
15%
63%
33%
41%
9%
90%
44%
44%
45%
21%
44%
18%
55%
44%
15%
24%
5%
32%
9%
6%
12%
11%
11%
5%
14%
10%
3%
3%
11%
5%
14%
11%
Total value
Quantifiablevalue
Quantifiablevalue
Quantifiablevalue
Quantifiablevalue
Total value
Total value
Total value
Asi
a Pa
cifi
cEu
rop
eN
ort
h A
mer
ica
Sou
th A
mer
ica
Much greater than the costs Somewhat greater than the costs
About the same as the costs Somewhat less than the costsMuch less than the costs
Some graphs do not total 100% due to rounding
Exhibit 16
�4

Global Risk Management Survey: Fifth EditionAccelerating Risk Management Practices
Looking Toward Basel IIFinancial institutions have been preparing for Basel II, which calls for enhanced risk measurement approaches for credit, market and operational risk, and for allocating adequate capital in light of an institution’s risk profile. More than 70% of executives reported that their firms have established a formal enterprise-wide program to implement Basel II. Most institutions are taking a centralized approach to Basel II. Three-quarters of institutions reported that their Basel II effort was either mostly or somewhat centralized, while �0% used a mix of a centralized and a decentralized approach.
The increased focus on operational risk is a distinctive feature of Basel II. When executives were asked about which operational risk approach their institution was adopting to meet Basel II requirements, the Standardized Approach was most popular, cited by 44% of executives, followed by 41% naming the Basic Indicator Approach. (See Exhibit 17.)
Neither of these approaches is currently planned to be available to U.S. institutions, where Basel II will be limited initially in most cases only to the largest bank holding companies with assets above $250 billion, for which the Advanced Measurement Approach (AMA) for operational risk and Advanced Internal Ratings Based (AIRB) approach for credit risk will be required.
The more sophisticated approaches available under Basel II provide regulatory capital calculations that more accurately reflect an institution’s actual risk profile, and can result in lower required capital. European regulators have tended to accept these approaches and the possibility that required regulatory capital could fall for large banks. However, U.S. regulators have been concerned that Basel II may rely too heavily on banks’ internal risk models. They have proposed that the implementation of Basel II in the United States be delayed until 2009 and that U.S. banks be subject to additional capital requirements, such as minimum leverage ratios.
Not surprisingly, larger institutions were more likely to report using more advanced approaches. For example, only 15% of institutions with $100 billion or more in assets reported using the Basic Indicator, compared to 51% for institutions with assets of $10 to $100 billion and 47% for institutions with $1 to $10 billion in assets. However, only 31% of the largest institutions were in the process of implementing the Advanced Measurement Approach, while 62% were implementing the Standardized Approach.
The survey found that risk coverage under the economic capital framework is not comprehensive, i.e., economic capital is not being allocated for all risk types. Institutions were more likely to calculate economic capital for risks that are well understood, such as credit, market and interest-rate risk, and
Some graphs do not total 100% due to rounding
Basel II - Operational Risk Approach
41%
44%
7%
14%
2%
19%
14%
47%
0% 10% 20% 30% 40% 50% 60% 70%
Basic indicator
Standardized
Alternative StandardizedApproach (ASA)
Advanced MeasurementApproach (AMA)
Implement by initial implementation deadline
Implement in the long run
Exhibit 17
Note: Respondents could make multiple selections
less likely to do so for reputation, privacy and legal risks. (See Exhibit 18.)
Institutions that do allocate economic capital for some of these emerging risk areas tend to use less sophisticated techniques. For example, only about one-third of executives described their institution’s techniques for calculating economic capital for liquidity and operational risk as very or somewhat sophisticated.
Generally, the most sophisticated economic capital methodologies are used at the largest institutions. However, economic capital oversight is viewed as a board-level and senior management oversight responsibility at most institutions. Nearly eight out of 10 executives said that economic capital results are reviewed by senior management, and nearly six out of 10 said results are reviewed by their board.
The survey also explored how the results of economic capital calculations compared to firms’ regulatory capital calculations. More than half the executives said that their regulatory capital results were greater than their economic capital results. Another 22% said they don’t compare results, but plan to do so regarding their Basel II requirements.
�5

Global Risk Management Survey: Fifth EditionAccelerating Risk Management Practices
It is well recognized that bottom-up economic capital models usually result in aggregate capital measures that are significantly less than actual book or minimum regulatory capital requirements. The gap is expected to close a bit under Basel II (once the floors are removed). However, a number of key differences between the measurement approaches will continue to show lower levels of economic capital measures relative to book or regulatory capital – primarily due to limitations in capital models for estimating strategic and business risks.
Exhibit 18
The survey found that substantial progress still needs to be made by many institutions to achieve overall Basel II preparedness. Roughly half the institutions reported that they had completed more than half the necessary work to comply with Pillar 2 (supervisory review process), and only about one-third had done so for Pillar 3 (market discipline). (See Exhibit 19.)
Exhibit 19
Many institutions also report that they have significant work to do to achieve key Basel II qualification standards – especially in the areas of validation and testing, use test requirements, risk parameter analytics and calibration and AMA modeling for operational risk. (See Exhibit 20.)
Ensuring data quality and integrity in risk management systems also continues to be a challenge. The area of loss and recovery data is farthest behind, with 21% of the executives saying data quality in this area was poor. Companies are having more success with efforts to have consistent customer identifiers across the business, managing customer and facility-level data and, especially, maintaining historical data on risk rating performance.
The focus on accurate data for Basel II purposes has also raised many larger data issues throughout organizations such as data governance, data policies and data testing. However, data quality issues will continue to garner more attention in the Basel II programs with less than half of the participating institutions considering their current state to be good or excellent.
Our experience suggests that this self-assessment by bank executives regarding the quality of risk data is too generous. Only 37% of executives reported that senior management at their institutions has risk management included in their goals. Yet, if an institution does not link the success of a major enterprise-level program, such as Basel II, to performance results, it is difficult to implement effectively.
Exhibit 20
Progress in Basel II Implementation
Not yet started Less than 50% completed More than 50% completed Completed
Some graphs do not total 100% due to rounding
0%
10%
20%
30%
40%
50%
60%
70%
80%
90%
100%
Pillar 1 (minimum capital requirement) Pillar 2 (superv isory rev iew process) Pillar 3 (market discipline)
6% 15%28%
17%
36%
43%
72%
46%
29%
5% 2% 1%
0% 10% 20% 30% 40% 50% 60% 70% 80% 90% 100%
Interest rate risk ofthe balance sheet
Market risk of thetrading book
Credit risk of thebanking book
Counterparty creditrisk of the trading book
Operational risk
Liquidity risk
Strategic risk
Legal risk
Privacy risk
Reputation risk
Sophistication of Economic Capital Approaches
26%
18%
16%
9%
7%
3%
2%
1%
1%
38%
47%
46%
34%
24%
25%
9%
14%
10%
8%
13%
13%
15%
17%
30%
17%
16%
21%
14%
21%
7%
9%
10%
6%
15%
9%
5%
8%
3%
3%
15%
14%
13%
34%
22%
42%
68%
56%
73%
68%
9%
Highly sophisticated
Is currently being developed Do not calculate for this risk type
Somewhat sophisticated Not very sophisticated
Some graphs do not total 100% due to rounding
0% 10% 20% 30% 40% 50% 60% 70% 80% 90% 100%
Credit data history forPD, LGD, EAD
Validation and testing
AMA modeling
Operational loss data
Use Test requirements
Analytics and calibration
Retail data
Risk rating systemand scorecards
Governance and controls
Reporting
External agency ratings(for Standardized Approach)
Basel II - Progress in the Key Qualification Standards
Much work needed Some work needed Little work needed Completed
Some graphs do not total 100% due to rounding
44%
43%
32%
25%
24%
20%
19%
15%
14%
14%
41%
38%
43%
41%
51%
52%
43%
42%
54%
59%
41%
10%
17%
16%
18%
23%
21%
25%
24%
22%
22%
27%
4%
2%
9%
12%
1%
4%
12%
16%
9%
5%
19%
28%
Excludes “NA - Not Applicable” answers
�6

Global Risk Management Survey: Fifth EditionAccelerating Risk Management Practices
Addressing Key RisksFinancial institutions face a wide and growing range of risks. Our survey examined how the industry is addressing several specific risk types, including: credit risk, market risk, operational risk, valuation risk and extended enterprise risk.
Looking ahead, the survey found that roughly 80% of executives said that meeting requirements for Basel II was an investment priority to improve their institution’s commercial credit risk management capabilities. Roughly two-thirds cited determining economic capital allocation and creating and aggregating consistent credit data at the corporate level as key investment priorities in this area. As information and decision tools continue to improve, institutions are conducting more granular analyses of risk and return, analyzing their risk profile by products and geographies, for example. Additional challenges include establishing or enhancing valuation capabilities for the growing range of credit products.
In managing consumer credit risk, the top investment priority was improving analytics through more sophisticated application and behavior scoring, cited by roughly three-quarters of executives. Approximately two-thirds cited as priorities achieving consistent credit data and aggregation at a corporate level, and improving the linkage of scoring and collections results to marketing, origination and measures of customer profitability.
As consumer markets tighten, this may lead to a “right sizing” of competitors. The prime markets continue to push out competitors, and the sub-prime sectors are likely to begin to do the same. This will intensify the pressure on institutions to improve their risk scoring, risk decisioning and risk/reward calculations, discourage new entrants to these markets, lead to more exits and drive improved servicing efficiency. In addition, lifecycle selection will become more popular, which will lead to improved underwriting, monitoring and collections and recovery. This new arena will also be driven by data improvements in mapping, governance and integrity that will provide the ability to enhance analytics and reporting.
Given all of these developments, the survivors will have achieved substantially higher levels of efficiency and better decision-making capabilities. Many institutions will look to use a consistent framework and more advanced approaches in expected loss analysis to help ensure the smooth adoption of Basel II.
Credit Risk The survey found that financial institutions are using a variety of tools in credit-risk mitigation and management. The most common risk mitigation methods were collateral support, used by nearly nine out of 10 institutions, and guarantee support, used by eight out of 10. (See Exhibit 21.) Other risk mitigation methods used by at least half the institutions were syndication and participation of credit exposures and on/off balance sheet netting.
In general, institutions have been moving toward the use of a wider variety of tools – and more-sophisticated techniques – for some time, and that trend appears to be continuing. One-quarter or more of executives said that their companies were planning to use macro hedges, asset securitization vehicles, index or basket credit default swaps and credit spread options to help manage, mitigate and improve the risk/return profile from a credit risk perspective.
The rapid rise in traded credit products, such as credit default swaps, has created additional risk management challenges. Financial institutions need to understand the risks associated with these instruments and their drivers, value them accurately and understand how these risks may interact with other risks the institutions faces.
Exhibit 21
0% 10% 20% 30% 40% 50% 60% 70% 80% 90% 100%
Credit Risk Mitigation Methods
Extensively used
Some graphs do not total 100% due to rounding
Somewhat used Plan to use Do not plan to use
Collateral
Guarantees
Syndication and participation
On/off-balance sheet netting
Asset securitization vehicles(e.g. CBO,CLO)
Credit insurance programs
Macro-hedges
Single-name creditdefault swaps
Index or basket creditdefault swaps
Total return swaps
Synthetic collateralizeddebt obligations
Credit spread options
Credit linked notes
62%
44%
14%
12%
7%
6%
5%
3%
3%
3%
1%
1%
26%
39%
51%
36%
28%
32%
31%
28%
16%
18%
15%
14%
26%
7%
4%
8%
16%
25%
13%
25%
24%
29%
22%
28%
26%
22%
5%
13%
28%
34%
35%
47%
38%
43%
52%
57%
54%
59%
51%
14%
�7

Global Risk Management Survey: Fifth EditionAccelerating Risk Management Practices
Market RiskThe industry’s approaches to market risk analysis have evolved to include sophisticated analytics – but not everyone is taking full advantage of these tools. For example, a significant number of institutions are not including some important asset classes in their VaR analytics programs. Most institutions use VaR analytics to cover fixed-income (85%), foreign-exchange (81%) and equity assets (79%), but coverage fell off quickly when looking at other asset classes. (See Exhibit 22.) For example, only 41% of executives reported using VaR to cover credit derivatives, and only 20% said it was used extensively for these instruments.
These results indicate that much of the industry may be lagging behind the explosive growth of credit derivatives and their attendant risks. Credit default swaps, which essentially provide insurance against default, have been especially popular. The outstanding notional value of credit default swaps reached $26 trillion by mid-2006, up from less than $4 trillion just three years earlier, according to the International Swaps and Derivatives Association (ISDA). The equity derivatives market is smaller, at $6.4 trillion in mid-2006, but has also expanded by almost one-third over the previous year, according to ISDA. Meanwhile the largest segment of the derivatives market, interest rate and currency swaps, grew by 18% over the period to total $250.8 trillion, according to ISDA.
Institutions that are using credit derivatives, but not yet employing VaR to analyze them, should develop an appropriate methodology for covering these instruments. In addition, the fact that only 21% of the institutions use VaR analytics for energy products is a troubling result, given the growth and volatility of these instruments. A primary reason for the low usage of VaR analytics for physical energy commodities is that most new physical market entrants are just beginning to understand fully the complexities and data requirements in this area.
For physical energy products, the drivers to VaR are caused by unusually large commodity price swings (such as short-term price spikes), breakdowns in correlations across commodity classes and geographic regions due to abnormal market movements, and seasonality fluctuations of the shape of the forward curve (e.g., forward curve shifts from contango to backwardation). Another reason why VaR analytics for energy have not been used more extensively is that most organizations attempt to use existing financial models and tools to measure physical energy market risks.
Assessing these risks has proven to be quite challenging given the unique physical characteristics of the various commodities. Financial organizations are leveraging other risk measurements to supplement VaR analytics such as standard deviation and locational and commodity correlation matrix scenario analysis. However, improvement of valuation and risk measures
continues to be an area of continued focus across commodity classes within the financial services industry. Additional investments that pose valuation challenges include a variety of principal investments, private equity investments and other types of illiquid assets.
Although VaR is an important tool, it is not sufficient on its own given the complexity of the market risks assumed by many financial institutions. In particular, VaR doesn’t calculate the potential impact of low-frequency events that could have a major impact. Stress testing takes account of these possible events by considering potential large moves in market prices, volatility, time required to liquidate assets, and leverage, among other factors. However, only 42% of the participating institutions reported using stress testing extensively to understand their risk profile, although an additional 34% said it is used somewhat. While it is a good sign that many institutions use stress testing to some degree, given the potentially severe impacts of a range of less likely risks, stress testing should be used more extensively.
Many institutions established their VaR methodologies after the 1996 introduction of the Basel Market Risk Amendment, which allowed the use of internal VaR models for market risk regulatory capital requirements. Since then, institutions have added coverage for additional products and made some patchwork enhancements. Some institutions are assessing and moving to new VaR applications that leverage advances in computing power since the original VaR calculation engines were implemented. These new applications provide greater calculation performance through more timely calculations such as “on demand” intra-day VaR results, whereas the original VaR implementations generally provided only end-of-day reporting, for some through an overnight batch process.
Exhibit 22
0% 10% 20% 30% 40% 50% 60% 70% 80% 90% 100%
Foreign exchange
Fixed income
Equity
Asset-backed securities (MBS,CMOs, CBOs, CLOs and CDOs)
Structured products
Commodity
Credit derivatives
Energy
Catastrophe or other eventdriven instruments
Market Risk VaR Analytics Coverage
Extensively covered Somewhat covered Plan to cover in future Do not plan to cover
Some graphs do not total 100% due to rounding
3%
16%
20%
30%
32%
62%
64%
71%
8%
5%
21%
8%
23%
27%
15%
17%
14%
15%
10%
24%
11%
25%
23%
11%
6%
6%
74%
69%
35%
54%
22%
18%
13%
14%
9%
27%
�8

Global Risk Management Survey: Fifth EditionAccelerating Risk Management Practices
Operational RiskTwo years ago, many financial institutions were still in the beginning stages of implementing more rigorous operational risk management processes. The current survey found that the industry has made progress – driven largely by Basel II – but overall results remain mixed. For example, 69% of the executives said their firms had substantially or fully implemented the ability to identify operational risk types, while 56% said they had done so in the areas of documenting processes and controls and 52% in data gathering. (See Exhibit 23.) Of course, while this indicates progress, the fact remains that one-third to one-half of firms have not implemented these capabilities. In addition, less than one-third said their organizations had created metrics for monitoring each type of operational risk or developed methodologies to quantify these risks.
Exhibit 23
Executives cited a variety of drivers for their operational risk management implementations. The most common motivation was the need to respond to regulatory activity, such as Basel II, which was rated as extremely or very important by 80% of executives. This is consistent with our observations that the Basel II regulations represent a paradigm shift for operational risk, specifically in the area of operational risk measurement. (In addition to the banking industry, Basel II is continuing to inform and guide other industries such as insurance through the similar operational risk requirements being established for Solvency II.) Other motivations for operational risk management initiatives that were rated as extremely or very important by significant percentages of executives were to support ERM initiatives (66%), in response to a request by senior management or risk management leadership (56%) and due to loss events (55%).
Although implementation progress was mixed, some institutions appear to be seeing some results from their efforts. When asked how capable their operational risk management systems were in key areas, about one-quarter of executives said they were very capable in reporting and data gathering, and more than two-thirds said they were at least somewhat capable in those areas. Only one-half of executives rated their institutions highly and somewhat capable regarding exposure calculations and scenario model building. (See Exhibit 24.)
These results are consistent with our experience since many institutions have been engaged in operational risk loss data collection activities for years due to the need to build historical databases, whereas the scenario model building has only more recently been a challenge to address.
Exhibit 24
In creating operational risk management functions, most firms are either taking a centralized approach (51%) or using a mix of centralization and decentralization (33%). The tendency toward centralization is not surprising since operational risk is by nature a broad arena that can affect virtually any part of an institution, making isolated or fragmented efforts largely ineffective. Similarly, the tools used to manage and measure operational risks – like the underlying risks themselves – are also varied. However, the tools that are used most widely are those that support Basel II readiness, such as risk and control self-assessment techniques (73%), the creation of an internal loss event database (71%) and risk mapping (70%).
Many people consider operational risk to be in its infancy and especially the measurement of operational risk. Operational risk may perhaps be in a similar state to where market and credit risk were a decade or more ago. At that time, techniques like VaR were being rolled out more widely for market risk. Due to some of the unique challenges in measuring and managing operational risk, we expect this to be an area of continuing focus and development for some time. Firms are actively working on the methodology and data issues associated with operational risk measurement. Additional questions and challenges remain regarding scenario analysis, usefulness and integration of loss data driven approaches into proactive risk management and the right organizational level of analysis e.g., at the enterprise level or different business unit levels.
0% 10% 20% 30% 40% 50% 60% 70% 80% 90% 100%
Identifying risk types
Gathering relevant data
Standardizing documentationof processes and controls
Creating metrics for monitoringeach type of operational risk
Developing methodologiesto quantify risks
Progress Implementing Operational Risk Management
Fully implemented Substantially implemented Partially implemented Not implemented
Some graphs do not total 100% due to rounding
42%
21%
18%
10%
27%
31%
38%
20%
20%
27%
38%
33%
40%
36%
5%
10%
11%
29%
33%
11%
0% 10% 20% 30% 40% 50% 60% 70% 80% 90% 100%
Data gathering
Reporting
Scenario andmodel building
Exposure calculations
Capability of Operational Risk System
Very capable Somewhat capable Not too capable Do not have functionality
Some graphs do not total 100% due to rounding
12%
13%
24%
45%
34%
45%
46%
20%
28%
18%
14%
24%
26%
14%
14%26%
Excludes “Not implementing operational risk management” answers
�9

Global Risk Management Survey: Fifth EditionAccelerating Risk Management Practices
Our belief is that ultimately more rigorous operational risk management will become a commonly accepted and practiced capability within the financial services industry. In addition to the drivers mentioned in the survey results, we see two emerging trends that may significantly influence the importance of operational risk management in the near future:
One trend is the growing recognition that there are significant benefits associated with the need for companies to integrate multiple risk frameworks such as Sarbanes-Oxley, regulatory compliance, compliance with internal policies and procedures, IT risk, risk inherent in business processes and HR risk.
A second trend is the growing sophistication of operational risk management technology. Technology vendors are advancing their tools to broaden their applicability into “enterprise solutions” and leveraging functionality to incorporate a variety of different requirements such as risk cataloguing, controls testing, risk and control self assessments, key risk indicators, loss event recording and data warehousing, risk and capital modeling and risk dashboards. These tools will play a significant role in empowering the operational risk management process.
Valuation RiskThe investment landscape has become far more varied, with financial institutions now having investment positions in instruments ranging from credit derivatives to private equity to real estate. Among the institutions surveyed, 82% used derivatives, 63% used private equity and more than half use collateralized debt obligations (CDOs) and mortgage-backed securities (MBS).
The proliferation of these investment instruments, coupled with their complexity and the fact that many are illiquid, poses significant challenges in establishing fair valuation. For example, 63% of executives considered the valuation of derivatives to pose a high or medium risk to their institutions, while 60% said the same about collateralized debt obligations and 55% gave this rating to real estate funds. (See Exhibit 25.)
In addition, many executives considered private equity investments as posing significant valuation risk. Financial institutions have increased their private equity investments significantly over the last several years, as they have sought to generate greater returns. With most private equity investments being inherently illiquid and difficult to value, 53% of executives said they pose a high or medium valuation risk.
In the United States, the Statement of Financial Accounting Standards No. 157: Fair Value Measurements, has established new standards for valuation, including enhanced disclosure requirements for illiquid and model-priced instruments. Due to the greater transparency and other requirements established by this standard and by other industry guidance, many firms are also increasing their controls over valuation risks. One key
•
•
valuation control that many institutions are establishing is a robust independent validation program to provide assurance on models used for valuation and risk measurement. Institutions are also establishing valuation policies and procedures, independent price verification and model oversight and governance structures as additional valuation risk management and control techniques.
Exhibit 25
Extended Enterprise RiskOutsourcing operations to third-party providers in other countries is now a widely-accepted operational strategy in the financial services industry as institutions look for ways to reduce costs while maintaining service quality. But introducing a third party into the equation – especially one located overseas – naturally introduces new types of risk and makes risk management more complex. Therefore, the risk survey looked at the industry’s risk management experience with “offshoring,” meaning “global sourcing outside of the region of an organization’s home country,” and with “near-shoring,” meaning “sourcing in the region of an organization’s home country.”
Executives seemed to be alert to the risks associated with the extended enterprise. In regard to offshoring and near-shoring, IT was considered to be a high or medium risk by 69% of executives and operational risk by 60%. (See Exhibit 26.) This is to be expected given the intrinsic complications of managing operations across borders due to different legal and regulatory systems and local cultures. Reputation, regulatory and human capital risk were each considered a high or medium risk by more than half of the executives.
While these concerns are real, they should also be put into perspective. Only roughly one-third of executives considered IT, and one-fifth or fewer considered other issues, as high risk in their institution’s extended enterprise operations. To manage risks in this environment, firms are most commonly using such techniques as written contracts, formal vendor-selection processes, regular internal audits, documented vendor-oversight policies and disaster recovery planning.
One area of special concern emerged from the survey: only 16% of the executives said their risk management processes were well integrated into their extended enterprise operations.
0% 10% 20% 30% 40% 50% 60% 70% 80% 90% 100%
Private equity
Derivatives
Collateralized debt obligations
Real estate funds
Mortgage-backed securities
Real estate investment trusts
Valuation Risk Exposure
High risk Medium risk Low risk
Some graphs do not total 100% due to rounding
4%
7%
10%
11%
16%
37%
41%
45%
48%
51%
36%
59%
52%
45%
40%
38%
48%
12%
�0

Global Risk Management Survey: Fifth EditionAccelerating Risk Management Practices
Thirty-seven percent said they were not integrated at all, with the remainder reporting only partial integration. Without that integration, of course, institutions have limited visibility and control over these risks and how they are being managed in the outsourced process.
A significant amount of work remains to be done in some institutions to bring the risk management of the extended enterprise in line with their overall ERM program and ensure consistency in how similar risks, such as operational risks, are managed by in-house operations. Risks from outsourcing are not just theoretical or necessarily small. Several financial firms have experienced data-security-related breaches in which outsourcing vendors or their personnel have either unwittingly lost control over or, in some cases, even sold customer data. This not only results in losses from required recovery actions, but also the potential for substantial reputational risks.
Exhibit 26
0% 10% 20% 30% 40% 50% 60% 70% 80% 90% 100%
Operational risk
IT risk
Reputation risk
Regulatory (compliance) risk
Human capital risk
Privacy risk
Geopolitical risk
Risks Associated with Extended Enterprise Solutions
High risk Medium risk Low risk
Some graphs do not total 100% due to rounding
3%
10%
10%
18%
22%
32%
17%
31%
42%
36%
35%
38%
37%
80%
59%
48%
47%
46%
40%
30%
18%
Exhibit 26
��
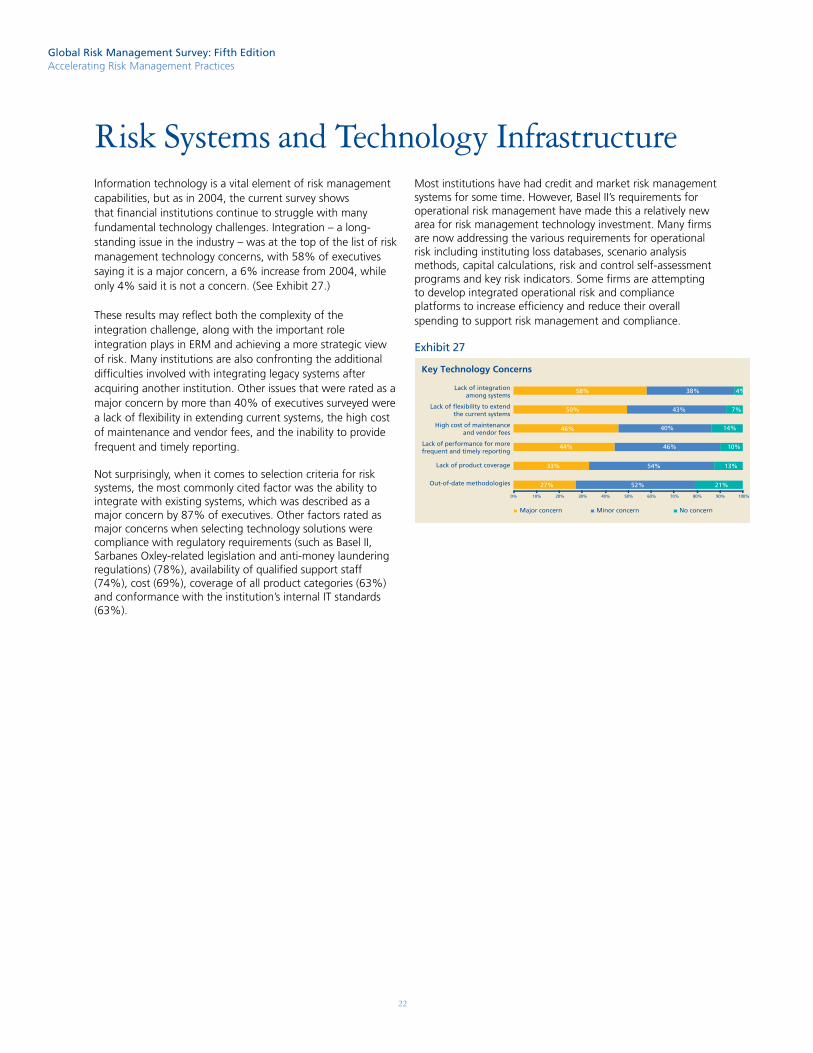
Global Risk Management Survey: Fifth EditionAccelerating Risk Management Practices
Risk Systems and Technology Infrastructure
0% 10% 20% 30% 40% 50% 60% 70% 80% 90% 100%
Lack of integrationamong systems
Lack of flexibility to extendthe current systems
High cost of maintenanceand vendor fees
Lack of performance for morefrequent and timely reporting
Lack of product coverage
Out-of-date methodologies
Key Technology Concerns
Major concern Minor concern No concern
27%
33%
44%
50%
58%
52%
54%
46%
40%
43%
38%
21%
13%
10%
14%
7%
4%
46%
Information technology is a vital element of risk management capabilities, but as in 2004, the current survey shows that financial institutions continue to struggle with many fundamental technology challenges. Integration – a long-standing issue in the industry – was at the top of the list of risk management technology concerns, with 58% of executives saying it is a major concern, a 6% increase from 2004, while only 4% said it is not a concern. (See Exhibit 27.)
These results may reflect both the complexity of the integration challenge, along with the important role integration plays in ERM and achieving a more strategic view of risk. Many institutions are also confronting the additional difficulties involved with integrating legacy systems after acquiring another institution. Other issues that were rated as a major concern by more than 40% of executives surveyed were a lack of flexibility in extending current systems, the high cost of maintenance and vendor fees, and the inability to provide frequent and timely reporting.
Not surprisingly, when it comes to selection criteria for risk systems, the most commonly cited factor was the ability to integrate with existing systems, which was described as a major concern by 87% of executives. Other factors rated as major concerns when selecting technology solutions were compliance with regulatory requirements (such as Basel II, Sarbanes Oxley-related legislation and anti-money laundering regulations) (78%), availability of qualified support staff (74%), cost (69%), coverage of all product categories (63%) and conformance with the institution’s internal IT standards (63%).
Most institutions have had credit and market risk management systems for some time. However, Basel II’s requirements for operational risk management have made this a relatively new area for risk management technology investment. Many firms are now addressing the various requirements for operational risk including instituting loss databases, scenario analysis methods, capital calculations, risk and control self-assessment programs and key risk indicators. Some firms are attempting to develop integrated operational risk and compliance platforms to increase efficiency and reduce their overall spending to support risk management and compliance.
Exhibit 27
��

Global Risk Management Survey: Fifth EditionAccelerating Risk Management Practices
The Road AheadOur Global Risk Management Survey: Fifth Edition provides a comprehensive overview of the state of risk management in the financial services industry. Just as important, it provides guideposts for understanding how risk management will continue to evolve in the coming years and where institutions can best focus their efforts.
to the requirements from Basel II. Still others will need to develop more integrated programs to address key issues from emerging markets, hedge funds, new products, conflicts management and regulatory requirements.
Regardless of the areas of focus within risk management initiatives, it is clear that all financial institutions will be pressured to reduce costs. As a result, they will look at both the efficiency and effectiveness of their major risk management – and ERM – programs. We encourage financial institutions to address these cost pressures by developing more integrated risk and compliance programs, which will save money by creating a more efficient solution and provide better and more timely risk management information though an integrated capability.
Progress within the industry has been real, yet the survey makes clear that many institutions have much more to accomplish to truly achieve a comprehensive approach that actively identifies, assesses and manages the full range of risks they face. The trend toward a strategic approach to risk management is likely to continue – and the institutions that take a leading role in this evolution will be in a position to use risk management as a key competitive tool.
Risk is clearly assuming greater visibility in financial institutions and managing risk is being given a higher priority. In response, institutions are continuing to formalize risk management and to move responsibility for risk management to the highest levels of the organization. The CRO position has been widely adopted across the industry to provide an enterprise-wide view of risk management and the board provides risk management oversight.
Yet, most institutions have not implemented ERM programs and few of those that do have ERM programs have quantified their costs and benefits. Most institutions have done a much better job of managing traditional risks, like market and credit risk, than of addressing less traditional areas such as operational, strategic, reputation and privacy risk.
Looking ahead, we expect financial institutions will focus on a number of different areas within their risk management initiatives. Some institutions will begin or advance their ERM program development efforts. Others may include additional risk types within their ERM program – particularly the less traditional and emerging risks where risk methodologies are not as developed and the risks themselves less understood. Many will continue to develop more sophisticated approaches to measure and manage credit and operational risk due
�3
Industry LeadershipJack RibeiroManaging Partner Global Financial Services IndustryDeloitte & Touche LLP+1 (212) 436 [email protected]
Owen RyanManaging PartnerCapital MarketsDeloitte & Touche LLP+1 (212) 436 [email protected]
Survey EditorEdward HidaPartner, Risk Advisory Service Line LeaderCapital MarketsDeloitte & Touche LLP+1 (212) 436 [email protected]
ContributorsDolores Atallo-HazelgreenFirm DirectorCapital MarketsDeloitte & Touche LLP+1 (212) 436 [email protected]
Scott BaretPartnerCapital MarketsDeloitte & Touche LLP +1 (212) 436 [email protected]
J.H. CaldwellPartnerCapital MarketsDeloitte & Touche LLP+1 (312) 486 [email protected]
Carl GrothFirm DirectorCapital MarketsDeloitte & Touche LLP+1 (212) 436 [email protected]
Alok SinhaPrincipalCapital MarketsDeloitte & Touche LLP+1 (415) 783 [email protected]
Acknowledgements
This report is a result of a team effort that spanned our global financial services industry practice. A special thanks to DeloitteDEX for administering the survey and to Bayer Consulting for assistance. In addition, the following individuals conducted analysis and provided coordination support:
Maria BelianinaDeloitte & Touche LLP
Antonio CoutinhoDeloitte Touche Tohmatsu, Brazil
Mary Everette GlennDeloitte Services LP
Thaddeus MalitDeloitte & Touche LLP
Sanjeev MankotiaDeloitte & Touche LLP
Ahmet YetisDeloitte & Touche LLP
Global Risk Management Survey: Fifth EditionAccelerating Risk Management Practices
�8

�9
Global Risk Management Survey: Fifth EditionAccelerating Risk Management Practices
Australia
Hayden LlewellynPartnerDeloitte Touche Tohmatsu+61 (03) 9208 [email protected]
Debra RobertsonPartnerDeloitte Touche Tohmatsu+61 (03) 9208 [email protected]
Gerry SchipperPartnerDeloitte Touche Tohmatsu+61 (03) 9208 [email protected]
Austria
Dominik DammExecutive ManagerDeloitte FSI Consulting GmbH+43 (1) 53700 [email protected]
Brazil
Rodrigo Mendes DuartePartnerDeloitte Touche Tohmatsu+55 (11) 5186 [email protected]
Ives Pereira MullerPartnerDeloitte Touche Tohmatsu+55 (11) 5186 [email protected]
Canada
Leon BloomPartnerDeloitte & Touche+1 (416) 601 [email protected]
Jay McMahanAssociate PartnerDeloitte & Touche+1 (416) 874 [email protected]
Caribbean
Glen WigneyDirectorDeloitte & Touche+1 (345) 814 [email protected]
Central Europe
Petr BrichDirectorDeloitte Central Europe+420 (246) 042 [email protected]
Michael JenningsPartnerDeloitte Central Europe+420 (246) 042 [email protected]
Chile
Pablo HerreraPartnerDeloitte & Touche+56 (2) [email protected]
China/Hong Kong
Wade DeffenbaughPartnerDeloitte Touche Tohmatsu+(852) 2852 [email protected]
Alvin Chung Hon NgDirectorDeloitte Touche Tohmatsu CPA Ltd+ 86 (10) 8520 [email protected]
Maria XuerebPartnerDeloitte Touche Tohmatsu+(852) 2852 [email protected]
Colombia
Gabriel J LópezPartnerDeloitte & Touche Ltda.+57 (4) [email protected]
Cyprus
Nicos CharalambousPartnerDeloitte & Touche+357 (25) [email protected]
France
Francois ArbeyPartnerDeloitte Touche Tohmatsu+33 (1) 55 61 63 [email protected]
Philippe DeniauPartnerDeloitte Touche Tohmatsu+33 (1) 40 88 22 [email protected]
Marc Van CaeneghemPartnerDeloitte Touche Tohmatsu+33 (1) 55 61 65 [email protected]
Germany
Joerg EngelsPartnerDeloitte & Touche GmbH+49 (211) 8772 [email protected]
Joachim SchauffPartnerDeloitte & Touche GmbH+49 (211) 8772 [email protected]
Greece
Nicos SofianosPartnerDeloitte & Touche Hadjipavlou Sofianos & Cambanis SA+30 (210) 678 [email protected]
India
Vishwanath Prasad SinghDirectorDeloitte Haskins & Sells+91 (22) 5667 [email protected]
Indonesia
Riniek WinarsihPartnerDeloitte Touche Tohmatsu+62 (21) 231 [email protected]
Italy
Pierluigi BrienzaPartnerDeloitte Consulting S.p.A.+39 (02) [email protected]
Paolo GianturcoPartnerDeloitte Consulting S.p.A.+39 (02) [email protected]
Japan
Shigeru FurusawaPartnerTohmatsu & Co.+81 (3) 6213 [email protected]
Yoriko GotoPartnerTohmatsu & Co. +81 (3) 6213 [email protected]
David PulidoDirectorDeloitte & Touche LLP+81 (3) 6213 [email protected]
Mexico
Alfonso GomezDirectorDeloitte & Touche+52 (55) 508 6176 [email protected]
Netherlands
Hinko van Beek PartnerDeloitte Accountants B.V. +31 (61) 258 [email protected]
Hans van LeeuwenPartnerDeloitte Financial Advisory Services B.V.+31 (62) 078 [email protected]
Duco WansinkPartnerDeloitte & Touche+31 (65) 204 [email protected]
Deloitte Touche Tohmatsu Member Firm Global Risk Management Contacts

New Zealand
Richard KirklandDirectorDeloitte Touche Tohmatsu+64 (4) 470 [email protected]
Rodger MurphyPartnerDeloitte Touche Tohmatsu+64 (9) 303 [email protected]
Ian PerryPartnerDeloitte Touche Tohmatsu+64 (4) 495 [email protected]
Russia
Joanna DeclercqDirectorDeloitte & Touche CIS+7 (495) 787 0600 Ext. [email protected]
Andrei PospelovDirector Deloitte & Touche CIS+7 (495) 787 0600
Singapore
David ChewDirectorDeloitte & Touche+65 (621) 6 [email protected]
Prakash DesaiPartnerDeloitte & Touche+65 (653) 0 [email protected]
South Africa
Wayne SavagePartnerDeloitte+27 (11) 209 [email protected]
Casper TroskiePartnerDeloitte+27 (11) 806 [email protected]
South Korea
Jung In LeePartnerDeloitte Anjin LLC+82 (2) 6676 [email protected]
Jeong Kee Kim DirectorDeloitte Anjin LLC+82 (2) 6676 1987 [email protected]
Spain
Rafael Campo BernadPartnerDeloitte S.L.+34 (915) 145000 Ext. [email protected]
Fernando RuizPartnerDeloitte S.L.+34 (915) [email protected]
Switzerland
Philip GöethPartnerDeloitte AG+41 (44) 421 62 [email protected]
Sandro SchmidSenior ManagerDeloitte AG+41 (44) 421 62 [email protected]
Taiwan
Thomas WanPartnerDeloitte & Touche+886 (2) 25459988 Ext. [email protected]
Thailand
Russell ToyPartnerDeloitte Touche Tohmatsu Jaiyos Co. Ltd.+66 (2) 676 5700 [email protected]
Turkey
Murat AytoguPartnerDRT Bagımsız Denetim ve SMM A.S.+90 (212) 366 60 [email protected]
Hasan KilicPartnerDRT Bagımsız Denetim ve SMM A.S. +90 (212) 317 64 [email protected]
UK
William HigginsPartnerDeloitte & Touche+44 (20) 7303 [email protected]
Richard HoustonPartnerDeloitte MCS Limited+44 (20) 7007 [email protected]
Julian LeakePartnerDeloitte MCS Limited+44 (20) 7007 [email protected]
Vishal VediDirectorDeloitte & Touche+44 (20) 7303 [email protected]
Global Risk Management Survey: Fifth EditionAccelerating Risk Management Practices
30

3�
This publication contains general information only and Deloitte & Touche LLP is not, by means of this publication, rendering accounting, business, financial, investment, legal, tax, or other professional advice or services. This publication is not a substitute for such professional advice or services, nor should it be used as a basis for any decision or action that may affect your business. Before making any decision or taking any action that may affect your business, you should consult a qualified professional advisor.
Deloitte & Touche LLP, its affiliates and related entities shall not be responsible for any loss sustained by any person who relies on this publication.

About Deloitte Deloitte refers to one or more of Deloitte Touche Tohmatsu, a Swiss Verein, its member firms and their respective subsidiaries and affiliates. Deloitte Touche Tohmatsu is an organization of member firms around the world devoted to excellence in providing professional services and advice, focused on client service through a global strategy executed locally in nearly 140 countries. With access to the deep intellectual capital of approximately 135,000 people worldwide, Deloitte delivers services in four professional areas, audit, tax, consulting and financial advisory services, and serves more than 80 percent of the world’s largest companies, as well as large national enterprises, public institutions, locally important clients, and successful, fast-growing global growth companies. Services are not provided by the Deloitte Touche Tohmatsu Verein and, for regulatory and other reasons, certain member firms do not provide services in all four professional areas.
As a Swiss Verein (association), neither Deloitte Touche Tohmatsu nor any of its member firms has any liability for each other’s acts or omissions. Each of the member firms is a separate and independent legal entity operating under the names “Deloitte”, “Deloitte & Touche”, “Deloitte Touche Tohmatsu” or other related names.
In the United States, Deloitte & Touche USA LLP is the U.S. member firm of Deloitte Touche Tohmatsu and services are provided by the subsidiaries of Deloitte & Touche USA LLP (Deloitte & Touche LLP, Deloitte Consulting LLP, Deloitte Financial Advisory Services LLP, Deloitte Tax LLP, and their subsidiaries), and not by Deloitte & Touche USA LLP. The subsidiaries of the U.S. member firm are among the nation’s leading professional services firms, providing audit, tax, consulting, and financial advisory services through nearly 40,000 people in more than 90 cities. Known as employers of choice for innovative human resources programs, they are dedicated to helping their clients and their people excel. For more information, please visit the U.S. member firm’s Web site at www.deloitte.com
Copyright © 2007 Deloitte Development LLC. All rights reserved.
03/07 - Item #7103
Member ofDeloitte Touche Tohmatsu


![Risk Management (3C05/D22) Unit 3: Risk Management · 2004. 4. 29. · Risk-management planning Risk resolution [Boehm 1991] Risk monitoring Software risk management steps & techniques](https://static.fdocuments.in/doc/165x107/6122993708b35f7a264d6759/risk-management-3c05d22-unit-3-risk-2004-4-29-risk-management-planning.jpg)