GLOBAL RENEWABLE ENERGY STATUS - … · global renewable energy status launch of renewables 2015...
40
GLOBAL RENEWABLE ENERGY STATUS LAUNCH OF RENEWABLES 2015 GLOBAL STATUS REPORT Christine Lins Executive Secretary [email protected] CESC webinar Vienna, 18 June 2015
Transcript of GLOBAL RENEWABLE ENERGY STATUS - … · global renewable energy status launch of renewables 2015...
GLOBAL RENEWABLE ENERGY STATUS
LAUNCH OF RENEWABLES 2015 GLOBAL STATUS REPORT
Christine LinsExecutive [email protected]
CESC webinarVienna, 18 June 2015
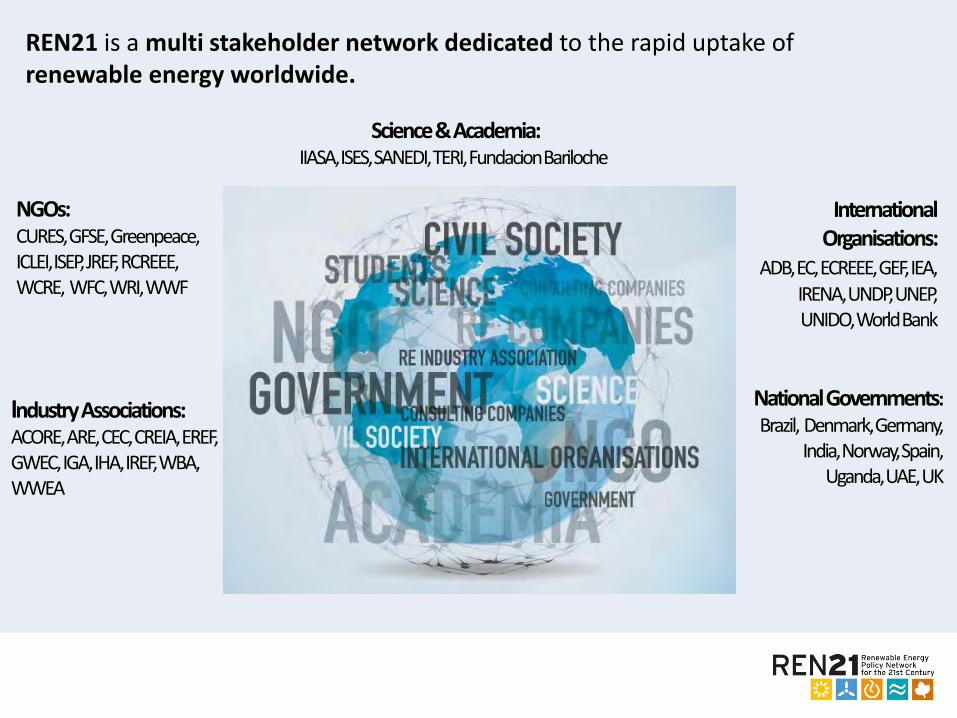
REN21 is a multi stakeholder network dedicated to the rapid uptake of renewable energy worldwide.
Industry Associations:ACORE, ARE, CEC, CREIA, EREF, GWEC, IGA, IHA, IREF, WBA, WWEA
Science & Academia:IIASA, ISES, SANEDI, TERI, FundacionBariloche
NGOs: CURES, GFSE, Greenpeace, ICLEI, ISEP, JREF, RCREEE, WCRE, WFC, WRI, WWF
International Organisations:
ADB, EC, ECREEE, GEF, IEA, IRENA, UNDP, UNEP, UNIDO, World Bank
National Governments:Brazil, Denmark, Germany,
India, Norway, Spain, Uganda, UAE, UK

Launched at Vienna Energy Forum on 18 June 2015
Network of over 500 contributors, researchers & reviewers worldwide
The report features:• Global Overview• Market & Industry Trends• Investment Flows• Policy Landscape• Distributed Renewable Energy for Energy Access• Feature: Using Renewables for Climate Change
AdaptationThe report covers:
• All renewable energy technologies• The power, heating & cooling, and transport sector• Energy Efficiency
Country data available under new REN21 RenewablesInteractive Map www.ren21.net/map
REN21 Renewables 2015 Global Status Report
www.ren21.net/gsr
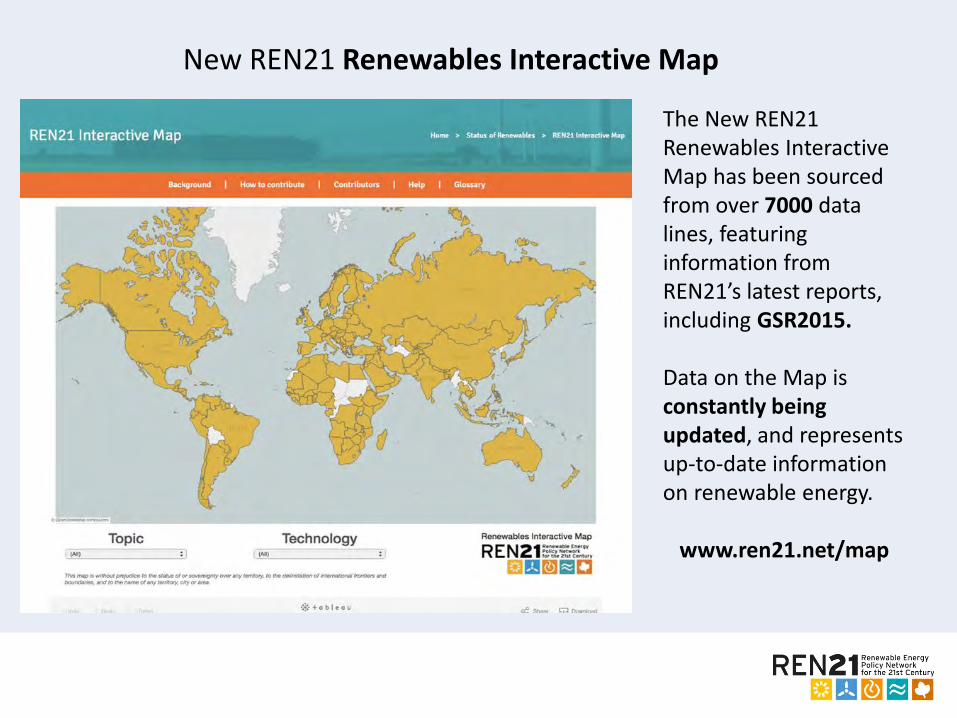
New REN21 Renewables Interactive Map
The New REN21 Renewables Interactive Map has been sourced from over 7000 data lines, featuring information from REN21’s latest reports, including GSR2015.
Data on the Map is constantly being updated, and represents up-to-date information on renewable energy.
www.ren21.net/map
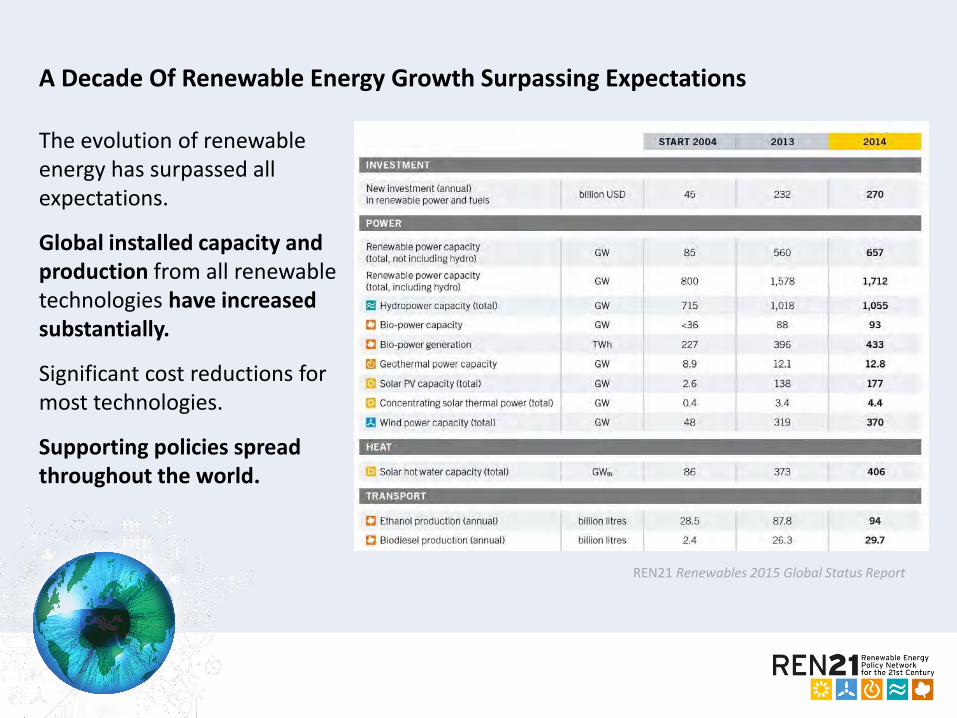
A Decade Of Renewable Energy Growth Surpassing Expectations
The evolution of renewable energy has surpassed all expectations.
Global installed capacity and production from all renewable technologies have increased substantially.
Significant cost reductions for most technologies.
Supporting policies spread throughout the world.
REN21 Renewables 2015 Global Status Report

Renewable energy provided an estimated 19.1% of global final energy consumption in 2013.
The share of modern renewable energy increased to 10.1%.
The share of traditional biomass was of 9%, same as in 2012.
Renewable Energy in the World
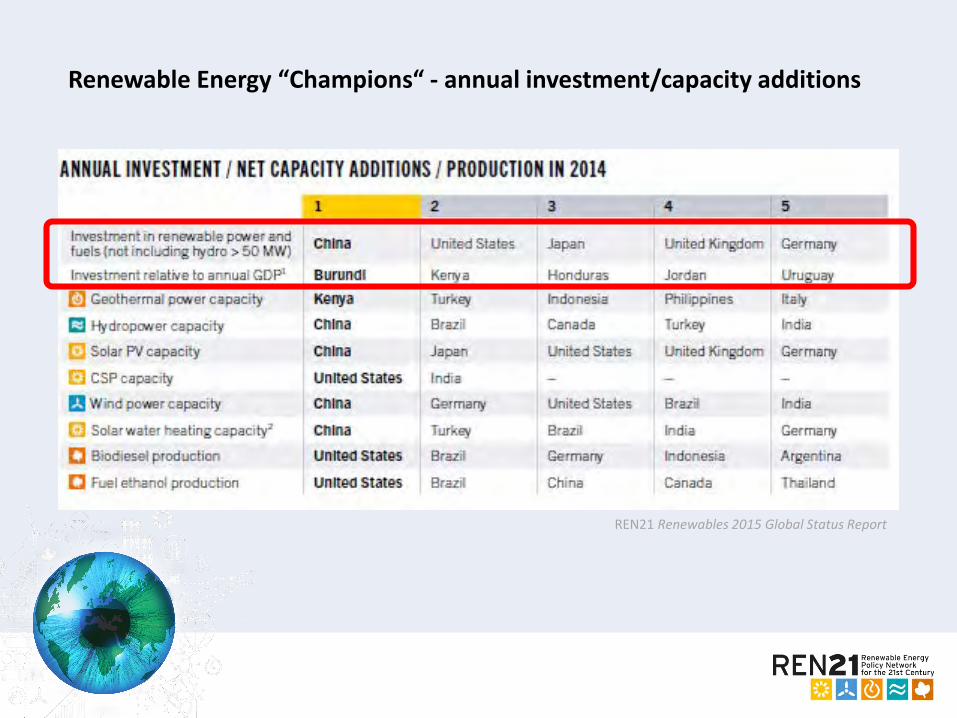
Renewable Energy “Champions“ - annual investment/capacity additions
REN21 Renewables 2015 Global Status Report
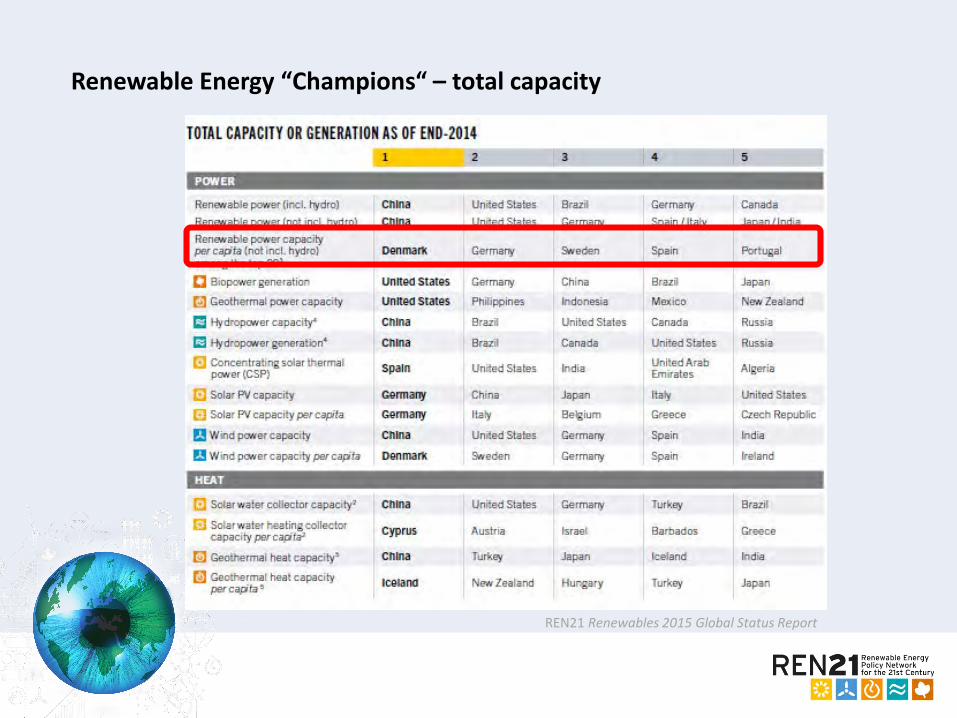
Renewable Energy “Champions“ – total capacity
REN21 Renewables 2015 Global Status Report

Power Sector
• Renewables accounted 27.7% of global power generation capacity and 22.8%of global electricity demand.
• Renewables made up for 59% of net additions to global power capacity.• Total RE power capacity: 1712 GW, an increase of more than 8.5% over 2013.

Power Sector – total renewable energy power capacity installed
BRICS lead for total RE power capacity (incl. hydro): 38% of global
capacity.
EU leads for non-hydro RE power capacity: 42% of global capacity

Heating & Cooling
Energy use for heat accounted for about half of total world final energy consumption in 2014.
Small but growing modern renewable energy share of final global heat demand: approx. 8%.
Trends:• Growing interest, although
advanced systems represent a small fraction of the global market
• Slow growth but vast potential—key for the energy transition
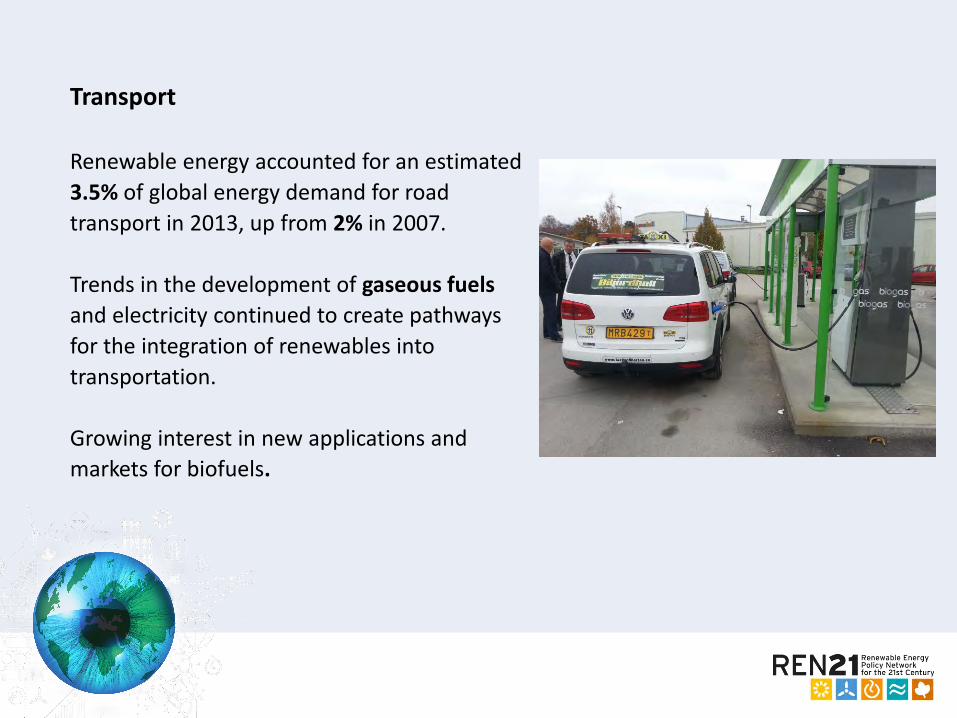
Transport
Renewable energy accounted for an estimated
3.5% of global energy demand for road
transport in 2013, up from 2% in 2007.
Trends in the development of gaseous fuels
and electricity continued to create pathways
for the integration of renewables into
transportation.
Growing interest in new applications and
markets for biofuels.

Hydropower - global capacity
Total global hydropower capacity:
1,055 GW
37GW of new capacity were
commissioned in 2014, presenting a
3.6% increase
Steady industry growth, driven by:
China’s expansion
modernisation of ageing
hydropower facilities.
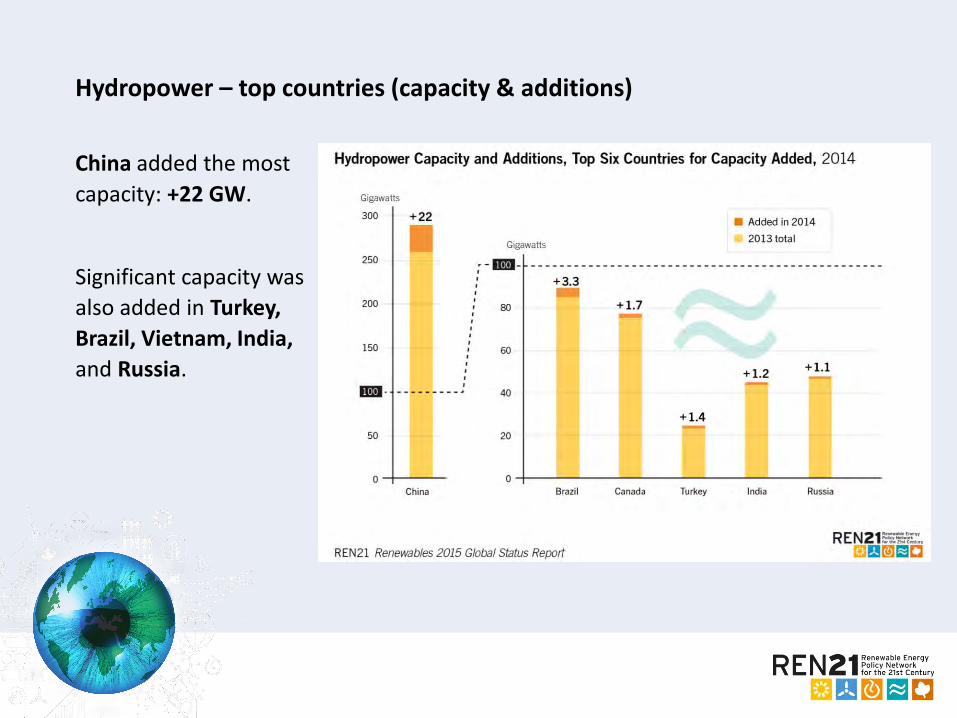
Hydropower – top countries (capacity & additions)
China added the most
capacity: +22 GW.
Significant capacity was
also added in Turkey,
Brazil, Vietnam, India,
and Russia.

Solar Photovoltaics (PV) – total global capacity
Solar PV:
+40 GW added
Total capacity: 177 GW
More than 60% of all PV
capacity in operation
worldwide at the end of
2014 was added over the
past three years.
Asia eclipsed all other
markets, accounting for
almost 60% of global
additions.
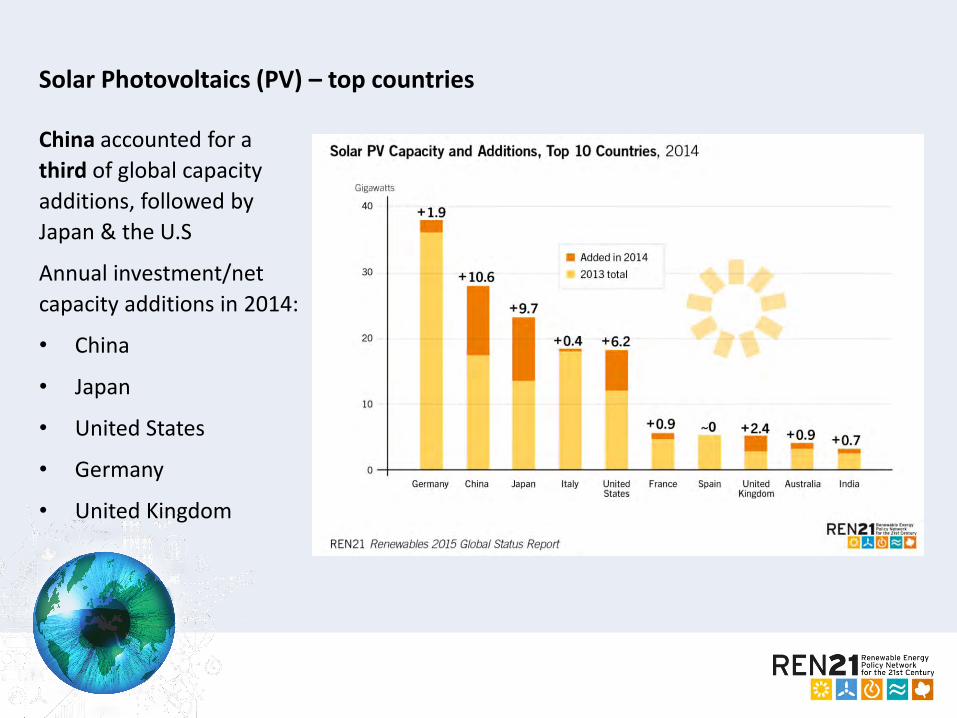
Solar Photovoltaics (PV) – top countries
China accounted for a
third of global capacity
additions, followed by
Japan & the U.S
Annual investment/net
capacity additions in 2014:
• China
• Japan
• United States
• Germany
• United Kingdom
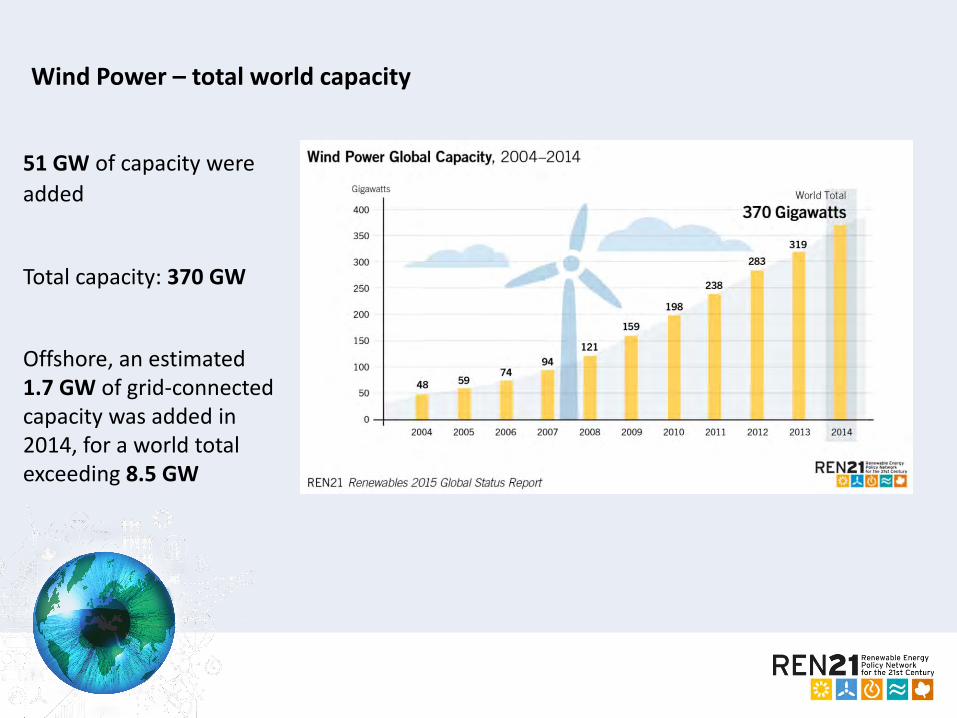
Wind Power – total world capacity
51 GW of capacity were
added
Total capacity: 370 GW
Offshore, an estimated 1.7 GW of grid-connected capacity was added in 2014, for a world total exceeding 8.5 GW
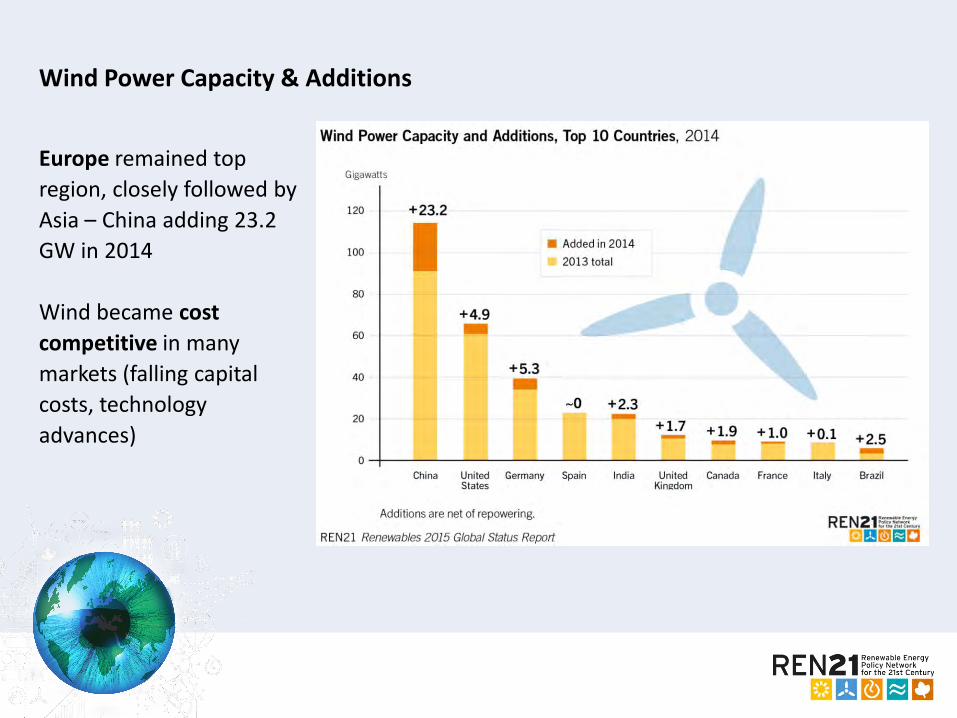
Wind Power Capacity & Additions
Europe remained top
region, closely followed by
Asia – China adding 23.2
GW in 2014
Wind became cost
competitive in many
markets (falling capital
costs, technology
advances)
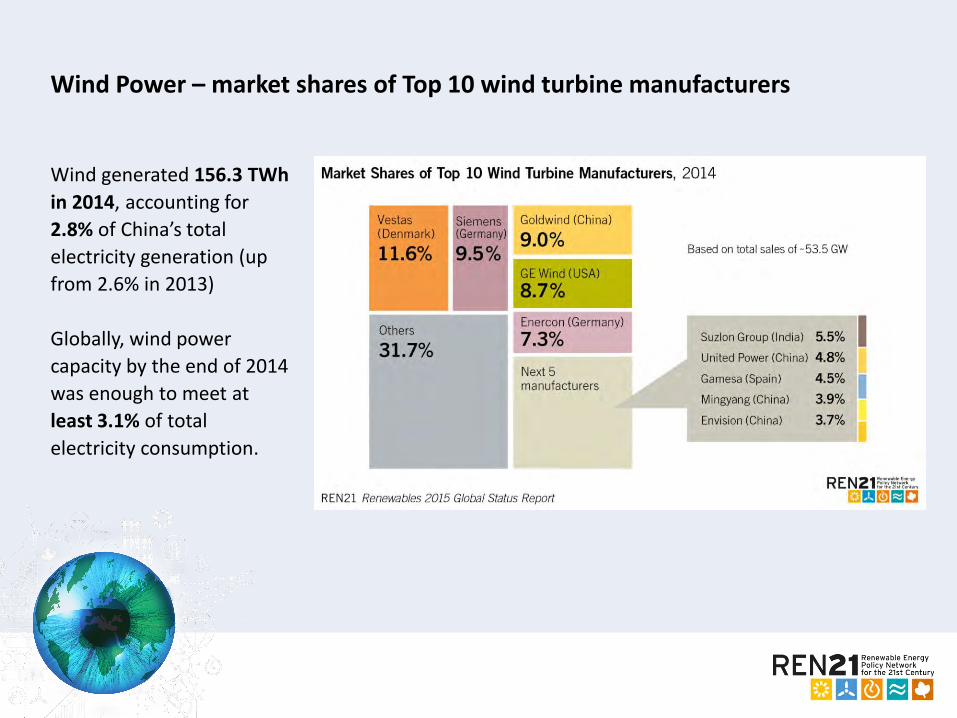
Wind Power – market shares of Top 10 wind turbine manufacturers
Wind generated 156.3 TWh
in 2014, accounting for
2.8% of China’s total
electricity generation (up
from 2.6% in 2013)
Globally, wind power
capacity by the end of 2014
was enough to meet at
least 3.1% of total
electricity consumption.

Bioenergy
Total primary energy demand from biomass was approximately 16,250 TWh
(58.5 EJ).
Biomass was used to produce an estimated 12,500 TWh (45 EJ) of heat
(addition of 9GWth).
Bio-power capacity increased by an estimated 5 GW in 2014 to a total of
approx. 93 GW.
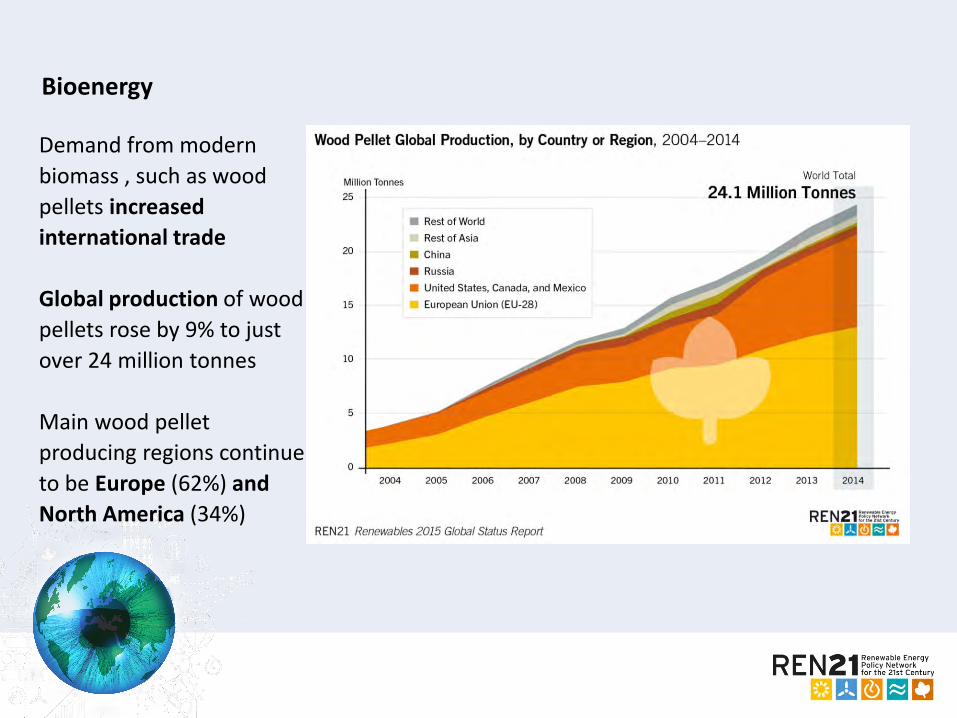
Bioenergy
Demand from modern
biomass , such as wood
pellets increased
international trade
Global production of wood
pellets rose by 9% to just
over 24 million tonnes
Main wood pellet
producing regions continue
to be Europe (62%) and
North America (34%)

Bioenergy – liquid biofuels
The top countries for total
production of biofuels were the
United States, Brazil, Germany,
China, and Argentina.
Global biofuel production
increased 8% in 2014, to a total
of 127.7 billion litres
Global investment in biofuels
production capacity continued
to fall in 2014, down 8% from
2013 and reaching a near 10-
year low of USD 5.1 billion.

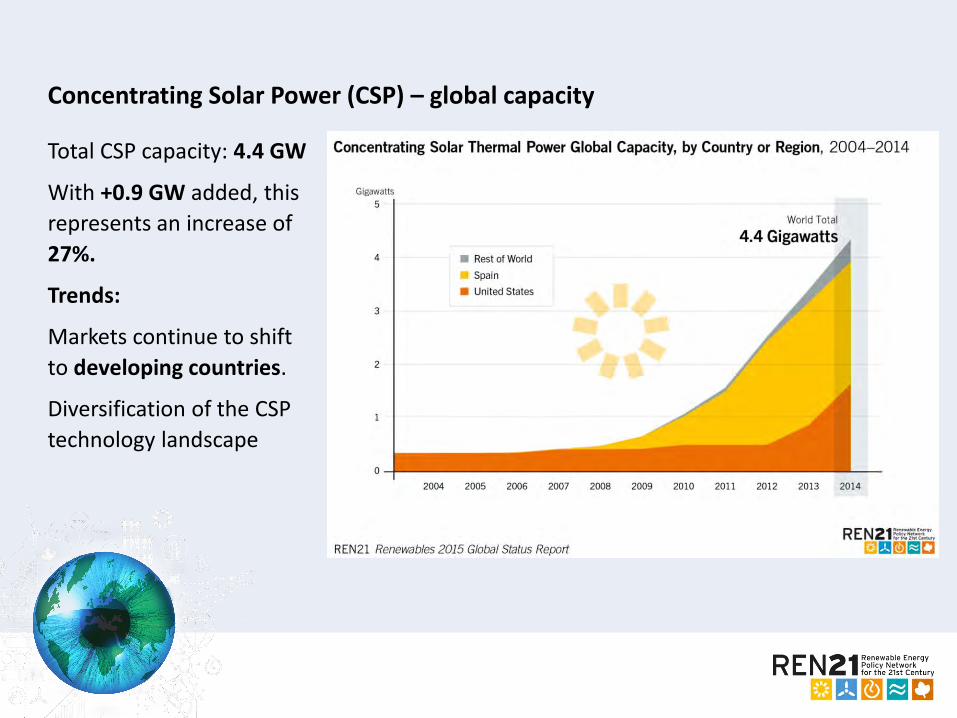
Concentrating Solar Power (CSP) – global capacity
Total CSP capacity: 4.4 GW
With +0.9 GW added, this
represents an increase of
27%.
Trends:
Markets continue to shift
to developing countries.
Diversification of the CSP
technology landscape
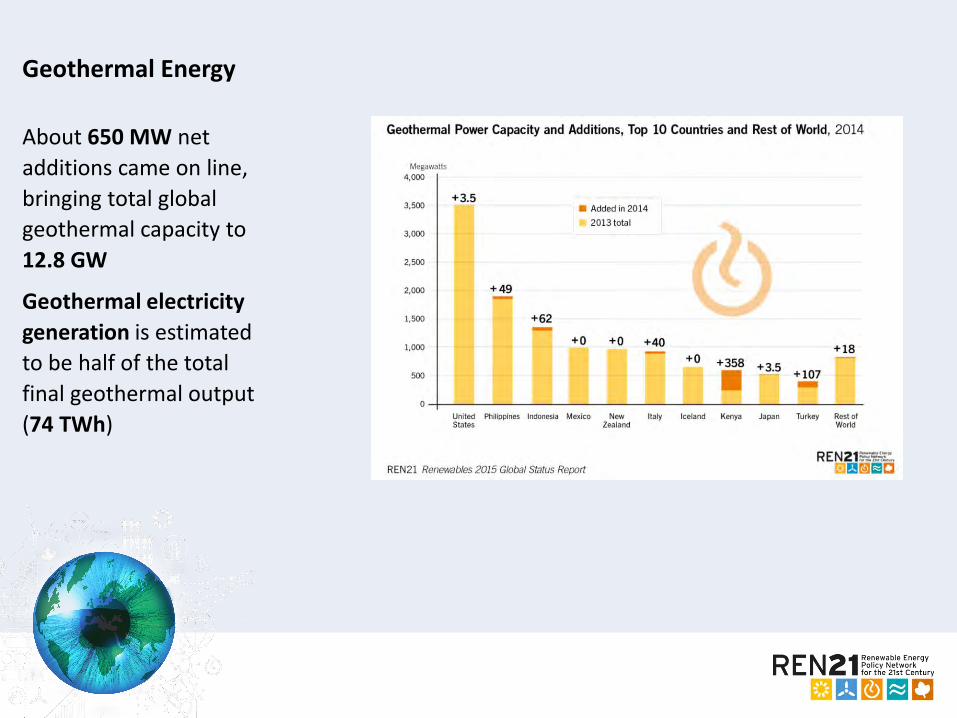
About 650 MW net
additions came on line,
bringing total global
geothermal capacity to
12.8 GW
Geothermal electricity
generation is estimated
to be half of the total
final geothermal output
(74 TWh)
Geothermal Energy
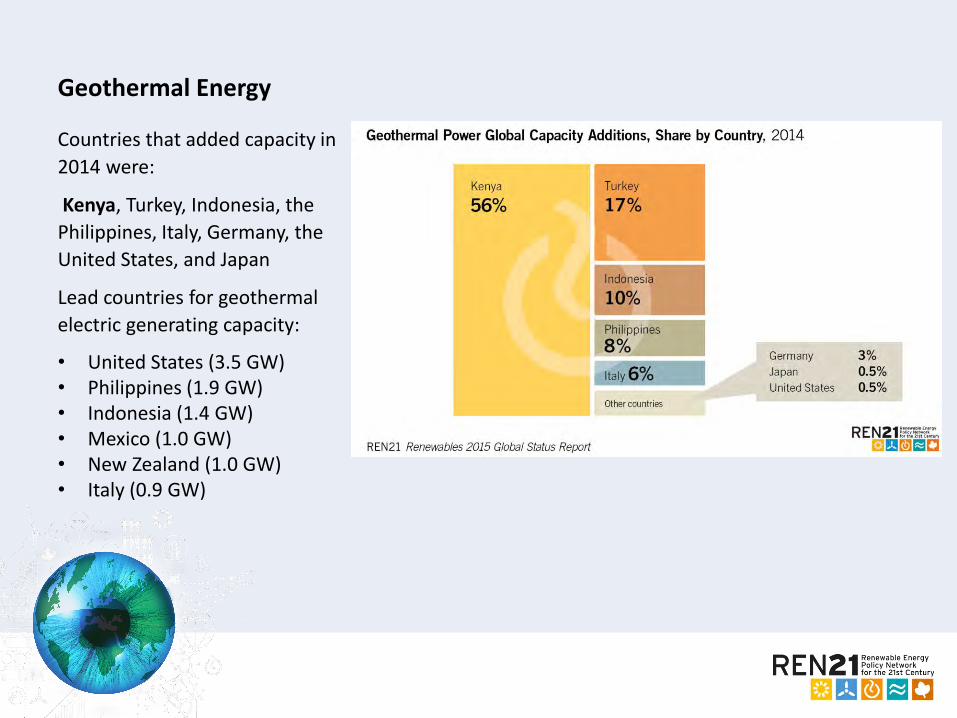
Geothermal Energy
Countries that added capacity in
2014 were:
Kenya, Turkey, Indonesia, the
Philippines, Italy, Germany, the
United States, and Japan
Lead countries for geothermal
electric generating capacity:
• United States (3.5 GW)• Philippines (1.9 GW)• Indonesia (1.4 GW)• Mexico (1.0 GW)• New Zealand (1.0 GW)• Italy (0.9 GW)
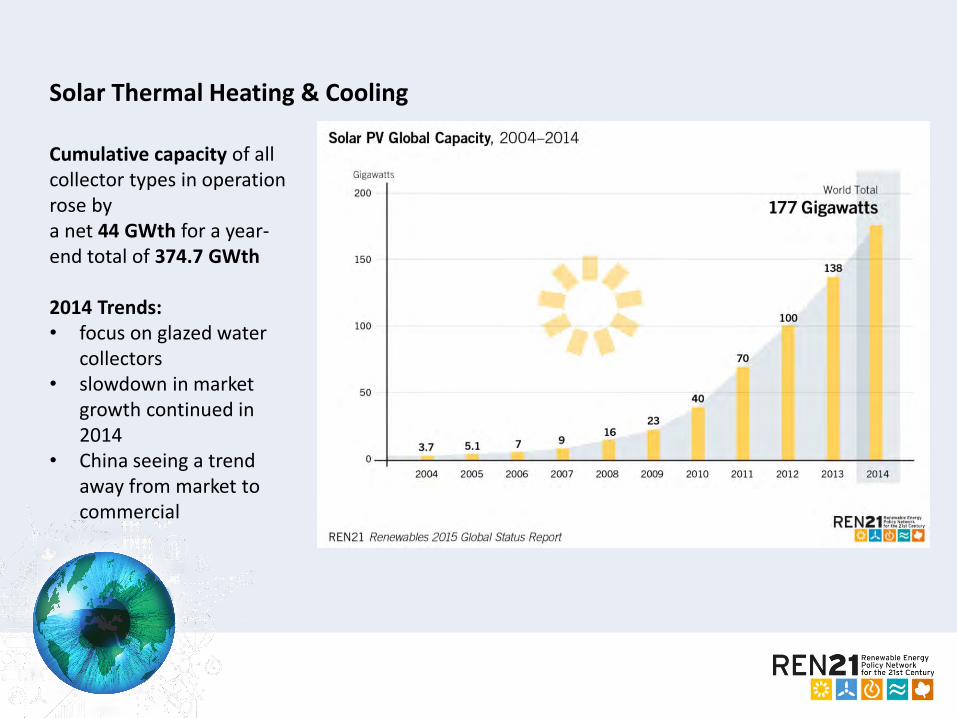
Solar Thermal Heating & Cooling
Cumulative capacity of all collector types in operation rose bya net 44 GWth for a year-end total of 374.7 GWth
2014 Trends:• focus on glazed water
collectors• slowdown in market
growth continued in 2014
• China seeing a trend away from market to commercial
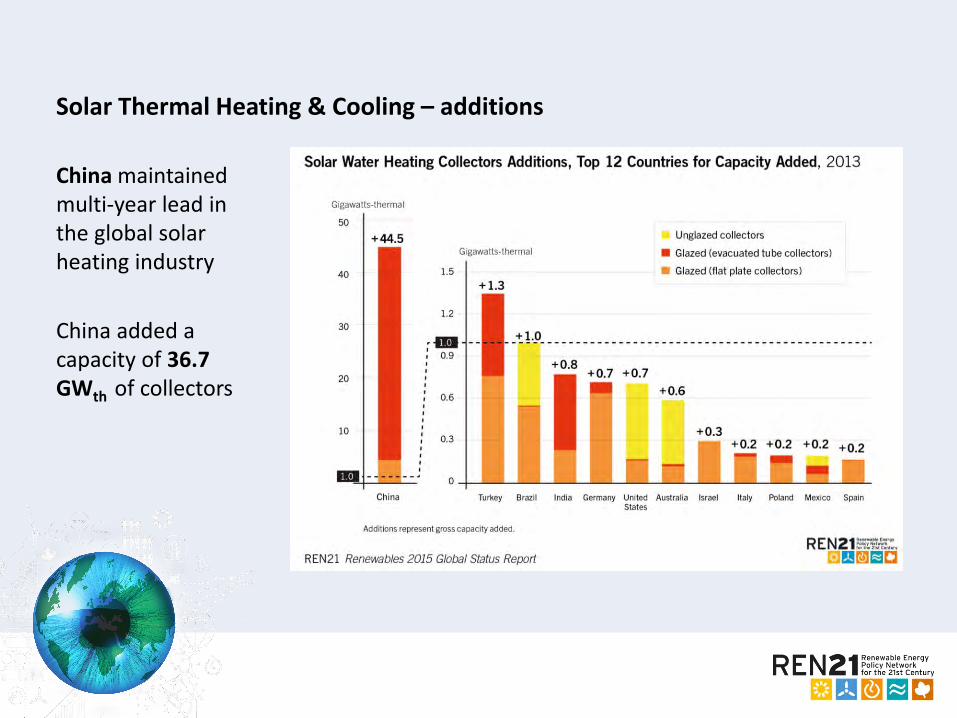
Solar Thermal Heating & Cooling – additions
China maintained multi-year lead in the global solar heating industry
China added a capacity of 36.7 GWth of collectors
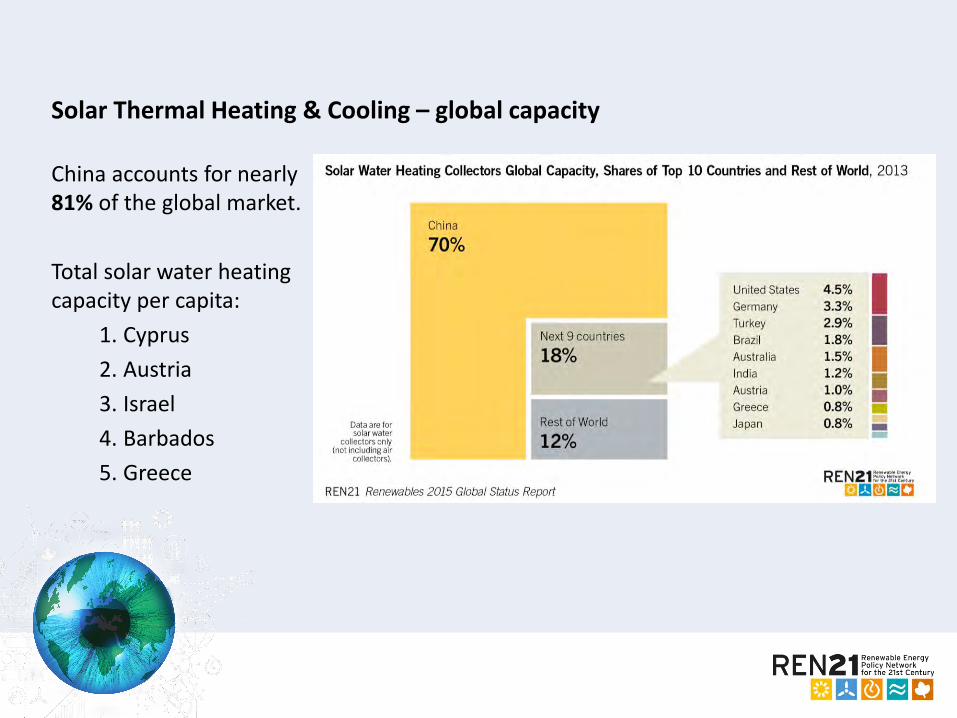
Solar Thermal Heating & Cooling – global capacity
China accounts for nearly 81% of the global market.
Total solar water heating capacity per capita:
1. Cyprus
2. Austria
3. Israel
4. Barbados
5. Greece
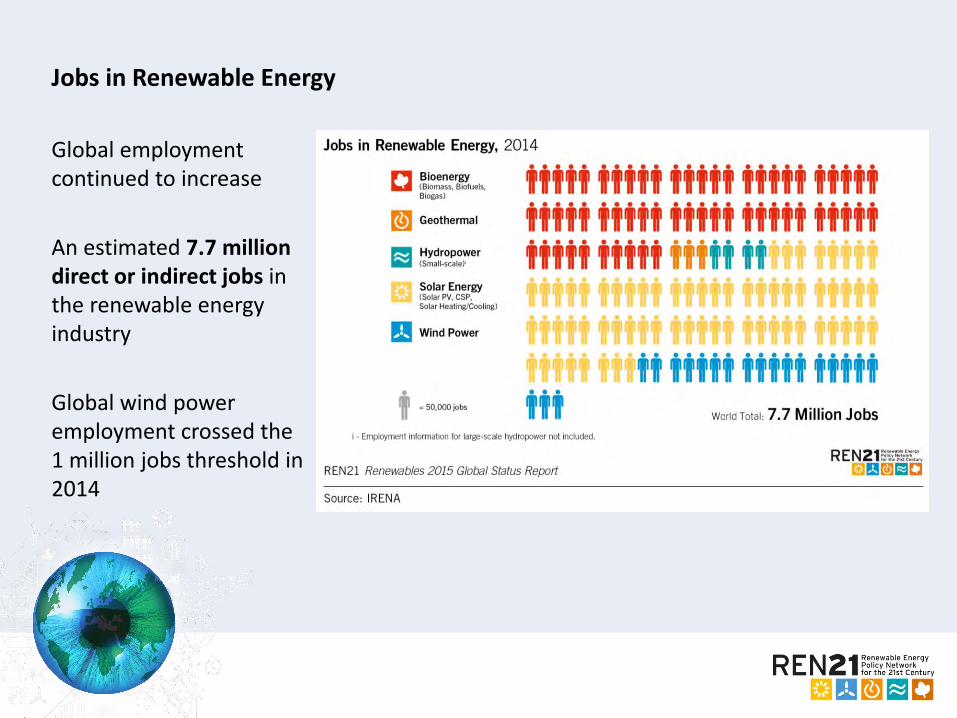
Jobs in Renewable Energy
Global employment continued to increase
An estimated 7.7 million direct or indirect jobs in the renewable energy industry
Global wind power employment crossed the 1 million jobs threshold in 2014 Data Source: IRENA
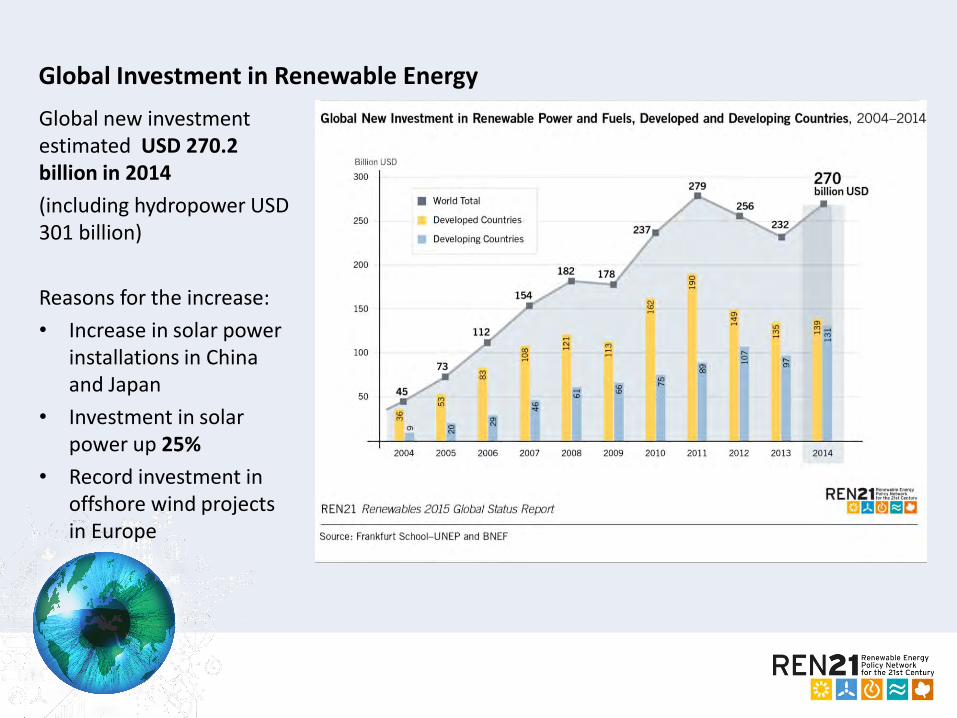
Global Investment in Renewable Energy
Global new investment estimated USD 270.2 billion in 2014
(including hydropower USD 301 billion)
Reasons for the increase:
• Increase in solar power installations in China and Japan
• Investment in solar power up 25%
• Record investment in offshore wind projects in Europe

Developed Countries: Annual investment in 2014: USD 138.9 billion
(increase of 3 % compared to 2013)
Developing Countries: annual investment in 2014: USD 131.3 billion
(increase of 36% compared to 2013)
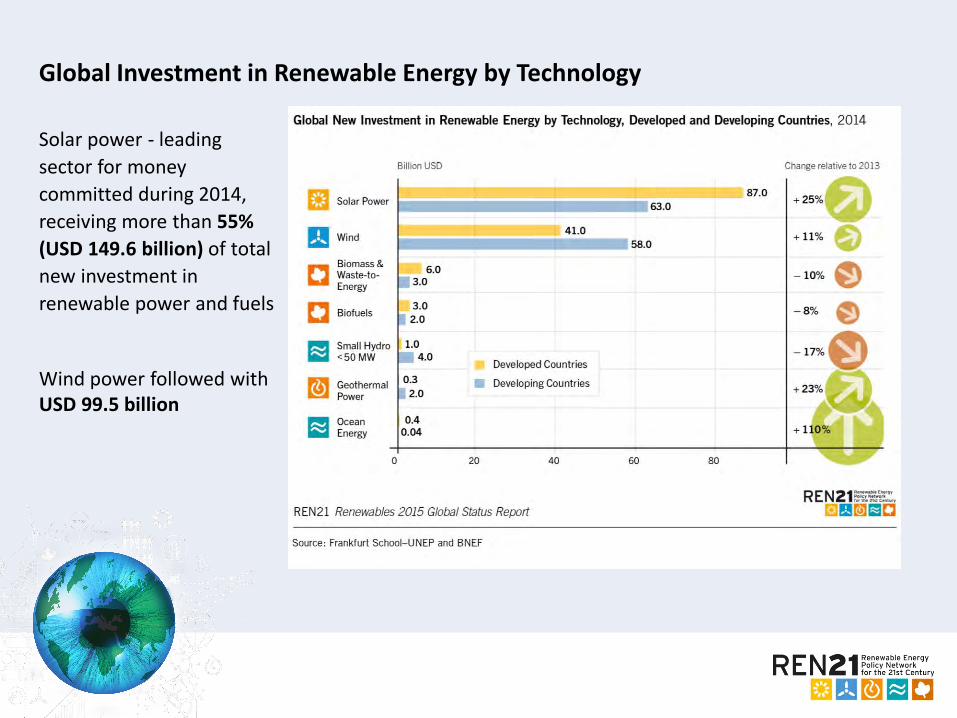
Global Investment in Renewable Energy by Technology
Solar power - leading
sector for money
committed during 2014,
receiving more than 55%
(USD 149.6 billion) of total
new investment in
renewable power and fuels
Wind power followed with USD 99.5 billion
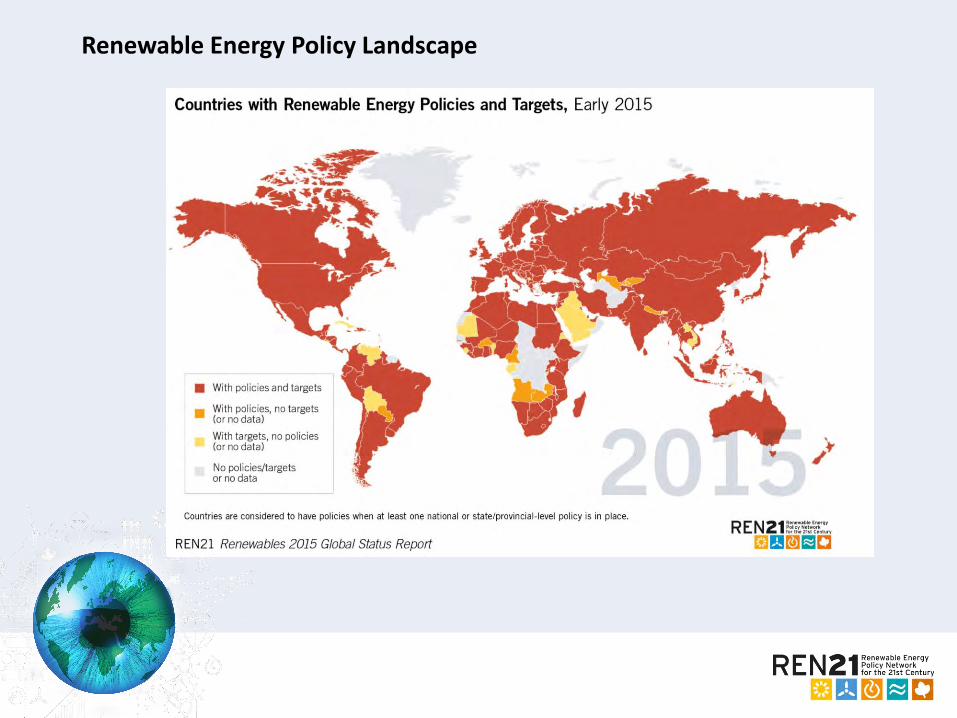
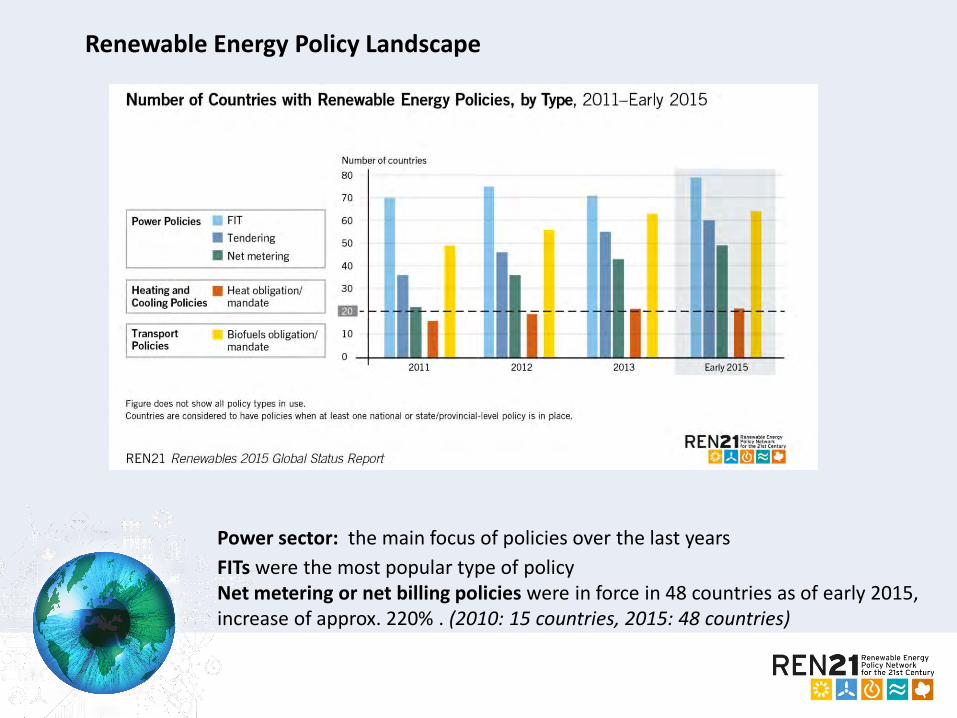
Renewable Energy Policy Landscape
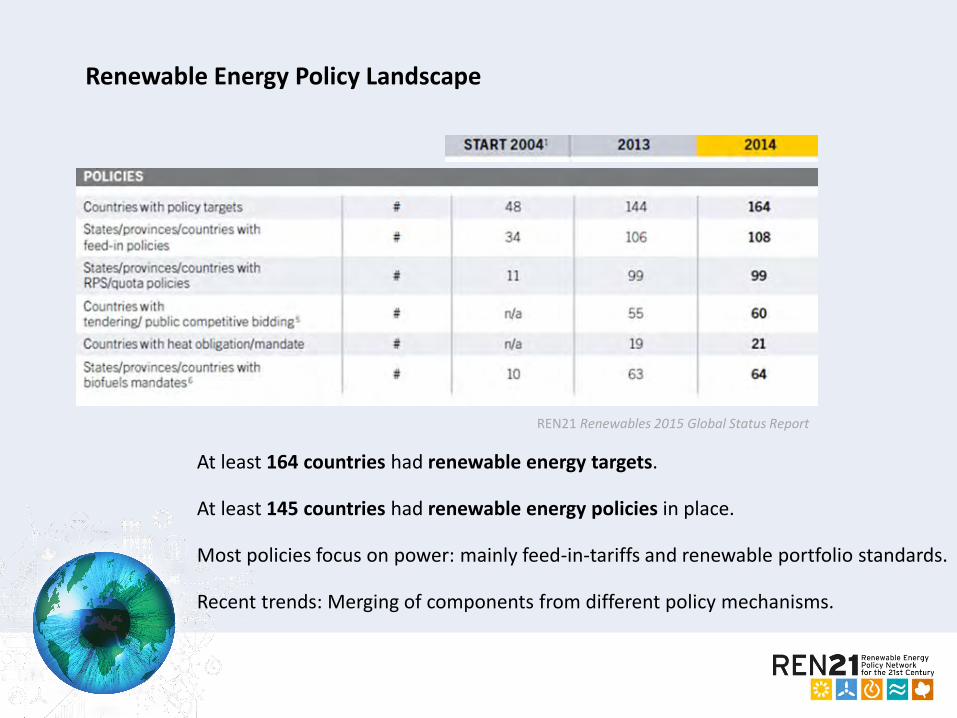
Renewable Energy Policy Landscape
At least 164 countries had renewable energy targets.
At least 145 countries had renewable energy policies in place.
Most policies focus on power: mainly feed-in-tariffs and renewable portfolio standards.
Recent trends: Merging of components from different policy mechanisms.
REN21 Renewables 2015 Global Status Report
Renewable Energy Policy Landscape
Power sector: the main focus of policies over the last years
FITs were the most popular type of policyNet metering or net billing policies were in force in 48 countries as of early 2015, increase of approx. 220% . (2010: 15 countries, 2015: 48 countries)

Renewable Energy Policy Landscape
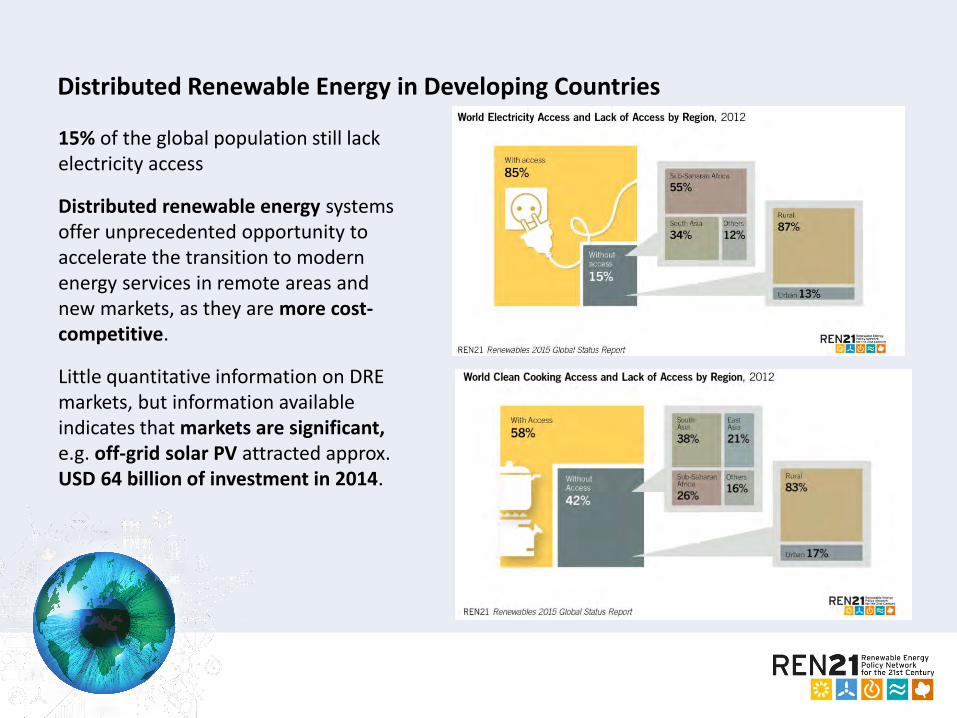
Distributed Renewable Energy in Developing Countries
15% of the global population still lack electricity access
Distributed renewable energy systems offer unprecedented opportunity to accelerate the transition to modern energy services in remote areas and new markets, as they are more cost-competitive.
Little quantitative information on DRE markets, but information available indicates that markets are significant, e.g. off-grid solar PV attracted approx. USD 64 billion of investment in 2014.
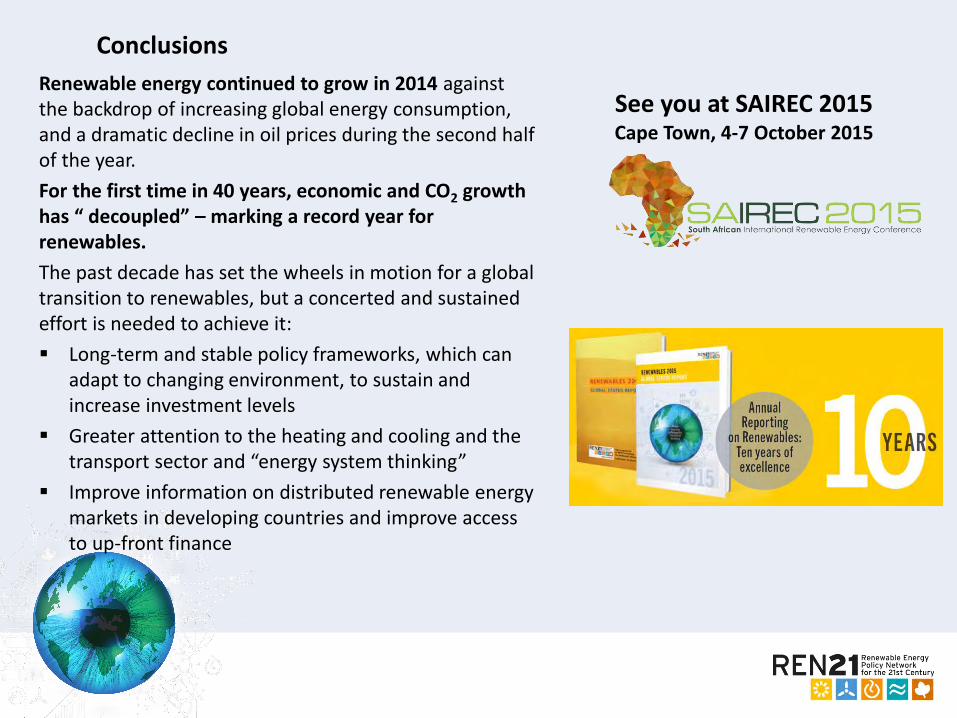
Conclusions
Renewable energy continued to grow in 2014 against the backdrop of increasing global energy consumption, and a dramatic decline in oil prices during the second half of the year.
For the first time in 40 years, economic and CO2 growth has “ decoupled” – marking a record year for renewables.
The past decade has set the wheels in motion for a global transition to renewables, but a concerted and sustained effort is needed to achieve it:
Long-term and stable policy frameworks, which can adapt to changing environment, to sustain and increase investment levels
Greater attention to the heating and cooling and the transport sector and “energy system thinking”
Improve information on distributed renewable energy markets in developing countries and improve access to up-front finance
See you at SAIREC 2015Cape Town, 4-7 October 2015

RENEWABLE ENERGY POLICY NETWORKFOR THE 21st CENTURY
www.ren21.net/gsr
Subscribe to our newsletterwww.ren21.net