Global Post-eradication IPV Supply and Demand...
24
Global Post-eradication IPV Supply and Demand Assessment: Integrated Findings Commissioned by the Bill & Melinda Gates Foundation Prepared by Oliver Wyman, Inc., www.oliverwyman.com March 2009
-
Upload
truongtuyen -
Category
Documents
-
view
213 -
download
0
Transcript of Global Post-eradication IPV Supply and Demand...
Global Post-eradication IPV Supply and Demand Assessment:
Integrated Findings
Commissioned by the Bill & Melinda Gates Foundation
Prepared by Oliver Wyman, Inc., www.oliverwyman.com
March 2009
1
Introduction
The Bill & Melinda Gates Foundation (BMGF), in discussion with The World Health Organization (WHO),
commissioned Oliver Wyman to conduct a global post-eradication inactivated polio vaccine (IPV) supply
and demand assessment. A preliminary report, summarizing the interim findings and remaining open
research questions was released in August 2008. From August through November 2008, additional
research and analysis was conducted and the following report represents the comprehensive findings
from the year-long effort.
Project Charter and Objectives
Launched in 1988, the Global Polio Eradication Initiative (GPEI) had by end-2005 led to the interruption of
indigenous wild poliovirus transmission in all but four countries in the world. Through the expanded use
of new eradication tools and tactics coupled with heightened political advocacy, the eradication effort is
on track to interrupt wild poliovirus in Asia and most of Africa by 2010. The major exception has been in
Nigeria where vaccine coverage lapses due to low quality polio immunization campaigns have led to
several wild poliovirus outbreaks and a vaccine-derived poliovirus outbreak.
In concert with the effort to interrupt wild poliovirus, the GPEI has continued to prepare for the 'post-
eradication' era. In May 2008, the World Health Assembly (WHA) endorsed in principle the eventual
cessation of routine immunization with OPV following confirmation of global eradication and containment
of wild polioviruses. Recognizing that IPV would be the only option for countries wishing to maintain polio
immunity through vaccination after OPV cessation, the WHA also called for intensification of the GPEI's
work to develop (a) affordable options for routine IPV use in low income settings, and (b) safer IPV
production processes to facilitate IPV manufacturing in tropical, developing country settings.
The GPEI continues to work towards the interruption of all wild poliovirus transmission by end-2010, in
which case the containment of all wild polioviruses would need to be complete by mid-2012. Certification
of WPV interruption and containment could then take place as early as end-2013. If these milestones are
achieved, the cessation of all OPV use in routine immunization could potentially take place in 2014-15,
depending on the status of the other pre-requisites for eventual OPV cessation.
As such, many countries, global health bodies, and key opinion leaders are now discussing the merits,
costs and feasibility of wider IPV use post-eradication. While many higher income countries use or are
exploring the use of IPV today, IPV has historically seen limited use in lower income countries given IPV’s
limited mucosal immunity, high price and significant programmatic requirements as compared to OPV. To
inform ongoing IPV discussions and potential policy development for the post-eradication era, a better
2
understanding of potential IPV supply, demand, and economics was needed. To that end, the Bill &
Melinda Gates Foundation commissioned Oliver Wyman to conduct a global IPV supply and demand
assessment, focused on identifying supply strategy implications for developing world populations.
Specifically the foundation asked Oliver Wyman to answer four questions concerning IPV:
1. What range of demand could exist post-eradication?
2. What are the current and potential sources of supply, including new technologies?
3. What are the tradeoffs between these supply sources, including differences in IPV economics?
4. Within the context of global demand and supply, what are the implications for developing world
supply strategies and what are the major next steps?
The insights and conclusions from this project are intended to help inform policy and aid country decision
making. To date, the material has been presented in some form to the Strategic Advisory Group of
Experts (SAGE) Working Group on IPV, Advisory Committee on Polio Eradication (ACPE), World Health
Organization Regional Offices, the Global Polio Eradication Initiative, The United Nations Children’s Fund
(UNICEF), all major IPV manufacturers, and BMGF.
Approach and methodology
The effort was conducted from December 2007 through November 2008 and consisted of four high-level
activities.
Activity 1: Assess current and potential supply – The project team first conducted a full literature review to
identify all existing and potential sources of supply for IPV. Then, direct discussions were pursued with all
of the current manufacturers to identify existing capacity levels and investments currently planned to
expand capacity. In addition, discussions were held with a range of manufacturers and research
institutes working on alternative IPV technologies to determine the status of those development activities
and potential capacity plans.
Activity 2: Evaluate tradeoffs and economics of IPV – In parallel with activity 1, additional secondary and
primary research was conducted to evaluate the full set of tradeoffs across the various sources of supply,
including timing, costs, and key risks. As part of this assessment, the team modeled the economics of
IPV manufacturing for both Salk / wild-type IPV (wtIPV) and Sabin-based production and evaluated how
the economics may change over time. In addition, the team analyzed the economic implications of using
IPV as a stand-alone vaccine or in combination with other antigens to determine the “breakeven” point
between the two options. The breakeven analysis was developed to present a complete picture of the
3
economics, including vaccine price, shipping cost, vaccine wastage, and programmatic/administration
costs.
Activity 3: Develop alternative demand scenarios – A set of activities were pursued to identify key drivers
of demand and potential demand scenarios to bound the amount of supply that may be needed. To
develop the alternative demand scenarios, the team conducted a primary research effort, soliciting input
from approximately 20 experts from academia and global health bodies with a wealth of experience in
polio eradication field work and polio-related research. The experts were asked to provide their insights
and opinions through a series of one-on-one interviews. Specifically, each expert was asked a series of
questions meant to identify the key drivers of demand, determine when and why countries may choose to
adopt IPV, and evaluate the polio vaccination schedule they might use (i.e., dosing level and timing).
Based on these responses, a series of demand scenarios were developed and quantified using WHO and
UN population data.
Activity 4: Synthesize findings and identify implications – This activity was conducted in an iterative
fashion to synthesize findings from the diagnostic, identify the implications for potential supply strategies,
seek feedback on the findings / implications, and then continue to refine the findings and implications.
During this phase of work, the team continued to interact with the set of global experts from the earlier
phase, current and potential IPV manufacturers, and select country government officials.
Summary of key findings
The following eight key findings emerged from the effort:
1. Post-eradication IPV demand is still uncertain, with clear policy guidance being highlighted as one of
the keys to resolving the uncertainty, which in turn requires additional research
2. Given the uncertainty, annual post-eradication demand could rise from the “as is” of 80 million doses
to between 190 and 425 million doses following OPV cessation, with the potential for subsequent
demand to taper over time
3. Existing Salk / wild-type IPV capacity is concentrated with a small set of manufacturers, but these
suppliers have the ability to satisfy even the highest demand scenarios with moderate investments,
clear demand signals, and lead times in the range of three-to-five years
4. Several factors can provide an indication of potential IPV pricing, but manufacturers will need to be
engaged in a dialogue around indicative pricing to obtain more definitive estimates: manufacturing
costs will decline as wtIPV manufacturers expand; given the nature of wtIPV manufacturing, IPV will,
4
however, never reach a price equal to that of OPV; pricing will be determined by a small set of
manufacturers
5. Given their potential capacity and proven track-record with wtIPV, existing wtIPV manufacturers will
have a significant role in any post-eradication supply strategy
6. Dosage-sparing approaches have an important role in further expanding capacity and reducing costs
for some sources of supply
7. Sabin IPV (sIPV) may have a role to play as a complementary technology to wtIPV by meeting
specific customer requirements, complying with containment guidelines, and diversifying supply;
however, clear risks exist that need to be managed given the early stage nature of the technology
8. Guidance must be provided around the use of IPV in stand-alone form vs. in a combination, which
needs to be informed by supply and demand considerations for stand-alone IPV, pentavalent
combinations without IPV, and IPV-containing combinations (with whole-cell and acellular pertussis)
Finding #1 – Post-eradication IPV demand is still uncertain, with clear policy
guidance being highlighted as one of the keys to resolving the uncertainty, which
in turn requires additional research
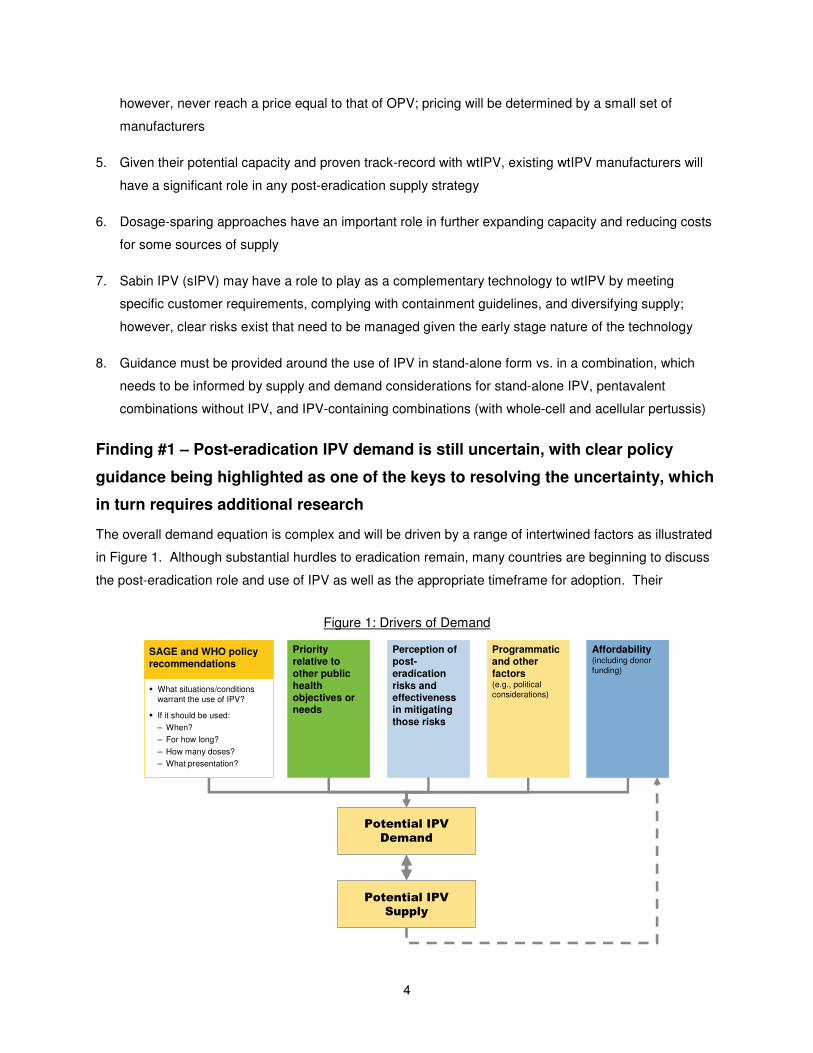
The overall demand equation is complex and will be driven by a range of intertwined factors as illustrated
in Figure 1. Although substantial hurdles to eradication remain, many countries are beginning to discuss
the post-eradication role and use of IPV as well as the appropriate timeframe for adoption. Their
Potential IPV
Demand
Potential IPV
Supply
SAGE and WHO policy
recommendations
� What situations/conditions warrant the use of IPV?
� If it should be used:
– When?
– For how long?
– How many doses?
– What presentation?
Affordability(including donor funding)
Priority relative to
other public
health objectives or needs
Programmatic and other
factors(e.g., political considerations)
Perception of post-
eradication
risks and effectiveness in mitigating
those risks
Figure 1: Drivers of Demand
5
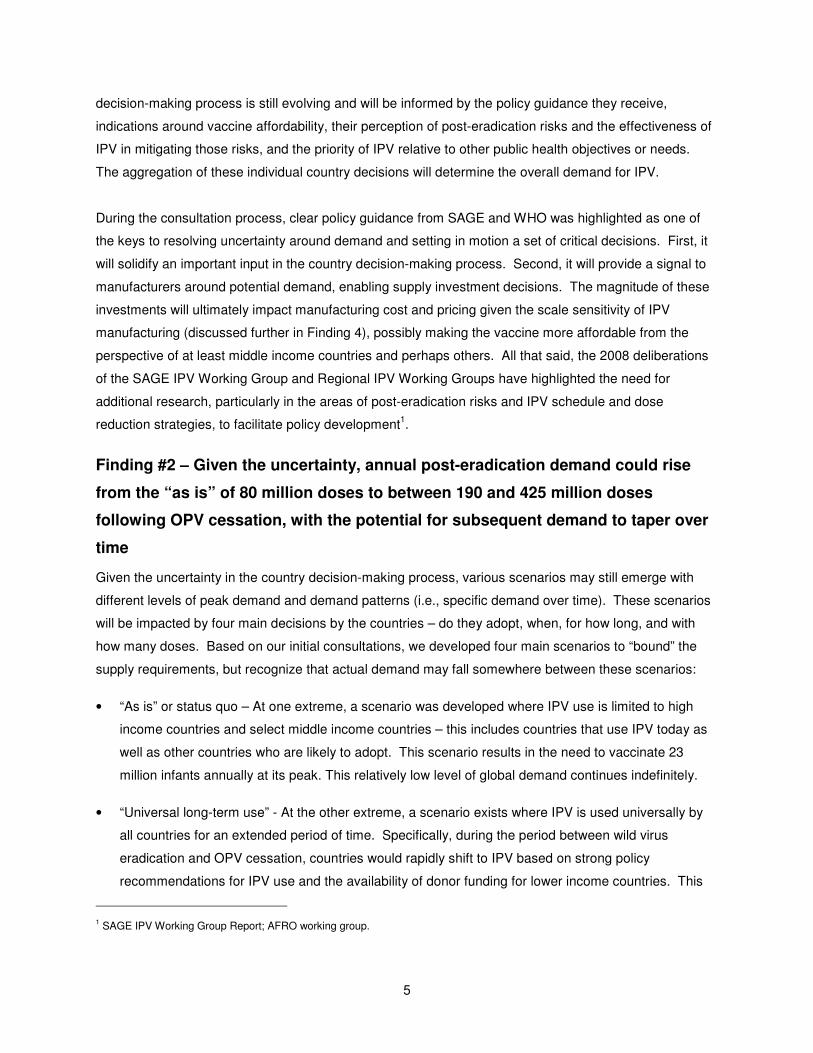
decision-making process is still evolving and will be informed by the policy guidance they receive,
indications around vaccine affordability, their perception of post-eradication risks and the effectiveness of
IPV in mitigating those risks, and the priority of IPV relative to other public health objectives or needs.
The aggregation of these individual country decisions will determine the overall demand for IPV.
During the consultation process, clear policy guidance from SAGE and WHO was highlighted as one of
the keys to resolving uncertainty around demand and setting in motion a set of critical decisions. First, it
will solidify an important input in the country decision-making process. Second, it will provide a signal to
manufacturers around potential demand, enabling supply investment decisions. The magnitude of these
investments will ultimately impact manufacturing cost and pricing given the scale sensitivity of IPV
manufacturing (discussed further in Finding 4), possibly making the vaccine more affordable from the
perspective of at least middle income countries and perhaps others. All that said, the 2008 deliberations
of the SAGE IPV Working Group and Regional IPV Working Groups have highlighted the need for
additional research, particularly in the areas of post-eradication risks and IPV schedule and dose
reduction strategies, to facilitate policy development1.
Finding #2 – Given the uncertainty, annual post-eradication demand could rise
from the “as is” of 80 million doses to between 190 and 425 million doses
following OPV cessation, with the potential for subsequent demand to taper over
time
Given the uncertainty in the country decision-making process, various scenarios may still emerge with
different levels of peak demand and demand patterns (i.e., specific demand over time). These scenarios
will be impacted by four main decisions by the countries – do they adopt, when, for how long, and with
how many doses. Based on our initial consultations, we developed four main scenarios to “bound” the
supply requirements, but recognize that actual demand may fall somewhere between these scenarios:
• “As is” or status quo – At one extreme, a scenario was developed where IPV use is limited to high
income countries and select middle income countries – this includes countries that use IPV today as
well as other countries who are likely to adopt. This scenario results in the need to vaccinate 23
million infants annually at its peak. This relatively low level of global demand continues indefinitely.
• “Universal long-term use” - At the other extreme, a scenario exists where IPV is used universally by
all countries for an extended period of time. Specifically, during the period between wild virus
eradication and OPV cessation, countries would rapidly shift to IPV based on strong policy
recommendations for IPV use and the availability of donor funding for lower income countries. This
1 SAGE IPV Working Group Report; AFRO working group.
6
scenario results in the need to vaccinate 109 million infants annually at its peak. In this aggressive
scenario, this high level of IPV use continues indefinitely.
• “Sovereign Capacity” – This scenario is similar to the “as is” scenario, but also includes adoption by
the remainder of upper middle income countries and the few large developing countries with a history
of locally producing the vaccines used in their country (“self-producing countries”). The birth cohorts
of three of these countries – China, India and Indonesia – are projected to total 47 million by 2014, or
36% of the total global birth cohort and 42% of the birth cohort of countries currently using OPV.
Total demand in this scenario peaks at 66 million infants annually. These new adopters are assumed
to use IPV for only 10 years.
• “Finite Use” - This scenario is similar to the “universal long-term use” scenario, but assumes lower
income countries only utilize IPV for a limited period of time (ranging from 5 to 10 years), due to policy
preferences and/or funding limitations. While this change does not impact peak demand – still 109
million infants annually – it does substantially modify the shape of the demand curve over time. The
implications of this demand “spike” on the supply base are an important consideration in supply
strategy formulation.
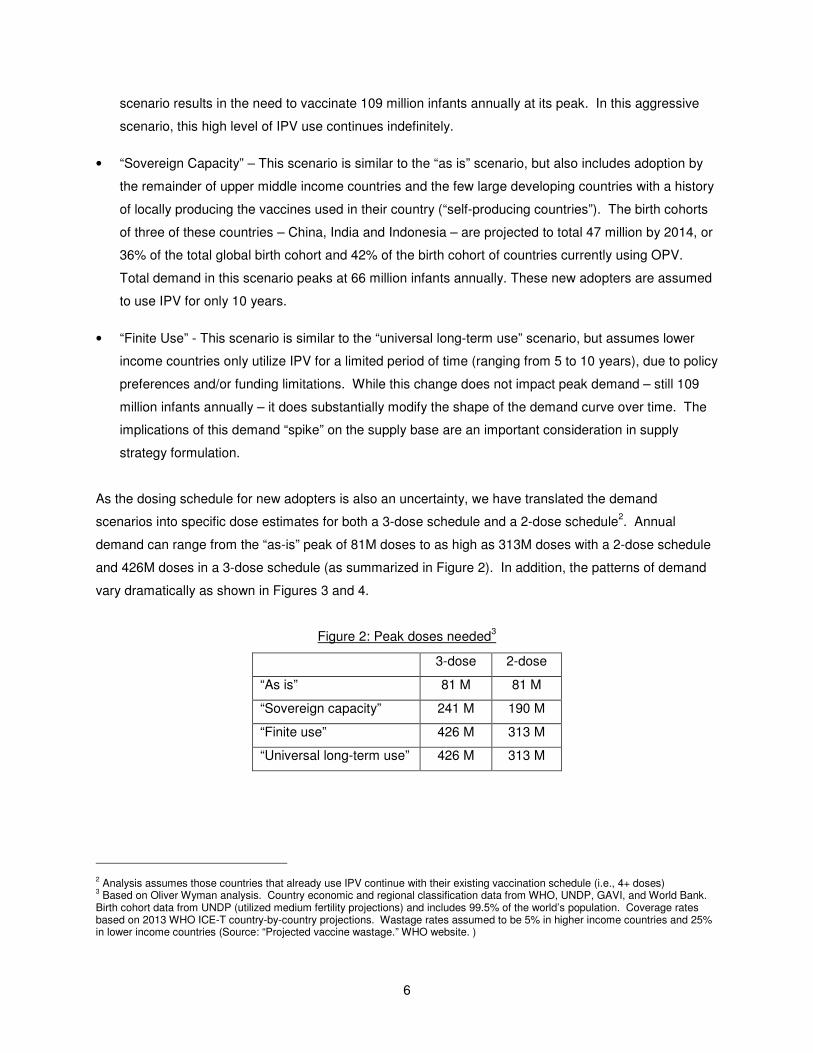
As the dosing schedule for new adopters is also an uncertainty, we have translated the demand
scenarios into specific dose estimates for both a 3-dose schedule and a 2-dose schedule2. Annual
demand can range from the “as-is” peak of 81M doses to as high as 313M doses with a 2-dose schedule
and 426M doses in a 3-dose schedule (as summarized in Figure 2). In addition, the patterns of demand
vary dramatically as shown in Figures 3 and 4.
Figure 2: Peak doses needed3
2 Analysis assumes those countries that already use IPV continue with their existing vaccination schedule (i.e., 4+ doses) 3 Based on Oliver Wyman analysis. Country economic and regional classification data from WHO, UNDP, GAVI, and World Bank. Birth cohort data from UNDP (utilized medium fertility projections) and includes 99.5% of the world’s population. Coverage rates based on 2013 WHO ICE-T country-by-country projections. Wastage rates assumed to be 5% in higher income countries and 25% in lower income countries (Source: “Projected vaccine wastage.” WHO website. )
3-dose 2-dose
“As is” 81 M 81 M
“Sovereign capacity” 241 M 190 M
“Finite use” 426 M 313 M
“Universal long-term use” 426 M 313 M
7
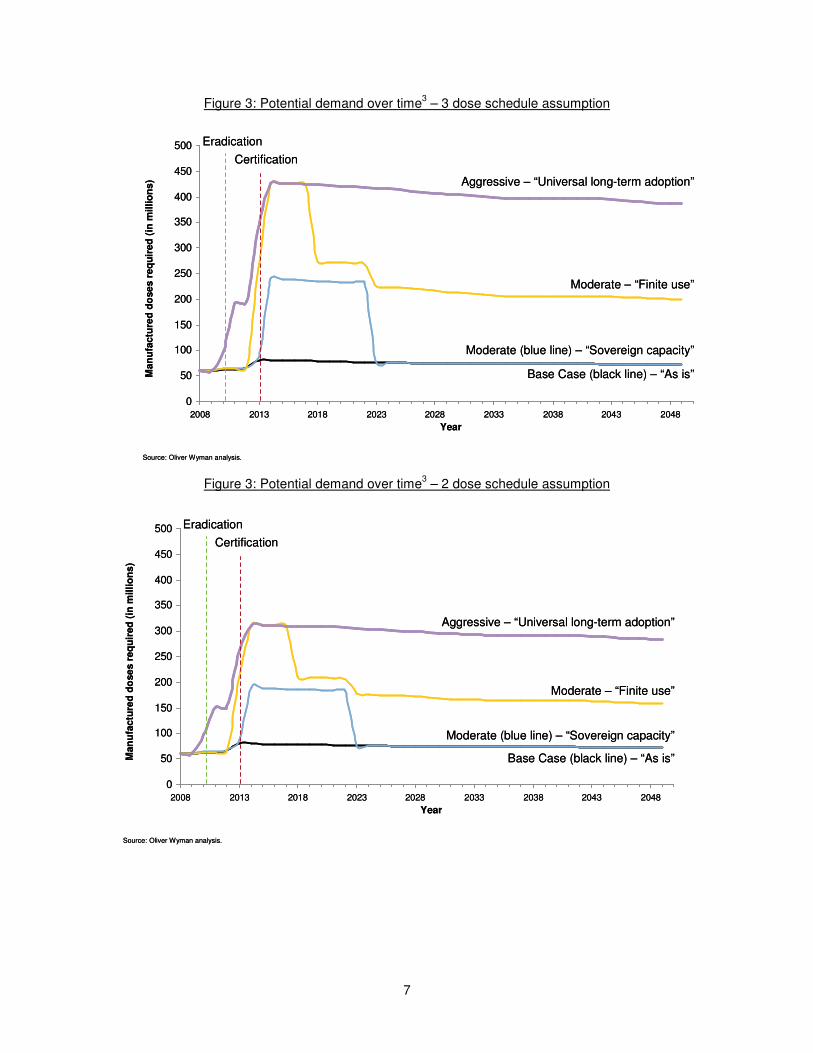
Figure 3: Potential demand over time3 – 3 dose schedule assumption
Figure 3: Potential demand over time3 – 2 dose schedule assumption
0
50
100
150
200
250
300
350
400
450
500
2008 2013 2018 2023 2028 2033 2038 2043 2048
Year
Man
ufa
ctu
red
do
se
s r
eq
uir
ed
(in
milli
on
s) Aggressive – “Universal long-term adoption”
Moderate – “Finite use”
Moderate (blue line) – “Sovereign capacity”
Base Case (black line) – “As is”
Source: Oliver Wyman analysis.
Eradication
Certification
0
50
100
150
200
250
300
350
400
450
500
2008 2013 2018 2023 2028 2033 2038 2043 2048
Year
Man
ufa
ctu
red
do
se
s r
eq
uir
ed
(in
milli
on
s)
Aggressive – “Universal long-term adoption”
Moderate – “Finite use”
Moderate (blue line) – “Sovereign capacity”
Base Case (black line) – “As is”
Source: Oliver Wyman analysis.
Eradication
Certification
8
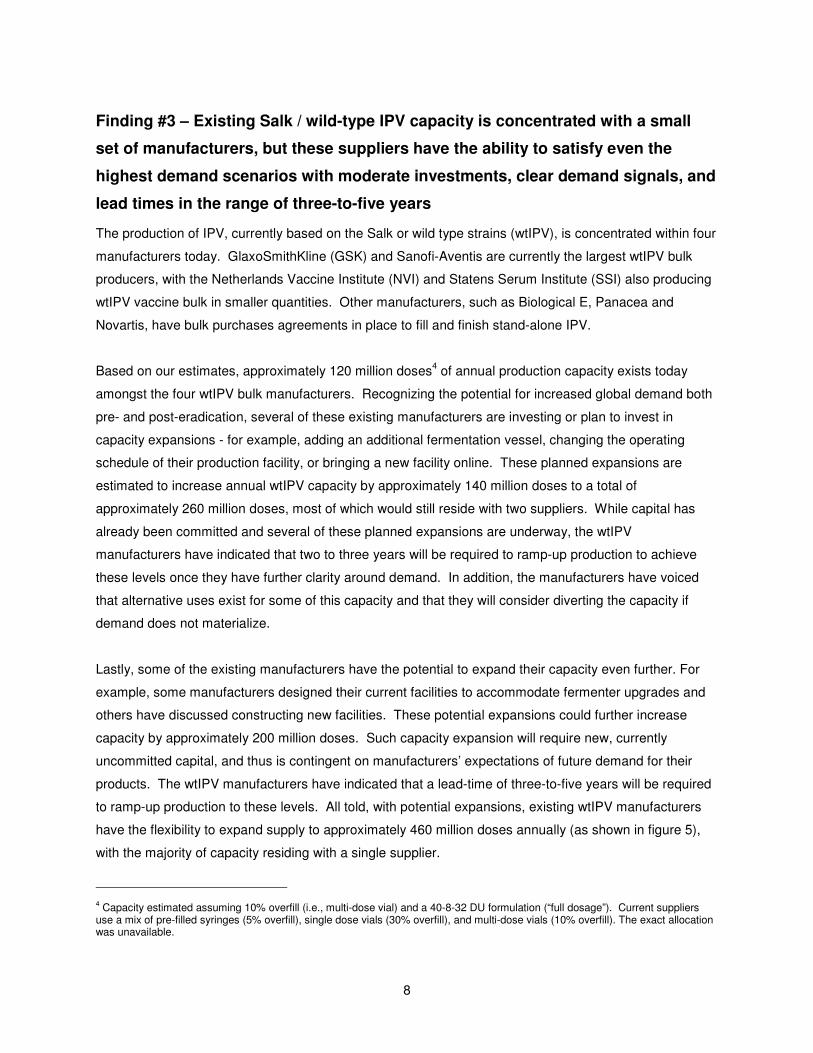
Finding #3 – Existing Salk / wild-type IPV capacity is concentrated with a small
set of manufacturers, but these suppliers have the ability to satisfy even the
highest demand scenarios with moderate investments, clear demand signals, and
lead times in the range of three-to-five years
The production of IPV, currently based on the Salk or wild type strains (wtIPV), is concentrated within four
manufacturers today. GlaxoSmithKline (GSK) and Sanofi-Aventis are currently the largest wtIPV bulk
producers, with the Netherlands Vaccine Institute (NVI) and Statens Serum Institute (SSI) also producing
wtIPV vaccine bulk in smaller quantities. Other manufacturers, such as Biological E, Panacea and
Novartis, have bulk purchases agreements in place to fill and finish stand-alone IPV.
Based on our estimates, approximately 120 million doses4 of annual production capacity exists today
amongst the four wtIPV bulk manufacturers. Recognizing the potential for increased global demand both
pre- and post-eradication, several of these existing manufacturers are investing or plan to invest in
capacity expansions - for example, adding an additional fermentation vessel, changing the operating
schedule of their production facility, or bringing a new facility online. These planned expansions are
estimated to increase annual wtIPV capacity by approximately 140 million doses to a total of
approximately 260 million doses, most of which would still reside with two suppliers. While capital has
already been committed and several of these planned expansions are underway, the wtIPV
manufacturers have indicated that two to three years will be required to ramp-up production to achieve
these levels once they have further clarity around demand. In addition, the manufacturers have voiced
that alternative uses exist for some of this capacity and that they will consider diverting the capacity if
demand does not materialize.
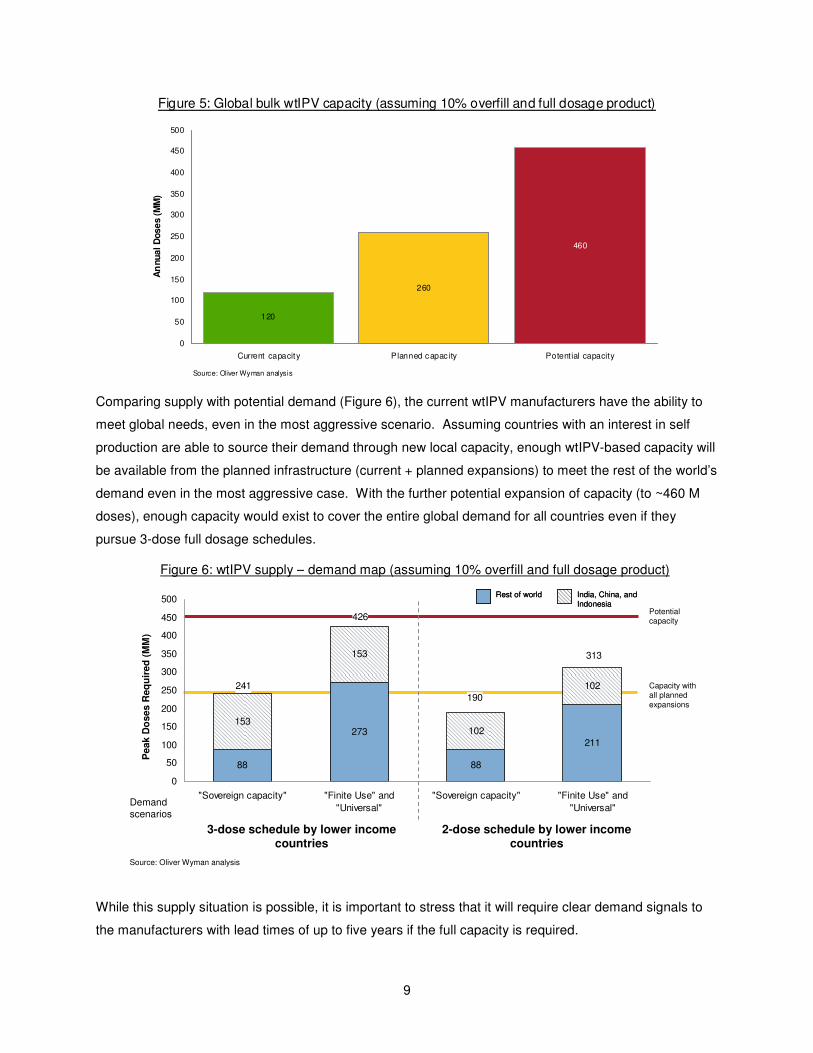
Lastly, some of the existing manufacturers have the potential to expand their capacity even further. For
example, some manufacturers designed their current facilities to accommodate fermenter upgrades and
others have discussed constructing new facilities. These potential expansions could further increase
capacity by approximately 200 million doses. Such capacity expansion will require new, currently
uncommitted capital, and thus is contingent on manufacturers’ expectations of future demand for their
products. The wtIPV manufacturers have indicated that a lead-time of three-to-five years will be required
to ramp-up production to these levels. All told, with potential expansions, existing wtIPV manufacturers
have the flexibility to expand supply to approximately 460 million doses annually (as shown in figure 5),
with the majority of capacity residing with a single supplier.
4 Capacity estimated assuming 10% overfill (i.e., multi-dose vial) and a 40-8-32 DU formulation (“full dosage”). Current suppliers use a mix of pre-filled syringes (5% overfill), single dose vials (30% overfill), and multi-dose vials (10% overfill). The exact allocation was unavailable.
9
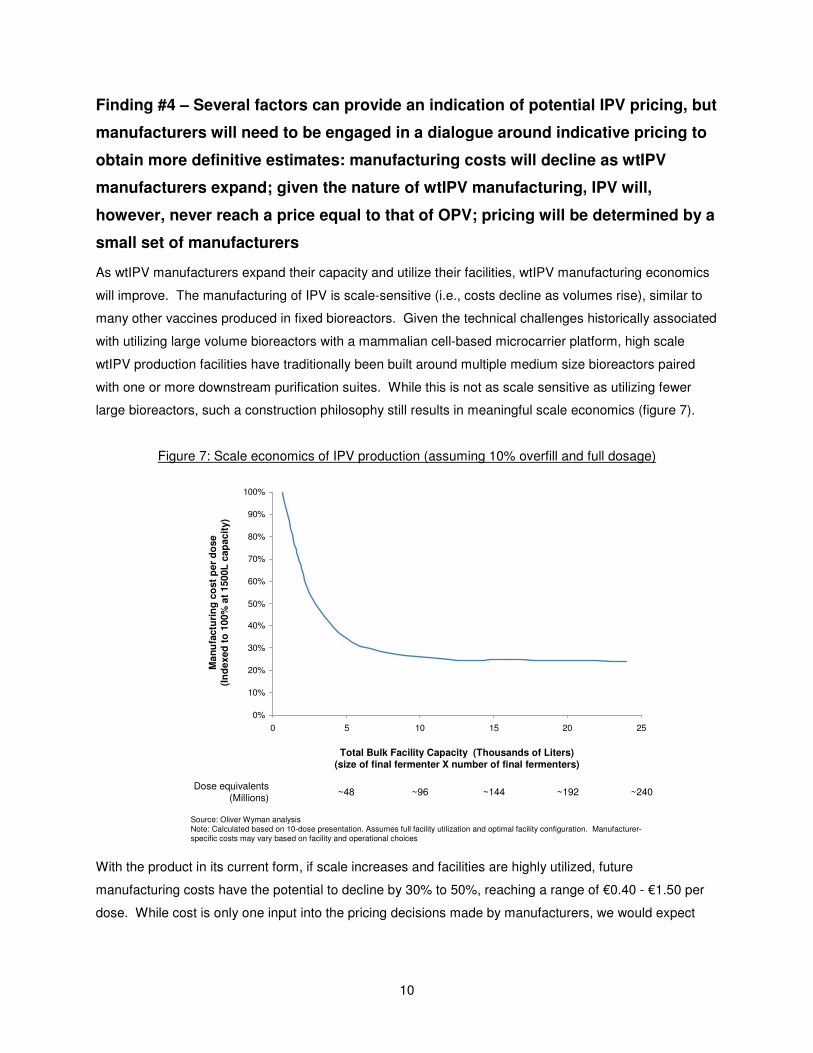
Comparing supply with potential demand (Figure 6), the current wtIPV manufacturers have the ability to
meet global needs, even in the most aggressive scenario. Assuming countries with an interest in self
production are able to source their demand through new local capacity, enough wtIPV-based capacity will
be available from the planned infrastructure (current + planned expansions) to meet the rest of the world’s
demand even in the most aggressive case. With the further potential expansion of capacity (to ~460 M
doses), enough capacity would exist to cover the entire global demand for all countries even if they
pursue 3-dose full dosage schedules.
While this supply situation is possible, it is important to stress that it will require clear demand signals to
the manufacturers with lead times of up to five years if the full capacity is required.
Figure 6: wtIPV supply – demand map (assuming 10% overfill and full dosage product)
Rest of world India, China, and Indonesia
Rest of world India, China, and Indonesia
Potential capacity
Peak D
oses R
eq
uir
ed
(M
M)
Demand scenarios
3-dose schedule by lower income countries
2-dose schedule by lower income countries
Capacity with all planned expansions
88
273
88
211
153
153
102
102
313
190
426
241
0
50
100
150
200
250
300
350
400
450
500
"Sovereign capacity" "Finite Use" and
"Universal"
"Sovereign capacity" "Finite Use" and
"Universal"
Source: Oliver Wyman analysis
Figure 5: Global bulk wtIPV capacity (assuming 10% overfill and full dosage product)
120
260
460
0
50
100
150
200
250
300
350
400
450
500
Current capacity Planned capac ity Potential capacity
An
nu
al D
ose
s (M
M)
Source: Oliver Wyman analysis
10
Finding #4 – Several factors can provide an indication of potential IPV pricing, but
manufacturers will need to be engaged in a dialogue around indicative pricing to
obtain more definitive estimates: manufacturing costs will decline as wtIPV
manufacturers expand; given the nature of wtIPV manufacturing, IPV will,
however, never reach a price equal to that of OPV; pricing will be determined by a
small set of manufacturers
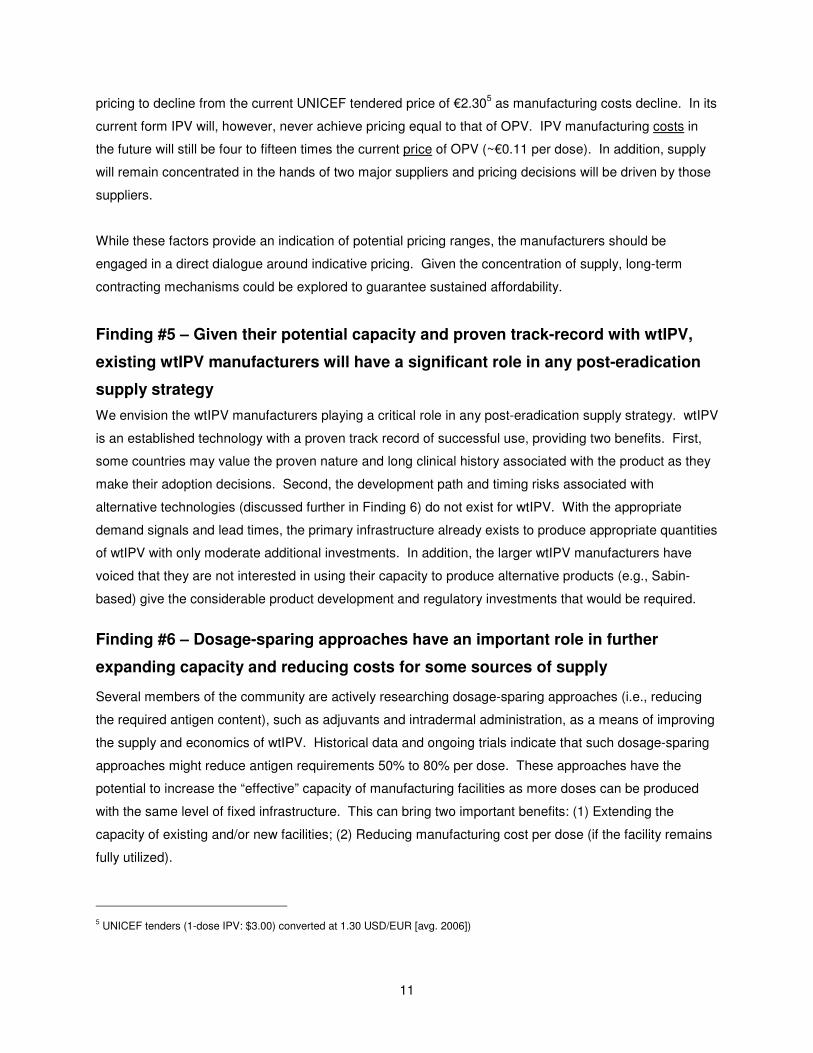
As wtIPV manufacturers expand their capacity and utilize their facilities, wtIPV manufacturing economics
will improve. The manufacturing of IPV is scale-sensitive (i.e., costs decline as volumes rise), similar to
many other vaccines produced in fixed bioreactors. Given the technical challenges historically associated
with utilizing large volume bioreactors with a mammalian cell-based microcarrier platform, high scale
wtIPV production facilities have traditionally been built around multiple medium size bioreactors paired
with one or more downstream purification suites. While this is not as scale sensitive as utilizing fewer
large bioreactors, such a construction philosophy still results in meaningful scale economics (figure 7).
Figure 7: Scale economics of IPV production (assuming 10% overfill and full dosage)
With the product in its current form, if scale increases and facilities are highly utilized, future
manufacturing costs have the potential to decline by 30% to 50%, reaching a range of €0.40 - €1.50 per
dose. While cost is only one input into the pricing decisions made by manufacturers, we would expect
Dose equivalents(Millions)
0%
10%
20%
30%
40%
50%
60%
70%
80%
90%
100%
0 5 10 15 20 25
Ma
nu
factu
rin
g c
ost
per
do
se
(In
dexed
to
100%
at
1500L
cap
acit
y)
Total Bulk Facility Capacity (Thousands of Liters)
(size of final fermenter X number of final fermenters)
~48 ~96 ~144 ~192 ~240
Source: Oliver Wyman analysisNote: Calculated based on 10-dose presentation. Assumes full facility utilization and optimal facility configuration. Manufacturer-specific costs may vary based on facility and operational choices
11
pricing to decline from the current UNICEF tendered price of €2.305 as manufacturing costs decline. In its
current form IPV will, however, never achieve pricing equal to that of OPV. IPV manufacturing costs in
the future will still be four to fifteen times the current price of OPV (~€0.11 per dose). In addition, supply
will remain concentrated in the hands of two major suppliers and pricing decisions will be driven by those
suppliers.
While these factors provide an indication of potential pricing ranges, the manufacturers should be
engaged in a direct dialogue around indicative pricing. Given the concentration of supply, long-term
contracting mechanisms could be explored to guarantee sustained affordability.
Finding #5 – Given their potential capacity and proven track-record with wtIPV,
existing wtIPV manufacturers will have a significant role in any post-eradication
supply strategy
We envision the wtIPV manufacturers playing a critical role in any post-eradication supply strategy. wtIPV
is an established technology with a proven track record of successful use, providing two benefits. First,
some countries may value the proven nature and long clinical history associated with the product as they
make their adoption decisions. Second, the development path and timing risks associated with
alternative technologies (discussed further in Finding 6) do not exist for wtIPV. With the appropriate
demand signals and lead times, the primary infrastructure already exists to produce appropriate quantities
of wtIPV with only moderate additional investments. In addition, the larger wtIPV manufacturers have
voiced that they are not interested in using their capacity to produce alternative products (e.g., Sabin-
based) give the considerable product development and regulatory investments that would be required.
Finding #6 – Dosage-sparing approaches have an important role in further
expanding capacity and reducing costs for some sources of supply
Several members of the community are actively researching dosage-sparing approaches (i.e., reducing
the required antigen content), such as adjuvants and intradermal administration, as a means of improving
the supply and economics of wtIPV. Historical data and ongoing trials indicate that such dosage-sparing
approaches might reduce antigen requirements 50% to 80% per dose. These approaches have the
potential to increase the “effective” capacity of manufacturing facilities as more doses can be produced
with the same level of fixed infrastructure. This can bring two important benefits: (1) Extending the
capacity of existing and/or new facilities; (2) Reducing manufacturing cost per dose (if the facility remains
fully utilized).
5 UNICEF tenders (1-dose IPV: $3.00) converted at 1.30 USD/EUR [avg. 2006])
12
Manufacturers’ interest in dosage-sparing approaches will vary. Some manufacturers, expecting IPV
demand to rise dramatically at eradication and OPV cessation, have already invested significant capital in
the infrastructure and facilities needed to support planned and potential capacities. These investments
allow the manufacturers to meet growing global demand without using dosage-sparing approaches.
Pursuing a dosage-sparing approach would only lead to over-capacity for those manufacturers and would
not be expected to reduce costs.
Dosage-sparing approaches will provide greater value for other manufacturers who have not planned for
significant surplus capacity. For those manufacturers, dosage-sparing approaches would extend the
production capacity of their existing facilities (or new facilities envisioned) and position them to serve
growing demand. These approaches would reduce their cost structures and may also improve the
competitive dynamics within the marketplace by further diversifying supply. At least one manufacturer
has voiced an interest in developing a dosage-sparing product.
While dosage-sparing approaches do have an important role to play in the aggregate market, several
cautions should be noted. First, dosage-sparing approaches will not simply double to quintuple the
capacity available (for 50% to 80% reduced antigen products) in existing facilities. Many of the wtIPV
manufacturers currently provide full dosage product to established markets and are unlikely to switch
these markets to reduced-dosage products given the re-development and re-approval expense. So, only
the surplus capacity in those facilities (or new capacity) would be eligible. Second, the manufacturing
cost reductions associated with dosage-sparing approaches may not translate one-for-one into vaccine
price reductions. The impact on pricing will be driven by a complex set of factors beyond manufacturing
cost, including the competitive dynamics in the market and required R&D investments. At a minimum, the
price will reflect the R&D costs associated with developing these new approaches.
Finding #7 – Sabin IPV (sIPV) may have a role to play as a complementary
technology to wtIPV by meeting specific customer requirements, complying with
containment guidelines, and diversifying supply; however, clear risks exist that
need to be managed given the early stage nature of the technology
IPV manufactured using Sabin strain virus seeds (sIPV) is seen as the primary near-term alternative IPV
technology platform. A range of manufacturers and research institutes have active programs at various
stages of development, including NVI, Panacea and JPRI/Takeda. While other alternative technologies
exist (primarily from non-pathogenic strains), these technologies are mostly in pre-clinical development
and at their current pace of development are not expected to be available at a commercial-scale to meet
near-term eradication milestones (e.g., OPV cessation). Therefore, these alternative technologies were
not evaluated as part of this work. These technologies may have a role to play in the longer-term, for
13
example, in response to stronger virus containment requirements, but additional evaluation would be
required.
In considering the potential role for the sIPV technology, we evaluated a range of tradeoffs relative to
wtIPV. We evaluated the potential advantages in several categories as well as the key risks associated
with this technology.
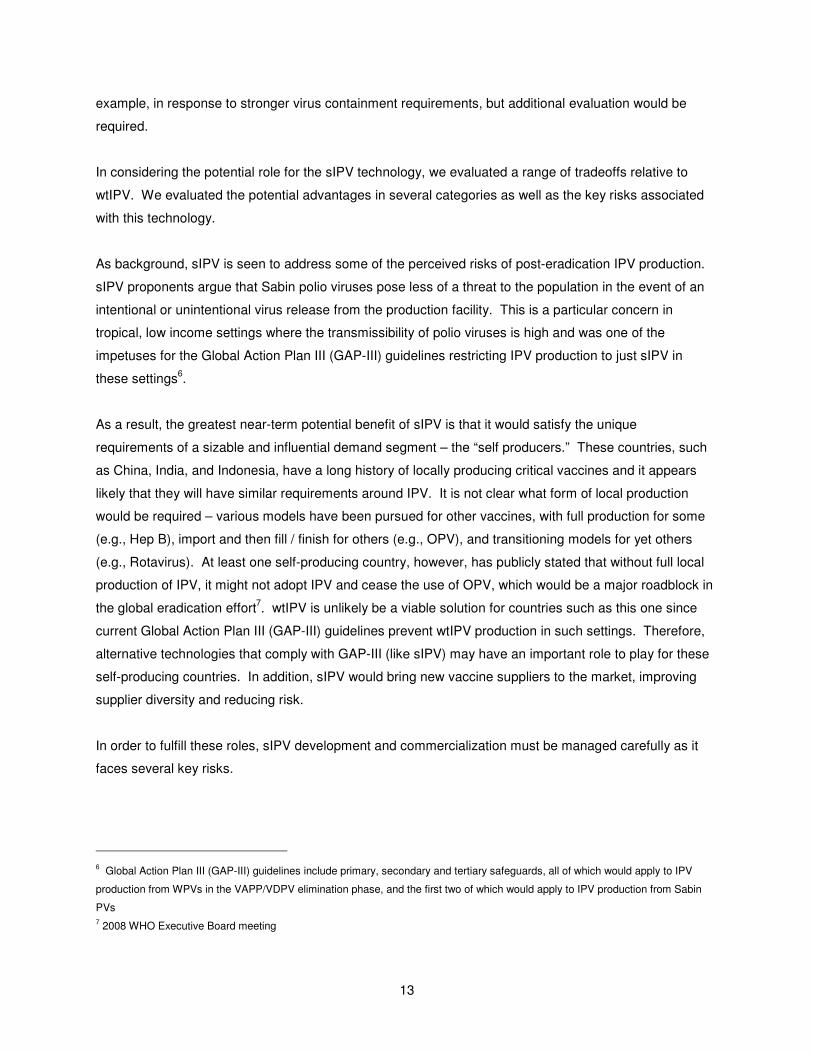
As background, sIPV is seen to address some of the perceived risks of post-eradication IPV production.
sIPV proponents argue that Sabin polio viruses pose less of a threat to the population in the event of an
intentional or unintentional virus release from the production facility. This is a particular concern in
tropical, low income settings where the transmissibility of polio viruses is high and was one of the
impetuses for the Global Action Plan III (GAP-III) guidelines restricting IPV production to just sIPV in
these settings6.
As a result, the greatest near-term potential benefit of sIPV is that it would satisfy the unique
requirements of a sizable and influential demand segment – the “self producers.” These countries, such
as China, India, and Indonesia, have a long history of locally producing critical vaccines and it appears
likely that they will have similar requirements around IPV. It is not clear what form of local production
would be required – various models have been pursued for other vaccines, with full production for some
(e.g., Hep B), import and then fill / finish for others (e.g., OPV), and transitioning models for yet others
(e.g., Rotavirus). At least one self-producing country, however, has publicly stated that without full local
production of IPV, it might not adopt IPV and cease the use of OPV, which would be a major roadblock in
the global eradication effort7. wtIPV is unlikely be a viable solution for countries such as this one since
current Global Action Plan III (GAP-III) guidelines prevent wtIPV production in such settings. Therefore,
alternative technologies that comply with GAP-III (like sIPV) may have an important role to play for these
self-producing countries. In addition, sIPV would bring new vaccine suppliers to the market, improving
supplier diversity and reducing risk.
In order to fulfill these roles, sIPV development and commercialization must be managed carefully as it
faces several key risks.
6 Global Action Plan III (GAP-III) guidelines include primary, secondary and tertiary safeguards, all of which would apply to IPV
production from WPVs in the VAPP/VDPV elimination phase, and the first two of which would apply to IPV production from Sabin
PVs 7 2008 WHO Executive Board meeting
14
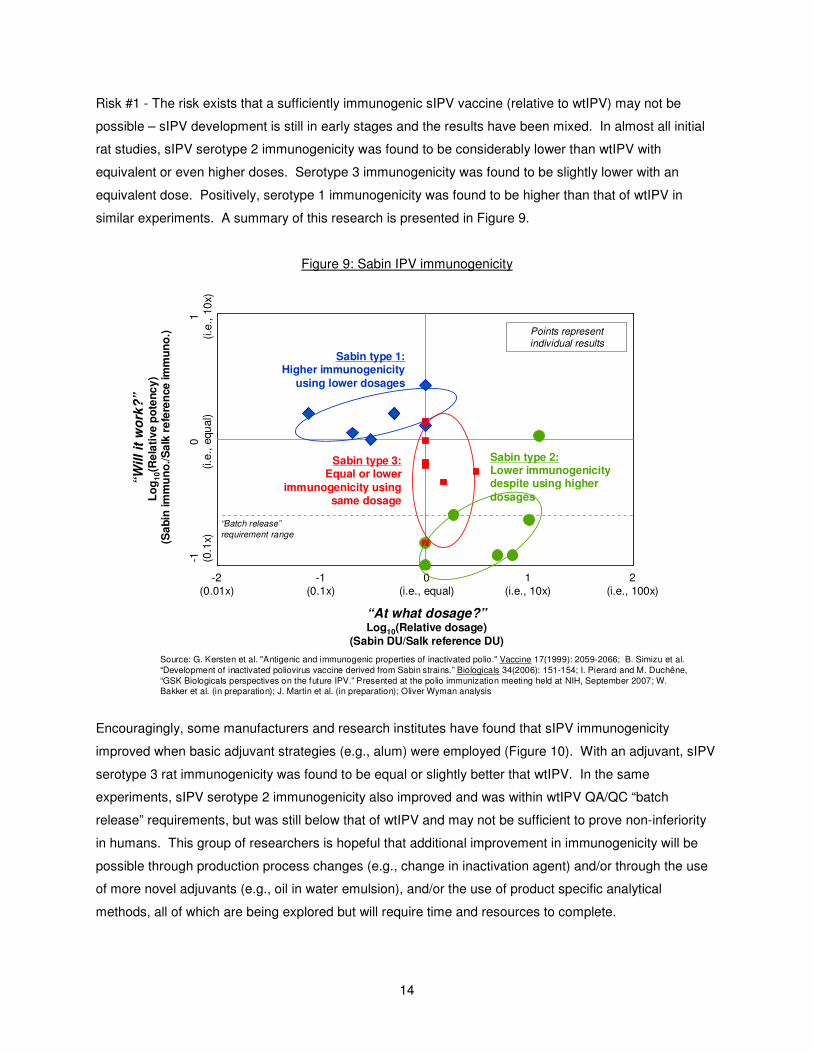
Risk #1 - The risk exists that a sufficiently immunogenic sIPV vaccine (relative to wtIPV) may not be
possible – sIPV development is still in early stages and the results have been mixed. In almost all initial
rat studies, sIPV serotype 2 immunogenicity was found to be considerably lower than wtIPV with
equivalent or even higher doses. Serotype 3 immunogenicity was found to be slightly lower with an
equivalent dose. Positively, serotype 1 immunogenicity was found to be higher than that of wtIPV in
similar experiments. A summary of this research is presented in Figure 9.
Figure 9: Sabin IPV immunogenicity
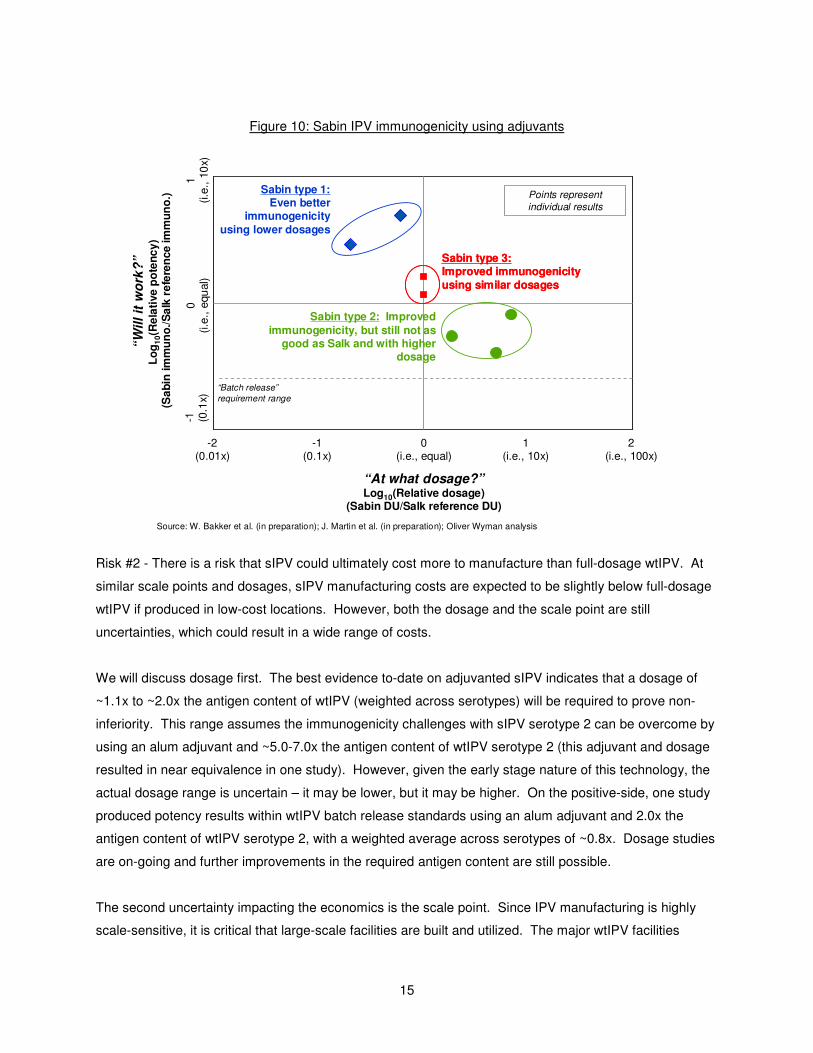
Encouragingly, some manufacturers and research institutes have found that sIPV immunogenicity
improved when basic adjuvant strategies (e.g., alum) were employed (Figure 10). With an adjuvant, sIPV
serotype 3 rat immunogenicity was found to be equal or slightly better that wtIPV. In the same
experiments, sIPV serotype 2 immunogenicity also improved and was within wtIPV QA/QC “batch
release” requirements, but was still below that of wtIPV and may not be sufficient to prove non-inferiority
in humans. This group of researchers is hopeful that additional improvement in immunogenicity will be
possible through production process changes (e.g., change in inactivation agent) and/or through the use
of more novel adjuvants (e.g., oil in water emulsion), and/or the use of product specific analytical
methods, all of which are being explored but will require time and resources to complete.
0.1
1.0
10.0
0.0 0.1 1.0 10.0 100.0
“W
ill
it w
ork
?”
Lo
g1
0(R
ela
tive p
ote
nc
y)
(Sa
bin
im
mu
no
./S
alk
re
fere
nce im
mu
no
.)
“At what dosage?”Log10(Relative dosage)
(Sabin DU/Salk reference DU)
“Batch release”
requirement range
Sabin type 1:Higher immunogenicity
using lower dosages
Sabin type 3:Equal or lower
immunogenicity using same dosage
2(i.e., 100x)
0(i.e., equal)
1(i.e
., 1
0x)
0(i.e
., e
qu
al)
-1 (0.1
x)
Sabin type 2:Lower immunogenicity despite using higher
dosages
Points represent
individual results
Source: G. Kersten et al. "Antigenic and immunogenic properties of inactivated polio." Vaccine 17(1999): 2059-2066; B. Simizu et al. “Development of inactivated poliovirus vaccine derived from Sabin strains.” Biologicals 34(2006): 151-154; I. Pierard and M. Duchêne, “GSK Biologicals perspectives on the future IPV.” Presented at the polio immunization meeting held at NIH, September 2007; W. Bakker et al. (in preparation); J. Martin et al. (in preparation); Oliver Wyman analysis
1(i.e., 10x)
-1(0.1x)
-2(0.01x)
15
Figure 10: Sabin IPV immunogenicity using adjuvants
Risk #2 - There is a risk that sIPV could ultimately cost more to manufacture than full-dosage wtIPV. At
similar scale points and dosages, sIPV manufacturing costs are expected to be slightly below full-dosage
wtIPV if produced in low-cost locations. However, both the dosage and the scale point are still
uncertainties, which could result in a wide range of costs.
We will discuss dosage first. The best evidence to-date on adjuvanted sIPV indicates that a dosage of
~1.1x to ~2.0x the antigen content of wtIPV (weighted across serotypes) will be required to prove non-
inferiority. This range assumes the immunogenicity challenges with sIPV serotype 2 can be overcome by
using an alum adjuvant and ~5.0-7.0x the antigen content of wtIPV serotype 2 (this adjuvant and dosage
resulted in near equivalence in one study). However, given the early stage nature of this technology, the
actual dosage range is uncertain – it may be lower, but it may be higher. On the positive-side, one study
produced potency results within wtIPV batch release standards using an alum adjuvant and 2.0x the
antigen content of wtIPV serotype 2, with a weighted average across serotypes of ~0.8x. Dosage studies
are on-going and further improvements in the required antigen content are still possible.
The second uncertainty impacting the economics is the scale point. Since IPV manufacturing is highly
scale-sensitive, it is critical that large-scale facilities are built and utilized. The major wtIPV facilities
0.1
1.0
10.0
0.0 0.1 1.0 10.0 100.0
Sabin type 1:Even better
immunogenicity
using lower dosages
Sabin type 3:Improved immunogenicity
using similar dosages
Sabin type 3:Improved immunogenicity
using similar dosages
Sabin type 2: Improved
immunogenicity, but still not as good as Salk and with higher
dosage
“Batch release”
requirement range
1(i.e
., 1
0x)
0(i.e
., e
qu
al)
“W
ill
it w
ork
?”
Lo
g1
0(R
ela
tive p
ote
nc
y)
(Sa
bin
im
mu
no
./S
alk
re
fere
nce im
mu
no
.)
“At what dosage?”Log10(Relative dosage)
(Sabin DU/Salk reference DU)
Points represent
individual results
Source: W. Bakker et al. (in preparation); J. Martin et al. (in preparation); Oliver Wyman analysis
2(i.e., 100x)
0(i.e., equal)
1(i.e., 10x)
-1(0.1x)
-2(0.01x)
-1 (0.1
x)

16
operate at high-scale, so uncertainty does not exist for those products. For sIPV facilities, however, the
scale points are yet to be determined. If each self-producing country procures vaccine from several local
manufacturers, the resulting scale points could be considerably below wtIPV and drive up manufacturing
costs.
Figure 11 shows the comparison of wtIPV and sIPV at multiples dosage ranges and scale points. At
scale points similar to wtIPV facilities and within a dosage range of ~1.1x to ~2.0x, sIPV manufacturing
costs would be consistent with wtIPV (slightly higher to slightly lower depending on the position in the
required dosage range). At lower dosage, sIPV could be less costly to manufacture. However, the major
risk then lies in the scale points. At scale points below 5,000 liters of fermenter capacity (approximately
48 million annual doses at wtIPV dosage levels), sIPV would reach a steep portion of the scale curve and
could be considerably more expensive than wtIPV.
Risk #3 - There is the risk that sufficient sIPV capacity will not be available when required given current
wild polio virus eradication and OPV cessation goals. The timing is quite tight and would need to be
aggressively managed. Due to the early-stage nature of the product and the need to use adjuvants
and/or process changes to achieve target immunogenicity, considerable development, regulatory, and
licensure activities still need to occur. While some of the manufacturers are currently operating on a
Figure 11: Relative economics of wtIPV versus adjuvanted sIPV
0%
20%
40%
60%
80%
100%
120%
0 5 10 15 20 25
At similar scale points, the high-end of the Sabin
efficiency range would
represent an
improvement over Salk
1??
??
??
??
??
??
??
??
??
??
Total Bulk Facility Capacity (Thousands of Liters)(size of final fermenter X number of final fermenters)
Man
ufa
ctu
rin
g c
ost
per
do
se
(In
dexe
d t
o 1
00
% o
f w
tIP
V a
t 1
500
L c
ap
acit
y)
Dose equivalents @ 100% efficiency (Mill ions) ~48 ~96 ~144 ~192 ~240
Source: Oliver Wyman analysisNote: Calculated based on 10-dose presentation. Assumes full facility utilization and optimal facility configuration. Manufacturer-specific costs may vary based on facility and operational choices . Modeled Salk location as Europe, Sabin location as India
wtIPV curve
sIPV assuming ~2.0x antigen, low cost location
sIPV assuming ~1.1x antigen, low cost location
sIPV assuming ~0.8x antigen, low cost location
???? ??
??
Sabin scale is st ill unclear and could increase costs relativ e to high-scale Salk2
17
timeline consistent with eradication goals, timeline risks always exist in vaccine development. In addition,
new local production capacity would need to be built and would need to begin prior to the completion of
product development, requiring advanced planning and carefully staging of technology transfers for many
of the developers.
Finding #8 – Guidance must be provided around the use of IPV in stand-alone
form vs. in a combination, which needs to be informed by supply and demand
considerations for stand-alone IPV, pentavalent combinations without IPV, and
IPV-containing combinations (with whole-cell and acellular pertussis)
In making the stand-alone versus combination decision, countries, global health bodies, and donors need
to carefully evaluate the economic and non-economic considerations of a combination vaccine (which
would contain IPV) versus the alternative of stand-alone IPV used in conjunction with a pentavalent
combination without IPV (i.e., DTwP-HepB-Hib, which is rapidly being adopted by the countries using
OPV today)
To help frame the economic elements, we can analyze the price of a combination vaccine that would
make it economically equivalent to the stand-alone option, referred to as the “breakeven price.” For the
purpose of this analysis, we have assumed the combination vaccine would be a hexavalent, which would
replace the need for a stand-alone IPV vaccine and current pentavalent. The current average low
income, public market price for stand-alone IPV and the non-IPV containing pentavalent combination
(fully liquid form) are €2.30 per dose and €2.69 per dose respectively8. Programmatically, the use of a
hexavalent combination would result in, on average, €0.60 in savings per child vaccinated9. This savings
results from the need to administer less injections, reducing the cost associated with syringes,
safety/disposal, cold chain transportation, etc. Combining these inputs with assumptions on wastage and
shipping cost10
, a hypothetical hexavalent vaccine would have to be priced at €5.19 per dose to be
economically equivalent to the stand-alone option.
8 UNICEF tenders (2-dose penta: $3.50 and 1-dose IPV: $3.00) converted at 1.30 USD/EUR [avg. 2006])
9 Based on Oliver Wyman analysis of WHO Global Immunization Vision and Strategy (GIVS) programmatic cost data and projections. The €0.60 figure is a global weighted average; specific savings varied from country to country
10 Vaccine wastage, which is driven by presentation, was assumed to be 15% (2-dose presentation). Shipping was assumed to be €0.03 per dose
18
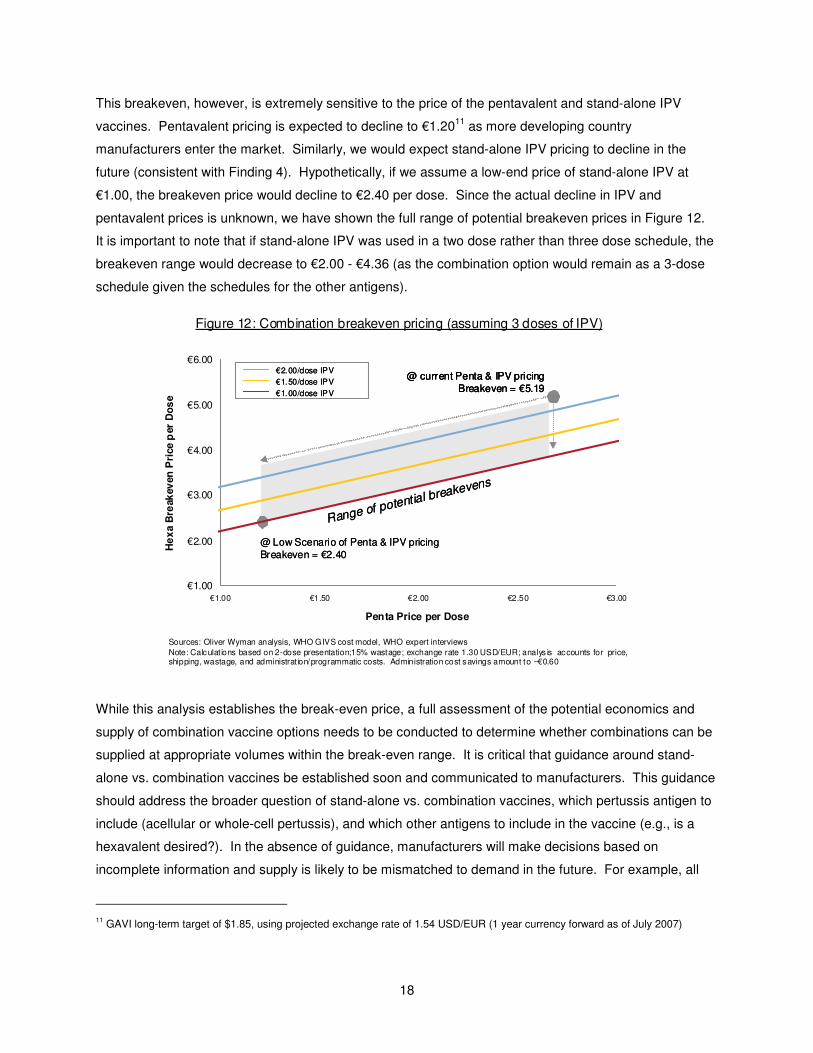
This breakeven, however, is extremely sensitive to the price of the pentavalent and stand-alone IPV
vaccines. Pentavalent pricing is expected to decline to €1.2011
as more developing country
manufacturers enter the market. Similarly, we would expect stand-alone IPV pricing to decline in the
future (consistent with Finding 4). Hypothetically, if we assume a low-end price of stand-alone IPV at
€1.00, the breakeven price would decline to €2.40 per dose. Since the actual decline in IPV and
pentavalent prices is unknown, we have shown the full range of potential breakeven prices in Figure 12.
It is important to note that if stand-alone IPV was used in a two dose rather than three dose schedule, the
breakeven range would decrease to €2.00 - €4.36 (as the combination option would remain as a 3-dose
schedule given the schedules for the other antigens).
While this analysis establishes the break-even price, a full assessment of the potential economics and
supply of combination vaccine options needs to be conducted to determine whether combinations can be
supplied at appropriate volumes within the break-even range. It is critical that guidance around stand-
alone vs. combination vaccines be established soon and communicated to manufacturers. This guidance
should address the broader question of stand-alone vs. combination vaccines, which pertussis antigen to
include (acellular or whole-cell pertussis), and which other antigens to include in the vaccine (e.g., is a
hexavalent desired?). In the absence of guidance, manufacturers will make decisions based on
incomplete information and supply is likely to be mismatched to demand in the future. For example, all
11 GAVI long-term target of $1.85, using projected exchange rate of 1.54 USD/EUR (1 year currency forward as of July 2007)
@ current Penta & IPV pricing Breakeven = €5.19
Range of potential breakevens
@ Low Scenario of Penta & IPV pricing Breakeven = €2.40
@ current Penta & IPV pricing Breakeven = €5.19
@ current Penta & IPV pricing Breakeven = €5.19
Range of potential breakevens
@ Low Scenario of Penta & IPV pricing Breakeven = €2.40
€1.00
€2.00
€3.00
€4.00
€5.00
€6.00
€1.00 €1.50 €2.00 €2.50 €3.00
He
xa B
reak
ev
en
Pri
ce
per
Do
se
Penta Price per Dose
€2.00/dose IPV
€1.00/dose IPV
€1.50/dose IPV
€2.00/dose IPV
€1.00/dose IPV
€1.50/dose IPV
Sources: Oliver Wyman analysis, WHO GIVS cost model, WHO expert interviews
Note: Calculat ions based on 2-dose presentation;15% wastage; exchange rate 1.30 USD/EUR; analys is accounts for price, shipping, wastage, and administrat ion/programmatic costs. Administration cost savings amount to ~€0.60
Figure 12: Combination breakeven pricing (assuming 3 doses of IPV)
19
IPV-containing combination vaccines today contain acellular, not whole cell pertussis, partially due to the
incompatibility of existing wtIPV manufacturers’ whole cell pertussis production process with IPV. Only
one manufacturer produces a hexavalent combination, and supply for combination vaccines is
considerably more limited than stand-alone vaccines. In addition, existing and new manufacturers are
considering a range of new products, including various combinations with acellular and whole cell
pertussis.
Overall, this guidance will be key and needs to be informed by various economic (e.g., vaccine price,
administration costs, available supply) and non-economic tradeoffs. Further, as this decision involves
different pertussis antigens, it needs to be informed by policy guidance on the merits of wP vs. aP from
SAGE and WHO.
Summary implications
In summary, both wtIPV and sIPV have roles to play in satisfying the demand for different country
segments. It is important to distinguish between the needs of two clear demand segments – (1) The self-
producing countries, which have set a historical precedent of desiring local production; (2) All other new
adopter countries, open to importing vaccine. Satisfying the needs of both of these segments will be
critical to gaining global agreement around OPV cessation, a key step in the eradication process.
It is clear that wtIPV has a strong role to play for the non-self-producing countries, representing ~60% of
total global birth cohort. wtIPV is an established technology, has significant planned and potential
capacity, and has economics that are expected to improve as facilities scale-up. Given the lead times
associated with scaling-up capacity (and ensuring that capacity is not repurposed for other uses), the
decision to use planned and potential wtIPV capacity must be made soon, potentially before some of the
uncertainties around sIPV are resolved (e.g., sIPV manufacturing scale). In addition, the ongoing
dialogue on dosage-sparing approaches with the manufacturers should continue to better define their
interest in investing in those technologies.
sIPV may have a role to play for the self-producing countries, and therefore continued development is
important. It is not clear what form of local production (i.e. complete bulk through finishing, importing bulk
and finishing locally) would be required, although many countries have already begun to express their
preferences. If some countries will require local bulk IPV production in the long-term as they have done
for other vaccines, then wtIPV will not be a viable solution for those countries. Current Global Action Plan
III (GAP-III) guidelines prevent wtIPV production in such settings given concerns over the high
transmissibility of wtPVs.
20
In the short-term, a clear dialogue with the self-producing countries must continue to explore their
flexibility in their self-production requirements. Two elements of that dialogue will be critical: (1)
Determination of how their decisions would change if vaccine could be imported at a price similar or lower
than what would be available from local production; and (2) determination of whether in exchange for
continued support of sIPV development, they would cease OPV use even if sIPV is not available in the
targeted cessation timeframe. Given the risks associated with sIPV development, these countries would
need to make advanced arrangements to import wtIPV post-cessation for a period of time – either in bulk
or finished form – to ensure an IPV product is available if sIPV development is delayed.
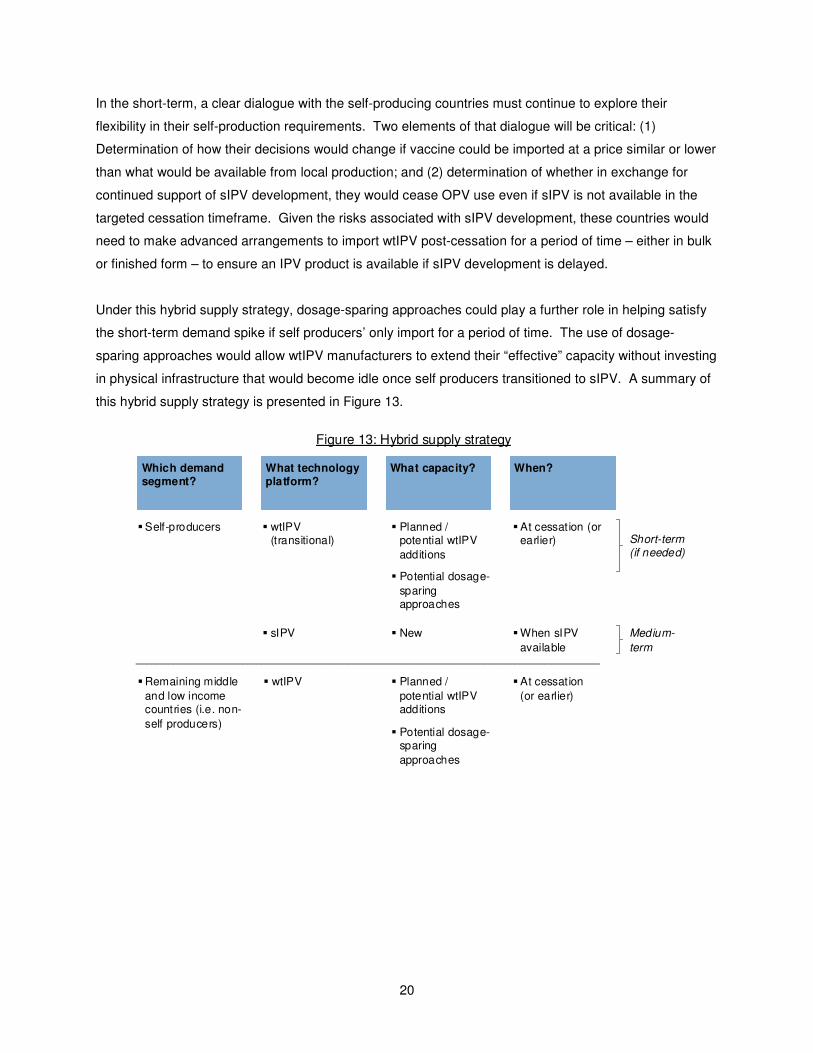
Under this hybrid supply strategy, dosage-sparing approaches could play a further role in helping satisfy
the short-term demand spike if self producers’ only import for a period of time. The use of dosage-
sparing approaches would allow wtIPV manufacturers to extend their “effective” capacity without investing
in physical infrastructure that would become idle once self producers transitioned to sIPV. A summary of
this hybrid supply strategy is presented in Figure 13.
Which demand segment?
What technology platform?
What capacity? When?
�Self-producers � wtIPV (transitional)
�Remaining middle
and low income countries (i.e. non-
self producers)
� sIPV
� Planned / potential wtIPV
additions
� Potential dosage-
sparing approaches
� New
�At cessation (or earlier)
�When sIPV
available
� wtIPV � Planned /
potential wtIPV additions
� Potential dosage-sparing
approaches
�At cessation
(or earlier)
Short-term(if needed)
Medium-
term
Figure 13: Hybrid supply strategy
21
Path forward
We recommend several key next steps for the community based on these findings.
Seek indicative vaccine pricing from wtIPV manufacturers
It is important to engage the wtIPV manufacturers to understand potential vaccine pricing before making a
conclusive assessment on the affordability of wtIPV. Ideally wtIPV manufacturers would provide the
community price estimates across a range of different demand levels. This would allow the community to
evaluate the trade-offs associated with different supply strategies as well as inform the program’s future
research activities. In addition, given the concentration of wtIPV supply, the community might consider
long-term contracting mechanisms that would guarantee sustained affordability.
Rapidly complete the evaluation of schedule and dosage-sparing options
The community should rapidly complete the ongoing evaluation of the wide range of potential schedule
(i.e., number of doses) and dosing-sparing options within the context of expected supply and demand.
This evaluation should include a heightened dialogue with the manufacturers (particularly the more
constrained players with an interest in dosage-sparing approaches) to optimize their participation.
Incorporate the research on IPV schedule and dose-reduction into the development of
clear policy guidance for countries on the use of IPV post-eradication and assist
countries in their decision making
Global health policy bodies should move towards issuing definitive guidance on the use of IPV. This
guidance should address which situations / conditions warrant the use of IPV, when it should be adopted,
for how long, and with what schedule. To that end, SAGE has recently established an IPV working group,
which conducted its first meeting in early October. Under current timelines, this working group will deliver
its initial recommendation to SAGE by 2011. In addition, it will be critical for GPEI stakeholders to work
closely with the countries to help them make timely decisions around the introduction of IPV – this would
include assessing the local situation in the context of the broader policy guidance.
Clarify the intentions of the “self-producers” concerning IPV
The flexibility of the “self-producing” countries should be further explored as their perspectives will impact
decisions around technology / supplier choice. It will be critical to determine how their decisions would
change if vaccine could be imported for similar or lower price than local production. In addition, it will be
important to understand whether these countries would cease the use of OPV even if sIPV is not
available at the time of global cessation. Depending on the models pursued, it may be necessary for
22
these countries to enter into supply agreements with wtIPV manufacturers to import product for a
transitional timeframe until sIPV is available.
Refine demand estimates and communicate to manufacturers / donors in accordance
with key eradication milestones
A more refined demand estimate should be developed based on the research on potential IPV
schedules/dose and an understanding of specific country decision making, particularly that of the self-
producers. This demand should be communicated to existing and new IPV manufacturers given the
three-to-five years of lead time associated with the build out and validation of new production capacity. A
consolidated view of low-income country IPV demand should also be shared with potential donors so they
can further define their post-OPV cessation role in co-financing arrangements for IPV use in such
settings.
Aggressively manage the risks of sIPV as development continues
With support from the community, public and private-sector manufacturers should continue to carefully
monitor and manage each of the key risks associated with sIPV. As obstacles arise in development that
impact the immunogenicity profile and/or timing, the community will need to continue to reassess the role
of sIPV and identify potential measures (e.g., development assistance) that can be pursued. In addition,
if it is important that sIPV is economically competitive with wtIPV, manufacturers need to carefully
consider the implications of facility and scale point decisions.
Further evaluate key elements of the stand-alone versus combination decision and
incorporate into demand projections shared with manufacturers
Several additional elements need to be evaluated to appropriately make the stand-alone vs. combination
decision. First, the economic and supply situation around combination vaccines should be evaluated to
determine whether these vaccines can be supplied at appropriate volumes within the economic
breakeven range by key eradication milestones. Second, a better understanding of country perspectives
(economic and non-economic) should be developed around the value of combination vaccines. Third, as
SAGE continues to review its current guidance on the pertussis component of combination vaccines, any
changes to its current policy on wP vs. aP should be incorporated into decisions regarding IPV stand-
alone vs. hexavalent products. It is critical that the perspective on stand-alone vs. combination vaccines
be incorporated into demand projections that are shared with manufacturers. Current and potential
manufacturers are pursuing a range of different products and without clarity on this issue, supply is likely
to be mismatched to demand in the future.
23
Credits
The Bill & Melinda Gates Foundation, WHO, and Oliver Wyman would like to thank the many individuals,
public institutions, and companies that provided data, insights, and expert opinions during the course of
this project. These contributions have been exceptional and were invaluable to the effort.
Author contact information
Dr. Linda Venczel ([email protected]) – The Bill & Melinda Gates Foundation
Dr. Steve Landry ([email protected]) – The Bill & Melinda Gates Foundation
Dr. Bruce Aylward ([email protected]) – World Health Organization, GPEI group
Dr. Roland Sutter ([email protected]) – World Health Organization, GPEI group
Mr. Adam Sabow ([email protected]) – Oliver Wyman
Mr. Graegar Smith ([email protected]) – Oliver Wyman