GLOBAL POSITIONING SYSTEM OUTAGE EN … of Transportation in the interest of information ... 2.4.3...
107
ote ote ote ote technical note techn Document is available to the public through the National Technical Information Service, Springfield, Virginia 22161 U.S. Department of Transportation Federal Aviation Administration William J. Hughes Technical Center Atlantic City International Airport, NJ 08405 technical note techn Document is available to the public through the National Technical Information Service, Springfield, Virginia 22161 U.S. Department of Transportation Federal Aviation Administration William J. Hughes Technical Center Atlantic City International Airport, NJ 08405 technical note techn Document is available to the public through the National Technical Information Service, Springfield, Virginia 22161 U.S. Department of Transportation Federal Aviation Administration William J. Hughes Technical Center Atlantic City International Airport, NJ 08405 technical note techn Document is available to the public through the National Technical Information Service, Springfield, Virginia 22161 U.S. Department of Transportation Federal Aviation Administration William J. Hughes Technical Center Atlantic City International Airport, NJ 08405 ote ote ote ote technical note techn Document is available to the public through the National Technical Information Service, Springfield, Virginia 22161 U.S. Department of Transportation Federal Aviation Administration William J. Hughes Technical Center Atlantic City International Airport, NJ 08405 technical note techn Document is available to the public through the National Technical Information Service, Springfield, Virginia 22161 U.S. Department of Transportation Federal Aviation Administration William J. Hughes Technical Center Atlantic City International Airport, NJ 08405 technical note techn Document is available to the public through the National Technical Information Service, Springfield, Virginia 22161 U.S. Department of Transportation Federal Aviation Administration William J. Hughes Technical Center Atlantic City International Airport, NJ 08405 technical note techn Document is available to the public through the National Technical Information Service, Springfield, Virginia 22161 U.S. Department of Transportation Federal Aviation Administration William J. Hughes Technical Center Atlantic City International Airport, NJ 08405 GLOBAL POSITIONING SYSTEM OUTAGE EN ROUTE SIMULATION Nicole S. Racine, Titan Edmundo A. Sierra, Jr., Titan Karen Buondonno, ACB-330 April 2005 DOT/FAA/CT-TN05/21
Transcript of GLOBAL POSITIONING SYSTEM OUTAGE EN … of Transportation in the interest of information ... 2.4.3...

ote
ote
ote
ote
tech
nica
l not
ete
chn
Document is available to the publicthrough the National Technical InformationService, Springfield, Virginia 22161
U.S. Department of TransportationFederal Aviation Administration
William J. Hughes Technical CenterAtlantic City International Airport, NJ 08405
tech
nica
l not
ete
chn
Document is available to the publicthrough the National Technical InformationService, Springfield, Virginia 22161
U.S. Department of TransportationFederal Aviation Administration
William J. Hughes Technical CenterAtlantic City International Airport, NJ 08405
tech
nica
l not
ete
chn
Document is available to the publicthrough the National Technical InformationService, Springfield, Virginia 22161
U.S. Department of TransportationFederal Aviation Administration
William J. Hughes Technical CenterAtlantic City International Airport, NJ 08405
tech
nica
l not
ete
chn
Document is available to the publicthrough the National Technical InformationService, Springfield, Virginia 22161
U.S. Department of TransportationFederal Aviation Administration
William J. Hughes Technical CenterAtlantic City International Airport, NJ 08405
ote
ote
ote
ote
tech
nica
l not
ete
chn
Document is available to the publicthrough the National Technical InformationService, Springfield, Virginia 22161
U.S. Department of TransportationFederal Aviation Administration
William J. Hughes Technical CenterAtlantic City International Airport, NJ 08405
tech
nica
l not
ete
chn
Document is available to the publicthrough the National Technical InformationService, Springfield, Virginia 22161
U.S. Department of TransportationFederal Aviation Administration
William J. Hughes Technical CenterAtlantic City International Airport, NJ 08405
tech
nica
l not
ete
chn
Document is available to the publicthrough the National Technical InformationService, Springfield, Virginia 22161
U.S. Department of TransportationFederal Aviation Administration
William J. Hughes Technical CenterAtlantic City International Airport, NJ 08405
tech
nica
l not
ete
chn
Document is available to the publicthrough the National Technical InformationService, Springfield, Virginia 22161
U.S. Department of TransportationFederal Aviation Administration
William J. Hughes Technical CenterAtlantic City International Airport, NJ 08405
GLOBAL POSITIONING SYSTEM OUTAGE EN ROUTE SIMULATION
Nicole S. Racine, Titan Edmundo A. Sierra, Jr., Titan Karen Buondonno, ACB-330
April 2005 DOT/FAA/CT-TN05/21
NOTICE
This document is disseminated under the sponsorship of the U.S. Department of Transportation in the interest of information exchange. The United States Government assumes no liability for the contents or use thereof. The United States Government does not endorse products or manufacturers. Trade or manufacturer's names appear herein solely because they are considered essential to the objective of this report.
DISCLAIMER
This study was designed to meet the specific requirements of the sponsor within the constraints of cost, schedule, participant availability, laboratory capability, and experimental control. Though this experiment emulated aspects of the operational environment at high fidelity levels, all simulation studies presume some limitations and assumptions.
It is standard scientific practice for analysts to break down large, complex issues into smaller components and examine them under relatively controlled conditions, while recognizing that additional factors can influence the outcome. Therefore, whereas this study provides valuable data concerning particular technologies and/or procedures, it may not fully address all issues associated with these particular technologies and/or procedures.
Interpretation and application of the findings from this work and all similar experimental research should be limited to what is reasonable, based on the data, and used by the stakeholders as input to the decision process. Additional studies may be required to fully address the issues surrounding the technologies and/or procedures examined in this study.

Technical Report Documentation Page 1. Report No. DOT/FAA/CT-TN05/21
2. Government Accession No.
3. Recipient’s Catalog No. 5. Report Date April 2005
4. Title and Subtitle Global Positioning System Outage En Route Simulation
6. Performing Organization Code ACB-330
7. Author(s) Nicole Racine and Edmundo Sierra (Titan Corporation), and Karen Buondonno (FAA Simulation and Analysis Group)
8. Performing Organization Report No. DOT/FAA/CT-TN05/21 10. Work Unit No. (TRAIS)
9. Performing Organization Name and Address Federal Aviation Administration Simulation and Analysis Group William J. Hughes Technical Center Atlantic City International Airport, NJ 08405
11. Contract or Grant No.
13. Type of Report and Period Covered Technical Note
12. Sponsoring Agency Name and Address Federal Aviation Administration Required Navigation Performance Division 800 Independence Avenue S.W. Washington, D.C. 20591
14. Sponsoring Agency Code
ATP-500
15. Supplementary Notes 16. Abstract This study provided an initial examination of the workload and operational issues associated with a controller's ability to manage a Global Positioning System/Wide Area Augmentation System/Local Area Augmentation System outage situation under the conditions simulated. Twenty-seven Certified Professional Controllers staffed Jacksonville Air Route Traffic Control Center sectors emulated on a high fidelity platform. Controller teams operated in one of three Environment groups: a baseline group representing current airspace conditions, a second representing future avionics equipage, and a third representing future avionics equipage with a 50% decommissioning of a select group of ground-based navigation aids. All teams experienced three Outage conditions: no outage, a partial outage in which the GPS/WAAS/LAAS signal was not available to a portion of the airspace, and a full outage where the signal was completely unavailable. Partial and full outage conditions emulated Radio Frequency Interference (RFI) effects. Controllers indicated an increase in workload and provided comments indicating operationally important areas of increased workload that included congested frequencies and increased coordination. The conclusion made in this report is that there was a relevant effect of Outage on workload as simulated; however, controllers were generally able to compensate for the increase. Operational issues that became apparent included the need for clear procedures on both the air and ground sides during an outage, frequency congestion, and equipment identifier interpretation. The Environment factor was inconsequential.
17. Key Words Global Positioning System, GPS outage, GOERS, Air Traffic Controller, Certified Professional Controller
18. Distribution Statement This document is available to the public through the National Technical Information Service, Springfield, Virginia, 22161
19. Security Classif. (of this report) Unclassified
20. Security Classif. (of this page) Unclassified
21. No. of Pages 107
22. Price
Form DOT F 1700.7 (8-72) Reproduction of completed page authorized

iii

Acknowledgements
The authors wish to acknowledge several individuals and teams who contributed their expert talent and many long hours to this study. Without their hard work and outstanding support, this simulation would not have been a success.
Members of the GOERS Research Team: Jerry Baker (MITRE CAASD), Charlyn Davis (ATP-110), Mike Dodd (AMTI), Bruce J. Lawson (Boston ARTCC-Host), Terry Mahaffey (NATCA GOERS representative), Vince Massimini (MITRE CAASD), David Olsen (ASD-140), Don Porter (ATP-500), and Jeff Williams (ATP-500).
Air Traffic Control Subject Matter Experts: The authors wish to thank and extend special recognition to three talented air traffic control professionals, Lance Bonin (ZJX), Carrie Lee (ZJX), and Ben Snow (ZJX). Their enthusiasm and dedication to this project was truly admirable and undeniably invaluable. In addition, we would like to recognize Tim Anderson (WCG), Philip Bassett (ZJX), Jack Graff (Titan Systems), and Tim Holth (Titan Systems).
Jacksonville ARTCC: National Air Traffic Controllers Association and the participating Certified Professional Controllers.
Study Design, Execution, and Analysis Support at the FAA William J. Hughes Technical Center (WJHTC): Ulf Ahlstrom (ACB-330), Susan Aspenberg (Titan Corporation), Vince Lasewicz (ACB-330), Sherri Magyarits (ACB-330), Rick Ozmore (ACB-330), Kim Bender (Titan Corporation), and Parimal Kopardekar (ACB-100).
Facility and Laboratory Support at the FAA WJHTC: Mike Capito (Titan Corporation), Scott Cramer (ACB-860), Scott Doucett (ACB-860), Jim Hamilton (Titan Corporation), Jullia Moore (Titan Corporation), Stan Rimdzius (Titan Corporation), Dana Whicker (Titan Corporation), the Pseudo Aircraft Simulation Laboratory staff, and the VSCS and DSF Laboratory support staffs.
iv

v

TABLE OF CONTENTS
Page
Acknowledgements........................................................................................................................ iv
Executive Summary .........................................................................................................................x
1. Introduction..................................................................................................................................1 1.1 Background............................................................................................................................2 1.2 Study Objectives ....................................................................................................................3
2. Method .........................................................................................................................................4 2.1 Simulation Design..................................................................................................................4 2.2 Participants.............................................................................................................................5 2.3 Simulation Support Personnel ...............................................................................................6
2.3.1 Technical Observers........................................................................................................6 2.3.2 Simulation Pilots .............................................................................................................6 2.3.3 Ghost Controllers ............................................................................................................6 2.3.4 Operations Supervisor.....................................................................................................6 2.3.5 GOERS Research Team..................................................................................................7
2.4 Facility and Equipment Configuration ..................................................................................8 2.4.1 Display System Facility 1 ...............................................................................................8 2.4.2 Target Generation Facility ..............................................................................................9 2.4.3 Voice Switching and Control System .............................................................................9 2.4.4 Workload Assessment Keypad .......................................................................................9 2.4.5 Decision Support Tools.................................................................................................10
2.5 Airspace ...............................................................................................................................10 2.5.1 LAKE CITY Sector ......................................................................................................10 2.5.2 OCALA Sector..............................................................................................................10 2.5.3 CEDAR KEY Sector.....................................................................................................11
2.6 Scenarios..............................................................................................................................11 2.6.1 GPS Outages .................................................................................................................13 2.6.2 Aircraft GPS and Avionics Equipage ...........................................................................15 2.6.3 Ground-Based Navigation Aid Reductions ..................................................................15 2.6.4 Scripted Aircraft Requiring Assistance.........................................................................15 2.6.5 Scripted Request for Information..................................................................................15 2.6.6 Blocked Communications .............................................................................................16
2.7 Simulation Procedure...........................................................................................................16 2.7.1 Briefing .........................................................................................................................16 2.7.2 Laboratory Familiarization ...........................................................................................17 2.7.3 Controller Participant Training .....................................................................................17 2.7.4 Simulation Pilot/Ghost Controller Training..................................................................17 2.7.5 Scenario Run Order.......................................................................................................18
2.8 Data Collection ....................................................................................................................18 2.8.1 Subjective Data .............................................................................................................18 2.8.2 Objective Data ..............................................................................................................20
2.9 Technical Observer During-the-Run Form..........................................................................20
vi

3. Results........................................................................................................................................20 3.1 Workload Ratings ................................................................................................................21
3.1.1 Overall Analysis............................................................................................................22 3.1.2 Questionnaire Results ...................................................................................................23
3.2 Traffic Flow Restrictions .....................................................................................................25 3.2.1 Overall Analysis............................................................................................................26 3.2.2 Questionnaire Results ...................................................................................................26
3.3 Number of Point-Outs..........................................................................................................27 3.3.1 Overall Analysis............................................................................................................28
3.4 Communications ..................................................................................................................28 3.4.1 Overall Analysis............................................................................................................30 3.4.2 Questionnaire Results ...................................................................................................31
3.5 Traffic and Workload Time Series Data..............................................................................33 3.6 Traffic Count........................................................................................................................36
3.6.1 Overall Analysis............................................................................................................36 3.6.2 Questionnaire Results ...................................................................................................37
3.7 Technical Observer Reported Airspace Violations .............................................................38 3.7.1 Comparison Between Outages ......................................................................................38 3.7.2 Comparison Between Environments.............................................................................40 3.7.3 Questionnaire Results ...................................................................................................41
3.8 Separation Violations...........................................................................................................41 3.9 Requests for a Tracker .........................................................................................................42
3.9.1 Overall Analysis............................................................................................................43 3.10 Debriefing ..........................................................................................................................43
3.10.1 Assessing an Outage ...................................................................................................43 3.10.2 Air-Ground Coordination............................................................................................43 3.10.3 Ground-to-Ground Coordination ................................................................................44 3.10.4 Complexity..................................................................................................................44 3.10.5 Tracking Aircraft Experiencing a Loss of GPS Signal ...............................................45 3.10.6 Learning Curve ...........................................................................................................45 3.10.7 Impact of Backup Navigation Systems.......................................................................45 3.10.8 Situational Awareness.................................................................................................45 3.10.9 Simulation Realism.....................................................................................................46
4. Discussion ..................................................................................................................................46
5. GOERS Research Team Observations.......................................................................................48
6. Conclusions................................................................................................................................49
7. Future Study Recommendations ................................................................................................51
Acronyms.......................................................................................................................................53
References......................................................................................................................................55
vii
APPENDICES
Appendix A Technical Observer During-the-Run Questionnaire Appendix B Technical Observer Post-Run Questionnaire Appendix C Controller Briefing Appendix D Background Questionnaire Appendix E Informed Consent Form Appendix F Controller Post-Run Questionnaire Appendix G Controller Post-Simulation Questionnaire
LIST OF FIGURES
Page
Figure 1. Console assignments – DSF1. .........................................................................................9 Figure 2. The Lake City (78), Ocala (15), and Cedar Key (14) Sectors.......................................11 Figure 3. Areas affected by RFI in partial outage condition.........................................................14 Figure 4. Area affected by RFI in full outage condition...............................................................14 Figure 5. Mean subjective workload ratings (± standard errors) as a function of
Environment and Outage. .........................................................................................22 Figure 6. Mean response choices (± standard errors) for partial and full outage conditions
given in the Controller Post-Run Questionnaire.......................................................24 Figure 7. Mean response choices (± standard errors) for partial and full outage conditions
given in the Controller Post-Run Questionnaire.......................................................25 Figure 8. Sector teams imposing traffic flow restrictions in each environment per outage
occurrence.................................................................................................................26 Figure 9. Number of traffic flow restrictions for each Outage (n = 9) by first, second, and
third encounter. .........................................................................................................27 Figure 10. Mean number of point-outs (± standard errors) as a function of Environment and
Outage.......................................................................................................................28 Figure 11. Mean frequency air-to-ground (only) communications (± standard errors) as a
function of Environment and Outage........................................................................29 Figure 12. Mean frequency of ground-to-air (only) communications (± standard errors) as a
function of Environment and Outage........................................................................29 Figure 13. Mean frequency of G/G communications (± standard errors) as a function of
Environment and Outage. .........................................................................................30 Figure 14. Mean traffic counts (± standard errors) for no outage, partial outage and full
outage conditions in the current environment...........................................................33 Figure 15. Mean subjective workload ratings (± standard errors) for no outage, partial
outage and full outage conditions in the current environment..................................34 Figure 16. Mean traffic count (± standard errors) for no outage, partial outage, and full
outage conditions in the future environment. ...........................................................34
viii
Figure 17. Mean subjective workload ratings (± standard errors) for no outage, partial outage, and full outage conditions in the future environment. .................................35
Figure 18. Mean traffic counts (± standard errors) for no outage, partial outage, and full outage conditions in the MON environment.............................................................35
Figure 19. Mean subjective workload ratings (± standard errors) for no outage, partial outage, and full outage conditions in the MON environment...................................36
Figure 20. Number of sector teams reported as having committed an airspace violation by Outage.......................................................................................................................39
Figure 21. Percentage each airspace violation category contributed to the total number of violations by Outage. ................................................................................................39
Figure 22. Mean airspace violations (± standard errors) committed in each Environment. .........40 Figure 23. Percentage each airspace violation category contributed to the average number of
violations in each Environment. ...............................................................................41 Figure 24. Frequency of T/O responses to Question 5. ................................................................42
LIST OF TABLES
Page
Table 1a. Scenario Characteristics................................................................................................12 Table 1b. Equipage Set .................................................................................................................13 Table 2. Differences Between Environments ...............................................................................13 Table 3. Data Collection Scenarioa Run Order .............................................................................18 Table 4. Subjective Data Instruments Summary...........................................................................19 Table 5. Objective Data Instrument Summary .............................................................................20 Table 6. Objective Data Measures ................................................................................................21 Table 7. Workload: Analysis of Variance.....................................................................................23 Table 8. Air-to-Ground (only): Analysis of Variance for Communications ................................30 Table 9. Ground-to-Air (only): Analysis of Variance for Communications ................................31 Table 10. Ground-to-Ground: Analysis of Variance for Communications ..................................31 Table 11. Question 19 responses to, "Please indicate how the loss of GPS affected the
manageability of activities associated with G/G communications." ........................32 Table 12. Question 20 responses to “Please indicate how the loss of GPS affected the
manageability of activities associated with A/G communications.” ........................32 Table 13. Traffic Count: Analysis of Variance.............................................................................37 Table 14. Airspace Violations as a Function of Environment and Outage...................................38 Table 15. Total Frequency of Separation Violations ....................................................................42
ix
Executive Summary
The Federal Aviation Administration is in the process of enhancing the capabilities of the Global Positioning System (GPS) to enable its use as a primary navigation source for en route and terminal applications in the National Airspace System (NAS). This capability may allow some current ground-based radio-navigation aids to be decommissioned and the removal of some avionics from aircraft. GPS, augmented with a Wide Area Augmentation System, may provide a robust navigation capability that will meet integrity, accuracy, and availability requirements for the NAS, except possibly for Radio Frequency Interference (RFI) on GPS transmission frequencies.
Due to the potential for either intentional or unintentional RFI, the Air Traffic Area Navigation (RNAV) Implementation Office, ATP-104 (reorganized as the Required Navigation Performance (RNP) Division, ATP-500) directed the En Route Procedures Branch (ATP-110) to be the sponsoring organization for this simulation. Due to a management personnel change at ATP-110 and for the purpose of having a sponsor adequately familiar with the GOERS project, it was determined that the ATP-500 Division Manager would sign as the sponsoring authority. The Simulation and Analysis Group, ACB-330, led and conducted the GPS Outage En Route Simulation (GOERS) study on October 22-November 19, 2002 at the William J. Hughes Technical Center (WJHTC), in Atlantic City International Airport, NJ.
The specific objectives of the GOERS were 1) to assess the impact of a GPS outage on controller workload; 2) to identify operational issues that may arise as a result of a GPS outage under the conditions simulated; and 3) to provide a basis for conducting further simulations.
The WJHTC provided a high fidelity platform to emulate three sectors from Jacksonville Air Route Traffic Control Center (ARTCC). Three groups of nine Certified Professional Controllers (CPCs) from Jacksonville ARTCC staffed emulated sectors over a period of 3 weeks. CPCs experienced a total of nine different scenarios that incorporated three environmental conditions (i.e., current, future, and a minimum operational network of Very-high-frequency Omni Range navigation aids with future avionics equipage), and three degrees of GPS coverage (i.e., no outage, partial outage, and full outage).
Subjective and objective data were collected by automated and manual means throughout the simulation. Subjective data included workload ratings, questionnaires, and debriefing comments. Objective data included recordings of communications, flight data, air traffic system data, and observer data.
Assessing the impact of a GPS outage (i.e., RFI as simulated) on controller workload was a major objective of this simulation. The data gathered in the simulation did not decidedly indicate consistent effects of the GPS outages on controller workload. The subjective ratings of workload were all within the moderate range and much of the related objective measures showed no differences between outages, indicating perhaps a minimal operational relevance of observed workload increase. On the other hand, a repeated measures analysis of variance revealed a statistically significant effect of Outage on mean workload ratings. This may have been an indicator that workload did increase substantially but was redistributed through actions such as requesting trackers and changing coordination behaviors. Additionally, a significant number of
x

the controllers provided comments that indicated areas of increased workload that were operationally important, including congested frequencies and increased coordination.
The controllers reported that workload might be even higher in the real world because there may be more frequency congestion and coordination necessary in the event of an outage. In addition, workload would be adversely impacted with the occurrence of more aircraft requiring assistance than were represented in the simulation. Therefore, the conclusion made in this report is that there was a relevant effect of GPS outages on workload; however, the controllers were generally able to compensate for the increase in workload. Future simulations should explore controller redistribution of workload during outages and how the redistribution affects the performance of the system. However, they should incorporate comments and lessons learned from this simulation, such as improved phraseology and procedures.
Operational issues that became apparent from this study include the need for clear procedures on both the air and ground sides during an outage. Frequency congestion was a significant concern among the controllers. Most controllers reported that all aircraft informing them of an outage situation was a nuisance and resulted in an unnecessary increase in Air Traffic Control (ATC) workload. Controllers also expressed concern that phraseology was inadequate and needs to be developed to specifically address these types of GPS outages. In addition, less urgent tasks, such as marking strips, could possibly be shed during very busy traffic flows.
The ability of controllers to correctly interpret aircraft backup navigation capabilities was lacking. Controllers indicated that current equipage identifiers do not adequately inform the controller of backup navigation capabilities in the event of a GPS outage. The controllers also expressed concern regarding their difficulty staying updated with the increasing number of equipment identifiers. In addition, the controllers expressed a need for a means to determine whether a failure is system related or an isolated aircraft equipment failure.
To thoroughly assess the impact of GPS outages on the ATC system, it is recommended that further simulations be conducted in other operational environments including en route to terminal transitional sectors, terminal sectors, and sectors that utilize grid structure in lieu of airways. In addition, scenarios should include more instances of aircraft emergencies and more moderate traffic flows with peaks and troughs. Finally, procedures for aircraft reporting outages with proper phraseology need to be clearly defined.
xi

1. INTRODUCTION
The Federal Aviation Administration (FAA) is in the process of enhancing the capabilities of the Global Positioning System (GPS) to enable its use as a primary navigation source for en route and terminal applications in the National Airspace System (NAS). To accomplish this, the FAA plans to implement the Wide Area Augmentation System (WAAS) and is investigating potential implementation of the Local Area Augmentation System (LAAS). WAAS implementation will support the use of GPS for en route and terminal navigation and non-precision and near precision instrument approaches. LAAS implementation will support increased Category I (CAT I) availability at high traffic airports and will enable Category II (CAT II) and Category III (CAT III) precision approaches.
A major benefit of GPS augmentation is its ability to provide a primary means of navigation for all phases of flight. This capability may allow some current ground-based navigation aids (GBNA) to be decommissioned and the removal of some avionics from aircraft. The proposed decommissioning of the GBNA is dependent upon WAAS performance, user acceptance, and adequate user equipage rates. After these conditions are met, the planned decommissioning of GBNA would begin, and GPS would become the primary means of navigation. As a result, the unlikely event of GPS outages has become a concern.
The National Air Traffic Satellite Operational Implementation Team, an air traffic team that assists with GPS development and implementation, recommended that Air Traffic Control (ATC) human factors issues be identified and appraised prior to or during any national implementation of advanced area navigation (RNAV). The Air Traffic Planning and Procedures Program (ATP-1) and Office of Architecture and System Engineering (ASD-100) also recognized the importance of addressing human factors issues associated with GPS outage studies. As a result, it was determined that the controller's ability to manage an outage situation, particularly if resulting from deliberate interference to the system, should be studied in a real-time environment. Also identified was the need for two separate simulation environments, the en route environment, to take place first, with the terminal environment to take place at a later date. The GPS En Route Simulation (GOERS) Research Team was formed to develop and execute the en route simulation. Various FAA organizations, the National Air Traffic Controllers Association (NATCA), National Association of Air Traffic Specialists (NAATS), and MITRE Center for Advanced Aviation System Development (CAASD) represent the GOERS team. The FAA will conduct a GPS Outage Terminal Simulation (GOTS) in the future.
This document describes a concept exploration GOERS study. The Simulation and Analysis Group, ACB-330, led and conducted the GOERS study at the William J. Hughes Technical Center (WJHTC), in Atlantic City International Airport, NJ. The Air Traffic RNAV Implementation Office, ATP-104 (reorganized as the Required Navigation Performance (RNP) Division, ATP-500) directed the En Route Procedures Branch (ATP-110) to be the sponsoring organization for this simulation. Due to a management personnel change at ATP-110 and for the purpose of having a sponsor adequately
1

familiar with the GOERS project, it was determined that the ATP-500 Division Manager would sign as the sponsoring authority.
1.1 Background
GPS is a satellite-based system operated and maintained by the United States (U.S.) government. It was declared operational in 1994 and is used for navigation, position determination, and timing applications. The GPS constellation nominally consists of 24 satellites orbiting approximately 11,000 nm above the earth’s surface; the satellites and the ground-based control segment are operated by the Department of Defense. Civil users receive signals from the GPS satellites on a single frequency (L1: 1575.42 MHz) and compute their position. Planned improvements to GPS will provide additional frequencies for civil use by approximately 2013 for improved performance.
The U.S. and many other countries have authorized GPS for civil aviation use as a supplemental navigation system. As such, navigation can be performed using GPS, but avionics compatible with primary GBNA, such as Very-high-frequency Omni Range (VOR) and Instrument Landing System (ILS), must be maintained on board aircraft and on the ground.
To become a primary navigation system, GPS must be augmented to attain the integrity, availability, and accuracy required for civil aviation applications. Both space-based and ground-based augmentation systems are planned. The U.S. WAAS will use ground monitors and geosynchronous satellites to provide integrity, accuracy, and availability suitable for primary navigation in en route through non-precision approach phases of flight. It will also provide near-precision approaches at many airports. Ground-based LAAS is also being developed to provide precision approaches at larger airports. It is envisioned that augmented GPS will become the primary means by which instrument flight rules (IFR) aircraft navigate in the U.S. NAS.
Widespread use of augmented GPS will have many benefits. It will allow aircraft to perform RNAV, flying direct from point-to-point without reliance on GBNA, and will allow ATC to design routes without being constrained to GBNA. Also, the potential for elimination of many GBNA and related avionics exists, saving money both for aircraft owners and for the FAA (FAA, 2002).
Studies (Hegarty, Wroblewski, & Markin, 1996) have shown that WAAS will provide a robust navigation capability that will meet integrity, accuracy, and availability requirements for the NAS, except possibly for Radio Frequency Interference (RFI) on GPS transmission frequencies. GPS remains vulnerable to both unintentional and intentional RFI. WAAS and LAAS are augmentations of the GPS; therefore, any loss of GPS would also imply a loss of WAAS and LAAS capability within the affected area. The addition of other frequencies to the civil system should reduce susceptibility to unintentional interference, but a perceived or actual vulnerability to intentional interference will remain. To mitigate the threat of RFI, the FAA has committed to retain a system of GBNA (i.e., VORs, Distance Measuring Equipment (DME), and ILSs) for an
2

indefinite period of time. The Loran-C radio navigation system will also continue in operation while its long-term need is being evaluated.
The extent of the GBNA system retained has not yet been finalized, but the FAA proposes reductions that extend over several years. Expectations are that the resultant GBNA population will serve as a backup network to GPS and that RNAV will be the primary navigation method. Preliminary analysis has indicated that a Minimum Operational Network (MON) consisting of approximately 50% of today's VOR population would be needed to provide a suitable backup capability for en route navigation. The entire population of DME systems is likely to be retained to support RNAV operations by aircraft with scanning-DME/Flight Management System (FMS) equipment.
Users may be permitted to operate under IFR in the NAS with only augmented (WAAS capable) GPS avionics, but retaining other avionics compatible with the GBNA would also present some advantages. Most large transport category jets will almost certainly retain the capability for inertial navigation because Inertial Reference Systems (IRSs) are essential to the operation of many aircraft systems (e.g., attitude and heading reference). Inertial navigation may permit en route navigation independent of GPS or GBNA. Thus, an outage of GPS during the en route phase of flight should have minimal effect on these aircraft. Smaller jets, turboprops, and general aviation (GA) aircraft do not generally have inertial equipment, although the development of low-cost inertial systems could result in some equipage. The aircraft without inertial systems would be dependent on GPS if no GBNA-compatible avionics were retained. Additionally, aircraft with FMSs that retain GBNA compatible avionics (especially DME/DME capabilities) will be able to perform RNAV if GBNA-compatible avionics are retained or if the aircraft has an inertial system. Virtually all transport category jets will have these backup systems, reducing the effect of a GPS outage. GA aircraft that do not have backup systems will likely experience more of an effect from a GPS outage.
It is essential that the FAA determine what kind of effect a GPS outage would have on controller workload and procedures because of the potential for a GPS outage and the predicted extent of dependence on GPS for navigation. Therefore, an experiment to estimate how controllers would react to a GPS outage and to determine operational issues that may result from an outage situation would be valuable.
1.2 Study Objectives
This study was intended to provide an initial examination of the workload and operational issues associated with a controller’s ability to manage a GPS/WAAS/LAAS outage situation under the conditions simulated. The conditions described represent today’s environment and several reduced GBNA and mixed avionics environments.
3

The specific objectives were
• to assess the impact of a GPS outage on controller workload,
• to identify operational issues that may arise as a result of a GPS outage under the conditions simulated, and
• to identify potential issues to investigate in future simulations.
The experiment described in this document focused on the en route environment. Further simulation studies will investigate terminal and/or joint en route and terminal operations. Other domains, such as oceanic, may also be considered for future research.
2. METHOD
The simulation was designed as a real-time, high fidelity simulation. Three sectors of the Jacksonville Air Route Traffic Control Center (ARTCC) (ZJX) were replicated in the WJHTC Display System Facility (DSF). Three environmental conditions were simulated: a current baseline, a future environment (∼2013-2015) without GBNA reduction, and the MON (∼2013-2015) with GBNA reduction. The effect of different levels of GPS outages was examined in each condition.
Traffic scenarios were developed from flight plans extracted from ZJX System Analysis Recording (SAR) tapes and accompanying Adaptation Control Environment System (ACES) configuration tapes from the field; the traffic scenarios emulated peak air traffic conditions. Certified Professional Controllers (CPCs) who were current and qualified to control traffic participated and provided ATC services. The controller participants interacted with individuals functioning as pilots (simulation pilots) and other controllers (ghost controllers) operating adjacent sectors. The simulation pilots manipulated computer-generated targets in response to controller participant instructions.
2.1 Simulation Design
The investigation of a GPS outage should encompass combinations of reasonable possibilities concerning the presence of GBNA, GBNA-compatible avionics, RNAV and self-contained (inertial) systems, and space and ground-based GPS augmentation systems. As such, the following specifications were incorporated into the simulation design:
• Three Environments were simulated:
a. Current Operations: This scenario represented a baseline of the current operational environment. Aircraft avionics for each aircraft type emulated current levels of equipage. All current airway and jetway support was available.
b. Future Environment: This scenario represented the avionics equipage environment expected for ∼2013-2015 without any GBNA reductions. All current airway support was available.
4

c. MON: This scenario represented the avionics equipage and the navigation infrastructure expected for ∼2013-2015. Approximately 50% of the current VOR GBNA was available, but all DME support was available. The available DMEs supported RNAV DME/DME for en route operations above 10,000 ft.
• Scenarios were developed from flight plans extracted from ZJX SAR tapes and reflected current levels of traffic (i.e., not predicted levels of future traffic). Some traffic was modified (by adding aircraft and/or altering traffic flows) to reflect realistic density and complexity that these sectors typically experience today.
• The aircraft traffic mix approximated the current mix of aircraft types that currently exist in the ZJX sectors simulated.
• Two sets of aircraft equipage were used in the simulation. Set 1 had a lower percentage of GPS-equipped and IRS/FMS-equipped aircraft than Set 2. During a GPS outage
a. aircraft not equipped with inertial or GBNA-compatible avionics were required to continue by dead reckoning until receiving further instruction from ATC (e.g., radar vectors),
b. FMS-equipped aircraft that retained GBNA-compatible avionics were able to navigate using RNAV (whether equipped with GPS or not), and
c. Non-FMS-equipped aircraft that retained GBNA-compatible avionics were required to continue by dead reckoning until receiving further instruction from ATC (e.g., radar vectors, clearance via GBNA).
• GPS/WAAS/LAAS outages emulated RFI effects. The RFIs were omni-directional and cylindrical in shape with radii ranging from 80 nm to 100 nm1.
• All aircraft operating in the outage area lost GPS/WAAS/LAAS signals.
• An outage encompassed an entire sector or only part of a sector.
• Controllers were instructed to apply existing rules and procedures as defined by FAA Order 7110.65 and exercise their best judgment when a directive did not cover a situation2.
• Existing communications and radar systems were available and remained operational during GPS/WAAS/LAAS outages.
• Instrument Meteorological Conditions (IMCs) existed throughout most of the sectors simulated and at all airports within the sectors.
2.2 Participants
Three groups of nine CPCs (i.e., a total of 27 individuals) from ZJX participated in the simulation over a 3-week period. Each group participated for 5 days and was divided
1 The emitter location and the size and shape of the affected airspace volume are constructs created to enable laboratory examination of the affects of denying GPS/WAAS/LAAS signals to aircraft in the studied sectors. The constructs are representative of one possible type of RFI. Other potential signal interruption profiles are possible. 2 Described in ATC, DOT/FAA/Order 7110.65M, Chapter 1, Section 1, Paragraph 1-1-1.
5

into three, 3-member teams. Each team consisted of a Radar (R-side) Controller and a Radar Associate (D-side) Controller. A third controller functioned as an Assistant (A-side) Controller at the beginning of each run (the term “run” refers to the execution of a scenario) and was available as a Tracker Controller to the team, if needed. One team operated the LAKE CITY sector, the second team operated the OCALA sector, and the third team operated the CEDAR KEY sector. All individuals were CPCs (not Developmental CPCs).
2.3 Simulation Support Personnel
The simulation required the collaboration of various groups. The following sections describe these groups and their tasks.
2.3.1 Technical Observers
Three individuals highly familiar with ZJX operations participated as Technical Observers (T/Os). One observed the LAKE CITY sector, the second observed the OCALA sector, and the third observed the CEDAR KEY sector. All observers were CPCs. Each was currently certified to control air traffic in the sector positions they observed during the simulation. T/Os observed and recorded important events (see Appendix A). After each simulation run, they completed T/O Post-Run Questionnaires (see Appendix B). To ensure record-keeping consistency, the same individuals participated as T/Os for the entire simulation. T/Os were not subjects for study or evaluation.
2.3.2 Simulation Pilots
Simulation pilots emulated pilot communications and actions. They initiated pre-scripted air-to-ground (A/G)3 communications and responded to ATC instructions. They also entered data into the Target Generation Facility (TGF) computers in response to controller-issued instructions (e.g., turn right heading one two zero, climb to and maintain Flight Level (FL) 270). Simulation pilots were not subjects for study or evaluation.
2.3.3 Ghost Controllers
Four individuals acted as controllers for all adjacent, non-simulated sectors. These individuals accepted and initiated hand-offs and performed ground-to-ground (G/G) communications with the participant controllers. These individuals had ATC experience. Ghost controllers were not subjects for study or evaluation.
2.3.4 Operations Supervisor
One individual acted as an Operations Supervisor (OS) simulating coordination between the Traffic Management Unit (TMU) and the control room floor regarding issues related
3 The term air-to-ground communications and the associated acronym (A/G) refer to both air-to-ground and ground-to-air communications collectively, unless specifically noted otherwise.
6

to the scope of the GPS outage. The OS was there to respond to controller requests, but they did not initiate any action. The OS was not a subject for study or evaluation.
2.3.5 GOERS Research Team
2.3.5.1 ACB-330 – Simulation & Analysis Group
ACB-330 had the lead responsibility for the planning, execution, and overall management of the study at the WJHTC. The Test Director was a representative from ACB-330 who was responsible for the overall management of the simulation. This individual had the authority to direct the activities of all members of the research team as necessary to achieve simulation objectives.
Human factors and simulation experts provided by ACB-330 assisted in the planning and conduct of the simulation, the creation of questionnaires, and the debriefing. They also performed the data analyses of the subjective and objective data. ACB-330 kept and maintained simulation logs recording the start and stop times of each run, as well as the details of unusual lab events or situations that occurred during each run that may have been pertinent to the subsequent analysis of the simulation results. The experiment team consisted of a test director, simulation experts, and laboratory personnel.
2.3.5.2 ATP-500 – Required Navigation Performance Division
ATP-500 was the sponsoring organization of the GOERS Study. ATP-500 provided requirements guidance and approved the experiment plan before execution of the simulation. ATP-500 was also responsible for providing all controller participants in this study.
2.3.5.3 ASD-140 – Office of System Architecture and Investment Analysis
ASD-140 provided requirements guidance and input for the experiment plan before execution of the simulation. ASD-140 also provided input for simulation planning, scenario requirements, briefings, and reports.
2.3.5.4 GOERS NATCA Liaison
The designated NATCA National Liaison for the GOERS Program provided input for simulation planning, scenario requirements, briefings, and reports. The liaison participated in problem definition and shakedown events, observed the simulation runs, and participated in the debriefings following each run.
2.3.5.5 ACB-800 – Real & Virtual Environments Division
ACB-800 managed the activities of the WJHTC NAS laboratories, which included the DSR Laboratory and supporting peripherals that were used in this study. Specifically, ACB-800 managed the laboratory scheduling. All requests for laboratory time were made through the Facility Control Office (FACO) in ACB-810, which is responsible for
7

compiling, publishing, and daily updating of the weekly schedules for the En Route, Terminal, and Oceanic laboratories.
2.3.5.6 ACB-860 – Simulation Group
ACB-860 had management responsibility for the TGF staffing. TGF staff created initial flight samples for the simulation from SAR data obtained from ZJX. TGF staff also created the required Host Computer System (HCS) and Display System Replacement (DSR) builds for the simulation and supported the conduct of the simulation by operating the laboratory equipment.
2.3.5.7 Jacksonville ARTCC
CPCs from ZJX assisted in the creation and refinement of traffic scenarios and provided ZJX airspace and procedures expertise to the simulation planners and technical staff. These individuals participated in the shakedown of the problems in the DSF, ensured that the problems were realistic, and that the lab systems were properly adapted and configured for ZJX operations. Some of these CPCs also assisted in selected stages of the data and results analysis. Additionally, other ZJX CPCs were subjects of the simulation experiment, staffed the sectors, and conducted simulated ATC operations. They provided the subjective input during and after each simulation run and participated in post-simulation debriefings.
2.4 Facility and Equipment Configuration
The simulation test bed included the WJHTC, the DSF1, TGF, and Voice Switching and Control System (VSCS).
2.4.1 Display System Facility 1
The WJHTC DSF1 provided a realistic, simulated en route radar environment for the conduct of the study. The DSF1 included systems such as the DSR and the G3 HCS mainframe with associated peripheral devices. Three (common console workstations) sector positions were configured to emulate the ZJX sectors under study (see Figure 1). Each included a thermal flight strip printer, strip bays, VSCS equipment, and the lists, maps, and charts associated with the emulated sector. Ghost controllers used three additional controller positions (plus one spare) when emulating the interactions of adjacent sectors. Ghost controller positions included the same displays and equipment for the sectors they emulated.
8
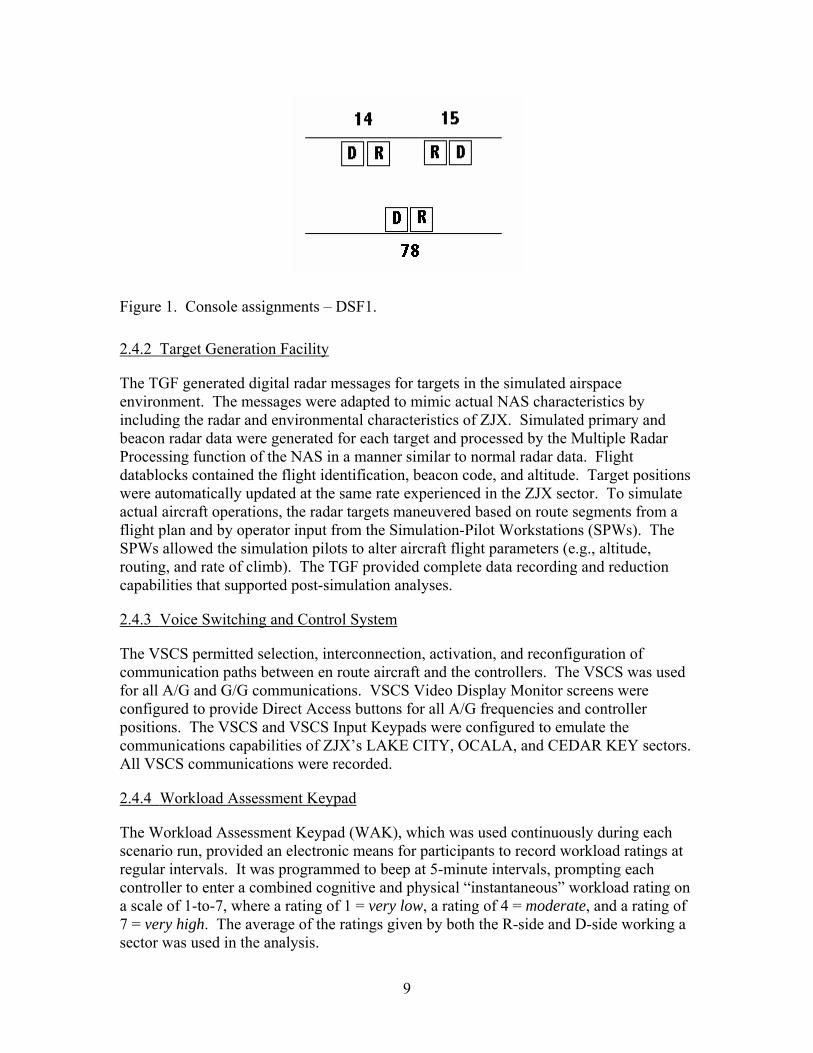
Figure 1. Console assignments – DSF1.
2.4.2 Target Generation Facility
The TGF generated digital radar messages for targets in the simulated airspace environment. The messages were adapted to mimic actual NAS characteristics by including the radar and environmental characteristics of ZJX. Simulated primary and beacon radar data were generated for each target and processed by the Multiple Radar Processing function of the NAS in a manner similar to normal radar data. Flight datablocks contained the flight identification, beacon code, and altitude. Target positions were automatically updated at the same rate experienced in the ZJX sector. To simulate actual aircraft operations, the radar targets maneuvered based on route segments from a flight plan and by operator input from the Simulation-Pilot Workstations (SPWs). The SPWs allowed the simulation pilots to alter aircraft flight parameters (e.g., altitude, routing, and rate of climb). The TGF provided complete data recording and reduction capabilities that supported post-simulation analyses.
2.4.3 Voice Switching and Control System
The VSCS permitted selection, interconnection, activation, and reconfiguration of communication paths between en route aircraft and the controllers. The VSCS was used for all A/G and G/G communications. VSCS Video Display Monitor screens were configured to provide Direct Access buttons for all A/G frequencies and controller positions. The VSCS and VSCS Input Keypads were configured to emulate the communications capabilities of ZJX’s LAKE CITY, OCALA, and CEDAR KEY sectors. All VSCS communications were recorded.
2.4.4 Workload Assessment Keypad
The Workload Assessment Keypad (WAK), which was used continuously during each scenario run, provided an electronic means for participants to record workload ratings at regular intervals. It was programmed to beep at 5-minute intervals, prompting each controller to enter a combined cognitive and physical “instantaneous” workload rating on a scale of 1-to-7, where a rating of 1 = very low, a rating of 4 = moderate, and a rating of 7 = very high. The average of the ratings given by both the R-side and D-side working a sector was used in the analysis.
9

2.4.5 Decision Support Tools
The GOERS team realized that the Decision Support Tools (DSTs), airspace design, and associated procedures would likely be different than current operations by the time proposed NAS changes such as the MON were implemented. However, understanding the consequences, difficulty, and impact of defining and incorporating a future environment in the simulation, only those DSTs and airspace design that were in effect at ZJX when the scenarios were developed (06/10/2002) were included. Using current NAS configuration and operations presented a realistic environment for the controller participants and eliminated the need for extensive training, learning curve effects, and significant software modifications including adaptation development.
2.5 Airspace
ZJX’s LAKE CITY (sector 78), OCALA (sector 15), and CEDAR KEY (sector 14) sectors were emulated. These sectors were selected for the following reasons:
• LAKE CITY (high altitude sector) and OCALA (low altitude sector) are adjacent sectors that offer high complexity and inter sector coordination. LAKE CITY and CEDAR KEY (low altitude sector) and CEDAR KEY and OCALA are also adjoined.
• The sectors have a high concentration of GA aircraft operating above 10,000 ft. Aircraft operating below 10,000 ft were generally controlled by other facilities and were not a part of this experiment.
• Examination of operations in both high and low altitude was desirable.
Selection of contiguous sectors allowed coordination-related issues to be examined. The selection of sectors from two separate Areas of Operation reduced the impact of removing controllers from the facility work schedule to participate in the study. LAKE CITY is from the South Area, and OCALA and CEDAR KEY are from the Central Area.
2.5.1 LAKE CITY Sector
LAKE CITY is a high altitude sector encompassing the airspace between FL 240 up to but not including FL 600 (see Figure 2). This sector is responsible for working a high volume of en route traffic and transitioning traffic inbound to the Orlando International Airport (MCO) and Tampa International Airport (TPA) complexes.
2.5.2 OCALA Sector
OCALA is a low altitude sector encompassing all airspace from 11,000 ft up to but not including FL 270 (see Figure 2). The OCALA sector is responsible for sequencing arrival traffic to the TPA and MCO complexes as well as departures exiting the MCO complex via the CAMAN Departure Transition Area.
10

Figure 2. The Lake City (78), Ocala (15), and Cedar Key (14) Sectors.
2.5.3 CEDAR KEY Sector
CEDAR KEY is a low altitude sector including all airspace from 11,000 ft up to, but not including, FL 270 (see Figure 2) with a small portion in the western part of the sector consisting of surface up to but not including FL 270. The CEDAR KEY sector is responsible for sequencing arrival traffic to the TPA and Sarasota International Airport (SRQ) complexes. The CEDAR KEY sector must blend TPA, SRQ, and MCO area departing aircraft while transitioning them to their respective route clearances and altitude strata. Special attention must be paid to TPA complex departures to ensure that they do not drift into the OCALA sector or conflict with westbound MCO departure aircraft.
2.6 Scenarios
Scenarios were developed from flight plans extracted from Data Analysis and Reduction Tool (DART) runs of ZJX SAR tapes. The data allowed for the replication of sector boundaries, jet routes, and fixes for the chosen and adjacent sectors. ZJX personnel assisted in developing the scenarios.
11

The air traffic used in the scenarios mirrored busy traffic situations for the selected sectors. The scenarios were designed in a manner that reflected a typical traffic density, peak traffic count, traffic mix, and traffic flow that occurred in the LAKE CITY, OCALA, and CEDAR KEY sectors at ZJX. Some traffic and sector entry times were adjusted so that all three sectors experienced similar levels of complexity. These adjustments depicted real-world situations that may not have occurred on the day the traffic sample was obtained.
The traffic mix operating in the LAKE CITY and OCALA sectors principally consisted of air carrier and business jets. The traffic mix operating in the CEDAR KEY sector primarily consisted of air carrier, business jets, military, and GA aircraft operating at and above 11,000 ft. The simulation scenarios accurately reflected the traffic mixes of the operational field sectors.
Nine 45-minute scenarios were developed to represent the current (i.e., baseline), future, and MON environments in the selected sectors of this simulation. They differed in three major areas: the degree of GBNA reductions, the level of aircraft GPS and avionics equipage, and the size of the GPS outages (see Table 1a, Table 1b and Table 2).
Table 1a. Scenario Characteristics
Avionics GPS
Scenario GBNA (VOR)
Reduction Equipage
Set Outage Planned Environment
1 0 1 No Outage Current (∼2003) 2 0 1 Partial Current (∼2003) 3 0 1 Full Current (∼2003) 4 0 2 No Outage Future (∼2013-2015) 5 0 2 Partial Future (∼2013-2015) 6 0 2 Full Future (∼2013-2015) 7 ~50% 2 No Outage MON (∼2013-2015) 8 ~50% 2 Partial MON (∼2013-2015) 9 ~50% 2 Full MON (∼2013-2015)
12

Table 1b. Equipage Set
Set Low-end GAa % Regional
Turboprop % Regional Jet/
High-end GAb % Air Carrier
Jet % Military
% GPS = 10 GPS = 10 GPS = 10 GPS = 10 GPS = 90+ IRSc = 0 IRSc = 0 IRSc = 0 IRSc = 70 IRSc = 90+ 1 FMSd = 0 FMSd = 0 FMSb = 100 FMSd = 70 FMSd = 10 V/De= 100 V/De = 100 V/De = 100 V/De = 100 V/D/Tf = 100 GPS = 80 GPS = 80 GPS = 80 GPS = 80 GPS = 90+ IRSc = 0 IRSc = 0 IRSc = 0 IRSc/FMSb = 90+ IRSc = 90+ 2 FMSd = 0 FMSd = 0 FMSd = 100 IRSc/FMSd = 90+ FMSd = 10 V/De = 50 V/De = 100 V/De = 100 V/De = 100 V/D/Tf = 100
aLow-end GA = aircraft not equipped with FMS-type systems, usually piston-powered aircraft. bHigh-end GA = aircraft equipped with FMS-type systems, usually turbine-powered aircraft. These aircraft are similar in equipage of
navigation systems to Regional Jet aircraft. cIRS = IRS or INS equipped. dFMS = FMS equipped. eV/D = VOR and DME (not all GA have DME). fV/D/T = VOR/DME and/or tactical air navigation.
Table 2. Differences Between Environments
Environment Characteristic Current Future MON
GBNA (VOR) Reductiona None None ~50% Avionics Equipage Set From Table 1b 1 2 2 aIn the MON environment, the decommission of selected VOR ground-based navigation aids.
2.6.1 GPS Outages
Three different Outage conditions involving the presence of GPS occurred in the simulation scenarios. For one type of scenario, termed no outage, the GPS/WAAS/LAAS signal was available to all aircraft throughout the entire airspace. In the second type, termed partial outage (see Figure 3)4, the GPS/WAAS/LAAS signal was not available to aircraft operating in a portion of each sector’s airspace. In the third type, termed full outage (see Figure 4), the GPS/WAAS/LAAS signal was not available to any aircraft throughout all three sectors. In both the partial and full outage conditions, the outages occurred at the 17th minute and continued until the end of each scenario.
4 The circles depicting the areas of GPS outages in Figures 3 and 4 are displayed for illustrative purposes only. They were not visible to the controllers during the actual simulation.
13

Figure 3. Areas affected by RFI in partial outage condition.
Figure 4. Area affected by RFI in full outage condition.
14

2.6.2 Aircraft GPS and Avionics Equipage
Two different levels of GPS and avionics equipment aboard a given aircraft were scripted into the scenarios. Table 1b specified the percentage levels of GPS, IRS, FMS, V/D, V/D/T, and IRS/FMS for low-end GA, turboprop, regional jet/high-end GA, air carrier jet, and military aircraft respectively, that corresponds to the levels.
2.6.3 Ground-Based Navigation Aid Reductions
Two different degrees of GBNA reductions occurred in the simulation scenarios. Scenarios either had all current airway and jetway support available (i.e., 0% GBNA reduction) or approximately half of the current airway and jetway support (i.e., 50% VOR GBNA reduction). Table 2 indicated the percentage levels. Note that the reduction in GBNA did not reduce the effective DME coverage for DME/DME equipped aircraft.
2.6.4 Scripted Aircraft Requiring Assistance
The sectors used in the study normally contain a mix of IFR and visual flight rules (VFR) aircraft. Some VFR aircraft had GPS as their only navigation source. Many of these aircraft may be operated by non-IFR qualified pilots with relatively low experience in the cockpit; therefore, it was expected that a GPS outage would provoke numerous requests for information and/or assistance from the VFR aircraft, both identified and unidentified. In order to provide a scenario where aircraft would “reasonably” be expected to request assistance in an unusual situation, some VFR aircraft were scripted to request assistance. The weather was briefed as “marginal VFR,” which added to the necessity of ATC assistance at times. These aircraft had GPS as their only navigation source. Each scenario was scripted to have at least one previously identified and tracked VFR aircraft receiving flight-following from ATC. In addition, two VFR aircraft were scripted to call ATC requesting assistance during the GPS outage conditions. The controllers were expected to radar-identify the unknown VFR aircraft and render the requested assistance as their priorities of work required and workload permitted.
2.6.5 Scripted Request for Information
During an outage situation, it was expected that pilots could be concerned with the following:
• The size of the GPS outage.
• The duration of the GPS outage.
• The appropriate radar vectors to a place where normal navigation could be resumed or to a suitable landing airport.
The simulation pilots were trained to interactively address these topics with the controllers as they occurred during the simulation.
15

2.6.6 Blocked Communications
In the ‘real world,’ it is expected that more than one pilot would simultaneously attempt to contact the controller soon after the GPS/WAAS/LAAS signal is interrupted. This situation would likely prevent two-way communications on the control frequency. Blocked communications were present in the simulation.
2.7 Simulation Procedure
LAKE CITY, OCALA, and CEDAR KEY sectors were simultaneously simulated in all runs. Sector configurations (i.e., boundaries, vertical dimensions, and route structures) remained consistent throughout the simulation. Controller positions were staffed according to the normal operating procedures for the traffic volume experienced. Outage conditions were experienced within controller teams and Environment conditions were experienced between controller teams.
The simulation was organized around major activity groupings: briefings, familiarization, training, and scenario runs.
2.7.1 Briefing
Members of the experiment team briefed the controller participants in a classroom setting prior to entering the laboratory area. Questions were encouraged. The participants were provided with the briefing materials contained in Appendix C.
The briefing covered the following topics:
• Informed Consent document
• Controller participant’s role in the study
• Study objectives
• Study methodology
• Airspace structure
• Air traffic characteristics
• Aircraft equipage
• GPS/WAAS/LAAS background information
• Rules and procedures
• Laboratory equipment and configuration
Although the controllers were aware that they may experience deliberate interference GPS outages in the simulation, they were not informed about the specifics of the outages they encountered (e.g., when the outages would occur, where they would occur, size, duration).
16

Following the briefing, the controller participants were asked to complete the Background Questionnaire contained in Appendix D and to review the Informed Consent Form contained in Appendix E.
2.7.2 Laboratory Familiarization
Although the DSF1 was configured to replicate the LAKE CITY, OCALA, and CEDAR KEY sectors, slight differences from the operational field existed. Controller participants were afforded a 30-minute “hands-on” opportunity to familiarize themselves with the laboratory equipment prior to its use.
2.7.3 Controller Participant Training
Two 45-minute training periods enabled the controller participants to practice using the laboratory equipment and to experience GPS outage situations in a low intensity operational situation. Members of the GOERS Research Team were available throughout the periods to answer questions as they arose. A group discussion in a classroom setting followed each training period.
2.7.4 Simulation Pilot/Ghost Controller Training
Simulation pilots and ghost controllers were rigorously trained to assure operationally consistent, accurate, and timely responses to controller instructions and requests. Lectures on the following topics were performed:
• Study objectives
• Study methodology
• Airspace structure
• Air traffic characteristics
• Aircraft equipage
• GPS/WAAS/LAAS outage volumes
• Controller procedures
• Anticipated controller actions during outage situations
Additionally, the simulation pilots and ghost controllers exercised the scenarios for 72 hours over a 3-week period. Particular emphasis was placed on reacting to unusual controller requests and instructions, and timely execution of scripted events.
17

2.7.5 Scenario Run Order
In this simulation, the number of runs for each controller team equaled the number of different scenarios they experienced. The scenarios were presented in a random order. The scenario order for each controller group is presented in Table 3. Run 2 of Group 1 failed 20 minutes into the scenario due to a system malfunction. The failed run was not included in the analysis. The scenario was rerun in its entirety following run 3 and included in the analysis.
Table 3. Data Collection Scenarioa Run Order
Run No.
Controller Group 1
Scenario No.
Controller Group 2
Scenario No.
Controller Group 3
Scenario No. 1 5 6 3 2 2 2 5 3 8 4 1 4 3 1 7 5 1 9 6 6 6 3 8 7 7 8 4 8 4 5 9 9 9 7 2
aRefer to Table 1a for scenario characteristics.
2.8 Data Collection
Data were collected throughout the simulation by electronic and manual means. The data were subsequently reduced and analyzed. Findings were presented to the GOERS Research Team. This report documents those findings and conclusions.
2.8.1 Subjective Data
Subjective data were collected from controller participants using questionnaires, workload ratings, and debriefing sessions. Table 4 provides a summary of the data collection instruments.
2.8.1.1 Questionnaires
During the initial briefing session, participant controllers completed a Background Questionnaire (see Appendix D). The Background Questionnaire solicited information mostly related to controller experience.
At the end of each run, both participant controllers and T/Os completed a questionnaire. The Controller Post-Run Questionnaire (see Appendix F) solicited information regarding
18

the traffic, simulation environment, workload, and impact of the GPS outage. The T/O Post-Run Questionnaire (see Appendix B) solicited information regarding the overall workload and impact of the GPS outage.
Table 4. Subjective Data Instruments Summary
Instrument Users Frequency Completed Objective Background Questionnaire
Controllers Once Before first training run
Gathered controller demographic information.
Workload Ratings using keypad
Controllers Every run Concurrent Electronically recorded controller workload ratings.
Post-Run Questionnaire
Controllers Every run After each run
Elicited controller experiences as a result of GPS outage, scenario information, and so on.
Post-Run Questionnaire
T/Os Every run After each run
Recorded T/O observations related to GPS outage, workload, and so on.
Post Simulation Questionnaire
Controllers Once End of all runs
Gathered information regarding impact of GPS outage on workload, training adequacy, automation needs, and simulation fidelity.
Debriefing T/Os and Controllers
Once End of all runs
Gathered information that was not previously acquired.
At the end of all runs, participant controllers completed a Post-Simulation Questionnaire (see Appendix G). This questionnaire solicited information regarding simulation fidelity, adequacy of training for simulation, automation needs, and the effects of GPS outages. All questionnaires contained space to provide additional information as appropriate.
2.8.1.2 Workload Assessment
During each run, participant controllers rated their workload on a 1-to-7 scale (1 = very low, 4 = moderate, and 7 = very high), at 5-minute intervals, using a WAK connected to an online computer. The 1-to-7 scale was represented on the keypad by numbered buttons that would beep and become illuminated to alert the controller that a rating was required. The keypad was placed beside each controller’s workstation.
2.8.1.3 Debriefings
An unstructured, group, debriefing session was held at the end of each simulation week. Participant controllers and T/Os from all sectors participated. The purpose of the debriefings was to offer an opportunity for those involved to provide information that may not have been addressed by the questionnaires. The debriefings were recorded on audiocassettes.
19
2.8.2 Objective Data
Table 5 presents a summary of the objective data collected during each run.
Table 5. Objective Data Instrument Summary
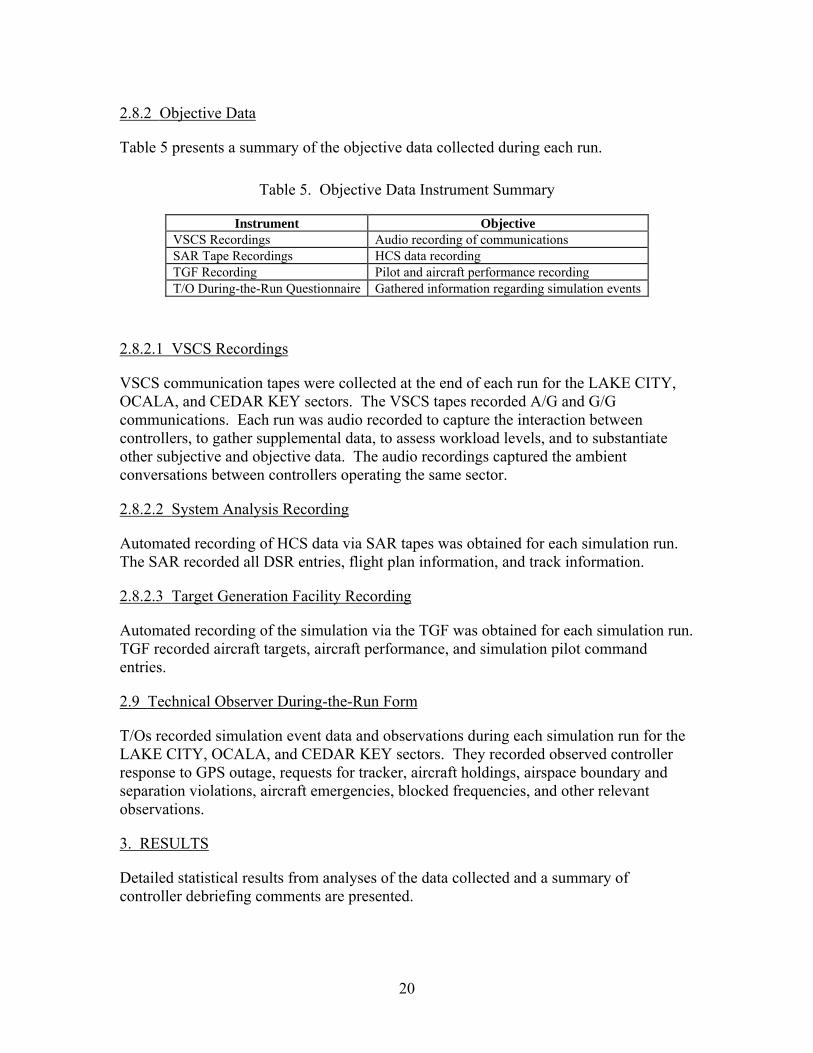
Instrument Objective VSCS Recordings Audio recording of communications SAR Tape Recordings HCS data recording TGF Recording Pilot and aircraft performance recording T/O During-the-Run Questionnaire Gathered information regarding simulation events
2.8.2.1 VSCS Recordings
VSCS communication tapes were collected at the end of each run for the LAKE CITY, OCALA, and CEDAR KEY sectors. The VSCS tapes recorded A/G and G/G communications. Each run was audio recorded to capture the interaction between controllers, to gather supplemental data, to assess workload levels, and to substantiate other subjective and objective data. The audio recordings captured the ambient conversations between controllers operating the same sector.
2.8.2.2 System Analysis Recording
Automated recording of HCS data via SAR tapes was obtained for each simulation run. The SAR recorded all DSR entries, flight plan information, and track information.
2.8.2.3 Target Generation Facility Recording
Automated recording of the simulation via the TGF was obtained for each simulation run. TGF recorded aircraft targets, aircraft performance, and simulation pilot command entries.
2.9 Technical Observer During-the-Run Form
T/Os recorded simulation event data and observations during each simulation run for the LAKE CITY, OCALA, and CEDAR KEY sectors. They recorded observed controller response to GPS outage, requests for tracker, aircraft holdings, airspace boundary and separation violations, aircraft emergencies, blocked frequencies, and other relevant observations.
3. RESULTS
Detailed statistical results from analyses of the data collected and a summary of controller debriefing comments are presented.
20

The data reported include workload ratings and objective measures presented in Table 6 with associated controller questionnaire responses, and controller debriefing comments. Unless otherwise noted, there were 27 unique combinations of the 9 controller teams (n = 27) included in the analyses. Each Outage condition consisted of 9 controller teams (between-subjects) and each of the 27 teams served in all Outage conditions (within-subjects). For each sector in each group, the three controllers experienced a no outage, partial outage, and full outage while working in a fixed position (R-side, D-side, and A-side/Tracker) in a single environment (not necessarily one right after the other). For the next environment, the same three controllers in the sector rotated positions and experienced the three outages. The same applies for the last environment.
Various statistical tests were used to analyze the data. They were Cochran’s Q5, one-way analysis of variance (ANOVA), two-tailed t tests, repeated measures ANOVA, Tukey’s honestly significant difference (HSD)6 test, correlation, and descriptive analysis. The nature of the data dictated that different statistical tests be applied. An alpha level of .05 was used for all statistical tests.
Table 6. Objective Data Measures
Data Measures Source of Data Number of traffic flow initiatives
Cochran’s Q,, One-way ANOVA T/O During-the-Run Questionnaire
Number of point-outs Repeated Measures ANOVA, Tukey HSD SAR tapes Number of A/G communications
Repeated Measures ANOVA, VSCS recordings
Number of G/G communications
Repeated Measures ANOVA, VSCS recordings
Traffic count Repeated Measures ANOVA, TGF Recordings Airspace Violations Cochran’s Q, One-way ANOVA, Descriptive analysis T/O During-the-Run
Questionnaire Number of separation violations
Descriptive analysis SAR tapes, TGF recordings
Requests for a tracker Cochran’s Q, One-way ANOVA, Tukey HSD T/O During-the-Run Questionnaire
3.1 Workload Ratings
The WAK was used continuously during each simulation run. The WAK provided an electronic means for participants to record workload ratings at regular intervals. It was programmed to beep at 5-minute intervals, prompting each controller to enter their combined physical and mental “instantaneous” workload on a 1-to-7 rating scale with the anchors of 1 = very low, 4 = moderate, and 7 = very high. The average of the rating given by both the R-side and D-side controllers working a sector was used in the analysis.
5 Cochran’s Q provides a method for testing whether three of more sets of frequencies or proportions differ significantly among themselves (Siegel, 1956). 6 The Tukey HSD test is a post hoc test used to make comparisons between all pairs of means. This test maintains the family wise error rate (αFW) at a chosen value for the entire set of pairwise comparisons. The FW error rate is the Type I error that results from evaluating the significance of the difference between all pairs of treatment means (Keppel, 1991).
21
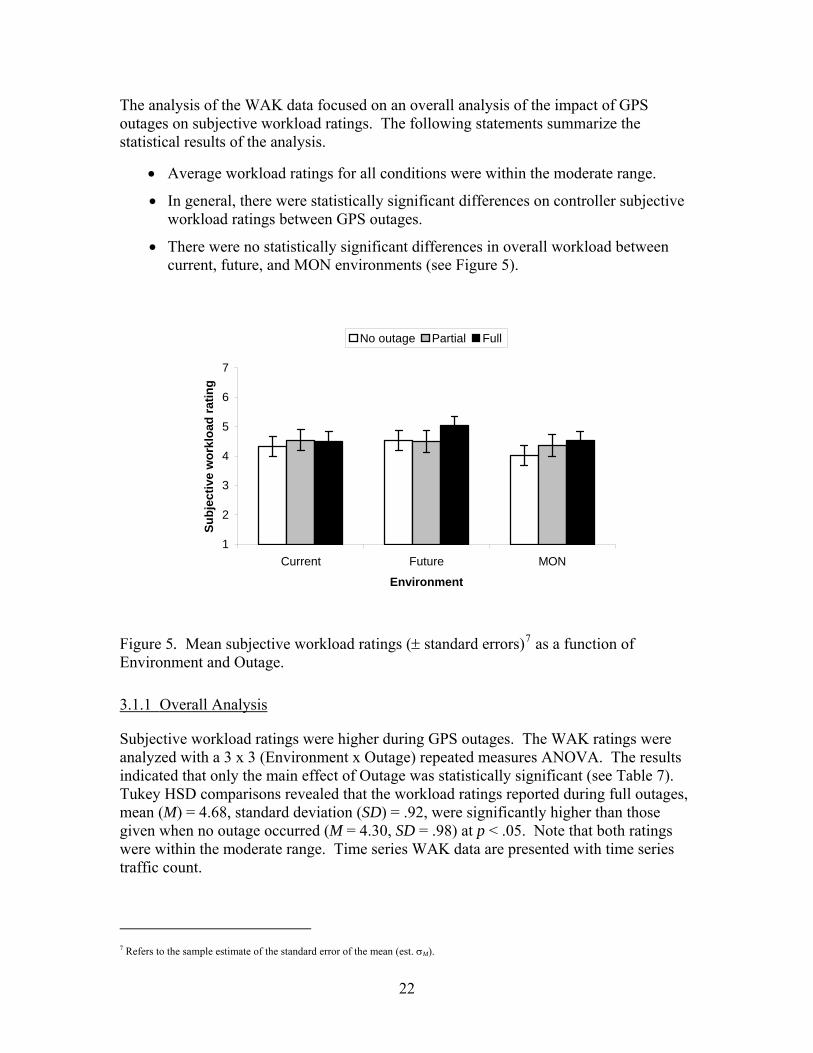
The analysis of the WAK data focused on an overall analysis of the impact of GPS outages on subjective workload ratings. The following statements summarize the statistical results of the analysis.
• Average workload ratings for all conditions were within the moderate range.
• In general, there were statistically significant differences on controller subjective workload ratings between GPS outages.
• There were no statistically significant differences in overall workload between current, future, and MON environments (see Figure 5).
1
2
3
4
5
6
7
Current Future MON
Environment
Subj
ectiv
e w
orkl
oad
ratin
g
No outage Partial Full
Figure 5. Mean subjective workload ratings (± standard errors)7 as a function of Environment and Outage.
3.1.1 Overall Analysis
Subjective workload ratings were higher during GPS outages. The WAK ratings were analyzed with a 3 x 3 (Environment x Outage) repeated measures ANOVA. The results indicated that only the main effect of Outage was statistically significant (see Table 7). Tukey HSD comparisons revealed that the workload ratings reported during full outages, mean (M) = 4.68, standard deviation (SD) = .92, were significantly higher than those given when no outage occurred (M = 4.30, SD = .98) at p < .05. Note that both ratings were within the moderate range. Time series WAK data are presented with time series traffic count.
7 Refers to the sample estimate of the standard error of the mean (est. σM).
22

Table 7. Workload: Analysis of Variance
Source SS df MS F p Between subjects
Environment (E) 2.01 2 1.00 .41 .67 Error 59.24 24 (2.5) a
Within subjects Outage (O) 2.03 2 1.02 4.88* .01 O x E .91 4 .23 1.09 .37 Error (Outage) 9.98 48 (.21) a a Values enclosed in parentheses represent mean square errors. *p < .01
3.1.2 Questionnaire Results
Post-Run Questionnaire responses given by controllers indicated that the GPS outages had nearly no affect or only slightly increased overall workload and mental and physical activities. Results indicated no significant difference in results between partial and full outages (see Figure 6). Controllers were asked in a questionnaire to rate on a scale from 1-to-7, with anchors 1 = strongly decreased and 7 = strongly increased, how the GPS outage affected their workload in terms of both cognitive and physical demands. The questions were as follows:
Q. 21) Please indicate below how your overall workload was affected by the loss of GPS.
Q. 25) How did the loss of GPS affect your physical activity (data entry, record keeping, etc.)?
Q. 26) How did the loss of GPS affect your mental activity (thinking, planning, concentrating, etc.)?
The data were analyzed with paired samples t tests. The responses for each question were not statistically different between the partial and full outage conditions: workload, t(26) = -1.65, p = .11; physical activity, t(26) = -1.82, p = .08; mental activity, t(25) = -1.24, p = .23.
23

1
2
3
4
5
6
7
Q. 21 OverallWorkload
Q. 25 Physical Activity Q. 26Mental Activity
Mea
n re
spon
se ra
ting
Partial Full
Figure 6. Mean response choices (± standard errors) for partial and full outage conditions given in the Controller Post-Run Questionnaire.
Post-Run Questionnaire responses given by controllers indicated that maintaining aircraft separation, G/G communication activities, and A/G communication activities had nearly no effect on their workload (see Figure 7). In addition, there were no statistical differences between response ratings reported for partial and full outages. Controllers were asked in a questionnaire to rate on a scale from 1 (Strongly Decreased) to 7 (Strongly Increased) how activities contributed to their workload during the GPS outage period. The questions were as follows:
Q. 22) Please indicate how maintaining aircraft separation activities contributed to your workload during the GPS outage period.
Q. 23) Please indicate how G/G communication activities contributed to your workload during the GPS outage period.
Q. 24) Please indicate how A/G communication activities contributed to your workload during the GPS outage period.
The data were analyzed with paired samples t tests. The responses for each question were not statistically significant between partial and full outages: maintaining aircraft separation, t(26) = -1.49, p = .15; G/G communication activities, t(26) = -1.86, p = .07; A/G communication activities, t(26) = -1.38, p = .18.
24
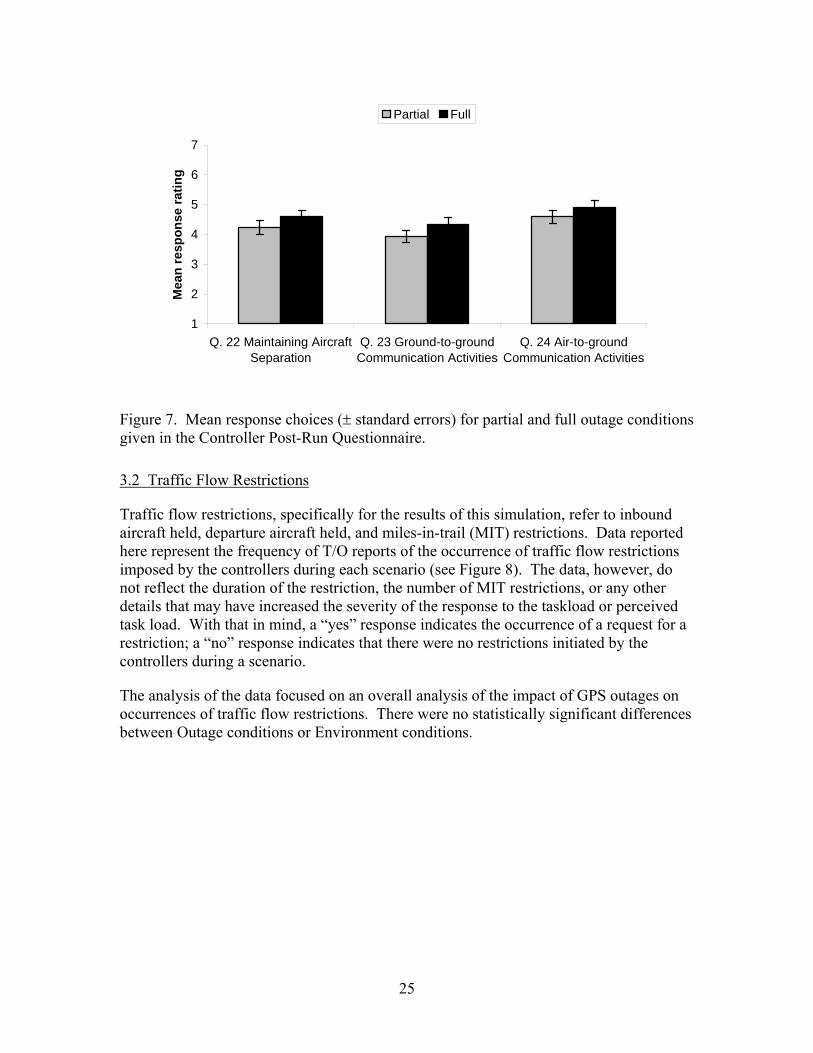
1
2
3
4
5
6
7
Q. 22 Maintaining AircraftSeparation
Q. 23 Ground-to-groundCommunication Activities
Q. 24 Air-to-groundCommunication Activities
Mea
n re
spon
se ra
ting
Partial Full
Figure 7. Mean response choices (± standard errors) for partial and full outage conditions given in the Controller Post-Run Questionnaire.
3.2 Traffic Flow Restrictions
Traffic flow restrictions, specifically for the results of this simulation, refer to inbound aircraft held, departure aircraft held, and miles-in-trail (MIT) restrictions. Data reported here represent the frequency of T/O reports of the occurrence of traffic flow restrictions imposed by the controllers during each scenario (see Figure 8). The data, however, do not reflect the duration of the restriction, the number of MIT restrictions, or any other details that may have increased the severity of the response to the taskload or perceived task load. With that in mind, a “yes” response indicates the occurrence of a request for a restriction; a “no” response indicates that there were no restrictions initiated by the controllers during a scenario.
The analysis of the data focused on an overall analysis of the impact of GPS outages on occurrences of traffic flow restrictions. There were no statistically significant differences between Outage conditions or Environment conditions.
25
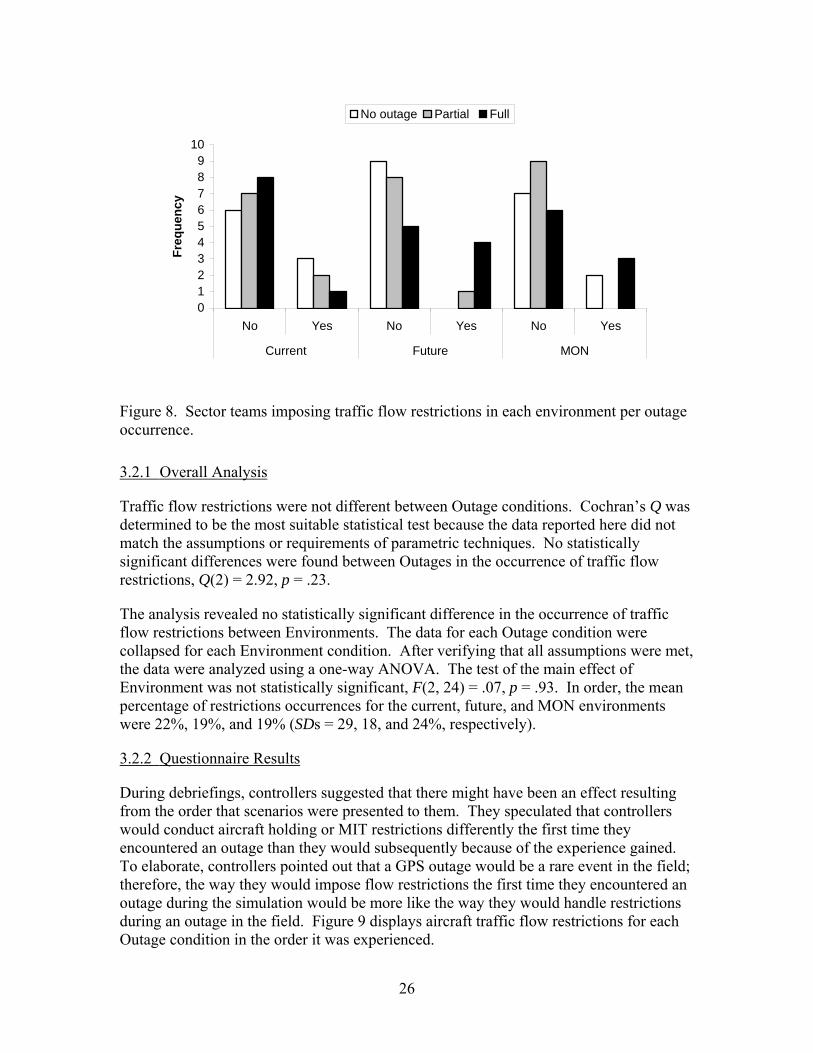
0123456789
10
No Yes No Yes No Yes
Current Future MON
Freq
uenc
y
No outage Partial Full
Figure 8. Sector teams imposing traffic flow restrictions in each environment per outage occurrence.
3.2.1 Overall Analysis
Traffic flow restrictions were not different between Outage conditions. Cochran’s Q was determined to be the most suitable statistical test because the data reported here did not match the assumptions or requirements of parametric techniques. No statistically significant differences were found between Outages in the occurrence of traffic flow restrictions, Q(2) = 2.92, p = .23.
The analysis revealed no statistically significant difference in the occurrence of traffic flow restrictions between Environments. The data for each Outage condition were collapsed for each Environment condition. After verifying that all assumptions were met, the data were analyzed using a one-way ANOVA. The test of the main effect of Environment was not statistically significant, F(2, 24) = .07, p = .93. In order, the mean percentage of restrictions occurrences for the current, future, and MON environments were 22%, 19%, and 19% (SDs = 29, 18, and 24%, respectively).
3.2.2 Questionnaire Results
During debriefings, controllers suggested that there might have been an effect resulting from the order that scenarios were presented to them. They speculated that controllers would conduct aircraft holding or MIT restrictions differently the first time they encountered an outage than they would subsequently because of the experience gained. To elaborate, controllers pointed out that a GPS outage would be a rare event in the field; therefore, the way they would impose flow restrictions the first time they encountered an outage during the simulation would be more like the way they would handle restrictions during an outage in the field. Figure 9 displays aircraft traffic flow restrictions for each Outage condition in the order it was experienced.
26

0
2
4
6
8
10
12
First Second Third
Encounter
Num
ber o
f tra
ffic
flow
rest
rictio
ns
No outage Partial Full
Figure 9. Number of traffic flow restrictions for each Outage (n = 9) by first, second, and third encounter.
The nature of the pattern shown in Figure 9 is unclear. As controllers encountered more scenarios where no outages occurred, they held less aircraft; however, controllers who experienced outages held more aircraft as they encountered more scenarios. Although the study was counterbalanced, controllers from each group experienced either a full or a partial outage before they experienced a no-outage scenario. Therefore, it is unclear whether the increased number of aircraft traffic flow restrictions during no outage scenarios may have occurred because controllers anticipated an outage or because of what was happening in the scenario (namely, an outage or lack thereof).
Regardless of whether no outage, a partial outage, or a full outage occurred, the majority of aircraft holds were departures (63%, 100%, and 75%, respectively) followed by inbound aircraft (13%, 0%, and 25%, respectively).
3.3 Number of Point-Outs
Point-outs are physical or automated actions taken by a controller to transfer the radar identification of an aircraft to another controller. These point-outs occur only if the aircraft will or may enter the airspace or protected airspace of another controller and radio communications will not be transferred. The point-out data reported here represent the number of forced datablocks entered into the HCS. The CEDAR CREEK and
27

OCALA sectors were positioned side by side; therefore, any coordination that was done verbally was not captured in the HCS data.
The analysis of the point-out data focused on an overall analysis of the impact of GPS outages on the number of point-outs. In general, GPS outages had a statistically significant effect on the number of point-outs (see Figure 10).
0
2
4
6
8
10
12
14
Current Future MON
Environment
Mea
n nu
mbe
r of p
oint
-out
s
No outage Partial Full
Figure 10. Mean number of point-outs (± standard errors) as a function of Environment and Outage.
3.3.1 Overall Analysis
GPS outages had a statistically significant effect on the number of point-outs. The number of point-outs was analyzed with a 3 x 3 (Environment x Outage) repeated measures ANOVA. The results indicated that the main effect of Outage was statistically significant, F(2, 48) = 6.16, p < .01. Tukey HSD comparisons indicated that the number of point-outs when no outage occurred (M = 8.61, SD = 4.04) were significantly higher than those made during partial outages (M = 6.50, SD = 3.57) at the p < .05 level.
3.4 Communications
All VSCS communications were recorded for the LAKE CITY, OCALA, and CEDAR KEY sectors and analyzed to obtain frequency counts (see Figures 11, 12, and 13). Each frequency count represented the transmission of information from one person to the other, whether it was the opening message or the response. For this specific analysis, A/G communications were separated into air-to-ground (only) communications and ground-to-air (only) communications.
The analysis of the communications data focused on an overall analysis of the impact of GPS outages on the number of communications made. The overall analysis indicated that
28
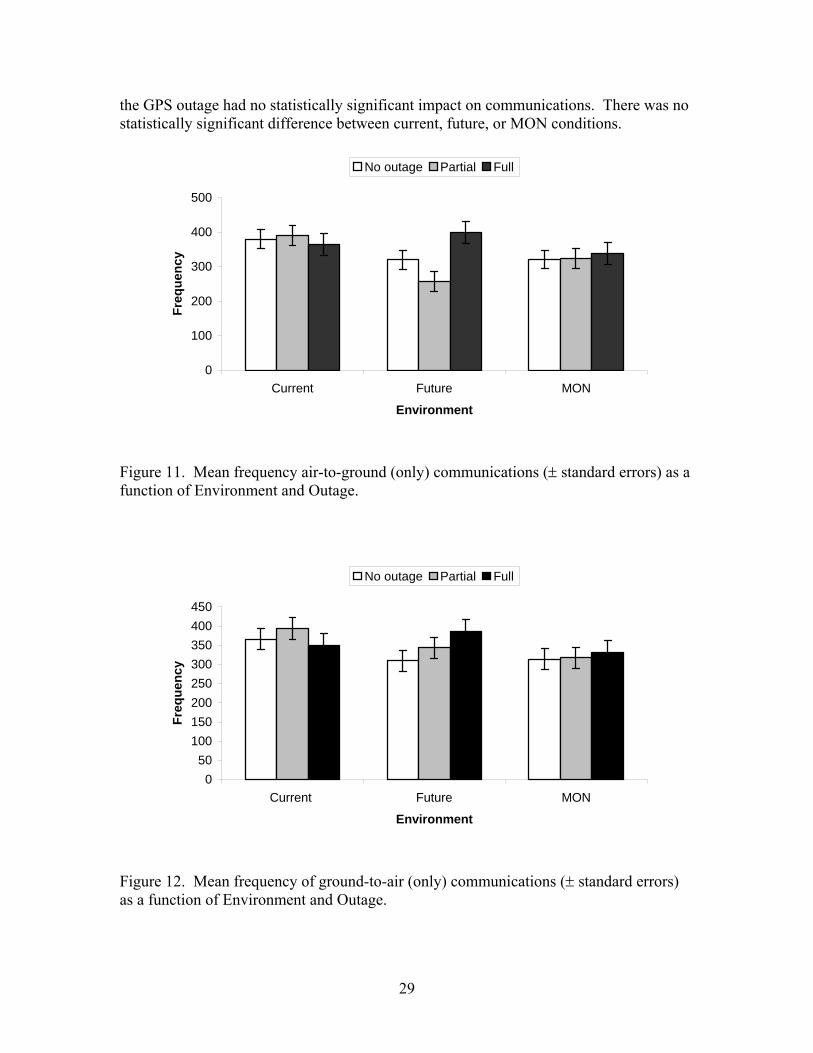
the GPS outage had no statistically significant impact on communications. There was no statistically significant difference between current, future, or MON conditions.
0
100
200
300
400
500
Current Future MON
Environment
Freq
uenc
yNo outage Partial Full
Figure 11. Mean frequency air-to-ground (only) communications (± standard errors) as a function of Environment and Outage.
050
100150200250300350400450
Current Future MON
Environment
Freq
uenc
y
No outage Partial Full
Figure 12. Mean frequency of ground-to-air (only) communications (± standard errors) as a function of Environment and Outage.
29

02468
101214161820
Current Future MON
Environment
Freq
uenc
y
No outage Partial Full
Figure 13. Mean frequency of G/G communications (± standard errors) as a function of Environment and Outage.
3.4.1 Overall Analysis
The communications data were each analyzed with a 3 x 3 (Environment x Outage) repeated measures ANOVA (see Tables 8, 9, and 10). The analysis indicated that the GPS outage had no statistically significant impact on communications.
Table 8. Air-to-Ground (only): Analysis of Variance for Communications
Source SS df MS F p Between subjects
Environment (E) 34262.00 2 17131.00 1.97 .16 Error 208658.67 24 (8694.11)
Within subjects Outage (O) 10226.74 2 5113.70 .67 .52 O x E 22644.59 4 5661.15 .75 .57 Error (Outage) 364348.00 48 (7590.58) Note. Values enclosed in parentheses represent mean square errors.
30

Table 9. Ground-to-Air (only): Analysis of Variance for Communications
Source SS df MS F p Between subjects
Environment (E) 23755.63 2 11877.82 1.29 .29 Error 220825.26 24 (9201.05)
Within subjects Outage (O) 8854.52 2 4427.26 .61 .55 O x E 22175.85 4 5543.96 .77 .55
Error (Outage) 345244.30 48 (7192.59) Note. Values enclosed in parentheses represent mean square errors.
Table 10. Ground-to-Ground: Analysis of Variance for Communications
Source SS df MS F p Between subjects
Environment (E) 53.41 2 26.70 .47 .63 Error 1376.82 24 (57.37)
Within subjects Outage (O) 4.67 2 2.33 .09 .92 O x E 66.82 4 16.70 .63 .65 Error (Outage) 1279.85 48 26.66 Note. Values enclosed in parentheses represent mean square errors.
3.4.2 Questionnaire Results
It is uncertain from the questionnaire rating responses whether the outages affected the manageability of activities associated with G/G communications. Question 19 on the Controller Post-Run Questionnaire asked to “…indicate how the loss of GPS affected the manageability of activities associated with G/G communications.” Typical responses revealed that the R-side controllers had a tendency of reporting a slight negative effect. D-side controllers provided more consistent negative ratings (see Table 11). The original scale ranged from 1-to-7; however, due to an error in the anchors, only ratings of 1-to-4 were valid. Therefore, responses were on a 1-to-4 rating scale with the anchors 1 = strong negative effect and 4 = no effect. The statistics represent 92 responses; 16 of the 108 original responses were omitted because of systematic measurement error.
31
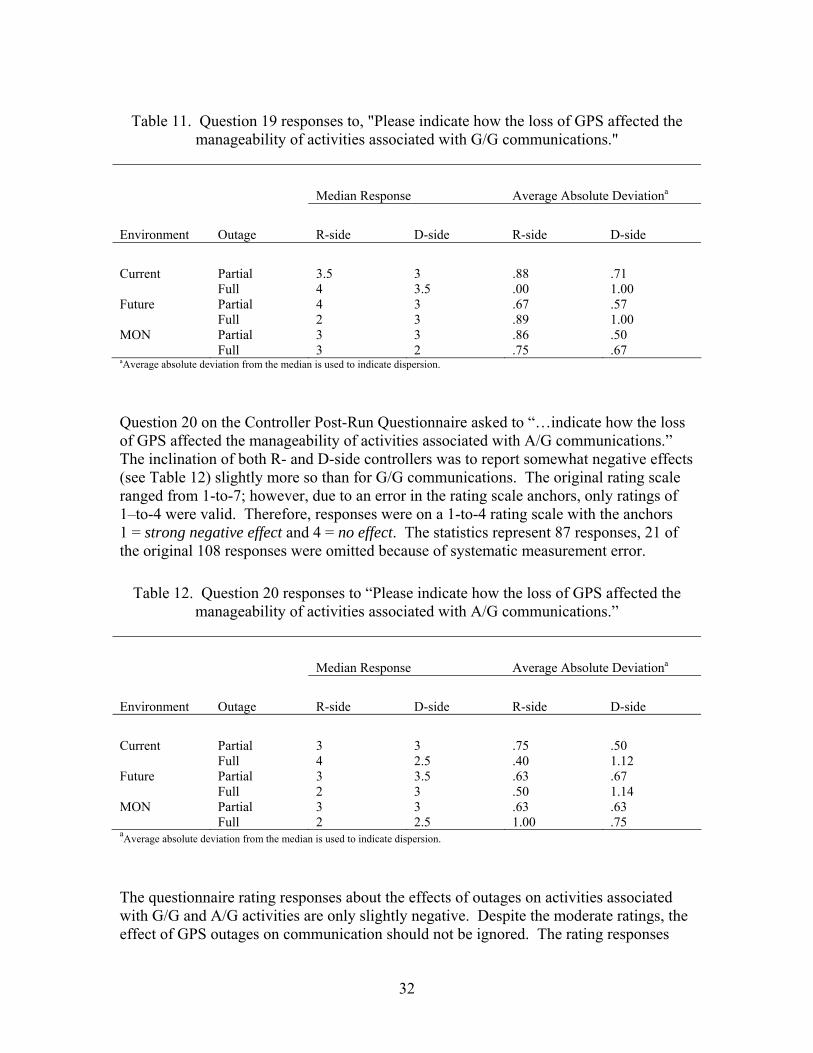
Table 11. Question 19 responses to, "Please indicate how the loss of GPS affected the manageability of activities associated with G/G communications."
Median Response Average Absolute Deviationa
Environment Outage R-side D-side R-side D-side
Current Partial 3.5 3 .88 .71 Full 4 3.5 .00 1.00 Future Partial 4 3 .67 .57 Full 2 3 .89 1.00 MON Partial 3 3 .86 .50 Full 3 2 .75 .67 aAverage absolute deviation from the median is used to indicate dispersion.
Question 20 on the Controller Post-Run Questionnaire asked to “…indicate how the loss of GPS affected the manageability of activities associated with A/G communications.” The inclination of both R- and D-side controllers was to report somewhat negative effects (see Table 12) slightly more so than for G/G communications. The original rating scale ranged from 1-to-7; however, due to an error in the rating scale anchors, only ratings of 1–to-4 were valid. Therefore, responses were on a 1-to-4 rating scale with the anchors 1 = strong negative effect and 4 = no effect. The statistics represent 87 responses, 21 of the original 108 responses were omitted because of systematic measurement error.
Table 12. Question 20 responses to “Please indicate how the loss of GPS affected the manageability of activities associated with A/G communications.”
Median Response Average Absolute Deviationa
Environment Outage R-side D-side R-side D-side
Current Partial 3 3 .75 .50 Full 4 2.5 .40 1.12 Future Partial 3 3.5 .63 .67 Full 2 3 .50 1.14 MON Partial 3 3 .63 .63 Full 2 2.5 1.00 .75 aAverage absolute deviation from the median is used to indicate dispersion.
The questionnaire rating responses about the effects of outages on activities associated with G/G and A/G activities are only slightly negative. Despite the moderate ratings, the effect of GPS outages on communication should not be ignored. The rating responses
32

may not reflect the actual concern about the effect of GPS outages on the perceived level of communications expressed during post-run debriefings. The controllers repeatedly raised concerns about the additional workload induced by the perceived increase in communications and how the loss of GPS affected their mental activity. In addition, controllers found repetitive calls from aircraft reporting GPS outages distracting, and these calls may have led to increased complexity and duration of communications.
3.5 Traffic and Workload Time Series Data
Traffic count represents the total number of actively controlled aircraft in a sector. Figures 14, 16, and 18 show the traffic counts (average per controller team) for each 5-minute period during a scenario. The subjective mental workload average ratings are plotted below their respective traffic count figure (see Figures 15, 17, and 19). A repeated measures regression analysis showed a significant positive relationship between traffic count and subjective workload, r(676) = .56, p < .01.
0
5
10
15
20
25
30
5 10 15 20 25 30 35 40 45
Time
Traf
fic c
ount
No outage Partial Full
Figure 14. Mean traffic counts (± standard errors) for no outage, partial outage and full outage conditions in the current environment.
33

1
2
3
4
5
6
7
5 10 15 20 25 30 35 40 45
Time
Subj
ectiv
e w
orkl
oad
ratin
g
No outage Partial Full
Figure 15. Mean subjective workload ratings (± standard errors) for no outage, partial outage and full outage conditions in the current environment.
0
5
10
15
20
25
30
5 10 15 20 25 30 35 40 45
Time
Traf
fic c
ount
No outage Partial Full
Figure 16. Mean traffic count (± standard errors) for no outage, partial outage, and full outage conditions in the future environment.
34

1
2
3
4
5
6
7
5 10 15 20 25 30 35 40 45
Time
Subj
ectiv
e w
orkl
oad
ratin
g
No outage Partial Full
Figure 17. Mean subjective workload ratings (± standard errors) for no outage, partial outage, and full outage conditions in the future environment.
0
5
10
15
20
25
30
5 10 15 20 25 30 35 40 45
Time
Traf
fic c
ount
No outage Partial Full
Figure 18. Mean traffic counts (± standard errors) for no outage, partial outage, and full outage conditions in the MON environment.
35

1
2
3
4
5
6
7
5 10 15 20 25 30 35 40 45
Time
Subj
ectiv
e w
orkl
oad
ratin
g
No outage Partial Full
Figure 19. Mean subjective workload ratings (± standard errors) for no outage, partial outage, and full outage conditions in the MON environment.
3.6 Traffic Count
All scenarios were designed to have approximately the same traffic volume (i.e., number of aircraft or aircraft count). However, factors such as controller imposed flow restrictions can affect the number of aircraft worked by the controller teams. Analyses were conducted to see if the events of the simulation affected the number of aircraft that were worked by the controller teams.
The analysis of the traffic count data focused on an overall analysis of the impact of GPS outages on the traffic count. The following statements summarize the statistical results of the analysis.
• Outage had no statistically significant impact on the number of aircraft in a sector.
• Environment had no statistically significant impact on the number of aircraft in a sector.
3.6.1 Overall Analysis
The traffic counts were analyzed with a 3 x 3 (Environment x Outage) repeated measures ANOVA (see Table 13). The results revealed no statistically significant effects of Outage, F(2, 48) = 3.13, p = .05 or Environment, F(2, 24) = 1.60, p = .22.
36

Table 13. Traffic Count: Analysis of Variance
Source SS df MS F p
Between subjects
Environment (E) 39.77 2 19.89 1.60 .22
Error 298.52 24 (12.44)
Within subjects
Outage (O) 25.02 2 12.51 3.13 .05
O x E 7.98 4 2.00 .500 .74
Error (Outage) 191.67 48 (3.99) Note. Values enclosed in parentheses represent mean square errors.
3.6.2 Questionnaire Results
Controllers stated that the traffic volumes in the scenarios were comparable to heavy traffic experienced when working this sector in the field. Question 5 of the Controller Post-Run Questionnaire asked, “How do you compare the traffic volume of this run with what you typically experience when working in this sector in the field?” Response options ranged from 1-to-7 with the anchors of 1 = very light, 4 = moderate, and 7 = very heavy. The questionnaire responses were analyzed with a 3 x 3 (Environment x Outage) repeated measures ANOVA. The results indicated that the main effect of Outage was statistically significant, F(2, 48) = 4.58, p < .05. Tukey HSD comparisons revealed that the responses given when no outage (M = 5.58, SD = .84) occurred were significantly lower than ratings given when full (M = 5.97, SD = .73) outages occurred.
Controllers reported that they were busy during the runs. Question 13 of the Controller Post-Run Questionnaire asked, “How busy were you during this run?” Responses ranged from 1-to-7 with the anchors 1 = not busy at all and 7 = extremely busy. The questionnaire responses were analyzed with a 3 x 3 (Environment x Outage) repeated measures ANOVA. The results indicated that the main effect of Outage was statistically significant, F(2, 48) = 5.23, p < .01. Tukey HSD comparisons revealed that responses given when no outage occurred (M = 5.07, SD = 1.16) were significantly lower than responses given during a full outage (M = 5.66, SD = .84). Ratings reported by T/Os were nearly identical, and the statistical results were the same; however, the only exception was a significant difference between partial (M = 5.41, SD = .76) and full outages (M = 5.75, SD = .80) in a pair-wise comparison. T/Os also reported in the Post-Run Questionnaire (question 6) that the busyness level was uniform throughout for all of the runs regardless of Outage or Environment.
37

3.7 Technical Observer Reported Airspace Violations
The data represent the number of T/O reports of airspace violations8. The observed airspace violations were categorized as hand-off related airspace violations, point-out related airspace violations, or other airspace violations (namely, a violation of special use airspace and an inappropriate descent). The number of airspace violations as a function of Environment and Outage are shown in Table 14.
Table 14. Airspace Violations as a Function of Environment and Outage
Current Future MON No outage 6 4 1 Partial outage 6 4 4 Full outage 7 8 4
The most suitable statistical tests were used for each comparison. Cochran’s Q was used for the comparison between Outages because the data did not meet the assumptions for parametric tests. A one-way ANOVA was used to analyze the effect of Environment on airspace violations.
The results of the analysis were the following:
• There were no statistically significant differences between Outage conditions in the number of sector teams reported as having committed an airspace violation.
• There were no statistically significant differences between Environment conditions in the number of airspace violations committed.
3.7.1 Comparison Between Outages
T/Os were asked to respond yes or no to the question, “Did you observe any airspace boundary violations?” The frequency of each response for no, partial, and full outages was tallied and analyzed using Cochran’s Q.
No statistically significant differences were found between the T/O reports of the occurrence of airspace violations between the Outage conditions (see Figure 20). The percentage of controller teams that committed airspace violations when no outage occurred was 41% (11 out of a possible 27), when a partial outage occurred was 30% (9 out of 27), and when a full outage occurred was 48% (13 out of 27). However, the number of violations reported by T/Os was not statistically different between Outage conditions, Q(2) = 2.11, p = .35.
8 The observed number of airspace violations is likely the result of simulation artifact. In order to optimally observe the effect of GPS outages, the simulation consistently presented a high level of traffic complexity to the controllers. Also, to avoid confounding controller workload results, supervisory interaction was limited and no TMU assistance was provided. Because of these constraints, the airspace violations observed in this simulation may not represent what would be experienced in the field and are being used for relative comparisons between conditions only. These results should not be interpreted outside of this context.
38

0
3
6
9
12
15
18
21
24
27
No Outage Partial Full
Outage
# of
YES
resp
onse
s
Figure 20. Number of sector teams reported as having committed an airspace violation by Outage.
As seen in Figure 21, the majority of airspace violations reported were related to point-out events.
0%
20%
40%
60%
80%
100%
No Outage Partial Full
Outage
%
Hand-off Point-out Misc.
Figure 21. Percentage each airspace violation category contributed to the total number of violations by Outage.
39

3.7.2 Comparison Between Environments
The analysis revealed no statistically significant difference between the numbers of airspace violations committed when operating in each Environment. The airspace violations committed for each Outage condition were collapsed into one cumulative sum. The data were analyzed using a one-way ANOVA. The test of the main effect of Environment was not statistically significant, F(2, 24) = 1.09, p = .35. The mean number of airspace violations committed in each Environment is shown in Figure 22.
0123456789
10
Current Future MON
Environment
Mea
n ai
rspa
ce v
iola
tions
Figure 22. Mean airspace violations (± standard errors) committed in each Environment.
40
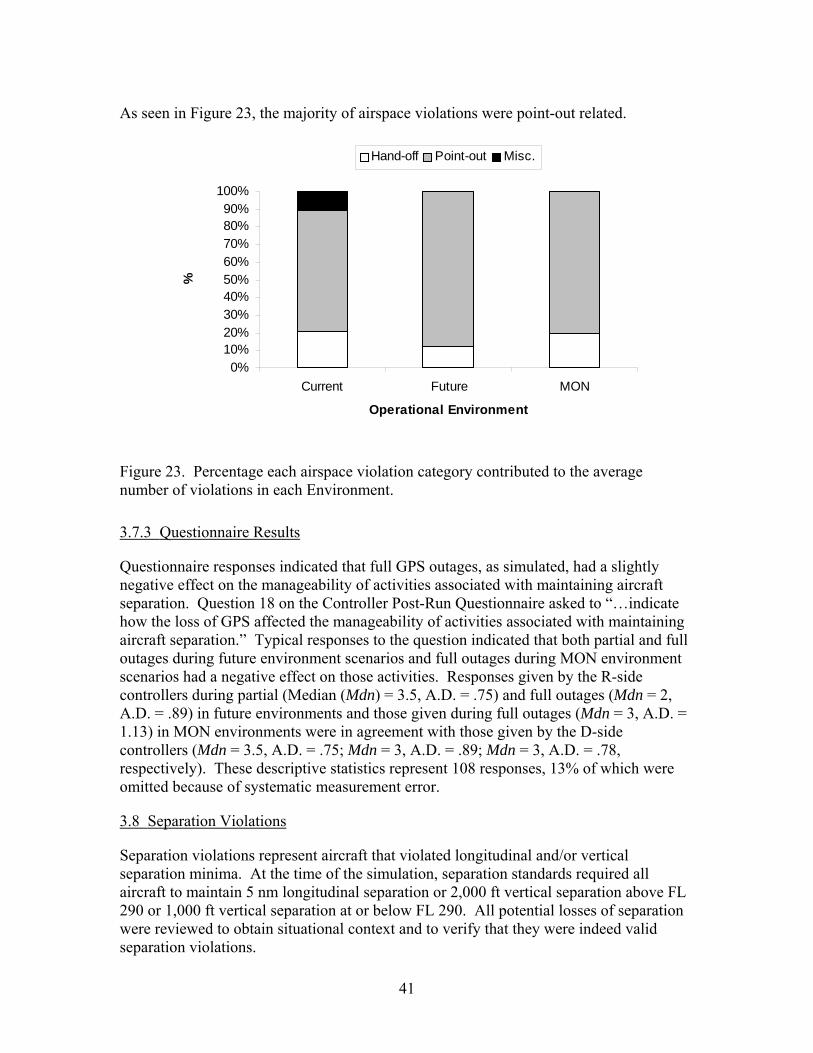
As seen in Figure 23, the majority of airspace violations were point-out related.
0%10%20%30%40%50%60%70%80%90%
100%
Current Future MON
Operational Environment
%
Hand-off Point-out Misc.
Figure 23. Percentage each airspace violation category contributed to the average number of violations in each Environment.
3.7.3 Questionnaire Results
Questionnaire responses indicated that full GPS outages, as simulated, had a slightly negative effect on the manageability of activities associated with maintaining aircraft separation. Question 18 on the Controller Post-Run Questionnaire asked to “…indicate how the loss of GPS affected the manageability of activities associated with maintaining aircraft separation.” Typical responses to the question indicated that both partial and full outages during future environment scenarios and full outages during MON environment scenarios had a negative effect on those activities. Responses given by the R-side controllers during partial (Median (Mdn) = 3.5, A.D. = .75) and full outages (Mdn = 2, A.D. = .89) in future environments and those given during full outages (Mdn = 3, A.D. = 1.13) in MON environments were in agreement with those given by the D-side controllers (Mdn = 3.5, A.D. = .75; Mdn = 3, A.D. = .89; Mdn = 3, A.D. = .78, respectively). These descriptive statistics represent 108 responses, 13% of which were omitted because of systematic measurement error.
3.8 Separation Violations
Separation violations represent aircraft that violated longitudinal and/or vertical separation minima. At the time of the simulation, separation standards required all aircraft to maintain 5 nm longitudinal separation or 2,000 ft vertical separation above FL 290 or 1,000 ft vertical separation at or below FL 290. All potential losses of separation were reviewed to obtain situational context and to verify that they were indeed valid separation violations.
41

Due to the infrequent occurrence of violations, a descriptive analysis is included. A total of six separation violations (see Table 15) occurred throughout the simulation with three occurring in Group 1, three in Group 2, and none in Group 3. In all occurrences, controllers rated their workload as 5 or higher during the time of the separation violation. One separation violation occurred during the current/partial outage condition, and one in the MON/full outage condition. The remaining four separation violations occurred in the future/no outage condition.
Table 15. Total Frequency of Separation Violations
No Outage Partial Outage Full Outage Current 1 Future 4 MON 1
Note: Two of the violations in the no outage condition were the result of a single pilot read back error. The controller cleared an aircraft to descend and the pilot read back the clearance for a different aircraft. The pilot then descended the incorrect aircraft, which subsequently lost separation with two other aircraft.
3.9 Requests for a Tracker
Question 5 of the T/O questionnaire asked, “Did a member of the controller team request a tracker?” Response options included “yes” or “no” and are summarized in this section (see Figure 24).
0123456789
No Yes No Yes No Yes
Current Future MON
Tracker Requested
Freq
uenc
y
None Partial Full
Figure 24. Frequency of T/O responses to Question 5.
The analysis of the data focused on an overall analysis of the impact of GPS outages on the request for a tracker. More trackers were requested during full outages than during partial or no outage conditions.
42

3.9.1 Overall Analysis
More trackers were requested during full outages than during partial or no outage conditions. Cochran’s Q test determined that the proportion of trackers needed differed statistically between each outage, Q(2) = 7.43, p = .02. An examination of the frequencies for each outage reveals that there were more requests for trackers during full outages (67%) than there were during no outages (37%) and partial outages (44%). The effect of Environment was not statistically significant, F(2, 24) = 1.96, p = .16.
3.10 Debriefing
A debriefing session was held after each run and at the end of the simulation to capture the participants’ comments and observations. Relevant participant comments are summarized.
For all no-outage scenarios (in the current, future, and MON operational environments), controller participants reported that they had steady to busy traffic workload, with some frequency congestion representing ‘typical’ operations.
3.10.1 Assessing an Outage
After identifying a GPS outage, the controllers were instructed to report it to the supervisor and, if possible, to assess the area of the outage. Based on their experience in the simulation, the controllers indicated that, in the field, it would be difficult to determine if the event was system related or if it was an isolated aircraft equipment failure. However, in the simulation, after more aircraft reported a loss of GPS signal, it became apparent that the outages were a system failure. Some controllers were able to determine the area by the locations of the various reports. Many controllers reported that they were too busy to attempt to assess the area of the outage, and some stated that it should be the supervisors’ responsibility.
3.10.2 Air-Ground Coordination
The controllers stated that clear procedures for communicating a loss of GPS signal need to be developed before GPS becomes a primary means of navigation. For example, it is necessary to determine whether pilots will be required to report a loss of signal to ATC even if they can still navigate on their previously cleared course. Many controllers suggested that only pilots who need assistance navigating should call regarding GPS outages.
Simulation pilots were instructed to inform controllers of all losses of GPS signal. Pilots would typically report a loss of GPS when they checked on to a frequency. As a result, controllers perceived an increase in A/G communications during outage scenarios in all Environment conditions. After a GPS outage was identified, the controllers typically viewed “information only” calls (i.e., aircraft reporting an outage, but able to navigate without assistance) as a nuisance and/or a hindrance and were largely ignored. The frequent reports may aid the controller in assessing the area of outage; however, the benefits of this may be offset by issues created by the increase in pilot calls to report
43

outages. In addition, if the procedures dictate that only on-board equipment failures need to be reported to ATC, the pilot must be able to differentiate between a loss of on-board GPS equipment and a loss of GPS signal that is external to the aircraft’s equipment.
Coping strategies included general broadcasts on the frequency informing aircraft that there was an area of GPS loss of signal. Based on their experience in the simulation, the controllers stated that it should be the pilots’ responsibility to inform the controllers if they are unable to navigate, and that the controllers should not be responsible for assessing each aircraft’s capability. In addition, many controllers commented that although frequency congestion was a concern, they believed it would be even greater in the real world due to potential factors such as coordination between facilities and weather.
Controllers stated that phraseology and procedures for GPS outages need further definition. Phraseology related to outage communication should be clear and concise. Procedures should be kept simple. Furthermore, pilot requests for assistance should be clear and specific.
3.10.3 Ground-to-Ground Coordination
Controllers perceived that there was an increase in some coordination activities due to GPS outages. These included coordination with supervisors regarding general outage information and sector-to-sector coordination regarding individual aircraft and outage area information. The controllers debated over several options to assist in these activities. The use of DSTs was seen as a possible means to pass information while reducing verbal communication. Modifying aircraft datablocks with color or text to pass information was another suggestion. The controllers also suggested using procedures such as pre-coordinated headings between sectors. The idea of changing equipment identifiers to indicate aircraft affected by an outage and to assist in their coordination was widely discussed. However, the controllers recognized many potential problems that would be created by changing the identifier, thereby mitigating its effectiveness. For example, the equipment identifier would not be technically accurate and would need to be changed back when normal operations resume. Regardless, controllers generally agreed that in the event of an outage, they need some kind of clear indication of aircraft navigation equipment and functioning capabilities.
3.10.4 Complexity
Controllers reported that the complexity related to both partial and full GPS outages in all Environments largely depended on the number of aircraft requiring navigation assistance from controllers. If an aircraft required assistance, controllers viewed this as additional workload. Strategies they reported using to cope with the workload included giving VFR aircraft IFR clearance and routings, imposing flow restrictions, adding a tracker, and assigning vectors or headings. In some cases, the controllers were too busy to accommodate these special requests and did not provide assistance to aircraft unless they
44
were declaring an emergency. The controllers generally reported that the simulation scenarios were moderate to very busy even without a loss of GPS, making it difficult to properly attend to aircraft experiencing a loss of GPS signal.
A few controllers described the coping strategy for a GPS outage event as analogous to coping with thunderstorms. It was discussed that specific procedures for all possible contingencies may not be realistic. In addition, strategies dealing with these types of events may utilize similar survival strategies to maintain sector safety and may not be something that can be completely addressed through procedures or training.
3.10.5 Tracking Aircraft Experiencing a Loss of GPS Signal
The controllers adopted a few different strategies to track aircraft with a GPS outage. In some cases, the D-side attempted to keep track using strips. However, if the problem became too busy, the controller abandoned this in order to assist the R-side with other tasks, such as maintaining safe operations. Some controllers used the dwell function on the datablocks to indicate the aircraft that were operating on vectors.
3.10.6 Learning Curve
Most controllers reported that dealing with a loss of GPS signal became easier as they became more familiar with what to expect in an outage situation. The controllers tended to introduce flow restrictions until they became more confident that they could deal with the issues induced by the outage situation. As one controller said, “It wasn’t workload, it was the uncertainty of the potential workload. Workload didn’t make us stop departures, but I was uncertain about who was coming and [who would need] help.” The controllers said they would likely slow down traffic in the field until they were confident that they were able to handle the situation.
3.10.7 Impact of Backup Navigation Systems
Aircraft equipped with a seamless backup navigation system were able to navigate during a GPS outage without increased assistance from controllers. Aircraft equipped with a VOR backup only allowed controllers to provide alternate routing, which required additional cognitive workload, A/G communication, flight data entries, and possible coordination. Aircraft without any backup system required considerable assistance from the controller including vectors, coordination, and monitoring. The controllers commented that GPS outages were manageable due to the number of aircraft with multiple navigation backup systems. Therefore, it appears that the greater the percentage of aircraft equipped with backup systems, the less impact on the controller in the event of an outage. Hence, aircraft avionics should be considered throughout any decommissioning strategy for navigation aids.
3.10.8 Situational Awareness
The controllers commented that it was sometimes difficult to maintain situational awareness of aircraft requiring navigation assistance. Some controllers used the dwell feature to highlight the datablock of those aircraft on vectors (due to an outage situation);
45

however, comments were also made stating that it was easy to accidentally turn off the dwell feature. (Note that changes in the DSR since this simulation have mitigated the likelihood of this occurring.) Other controllers made identifying marks on the flight strips to indicate that an aircraft was experiencing a GPS outage. To assist in maintaining situational awareness, a number of strategies were proposed: annotating the outage information in the remarks section of the flight plan, having a special indicator displayed on the datablock that would forward to the next sector (also reducing coordination), and using the DSR draw function to outline the area of GPS outage. (Note that since the simulation, the fourth line in the datablock has now become available in the DSR and allows the forwarding of free text information from sector to sector.)
3.10.9 Simulation Realism
The controllers reported that the simulation environment was very realistic and that training was adequate. There were some differences in the environment that the controllers thought were a slight issue. For example, there were less strip bays in the simulation environment than in the field. Also, some of the phraseology utilized by the simulation pilots was not realistic. In addition, all of the flight strips were printed and stuffed in the beginning of each scenario rather than as flights arrived. Some controllers reported that this gave them an initial perception of a higher workload level.
4. DISCUSSION
This simulation provided an initial look at the effects of GPS outage situations and operational environments on controller workload and procedures and identified several associated operational issues. The following paragraphs discuss the effects of Environments and then Outages on workload in terms of both subjective and objective measures. In addition, this discussion includes operational issues that were captured from the objective measures, questionnaire results, and discussions with the controllers. Implications of patterns in the data for the air traffic system and procedures are also addressed.
The sectors simulated in this study were chosen based on the best historical traffic count data available at the time, and it is believed that they generally represent a typical body of airspace within the NAS. However, other sectors within the NAS are likely to be impacted differently due to unique conditions that may exist. This simulation, nonetheless, attempted to identify typical effects of an outage event on a typical sector.
Results from the simulation indicated that there were no significant main effects of Environment on any of the measures reported. Although it does not appear that Environment is a major concern, it may be worth re-examining under different conditions in future simulations.
The data gathered in the simulation did not uniformly indicate consistent effects of GPS outages on controller workload. Some data indicated that there was no meaningful impact of GPS outages on workload. For example, the analysis revealed that there was a statistically significant effect of Outage on the average controller WAK interval ratings;
46
however, the workload responses were all within the moderate range. Furthermore, the questionnaire responses regarding the effect of Outage on overall workload and mental/physical activities showed no significant effect. Additionally, the outages had no effect on the occurrence of traffic flow restrictions or airspace violations.
However, when all the data were considered, an overall effect became clearer. The controllers’ write-in responses and debriefing comments indicated workload increases in areas of operational importance to ATC. Those areas included perceived increases in coordination demands (between sectors, facilities, and aircraft), and increased sector complexity (troubleshooting, traffic analysis and route planning, maintaining aircraft separation, maintaining awareness of the outage-derived activities).
Although there was no statistical effect of Outage on the average frequency of communications, there may be an effect on frequency congestion that was not captured in the data. The length of the transmissions was not measured in the simulation; therefore, the effect of Outage on overall airtime was not analyzed. Outage related activities, such as aircraft re-routes, may have contributed to the complexity and duration of communications. Many pilots would typically add the report of a loss of GPS outage at the time they checked on the controllers’ frequency. This possibly assisted in maintaining the same frequency of transmissions while also contributing to additional complexity and duration of communications. Most of the controllers did indicate that the ‘information only’ calls from pilots reporting a GPS loss were a nuisance. Furthermore, controllers believed there might be more frequency congestion in the real world during GPS outage situations, especially if the occurrence is simultaneous with other off-nominal events such as thunderstorms.
Other data indicated that the effect of GPS outages on controllers was moderated by a redistribution of workload. For example, more trackers were requested during full outages than during partial or no outage conditions. D-sides often reported shedding less urgent tasks (i.e., strip marking) during busier periods. In addition, GPS outages had a significant effect on the number of point outs; the number of point outs was lower in the partial and full outage conditions than in the no-outage conditions. This is particularly interesting because the controllers reported that more coordination was required in outage situations (coordination of headings, exchange of information on outage areas between sectors, etc.). The frequency of coordination was approximately the same, therefore, a shift in resources probably occurred and resources usually allocated to other communications (i.e., point outs) may have been reduced to compensate for the required outage-related communications.
The controllers stated that the specific level of Outage and Environment made some scenarios more difficult than others. They reported that the current, no-outage scenarios were most like today’s heavy traffic environments. The difficulty of the scenario increased with the degree of outage, especially when aircraft were dependent on GPS for navigation or when there was a reduction in GBNA. Most reported that the full outage in the MON environment was the most difficult scenario. Some reasons given were that the MON scenario required controllers to think about what route the aircraft were on or what navigation aids and equipment existed. A lack of clearly defined ATC and aircrew
47
procedures and phraseology contributed to the degree of difficulty for this scenario. Conversely, controllers from one team reported that the future environment was the busiest of all of the scenario environments.
Controllers generally agreed that a degree of redundant or backup navigation systems is important to maintaining safety. They noted that the number of aircraft in this simulation that operated with a seamless backup system was a factor in their ability to maintain sector operations. Controllers generally believed that, in a very busy environment, aircraft without seamless backup navigation systems (e.g., DME/DME or IRS) increased the complexity of ATC. This includes aircraft with no backup navigation (i.e., GPS only) and aircraft that had a VOR backup but were flying a route with no GBNA facilities. As noted previously, the controllers were generally able to manage the traffic with the levels of redundant or backup navigation equipage simulated. The main concern was that future scenarios might have higher levels of aircraft without redundant or backup navigation.
5. GOERS RESEARCH TEAM OBSERVATIONS
Members of the GOERS Research Team were present throughout the simulation. This section serves to capture their observances and interpretations of the events and to provide their insight surrounding the issues under assessment.
Comments from the controllers during and after the simulation seemed to indicate that the lack of standard phraseology and procedures created the most operational impact. It was evident that identifying basic phraseology and procedures for handling a GPS outage was most important to the controllers. Suggestions focused on minimizing the coordination and simplifying the procedures. For example, receiving outage notification calls only from the pilots requiring navigation assistance and coordinated heading-agreements were cited as areas for improvement.
The team observed that it was difficult for controllers to ascertain the size of an outage area due to frequency congestion and workload. Current procedures call for controllers to log the call sign and type of each aircraft reporting a GPS outage as well as the location of the aircraft, the altitude of the aircraft, and the time of occurrence. This information is to be logged on FAA Form 7230-4 or the appropriate military form. Most of the controllers were too busy to log this information, dealing instead with higher priority issues. It was also difficult for some controllers to ascertain the size of an outage due to the nature of the GPS system. Some controllers thought they had a partial outage when they had a full outage; others thought that the outage area was moving across the sector when it was actually stationary.
It appeared difficult for some controllers to ascertain whether an outage was due to a GPS problem or an avionics problem. Once aircraft reported that they had no GPS signal, some controllers chose to change their equipment suffix to a non-GPS identifier such as ‘/A.’ Reasons given for this included expediency for the controller and uncertainty of when or whether the aircraft would be out of the outage area. Many of the controllers and members of the research team did not agree with the idea of changing the suffix in
48

this situation because the problem was not with the aircraft’s equipment. Additionally, many felt that significant problems that this change could cause outweighed any benefit.
Equipment identifiers used to reflect the navigation capabilities of the aircraft were problematic throughout the planning and execution of the simulation. The controllers had no way to ascertain backup capabilities from the current equipment identifiers. In general, equipment identifiers reflected primary navigation equipment carried on the aircraft, but had no direct correlation to information necessary during a GPS outage. For example, a ‘/G’ indicated that the aircraft had an IFR-certified GPS. There was no indication of whether that aircraft also carried a VOR for a backup or redundant navigation. A ‘/F’ aircraft carried an FMS, but, in these cases, it was possible that the aircraft may have had GPS as their only means of navigation, or they may have had no GPS capability at all and relied on VOR and DME. One solution may be to simply add more identifiers to provide additional information; however, this idea may be counter productive. Many of the controllers had no clear concept of the shades of meaning of the current identifiers. For example, during the planning of the simulation, one controller remarked, “Before this test, I didn’t really know what an FMS was or what it did.” It is suggested that a concerted and well-thought-out effort to address navigation equipment capabilities be conducted.
In addition to their observances during the simulation, the GOERS Research Team provided insight on overarching considerations. It is their opinion that the navigation aid decommissioning strategy and timeline, as outlined in the FAA’s Navigation and Landing Transition Strategy (August 2002) appears to be a reasonable one based on this simulation; however, adjustments may be required as the actual decommissioning progresses. If aircraft owners’ and operators’ investment in aircraft equipage happens at a slower rate than discussed in the FAA’s Navigation and Landing Transition Strategy, then the decommissioning schedule must be analyzed for modification to coincide with the actual equipage rate. If aircraft equipage occurs at a faster rate than has been assumed, then perhaps the decommissioning schedule could be made more aggressive. In any event, the decommissioning plan for navigation aids will only be successful if the aircraft navigation infrastructure rate increases in concert with, or in advance of, the decrease in ground-based navigation infrastructure.
Overall, based on the observations and results of the simulation, the GOERS Research Team believes that the stated objectives of the GOERS simulation were adequately addressed. The simulation provided a valuable assessment of GPS outages (outages emulated RFI effects) on controller workload; many operational issues surfaced as a result of the conditions simulated; and valuable input and lessons learned for future simulations were gathered.
6. CONCLUSIONS
Assessing the impact of a GPS outage (i.e., RFI as simulated) on controller workload was a major objective of this simulation. The data gathered in the simulation did not decidedly indicate consistent effects of the GPS outage on controller workload. The subjective ratings of workload were all within the moderate range, and much of the
49

related objective measures showed no differences between outages. This indicates, perhaps, a minimal operational relevance of observed workload increase. On the other hand, the statistically significant effect of Outage on workload may have been an indicator that workload did increase substantially, but was redistributed through actions such as requesting trackers (which were available upon request) and changing coordination behaviors. Additionally, a significant number of the controllers provided comments that indicated those areas of increased workload were operationally important. Congested frequencies, increased coordination, and additional distractions were identified as areas of increased workload.
The controllers believed that workload might be even higher in the real world because there might be more frequency congestion and coordination necessary in the event of an outage. Workload would also be adversely impacted with the occurrence of more aircraft requiring assistance than were represented in the simulation. Uncertainty of procedures and phraseology was also identified as contributing to workload. These perspectives are important, however, the results of this simulation are subject to how it was executed. Many factors have the potential to influence workload; for example, had trackers not been available, results may have been different. If the factors change or evolve, the validity of the results from the simulation must be reexamined to assess if they are still valid.
Therefore, the conclusion made in this report is that there was a relevant effect of Outage on workload; however, the controllers were generally able to compensate for the increase in workload. Future simulations should explore controller redistribution of workload during outages and how the redistribution affects the system. This should occur only after incorporating comments and lessons learned from this simulation, such as improved phraseology and procedures.
Operational issues that became apparent from this study include the need for clear procedures on both the air and ground sides during an outage. Frequency congestion was a significant concern among the controllers. Most reported that all aircraft informing them of an outage situation was a nuisance and resulted in an unnecessary increase in ATC workload. Controllers also expressed concern that phraseology was inadequate and needed to be developed to specifically address these types of GPS outages. In addition, less urgent tasks, such as marking strips, could possibly be shed during very busy traffic flows.
The ability of controllers to correctly interpret aircraft backup navigation capabilities was lacking. Controllers indicated that current equipage identifiers do not adequately inform the controller of backup navigation capabilities in the event of a GPS outage. The controllers also expressed concern regarding their difficulty staying updated with the increasing number of equipment identifiers. In addition, the controllers expressed a need for a means to determine whether a failure is system related or an isolated aircraft equipment failure.
50

Overall, the results of the simulation indicate that controllers were generally able to adapt to the challenges of GPS outages as simulated. Addressing the identified operational issues may mitigate the effects of an outage on ATC.
7. FUTURE STUDY RECOMMENDATIONS
Future GPS outage studies may benefit from alternative ways of presenting scenarios. Several controllers commented that a less busy problem, with more aircraft solely dependent on GPS requiring controller intervention, would be a better test of a GPS outage situation. The inclusion of proximal sectors would allow investigators to assess the effects of outages on each sector. Controllers from all three groups stated that the scenarios sustained a busy traffic load for too long, and that future simulations would benefit by incorporating peaks and troughs.
To thoroughly assess the impact of GPS outages on the ATC system, it is recommended that further simulations be conducted in other operational environments including en route to terminal transitional sectors, terminal sectors, and sectors that utilize grid structure in lieu of airways. In addition, scenarios should include more instances of aircraft emergencies and more moderate traffic flows with peaks and troughs. Finally, procedures for aircraft reporting outages with proper phraseology need to be clearly defined.
51

52

Acronyms
A/G Air-to-Ground A-side Assistant ACES Adaptation Control Environment System ANOVA Analysis of Variance ARTCC Air Route Traffic Control Center ATC Air Traffic Control CAASD Center for Advanced Aviation System Development CAT I Category I CAT II Category II CAT III Category III CPC Certified Professional Controller D-side Radar Associate DART Data Analysis And Reduction Tool DME Distance Measuring Equipment DSF Display System Facility DSR Display System Replacement DST Decision Support Tool FAA Federal Aviation Administration FACO Facility Control Office FL Flight Level FMS Flight Management System G/G Ground-to-Ground GA General Aviation GBNA Ground-Based Navigation Aids GOERS GPS Outage En Route Simulation GOTS GPS Outage Terminal Simulation GPS Global Positioning System HCS Host Computer System HSD Honestly Significant Difference IFR Instrument Flight Rules ILS Instrument Landing System IMC Instrument Meteorological Conditions IRS Inertial Reference System LAAS Local Area Augmentation System MCO Orlando International Airport Mdn Median MIT Miles-In-Trail MON Minimum Operational Network NAATS National Association of Air Traffic Specialists NAS National Airspace System NATCA National Air Traffic Controllers Association OS Operations Supervisor R-side Radar RFI Radio Frequency Interference RNAV Area Navigation
53

RNP Required Navigation Performance SAR System Analysis Recording SPW Simulation-Pilot Workstation SRQ Sarasota International Airport T/O Technical Observer TGF Target Generation Facility TMU Traffic Management Unit TPA Tampa International Airport U.S. United States VFR Visual Flight Rules VOR Very-High-Frequency Omni Range VSCS Voice Switching And Control System WAAS Wide Area Augmentation System WAK Workload Assessment Keypad WJHTC William J. Hughes Technical Center ZJX Jacksonville Air Route Traffic Control Center
54
References
Federal Aviation Administration (August 2002). Navigation and landing transition strategy. Washington, DC: Author.
Hegarty, C., Wroblewski, T., & Markin, K. R. (1996). An assessment of the ability of augmented GPS to provide sole means navigation (WN 95W254). McLean, VA: The MITRE Corporation.
Keppel, G. (1991). Design and analysis: A researcher’s handbook (3rd ed.). Englewood Cliffs, NJ: Prentice-Hall, Inc.
Siegel, S. (1956). Nonparametric statistics for the behavioral sciences. New York: McGraw-Hill.
55


APPENDIX A
TECHNICAL OBSERVER DURING-THE-RUN QUESTIONNAIRE


A-1
GPS OUTAGE EN ROUTE SIMULATION (GOERS) OBSERVER QUESTIONNAIRE – DURING-THE-RUN
==============================================================
Date: ______________ Run Number: ___________ Scenario Number: __________ Sector Observed (circle one): CEDAR KEY OCALA LAKE CITY ===============================================================
INSTRUCTIONS FOR COMPLETING THE QUESTIONNAIRE. Please familiarize yourself with the items contained in the questionnaire before the simulation starts. Listen and closely observe the actions of the controller team operating in your sector. Based on what you hear and see, apply your expertise and experience as a controller to carefully respond to each question. In addition to answering the questions, please record any problems or difficulties that were pointed out to you by the controller participants or that you may have noticed.

A-2
ANSWER QUESTIONS 1 THROUGH 4 ONLY IF THE SCENARIO CONTAINS A GPS OUTAGE.
GPS OUTAGE 1. What was the simulation time when the controller team first identified that there was a GPS
outage? Simulation time: ______________
2. What was the principal circumstance, event, set of circumstances, or sequence of events that
cued the controller team that an extensive GPS outage had occurred. ________________________________________________________________________ ________________________________________________________________________ OUTAGE SCOPE 3. Did any member of the controller team attempt to determine the scope of the outage?
Circle one: YES NO 4. If the answer to question 3 was YES, who first initiated the action?
Circle one: R-Controller D-Controller Tracker The Team, collectively
If the answer to question 3 was YES, identify the methods, events, parameters, or circumstances that were used to determine the outage limits.
________________________________________________________________________ ________________________________________________________________________ TRACKER REQUESTS 5. Did a member of the controller team request a Tracker?
Circle one: YES NO 6. Tracker request Simulation time: ______________
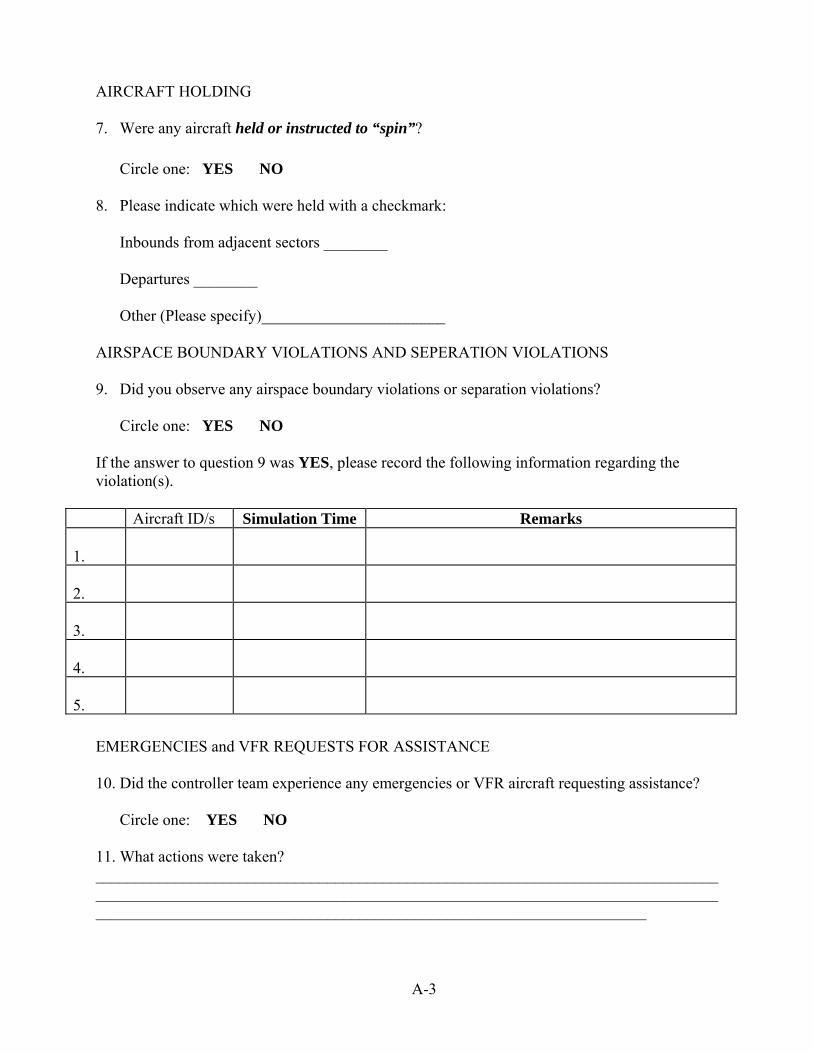
A-3
AIRCRAFT HOLDING 7. Were any aircraft held or instructed to “spin”?
Circle one: YES NO 8. Please indicate which were held with a checkmark:
Inbounds from adjacent sectors ________ Departures ________ Other (Please specify)_______________________
AIRSPACE BOUNDARY VIOLATIONS AND SEPERATION VIOLATIONS 9. Did you observe any airspace boundary violations or separation violations?
Circle one: YES NO If the answer to question 9 was YES, please record the following information regarding the violation(s).
Aircraft ID/s Simulation Time Remarks 1.
2.
3.
4.
5.
EMERGENCIES and VFR REQUESTS FOR ASSISTANCE 10. Did the controller team experience any emergencies or VFR aircraft requesting assistance?
Circle one: YES NO
11. What actions were taken? _________________________________________________________________________________________________________________________________________________________________________________________________________________________________

A-4
BLOCKED FREQUENCIES 12. Did the controller team experience any blocked frequencies?
Circle one: YES NO
13. What actions were taken? _________________________________________________________________________________________________________________________________________________________________________________________________________________________________ OTHER COMMENTS 14. Please comment on any other issues that you observed during this run that could aid
experiment team members to understand the events as they occurred. ____________________________________________________________________________________________________________________________________________________________________________________________________________________________________________________________________________________________________________
Thank you for your cooperation

APPENDIX B
TECHNICAL OBSERVER POST-RUN QUESTIONNAIRE


GPS OUTAGE EN ROUTE SIMULATION (GOERS) OBSERVER QUESTIONNAIRE – POST-RUN
=============================================================== Date: _____________ Run Number: __________ Scenario Number: __________ Sector Observed (circle one): LAKE CITY OCALA CEDAR KEY Participant Code: __________ ===============================================================
INSTRUCTIONS FOR COMPLETING THE QUESTIONNAIRE. Please familiarize yourself with the items contained in the questionnaire before the simulation starts. Based on what you heard and saw during the last run, apply your expertise and experience as a controller to carefully respond to each question. In addition to answering the questions, please record any problems or difficulties that were pointed out to you by the controller participants or that you may have noticed.
B-1

1. Did this run involve a GPS outage?
Circle one: YES NO 2. Was the run completed?
Circle one: YES NO 3. If the answer to question 2 was NO, describe the circumstances that caused the run to
prematurely end. ________________________________________________________________________ ________________________________________________________________________ ________________________________________________________________________ 4. Did you observe any problem with the use of the DSR, CRD, keyboard, or VSCS?
Circle one: YES NO 5. If the answer to question 4 was YES, describe the problem and how it was solved ________________________________________________________________________ ________________________________________________________________________ ________________________________________________________________________ ________________________________________________________________________ The term busyness (as used in questions 6, 7 and 8) refers to the physical activities associated with accomplishing tasks. For example, performing the physical actions associated with entering keyboard data, marking strips, selecting VSCS connections, manipulating the trackball, etc. 6. Circle the number which best describes the busyness level of the: R-Controller: 1 2 3 4 5 6 7
Very Low Moderate Very High D-Controller: 1 2 3 4 5 6 7
Very Low Moderate Very High Tracker: 1 2 3 4 5 6 7
Very Low Moderate Very High If a Tracker was not used, check this box
B-2

7. Was the busyness level uniform throughout the run?
Circle one: YES NO 8. If the response to question 7 was NO, describe how the busyness level fluctuated and
whether such fluctuations are normal in this sector. ________________________________________________________________________ ________________________________________________________________________ ________________________________________________________________________ ________________________________________________________________________ ________________________________________________________________________ 9. Based on what you observed during this run, is the use of radar vectors as the sole means of
navigation safe?
Circle one: YES NO 10. If your response to question 9 was NO, please explain. ________________________________________________________________________ ________________________________________________________________________ ________________________________________________________________________ ________________________________________________________________________ ________________________________________________________________________
B-3

11. Please comment on any other issues or concerns that you may have regarding the activities
that you observed during this run. ________________________________________________________________________ ________________________________________________________________________ ________________________________________________________________________ ________________________________________________________________________ ________________________________________________________________________ ________________________________________________________________________ ________________________________________________________________________ ________________________________________________________________________ ________________________________________________________________________ ________________________________________________________________________ ________________________________________________________________________ ________________________________________________________________________ ________________________________________________________________________ ________________________________________________________________________ ________________________________________________________________________ ________________________________________________________________________ ________________________________________________________________________ ________________________________________________________________________ ________________________________________________________________________ ________________________________________________________________________
B-4
APPENDIX C
CONTROLLER BRIEFING


GPS Outage En Route Simulation (GOERS) – Controller Briefing
The FAA is promoting reliance on space-based navigation, while contemplating a reduction in Ground-based navigation aids (GBNA). The FAA is rapidly developing and implementing RNAV routes and approach procedures that could be impacted by a Global Positioning System (GPS) outage or by GPS signal interference. The level of impact depends on the degree of GPS reliance by the airborne navigation equipment being flown. The FAA is also implementing the Wide Area Augmentation System (WAAS) and is investigating potential implementation of the Local Area Augmentation system (LAAS). Both are intended to enhance the capabilities of GPS to enable its use as a primary navigation source for en route and terminal applications in the National Airspace System (NAS); however, both are equally susceptible to GPS interference and equally impacted by a GPS outage. The vulnerability of the GPS constellation and the susceptibility of the GPS signal to interference were researched and documented in the Johns Hopkins University GPS Risk Assessment Study (January 1999) and the John A. Volpe National Transportation Systems Center Vulnerability Assessment of the Transportation Infrastructure Relying on the Global Positioning System (August 2001). GOERS is the first of a two-part study known as the GPS Outage Simulation Studies (GOSS). GOERS is intended to provide an initial examination of the workload and operational issues associated with an en route controller’s ability to manage a GPS outage situation. The specific objectives are: (1) to assess the impact of a GPS outage on controller workload, (2) to identify operational issues that may arise as a result of a GPS outage under the conditions simulated, and (3) to provide a basis for conducting further simulations. GOERS will be followed by an analysis of the impact within terminal airspace, known as the GPS Outage Terminal Simulation (GOTS). The latter part of the experiment assumes a partial reduction of GBNA. The existing surveillance capabilities are available, including primary radar, secondary radar, and current Host automation features. The existing airway route structure is also available. VHF voice is used for A/G communications. Current inter- and intra-facility communications capabilities exist. The VSCS is used. Weather throughout the airspace is mostly IMC with areas of VMC conditions, and airports underlying the subject en route airspace are IMC. Aircraft equipage rates vary throughout the experiment. They represent the most likely rates anticipated through research by the MITRE Corporation of McLean, Virginia. Your role is to provide air traffic services. As always, maintaining separation between aircraft is your first priority. You will use existing rules and procedures as defined by FAA Order 7110.65. Should a GPS outage occur, /E and /F equipped aircraft will be expected to continue navigating without assistance. However, in a GPS outage situation, aircraft that are dependent on GPS as a navigation source will require some level of assistance from ATC (radar vectors, alternate routes, GPS outage area information, etc.).
C-1

Video and audio data will be collected throughout the simulation. An observer will also take notes and record information as you work. Additionally, you will be asked to rate your instantaneous individual workload every five minutes. A keypad will be provided for this purpose. When the alert sounds, we ask you to depress the key corresponding to your estimated workload using the following 1-to-7 scale.
Workload Rating Scale
Very Low Moderate Very High
1 2 3 4 5 6 7
After each run, you will be asked to complete a questionnaire and a short, structured interview session will follow. At the end of the last day, you will be asked to complete a Post-Simulation Questionnaire and you will participate in a short group debriefing session. The data and information that are obtained will be analyzed and a report will be compiled and published. COMPLETE ANONYMITY WILL BE MAINTAINED – all audio records will be securely safeguarded until the report is approved and published. They will then be destroyed.
C-2

APPENDIX D
BACKGROUND QUESTIONNAIRE


GPS OUTAGE EN ROUTE SIMULATION (GOERS) BACKGROUND QUESTIONNAIRE
The following information is requested for reporting data relevant to the GOERS simulation. Your personal information will be kept completely confidential and will not be included in any of the reports or documents that will be produced as a result of this study. When necessary, individuals will be identified as Subject A, Subject B, etc. Participant Code: __________ Date:
1. Are you a CPC?
Circle one: YES NO
2. Are you currently certified to operate in the LAKE CITY sector?
Circle one: YES NO
3. Are you currently certified to operate in the OCALA sector?
Circle one: YES NO
4. Are you currently certified to operate in the CEDAR KEY sector
Circle one: YES NO
5. In which Area do you usually control traffic (check the appropriate box)?
South Area (LAKE CITY sector) Central Area (OCALA sector/CEDAR KEY sector)
6. What is your total experience as a controller (in any control position and geographic
location)?
Years: ______________ Months: ______________
7. What is your total experience as a ZJX controller?
Years: ______________ Months: ______________
D-1

8. What is your total experience as a ZJX, South Area, radar controller?
Years: ______________ Months: ______________
9. What is your total experience as a ZJX, Central Area, radar controller?
Years: ______________ Months: ______________
10. How many of the past 12 months have you actively controlled traffic in ZJX South Area? Months: ______________
11. How many of the past 12 months have you actively controlled traffic in ZJX Central
Area?
Months: ______________
12. How many hours a month do you work in the LAKE CITY sector?
Hours/Month: ______________
13. How many hours a month do you work in the OCALA sector?
Hours/Month: ______________
14. How many hours a month do you work in the CEDAR KEY sector?
Hours/Month: ______________
D-2

APPENDIX E
INFORMED CONSENT FORM


GPS Outage En Route Simulation (GOERS) Participation Form
Nature and Purpose: GOERS is the first of a two-part study known as the GPS Outage Simulation Studies (GOSS). GOERS is intended to provide an initial examination of the workload and operational issues associated with an en route controller’s ability to manage a GPS outage situation.
Experimental Procedures: Three groups (i.e., 27 individuals) of nine Certified Professional Controllers (CPCs) from the ZJX will participate in the simulation over a three-week period. Each group will participate for five days. Each group will be divided into three, three member teams. Each team will consist of a Radar Controller, a Radar Associate (D-side) Controller, and a Tracker Controller. Each team member will participate in each of the three positions. One team will operate the LAKE CITY sector, the second team will operate the OCALA sector, and the third team will operate the CEDAR KEY sector. During each simulation run, participants will work either the R-side, the D-side, or the Tracker position (if required). Subjective workload measures will be collected during each simulation run. Discomforts and Risks: There are no expected discomforts or risks associated with this simulation. Benefits: I understand that the benefit to me is the opportunity to participate in research that examines the impact of GPS outages on all controllers. Participant Responsibilities: During the simulation it will be my responsibility to control air traffic and regard the simulated air traffic as if it were live traffic. I will answer any questions asked during the simulation to the best of my abilities. I will not discuss the content of the simulation with anyone until its formal completion. I will complete a background questionnaire, a Post-Run Questionnaire at the end of each simulation run, and a Post-Simulation Questionnaire at the end of all simulation runs. I will participate in debriefings at the end of each simulation run, and at the completion of the full simulation. Participant’s Assurances: I understand that my participation in this simulation is completely voluntary. Karen Buondonno will adequately answer any and all questions I have about this simulation, my participation, and the procedures involved. I understand that if new findings develop during the course of this research that may relate to my decision to participate, I will be informed. I have not given up any of my legal rights or released any individual or institution from liability for negligence. I understand that records of this simulation are strictly confidential, and that I will not be
E-1

identifiable by name or description in any reports or publications about this simulation. Photographs and audio recordings are for use within the William J. Hughes FAA Technical Center (WJHTC) only. Any of the materials that may identify me as a participant cannot be used for purposes other than internal to the WJHTC without my written permission. I understand that I can withdraw from the simulation at any time without penalty or loss of benefits to which I may be entitled. I also understand that the researcher or sponsor of this simulation may terminate my participation if he or she feels this to be in my best interest. If I have questions about this simulation or need to report any adverse effects from the research procedures I will contact Karen Buondonno at (609) 485-4036. I have read this participation form, I understand its contents, and I freely consent to participate in this simulation under the conditions described. I have received a copy of this participation form.
Signature of Research Participant: ___________ Date: ___________________
Signature of Research Director: __________ Date: _____________________
Witness: ____________________________________________ Date: _____________________
E-2

APPENDIX F
CONTROLLER POST-RUN QUESTIONNAIRE


GPS OUTAGE EN ROUTE SIMULATION (GOERS) CONTROLLER QUESTIONNAIRE – POST-RUN
Participant Code: __________ Date: _____________ Run Number: __________ Scenario Number: __________ =============================================================== 1. Which Sector did you work? Circle one.
LAKE CITY OCALA CEDAR KEY
2. Which position did you work? Circle one. R-Controller D-Controller Tracker
3. Was the run completed? Circle one: YES NO
4. If the answer to question 3 was NO, describe the circumstances that caused the run to
prematurely end. ________________________________________________________________________ ________________________________________________________________________ ________________________________________________________________________ ________________________________________________________________________ ________________________________________________________________________ 5. How do you compare the traffic volume of this run with that you typically experience when
working in this sector in the field? Circle one. 1 2 3 4 5 6 7 Very Light Moderate Very Heavy
6. How do you compare the simulated flight crew responses with those experienced in the field? Circle one: 1 2 3 4 5 6 7 Very Slow Normal Very Quick
7. Did you have any problem(s) using the DSR, CRD, keyboard, or VSCS? Circle one: YES NO
F-1
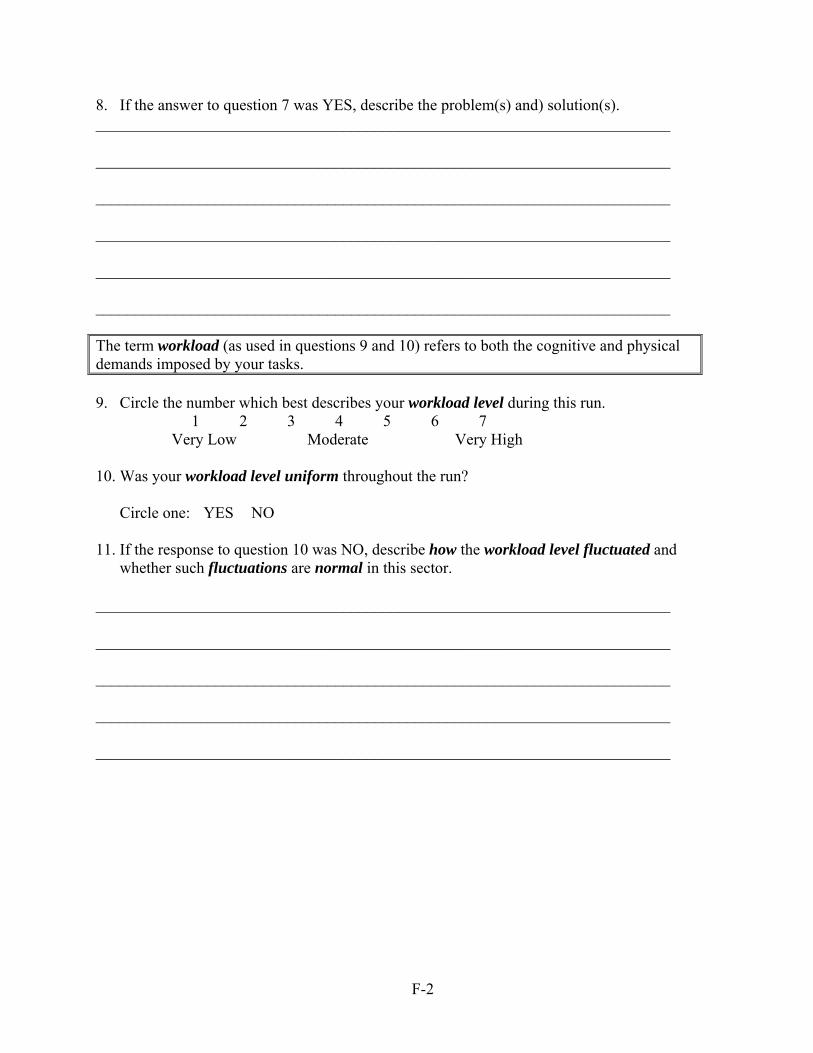
8. If the answer to question 7 was YES, describe the problem(s) and) solution(s). ________________________________________________________________________ ________________________________________________________________________ ________________________________________________________________________ ________________________________________________________________________ ________________________________________________________________________ ________________________________________________________________________ The term workload (as used in questions 9 and 10) refers to both the cognitive and physical demands imposed by your tasks. 9. Circle the number which best describes your workload level during this run.
1 2 3 4 5 6 7 Very Low Moderate Very High
10. Was your workload level uniform throughout the run?
Circle one: YES NO
11. If the response to question 10 was NO, describe how the workload level fluctuated and whether such fluctuations are normal in this sector.
________________________________________________________________________ ________________________________________________________________________ ________________________________________________________________________ ________________________________________________________________________ ________________________________________________________________________
F-2

12. How much did you have to have to think and plan during this run? Circle one. 1 2 3 4 5 6 7
Minimal Moderate A great thinking thinking deal of and and thinking planning planning and planning
The term busy (as used in question 13) refers to the physical activities associated with accomplishing tasks. For example, performing the physical actions associated with entering keyboard data, marking strips, selecting VSCS connections, manipulating the trackball, etc. 13. How busy were you during this run? Circle one.
1 2 3 4 5 6 7 Not Moderately Extremely busy busy busy at all 14. During the time that GPS was available during this run, how did you divide the control,
scanning, strip marking, and communications activities among the R-Controller, D-Controller, and Tracker.
________________________________________________________________________ ________________________________________________________________________ ________________________________________________________________________ ________________________________________________________________________ 15. Did this run involve a GPS outage?
Circle one: YES NO
If your response to question 15 was NO, proceed to Question 31. If your response was YES, continue with question 16. 16. Based on what you experienced during this run, is the use of radar vectors as the sole means
of navigation safe?
Circle one: YES NO
F-3
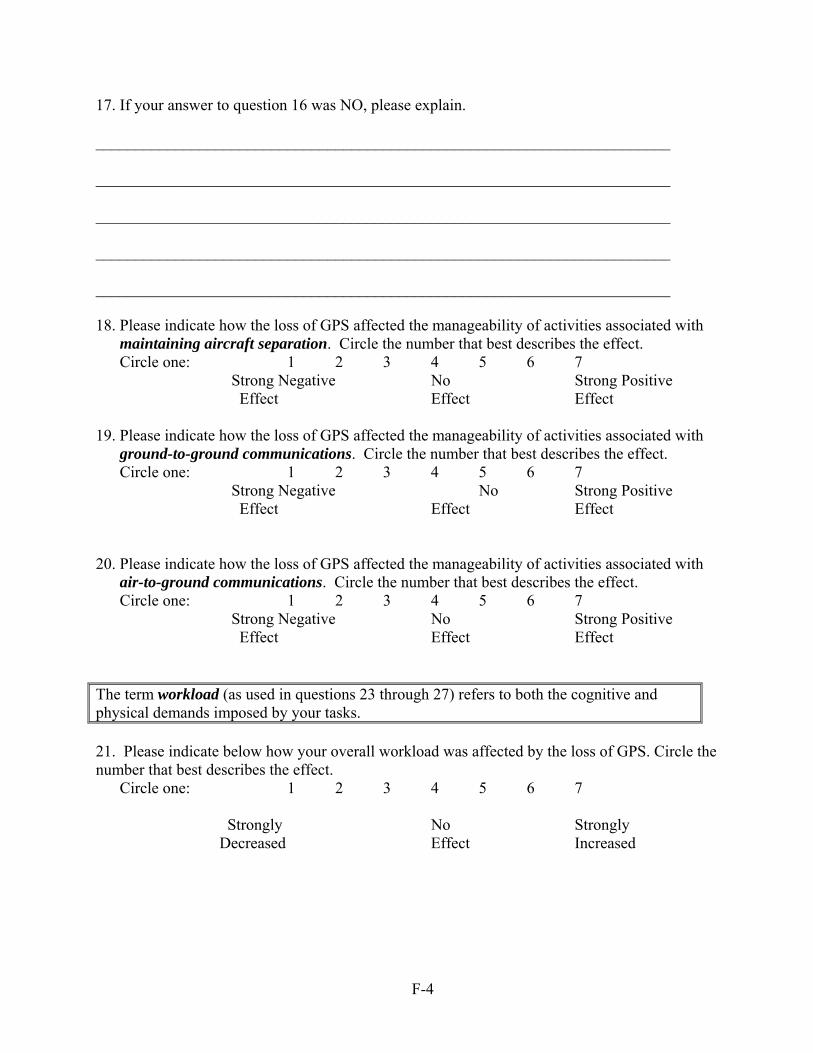
17. If your answer to question 16 was NO, please explain. ________________________________________________________________________ ________________________________________________________________________ ________________________________________________________________________ ________________________________________________________________________ ________________________________________________________________________ 18. Please indicate how the loss of GPS affected the manageability of activities associated with
maintaining aircraft separation. Circle the number that best describes the effect. Circle one: 1 2 3 4 5 6 7
Strong Negative No Strong Positive Effect Effect Effect 19. Please indicate how the loss of GPS affected the manageability of activities associated with
ground-to-ground communications. Circle the number that best describes the effect. Circle one: 1 2 3 4 5 6 7
Strong Negative No Strong Positive Effect Effect Effect
20. Please indicate how the loss of GPS affected the manageability of activities associated with
air-to-ground communications. Circle the number that best describes the effect. Circle one: 1 2 3 4 5 6 7
Strong Negative No Strong Positive Effect Effect Effect The term workload (as used in questions 23 through 27) refers to both the cognitive and physical demands imposed by your tasks. 21. Please indicate below how your overall workload was affected by the loss of GPS. Circle the number that best describes the effect.
Circle one: 1 2 3 4 5 6 7 Strongly No Strongly
Decreased Effect Increased
F-4

22. Please indicate how maintaining aircraft separation activities contributed to your workload during the GPS outage period.
Circle one: 1 2 3 4 5 6 7 Strongly No Strongly
Decreased Effect Increased 23. Please indicate how ground–to-ground communications activities contributed to your workload during the GPS outage period.
Circle one: 1 2 3 4 5 6 7 Strongly No Strongly
Decreased Effect Increased 24. Please indicate how air–to-ground communications activities contributed to your workload during the GPS outage period.
Circle one: 1 2 3 4 5 6 7 Strongly No Strongly
Decreased Effect Increased 25. How did the loss of GPS affect your physical activity (e.g., data entry, record keeping, etc.) Circle the number that best describes the amount of change.
Circle one: 1 2 3 4 5 6 7 Strongly No Strongly
Decreased Effect Increased Please explain why. ________________________________________________________________________ ________________________________________________________________________ ________________________________________________________________________ ________________________________________________________________________ ________________________________________________________________________
F-5

26. How did the loss of GPS affect your mental activity (e.g., thinking, planning, concentrating, etc.)? Circle the number that best describes the amount of change.
Circle one: 1 2 3 4 5 6 7 Strongly No Strongly
Decreased Effect Increased Please explain why. ________________________________________________________________________ ________________________________________________________________________ ________________________________________________________________________ ________________________________________________________________________ ________________________________________________________________________ 27. Please provide any additional comments or concerns you may have about this run. ________________________________________________________________________ ________________________________________________________________________ ________________________________________________________________________ ________________________________________________________________________ ________________________________________________________________________ ________________________________________________________________________ ________________________________________________________________________ ________________________________________________________________________ ________________________________________________________________________ ________________________________________________________________________ ________________________________________________________________________ ________________________________________________________________________
F-6

APPENDIX G
CONTROLLER POST-SIMULATION QUESTIONNAIRE


GPS OUTAGE EN ROUTE SIMULATION (GOERS) CONTROLLER QUESTIONNAIRE – POST-SIMULATION
Participant Code: __________ Date: _____________ =============================================================== 1. Which Sector did you work?
Circle one: LAKE CITY OCALA CEDAR KEY
2. Did the loss of GPS create any unmanageable situations during any run? Circle one: YES NO
3. If the answer to question 2 was YES, please describe the situation(s). ________________________________________________________________________ ________________________________________________________________________ ________________________________________________________________________ ________________________________________________________________________ ________________________________________________________________________ 4. Was the laboratory environment significantly different than your normal working
environment? Specifically consider target speeds, aircraft climb and descent rates, pilot response to instructions, realism of controller/pilot communications, and the interaction with adjacent sectors.
Circle one: YES NO
5. If the answer to question 4 was YES, please describe how the environments differed. ________________________________________________________________________ ________________________________________________________________________ ________________________________________________________________________ ________________________________________________________________________ ________________________________________________________________________
G-1

6. If the answer to question 4 was YES, please describe how the differences affected your ability to control traffic.
________________________________________________________________________ ________________________________________________________________________ ________________________________________________________________________ ________________________________________________________________________ ________________________________________________________________________ 7. Is the phraseology contained in FAAO 7110.65 adequate for use during GPS outage
situations? Circle one: YES NO
8. If the answer to question 7 is NO, please identify the deficiencies and describe what can be done to improve the communications effectiveness between flight crews and controller in such situations.
________________________________________________________________________ ________________________________________________________________________ ________________________________________________________________________ ________________________________________________________________________ ________________________________________________________________________ ________________________________________________________________________ ________________________________________________________________________ 9. Is there a particular message, set of messages, phrase, or set of phrases that you would
recommend for use by controllers and pilots during a GPS outage? Circle one: YES NO
G-2

10. If your response to question 9 is YES, please list the message(s) or phrase(s). ________________________________________________________________________ ________________________________________________________________________ ________________________________________________________________________ ________________________________________________________________________ ________________________________________________________________________ ________________________________________________________________________ ________________________________________________________________________ 11. Do you feel that the training you received was adequate to perform this simulation?
Circle one: YES NO
12. If your response to question 11 was NO, please identify the training deficiencies and describe what should be done to improve the training (e.g., longer practice sessions, more robust scenarios, etc.).
________________________________________________________________________ ________________________________________________________________________ ________________________________________________________________________ ________________________________________________________________________ ________________________________________________________________________ ________________________________________________________________________ ________________________________________________________________________
G-3

13. The table below lists the different types of scenarios that were used during this simulation. Please rank the scenarios in terms of difficulty (1 being the most difficult and 9 being the least difficult).
Outage Equipage Rank No Today’s NAS Partial Today’s NAS Full Today’s NAS No Future 2013-2015 Partial Future 2013-2015 Full Future 2013-2015 No MON 2013-2015 Partial MON 2013-2015 Full MON 2013-2015
14. Please explain why you ranked the scenarios in that particular order. ________________________________________________________________________ ________________________________________________________________________ ________________________________________________________________________ ________________________________________________________________________ ________________________________________________________________________ ________________________________________________________________________ ________________________________________________________________________ 15. Please provide any comments, concerns, or suggestions related to automation capabilities or
decision support tools that would assist you in controlling traffic in the event of a GPS outage.
________________________________________________________________________ ________________________________________________________________________ ________________________________________________________________________ ________________________________________________________________________ ________________________________________________________________________ ________________________________________________________________________
G-4

16. Please provide any additional comments, concerns, or suggestions that you may have about operational issues that may arise when controlling traffic in the event of a GPS outage.
________________________________________________________________________ ________________________________________________________________________ ________________________________________________________________________ ________________________________________________________________________ ________________________________________________________________________ ________________________________________________________________________ ________________________________________________________________________ ________________________________________________________________________ ________________________________________________________________________ ________________________________________________________________________ ________________________________________________________________________ ________________________________________________________________________ ________________________________________________________________________ ________________________________________________________________________ ________________________________________________________________________ ________________________________________________________________________ ________________________________________________________________________ ________________________________________________________________________ ________________________________________________________________________
G-5