Global Pharmaceuticals and Biotechnology 49,422 IMS Tracker
42
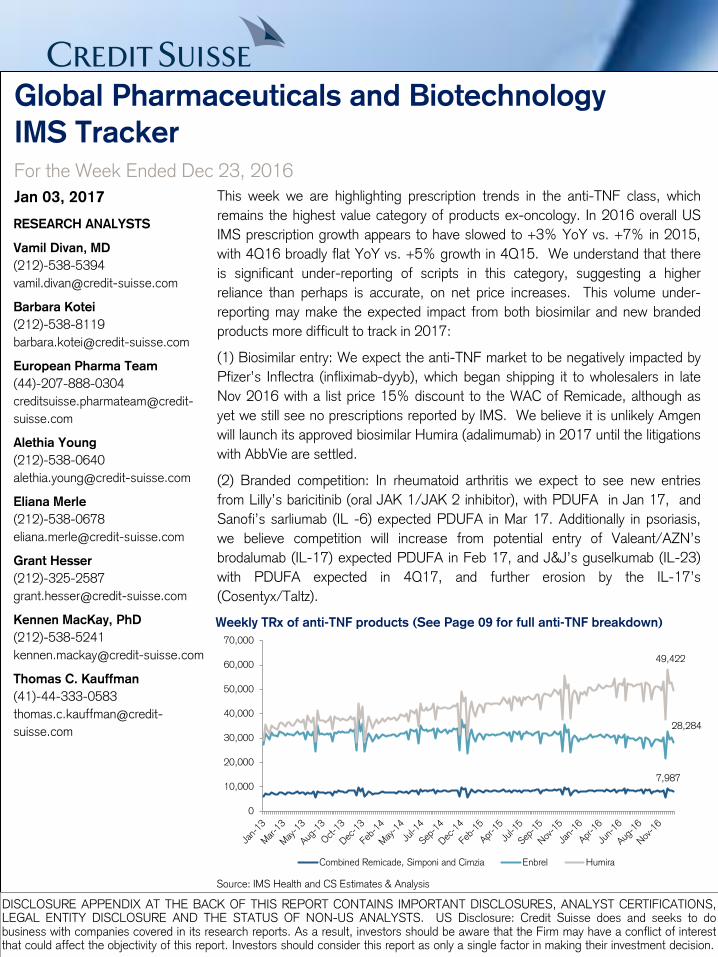
Jan 03, 2017 Global Pharmaceuticals and Biotechnology IMS Tracker For the Week Ended Dec 23, 2016 This week we are highlighting prescription trends in the anti-TNF class, which remains the highest value category of products ex-oncology. In 2016 overall US IMS prescription growth appears to have slowed to +3% YoY vs. +7% in 2015, with 4Q16 broadly flat YoY vs. +5% growth in 4Q15. We understand that there is significant under-reporting of scripts in this category, suggesting a higher reliance than perhaps is accurate, on net price increases. This volume under- reporting may make the expected impact from both biosimilar and new branded products more difficult to track in 2017: (1) Biosimilar entry: We expect the anti-TNF market to be negatively impacted by Pfizer’s Inflectra (infliximab-dyyb), which began shipping it to wholesalers in late Nov 2016 with a list price 15% discount to the WAC of Remicade, although as yet we still see no prescriptions reported by IMS. We believe it is unlikely Amgen will launch its approved biosimilar Humira (adalimumab) in 2017 until the litigations with AbbVie are settled. (2) Branded competition: In rheumatoid arthritis we expect to see new entries from Lilly’s baricitinib (oral JAK 1/JAK 2 inhibitor), with PDUFA in Jan 17, and Sanofi’s sarliumab (IL -6) expected PDUFA in Mar 17. Additionally in psoriasis, we believe competition will increase from potential entry of Valeant/AZN’s brodalumab (IL-17) expected PDUFA in Feb 17, and J&J’s guselkumab (IL-23) with PDUFA expected in 4Q17, and further erosion by the IL-17’s (Cosentyx/Taltz). DISCLOSURE APPENDIX AT THE BACK OF THIS REPORT CONTAINS IMPORTANT DISCLOSURES, ANALYST CERTIFICATIONS, LEGAL ENTITY DISCLOSURE AND THE STATUS OF NON-US ANALYSTS. US Disclosure: Credit Suisse does and seeks to do business with companies covered in its research reports. As a result, investors should be aware that the Firm may have a conflict of interest that could affect the objectivity of this report. Investors should consider this report as only a single factor in making their investment decision. RESEARCH ANALYSTS Vamil Divan, MD (212)-538-5394 [email protected] Barbara Kotei (212)-538-8119 [email protected] European Pharma Team (44)-207-888-0304 creditsuisse.pharmateam@credit- suisse.com Alethia Young (212)-538-0640 [email protected] Eliana Merle (212)-538-0678 [email protected] Grant Hesser (212)-325-2587 [email protected] Kennen MacKay, PhD (212)-538-5241 [email protected] Thomas C. Kauffman (41)-44-333-0583 thomas.c.kauffman@credit- suisse.com Source: IMS Health and CS Estimates & Analysis Weekly TRx of anti-TNF products (See Page 09 for full anti-TNF breakdown) 0 10,000 20,000 30,000 40,000 50,000 60,000 70,000 Combined Remicade, Simponi and Cimzia Enbrel Humira 7,987 28,284 49,422
Transcript of Global Pharmaceuticals and Biotechnology 49,422 IMS Tracker
Jan 03, 2017
Global Pharmaceuticals and Biotechnology
IMS Tracker
For the Week Ended Dec 23, 2016
This week we are highlighting prescription trends in the anti-TNF class, which
remains the highest value category of products ex-oncology. In 2016 overall US
IMS prescription growth appears to have slowed to +3% YoY vs. +7% in 2015,
with 4Q16 broadly flat YoY vs. +5% growth in 4Q15. We understand that there
is significant under-reporting of scripts in this category, suggesting a higher
reliance than perhaps is accurate, on net price increases. This volume under-
reporting may make the expected impact from both biosimilar and new branded
products more difficult to track in 2017:
(1) Biosimilar entry: We expect the anti-TNF market to be negatively impacted by
Pfizer’s Inflectra (infliximab-dyyb), which began shipping it to wholesalers in late
Nov 2016 with a list price 15% discount to the WAC of Remicade, although as
yet we still see no prescriptions reported by IMS. We believe it is unlikely Amgen
will launch its approved biosimilar Humira (adalimumab) in 2017 until the litigations
with AbbVie are settled.
(2) Branded competition: In rheumatoid arthritis we expect to see new entries
from Lilly’s baricitinib (oral JAK 1/JAK 2 inhibitor), with PDUFA in Jan 17, and
Sanofi’s sarliumab (IL -6) expected PDUFA in Mar 17. Additionally in psoriasis,
we believe competition will increase from potential entry of Valeant/AZN’s
brodalumab (IL-17) expected PDUFA in Feb 17, and J&J’s guselkumab (IL-23)
with PDUFA expected in 4Q17, and further erosion by the IL-17’s
(Cosentyx/Taltz).
DISCLOSURE APPENDIX AT THE BACK OF THIS REPORT CONTAINS IMPORTANT DISCLOSURES, ANALYST CERTIFICATIONS, LEGAL ENTITY DISCLOSURE AND THE STATUS OF NON-US ANALYSTS. US Disclosure: Credit Suisse does and seeks to do business with companies covered in its research reports. As a result, investors should be aware that the Firm may have a conflict of interest that could affect the objectivity of this report. Investors should consider this report as only a single factor in making their investment decision.
RESEARCH ANALYSTS
Vamil Divan, MD
(212)-538-5394
Barbara Kotei
(212)-538-8119
European Pharma Team
(44)-207-888-0304
creditsuisse.pharmateam@credit-
suisse.com
Alethia Young
(212)-538-0640
Eliana Merle
(212)-538-0678
Grant Hesser
(212)-325-2587
Kennen MacKay, PhD
(212)-538-5241
Thomas C. Kauffman
(41)-44-333-0583
thomas.c.kauffman@credit-
suisse.com
Source: IMS Health and CS Estimates & Analysis
Weekly TRx of anti-TNF products (See Page 09 for full anti-TNF breakdown)
0
10,000
20,000
30,000
40,000
50,000
60,000
70,000
Combined Remicade, Simponi and Cimzia Enbrel Humira
7,987
28,284
49,422
Source: IMS Health and CS Estimates & Analysis
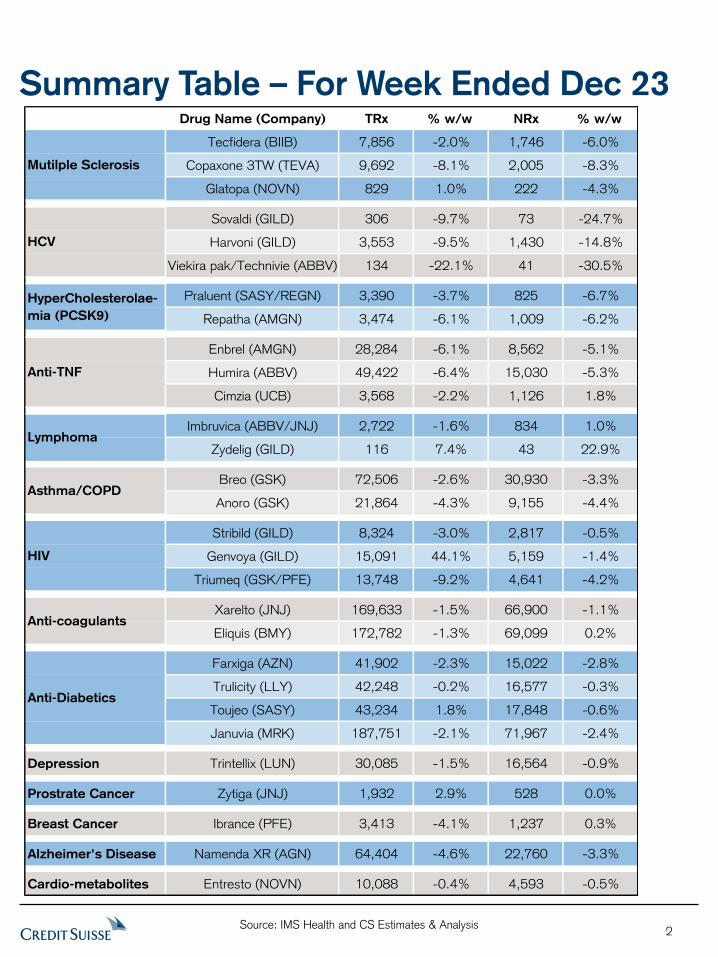
Summary Table – For Week Ended Dec 23
2
Drug Name (Company) TRx % w/w NRx % w/w
Tecfidera (BIIB) 7,856 -2.0% 1,746 -6.0%
Copaxone 3TW (TEVA) 9,692 -8.1% 2,005 -8.3%
Glatopa (NOVN) 829 1.0% 222 -4.3%
Sovaldi (GILD) 306 -9.7% 73 -24.7%
Harvoni (GILD) 3,553 -9.5% 1,430 -14.8%
Viekira pak/Technivie (ABBV) 134 -22.1% 41 -30.5%
Praluent (SASY/REGN) 3,390 -3.7% 825 -6.7%
Repatha (AMGN) 3,474 -6.1% 1,009 -6.2%
Enbrel (AMGN) 28,284 -6.1% 8,562 -5.1%
Humira (ABBV) 49,422 -6.4% 15,030 -5.3%
Cimzia (UCB) 3,568 -2.2% 1,126 1.8%
Imbruvica (ABBV/JNJ) 2,722 -1.6% 834 1.0%
Zydelig (GILD) 116 7.4% 43 22.9%
Breo (GSK) 72,506 -2.6% 30,930 -3.3%
Anoro (GSK) 21,864 -4.3% 9,155 -4.4%
Stribild (GILD) 8,324 -3.0% 2,817 -0.5%
Genvoya (GILD) 15,091 44.1% 5,159 -1.4%
Triumeq (GSK/PFE) 13,748 -9.2% 4,641 -4.2%
Xarelto (JNJ) 169,633 -1.5% 66,900 -1.1%
Eliquis (BMY) 172,782 -1.3% 69,099 0.2%
Farxiga (AZN) 41,902 -2.3% 15,022 -2.8%
Trulicity (LLY) 42,248 -0.2% 16,577 -0.3%
Toujeo (SASY) 43,234 1.8% 17,848 -0.6%
Januvia (MRK) 187,751 -2.1% 71,967 -2.4%
Depression Trintellix (LUN) 30,085 -1.5% 16,564 -0.9%
Prostrate Cancer Zytiga (JNJ) 1,932 2.9% 528 0.0%
Breast Cancer Ibrance (PFE) 3,413 -4.1% 1,237 0.3%
Alzheimer's Disease Namenda XR (AGN) 64,404 -4.6% 22,760 -3.3%
Cardio-metabolites Entresto (NOVN) 10,088 -0.4% 4,593 -0.5%
HIV
Anti-coagulants
Anti-Diabetics
Mutilple Sclerosis
HCV
HyperCholesterolae-
mia (PCSK9)
Anti-TNF
Lymphoma
Asthma/COPD
Source: IMS Health and CS Estimates & Analysis
Table of Contents (Click on Titles to Navigate Through Note)
ADHD (Pg 4)
Alzheimer’s Disease – Namenda (Pg 5)
− Weekly TRx % Shares of Namenda Franchise
− Namenda XR TRx Share of Namenda Franchise
Anti-Coagulants (Pg 6)
− Weekly TRx Shares for Anti-Coagulant Drugs
− Weekly NBRx Shares for Anti-Coagulant Drugs
Asthma/COPD (Pg 7)
− Weekly TRx Ramp for Asthma/COPD Drugs
− Weekly TRx Share for Asthma/COPD Drugs
− Weekly NBRx Share for Asthma/COPD Drugs
Autoimmune Anti-TNFs (Pg 9)
− Weekly TRx of Humira and Enbrel
− Weekly TRx of Cimzia, Remicade and Simponi
− Weekly NBRx of Anti-TNFs
Autoimmune – Psoriasis (Pg 11)
− Weekly TRx of Otezla, Xeljanz and Stelara Since
Apr, 2014
− Weekly TRx Ramp for Cosentyx, Stelara and Taltz
Since Their Respective Launches
Breast Cancer (Pg 12)
− Ibrance Weekly TRx and NRx
− Weekly TRx Ramp for Imbruvica and Ibrance
Cardio-metabolite – Entresto (Pg 13)
Cholesterol – PCSK9 (Pg 14)
Depression (Pg 15)
Diabetes (Pg 16)
− Anti-Diabetics Weekly TRx Share
− Anti-Diabetics Weekly NBRx Share
− NBRx % Shares for DPP-IV,& SGLT2 Drugs
− TRx % Shares for DPP-IV & SGLT2 Drugs
− Weekly Rolling TRx for SGLT-2 Drugs
− Weekly Rolling NBRx for SGLT-2 Drugs
− Weekly TRx for DPP-4 Class
− Weekly TRx Market Share for DPP-4 Drugs
− Weekly TRx Ramp for GLP-1 Drugs
− Weekly TRx Market Share for GLP-1 Drugs
− Weekly NBRx Market Share for GLP-1 Drugs
Diabetes - LA Insulins (Pg 22)
− Weekly NBRx % Shares of LA Insulins
− Weekly TRx % Shares of LA Insulins
− Weekly TRx for Tresiba and Toujeo
Dry Eye Disease (Pg 24)
Gastrointestinal - Constipation (Pg 25)
Gastrointestinal – IBS-D (Pg 26)
HCV (Pg 27)
HIV (Pg 29)
− Weekly TRx Ramp for HIV Drugs
− Weekly NBRx Shares for HIV Drugs
− Weekly Rolling TRx Ramp for HIV Drugs
− Weekly NBRx Shares for HIV Drugs (Company
Split)
Lymphoma (Pg 31)
− Imbruvica Weekly TRx and NRx
− Zydelig Weekly TRx and NRx
− Weekly TRx Ramp for Imbruvica and Zydelig
Multiple Sclerosis (Pg 33)
− Weekly NBRx % Share of Copaxone OD & 3TW
Copaxone 3TW, Glatopa OD
− Weekly TRx Market Share for Copaxone OD,
Copaxone 3TW, and Glatopa
− Weekly Rolling NRx for MS Drugs
− Weekly Rolling TRx for MS Drugs
− Weekly TRx Market Share for MS Drugs
− Weekly NBRx Market Share for MS Drugs
Opioid Dependence (Pg 36)
− Charts for Weekly NBRx (absolute scrips) and TRx
(% Share) of Opioid Dependence Drugs
Prostrate Cancer (Pg 37)
Pulmonary Arterial Hypertension (PAH) (Pg 38)
− Weekly NRx of PAH Drugs
− Weekly TRx of PAH Drugs
− Weekly NBRx of PAH Drugs
− Weekly TRx Market Share of PAH Drugs
Schizophrenia (Pg 40)
3
Source: IMS Health and CS Estimates & Analysis
ADHD
4
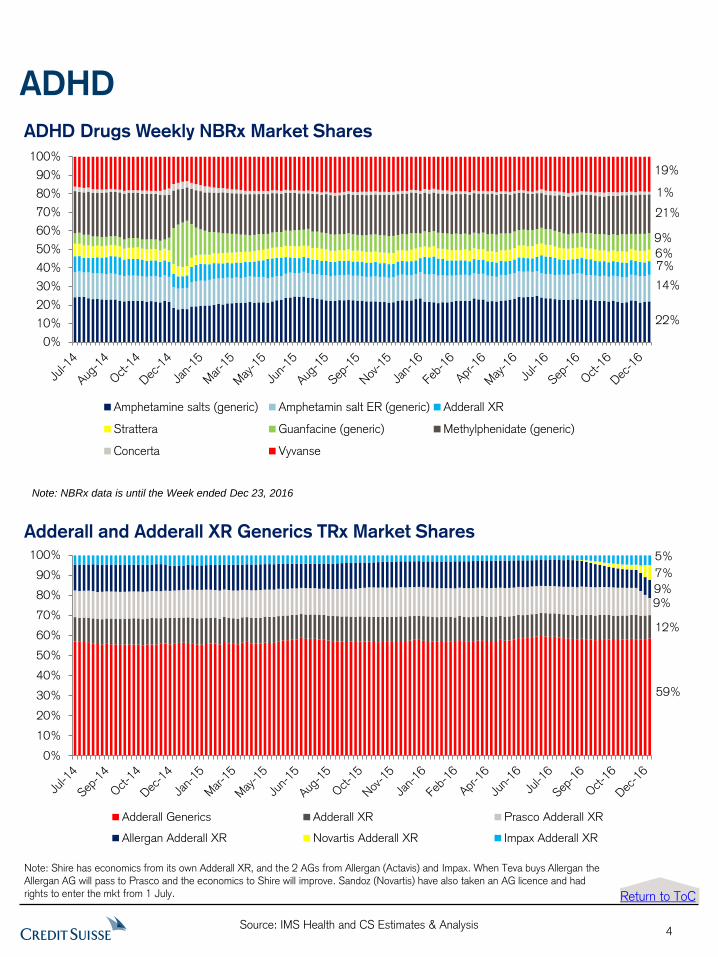
ADHD Drugs Weekly NBRx Market Shares
Adderall and Adderall XR Generics TRx Market Shares
ADHD Drugs Weekly NBRx Market Shares
0%
10%
20%
30%
40%
50%
60%
70%
80%
90%
100%
Amphetamine salts (generic) Amphetamin salt ER (generic) Adderall XR
Strattera Guanfacine (generic) Methylphenidate (generic)
Concerta Vyvanse
21%
9%
22%
14%
7%6%
1%
19%
Note: NBRx data is until the Week ended Dec 23, 2016
Adderal and Adderall XR Generics TRx Market Shares
0%
10%
20%
30%
40%
50%
60%
70%
80%
90%
100%
Adderall Generics Adderall XR Prasco Adderall XR
Allergan Adderall XR Novartis Adderall XR Impax Adderall XR
9%
5%
12%
59%
9%
7%
Note: Shire has economics from its own Adderall XR, and the 2 AGs from Allergan (Actavis) and Impax. When Teva buys Allergan the Allergan AG will pass to Prasco and the economics to Shire will improve. Sandoz (Novartis) have also taken an AG licence and had rights to enter the mkt from 1 July. Return to ToC
Source: IMS Health and CS Estimates & Analysis
Alzheimer’s Disease – Namenda Franchise
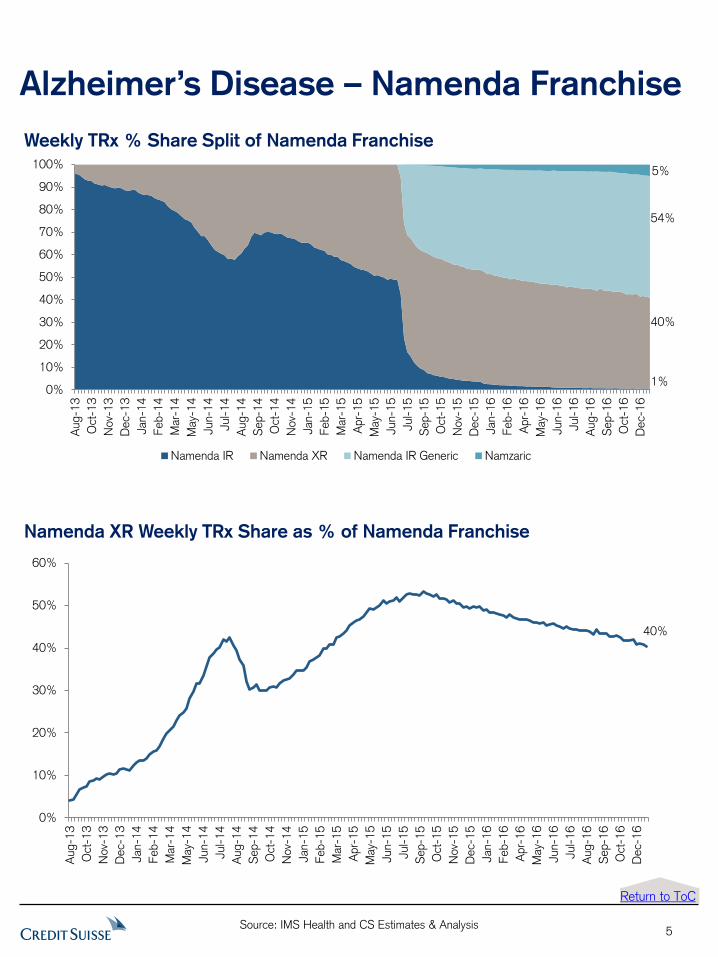
Weekly TRx % Share Split of Namenda Franchise
Namenda XR Weekly TRx Share as % of Namenda Franchise
5
Weekly TRx % Share Split of Namenda Franchise
0%
10%
20%
30%
40%
50%
60%
70%
80%
90%
100%
Aug-1
3
Oct
-13
Nov-
13
Dec-
13
Jan-1
4
Feb-1
4
Mar-
14
May-
14
Jun-1
4
Jul-14
Aug-1
4
Sep-1
4
Oct
-14
Nov-
14
Jan-1
5
Feb-1
5
Mar-
15
Apr-
15
May-
15
Jun-1
5
Jul-15
Sep-1
5
Oct
-15
Nov-
15
Dec-
15
Jan-1
6
Feb-1
6
Apr-
16
May-
16
Jun-1
6
Jul-16
Aug-1
6
Sep-1
6
Oct
-16
Dec-
16
Namenda IR Namenda XR Namenda IR Generic Namzaric
54%
40%
1%
5%
Namenda XR Weekly TRx Share as % of Namenda Franchise
0%
10%
20%
30%
40%
50%
60%
Aug-1
3
Oct
-13
Nov-
13
Dec-
13
Jan-1
4
Feb-1
4
Mar-
14
May-
14
Jun-1
4
Jul-1
4
Aug-1
4
Sep-1
4
Oct
-14
Nov-
14
Jan-1
5
Feb-1
5
Mar-
15
Apr-
15
May-
15
Jun-1
5
Jul-1
5
Sep-1
5
Oct
-15
Nov-
15
Dec-
15
Jan-1
6
Feb-1
6
Apr-
16
May-
16
Jun-1
6
Jul-1
6
Aug-1
6
Sep-1
6
Oct
-16
Dec-
16
40%
Return to ToC
Source: IMS Health and CS Estimates & Analysis
Anti-Coagulants
6
Return to ToC
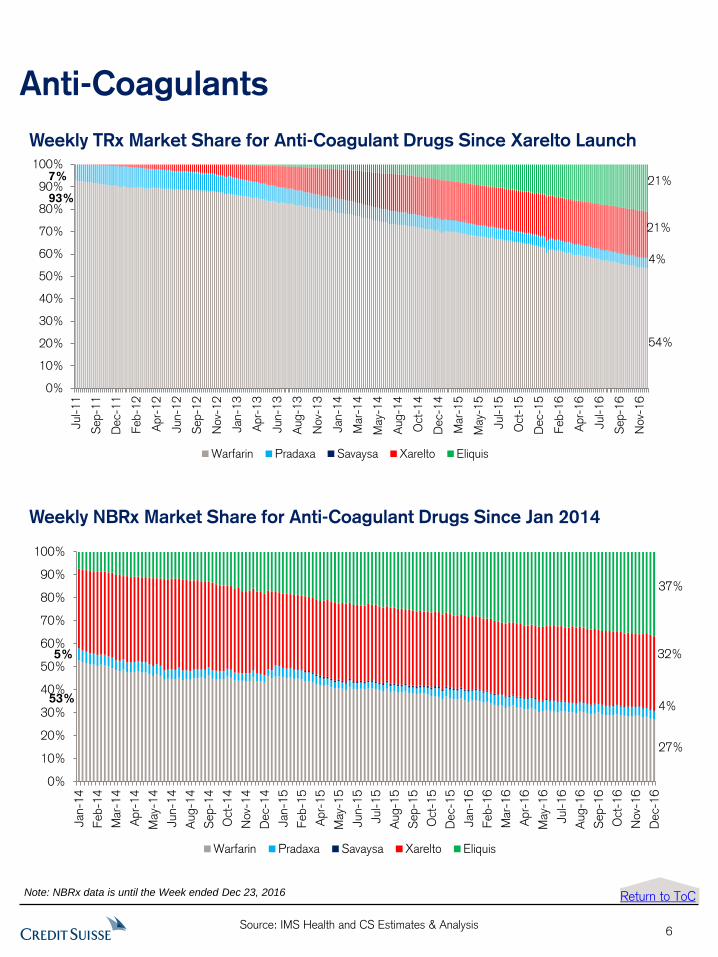
Weekly TRx Market Share for Anti-Coagulant Drugs Since Xarelto Launch Weekly TRx Market Share for Anti-Coagulant Drugs Since Xarelto Launch
0%
10%
20%
30%
40%
50%
60%
70%
80%
90%
100%
Jul-11
Sep-1
1
Dec-
11
Feb-1
2
Apr-
12
Jun-1
2
Sep-1
2
Nov-
12
Jan-1
3
Apr-
13
Jun-1
3
Aug-1
3
Nov-
13
Jan-1
4
Mar-
14
May-
14
Aug-1
4
Oct
-14
Dec-
14
Mar-
15
May-
15
Jul-15
Oct
-15
Dec-
15
Feb-1
6
Apr-
16
Jul-16
Sep-1
6
Nov-
16
Warfarin Pradaxa Savaysa Xarelto Eliquis
54%
4%
93%
21%
21%7%
Weekly NBRx Market Share for Anti-Coagulant Drugs Since Jan 2014
Weekly NBRx Market Share for Anti-Coagulant Drugs Since Jan, 2014
0%
10%
20%
30%
40%
50%
60%
70%
80%
90%
100%
Jan-1
4
Feb-1
4
Mar-
14
Apr-
14
May-
14
Jun-1
4
Aug-1
4
Sep-1
4
Oct
-14
Nov-
14
Dec-
14
Jan-1
5
Feb-1
5
Apr-
15
May-
15
Jun-1
5
Jul-15
Aug-1
5
Sep-1
5
Oct
-15
Dec-
15
Jan-1
6
Feb-1
6
Mar-
16
Apr-
16
May-
16
Jul-16
Aug-1
6
Sep-1
6
Oct
-16
Nov-
16
Dec-
16
Warfarin Pradaxa Savaysa Xarelto Eliquis
27%
4%
32%
37%
5%
53%
Note: NBRx data is until the Week ended Dec 23, 2016
Source: IMS Health and CS Estimates & Analysis
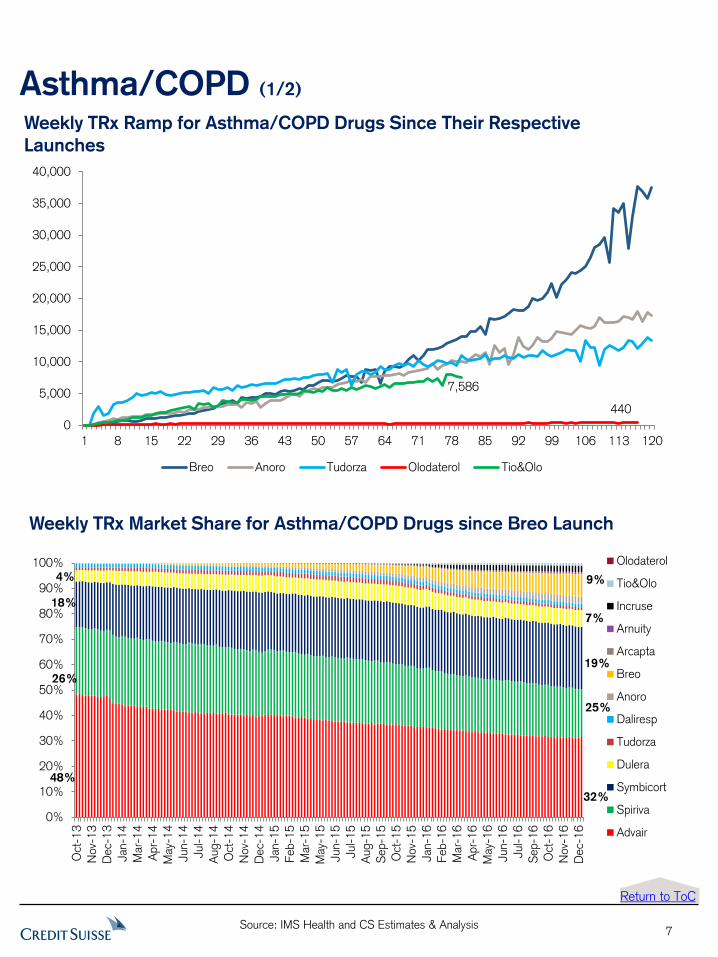
Asthma/COPD (1/2)
Weekly TRx Ramp for Asthma/COPD Drugs Since Their Respective
Launches
Weekly TRx Market Share for Asthma/COPD Drugs since Breo Launch
7
Weekly TRx Ramp for COPD Drugs Since Their Respective Launches
0
5,000
10,000
15,000
20,000
25,000
30,000
35,000
40,000
1 8 15 22 29 36 43 50 57 64 71 78 85 92 99 106 113 120
Breo Anoro Tudorza Olodaterol Tio&Olo
440
7,586
Weekly TRx Market Share for Asthma and COPD Drugs since Breo Launch
0%
10%
20%
30%
40%
50%
60%
70%
80%
90%
100%
Oct
-13
Nov-
13
Dec-
13
Jan-1
4
Mar-
14
Apr-
14
May-
14
Jun-1
4
Jul-1
4
Aug-1
4
Oct
-14
Nov-
14
Dec-
14
Jan-1
5
Feb-1
5
Mar-
15
May-
15
Jun-1
5
Jul-1
5
Aug-1
5
Sep-1
5
Oct
-15
Nov-
15
Jan-1
6
Feb-1
6
Mar-
16
Apr-
16
May-
16
Jun-1
6
Jul-1
6
Sep-1
6
Oct
-16
Nov-
16
Dec-
16
Olodaterol
Tio&Olo
Incruse
Arnuity
Arcapta
Breo
Anoro
Daliresp
Tudorza
Dulera
Symbicort
Spiriva
Advair
19%
25%
32%
9%
7%
4%
48%
26%
18%
Return to ToC
Source: IMS Health and CS Estimates & Analysis
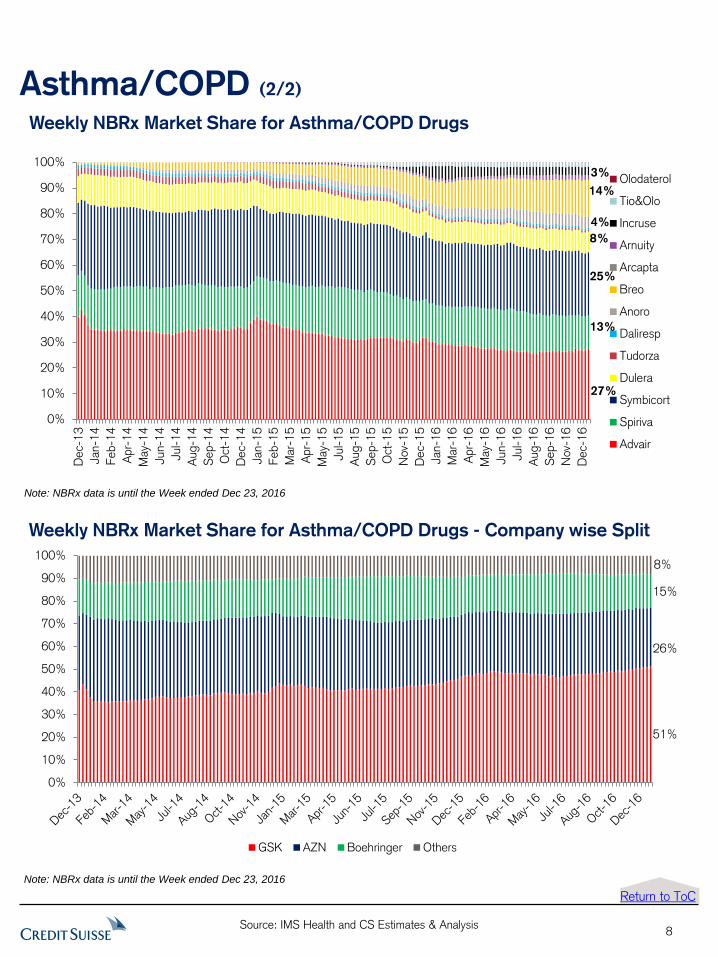
Asthma/COPD (2/2)
8
Weekly NBRx Market Share for Asthma/COPD Drugs
Weekly NBRx Market Share for Asthma/COPD Drugs
3%
0%
10%
20%
30%
40%
50%
60%
70%
80%
90%
100%
Dec-
13
Jan-1
4
Feb-1
4
Apr-
14
May-
14
Jun-1
4
Jul-1
4
Aug-1
4
Sep-1
4
Oct
-14
Dec-
14
Jan-1
5
Feb-1
5
Mar-
15
Apr-
15
May-
15
Jul-15
Aug-1
5
Sep-1
5
Oct
-15
Nov-
15
Dec-
15
Jan-1
6
Mar-
16
Apr-
16
May-
16
Jun-1
6
Jul-1
6
Aug-1
6
Sep-1
6
Nov-
16
Dec-
16
Olodaterol
Tio&Olo
Incruse
Arnuity
Arcapta
Breo
Anoro
Daliresp
Tudorza
Dulera
Symbicort
Spiriva
Advair
14%
27%
25%
8%
13%
4%
3%
Return to ToC
Note: NBRx data is until the Week ended Dec 23, 2016
Weekly NBRx Market Share for Asthma/COPD Drugs - Company wise Split Weekly NBRx Market Share for Asthma/COPD Drugs - Company wise Split
0%
10%
20%
30%
40%
50%
60%
70%
80%
90%
100%
GSK AZN Boehringer Others
51%
15%
8%
26%
Note: NBRx data is until the Week ended Dec 23, 2016

Source: IMS Health and CS Estimates & Analysis
Autoimmune Anti-TNFs (1/2)
Weekly TRx of Humira and Enbrel Since Jan 2013
Weekly TRx for Cimzia, Remicade and Simponi Since Jan 2013
9
Weekly TRx of Humira and Enbrel Since Jan, 2013
0
10,000
20,000
30,000
40,000
50,000
60,000
70,000
Enbrel Humira
49,422
28,284
Weekly TRx for Cimzia, Remicade and Simponi Since Jan, 2013
0
500
1,000
1,500
2,000
2,500
3,000
3,500
4,000
4,500
5,000
Simponi Remicade Cimzia
2,797
1,622
3,568
Return to ToC
Source: IMS Health and CS Estimates & Analysis
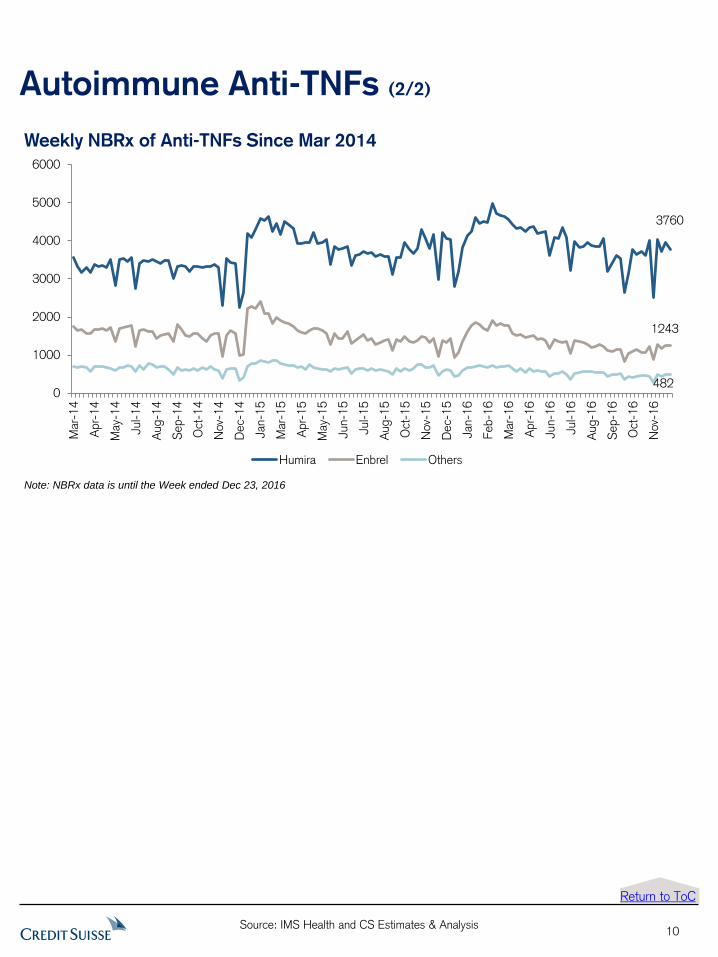
Autoimmune Anti-TNFs (2/2)
Weekly NBRx of Anti-TNFs Since Mar 2014
10
Weekly NBRx of Anti-TNFs Since Mar, 2014
0
1000
2000
3000
4000
5000
6000
Mar-
14
Apr-
14
May-
14
Jul-1
4
Aug-1
4
Sep-1
4
Oct
-14
Nov-
14
Dec-
14
Jan-1
5
Mar-
15
Apr-
15
May-
15
Jun-1
5
Jul-1
5
Aug-1
5
Oct
-15
Nov-
15
Dec-
15
Jan-1
6
Feb-1
6
Mar-
16
Apr-
16
Jun-1
6
Jul-1
6
Aug-1
6
Sep-1
6
Oct
-16
Nov-
16
Humira Enbrel Others
3760
1243
482
Return to ToC
Note: NBRx data is until the Week ended Dec 23, 2016
Source: IMS Health and CS Estimates & Analysis
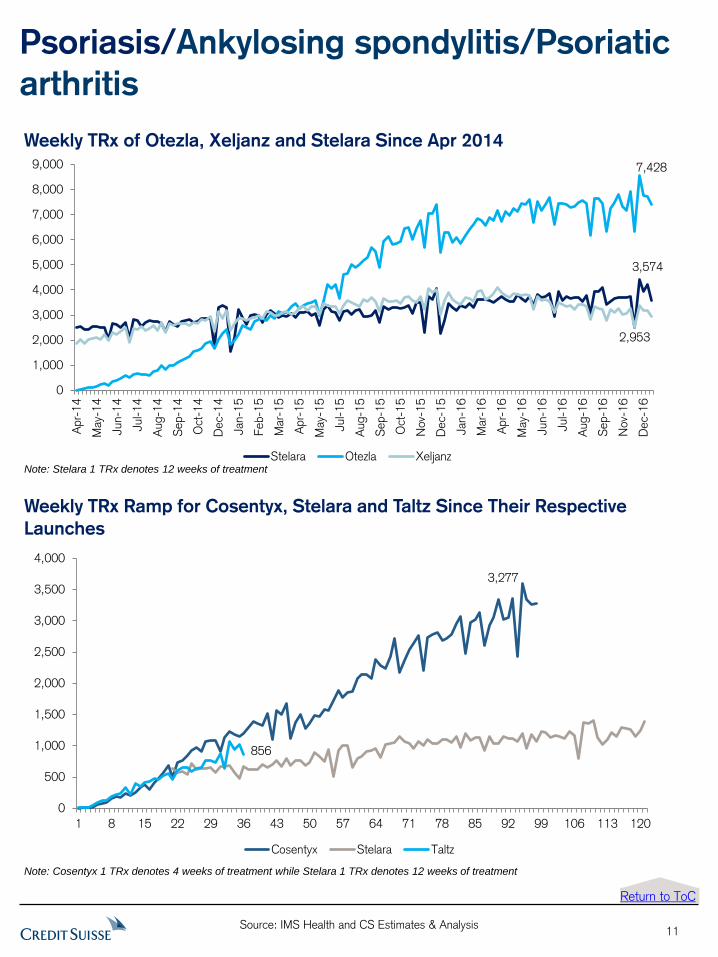
Psoriasis/Ankylosing spondylitis/Psoriatic
arthritis
Weekly TRx of Otezla, Xeljanz and Stelara Since Apr 2014
11
Weekly TRx of Otezla, Xeljanz and Stelara Since Apr, 2014
0
1,000
2,000
3,000
4,000
5,000
6,000
7,000
8,000
9,000
Apr-
14
May-
14
Jun-1
4
Jul-1
4
Aug-1
4
Sep-1
4
Oct
-14
Dec-
14
Jan-1
5
Feb-1
5
Mar-
15
Apr-
15
May-
15
Jul-1
5
Aug-1
5
Sep-1
5
Oct
-15
Nov-
15
Dec-
15
Jan-1
6
Mar-
16
Apr-
16
May-
16
Jun-1
6
Jul-1
6
Aug-1
6
Sep-1
6
Nov-
16
Dec-
16
Stelara Otezla Xeljanz
7,428
3,574
2,953
Return to ToC
Note: Stelara 1 TRx denotes 12 weeks of treatment
Weekly TRx Ramp for Cosentyx, Stelara and Taltz Since Their Respective
Launches
Weekly TRx Ramp for Cosentyx, Stelara and Taltz Since Their Respective Launches
0
500
1,000
1,500
2,000
2,500
3,000
3,500
4,000
1 8 15 22 29 36 43 50 57 64 71 78 85 92 99 106 113 120
Cosentyx Stelara Taltz
3,277
856
Note: Cosentyx 1 TRx denotes 4 weeks of treatment while Stelara 1 TRx denotes 12 weeks of treatment
Source: IMS Health and CS Estimates & Analysis
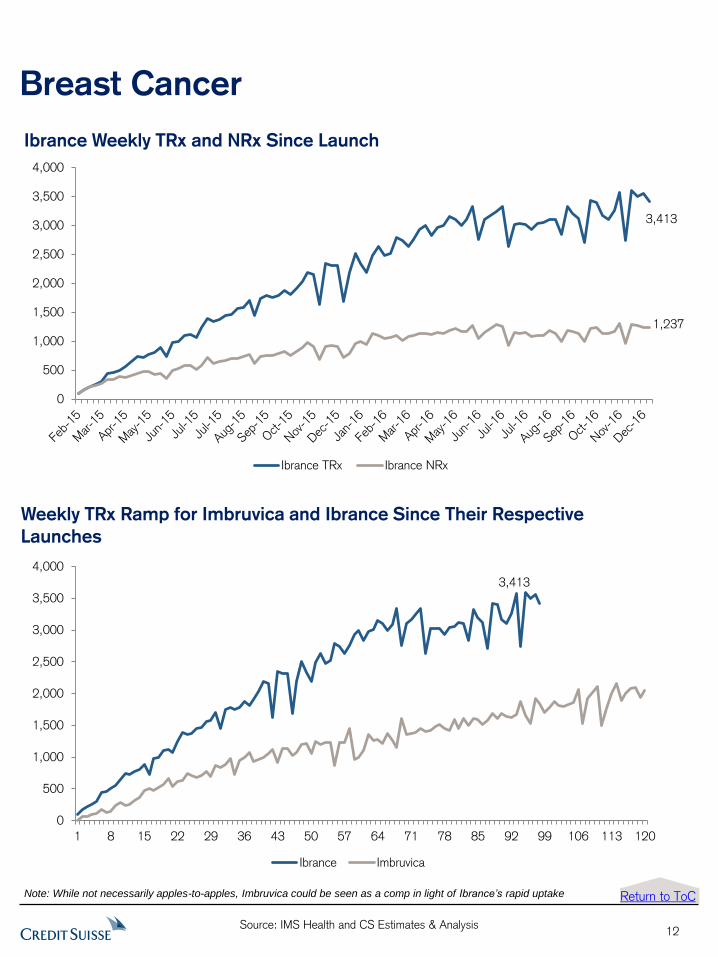
Breast Cancer
Ibrance Weekly TRx and NRx Since Launch
Weekly TRx Ramp for Imbruvica and Ibrance Since Their Respective
Launches
12
Note: While not necessarily apples-to-apples, Imbruvica could be seen as a comp in light of Ibrance’s rapid uptake
Ibrance Weekly TRx and NRx Since Launch
0
500
1,000
1,500
2,000
2,500
3,000
3,500
4,000
Ibrance TRx Ibrance NRx
1,237
3,413
2,050
Weekly TRx Ramp for Imbruvica and Ibrance Since Their Respective Launches
0
500
1,000
1,500
2,000
2,500
3,000
3,500
4,000
1 8 15 22 29 36 43 50 57 64 71 78 85 92 99 106 113 120
Ibrance Imbruvica
3,413
Return to ToC
Source: IMS Health and CS Estimates & Analysis
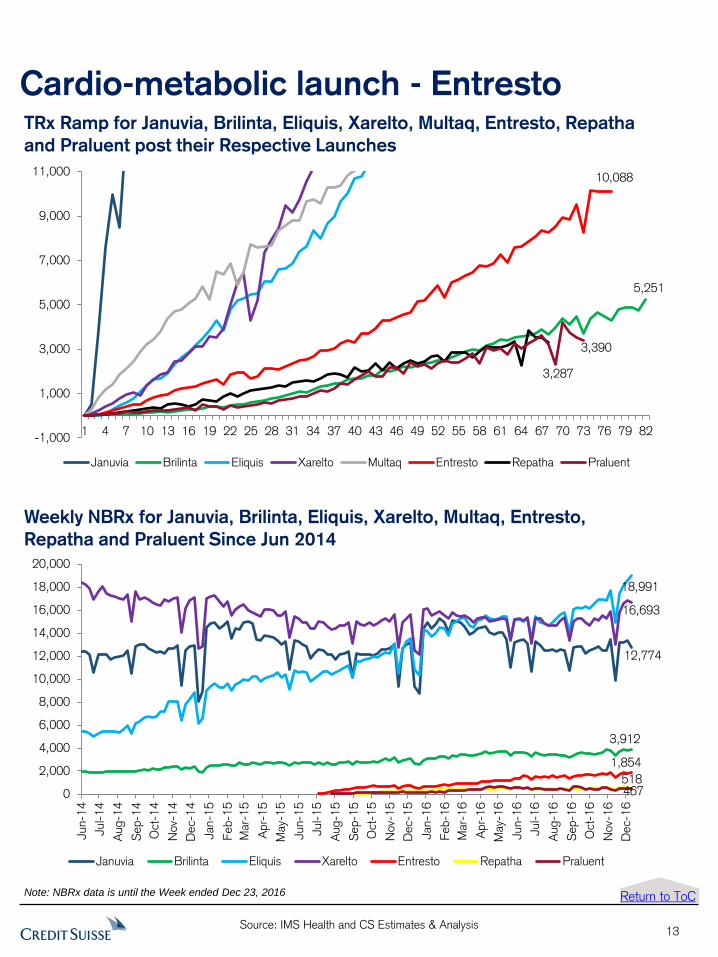
Cardio-metabolic launch - Entresto TRx Ramp for Januvia, Brilinta, Eliquis, Xarelto, Multaq, Entresto, Repatha
and Praluent post their Respective Launches
13
TRx Ramp for Januvia, Brilinta, Eliquis, Xarelto, Multaq, Entresto post their Respective Launches
-1,000
1,000
3,000
5,000
7,000
9,000
11,000
1 4 7 10 13 16 19 22 25 28 31 34 37 40 43 46 49 52 55 58 61 64 67 70 73 76 79 82
Januvia Brilinta Eliquis Xarelto Multaq Entresto Repatha Praluent
10,088
3,287
3,390
5,251
Weekly NBRx for Januvia, Brilinta, Eliquis, Xarelto, Multaq, Entresto,
Repatha and Praluent Since Jun 2014
Return to ToC
Weekly NBRx for Januvia, Brilinta, Eliquis, Xarelto, Multaq, Entresto Since Jun, 2014
0
2,000
4,000
6,000
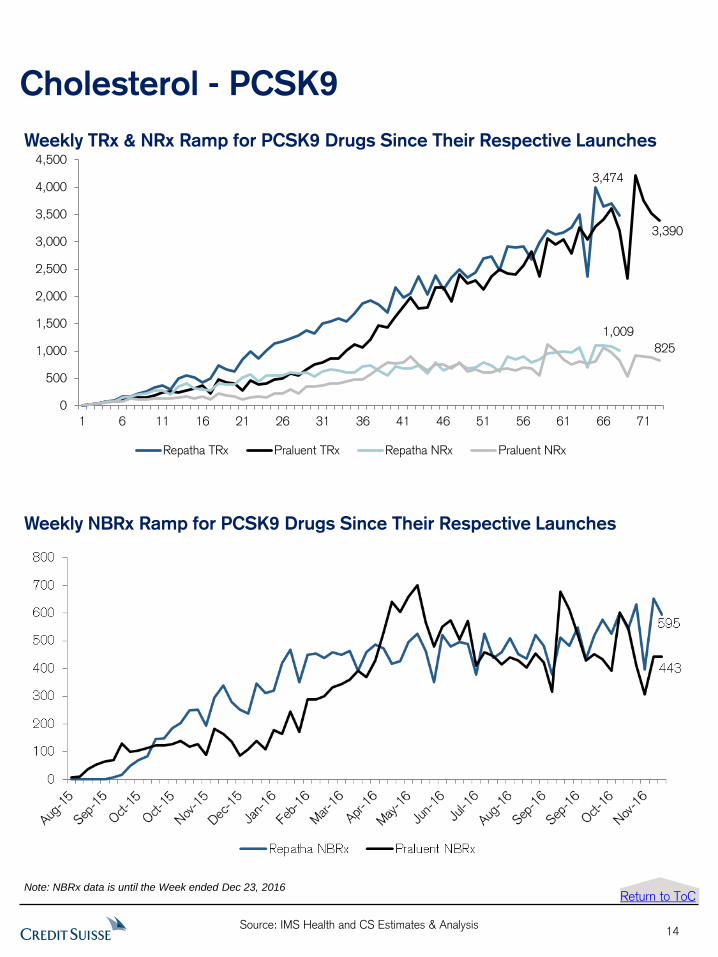
8,000
10,000
12,000
14,000
16,000
18,000
20,000
Jun-1
4
Jul-1
4
Aug-1
4
Sep-1
4
Oct
-14
Nov-
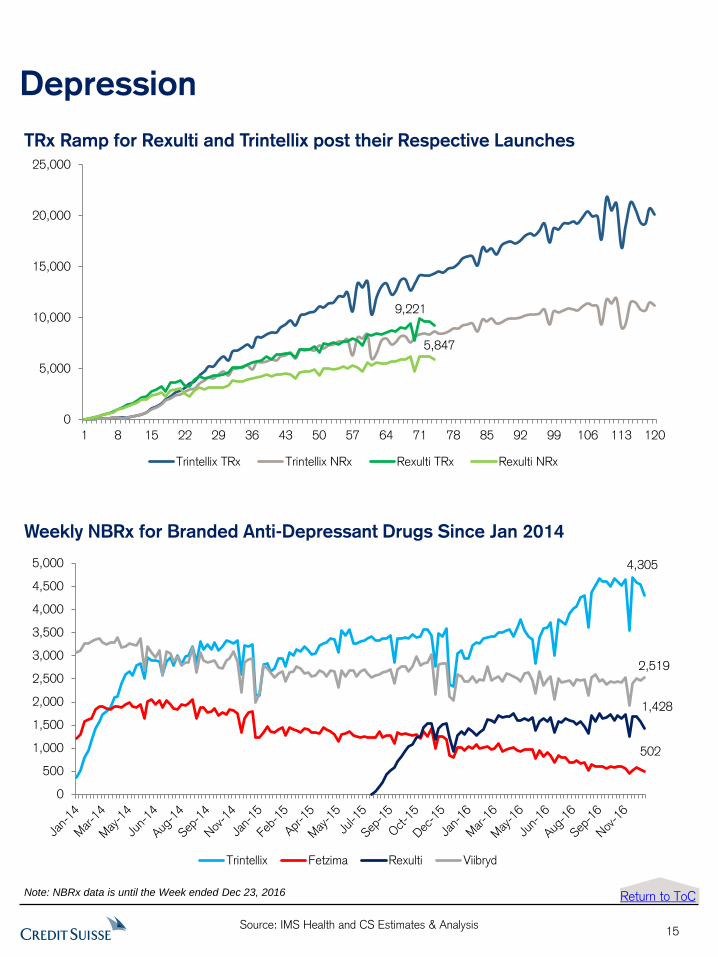
14
Dec-
14
Jan-1
5
Feb-1
5
Mar-
15
Apr-
15
May-
15
Jun-1
5
Jul-1
5
Aug-1
5
Sep-1
5
Oct
-15
Nov-
15
Dec-
15
Jan-1
6
Feb-1
6
Mar-
16
Apr-
16
May-
16
Jun-1
6
Jul-1
6
Aug-1
6
Sep-1
6
Oct
-16
Nov-
16
Dec-
16
Januvia Brilinta Eliquis Xarelto Entresto Repatha Praluent
12,774
3,912
18,991
16,693
518
1,854
467
Note: NBRx data is until the Week ended Dec 23, 2016
Source: IMS Health and CS Estimates & Analysis
Cholesterol - PCSK9
14
Weekly TRx & NRx Ramp for PCSK9 Drugs Since Their Respective Launches
Return to ToC
Weekly TRx & NRx Ramp for PCSK9 Drugs Since Their Respective Launches
0
500
1,000
1,500
2,000
2,500
3,000
3,500
4,000
4,500
1 6 11 16 21 26 31 36 41 46 51 56 61 66 71
Repatha TRx Praluent TRx Repatha NRx Praluent NRx
3,474
3,390
1,009
825
Weekly NBRx Ramp for PCSK9 Drugs Since Their Respective Launches
Note: NBRx data is until the Week ended Dec 23, 2016
Source: IMS Health and CS Estimates & Analysis
Depression
TRx Ramp for Rexulti and Trintellix post their Respective Launches
15
Weekly NBRx for Branded Anti-Depressant Drugs Since Jan 2014
Weekly NBRx for Branded Anti-Depressant Drugs Since Jan, 2014
0
500
1,000
1,500
2,000
2,500
3,000
3,500
4,000
4,500
5,000
Trintellix Fetzima Rexulti Viibryd
4,305
502
1,428
2,519
Trintellix Weekly TRx and NRx
0
5,000
10,000
15,000
20,000
25,000
1 8 15 22 29 36 43 50 57 64 71 78 85 92 99 106 113 120
Trintellix TRx Trintellix NRx Rexulti TRx Rexulti NRx
9,221
5,847
Return to ToC Note: NBRx data is until the Week ended Dec 23, 2016
Source: IMS Health and CS Estimates & Analysis
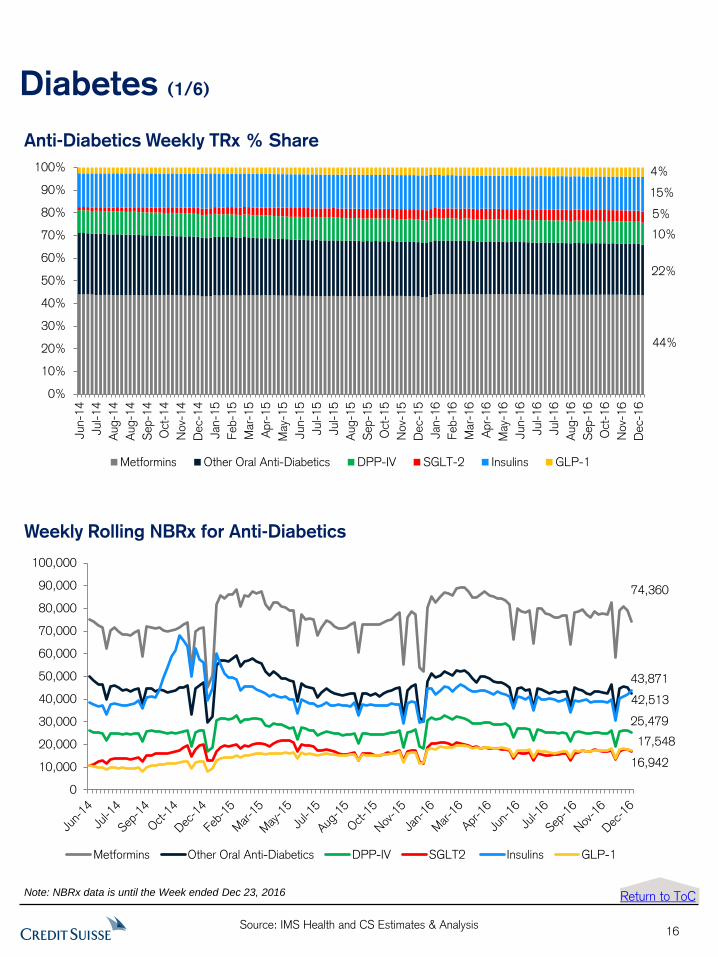
Diabetes (1/6)
Anti-Diabetics Weekly TRx % Share
Weekly Rolling NBRx for Anti-Diabetics
16
Anti-Diabetics Weekly TRx % Share
0%
10%
20%
30%
40%
50%
60%
70%
80%
90%
100%
Jun-1
4
Jul-1
4
Aug-1
4
Aug-1
4
Sep-1
4
Oct
-14
Nov-
14
Dec-
14
Jan-1
5
Feb-1
5
Mar-
15
Apr-
15
May-
15
Jun-1
5
Jul-1
5
Jul-1
5
Aug-1
5
Sep-1
5
Oct
-15
Nov-
15
Dec-
15
Jan-1
6
Feb-1
6
Mar-
16
Apr-
16
May-
16
Jun-1
6
Jul-1
6
Jul-1
6
Aug-1
6
Sep-1
6
Oct
-16
Nov-
16
Dec-
16
Metformins Other Oral Anti-Diabetics DPP-IV SGLT-2 Insulins GLP-1
4%
5%
10%
15%
44%
22%
Return to ToC
Weekly Rolling NBRx for Anti-Diabetics
0
10,000
20,000
30,000
40,000
50,000
60,000
70,000
80,000
90,000
100,000
Metformins Other Oral Anti-Diabetics DPP-IV SGLT2 Insulins GLP-1
25,479
16,942
17,548
74,360
43,871
42,513
Note: NBRx data is until the Week ended Dec 23, 2016
Source: IMS Health and CS Estimates & Analysis
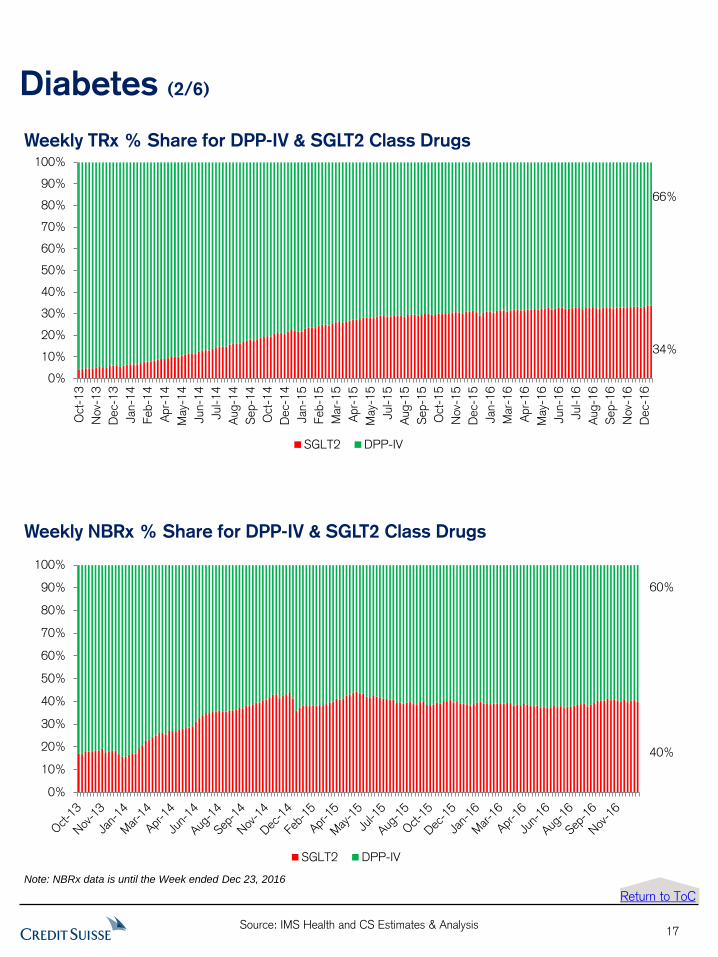
Diabetes (2/6)
Weekly TRx % Share for DPP-IV & SGLT2 Class Drugs
Weekly NBRx % Share for DPP-IV & SGLT2 Class Drugs
17
Weekly NBRx % Share for DPP-IV, SGLT2, GLP-1 Class Drugs
0%
10%
20%
30%
40%
50%
60%
70%
80%
90%
100%
SGLT2 DPP-IV
60%
40%
Weekly TRx % Share for DPP-IV, SGLT2, GLP-1 Class Drugs
0%
10%
20%
30%
40%
50%
60%
70%
80%
90%
100%
Oct
-13
Nov-
13
Dec-
13
Jan-1
4
Feb-1
4
Apr-
14
May-
14
Jun-1
4
Jul-14
Aug-1
4
Sep-1
4
Oct
-14
Dec-
14
Jan-1
5
Feb-1
5
Mar-
15
Apr-
15
May-
15
Jul-15
Aug-1
5
Sep-1
5
Oct
-15
Nov-
15
Dec-
15
Jan-1
6
Mar-
16
Apr-
16
May-
16
Jun-1
6
Jul-16
Aug-1
6
Sep-1
6
Nov-
16
Dec-
16
SGLT2 DPP-IV
66%
34%
Return to ToC
Note: NBRx data is until the Week ended Dec 23, 2016
Source: IMS Health and CS Estimates & Analysis
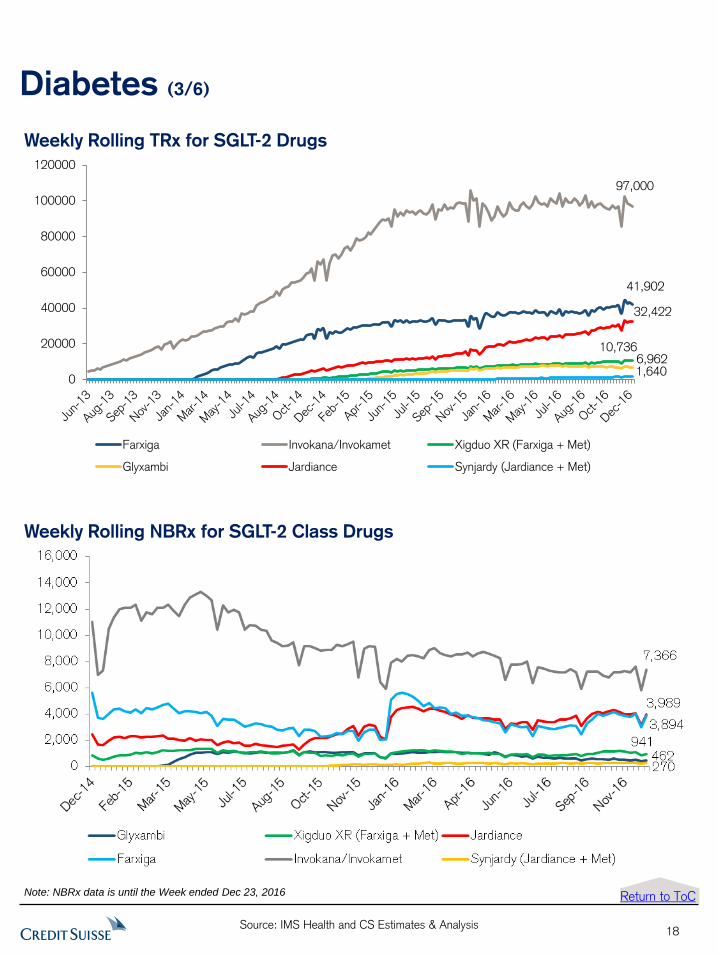
Diabetes (3/6)
Weekly Rolling NBRx for SGLT-2 Class Drugs
18
Weekly Rolling TRx for SGLT-2 Drugs
Return to ToC
Weekly Rolling TRx for SGLT-2 Drugs for Last Three Years
0
20000
40000
60000
80000
100000
120000
Farxiga Invokana/Invokamet Xigduo XR (Farxiga + Met)
Glyxambi Jardiance Synjardy (Jardiance + Met)
97,000
41,902
6,96210,736
32,422
1,640
Note: NBRx data is until the Week ended Dec 23, 2016
Source: IMS Health and CS Estimates & Analysis
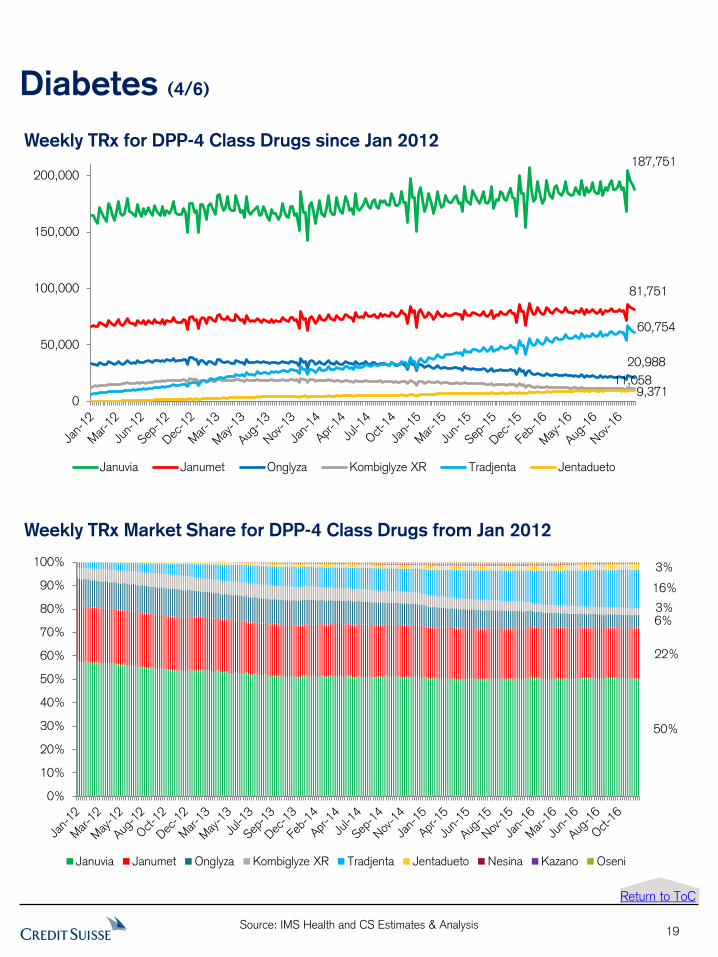
Diabetes (4/6)
Weekly TRx for DPP-4 Class Drugs since Jan 2012
Weekly TRx Market Share for DPP-4 Class Drugs from Jan 2012
19
Weekly TRx Market Share for DPP-4 Class Drugs from Jan, 2012
0%
10%
20%
30%
40%
50%
60%
70%
80%
90%
100%
Januvia Janumet Onglyza Kombiglyze XR Tradjenta Jentadueto Nesina Kazano Oseni
50%
3%
3%
22%
6%
16%
Return to ToC
TRx for DPP-4 Class drugs: Januvia, Janumet, Onglyza, Kombiglyze XR and Tradjenta since 2012
0
50,000
100,000
150,000
200,000
Januvia Janumet Onglyza Kombiglyze XR Tradjenta Jentadueto
187,751
81,751
20,988
11,058
60,754
9,371
Source: IMS Health and CS Estimates & Analysis
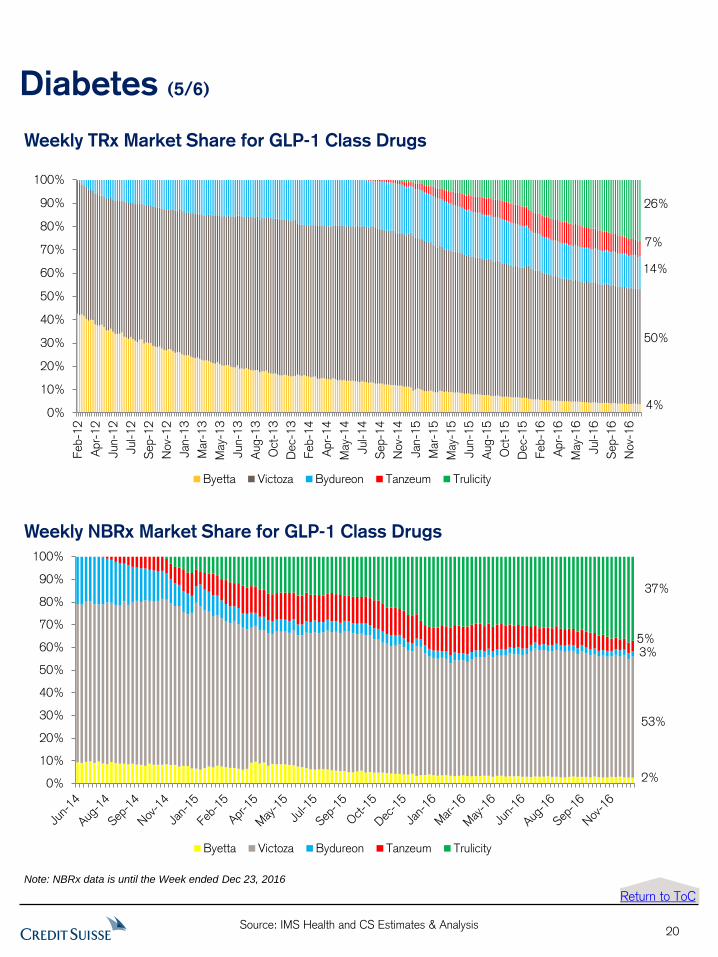
Diabetes (5/6)
Weekly TRx Market Share for GLP-1 Class Drugs
Weekly NBRx Market Share for GLP-1 Class Drugs
20
Weekly TRx Market Share for GLP-1 Class Drugs since Bydureon Launch
0%
10%
20%
30%
40%
50%
60%
70%
80%
90%
100%
Feb-1
2
Apr-
12
Jun-1
2
Jul-1
2
Sep-1
2
Nov-
12
Jan-1
3
Mar-
13
May-
13
Jun-1
3
Aug-1
3
Oct
-13
Dec-
13
Feb-1
4
Apr-
14
May-
14
Jul-1
4
Sep-1
4
Nov-
14
Jan-1
5
Mar-
15
May-
15
Jun-1
5
Aug-1
5
Oct
-15
Dec-
15
Feb-1
6
Apr-
16
May-
16
Jul-1
6
Sep-1
6
Nov-
16
Byetta Victoza Bydureon Tanzeum Trulicity
26%
7%
50%
14%
4%
Return to ToC
Weekly NBRx Market Share for GLP-1 Class Drugs Since June, 2014
0%
10%
20%
30%
40%
50%
60%
70%
80%
90%
100%
Byetta Victoza Bydureon Tanzeum Trulicity
5%
37%
3%
53%
2%
Note: NBRx data is until the Week ended Dec 23, 2016
Source: IMS Health and CS Estimates & Analysis
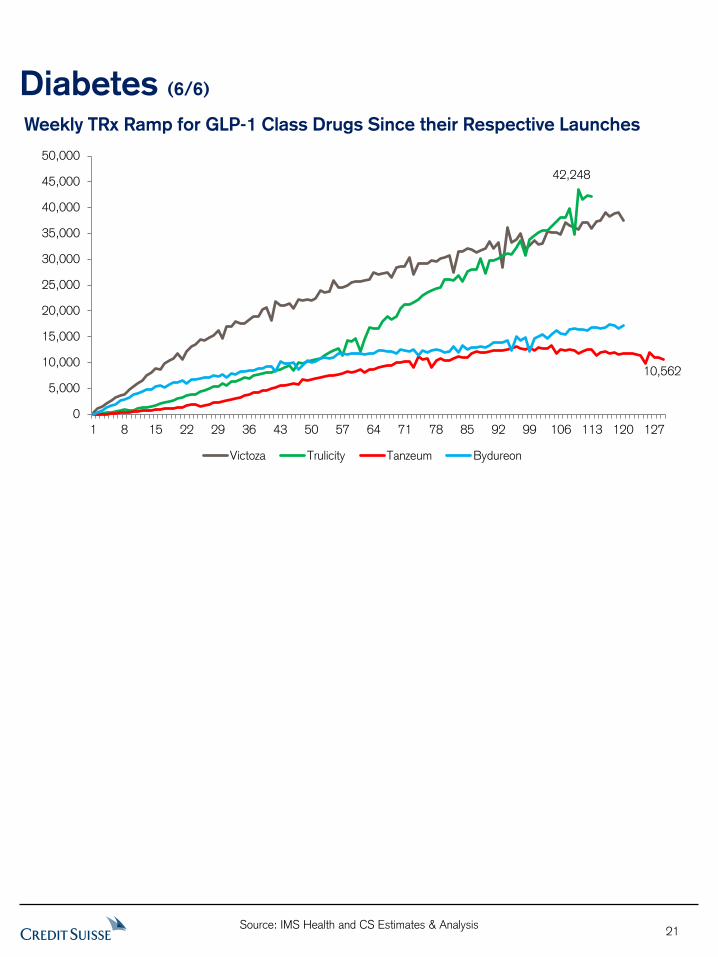
Diabetes (6/6)
21
Weekly TRx Ramp for GLP-1 Class Drugs Since their Respective Launches
Weekly TRx Ramp for GLP-1 Class Drugs Since their Respective Launches
0
5,000
10,000
15,000
20,000
25,000
30,000
35,000
40,000
45,000
50,000
1 8 15 22 29 36 43 50 57 64 71 78 85 92 99 106 113 120 127
Victoza Trulicity Tanzeum Bydureon
42,248
10,562
Source: IMS Health and CS Estimates & Analysis
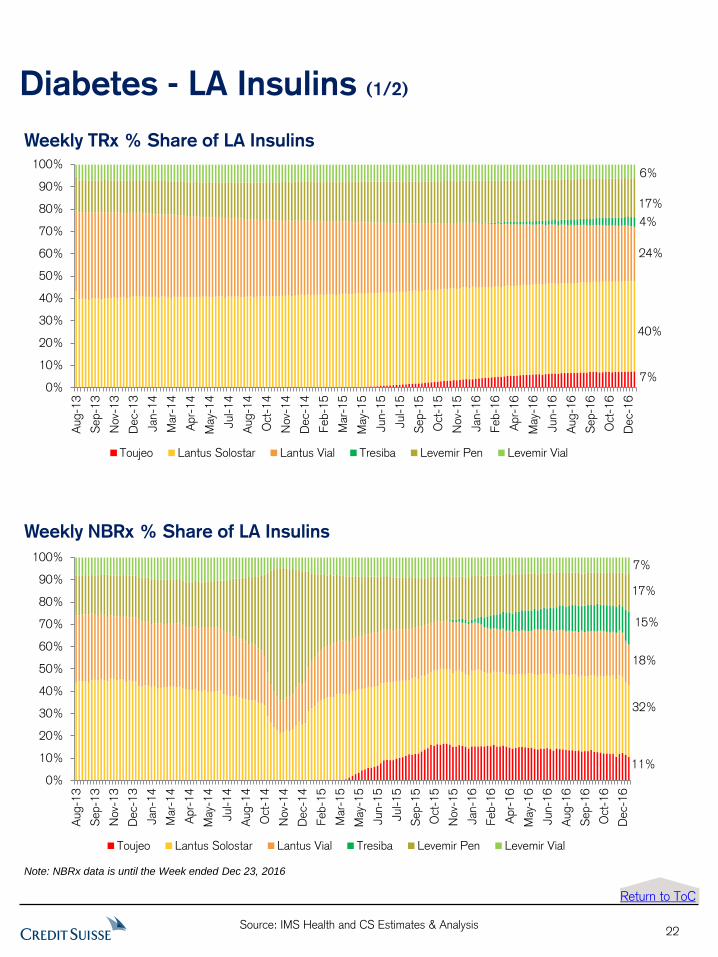
Diabetes - LA Insulins (1/2)
Weekly TRx % Share of LA Insulins
Weekly NBRx % Share of LA Insulins
22
Weekly NBRx % Share of LA Insulins
0%
10%
20%
30%
40%
50%
60%
70%
80%
90%
100%
Aug-1
3
Sep-1
3
Nov-
13
Dec-
13
Jan-1
4
Mar-
14
Apr-
14
May-
14
Jul-14
Aug-1
4
Oct
-14
Nov-
14
Dec-
14
Feb-1
5
Mar-
15
May-
15
Jun-1
5
Jul-15
Sep-1
5
Oct
-15
Nov-
15
Jan-1
6
Feb-1
6
Apr-
16
May-
16
Jun-1
6
Aug-1
6
Sep-1
6
Oct
-16
Dec-
16
Toujeo Lantus Solostar Lantus Vial Tresiba Levemir Pen Levemir Vial
7%
18%
11%
32%
15%
17%
Weekly TRx % Share of LA Insulins
0%
10%
20%
30%
40%
50%
60%
70%
80%
90%
100%
Aug-1
3
Sep-1
3
Nov-
13
Dec-
13
Jan-1
4
Mar-
14
Apr-
14
May-
14
Jul-14
Aug-1
4
Oct
-14
Nov-
14
Dec-
14
Feb-1
5
Mar-
15
May-
15
Jun-1
5
Jul-15
Sep-1
5
Oct
-15
Nov-
15
Jan-1
6
Feb-1
6
Apr-
16
May-
16
Jun-1
6
Aug-1
6
Sep-1
6
Oct
-16
Dec-
16
Toujeo Lantus Solostar Lantus Vial Tresiba Levemir Pen Levemir Vial
6%
24%
7%
40%
4%
17%
Return to ToC
Note: NBRx data is until the Week ended Dec 23, 2016
Source: IMS Health and CS Estimates & Analysis
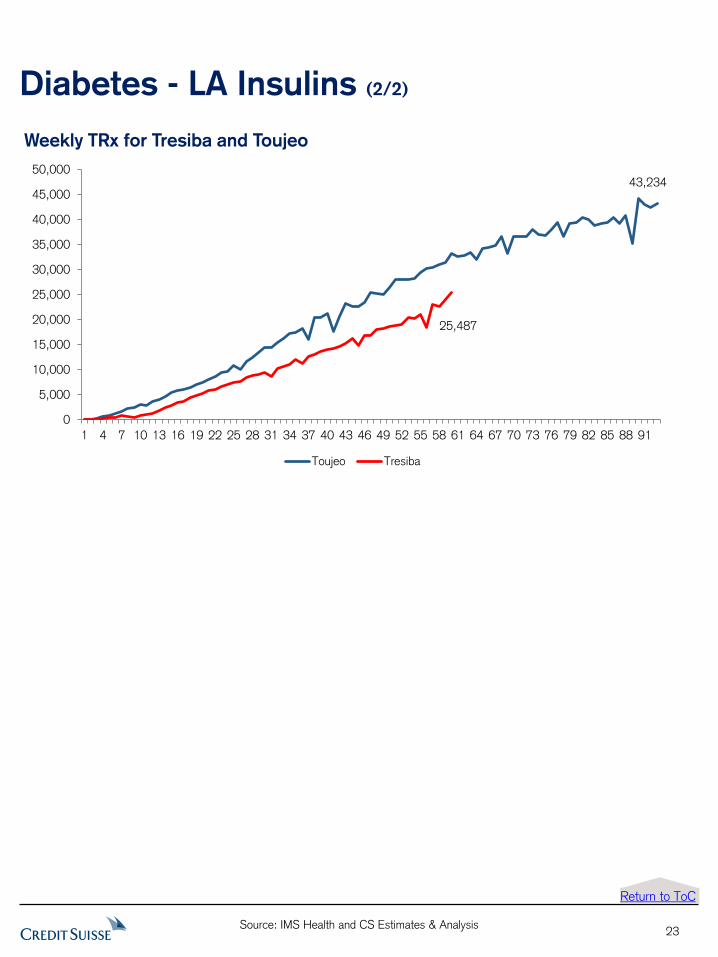
Diabetes - LA Insulins (2/2)
Weekly TRx for Tresiba and Toujeo
23
Weekly TRx for Tresiba and Toujeo
0
5,000
10,000
15,000
20,000
25,000
30,000
35,000
40,000
45,000
50,000
1 4 7 10 13 16 19 22 25 28 31 34 37 40 43 46 49 52 55 58 61 64 67 70 73 76 79 82 85 88 91
Toujeo Tresiba
43,234
25,487
Return to ToC
Source: IMS Health and CS Estimates & Analysis
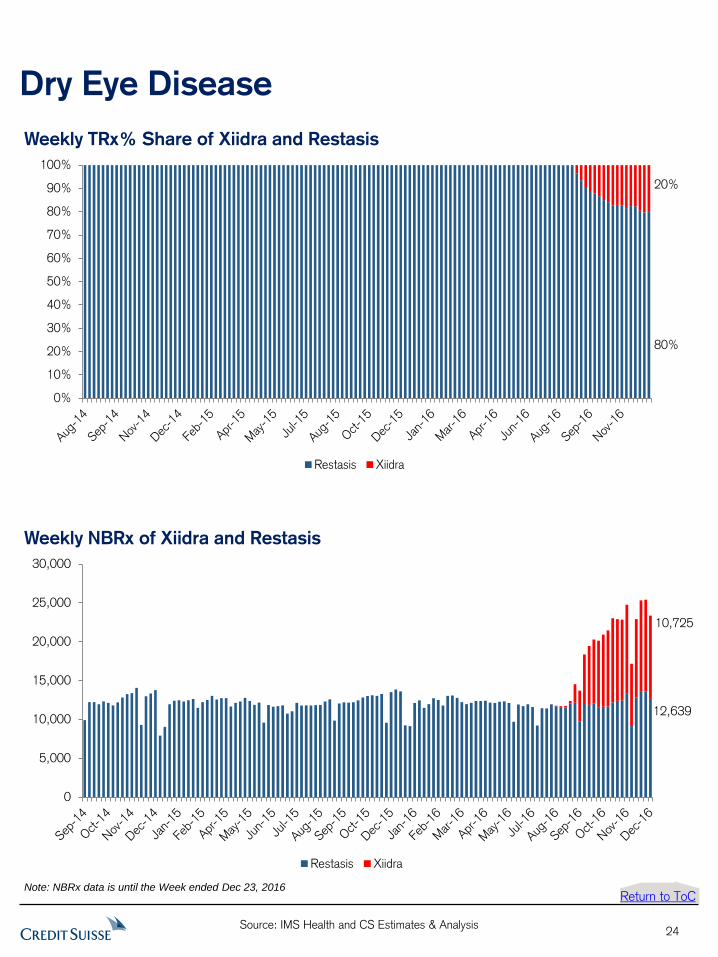
Dry Eye Disease
24
Return to ToC
Weekly NBRx of Xiidra and Restasis
Weekly TRx% Share of Xiidra and Restasis
Note: NBRx data is until the Week ended Dec 23, 2016
Weekly NBRx of Xiidra and Restasis
0
5,000
10,000
15,000
20,000
25,000
30,000
Restasis Xiidra
12,639
10,725
Weekly TRX% Share of Xiidra and Restasis
0%
10%
20%
30%
40%
50%
60%
70%
80%
90%
100%
Restasis Xiidra
80%
20%
Source: IMS Health and CS Estimates & Analysis
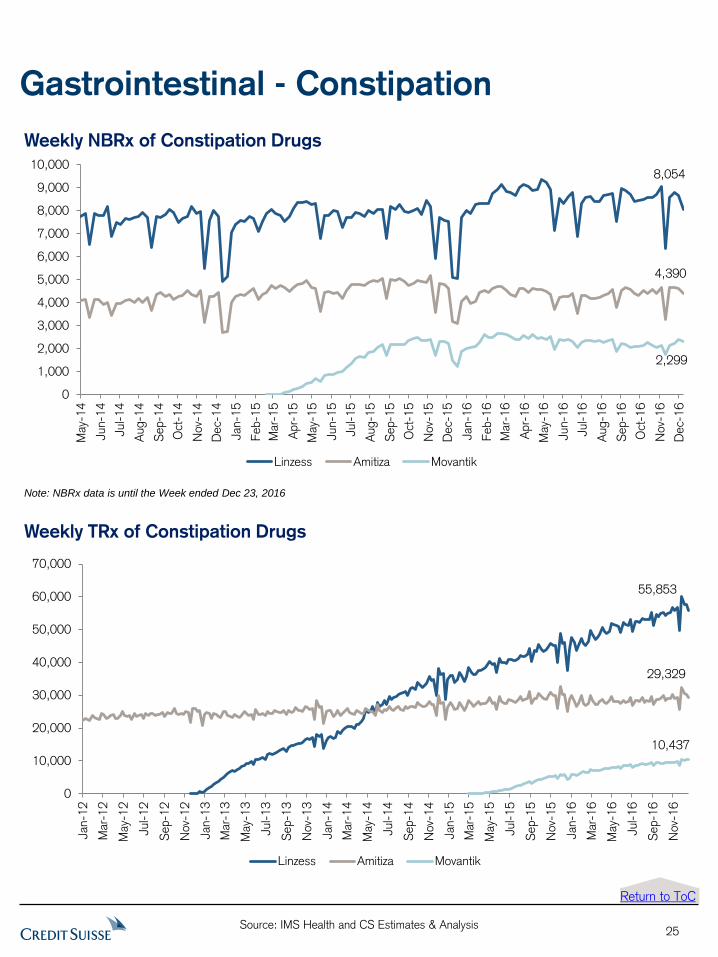
Gastrointestinal - Constipation
25
Weekly NBRx of Constipation Drugs
Weekly TRx of Constipation Drugs
Weekly NBRx of Constipation Drugs
0
1,000
2,000
3,000
4,000
5,000
6,000
7,000
8,000
9,000
10,000
May
-14
Jun-1
4
Jul-14
Aug-1
4
Sep-1
4
Oct
-14
Nov-
14
Dec-
14
Jan-1
5
Feb-1
5
Mar
-15
Apr-
15
May
-15
Jun-1
5
Jul-15
Aug-1
5
Sep-1
5
Oct
-15
Nov-
15
Dec-
15
Jan-1
6
Feb-1
6
Mar
-16
Apr-
16
May
-16
Jun-1
6
Jul-16
Aug-1
6
Sep-1
6
Oct
-16
Nov-
16
Dec-
16
Linzess Amitiza Movantik
8,054
4,390
2,299
Note: NBRx data is until the Week ended Dec 23, 2016
Weekly TRx of Constipation Drugs
0
10,000
20,000
30,000
40,000
50,000
60,000
70,000
Jan-1
2
Mar
-12
May
-12
Jul-12
Sep-1
2
Nov-
12
Jan-1
3
Mar
-13
May
-13
Jul-13
Sep-1
3
Nov-
13
Jan-1
4
Mar
-14
May
-14
Jul-14
Sep-1
4
Nov-
14
Jan-1
5
Mar
-15
May
-15
Jul-15
Sep-1
5
Nov-
15
Jan-1
6
Mar
-16
May
-16
Jul-1
6
Sep-1
6
Nov-
16
Linzess Amitiza Movantik
55,853
29,329
10,437
Return to ToC
Source: IMS Health and CS Estimates & Analysis
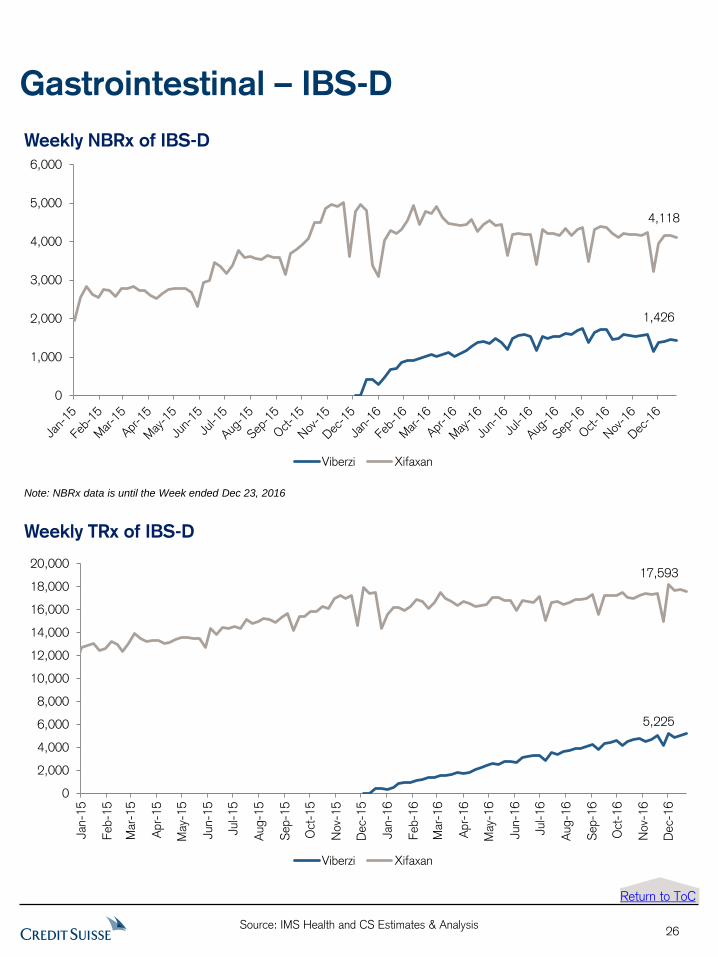
Gastrointestinal – IBS-D
26
Weekly NBRx of IBS-D
Weekly TRx of IBS-D
Weekly TRx of IBS-D Drugs
0
2,000
4,000
6,000
8,000
10,000
12,000
14,000
16,000
18,000
20,000
Jan-1
5
Feb-1
5
Mar
-15
Apr-
15
May
-15
Jun-1
5
Jul-15
Aug-1
5
Sep-1
5
Oct
-15
Nov-
15
Dec-
15
Jan-1
6
Feb-1
6
Mar
-16
Apr-
16
May
-16
Jun-1
6
Jul-16
Aug-1
6
Sep-1
6
Oct
-16
Nov-
16
Dec-
16
Viberzi Xifaxan
5,225
17,593
Weekly NBRx of IBS-D Drugs
0
1,000
2,000
3,000
4,000
5,000
6,000
Viberzi Xifaxan
1,426
4,118
Note: NBRx data is until the Week ended Dec 23, 2016
Return to ToC
Source: IMS Health and CS Estimates & Analysis
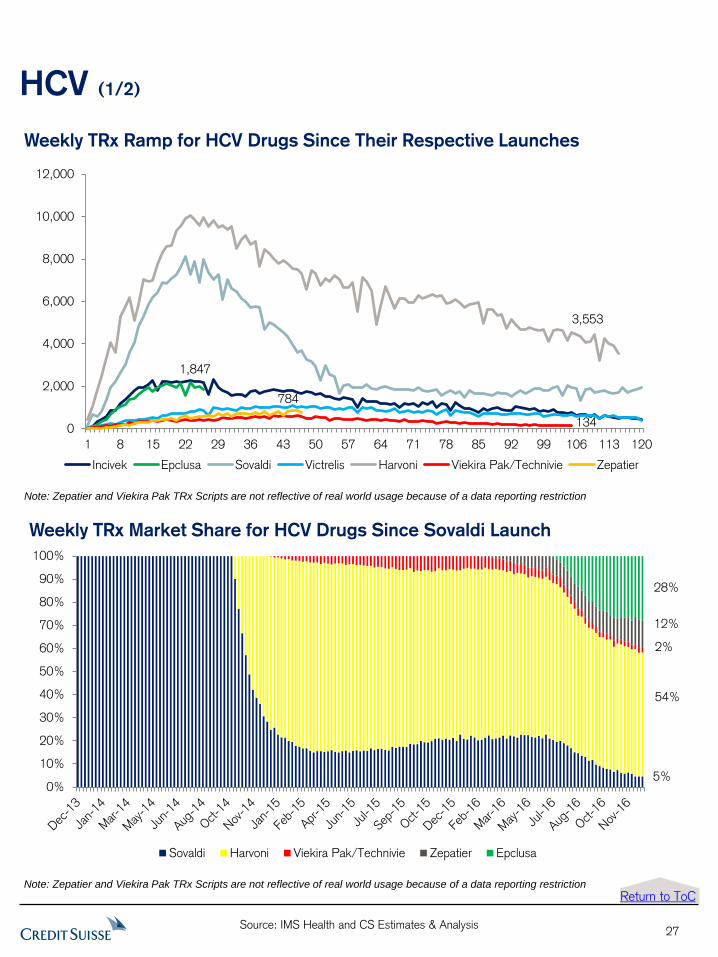
HCV (1/2)
Weekly TRx Ramp for HCV Drugs Since Their Respective Launches
Weekly TRx Market Share for HCV Drugs Since Sovaldi Launch
27
Note: Zepatier and Viekira Pak TRx Scripts are not reflective of real world usage because of a data reporting restriction
Weekly TRx Ramp for HCV Drugs Since Their Respective Launches
0
2,000
4,000
6,000
8,000
10,000
12,000
1 8 15 22 29 36 43 50 57 64 71 78 85 92 99 106 113 120
Incivek Epclusa Sovaldi Victrelis Harvoni Viekira Pak/Technivie Zepatier
3,553
134
1,847
784
Return to ToC
Weekly TRx Market Share for HCV Drugs Since Sovaldi Launch
0%
10%
20%
30%
40%
50%
60%
70%
80%
90%
100%
Sovaldi Harvoni Viekira Pak/Technivie Zepatier Epclusa
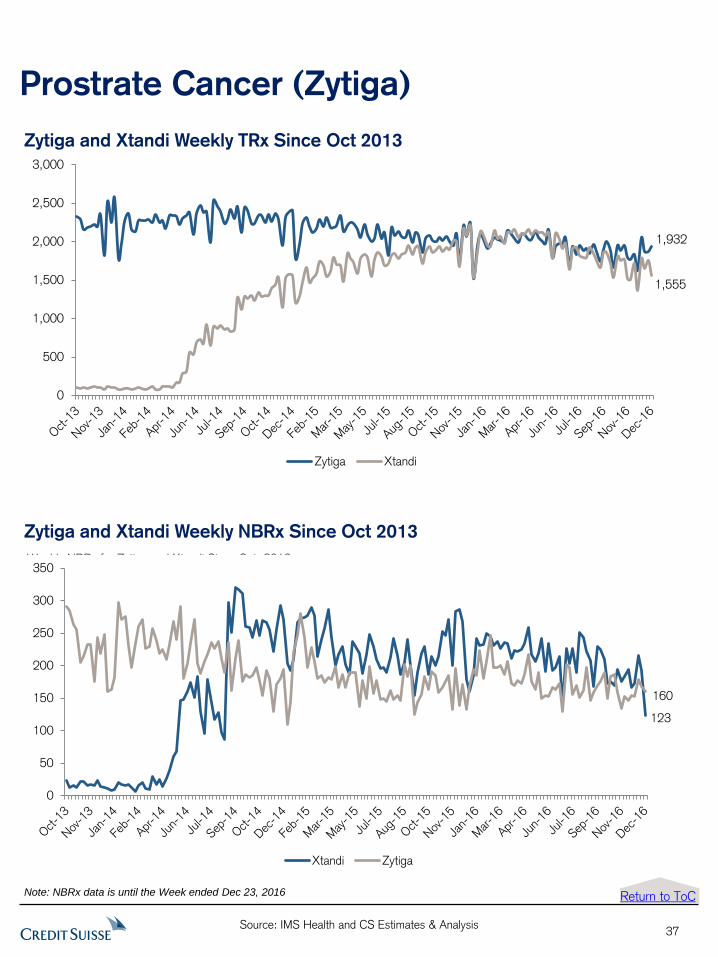
5%
54%
2%
12%
28%
Note: Zepatier and Viekira Pak TRx Scripts are not reflective of real world usage because of a data reporting restriction
Source: IMS Health and CS Estimates & Analysis
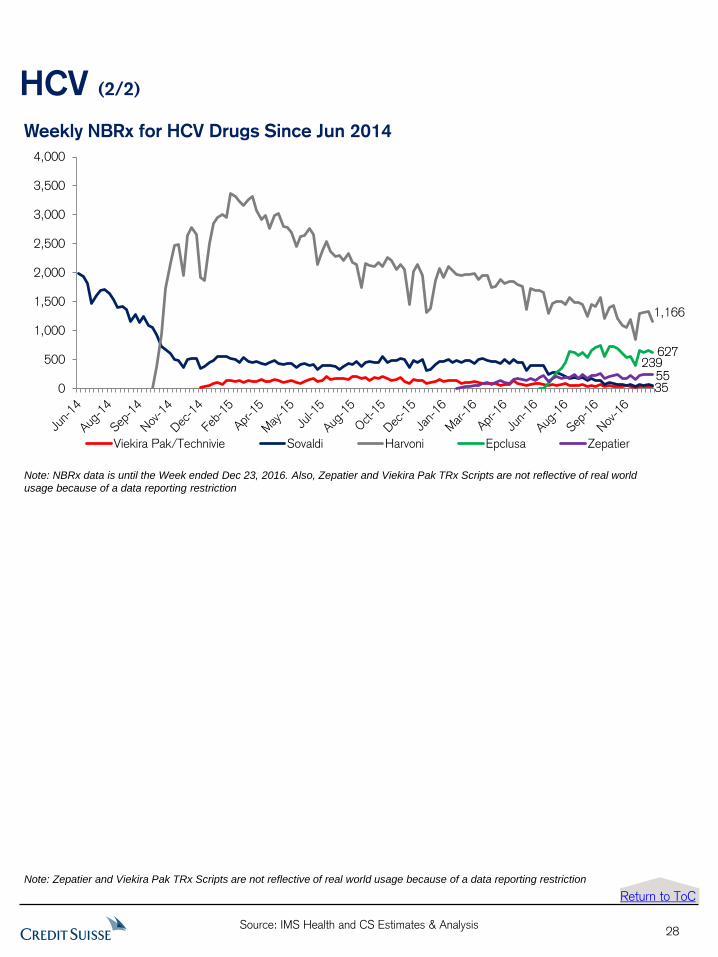
HCV (2/2)
28
Note: Zepatier and Viekira Pak TRx Scripts are not reflective of real world usage because of a data reporting restriction
Return to ToC
Weekly NBRx for HCV Drugs Since Jun 2014 Weekly NBRx for HCV Drugs Since Jun, 2014
0
500
1,000
1,500
2,000
2,500
3,000
3,500
4,000
Viekira Pak/Technivie Sovaldi Harvoni Epclusa Zepatier
55
1,166
627239
35
Note: NBRx data is until the Week ended Dec 23, 2016. Also, Zepatier and Viekira Pak TRx Scripts are not reflective of real world
usage because of a data reporting restriction
Source: IMS Health and CS Estimates & Analysis
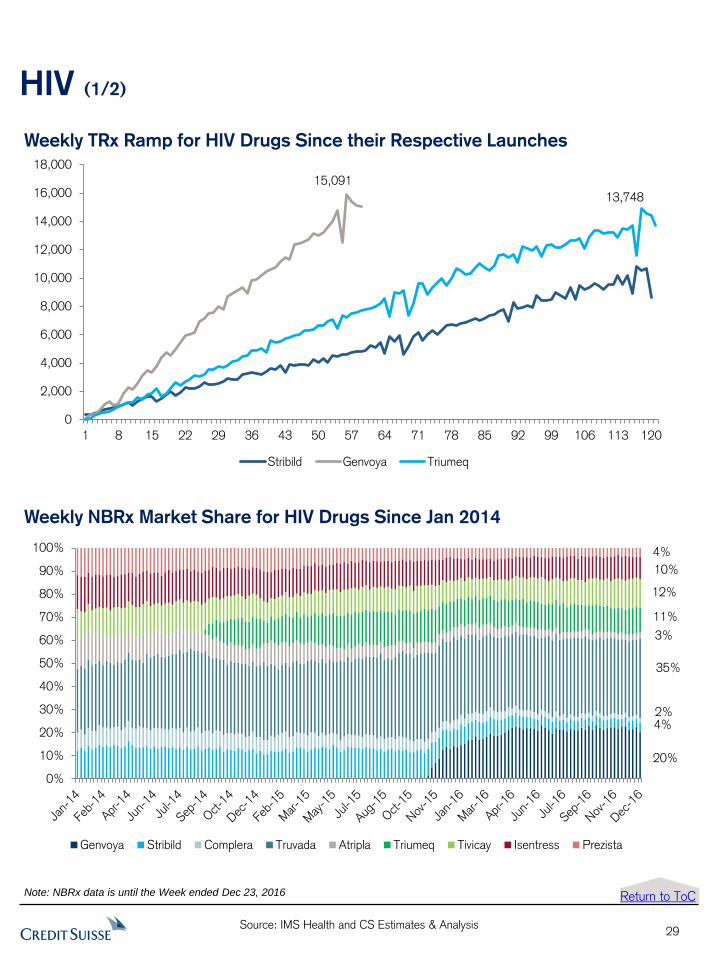
HIV (1/2)
Weekly TRx Ramp for HIV Drugs Since their Respective Launches
Weekly NBRx Market Share for HIV Drugs Since Jan 2014
29
Weekly TRx Ramp for HIV Drugs Since their Respective Launches
0
2,000
4,000
6,000
8,000
10,000
12,000
14,000
16,000
18,000
1 8 15 22 29 36 43 50 57 64 71 78 85 92 99 106 113 120
Stribild Genvoya Triumeq
13,748
15,091
Weekly NBRx Market Share for HIV Drugs Since Jan, 2014
0%
10%
20%
30%
40%
50%
60%
70%
80%
90%
100%
Genvoya Stribild Complera Truvada Atripla Triumeq Tivicay Isentress Prezista
12%
11%
3%
2%4%
35%
20%
4%
10%
Return to ToC Note: NBRx data is until the Week ended Dec 23, 2016
Source: IMS Health and CS Estimates & Analysis
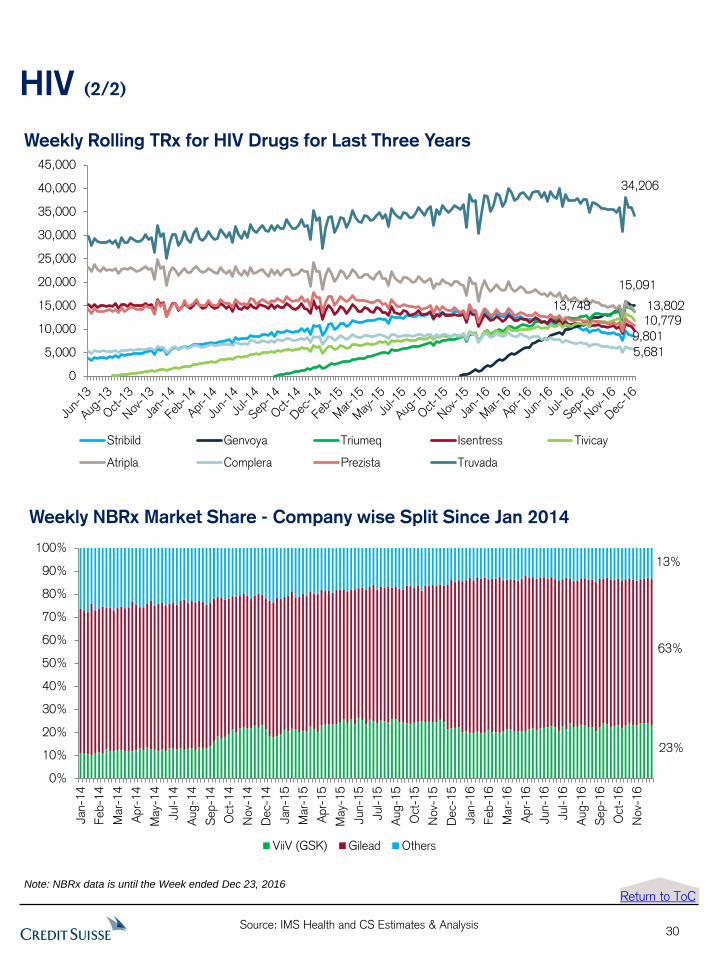
HIV (2/2)
30
Weekly Rolling TRx for HIV Drugs for Last Three Years
Weekly NBRx Market Share - Company wise Split Since Jan 2014
Weekly NBRx Market Share - Company wise Split Since Jan, 2014
0%
10%
20%
30%
40%
50%
60%
70%
80%
90%
100%
Jan-1
4
Feb-1
4
Mar-
14
Apr-
14
May-
14
Jul-14
Aug-1
4
Sep-1
4
Oct
-14
Nov-
14
Dec-
14
Jan-1
5
Mar-
15
Apr-
15
May-
15
Jun-1
5
Jul-15
Aug-1
5
Oct
-15
Nov-
15
Dec-
15
Jan-1
6
Feb-1
6
Mar-
16
Apr-
16
Jun-1
6
Jul-16
Aug-1
6
Sep-1
6
Oct
-16
Nov-
16
ViiV (GSK) Gilead Others
23%
63%
13%
Note: NBRx data is until the Week ended Dec 23, 2016
Weekly Rolling TRx for HIV Drugs for Last Three Years
0
5,000
10,000
15,000
20,000
25,000
30,000
35,000
40,000
45,000
Stribild Genvoya Triumeq Isentress Tivicay
Atripla Complera Prezista Truvada
9,801
13,748 13,802
5,681
10,779
34,206
15,091
Return to ToC
Source: IMS Health and CS Estimates & Analysis
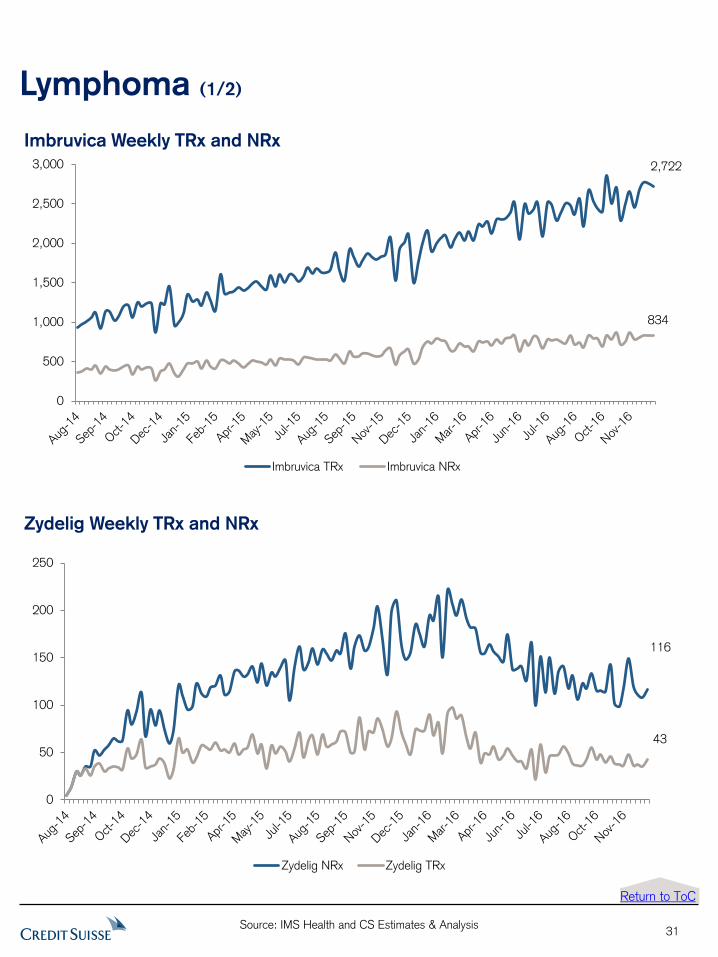
Lymphoma (1/2)
Imbruvica Weekly TRx and NRx
Zydelig Weekly TRx and NRx
31
Imbruvica Weekly TRx and NRx
0
500
1,000
1,500
2,000
2,500
3,000
Imbruvica TRx Imbruvica NRx
834
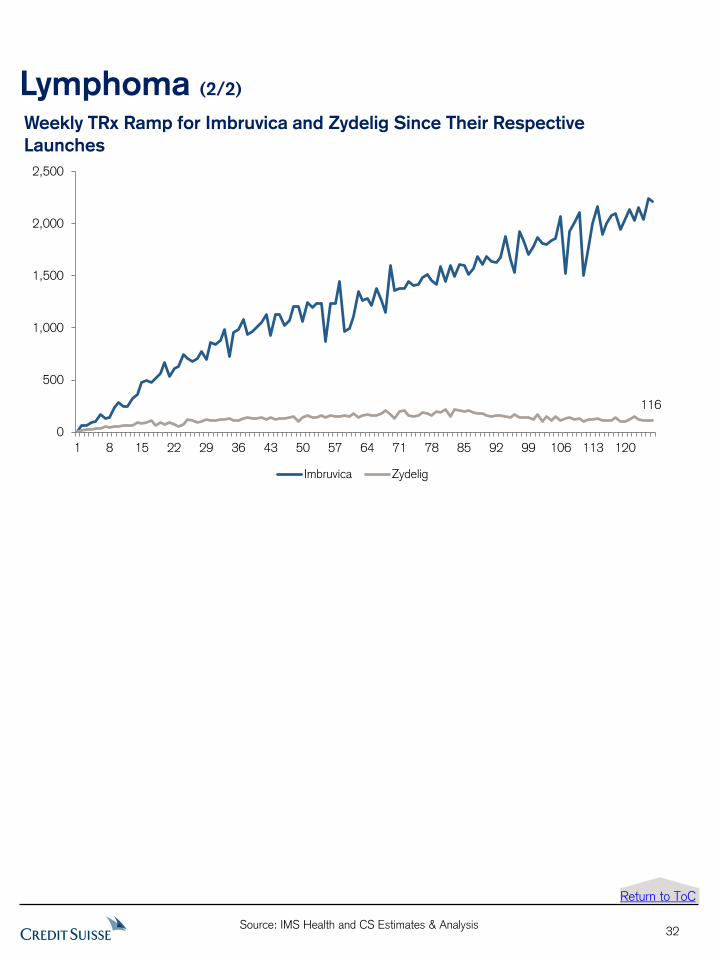
2,722
Zydelig Weekly TRx and NRx
0
50
100
150
200
250
Zydelig NRx Zydelig TRx
43
116
Return to ToC
Source: IMS Health and CS Estimates & Analysis
Lymphoma (2/2)
Weekly TRx Ramp for Imbruvica and Zydelig Since Their Respective
Launches
32
Weekly TRx Ramp for Imbruvica and Zydelig Since Their Respective Launches
0
500
1,000
1,500
2,000
2,500
1 8 15 22 29 36 43 50 57 64 71 78 85 92 99 106 113 120
Imbruvica Zydelig
116
Return to ToC
Source: IMS Health and CS Estimates & Analysis
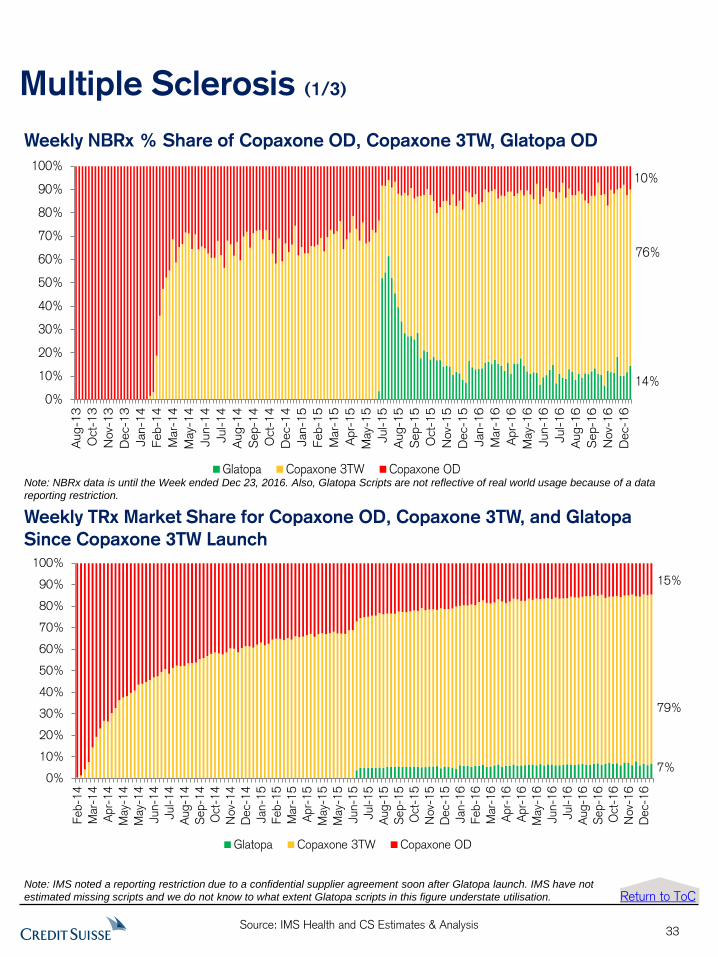
Multiple Sclerosis (1/3)
Weekly NBRx % Share of Copaxone OD, Copaxone 3TW, Glatopa OD
Weekly TRx Market Share for Copaxone OD, Copaxone 3TW, and Glatopa
Since Copaxone 3TW Launch
33
Weekly NBRx % Share of Copaxone OD, Copaxone 3TW, Glatopa OD
0%
10%
20%
30%
40%
50%
60%
70%
80%
90%
100%
Aug-1
3
Oct-
13
Nov-
13
Dec-1
3
Jan-1
4
Feb-1
4
Mar-
14
May-
14
Jun-1
4
Jul-14
Aug-1
4
Sep-1
4
Oct-
14
Dec-1
4
Jan-1
5
Feb-1
5
Mar-
15
Apr-
15
May-
15
Jul-15
Aug-1
5
Sep-1
5
Oct-
15
Nov-
15
Dec-1
5
Jan-1
6
Mar-
16
Apr-
16
May-
16
Jun-1
6
Jul-16
Aug-1
6
Sep-1
6
Nov-
16
Dec-1
6
Glatopa Copaxone 3TW Copaxone OD
10%
76%
14%
Weekly TRx Market Share for Copaxone OD, Copaxone 3TW, and Glatopa Since Copaxone TIW Launch
0%
10%
20%
30%
40%
50%
60%
70%
80%
90%
100%
Feb-1
4
Mar-
14
Apr-
14
May-
14
May-
14
Jun-1
4
Jul-14
Aug-1
4
Sep-1
4
Oct
-14
Nov-
14
Dec-
14
Jan-1
5
Feb-1
5
Mar-
15
Apr-
15
May-
15
May-
15
Jun-1
5
Jul-15
Aug-1
5
Sep-1
5
Oct
-15
Nov-
15
Dec-
15
Jan-1
6
Feb-1
6
Mar-
16
Apr-
16
Apr-
16
May-
16
Jun-1
6
Jul-16
Aug-1
6
Sep-1
6
Oct
-16
Nov-
16
Dec-
16
Glatopa Copaxone 3TW Copaxone OD
7%
15%
79%
Return to ToC
Note: NBRx data is until the Week ended Dec 23, 2016. Also, Glatopa Scripts are not reflective of real world usage because of a data
reporting restriction.
Note: IMS noted a reporting restriction due to a confidential supplier agreement soon after Glatopa launch. IMS have not
estimated missing scripts and we do not know to what extent Glatopa scripts in this figure understate utilisation.
Source: IMS Health and CS Estimates & Analysis
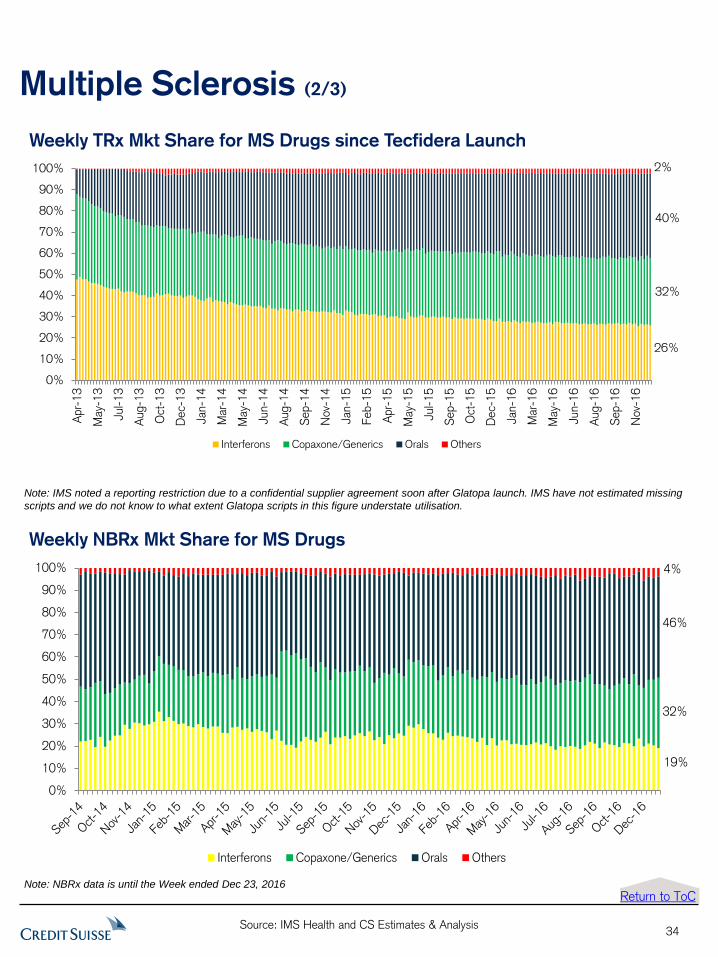
Multiple Sclerosis (2/3)
Weekly TRx Mkt Share for MS Drugs since Tecfidera Launch
34
Return to ToC
Note: IMS noted a reporting restriction due to a confidential supplier agreement soon after Glatopa launch. IMS have not estimated missing
scripts and we do not know to what extent Glatopa scripts in this figure understate utilisation.
Weekly TRx Mkt Share for MS Drugs since Tecfidera Launch
0%
10%
20%
30%
40%
50%
60%
70%
80%
90%
100%
Apr-
13
May
-13
Jul-13
Aug-1
3
Oct
-13
Dec-
13
Jan-1
4
Mar
-14
May
-14
Jun-1
4
Aug-1
4
Sep-1
4
Nov-
14
Jan-1
5
Feb-1
5
Apr-
15
May
-15
Jul-15
Sep-1
5
Oct
-15
Dec-
15
Jan-1
6
Mar
-16
May
-16
Jun-1
6
Aug-1
6
Sep-1
6
Nov-
16
Interferons Copaxone/Generics Orals Others
26%
32%
2%
40%
Weekly NBRx Mkt Share for MS Drugs
Weekly NBRx Mkt Share for MS Drugs
0%
10%
20%
30%
40%
50%
60%
70%
80%
90%
100%
Interferons Copaxone/Generics Orals Others
19%
32%
46%
4%
Note: NBRx data is until the Week ended Dec 23, 2016
Source: IMS Health and CS Estimates & Analysis
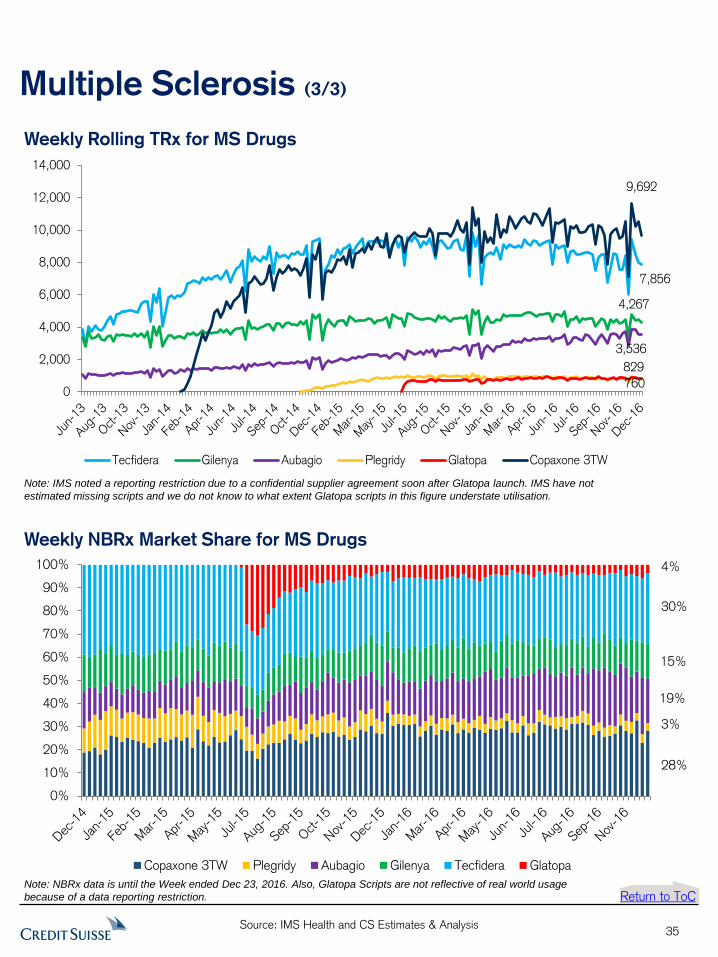
Multiple Sclerosis (3/3)
35
Weekly NBRx Market Share for MS Drugs
Weekly Rolling TRx for MS Drugs Weekly Rolling TRx for MS Drugs for Last Three Years
0
2,000
4,000
6,000
8,000
10,000
12,000
14,000
Tecfidera Gilenya Aubagio Plegridy Glatopa Copaxone 3TW
7,856
4,267
3,536
760
829
9,692
Return to ToC
Note: IMS noted a reporting restriction due to a confidential supplier agreement soon after Glatopa launch. IMS have not
estimated missing scripts and we do not know to what extent Glatopa scripts in this figure understate utilisation.
0%
10%
20%
30%
40%
50%
60%
70%
80%
90%
100%
Copaxone 3TW Plegridy Aubagio Gilenya Tecfidera Glatopa
19%
15%
28%
30%
4%
3%
Note: NBRx data is until the Week ended Dec 23, 2016. Also, Glatopa Scripts are not reflective of real world usage
because of a data reporting restriction.
Source: IMS Health and CS Estimates & Analysis
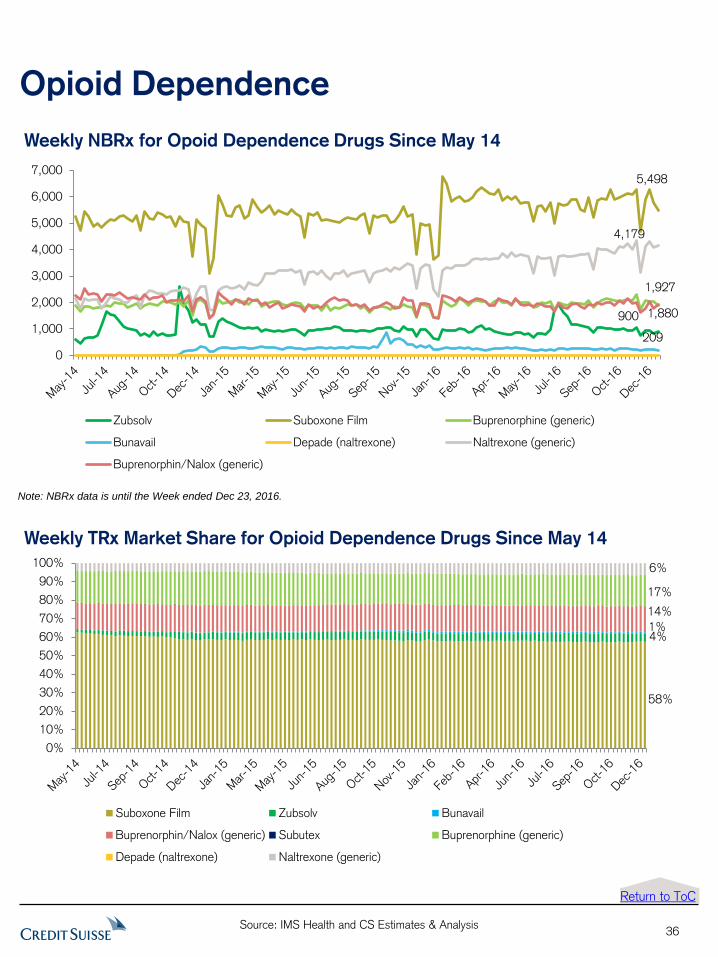
Opioid Dependence
Weekly NBRx for Opoid Dependence Drugs Since May 14
Weekly TRx Market Share for Opioid Dependence Drugs Since May 14
36
Note: NBRx data is until the Week ended Dec 23, 2016.
Weekly TRx Market Share for Opoid Dependance Drugs Since May 14
0%
10%
20%
30%
40%
50%
60%
70%
80%
90%
100%
Suboxone Film Zubsolv Bunavail
Buprenorphin/Nalox (generic) Subutex Buprenorphine (generic)
Depade (naltrexone) Naltrexone (generic)
4%1%
17%
6%
14%
58%
Return to ToC
Weekly NBRx for Opoid Dependance Drugs Since May 14
0
1,000
2,000
3,000
4,000
5,000
6,000
7,000
Zubsolv Suboxone Film Buprenorphine (generic)
Bunavail Depade (naltrexone) Naltrexone (generic)
Buprenorphin/Nalox (generic)
900
209
1,880
4,179
1,927
5,498
Source: IMS Health and CS Estimates & Analysis
Prostrate Cancer (Zytiga)
Zytiga and Xtandi Weekly TRx Since Oct 2013
Zytiga and Xtandi Weekly NBRx Since Oct 2013
37
Zytiga and Xtandi Weekly TRx
0
500
1,000
1,500
2,000
2,500
3,000
Zytiga Xtandi
1,555
1,932
Weekly NBRx for Zytiga and Xtandi Since Oct, 2013
0
50
100
150
200
250
300
350
Xtandi Zytiga
123
160
Return to ToC Note: NBRx data is until the Week ended Dec 23, 2016
Source: IMS Health and CS Estimates & Analysis
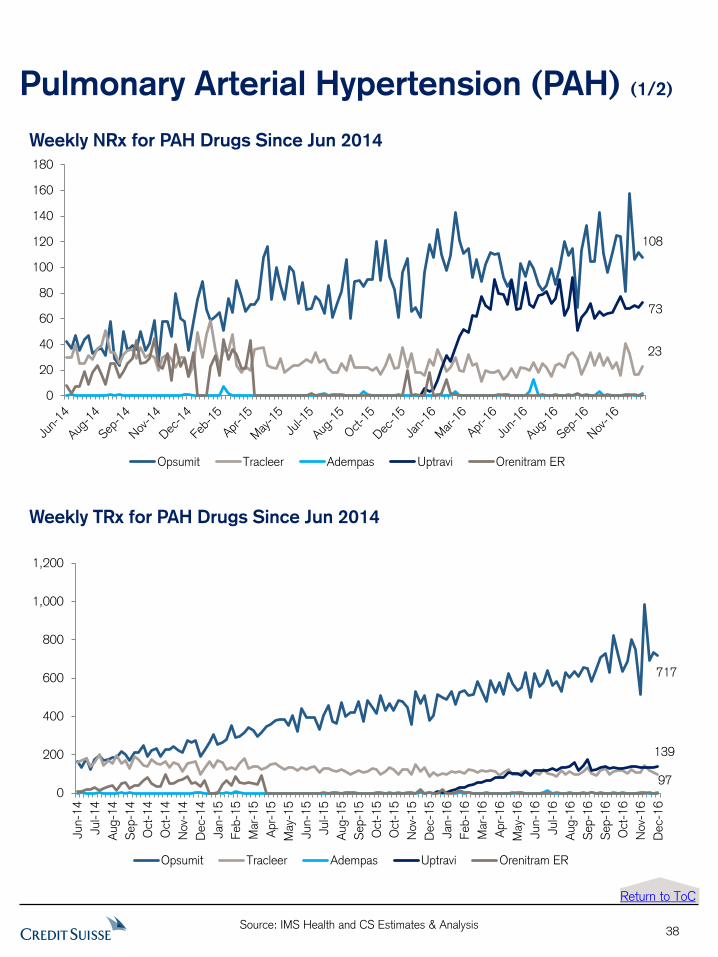
Pulmonary Arterial Hypertension (PAH) (1/2)
38
Weekly NRx for PAH Drugs Since Jun 2014
Weekly TRx for PAH Drugs Since Jun 2014
Weekly NRx of PAH Drugs Since Jan, 2014
0
20
40
60
80
100
120
140
160
180
Opsumit Tracleer Adempas Uptravi Orenitram ER
108
23
73
Weekly TRx of PAH Drugs Since Jan, 2014
0
200
400
600
800
1,000
1,200
Jun-1
4
Jul-14
Aug-1
4
Sep-1
4
Oct
-14
Oct
-14
Nov-
14
Dec-
14
Jan-1
5
Feb-1
5
Mar-
15
Apr-
15
May-
15
Jun-1
5
Jul-1
5
Aug-1
5
Sep-1
5
Oct
-15
Oct
-15
Nov-
15
Dec-
15
Jan-1
6
Feb-1
6
Mar-
16
Apr-
16
May-
16
Jun-1
6
Jul-16
Aug-1
6
Sep-1
6
Sep-1
6
Oct
-16
Nov-
16
Dec-
16
Opsumit Tracleer Adempas Uptravi Orenitram ER
717
97
139
Return to ToC
Source: IMS Health and CS Estimates & Analysis
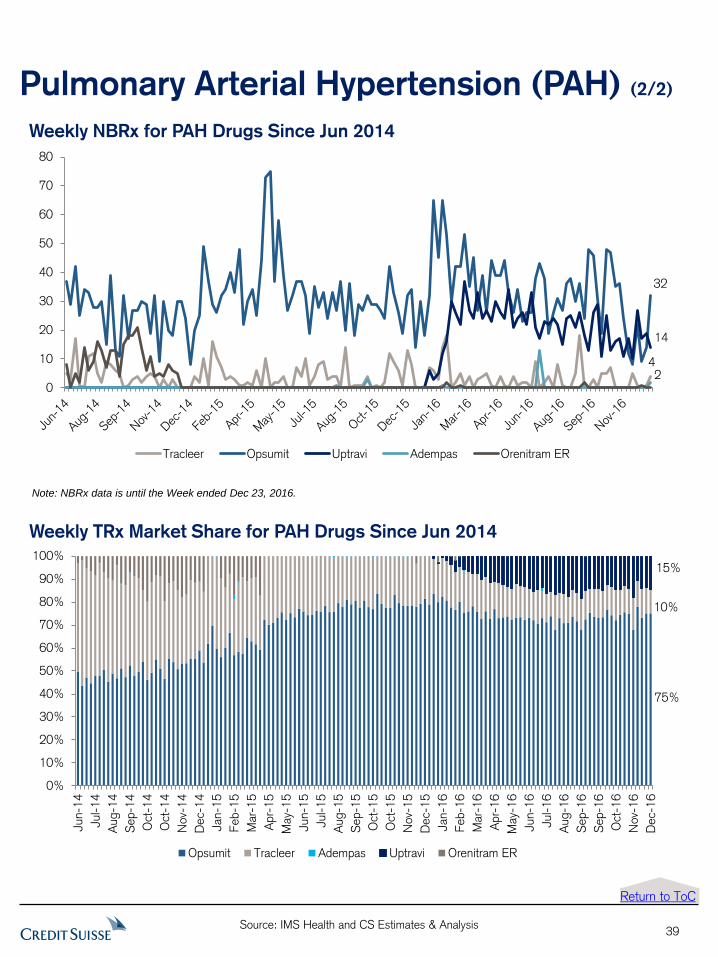
Pulmonary Arterial Hypertension (PAH) (2/2)
39
Weekly TRx Market Share for PAH Drugs Since Jun 2014
Return to ToC
Weekly TRx Market Share of PAH Drugs Since Jan, 2014
0%
10%
20%
30%
40%
50%
60%
70%
80%
90%
100%
Jun-1
4
Jul-14
Aug-1
4
Sep-1
4
Oct
-14
Oct
-14
Nov-
14
Dec-
14
Jan-1
5
Feb-1
5
Mar-
15
Apr-
15
May-
15
Jun-1
5
Jul-15
Aug-1
5
Sep-1
5
Oct
-15
Oct
-15
Nov-
15
Dec-
15
Jan-1
6
Feb-1
6
Mar-
16
Apr-
16
May-
16
Jun-1
6
Jul-16
Aug-1
6
Sep-1
6
Sep-1
6
Oct
-16
Nov-
16
Dec-
16
Opsumit Tracleer Adempas Uptravi Orenitram ER
75%
10%
15%
Weekly NBRx for PAH Drugs Since Jun 2014 Weekly NBRx for PAH Drugs Since Jun, 2014
0
10
20
30
40
50
60
70
80
Tracleer Opsumit Uptravi Adempas Orenitram ER
32
14
42
Note: NBRx data is until the Week ended Dec 23, 2016.
Source: IMS Health and CS Estimates & Analysis
Schizophrenia
40
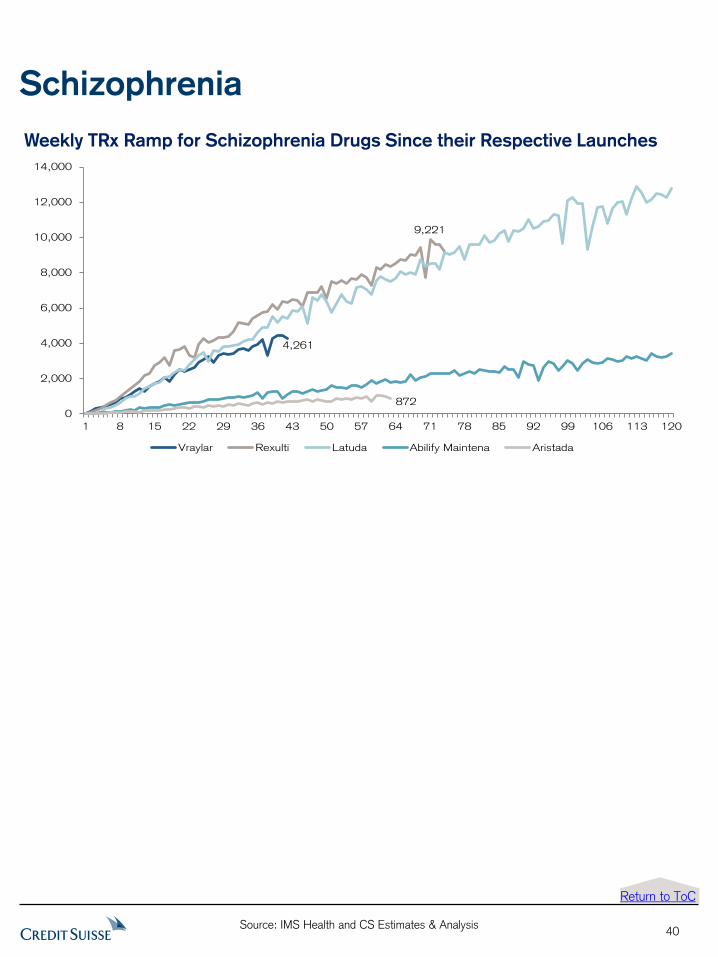
Weekly TRx Ramp for Schizophrenia Drugs Since their Respective Launches Vraylar Launch Performance
0
2,000
4,000
6,000
8,000
10,000
12,000
14,000
1 8 15 22 29 36 43 50 57 64 71 78 85 92 99 106 113 120
Vraylar Rexulti Latuda Abilify Maintena Aristada
4,261
9,221
872
Return to ToC
Companies Mentioned (Price as of 02-Jan-2017)
AbbVie Inc. (ABBV.N, $62.62) Actelion (ATLN.S, SFr220.5) Adamas Pharmaceuticals, Inc. (ADMS.OQ, $16.9) Aimmune Therapeutics (AIMT.OQ, $20.45) Akorn (AKRX.OQ, $21.83) Alder Biopharmaceuticals (ALDR.OQ, $20.8) Alkermes plc (ALKS.OQ, $55.58) Allergan Plc. (AGN.N, $210.01)
AmerisourceBergen (ABC.N, $78.19) Amgen, Inc. (AMGN.OQ, $146.21) Amphastar Pharms (AMPH.OQ, $18.42) Arena Pharmaceuticals Inc (ARNA.OQ, $1.42) AstraZeneca (AZN.L, 4437.5p) Baxter International Inc. (BAX.N, $44.34) Bayer (BAYGn.DE, €100.2) Biodelivery Sci (BDSI.OQ, $1.75) Biogen, Inc. (BIIB.OQ, $283.58) Bristol Myers Squibb Co. (BMY.N, $58.44) CVS Health (CVS.N, $78.91) Celgene Corporation (CELG.OQ, $115.75) Cigna Corporation (CI.N, $133.39) Corvus Pharmaceuticals, Inc. (CRVS.OQ, $14.3) Edge Therapeutics, Inc. (EDGE.OQ, $12.5) Eli Lilly & Co. (LLY.N, $73.55) Esperion Therapeutics (ESPR.OQ, $12.52) Express Scripts (ESRX.OQ, $68.79) Galapagos NV (GLPG.AS, €62.09) Gilead Sciences, Incorporated (GILD.OQ, $71.61) GlaxoSmithKline plc (GSK.L, 1562.0p) Indivior (INDV.L, 296.2p) Ironwood Pharmaceuticals, Inc. (IRWD.OQ, $15.29) Johnson & Johnson (JNJ.N, $115.21) Lundbeck (LUN.CO, Dkr295.5) Malinckrodt (MNK.N, $49.82) Merck & Co., Inc. (MRK.N, $58.87) Mylan Inc. (MYL.OQ, $38.15) MyoKardia, Inc. (MYOK.OQ, $12.95) Novartis (NOVN.S, SFr74.1) Novo Nordisk A/S (NOVOb.CO, Dkr259.0) Orexigen Therapeutics Inc. (OREX.OQ, $1.74) Orexo (ORX.ST, Skr39.9) Otsuka Holdings (4578.T, ¥5,093) PD-Rx (PDRX.PK, $7.0) Perrigo Company plc (PRGO.N, $83.23) Pfizer (PFE.N, $32.48) Portola Pharmaceuticals (PTLA.OQ, $22.44) Reckitt Benckiser (RB.L, 6886.0p) Sanofi (SASY.PA, €77.84) Shire Pharmaceuticals (SHP.L, 4684.0p) Sucampo Pharmaceuticals (SCMP.OQ, $13.55) Sun Pharmaceuticals Industries Limited (SUN.BO, Rs634.8) Takeda Pharmaceutical (4502.T, ¥4,835) Teva Pharmaceutical Industries Ltd. (TEVA.N, $36.25) UCB (UCB.BR, €61.27) VIVUS, Inc. (VVUS.OQ, $1.15) Versartis, Inc. (VSAR.OQ, $14.9)
Disclosure Appendix
Analyst Certification
Vamil Divan, MD, Alethia Young, Kennen MacKay, Ph.D., Grant Hesser, Eliana Merle and European Pharma Team each certify, with respect to the companies or securities that the individual analyzes, that (1) the views expressed in this report accurately reflect his or her personal views about all of the subject companies and securities and (2) no part of his or her compensation was, is or will be directly or indirectly related to the specific recommendations or views expressed in this report.
The analyst(s) responsible for preparing this research report received Compensation that is based upon various factors including Credit Suisse's total revenues, a portion of which are generated by Credit Suisse's investment banking activities
As of December 10, 2012 Analysts’ stock rating are defined as follows:
Outperform (O) : The stock’s total return is expected to outperform the relevant benchmark* over the next 12 months.
Neutral (N) : The stock’s total return is expected to be in line with the relevant benchmark* over the next 12 months.
Underperform (U) : The stock’s total return is expected to underperform the relevant benchmark* over the next 12 months.
*Relevant benchmark by region: As of 10th December 2012, Japanese ratings are based on a stock’s total return relative to the analyst's coverage universe which consists of all companies covered by the analyst within the relevant sector, with Outperforms representing the most attractive, Neutrals the less attractive, and Underperforms the least attractive investment opportunities. As of 2nd October 2012, U.S. and Canadian as well as European ra tings are based on a stock’s total return relative to the analyst's coverage universe which consists of all companies covered by the analyst within the relevant sector, with Outperforms representing the most attractive, Neutrals the less attractive, and Underperforms the least attractive investment opportunities. For La tin American and non-Japan Asia stocks, ratings are based on a stock’s total return relative to the average total return of the relevant country or regional benchmark; prior to 2nd October 2012 U.S. and Canadian ratings were based on (1) a stock’s absolute total return potential to its current share price and (2) the relative attractiveness of a stock’s total return potential wit hin an analyst’s coverage universe. For Australian and New Zealand stocks, the expected total return (ETR) calculation includes 12 -month rolling dividend yield. An Outperform rating is assigned where an ETR is greater than or equal to 7.5%; Underperform where an ETR less than or equal to 5%. A Neutral may be assigned where the ETR is between -5% and 15%. The overlapping rating range allows analysts to assign a rating that puts ETR in the context of associated risks. Prior to 18 May 2015, ETR ranges for Outperform and Underperform ratings did not overlap with Neutral thresholds between 15% and 7.5%, which was in operation from 7 July 2011.
Restricted (R) : In certain circumstances, Credit Suisse policy and/or applicable law and regulations preclude certain types of communications, including an investment recommendation, during the course of Credit Suisse's engagement in an investment banking transaction and in certain other circumstances.
Not Rated (NR) : Credit Suisse Equity Research does not have an investment rating or view on the stock or any other securities related to the company at this time.
Not Covered (NC) : Credit Suisse Equity Research does not provide ongoing coverage of the company or offer an investment rating or investment view on the equity security of the company or related products.
Volatility Indicator [V] : A stock is defined as volatile if the stock price has moved up or down by 20% or more in a month in at least 8 of the past 24 months or the analyst expects significant volatility going forward.
Analysts’ sector weightings are distinct from analysts’ stock ratings and are based on the analyst’s expectations for the fundamentals and/or valuation of the sector* relative to the group’s historic fundamentals and/or valuation:
Overweight : The analyst’s expectation for the sector’s fundamentals and/or valuation is favorable over the next 12 months.
Market Weight : The analyst’s expectation for the sector’s fundamentals and/or valuation is neutral over the next 12 months.
Underweight : The analyst’s expectation for the sector’s fundamentals and/or valuation is cautious over the next 12 months.
*An analyst’s coverage sector consists of all companies covered by the analyst within the relevant sector. An analyst may cover multiple sectors.
Credit Suisse's distribution of stock ratings (and banking clients) is:
Global Ratings Distribution
Rating Versus universe (%) Of which banking clients (%)
Outperform/Buy* 44% (64% banking clients)
Neutral/Hold* 38% (59% banking clients)
Underperform/Sell* 15% (53% banking clients)
Restricted 3%
*For purposes of the NYSE and NASD ratings distribution disclosure requirements, our stock ratings of Outperform, Neutral, and Underperform most closely correspond to Buy, Hold, and Sell, respectively; however, the meanings are not the same, as our stock ratings are determined on a relati ve basis. (Please refer to definitions above.) An investor's decision to buy or sell a security should be based on investment objectives, current holdings, and other individual factors.
Important Global Disclosures
Credit Suisse’s research reports are made available to clients through our proprietary research portal on CS PLUS. Credit Suisse research products may also be made available through third-party vendors or alternate electronic means as a convenience. Certain research products are only made available through CS PLUS. The services provided by Credit Suisse’s analysts to clients may depend on a specific client’s preferences regarding the frequency and manner of receiving communications, the client’s risk profile and investment, the size and scope of the overall client relationship with the Firm, as well as legal and regulatory constraints. To access all of Credit Suisse’s research that you are entitled to receive in the most timely manner, please contact your sales representative or go to https://plus.credit-suisse.com .
Credit Suisse’s policy is to update research reports as it deems appropriate, based on developments with the subject company, the sector or the market that may have a material impact on the research views or opinions stated herein.
Credit Suisse's policy is only to publish investment research that is impartial, independent, clear, fair and not misleading. For more detail please refer to Credit Suisse's Policies for Managing Conflicts of Interest in connection with Investment Research: http://www.csfb.com/research-and-analytics/disclaimer/managing_conflicts_disclaimer.html .
Credit Suisse's policy is only to publish investment research that is impartial, independent, clear, fair and not misleading. For more detail please refer to Credit Suisse's Policies for Managing Conflicts of Interest in connection with Investment Research:
See the Companies Mentioned section for full company names
The subject company (CI.N, ESRX.OQ, GILD.OQ, GSK.L, INDV.L, LUN.CO, NOVN.S, NOVOb.CO, RB.L, SASY.PA, UCB.BR, ABBV.N, ABC.N, ADMS.OQ, AGN.N, AIMT.OQ, ALDR.OQ, AMGN.OQ, ATLN.S, AZN.L, BAX.N, BAYGn.DE, BIIB.OQ, BMY.N, CELG.OQ, JNJ.N, LLY.N, MRK.N, MYOK.OQ, TEVA.N, PTLA.OQ, PRGO.N, PFE.N, OREX.OQ, GLPG.AS, CRVS.OQ, EDGE.OQ, ESPR.OQ, SHP.L, 4502.T) currently is, or was during the 12-month period preceding the date of distribution of this report, a client of Credit Suisse.
Credit Suisse provided investment banking services to the subject company (ESRX.OQ, NOVN.S, ABBV.N, AIMT.OQ, AMGN.OQ, ATLN.S, BAX.N, BAYGn.DE, BIIB.OQ, BMY.N, CELG.OQ, LLY.N, MRK.N, MYOK.OQ, TEVA.N, PTLA.OQ, PRGO.N, PFE.N, CRVS.OQ, EDGE.OQ, ESPR.OQ, SHP.L) within the past 12 months.
Credit Suisse provided non-investment banking services to the subject company (ESRX.OQ, GILD.OQ, ABC.N, AMGN.OQ, BIIB.OQ, CELG.OQ, TEVA.N) within the past 12 months
Credit Suisse has managed or co-managed a public offering of securities for the subject company (ESRX.OQ, ABBV.N, AMGN.OQ, BAX.N, BAYGn.DE, LLY.N, MYOK.OQ, TEVA.N, PRGO.N, PFE.N, CRVS.OQ, SHP.L) within the past 12 months.
Credit Suisse has received investment banking related compensation from the subject company (ESRX.OQ, NOVN.S, ABBV.N, AIMT.OQ, AMGN.OQ, ATLN.S, BAX.N, BAYGn.DE, BIIB.OQ, BMY.N, CELG.OQ, LLY.N, MRK.N, MYOK.OQ, TEVA.N, PTLA.OQ, PRGO.N, PFE.N, CRVS.OQ, EDGE.OQ, ESPR.OQ, SHP.L) within the past 12 months
Credit Suisse expects to receive or intends to seek investment banking related compensation from the subject company (CVS.N, CI.N, ESRX.OQ, GILD.OQ, GSK.L, INDV.L, LUN.CO, NOVN.S, NOVOb.CO, RB.L, SASY.PA, SUN.BO, UCB.BR, 4578.T, ABBV.N, ABC.N, ADMS.OQ, AGN.N, AIMT.OQ, ALDR.OQ, ALKS.OQ, AMGN.OQ, ATLN.S, AZN.L, BAX.N, BAYGn.DE, BIIB.OQ, BMY.N, CELG.OQ, JNJ.N, LLY.N, MRK.N, MYOK.OQ, VSAR.OQ, TEVA.N, PTLA.OQ, PRGO.N, PFE.N, OREX.OQ, GLPG.AS, CRVS.OQ, EDGE.OQ, ESPR.OQ, SHP.L, 4502.T) within the next 3 months.
Credit Suisse has received compensation for products and services other than investment banking services from the subject company (ESRX.OQ, GILD.OQ, ABC.N, AMGN.OQ, BIIB.OQ, CELG.OQ, TEVA.N) within the past 12 months
As of the date of this report, Credit Suisse makes a market in the following subject companies (CI.N, TEVA.N).
Please visit https://credit-suisse.com/in/researchdisclosure for additional disclosures mandated vide Securities And Exchange Board of India (Research Analysts) Regulations, 2014
Credit Suisse may have interest in (SUN.BO)
As of the end of the preceding month, Credit Suisse beneficially own 1% or more of a class of common equity securities of (OREX.OQ, ESPR.OQ, SHP.L).
As of the end of the preceding month, Credit Suisse beneficially own between 1-3% of a class of common equity securities of (NOVN.S, ATLN.S).
Credit Suisse beneficially holds >0.5% long position of the total issued share capital of the subject company (OREX.OQ).
Credit Suisse has a material conflict of interest with the subject company (CI.N) . Credit Suisse is acting as financial advisor to Anthem Inc. (ANTM) on its announced acquisition of Cigna Corporation (CI).
Credit Suisse has a material conflict of interest with the subject company (GSK.L) . "Urs Rohner, the Chairman of Credit Suisse is a non-executive Director of GlaxoSmithKline plc (LSE:GSK)"
Credit Suisse has a material conflict of interest with the subject company (ABC.N) . Credit Suisse is acting as financial adviser to PharMedium Healthcare Holdings, Inc. in relation to its definitive agreement to be acquired by AmerisourceBergen (ABC).
Credit Suisse has a material conflict of interest with the subject company (BAX.N) . Credit Suisse acted as the financial advisor to Claris Lifesciences Limited in relation to their announced transaction to sell their global generics injectables business to Baxter International, Inc.
Credit Suisse has a material conflict of interest with the subject company (BAYGn.DE) . Credit Suisse is acting as joint lead financial advisor to Bayer in relation to the proposed offer for Monsanto.
As of the date of this report, an analyst involved in the preparation of this report has the following material conflict of interest with the subject company (CVS.N). Training
As of the date of this report, an analyst involved in the preparation of this report has the following material conflict of interest with the subject company (PFE.N). As of the date of this report, an analyst involved in the preparation of this report, Vamil Divan, has following material conflicts of interest with the subject company. The analyst or a member of the analyst's household has a long position in the common stock Pfizer (PFE.N). A member of the analyst's household is an employee of Pfizer (PFE.N).
For other important disclosures concerning companies featured in this report, including price charts, please visit the website at https://rave.credit-suisse.com/disclosures or call +1 (877) 291-2683.
For date and time of production, dissemination and history of recommendation for the subject company(ies) featured in this report, disseminated within the past 12 months, please refer to the link: https://rave.credit-suisse.com/disclosures/view/report?i=239614&v=1ng708dueh99sis9xuvob0psr .
Important Regional Disclosures
Singapore recipients should contact Credit Suisse AG, Singapore Branch for any matters arising from this research report.
The analyst(s) involved in the preparation of this report may participate in events hosted by the subject company, including site visits. Credit Suisse does not accept or permit analysts to accept payment or reimbursement for travel expenses associated with these events.
Restrictions on certain Canadian securities are indicated by the following abbreviations: NVS--Non-Voting shares; RVS--Restricted Voting Shares; SVS--Subordinate Voting Shares.
Individuals receiving this report from a Canadian investment dealer that is not affiliated with Credit Suisse should be advised that this report may not contain regulatory disclosures the non-affiliated Canadian investment dealer would be required to make if this were its own report.
For Credit Suisse Securities (Canada), Inc.'s policies and procedures regarding the dissemination of equity research, please visit https://www.credit-suisse.com/sites/disclaimers-ib/en/canada-research-policy.html.
The following disclosed European company/ies have estimates that comply with IFRS: (LUN.CO, RB.L, SASY.PA, UCB.BR, ATLN.S, AZN.L, BMY.N).
An analyst involved in the preparation of this report received third party benefits in connection with this research report from the subject company (CVS.N)
Credit Suisse has acted as lead manager or syndicate member in a public offering of securities for the subject company (ESRX.OQ, GSK.L, NOVN.S, ABBV.N, ABC.N, ADMS.OQ, AGN.N, AIMT.OQ, ALDR.OQ, AMGN.OQ, AZN.L, BAX.N, BAYGn.DE, BIIB.OQ, BMY.N, CELG.OQ, LLY.N, MRK.N, MYOK.OQ, VSAR.OQ, TEVA.N, PTLA.OQ, PRGO.N, PFE.N, GLPG.AS, CRVS.OQ, EDGE.OQ, ESPR.OQ, SHP.L) within the past 3 years.
Principal is not guaranteed in the case of equities because equity prices are variable.
Commission is the commission rate or the amount agreed with a customer when setting up an account or at any time after that.
This research report is authored by:
Credit Suisse Securities (USA) LLCVamil Divan, MD ; Alethia Young ; Kennen MacKay, Ph.D. ; Grant Hesser ; Eliana Merle ; Barbara Kotei ; Muriel Chen ; Muriel Chen ; Muriel Chen ; Muriel Chen ; Muriel Chen ; Muriel Chen ; Matthew Keeler ; Muriel Chen ; Muriel Chen ; Muriel Chen ; Muriel Chen ; Muriel Chen ; Muriel Chen ; Muriel Chen ; Muriel Chen ; Muriel Chen ; Muriel Chen ; Muriel Chen ; Muriel Chen ; Muriel Chen
Credit Suisse International .................................................................................................................................................. European Pharma Team
To the extent this is a report authored in whole or in part by a non-U.S. analyst and is made available in the U.S., the following are important disclosures regarding any non-U.S. analyst contributors: The non-U.S. research analysts listed below (if any) are not registered/qualified as research analysts with FINRA. The non-U.S. research analysts listed below may not be associated persons of CSSU and therefore may not be subject to the NASD Rule 2711 and NYSE Rule 472 restrictions on communications with a subject company, public appearances and trading securities held by a research analyst account.
Credit Suisse International .................................................................................................................................................. European Pharma Team
For Credit Suisse disclosure information on other companies mentioned in this report, please visit the website at https://rave.credit-suisse.com/disclosures or call +1 (877) 291-2683.
This report is produced by subsidiaries and affiliates of Credit Suisse operating under its Global Markets Division. For more information on our structure, please use the following link: https://www.credit-suisse.com/who-we-are This report may contain material that is not directed to, or intended for distribution to or use by, any person or entity who is a citizen or resident of or located in any locality, state, country or other jurisdiction where such distribution, publication, availability or use would be contrary to law or regulation or which would subject Credit Suisse or its affiliates ("CS") to any registration or licensing requirement within such jurisdiction. All material presented in this report, unless specifically indicated otherwise, is under copyright to CS. None of the material, nor its content, nor any copy of it, may be altered in any way, transmitted to, copied or distributed to any other party, without the prior express written permission of CS. All trademarks, service marks and logos used in this report are trademarks or service marks or registered trademarks or service marks of CS or its affiliates.The information, tools and material presented in this report are provided to you for information purposes only and are not to be used or considered as an offer or the solicitation of an offer to sell or to buy or subscribe for securities or other financial instruments. CS may not have taken any steps to ensure that the securities referred to in this report are suitable for any particular investor. CS will not treat recipients of this report as its customers by virtue of their receiving this report. The investments and services contained or referred to in this report may not be suitable for you and it is recommended that you consult an independent investment advisor if you are in doubt about such investments or investment services. Nothing in this report constitutes investment, legal, accounting or tax advice, or a representation that any investment or strategy is suitable or appropriate to your individual circumstances, or otherwise constitutes a personal recommendation to you. CS does not advise on the tax consequences of investments and you are advised to contact an independent tax adviser. Please note in particular that the bases and levels of taxation may change. Information and opinions presented in this report have been obtained or derived from sources believed by CS to be reliable, but CS makes no representation as to their accuracy or completeness. CS accepts no liability for loss arising from the use of the material presented in this report, except that this exclusion of liability does not apply to the extent that such liability arises under specific statutes or regulations applicable to CS. This report is not to be relied upon in substitution for the exercise of independent judgment. CS may have issued, and may in the future issue, other communications that are inconsistent with, and reach different conclusions from, the information presented in this report. Those communications reflect the different assumptions, views and analytical methods of the analysts who prepared them and CS is under no obligation to ensure that such other communications are brought to the attention of any recipient of this report. Some investments referred to in this report will be offered solely by a single entity and in the case of some investments solely by CS, or an associate of CS or CS may be the only market maker in such investments. Past performance should not be taken as an indication or guarantee of future performance, and no representation or warranty, express or implied, is made regarding future performance. Information, opinions and estimates contained in this report reflect a judgment at its original date of publication by CS and are subject to change without notice. The price, value of and income from any of the securities or financial instruments mentioned in this report can fall as well as rise. The value of securities and financial instruments is subject to exchange rate fluctuation that may have a positive or adverse effect on the price or income of such securities or financial instruments. Investors in securities such as ADR's, the values of which are influenced by currency volatility, effectively assume this risk. Structured securities are complex instruments, typically involve a high degree of risk and are intended for sale only to sophisticated investors who are capable of understanding and assuming the risks involved. The market value of any structured security may be affected by changes in economic, financial and political factors (including, but not limited to, spot and forward interest and exchange rates), time to maturity, market conditions and volatility, and the credit quality of any issuer or reference issuer. Any investor interested in purchasing a structured product should conduct their own investigation and analysis of the product and consult with their own professional advisers as to the risks involved in making such a purchase. Some investments discussed in this report may have a high level of volatility. High volatility investments may experience sudden and large falls in their value causing losses when that investment is realised. Those losses may equal your original investment. Indeed, in the case of some investments the potential losses may exceed the amount of initial investment and, in such circumstances, you may be required to pay more money to support those losses. Income yields from investments may fluctuate and, in consequence, initial capital paid to make the investment may be used as part of that income yield. Some investments may not be readily realisable and it may be difficult to sell or realise those investments, similarly it may prove difficult for you to obtain reliable information about the value, or risks, to which such an investment is exposed. This report may provide the addresses of, or contain hyperlinks to, websites. Except to the extent to which the report refers to website material of CS, CS has not reviewed any such site and takes no responsibility for the content contained therein. Such address or hyperlink (including addresses or hyperlinks to CS's own website material) is provided solely for your convenience and information and the content of any such website does not in any way form part of this document. Accessing such website or following such link through this report or CS's website shall be at your own risk.
This report is issued and distributed in European Union (except Switzerland): by Credit Suisse Securities (Europe) Limited, One Cabot Square, London E14 4QJ, England, which is authorised by the Prudential Regulation Authority and regulated by the Financial Conduct Authority and the Prudential Regulation Authority. Germany: Credit Suisse Securities (Europe) Limited Niederlassung Frankfurt am Main regulated by the Bundesanstalt fuer Finanzdienstleistungsaufsicht ("BaFin"). United States and Canada: Credit Suisse Securities (USA) LLC; Switzerland: Credit Suisse AG; Brazil: Banco de Investimentos Credit Suisse (Brasil) S.A or its affiliates; Mexico: Banco Credit Suisse (México), S.A. (transactions related to the securities mentioned in this report will only be effected in compliance with applicable regulation); Japan: by Credit Suisse Securities (Japan) Limited, Financial Instruments Firm, Director-General of Kanto Local Finance Bureau ( Kinsho) No. 66, a member of Japan Securities Dealers Association, The Financial Futures Association of Japan, Japan Investment Advisers Association, Type II Financial Instruments Firms Association; Hong Kong: Credit Suisse (Hong Kong) Limited; Australia: Credit Suisse Equities (Australia) Limited; Thailand: Credit Suisse Securities (Thailand) Limited, regulated by the Office of the Securities and Exchange Commission, Thailand, having registered address at 990 Abdulrahim Place, 27th Floor, Unit 2701, Rama IV Road, Silom, Bangrak, Bangkok10500, Thailand, Tel. +66 2614 6000; Malaysia: Credit Suisse Securities (Malaysia) Sdn Bhd; Singapore: Credit Suisse AG, Singapore Branch; India: Credit Suisse Securities (India) Private Limited (CIN no.U67120MH1996PTC104392) regulated by the Securities and Exchange Board of India as Research Analyst (registration no. INH 000001030) and as Stock Broker (registration no. INB230970637; INF230970637; INB010970631; INF010970631), having registered address at 9th
Floor, Ceejay House, Dr.A.B. Road, Worli, Mumbai - 18, India, T- +91-22 6777 3777; South Korea: Credit Suisse Securities (Europe) Limited, Seoul Branch; Taiwan: Credit Suisse AG Taipei Securities Branch; Indonesia: PT Credit Suisse Securities Indonesia; Philippines:Credit Suisse Securities (Philippines ) Inc., and elsewhere in the world by the relevant authorised affiliate of the above. Additional Regional Disclaimers Hong Kong: Credit Suisse (Hong Kong) Limited ("CSHK") is licensed and regulated by the Securities and Futures Commission of Hong Kong under the laws of Hong Kong, which differ from Australian laws. CSHKL does not hold an Australian financial services licence (AFSL) and is exempt from the requirement to hold an AFSL under the Corporations Act 2001 (the Act) under Class Order 03/1103 published by the ASIC in respect of financial services provided to Australian wholesale clients (within the meaning of section 761G of the Act). Research on Taiwanese securities produced by Credit Suisse AG, Taipei Securities Branch has been prepared by a registered Senior Business Person. Australia (to the extent services are offered in Australia): Credit Suisse Securities (Europe) Limited (“CSSEL”) and Credit Suisse International (“CSI”) are authorised by the Prudential Regulation Authority and regulated by the Financial Conduct Authority (“FCA”) and the Prudential Regulation Authority under UK laws, which differ from Australian Laws. CSSEL and CSI do not hold an Australian Financial Services Licence (“AFSL”) and are exempt from the requirement to hold an AFSL under the Corporations Act (Cth) 2001 (“Corporations Act”) under Class Order 03/1099 published by the Australian Securities and Investments Commission (“ASIC”), in respect of the financial services provided to Australian wholesale clients (within the meaning of section 761G of the Corporations Act). This material is not for distribution to retail clients and is directed exclusively at Credit Suisse's professional clients and eligible counterparties as defined by the FCA, and wholesale clients as defined under section 761G of the Corporations Act. Credit Suisse (Hong Kong) Limited (“CSHK”) is licensed and regulated by the Securities and Futures Commission of Hong Kong under the laws of Hong Kong, which differ from Australian laws. CSHKL does not hold an AFSL and is exempt from the requirement to hold an AFSL under the Corporations Act under Class Order 03/1103 published by the ASIC in respect of financial services provided to Australian wholesale clients (within the meaning of section 761G of the Corporations Act). Credit Suisse Securities (USA) LLC (CSSU) and Credit Suisse Asset Management LLC (CSAM LLC) are licensed and regulated by the Securities Exchange Commission of the United States under the laws of the United States, which differ from Australian laws. CSSU and CSAM LLC do not hold an AFSL and is exempt from the requirement to hold an AFSL under the Corporations Act under Class Order 03/1100 published by the ASIC in respect of financial services provided to Australian wholesale clients (within the meaning of section 761G of the Corporations Act). Malaysia: Research provided to residents of Malaysia is authorised by the Head of Research for Credit Suisse Securities (Malaysia) Sdn Bhd, to whom they should direct any queries on +603 2723 2020. Singapore: This report has been prepared and issued for distribution in Singapore to institutional investors, accredited investors and expert investors (each as defined under the Financial Advisers Regulations) only, and is also distributed by Credit Suisse AG, Singapore Branch to overseas investors (as defined under the Financial Advisers Regulations). Credit Suisse AG, Singapore Branch may distribute reports produced by its foreign entities or affiliates pursuant to an arrangement under Regulation 32C of the Financial Advisers Regulations. Singapore recipients should contact Credit Suisse AG, Singapore Branch at +65-6212-2000 for matters arising from, or in connection with, this report. By virtue of your status as an institutional investor, accredited investor, expert investor or overseas investor, Credit Suisse AG, Singapore Branch is exempted from complying with certain compliance requirements under the Financial Advisers Act, Chapter 110 of Singapore (the “FAA”), the Financial Advisers Regulations and the relevant Notices and Guidelines issued thereunder, in respect of any financial advisory service which Credit Suisse AG, Singapore Branch may provide to you. UAE: This information is being distributed by Credit Suisse AG (DIFC Branch), duly licensed and regulated by the Dubai Financial Services Authority (“DFSA”). Related financial services or products are only made available to Professional Clients or Market Counterparties, as defined by the DFSA, and are not intended for any other persons. Credit Suisse AG (DIFC Branch) is located on Level 9 East, The Gate Building, DIFC, Dubai, United Arab Emirates. EU: This report has been produced by subsidiaries and affiliates of Credit Suisse operating under its Global Markets Division This research may not conform to Canadian disclosure requirements. In jurisdictions where CS is not already registered or licensed to trade in securities, transactions will only be effected in accordance with applicable securities legislation, which will vary from jurisdiction to jurisdiction and may require that the trade be made in accordance with applicable exemptions from registration or licensing requirements. Non-US customers wishing to effect a transaction should contact a CS entity in their local jurisdiction unless governing law permits otherwise. US customers wishing to effect a transaction should do so only by contacting a representative at Credit Suisse Securities (USA) LLC in the US. Please note that this research was originally prepared and issued by CS for distribution to their market professional and institutional investor customers. Recipients who are not market professional or institutional investor customers of CS should seek the advice of their independent financial advisor prior to taking any investment decision based on this report or for any necessary explanation of its contents. This research may relate to investments or services of a person outside of the UK or to other matters which are not authorised by the Prudential Regulation Authority and regulated by the Financial Conduct Authority and the Prudential Regulation Authority or in respect of which the protections of the Prudential Regulation Authority and Financial Conduct Authority for private customers and/or the UK compensation scheme may not be available, and further details as to where this may be the case are available upon request in respect of this report. CS may provide various services to US municipal entities or obligated persons ("municipalities"), including suggesting individual transactions or trades and entering into such transactions. Any services CS provides to municipalities are not viewed as "advice" within the meaning of Section 975 of the Dodd-Frank Wall Street Reform and Consumer Protection Act. CS is providing any such services and related information solely on an arm's length basis and not as an advisor or fiduciary to the municipality. In connection with the provision of the any such services, there is no agreement, direct or indirect, between any municipality (including the officials,management, employees or agents thereof) and CS for CS to provide advice to the municipality. Municipalities should consult with their financial, accounting and legal advisors regarding any such services provided by CS. In addition, CS is not acting for direct or indirect compensation to solicit the municipality on behalf of an unaffiliated broker, dealer, municipal securities dealer, municipal advisor, or investment adviser for the purpose of obtaining or retaining an engagement by the municipality for or in connection with Municipal Financial Products, the issuance of municipal securities, or of an investment adviser to provide investment advisory services to or on behalf of the municipality. If this report is being distributed by a financial institution other than Credit Suisse AG, or its affiliates, that financial institution is solely responsible for distribution. Clients of that institution should contact that institution to effect a transaction in the securities mentioned in this report or require further information. This report does not constitute investment advice by Credit Suisse to the clients of the distributing financial institution, and neither Credit Suisse AG, its affiliates, and their respective officers, directors and employees accept any liability whatsoever for any direct or consequential loss arising from their use of this report or its content. Principal is not guaranteed. Commission is the commission rate or the amount agreed with a customer when setting up an account or at any time after that. Copyright © 2017 CREDIT SUISSE AG and/or its affiliates. All rights reserved.
Investment principal on bonds can be eroded depending on sale price or market price. In addition, there are bonds on which investment principal can be eroded due to changes in redemption amounts. Care is required when investing in such instruments.
When you purchase non-listed Japanese fixed income securities (Japanese government bonds, Japanese municipal bonds, Japanese government guaranteed bonds, Japanese corporate bonds) from CS as a seller, you will be requested to pay the purchase price only