Global Performance and Prospects for Beer
50
Global Performance and Prospects for Beer July 2011
-
Upload
adriana-fu-vivian -
Category
Documents
-
view
39 -
download
0
description
Complete file from Euromonitor about beer market around the world
Transcript of Global Performance and Prospects for Beer

Global Performance and Prospects for Beer
July 2011

© Euromonitor International
2
Alcoholic Drinks: Beer Overview
Introduction
Global Picture
Category Analysis
Regional Analysis
Channel Analysis
Competitive Environment
Prospects

© Euromonitor International
3
Alcoholic Drinks: Beer Overview
Learn More
To find out more about Euromonitor International's complete range of business intelligence on industries, countries and consumers please visit www.euromonitor.com or contact your local Euromonitor International office:
Disclaimer
Much of the information in this briefing is of a statistical
nature and, while every attempt has been made to ensure
accuracy and reliability, Euromonitor International cannot be
held responsible for omissions or errors
Figures in tables and analyses are calculated from unrounded data and may not sum. Analyses found in the briefings may not totally reflect the companies’ opinions, reader discretion is advised
London +44 (0)20 7251 8024 Chicago +1 312 922 1115 Singapore +65 6429 0590 Shanghai +86 21 6372 6288 Vilnius +370 5 243 1577
Dubai +971 4 372 4363 Cape Town +27 21 552 0037 Santiago +56 2 915 7200 Sydney +61 2 9275 8869 Tokyo: +81 3 5403 4790
Scope
Introduction
ALCOHOLIC DRINKS 239 bn litres
Wine 27 bn litres
Beer 187 bn litres
Lager Dark beer Stout Low/non-alcohol
beer
Spirits 20 bn litres
RTDs/ high-strength
premixes 3.9 bn litres
Cider/perry 1.8 bn litres

© Euromonitor International
4
Alcoholic Drinks: Beer Overview
• The core objective of this report is to examine the current state of the global beer industry, including the post-
recession fallout, recovering and beleaguered markets, and scenarios for growth moving forward.
• In addition to providing a global overview of market performance, the report also analyses:
• performance by product category;
• performance by geographic region;
• the state of the competitive landscape;
• performance by retail distribution channel;
• global prospects and opportunities.
• The data and analysis are specific to beer and the categories of lager, dark beer, stout and low/non-alcoholic beer.
• The global beer market is examined in terms of performance over the period 2010-2015, with a closer look at 2010
specifically, with graphics and analysis identifying key areas of risk and opportunity.
• The report does not claim to be comprehensive, focusing on key industry developments, but rather seeks to offer
high-level insight into key changes in the market at a time of manifest macroeconomic volatility.
Objectives
Introduction
© Euromonitor International
5
Alcoholic Drinks: Beer Overview
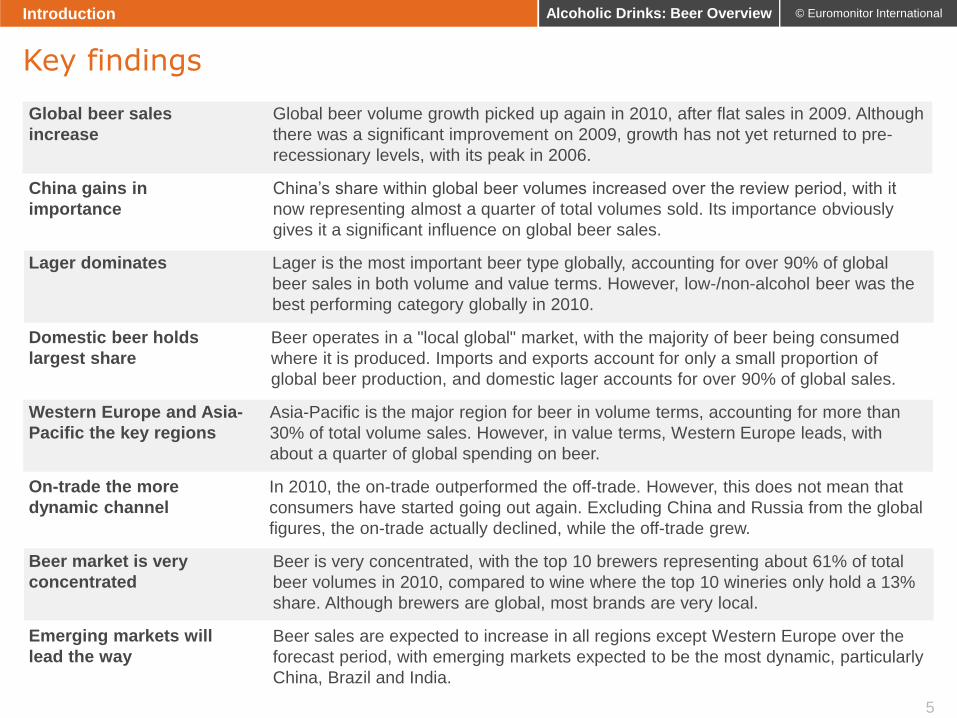
Global beer sales
increase
Global beer volume growth picked up again in 2010, after flat sales in 2009. Although
there was a significant improvement on 2009, growth has not yet returned to pre-
recessionary levels, with its peak in 2006.
China gains in
importance
China’s share within global beer volumes increased over the review period, with it
now representing almost a quarter of total volumes sold. Its importance obviously
gives it a significant influence on global beer sales.
Lager dominates Lager is the most important beer type globally, accounting for over 90% of global
beer sales in both volume and value terms. However, low-/non-alcohol beer was the
best performing category globally in 2010.
Domestic beer holds
largest share
Beer operates in a "local global" market, with the majority of beer being consumed
where it is produced. Imports and exports account for only a small proportion of
global beer production, and domestic lager accounts for over 90% of global sales.
Western Europe and Asia-
Pacific the key regions
Asia-Pacific is the major region for beer in volume terms, accounting for more than
30% of total volume sales. However, in value terms, Western Europe leads, with
about a quarter of global spending on beer.
On-trade the more
dynamic channel
In 2010, the on-trade outperformed the off-trade. However, this does not mean that
consumers have started going out again. Excluding China and Russia from the global
figures, the on-trade actually declined, while the off-trade grew.
Beer market is very
concentrated
Beer is very concentrated, with the top 10 brewers representing about 61% of total
beer volumes in 2010, compared to wine where the top 10 wineries only hold a 13%
share. Although brewers are global, most brands are very local.
Emerging markets will
lead the way
Beer sales are expected to increase in all regions except Western Europe over the
forecast period, with emerging markets expected to be the most dynamic, particularly
China, Brazil and India.
Key findings
Introduction

© Euromonitor International
6
Alcoholic Drinks: Beer Overview
Introduction
Global Picture
Category Analysis
Regional Analysis
Channel Analysis
Competitive Environment
Prospects

© Euromonitor International
7
Alcoholic Drinks: Beer Overview
0
2
4
6
8
10
12
14
145
150
155
160
165
170
175
180
185
190
2005 2006 2007 2008 2009 2010
% t
ota
l vo
lum
e g
row
th
Bill
ion
litre
s
Beer Total Volume Performance 2005-2010
Beer
Beer value growth
Beer volume growth
• Global beer volume growth picked up again in 2010, after flat sales in 2009, with volumes growing by over 1%. It
appears that recovery is on its way.
• Although 2010’s performance represented a significant improvement on 2009, growth has not returned to pre-
recessionary levels yet.
• Volumes stood at 187 billion litres in 2010, making beer the largest category in the alcoholic drinks industry
representing 78% of volume sales, compared to wine and spirits which represented 11% and 8%, respectively.
• The stagnation in 2009 and still relatively low growth in 2010 was mainly caused by Eastern Europe, North America
and the saturated Western European region, which all saw declines in both years.
Beer sales pick up in 2010 after the slowdown in 2009
Global Picture

© Euromonitor International
8
Alcoholic Drinks: Beer Overview
• China’s share in the global beer market has gradually increased over the past six years, from 19% in 2005 to 24% in
2010.
• As a result of China accounting for almost a quarter of the global beer market in 2010, it has a substantial impact on
the performance of the category globally.
• Western Europe has gradually been losing share within the global market, with its share declining from 18% in 2005
to 15% share in 2010, as beer becomes more and more saturated within the traditional beer consuming markets of
Western Europe.
• Global beer volume growth stood at 1% in 2010; however, excluding China global sales declined, highlighting the
importance of this one market.
-4
-2
0
2
4
6
8
10
12
14
16
2004/2005 2005/2006 2006/2007 2007/2008 2008/2009 2009/2010
% t
ota
l vo
lum
e g
row
th
Global and China Beer Growth 2005-2010
World
China
World excl. China
China impacts global beer volumes
Global Picture

© Euromonitor International
9
Alcoholic Drinks: Beer Overview
Introduction
Global Picture
Category Analysis
Regional Analysis
Channel Analysis
Competitive Environment
Prospects

© Euromonitor International
10
Alcoholic Drinks: Beer Overview Category Analysis
0%
10%
20%
30%
40%
50%
60%
70%
80%
90%
100%
2005 2006 2007 2008 2009 2010
Bill
ion
litre
s
Global Beer Performance by Category
Stout
Low/non-alcohol beer
Lager
Dark beer
• Lager is by far the most important beer
type, accounting for 93% of global beer
sales by volume and 91% by value in 2010.
• Although sales remain small compared to
lager, low-/non-alcohol beer was the best
performing category in beer in terms of both
volume and value growth in 2010, with
volume sales increasing by 6%, compared
to 1% for lager. The category benefits from
the current drive to consume less alcohol,
and stricter drink-driving regulations in
many countries.
• Stout is the smallest category in beer
representing less than 1% of beer volumes
in 2010. Falling consumption of stout in the
key markets of Ireland and the UK has
contributed to overall volume stagnation on
a global level.
• Although dark beer suffers from an old-
fashioned image in many traditional beer
drinking markets, it has seen growth
overall, driven by the popularity of wheat
beer among younger consumers looking for
sweeter and milder tastes, and also craft
beers, many of which are dark beers.
These are becoming increasingly popular in
developed markets, such as the US and the
UK.
Lager dominates the beer category
© Euromonitor International
11
Alcoholic Drinks: Beer Overview
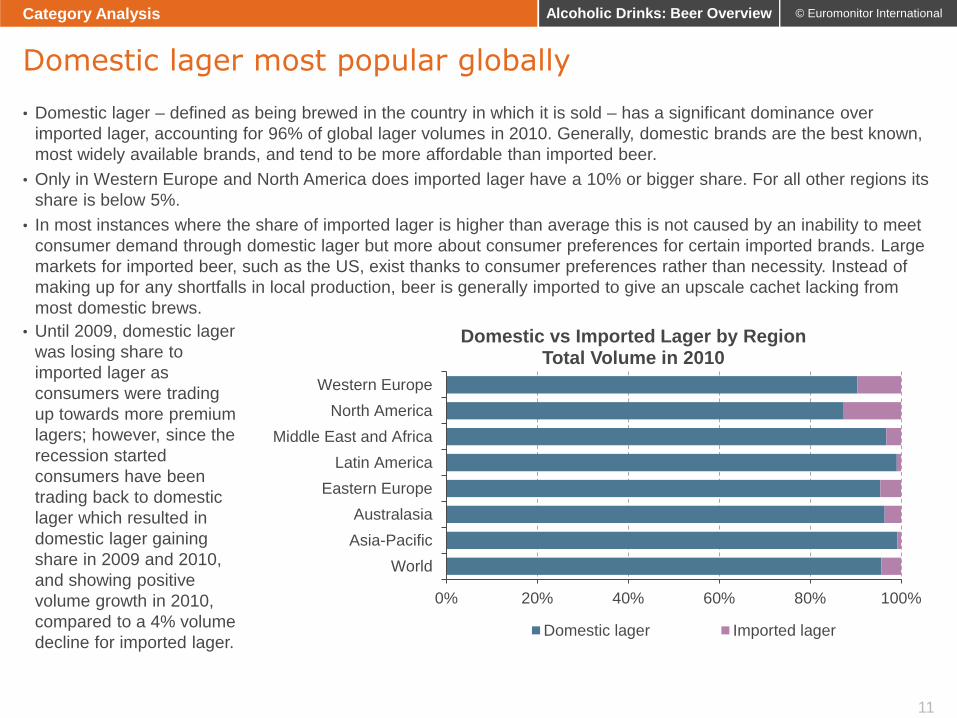
• Domestic lager – defined as being brewed in the country in which it is sold – has a significant dominance over
imported lager, accounting for 96% of global lager volumes in 2010. Generally, domestic brands are the best known,
most widely available brands, and tend to be more affordable than imported beer.
• Only in Western Europe and North America does imported lager have a 10% or bigger share. For all other regions its
share is below 5%.
• In most instances where the share of imported lager is higher than average this is not caused by an inability to meet
consumer demand through domestic lager but more about consumer preferences for certain imported brands. Large
markets for imported beer, such as the US, exist thanks to consumer preferences rather than necessity. Instead of
making up for any shortfalls in local production, beer is generally imported to give an upscale cachet lacking from
most domestic brews.
Domestic lager most popular globally
Category Analysis
0% 20% 40% 60% 80% 100%
World
Asia-Pacific
Australasia
Eastern Europe
Latin America
Middle East and Africa
North America
Western Europe
Domestic vs Imported Lager by Region Total Volume in 2010
Domestic lager Imported lager
• Until 2009, domestic lager
was losing share to
imported lager as
consumers were trading
up towards more premium
lagers; however, since the
recession started
consumers have been
trading back to domestic
lager which resulted in
domestic lager gaining
share in 2009 and 2010,
and showing positive
volume growth in 2010,
compared to a 4% volume
decline for imported lager.
© Euromonitor International
12
Alcoholic Drinks: Beer Overview
0.0% 20.0% 40.0% 60.0% 80.0% 100.0%
World
Asia-Pacific
Australasia
Eastern Europe
Latin America
Middle East and Africa
North America
Western Europe
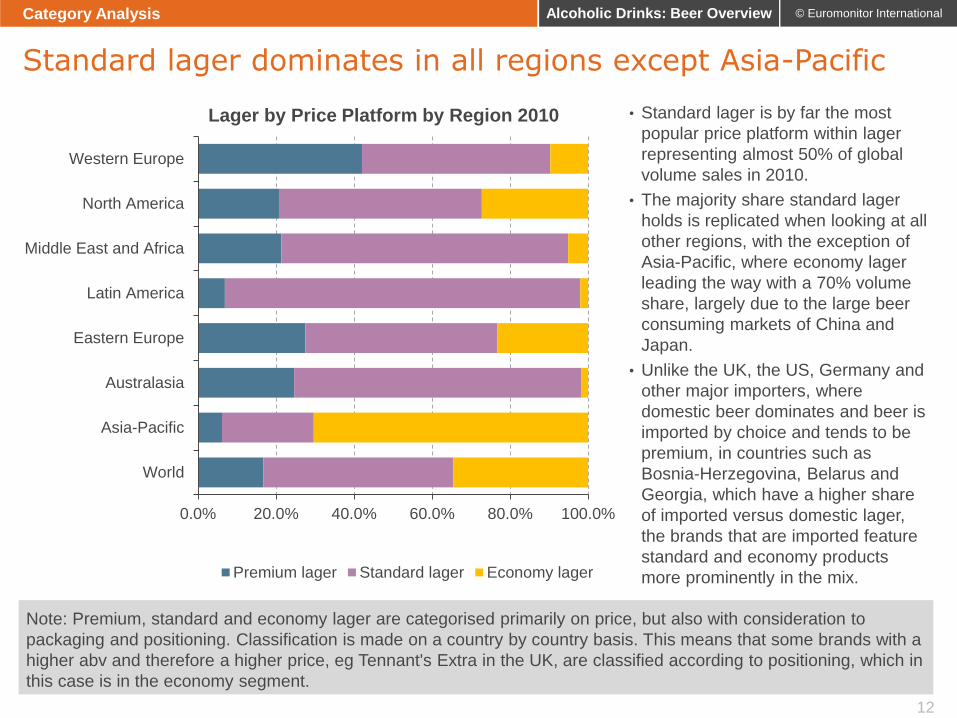
Lager by Price Platform by Region 2010
Premium lager Standard lager Economy lager
• Standard lager is by far the most
popular price platform within lager
representing almost 50% of global
volume sales in 2010.
• The majority share standard lager
holds is replicated when looking at all
other regions, with the exception of
Asia-Pacific, where economy lager
leading the way with a 70% volume
share, largely due to the large beer
consuming markets of China and
Japan.
• Unlike the UK, the US, Germany and
other major importers, where
domestic beer dominates and beer is
imported by choice and tends to be
premium, in countries such as
Bosnia-Herzegovina, Belarus and
Georgia, which have a higher share
of imported versus domestic lager,
the brands that are imported feature
standard and economy products
more prominently in the mix.
Standard lager dominates in all regions except Asia-Pacific
Category Analysis
Note: Premium, standard and economy lager are categorised primarily on price, but also with consideration to
packaging and positioning. Classification is made on a country by country basis. This means that some brands with a
higher abv and therefore a higher price, eg Tennant's Extra in the UK, are classified according to positioning, which in
this case is in the economy segment.

© Euromonitor International
13
Alcoholic Drinks: Beer Overview
-2
0
2
4
6
8
10
2004-05 2005-06 2006-07 2007-08 2008-09 2009-10
% t
ota
l vo
lum
e g
row
th
Lager Performance by Price Platform 2005-2010
Premium Lager Standard Lager Economy Lager
• While economy lager’s growth witnessed a marginal slowdown in 2010 compared to 2009, it consistently
outperformed both the standard and premium segments.
• Premium lager witnessed a relative resurgence in 2010, while standard lager continued facing significant hurdles.
The trading down of 2009 was thus replaced by a degree of polarisation in 2010.
• Polarisation was particularly evident in the US, where economy and premium lager saw growth in 2010, while
standard lager saw a 5% decline in total volume. Germany saw a similar trend to the US, with polarisation being
apparent in 2010.
Polarisation apparent in lager
Category Analysis

© Euromonitor International
14
Alcoholic Drinks: Beer Overview
• While recessionary pressures in mature markets appear to have largely bottomed out, the still subdued consumer
confidence levels, plummeting disposable incomes, the nature of the “jobless recovery” and persistent market
volatility have established thriftiness and bargain-hunting as defining characteristics of the “new consumer” in mature
markets.
• Economising can obviously take many forms beyond merely buying smaller quantities, ranging from purchases of
lower-end private label products to heavily discounted premium variants, and while the former is straightforward, the
latter goes hand-in-hand with the concept of value for money.
• Packaging reformulation is one of the ways that cost savings can be achieved. Larger and smaller sizes can either
reduce the average unit price or render affordable a product previously considered too expensive.
• At the same time, launches of products positioned at lower price points by leading manufacturers can mitigate
migration away from their flagship brands in times of austerity.
Polarisation: Economising in the age of austerity
Category Analysis
Brand name: Desperados
NBO : Heineken Entreprises
SAS
Market: France
Category: Lager
Launched: 2010
Comment: A large 1.2-litre
bottle to share: more
affordable and offering more
content than the standard
3x33cl pack
Brand name: Buck Range
NBO: Supervalu Inc
Market: US
Category: Lager
Launched: 2010
Comment: Taking on
brewing heavyweights, a
cheaper private label
alternative to the likes of
Bud Light and Coors Light
© Euromonitor International
15
Alcoholic Drinks: Beer Overview
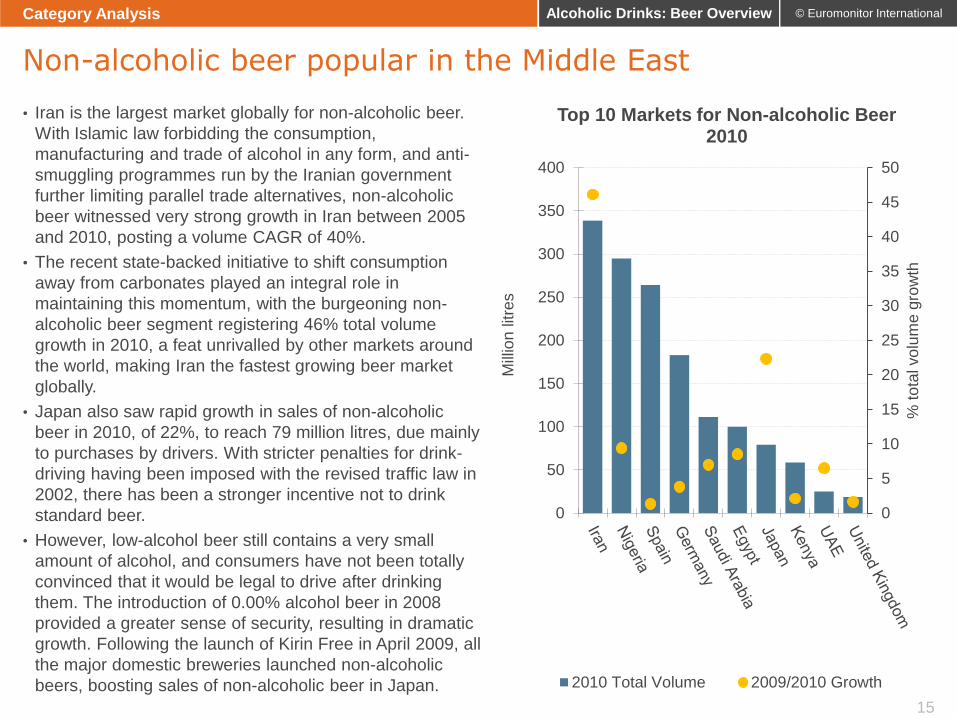
• Iran is the largest market globally for non-alcoholic beer.
With Islamic law forbidding the consumption,
manufacturing and trade of alcohol in any form, and anti-
smuggling programmes run by the Iranian government
further limiting parallel trade alternatives, non-alcoholic
beer witnessed very strong growth in Iran between 2005
and 2010, posting a volume CAGR of 40%.
• The recent state-backed initiative to shift consumption
away from carbonates played an integral role in
maintaining this momentum, with the burgeoning non-
alcoholic beer segment registering 46% total volume
growth in 2010, a feat unrivalled by other markets around
the world, making Iran the fastest growing beer market
globally.
• Japan also saw rapid growth in sales of non-alcoholic
beer in 2010, of 22%, to reach 79 million litres, due mainly
to purchases by drivers. With stricter penalties for drink-
driving having been imposed with the revised traffic law in
2002, there has been a stronger incentive not to drink
standard beer.
• However, low-alcohol beer still contains a very small
amount of alcohol, and consumers have not been totally
convinced that it would be legal to drive after drinking
them. The introduction of 0.00% alcohol beer in 2008
provided a greater sense of security, resulting in dramatic
growth. Following the launch of Kirin Free in April 2009, all
the major domestic breweries launched non-alcoholic
beers, boosting sales of non-alcoholic beer in Japan.
0
5
10
15
20
25
30
35
40
45
50
0
50
100
150
200
250
300
350
400
% t
ota
l vo
lum
e g
row
th
Mill
ion
litre
s
Top 10 Markets for Non-alcoholic Beer 2010
2010 Total Volume 2009/2010 Growth
Non-alcoholic beer popular in the Middle East
Category Analysis

© Euromonitor International
16
Alcoholic Drinks: Beer Overview
• Spain has emerged as the leader in the global rankings
for low-alcohol beer, with per capita consumption of 7
litres in 2010. Stricter drink-driving legislation, increasing
health awareness and a mature beer category in need of
innovation were the main growth drivers of the category
over the review period. However, as the economy
worsened and consumers drank less out of the home,
low-alcohol beer saw its volumes decline.
• In Russia, the second largest market, sales of low-
alcohol beer grew by 1% in 2010, making it the best
performing category. This increase in low-alcohol beer
was driven by two main factors – a ban on drinking
alcohol before driving and no increase in excise taxes,
as there was in lager.
• In the US, MillerCoors’ MGD 64 and Anheuser-Busch
InBev’s Select 55 have started an arms race to offer the
lowest calorie and carbohydrate products available.
These two products are marketed towards health- and
appearance-conscious consumers as “lighter” light
beers, with only 64 and 55 calories, respectively.
Premium imports have also taken notice of this trend,
with Red Stripe releasing a “light” version of its beer, and
both Heineken Premium Light and Corona Light
supported by advertising in 2010. A side effect of lower
calories and carbohydrates is a lower alcohol content in
the beer. As such, low-alcohol beer has surged in the
US, with total volume growth of 16% in 2010 – the
fastest among the top 10 markets by volume.
-10
-5
0
5
10
15
20
0
50
100
150
200
250
300
350
% t
ota
l vo
lum
e g
row
th
Mill
ion
litre
s
Top 10 Markets for Low-alcohol Beer 2010
2010 2009/2010 growth
Stricter drink-driving law aids low-alcohol beer
Category Analysis

© Euromonitor International
17
Alcoholic Drinks: Beer Overview
• While “health credentials” and “alcoholic drinks consumption” are rarely used in the same sentence, healthier or less
harmful alcoholic drinks propositions are increasingly finding favour.
• Such offerings seldom claim to promote health per se, but rather purport to moderate the negative effects of alcohol
consumption. They primarily targeting female consumers.
• Among health claims, low calorie and low carbohydrate content are the primary trends driving such propositions,
while attempts to promote functional attributes are still largely a niche, and products with such attributes account for
negligible volumes.
• Governments and independent health advocacy bodies around the world are putting increasing pressure on
manufacturers to provide lighter alternatives to their flagship brands, and at the same time demonstrate their
corporate responsibility credentials. Additionally, increasingly stringent drink-driving legislation is forcing the hands of
both manufacturers and consumers.
The health issue: Low calorie and low carbohydrate content
Category Analysis
Brand name: Stella
Artois Légère
NBO: Lion Nathan Ltd
Market: New Zealand
Category: Lager
Launched: 2010
Comment: Premium
low-carbohydrate beer
containing only half the
carbohydrates of the
standard variant
Brand name: Sol Cero
NBO: Colebrook SL
Market: Spain
Category: Non-alcoholic
beer
Launched: 2010
Comment: A non-
alcoholic extension of the
Mexican Sol brand,
providing social
responsibility credentials
to the company and a
practical alternative for
drivers
Brand name:
HeyDay
NBO: Khoshgovar
Mashhad Co
Market: Iran
Category: Non-
alcoholic beer
Launched: 2010
Comment: Addition
of mango and
raspberry flavours
to the line
© Euromonitor International
18
Alcoholic Drinks: Beer Overview
-6
-4
-2
0
2
4
6
8
10
12
0
200
400
600
800
1,000
1,200
1,400
1,600
% t
ota
l vo
lum
e g
row
th
Mill
ion
litre
s
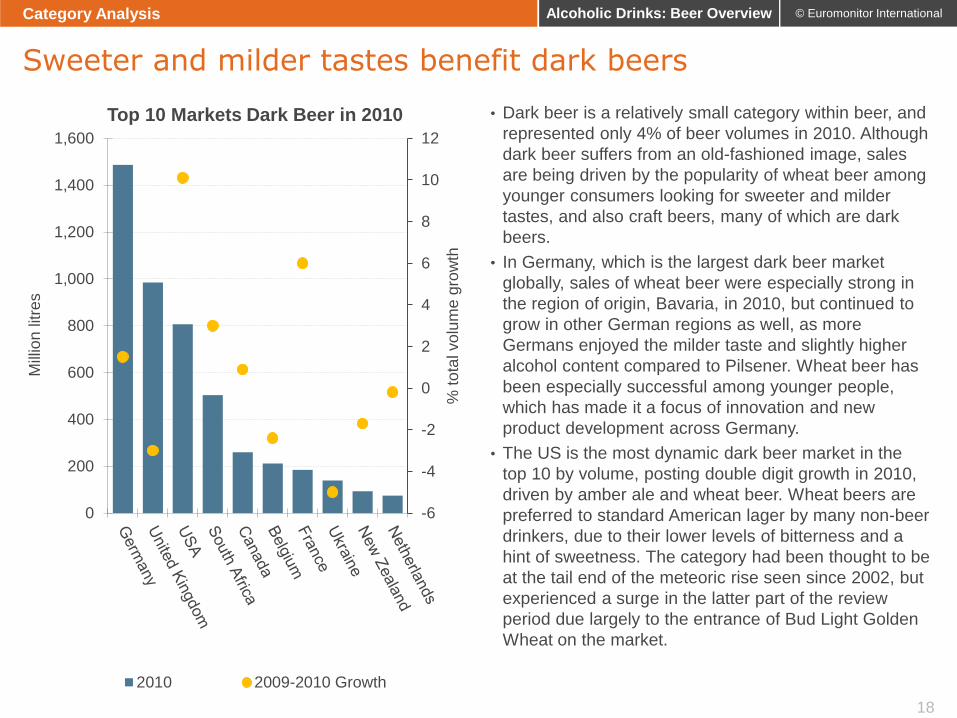
Top 10 Markets Dark Beer in 2010
2010 2009-2010 Growth
• Dark beer is a relatively small category within beer, and
represented only 4% of beer volumes in 2010. Although
dark beer suffers from an old-fashioned image, sales
are being driven by the popularity of wheat beer among
younger consumers looking for sweeter and milder
tastes, and also craft beers, many of which are dark
beers.
• In Germany, which is the largest dark beer market
globally, sales of wheat beer were especially strong in
the region of origin, Bavaria, in 2010, but continued to
grow in other German regions as well, as more
Germans enjoyed the milder taste and slightly higher
alcohol content compared to Pilsener. Wheat beer has
been especially successful among younger people,
which has made it a focus of innovation and new
product development across Germany.
• The US is the most dynamic dark beer market in the
top 10 by volume, posting double digit growth in 2010,
driven by amber ale and wheat beer. Wheat beers are
preferred to standard American lager by many non-beer
drinkers, due to their lower levels of bitterness and a
hint of sweetness. The category had been thought to be
at the tail end of the meteoric rise seen since 2002, but
experienced a surge in the latter part of the review
period due largely to the entrance of Bud Light Golden
Wheat on the market.
Sweeter and milder tastes benefit dark beers
Category Analysis

© Euromonitor International
19
Alcoholic Drinks: Beer Overview
-15
-10
-5
0
5
10
15
20
0
50
100
150
200
250
300
350
400
% t
ota
l vo
lum
e g
row
th
Mill
ion
litre
s
Top 10 Markets Stout 2010
2010 2009-2010 growth
• Nigeria overtook the UK and Ireland as
the top market for stout sales by volume
as far back as 2006 and 2004,
respectively, and by 2010, sales in the
country had reached 355 million litres.
• Marketing campaigns that successfully
used the platforms of football and music
to reach out to the massive consumer
pool of the Nigerian market were the
driving force behind the category's strong
gains over the review period.
• As in the UK and Ireland, Guinness
dominates the category in Nigeria,
accounting for 55% of sales in 2010.
• Italy is the most dynamic Western
European country among the top 10 in
2010, with stout enjoying 2% volume
growth. Italians are becoming more
interested in new types of beer, such as
dark beers and stout. This trend is being
fed by supermarkets, hypermarkets and
pubs, which are enhancing their portfolios
and increasing the space dedicated to
“special” beers. An increase in the
number of companies focused on special
beer imports, for example Eurosaga, has
contributed further to this.
Stout a Nigerian Staple
Category Analysis

© Euromonitor International
20
Alcoholic Drinks: Beer Overview
Introduction
Global Picture
Category Analysis
Regional Analysis
Channel Analysis
Competitive Environment
Prospects

© Euromonitor International
21
Alcoholic Drinks: Beer Overview
• Asia-Pacific and Western Europe are the
key regions for beer by both volume and
value.
• While Asia-Pacific is the major region in
volume terms (accounting for 34% of
global sales), value sales in the region
account for only 25% of global sales,
indicating the relatively low unit price of
beer in the region (economy lager makes
up the bulk of volumes, at 70% in 2010).
• Conversely, Western Europe accounts
for 15% of global volumes but 26% of
values, indicating the extent of
premiumisation in the region over the
review period. (Standard and premium
lager constituted 74% of volumes in
2010, and the region has a relatively high
share of other types of beer besides
lager compared to other regions.)
• Despite the large size of the Asia-Pacific
market, it offers potential for future
growth. As well as being the most
dynamic region in volume terms (average
annual growth of 7% between 2005 and
2010), per capita, consumption of beer,
at 17 litres, is well below the global
average (27 litres in 2010).
Asia-Pacific and Western Europe dominate
Regional Analysis
0%
10%
20%
30%
40%
50%
60%
70%
80%
90%
100%
2005 2010
Bill
ion
litre
s
Beer Total Volume by Region 2005 and 2010
Western Europe
North America
Middle East andAfrica
Latin America
Eastern Europe
Australasia
Asia-Pacific
© Euromonitor International
22
Alcoholic Drinks: Beer Overview
-8
-6
-4
-2
0
2
4
6
8
% t
ota
l vo
lum
e g
row
th
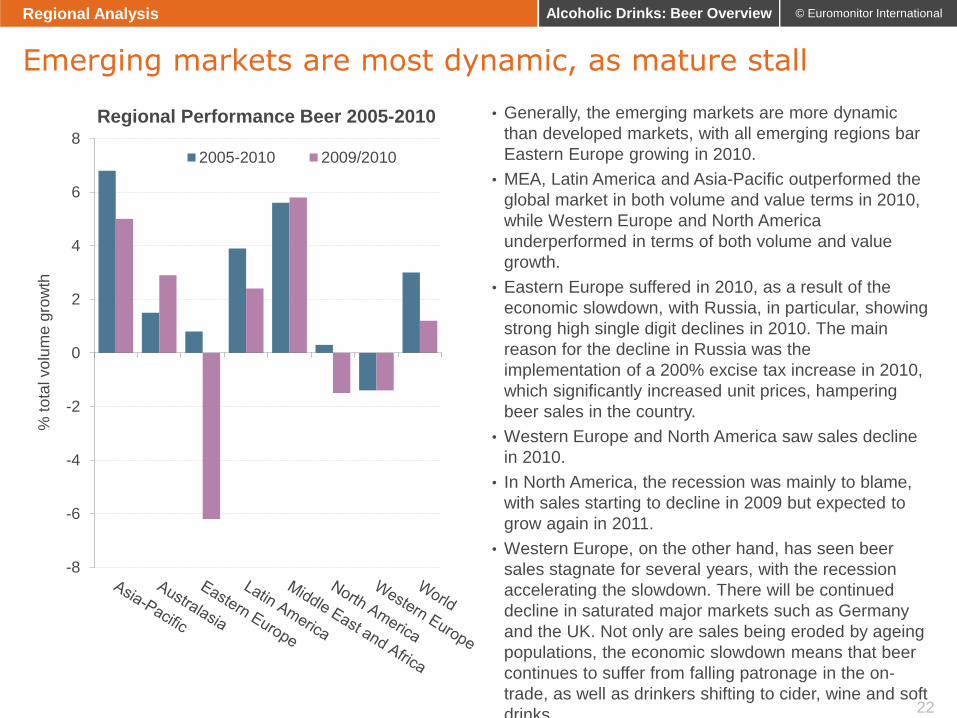
Regional Performance Beer 2005-2010
2005-2010 2009/2010
• Generally, the emerging markets are more dynamic
than developed markets, with all emerging regions bar
Eastern Europe growing in 2010.
• MEA, Latin America and Asia-Pacific outperformed the
global market in both volume and value terms in 2010,
while Western Europe and North America
underperformed in terms of both volume and value
growth.
• Eastern Europe suffered in 2010, as a result of the
economic slowdown, with Russia, in particular, showing
strong high single digit declines in 2010. The main
reason for the decline in Russia was the
implementation of a 200% excise tax increase in 2010,
which significantly increased unit prices, hampering
beer sales in the country.
• Western Europe and North America saw sales decline
in 2010.
• In North America, the recession was mainly to blame,
with sales starting to decline in 2009 but expected to
grow again in 2011.
• Western Europe, on the other hand, has seen beer
sales stagnate for several years, with the recession
accelerating the slowdown. There will be continued
decline in saturated major markets such as Germany
and the UK. Not only are sales being eroded by ageing
populations, the economic slowdown means that beer
continues to suffer from falling patronage in the on-
trade, as well as drinkers shifting to cider, wine and soft
drinks.
Emerging markets are most dynamic, as mature stall
Regional Analysis
© Euromonitor International
23
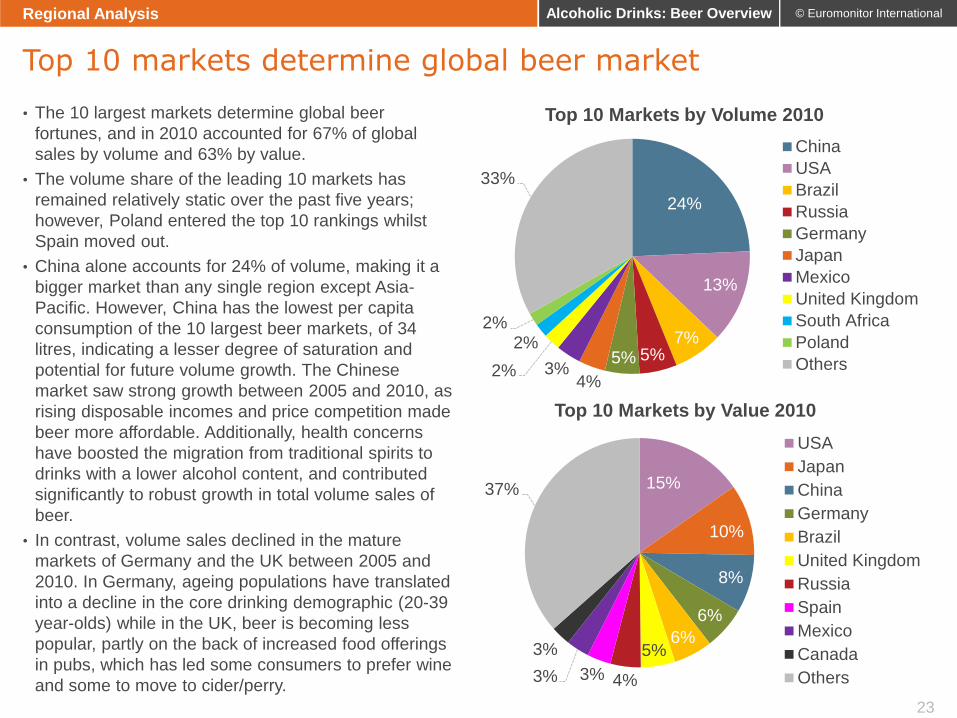
Alcoholic Drinks: Beer Overview
• The 10 largest markets determine global beer
fortunes, and in 2010 accounted for 67% of global
sales by volume and 63% by value.
• The volume share of the leading 10 markets has
remained relatively static over the past five years;
however, Poland entered the top 10 rankings whilst
Spain moved out.
• China alone accounts for 24% of volume, making it a
bigger market than any single region except Asia-
Pacific. However, China has the lowest per capita
consumption of the 10 largest beer markets, of 34
litres, indicating a lesser degree of saturation and
potential for future volume growth. The Chinese
market saw strong growth between 2005 and 2010, as
rising disposable incomes and price competition made
beer more affordable. Additionally, health concerns
have boosted the migration from traditional spirits to
drinks with a lower alcohol content, and contributed
significantly to robust growth in total volume sales of
beer.
• In contrast, volume sales declined in the mature
markets of Germany and the UK between 2005 and
2010. In Germany, ageing populations have translated
into a decline in the core drinking demographic (20-39
year-olds) while in the UK, beer is becoming less
popular, partly on the back of increased food offerings
in pubs, which has led some consumers to prefer wine
and some to move to cider/perry.
Top 10 markets determine global beer market
Regional Analysis
24%
13%
7% 5% 5%
4% 3% 2%
2% 2%
33%
Top 10 Markets by Volume 2010
China
USA
Brazil
Russia
Germany
Japan
Mexico
United Kingdom
South Africa
Poland
Others
15%
10%
8%
6%
6% 5%
4% 3% 3%
3%
37%
Top 10 Markets by Value 2010
USA
Japan
China
Germany
Brazil
United Kingdom
Russia
Spain
Mexico
Canada
Others

© Euromonitor International
24
Alcoholic Drinks: Beer Overview
Introduction
Global Picture
Category Analysis
Regional Analysis
Channel Analysis
Competitive Environment
Prospects

© Euromonitor International
25
Alcoholic Drinks: Beer Overview
-3
-2
-1
0
1
2
3
4
5
6
7
0
20
40
60
80
100
120
140
2005 2006 2007 2008 2009 2010
Bill
ion
litre
s
Global On-vs Off-trade Performance Beer 2005-2010
Off-trade volumes
On-trade volumes
Off-trade growth - Global
On-trade growth - Global
Off-trade growth - excl. China and Russia
On-trade growth - excl. China and Russia
• Both on-trade and off-trade alcoholic
drinks volume sales saw a bounce back
in 2010 after a slowdown in growth in
2009.
• The off-trade marginally outperformed
the on-trade over the review period, with
both channels taking a hit in 2009, when
the recession was at its peak.
• It is notable that in 2010, on-trade sales
grew faster than off-trade sales with this
trend expected to continue over the
forecast period.
• However, this does not mean that
consumers have started going out
again. If China and Russia were
excluded from the global figures, the off-
trade would see growth while the on-
trade would decline. This highlights the
importance of these two emerging
markets.
• The importance of Russia and China is
driven by the on-trade’s relative
advantage in absorbing the 200% tax
hike for beer in Russia and the rising
middle-class increasingly going out in
China. Nevertheless, these two markets
are the exception rather than the rule,
as the on-trade continues to suffer.
On-trade outperforms off-trade in 2010
Channel Analysis

© Euromonitor International
26
Alcoholic Drinks: Beer Overview
On-vs Off-trade performance by country in 2010
Channel Analysis
Note: The map denotes better performing channel (off-trade or on-trade) in 2010
Off-trade
On-trade
Key:

© Euromonitor International
27
Alcoholic Drinks: Beer Overview
-5 0 5 10
Internet retailing
Discounters
Supermarkets/hypermarkets
Independent smallgrocers
Convenience stores
Small groceryretailers
Food/drink/tobaccospecialists
Forecourt retailers
Other groceryretailers
Beer – Distribution Breakdown 2005-2010
% Off-trade volume CAGR 2005-2010
• Supermarkets/hypermarkets
and independent small
grocers remain the most
important off-trade channels
for beer, with 33% and 29%
shares of off-trade sales,
respectively, in 2010.
• Within store-based retailing,
discounters saw the highest
growth between 2005 and
2010.
• Discounters benefited from
consumers looking for value
for money, with their
economy proposition appeals
to cash-strapped consumers.
• Internet retailing was by far
the most dynamic channel
overall, having enjoyed near
double-digit annual average
growth over the review
period, benefiting, like
discounters, from consumers’
quest for value. Consumers
are looking for bargains and
bulk purchases, to which this
channel lends itself well.
Internet retailing the most dynamic channel
Channel Analysis
0
20
40
60
80
100
120
140
Bill
ion
litre
s
Global Beer Distribution by Channel
Non-store retailing
Other grocery retailers
Food/drink/tobacco specialists
Small grocery retailers
Discounters
Supermarkets/hypermarkets

© Euromonitor International
28
Alcoholic Drinks: Beer Overview
Introduction
Global Picture
Category Analysis
Regional Analysis
Channel Analysis
Competitive Environment
Prospects

© Euromonitor International
29
Alcoholic Drinks: Beer Overview
0
5,000
10,000
15,000
20,000
25,000
30,000
35,000
40,000
Bill
ion
litre
s
Top 10 Brewers 2009-2010
2009
2010
• AB-InBev is by far the largest
brewer globally, with a 19%
volume share in 2010: almost
double that of the second
biggest brewer, SABMiller,
which held a 10% share.
• Beer is very concentrated, with
the top 10 brewers representing
about 61% of total beer
volumes in 2010, compared to
wine, where the top 10 wineries
only hold a 13% share.
• Also, the wine rankings have
remained unchanged since
2005, unlike beer, where
consolidation has been going
on for several years, with the
acquisition of Anheuser Bush in
2008 by InBev, and Heineken
buying FEMSA in 2010.
• Heineken’s acquisition of
Femsa has made it the fastest
growing company in the
rankings with its volumes
increasing by 30% in 2010,
closing the gap to number two
brewer SABMiller.
One clear leader in a concentrated beer market
Competitive Environment

© Euromonitor International
30
Alcoholic Drinks: Beer Overview
0
1,000
2,000
3,000
4,000
5,000
6,000
7,000
8,000
9,000
Bill
ion
litre
s
Top 10 Beer Brands Globally – Total Volume
2009
2010
• Chinese beer brand Snow is the
leading beer brand globally holding a
5% total volume share in 2010. Its lead
is down to China’s importance in the
global beer market, holding a 24%
volume share of global beer sales.
• Snow, owned by China Resources
(CRE), is a very local brand, with its
sales concentrated in its home market.
This is not unusual as, unlike spirits
brands, which are more international
with major brands having an
international presence, beer brands
are relatively local, although brewers
are global.
• Budweiser and Heineken are
exceptions, with both brands having
significant international presence. This
is especially the case for Heineken,
with 40% of its sales volumes being
generated outside its home market of
the Netherlands, making it a truly
global brand.
• The next slide indicates how different
the coverage of CRE and Heineken is.
Chinese brand leads the pack
Competitive Environment

© Euromonitor International
31
Alcoholic Drinks: Beer Overview
Heineken vs China Resources' global presence in 2010
Competitive Environment
© Euromonitor International
32
Alcoholic Drinks: Beer Overview
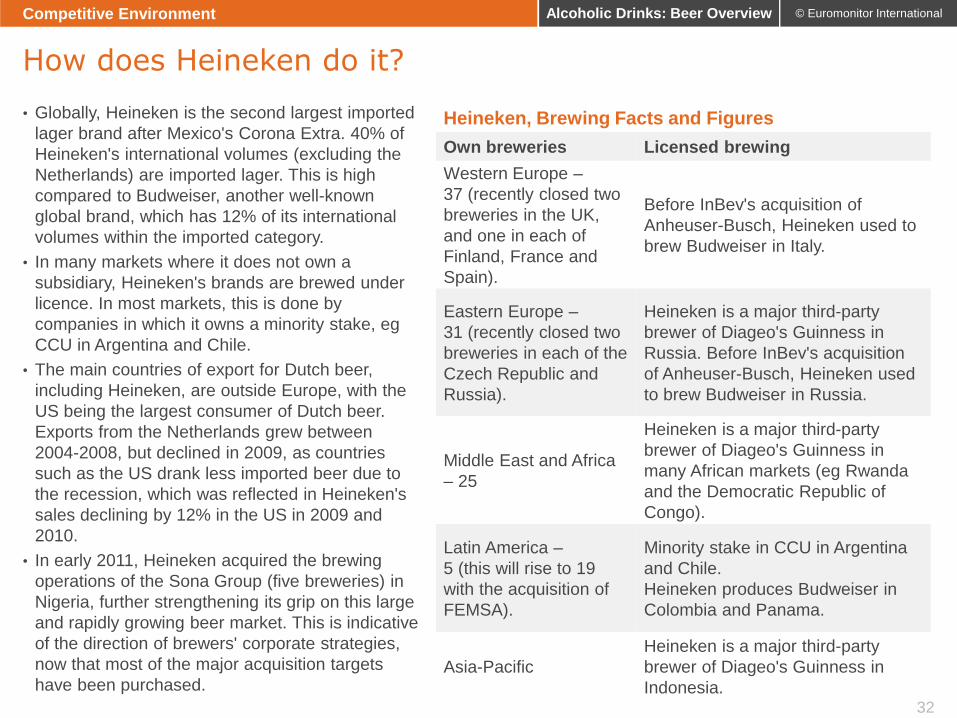
• Globally, Heineken is the second largest imported
lager brand after Mexico's Corona Extra. 40% of
Heineken's international volumes (excluding the
Netherlands) are imported lager. This is high
compared to Budweiser, another well-known
global brand, which has 12% of its international
volumes within the imported category.
• In many markets where it does not own a
subsidiary, Heineken's brands are brewed under
licence. In most markets, this is done by
companies in which it owns a minority stake, eg
CCU in Argentina and Chile.
• The main countries of export for Dutch beer,
including Heineken, are outside Europe, with the
US being the largest consumer of Dutch beer.
Exports from the Netherlands grew between
2004-2008, but declined in 2009, as countries
such as the US drank less imported beer due to
the recession, which was reflected in Heineken's
sales declining by 12% in the US in 2009 and
2010.
• In early 2011, Heineken acquired the brewing
operations of the Sona Group (five breweries) in
Nigeria, further strengthening its grip on this large
and rapidly growing beer market. This is indicative
of the direction of brewers' corporate strategies,
now that most of the major acquisition targets
have been purchased.
Heineken, Brewing Facts and Figures
Own breweries Licensed brewing
Western Europe –
37 (recently closed two
breweries in the UK,
and one in each of
Finland, France and
Spain).
Before InBev's acquisition of
Anheuser-Busch, Heineken used to
brew Budweiser in Italy.
Eastern Europe –
31 (recently closed two
breweries in each of the
Czech Republic and
Russia).
Heineken is a major third-party
brewer of Diageo's Guinness in
Russia. Before InBev's acquisition
of Anheuser-Busch, Heineken used
to brew Budweiser in Russia.
Middle East and Africa
– 25
Heineken is a major third-party
brewer of Diageo's Guinness in
many African markets (eg Rwanda
and the Democratic Republic of
Congo).
Latin America –
5 (this will rise to 19
with the acquisition of
FEMSA).
Minority stake in CCU in Argentina
and Chile.
Heineken produces Budweiser in
Colombia and Panama.
Asia-Pacific
Heineken is a major third-party
brewer of Diageo's Guinness in
Indonesia.
How does Heineken do it?
Competitive Environment

© Euromonitor International
33
Alcoholic Drinks: Beer Overview
• Until 2008, cider/perry was an undervalued niche category in the Netherlands, with limited volume growth. In 2008,
the country's dominant beer producer, Heineken, launched a new cider called Jillz, targeted primarily at women as
an alternative to wine and beer. The brand is expected to help volume sales and per capita consumption double
between 2008 and 2015, albeit from a small base. Heineken has achieved this by leveraging its distribution and
financial strength. The Jillz brand has seen very strong growth, and in 2010 accounted for around 50% of category
volumes.
• In 2010, Anheuser-Busch InBev launched Stella Cidre in a dynamic UK cider market, where cider sales are far more
dynamic than beer sales making it a logical step for the brewer.
• If any other brewer were to move into cider/perry, it could attempt something similar in the US and Canada, where
cider has a niche premium image, as well as in other Western European markets, such as Belgium, France and
Germany.
• One means to enter cider/perry would be through the acquisition of the world's third largest cider company, C&C,
which is a small independent player and publicly listed. C&C is already well established in the key cider/perry growth
markets of the UK and Ireland. Any volume gain would be relatively small in the short term and would require
considerable effort to develop brands, but in increasingly mature beer markets any growth is likely to be welcomed.
Potential for global brewers in cider/perry
Competitive Environment
0.0
0.2
0.4
0.6
0.8
0
2,000
4,000
6,000
8,000
10,000
12,000
14,000
2005 2006 2007 2008 2009 2010 2011 2012 2013 2014 2015
Pe
r ca
pita
co
nsu
mp
tio
n
(litre
s)
To
tal m
ark
et siz
e
('0
00
litre
s)
Cider/Perry Performance in the Netherlands 2005-2015
Total volume sales '000 litres Per capita consumption

© Euromonitor International
34
Alcoholic Drinks: Beer Overview
• The global beer market remains highly localised, with brewers constantly looking for new ventures and opportunities
to sustain growth in what is a relatively stagnant market overall. From China to Germany, brewers are facing
challenging market conditions, which vary by market and range from factors such as ageing and declining
populations to changing consumers preferences for other alcoholic drinks categories, such as wine, spirits, cider and
RTDs, to ongoing global economic uncertainty.
• Despite the different challenges currently faced in different markets, local and international brewers are all facing an
increasingly saturated market. As such, they will need to look to diversify, be it in the short, medium or long term.
• In Germany, the beer market is saturated, with consumers increasingly preferring lighter and “healthier” beers over
traditional varieties, thus many brewers have already expanded into the more lucrative malt-based RTDs category.
Malt-based variants boast a perceived healthier positioning and lower alcohol content, while consumers associating
such products with beer can provide a new direction for brewers.
• Similarly, in Russia, with increased pressure on the national beer market, due to a 200% excise tax increase, leading
to an almost 10% decline in 2010, brewers are looking to be less dependent on beer and find new growth areas. For
example, Baltika Breweries is launching products in new categories and focusing more on exports.
• Even in relatively high growth markets, such as China, brewers are looking further afield, with strategies to diversify
further their gradually maturing urban consumer base. Female-targeted products represent one option, as does
further expansion into underserved provincial and rural areas.
• .
Product diversification
• Within beer: moving into different categories; low/non- alcohol beer, premium lager, flavoured beer
• Within alcoholic drinks: cider, malt-based RTDs
• Outside alcoholic drinks: carbonates, bottled water, etc
Channel diversification
• On-trade focused: specific channels within on-trade, such as full-service restaurants
• Off-trade focused: non-store retailing vs store-based retailing – modern retailing vs traditional
Geographical diversification
• Urban vs rural
• Exports to more dynamic markets, with emerging markets in Africa and the Middle East, Latin America and Asia-Pacific offering the best growth opportunities
Opportunities for brewers: diversification is essential
Competitive Environment
© Euromonitor International
35
Alcoholic Drinks: Beer Overview
Introduction
Global Picture
Category Analysis
Regional Analysis
Channel Analysis
Competitive Environment
Prospects

© Euromonitor International
36
Alcoholic Drinks: Beer Overview
0
0.5
1
1.5
2
2.5
3
3.5
4
170,000
180,000
190,000
200,000
210,000
220,000
230,000
2010 2011 2012 2013 2014 2015
% g
row
th
Bill
ion
litre
s
Global Beer Market Forecast Performance
Beer Total Volume Total volume growth
• Global beer volumes are expected to continue to grow over the forecast period.
• The forecast total volume CAGR is 3% for 2010-2015, which is a slight improvement on the CAGR for the review
period, which stood at 3%, as the category sees sales picking up after the 2009 and 2010 slowdown caused by the
economic downturn.
• All regions are expected to see sales begin to increase again by the end of the forecast period, at the latest, after the
slowdown in the latter part of the review period.
• Western Europe is expected to take the longest to recover but will eventually see some growth again.
Beer volumes to increase over the forecast period
Prospects

© Euromonitor International
37
Alcoholic Drinks: Beer Overview
• As was the case during the review period,
non-alcoholic beer is set to be the most
dynamic beer category over the forecast
period, driven by the Middle East and
Africa, and in particular by Iran.
• Low-alcohol beer is seeing a marked
improvement on the review period, with
China being one of the most dynamic
countries as more flavoured and lower ABV
beers are on the market, targeting female
consumers. With economically independent
women becoming a much bigger group in
China, female consumers will become a
target market with greater potential. Hence,
manufacturers are likely to cater to female
consumers’ preferences with the launch of
more low-alcohol/non-alcoholic beers or
fruit-flavoured beers in the future.
• Lager’s forecast performance is similar to
its historic growth, mainly driven by Asia-
Pacific, which is forecast to grow by a 6%
CAGR in total volume terms between 2010
and 2015.
• The Middle East and Africa region will drive
stout’s and dark beer’s forecast growth,
with both categories showing an improved
or similar performance compared to the
review period.
Non-alcoholic beer continues to be most dynamic
Prospects
-2 0 2 4 6 8 10 12 14 16
Dark beer
Lager
Low-alcohol beer
Non-alcoholic beer
Stout
% total volume CAGR
Beer by Category Forecast Performance 2010-2015
Note: The filled bar is referring to 2010-2015 CAGR (forecast), the unfilled
bars refer to 2005-2010 CAGR (historic)

© Euromonitor International
38
Alcoholic Drinks: Beer Overview Prospects
Emerging markets set to remain most dynamic
Beer Forecasts by Country 2010-2015

© Euromonitor International
39
Alcoholic Drinks: Beer Overview
• Already the largest beer market in the world, China
will account for over half of global volume growth
between 2010 and 2015, and given that its per
capita consumption is still under half that of many
Western markets, this trend is set to continue.
• Therefore, having a strong presence in this market
is important; however, there are growth
opportunities in beer outside China.
• After China, Brazil will be the second most
dynamic beer market in terms of absolute volume
growth between 2010 and 2015, followed by India
and Vietnam.
• Emerging markets will be the main engine for beer
growth over the forecast period, with regions such
as Latin America and the Middle East and Africa
playing an important role. China will underpin the
dynamism of Asia-Pacific.
• Iran will be the most dynamic in percentage growth
terms despite the complete ban on alcoholic
drinks, with media coverage of the harmful effects
of cola carbonates offering growth potential for
non-alcoholic beer.
• The potential seen by brewers in these regions is
clearly evident when reviewing global brewers'
strategies.
• Opportunities also exist outside beer, with some
brewers looking to enter new categories.
0
5
10
15
20
25
30
35
0
500
1,000
1,500
2,000
2,500
3,000
3,500
Brazil India Vietnam Iran Nigeria
% C
AG
R 2
01
0-2
01
5
mill
ion
litre
s
Beer Opportunity Markets Outside China 2010-2015
2010-2015 Absolute Growth 2010-2015 CAGR
Growth Opportunities outside of China
Prospects

© Euromonitor International
40
Alcoholic Drinks: Beer Overview
• In 2010, beer benefited from increasing disposable
incomes among lower income brackets and a steady
employment rate, combined with the FIFA World Cup held
in South Africa, which boosted sales in June and July, a
period of the year when demand is typically lower
compared to the summer season.
• Increases in the purchasing power of most Brazilians, and
growing demand for higher quality products was evident
over the review period. As a result, alcoholic drinks
manufacturers invested in expanding their portfolios with
premium products, such as Cervejarias Kaiser do Brasil,
which introduced Amstel Pulse (Netherlands), Birra Moretti
(Italy), Edelweiss (Austria), Murphy’s Irish Stout and
Murphy’s Irish Red (Ireland) in early 2010, and Cervejaria
Petrópolis, which partnered with a German brewery to
produce and distribute Weltenburger beer.
• It is expected that consumers will continue to migrate to
more sophisticated products in the forecast period, as
disposable incomes continue to rise. The share of
households with a monthly disposable income over
US$750 is predicted to grow from 47% in 2010 to over
57% in 2015.
• Dark beer and premium lager will experience the fastest
growth, of 96% and 70%, respectively, in total volume
terms between 2010 and 2015. Greater investment in
these categories and growing demand for such products
among affluent consumers and the middle class are
expected to spur sales in the near future.
0 5 10 15 20
Dark beer
Premium lager
Beer
Standard lager
Low-/non-alcohol Beer
Economy lager
Brazil: Forecast Growth by Category 2010-2015
2010-15 CAGR %
Brazil beer sales driven by premiumisation
Prospects
Key point: Brazil offers great opportunities for brewers
as consumers are opting for more premium products
as disposable incomes are rising and urbanisation
continues. The northeast region of Brazil is a focus of
investment, as the area has benefited most from the
economic stability experienced in Brazil since
1998. It showed the fastest growth in GDP among
the regions of Brazil. The very young population of
Brazil, with the bulk being under 40 years, is also
favourable to brewers.

© Euromonitor International
41
Alcoholic Drinks: Beer Overview
Advancing middle classes key for growth in Brazil
Prospects

© Euromonitor International
42
Alcoholic Drinks: Beer Overview
• India is forecast to be the second fastest growing country for beer in absolute terms globally between 2010 and
2015. It is expected to add an extra 1.3 billion litres to its current market size of 1.7 billion litres by 2015. However,
although it is dynamic, beer consumption is still very low compared to Western markets. India’s per capita
consumption in 2015 is expected to be 2.4 litres, compared to the global average of 30 litres.
• Sales of beer are highest in South India, with over 30% of India’s beer volume sales. The hot climate makes beer a
favoured choice of South Indians. Andhra Pradesh and Tamil Nadu are the main contributors to South India’s beer
consumption. Strong lager, with around 8% abv, constitutes more than 70% of sales, while mild lager is more popular
in on-trade outlets in urban areas.
• International brands are expected to expand their shares considerably over the forecast period, as Indian consumers
become more discerning about their brand preferences. International products, including ales and
weissbier/weizen/wheat beer, are also expected to become more popular, particularly in the major cities, where
brands such as Hoegaarden, Little Devils and Geist proved popular in high-end on-trade outlets in 2010.
• Future growth is expected to be driven by small cities and towns in states such as Orissa and Madhya Pradesh,
which were under-penetrated by the major brewers over the review period. With increased availability in
supermarkets/hypermarkets, this will expand the occasions and locations for Indians to consume and purchase beer.
0
5
10
15
20
0
200
400
600
800
1,000
1,200
South India West India North India E and NEIndia
% t
ota
l vo
lum
e g
row
th
mill
ion
litre
s
India Beer Forecast by Region 2010-2015
2015 total volume 2010-2015 total volume CAGR
Opportunities in India for international brands and categories
Prospects
Key point: India has huge potential due to its
relatively low per capita consumption of beer
and its strong expected forecast growth, as
brewers are expected to increase their
penetration. However, it is worth noting that
India has issues with infrastructure and with
gross under-capacity for all forms of transport,
which hinders distribution. It also has a
complicated taxation system, which varies from
state to state. This, and the difficulty in setting
up production facilities nationally, caused by
byzantine regulations, could be big factors in
hindering development within beer.

© Euromonitor International
43
Alcoholic Drinks: Beer Overview
• The shift from traditional rice wine varieties to beer in the context of evolving westernisation trends was the main
driver of beer growth over the review period, which spearheaded alcoholic drinks growth.
• Volume sales of beer in Vietnam are expected to continue to grow between 2010 and 2015, at a 9% CAGR, on the
back of the long-term growth of the local economy, as well as changing consumer lifestyles, which are increasingly
influenced by Western culture.
Vietnam: Beer sales benefit from westernisation trend
Prospects
• With the increasing
number of more
educated consumers,
expatriates and
overseas students,
consumers will look for
products that suit their
taste, lifestyle and
status.
• At the same time,
consumers will also
seek drinks that have a
health and wellness
positioning or are low in
alcohol content for
social drinkers.
• Consequently, low-
alcohol beer is likely to
be introduced to the
market in the future to
meet this consumer
demand.

© Euromonitor International
44
Alcoholic Drinks: Beer Overview
• The integration of Vietnam into the WTO is opening more opportunities for investment and imports from foreign
companies, especially as its government is committed to reducing taxes levied on imported beer to 65% after joining
the WTO, and further reducing the rate to 35% in the next five years.
• Also, the country’s relatively young population, with a median age of just 28 in 2010, compared to Japan, where it is
45, offers good opportunities.
Prospects
Vietnam’s changing regulatory environment offers
Key point:
• Reinforcing “health and wellness” perceptions for beer will cement already buoyant growth rates, whilst also adding
value and raising profit margins.
• Imported beer will benefit in the medium and long term from the integration of Vietnam into the WTO and the
subsequent tax reductions.

© Euromonitor International
45
Alcoholic Drinks: Beer Overview
• With Islamic law forbidding the consumption, manufacturing and trade of alcohol in any form, and anti-smuggling
programmes run by the Iranian government further limiting parallel trade alternatives, non-alcoholic beer witnessed
strong growth in Iran over the review period, which is expected to continue over the forecast period.
• Forecast volume growth is expected to be at a 33% CAGR between 2010 and 2015, which makes Iran the fastest
growing country for beer. This will be driven entirely by non-alcoholic beer, and in actual terms it will add an extra one
billion litres to the global market.
• Non-alcoholic beer is expected to see an impressive performance in Iran, more than doubling its total volume sales
between 2010 and 2015. More young adults in Iran will switch to non-alcoholic beer, following widespread media
coverage suggesting that it as a better alternative to cola and other carbonates, and this will play a significant role in
most major players’ promotional activities. A number of international beverage companies, as well as some Iranian
soft drinks companies, have expressed interest in producing non-alcoholic beer, on the assumption that it could
become an alternative to standard carbonated soft drinks.
• The increasing number of supermarkets in Iran, together with growing westernisation and urbanisation trends, will be
the key reasons driving volume sales of foreign non-alcoholic beer over the forecast period. The shares of
multinationals, such as Carlsberg A/S, Bavaria NV and Heineken NV, are expected to grow slowly but steadily during
the 2010-2015 period, enhanced by their wider availability in major supermarkets and hotels all over the country.
• New entrants – both international beverage companies and some private Iranian soft drinks companies previously
operating only in soft drinks – are expected to be seen in non-alcoholic beer in Iran during the forecast period, on the
assumption that it could become an alternative to standard carbonated soft drinks. These players will aim to
persuade young Iranians to drink non-alcoholic beer instead of traditional carbonates, which is in line with the Iranian
government’s policy.
Iran the most dynamic beer market in terms of growth
Prospects
Key point: As the fastest growing beer market in percentage terms, Iran offers opportunities for non-alcoholic beer
manufacturers in the future, aided by increasing number of supermarkets and the growing westernisation and
urbanisation trends in the country, making it an increasingly attractive market for international producers.

© Euromonitor International
46
Alcoholic Drinks: Beer Overview
• Beer sales in Nigeria are set to grow by a 7% CAGR
between 2010 and 2015, adding an additional 907 million
litres to the global beer market.
• Growth will be particularly strong in dark beer and stout,
which are expected to grow by 19% and 11% CAGRs,
respectively, in total volume terms over the forecast
period.
• Although still relatively small compared to lager and stout,
dark beer is making inroads into the Nigerian beer market
because the high alcohol content and dark colour appeal
to many Nigerian consumers. In addition, dark beer
brands have attracted many consumers who typically
drink stout since they are of similar quality but are
cheaper.
• Polarisation is key for a country where 55% of households
live in poverty, while a niche socioeconomic elite is
adopting Western lifestyles and drinking habits. Focusing
on the lower and higher ends of the market with a diverse
product portfolio will guarantee the strongest returns
within alcoholic drinks.
• Any brewer that wants to be in the market has to have
local production, as there is a ban on imports of all
alcoholic drinks. This means that foreign brewers have
acquired breweries in Nigeria. For example, SABMiller
acquired Pabod Breweries Ltd and Voltic Nigeria Limited
in 2009, and has recently announced that it will invest
over US$100 million in building a new greenfield brewery
in Onitsha, in southeastern Nigeria.
Key point: Nigeria is on its way to becoming the largest
and fastest growing economy in Africa. Its population is
young and their disposable income will boom over the
forecast period, creating opportunities for beer.
However, this will also create challenges for brewers
and force them to segment their offer to more diverse
target groups. The one-dimensional, macho beer
drinker image is expected to evolve and adapt to cater
for women, older consumers or even expatriates, which
will provide further opportunities for beer in Nigeria
0
2
4
6
8
10
12
14
16
18
20
Beer Darkbeer
Lager Low-/non-
alcoholbeer
Stout
20
10
-20
15
CA
GR
%
Nigeria Beer by Category Forecast Performance
Nigeria – dark beer and stout most dynamic
Prospects

© Euromonitor International
47
Alcoholic Drinks: Beer Overview
• Emerging market potential is key,
but it is necessary to offset this with
strong operations in developed
markets with high profit margins.
• As brewers become increasingly
international, they are susceptible to
economic fluctuations in specific
markets.
• Having a balanced geographic
presence will enable companies to
mitigate declines.
• Similarly, brand portfolios should be
diverse enough to meet
macroeconomic conditions and
satisfy changing consumer
preferences.
China increasingly key
• Although still possessing
considerable potential for further
growth, China has already arrived
as a major market. Brewers must
target the next high growth areas,
such as Brazil, India, Iran, Nigeria
and Vietnam.
• India, with its low per capita
consumption, is an obvious target,
but there are other prospective
markets in Asia-Pacific, such as
Vietnam, and strong growth is
forecast in many African markets.
• Initial costs can be high, while
distribution and legislative factors
can be prohibitive, but the rewards
will be great in the long term.
Strong positions in emerging
markets
• Already the largest beer market in
the world, China will account for
over half of the global volume
growth between 2010 and 2015, and
given that its per capita consumption
is still under half that of many
Western markets, this trend is set to
continue.
• Having a strong presence in this
market is a necessity for the major
global brewers.
• Partnerships with local players have
for the most part dictated
operations, and whether
international players can instigate
buyouts will to a large extent be
dependent on government
legislation.
Geographic and portfolio
balance
Summary: Key future trends for brewers and beer
Prospects

© Euromonitor International
48
Alcoholic Drinks: Beer Overview
• Beer
An alcoholic drink usually brewed from malt, sugar, hops and water, and fermented with yeast. Some beers are
made by fermenting a cereal, especially barley, and are not flavoured by hops. Alcohol content for beer varies –
anything up to and even over 14% abv (alcohol by volume), although 3.5-5% is most common. Beer is often loosely
classified by the nature in which it is made: Top fermented (eg ales, bitters, wheat beers, stouts, porters etc) and
bottom fermented (eg all lagers). Pre-mixed beers, such as beer/lemonade, beer/whisky or beer/tequila mixes, are
excluded from the data. These are included in RTDs/high-strength premixes. Beer is the aggregation of lager, dark
beer, stout and LABs/NABs.
• Dark Beer
Included here are ales, bitter, wheat and sorghum beers. Ale is brewed using a warm fermentation (ie the beer is
fermented at a relatively warm temperature), while lager is fermented at lower temperatures, using a cool
fermentation. Bitters are ales. They are categorised by having a harder, bitter flavour (hence the name). Bitters tend
to be darker in colour, are usually less fizzy than lagers, and are generally drunk at warmer temperatures (just below
room temperature is typical). Major brands in Germany include Erdinger, Paulaner, Bindingerlager and Maisel. In the
US, Bass Ale and Molson Red Jack Ale. In the UK, John Smith’s, Boddingtons, Stones and Newcastle Brown Ale.
Also included are beers that have characteristics of other beers (for marketing purposes), such as Caffreys and
Calders sold in the UK, and Half and Half (from Suntory) sold in Japan. At country level, dark beer is broken down
into the main types within each country market.
• Low-Alcohol Beer
Low-alcohol beer is defined as beer with between 0.05% abv and 3% alcohol by volume (abv).
• Non-Alcoholic Beer
Non-alcohol beer has less than 0.05% abv.
• Stout
Stouts (and porters) are generally very dark, almost black, and often have a roasted coffee or burnt toast taste to
them. This is because the malt used in the brewing process is kilned or roasted until it is, literally, burnt. Kostritzer is
an example in Germany. In the UK, Guinness, Murphy’s, Beamish and Mackesons are examples.
Definitions I
Report Definitions

© Euromonitor International
49
Alcoholic Drinks: Beer Overview
• Lager
Lager is categorised primarily on price, but with consideration to packaging and positioning. This is the sum of the
following: imported premium/standard/economy lager and domestic premium/standard/economy lager.
• Premium Lager
Premium lager is categorised primarily on price, but with consideration to packaging and positioning. Premium lager
is classified on a country by country basis, therefore there is no set rule whereby all countries covered must deem
that any lager which is, for example, priced over 20% of the standard benchmark brand is necessarily premium. For
example, Tennant's Extra, in the UK, has a higher than average abv and therefore a higher price, but has a
positioning that places it in the economy segment. The classification of brands by premium/standard/economy can
be viewed through the brand shares link. Imported premium lager refers to lager that is brewed in a country other
than the one in which it is marketed.
• Standard Lager
Standard lager is categorised primarily on price, but with consideration to packaging and positioning. Brands within
standard lager are usually those which have the highest shares in the market. Standard lager is classified on a
country by country basis, therefore there is no set rule whereby all countries covered must adhere to the same price
classification. The classification of brands by premium/standard/economy can be viewed through the brand shares
link.
• Economy Lager
Economy products are at the bottom end of the price range. These will usually include private label (unless premium
private label brands have made inroads in the market) and unbranded products. Economy lager is categorised
primarily on price, but with consideration to packaging and positioning. Economy lager is classified on a country by
country basis, therefore there is no set rule whereby all countries covered must adhere to the same price
classification. For example, Tennant's Extra, in the UK, is classified as an economy lager because of its positioning in
the market, regardless of its higher than average abv and therefore higher price. The classification of brands by
premium/standard/economy can be viewed through the brand shares link.
Definitions II
Report Definitions

© Euromonitor International
50
Alcoholic Drinks: Beer Overview
• This research from Euromonitor International is part of a global strategic intelligence system which offers a complete
picture of the commercial environment. Also available from Euromonitor International:
Experience more...
Global Briefings Global Company Profiles Country Market Insight Reports
Interactive Statistical Database Strategy Briefings Learn More
The state of the market globally and regionally, emerging trends and pressing industry issues: timely, relevant insight published every month.
The competitive positioning and strategic direction of the leading companies including uniquely sector-specific sales and share data.
The key drivers influencing the industry in each country; comprehensive coverage of supply-side and demand trends and how they shape the future outlook.
Market sizes, market shares, distribution channels and forecasts; the complete market analysed at levels of category detail beyond any other source.
Executive debate on the global trends changing the consumer markets of the future.
To find out more about Euromonitor International's complete range of business intelligence on industries, countries and consumers please visit www.euromonitor.com or contact your local Euromonitor International office:
London + 44 (0)20 7251 8024
Chicago +1 312 922 1115
Singapore +65 6429 0590
Shanghai +86 21 6372 6288
Vilnius +370 5 243 1577
Cape Town + 27 21 552 0037
Dubai +971 4 372 4363
Santiago +56 2 915 7200
Sydney +61 2 9275 8869
Tokyo +81 3 5403 4790