Global overview of the applications of the Ecopath … 302 (2015) 42–53 Contents lists available...
12
Ecological Modelling 302 (2015) 42–53 Contents lists available at ScienceDirect Ecological Modelling j ourna l h omepa ge: www.elsevier.com/locate/ecolmodel Global overview of the applications of the Ecopath with Ecosim modeling approach using the EcoBase models repository Mathieu Colléter a,b,∗,1 , Audrey Valls a,1,2 , Jérôme Guitton b , Didier Gascuel b , Daniel Pauly a , Villy Christensen a a Fisheries Centre, University of British Columbia, 2202 Main Mall, V6T1Z4 Vancouver, BC, Canada b Université Européenne de Bretagne, Agrocampus Ouest, UMR985 Ecologie et Santé des Ecosystèmes, 65 rue de Saint-Brieuc, F-35042 Rennes, France a r t i c l e i n f o Article history: Received 22 August 2014 Received in revised form 23 January 2015 Accepted 29 January 2015 Available online 28 February 2015 Keywords: EcoBase Ecopath with Ecosim Ecosystem model Food web Metadata Information repository a b s t r a c t The ‘Ecopath’, later expanded to ‘Ecopath with Ecosim’ (‘EwE’), modeling approach has been applied to hundreds of ecosystems around the world, since its first implementation in 1984. The ‘EcoBase’ model repository was developed to gather EwE models published worldwide. For the 433 unique models doc- umented in EcoBase, we compiled, standardized, and analyzed all available metadata describing critical aspects of the models. We proposed a general description of the EwE applications and we analyzed their evolution over the last 30 years, based on the year of publication of the models. Then, we performed a correspondence analysis on the metadata to identify the main types of EwE models. Overall, most models were built to analyze ecosystem functioning and fisheries, principally in the Northern and Central Atlantic Ocean. During the first decade (1984–1993), most EwE applications were Ecopath models representing tropical marine systems and using simple food web representations to analyze trophic functioning only. Over the last two decades (1994–2014), EwE models were applied to study a wider variety of ecosystems, including polar regions and terrestrial systems, and a wider range of research topics , including pollution, aquaculture and Marine Protected Areas. The modeling practices also evolved toward Ecopath (but also Ecosim and Ecospace) models with larger spatial scales, shorter temporal scales, and more complex rep- resentations of the food web. In parallel, the numbers of both publications and modelers have steadily increased, while the proportion of journal articles presenting EwE-based studies has been growing. The correspondence analysis confirmed these trends and discriminated three types of models: the basic Eco- path models developed during the first decade, the average models developed over the last two decades using Ecopath and Ecosim routines and an intermediate number of groups, and the most elaborated models including Ecospace simulations and a high number of groups with multi-stanza. We concluded by discussing the challenges and potentials of the compilation and meta-analysis of EwE models, notably by using the EcoBase repository. This global overview showed that the usage of and interest for the EwE modeling approach in the scientific community had evolved and expended over the last three decades to support ecosystem-based fishery management. © 2015 Elsevier B.V. All rights reserved. 1. Introduction The Life Sciences have reached a new era, that of the ‘Big New Biology’ (Thessen and Patterson, 2011). Ecology is following a ∗ Corresponding author at: Fisheries Centre, University of British Columbia, 2202 Main Mall, V6T1Z4 Vancouver, BC, Canada. E-mail addresses: m.colleter@fisheries.ubc.ca (M. Colléter), [email protected] (A. Valls). 1 Co-first authors. 2 Present address: Centre for Biodiversity Theory and Modelling, Station d’Ecologie Expérimentale du CNRS, 2 route du CNRS, 09200 Moulis, France. similar path, and has turned into a ‘data-intensive science’ (Kelling et al., 2009; Michener and Jones, 2012). Ecological studies are more and more based on data-driven methodologies, relying on large pre-existing datasets and allowing for new insights on complex or underlying phenomena at global scale (e.g., Christensen et al., 2009b). A popular example of open-access, digital and cross- disciplinary database in aquatic ecology is FishBase, the online encyclopedia of fishes (www.fishbase.org). However, extensive data sharing is still rare in Life Sciences, and ecology has not yet joined the other historical “big” sciences, such as oceanog- raphy, meteorology or astronomy, where massive data-sharing is the norm (Pauly, 1995; Edwards, 2010; Hampton et al., 2013). Although incentives for digitization of non-digital materials have http://dx.doi.org/10.1016/j.ecolmodel.2015.01.025 0304-3800/© 2015 Elsevier B.V. All rights reserved.
Transcript of Global overview of the applications of the Ecopath … 302 (2015) 42–53 Contents lists available...

Gm
MDa
b
a
ARRAA
KEEEFMI
1
B
M
a
d
h0
Ecological Modelling 302 (2015) 42–53
Contents lists available at ScienceDirect
Ecological Modelling
j ourna l h omepa ge: www.elsev ier .com/ locate /eco lmodel
lobal overview of the applications of the Ecopath with Ecosimodeling approach using the EcoBase models repository
athieu Collétera,b,∗,1, Audrey Vallsa,1,2, Jérôme Guittonb, Didier Gascuelb,aniel Paulya, Villy Christensena
Fisheries Centre, University of British Columbia, 2202 Main Mall, V6T1Z4 Vancouver, BC, CanadaUniversité Européenne de Bretagne, Agrocampus Ouest, UMR985 Ecologie et Santé des Ecosystèmes, 65 rue de Saint-Brieuc, F-35042 Rennes, France
r t i c l e i n f o
rticle history:eceived 22 August 2014eceived in revised form 23 January 2015ccepted 29 January 2015vailable online 28 February 2015
eywords:coBasecopath with Ecosimcosystem modelood webetadata
nformation repository
a b s t r a c t
The ‘Ecopath’, later expanded to ‘Ecopath with Ecosim’ (‘EwE’), modeling approach has been applied tohundreds of ecosystems around the world, since its first implementation in 1984. The ‘EcoBase’ modelrepository was developed to gather EwE models published worldwide. For the 433 unique models doc-umented in EcoBase, we compiled, standardized, and analyzed all available metadata describing criticalaspects of the models. We proposed a general description of the EwE applications and we analyzed theirevolution over the last 30 years, based on the year of publication of the models. Then, we performed acorrespondence analysis on the metadata to identify the main types of EwE models. Overall, most modelswere built to analyze ecosystem functioning and fisheries, principally in the Northern and Central AtlanticOcean. During the first decade (1984–1993), most EwE applications were Ecopath models representingtropical marine systems and using simple food web representations to analyze trophic functioning only.Over the last two decades (1994–2014), EwE models were applied to study a wider variety of ecosystems,including polar regions and terrestrial systems, and a wider range of research topics , including pollution,aquaculture and Marine Protected Areas. The modeling practices also evolved toward Ecopath (but alsoEcosim and Ecospace) models with larger spatial scales, shorter temporal scales, and more complex rep-resentations of the food web. In parallel, the numbers of both publications and modelers have steadilyincreased, while the proportion of journal articles presenting EwE-based studies has been growing. Thecorrespondence analysis confirmed these trends and discriminated three types of models: the basic Eco-path models developed during the first decade, the average models developed over the last two decadesusing Ecopath and Ecosim routines and an intermediate number of groups, and the most elaborated
models including Ecospace simulations and a high number of groups with multi-stanza. We concludedby discussing the challenges and potentials of the compilation and meta-analysis of EwE models, notablyby using the EcoBase repository. This global overview showed that the usage of and interest for the EwEmodeling approach in the scientific community had evolved and expended over the last three decadesto support ecosystem-based fishery management.. Introduction
The Life Sciences have reached a new era, that of the ‘Big Newiology’ (Thessen and Patterson, 2011). Ecology is following a
∗ Corresponding author at: Fisheries Centre, University of British Columbia, 2202ain Mall, V6T1Z4 Vancouver, BC, Canada.
E-mail addresses: [email protected] (M. Colléter),[email protected] (A. Valls).1 Co-first authors.2 Present address: Centre for Biodiversity Theory and Modelling, Station’Ecologie Expérimentale du CNRS, 2 route du CNRS, 09200 Moulis, France.
ttp://dx.doi.org/10.1016/j.ecolmodel.2015.01.025304-3800/© 2015 Elsevier B.V. All rights reserved.
© 2015 Elsevier B.V. All rights reserved.
similar path, and has turned into a ‘data-intensive science’ (Kellinget al., 2009; Michener and Jones, 2012). Ecological studies are moreand more based on data-driven methodologies, relying on largepre-existing datasets and allowing for new insights on complexor underlying phenomena at global scale (e.g., Christensen et al.,2009b). A popular example of open-access, digital and cross-disciplinary database in aquatic ecology is FishBase, the onlineencyclopedia of fishes (www.fishbase.org). However, extensivedata sharing is still rare in Life Sciences, and ecology has not
yet joined the other historical “big” sciences, such as oceanog-raphy, meteorology or astronomy, where massive data-sharingis the norm (Pauly, 1995; Edwards, 2010; Hampton et al., 2013).Although incentives for digitization of non-digital materials have
al Mo
bme
adYftoitdR2tiMiiTooia2
mmaa2sEpbmfit(oEseTtw
hssssktfsoEembiao1
M. Colléter et al. / Ecologic
een growing, existing repositories, such as FishBase, were esti-ated to represent less than 1% of the data in ecology (Reichman
t al., 2011; Thessen and Patterson, 2011).Data sharing is a required principle for independent verification
nd reuse (Vision, 2010), and published papers which make theirata available are cited more frequently (Piwowar et al., 2007).et, the open-access principle of sharing information online for
ree has been increasingly applied to publications, but much lesso data, mainly due to issues with recognition and sense of datawnership (Vision, 2010; Thessen and Patterson, 2011). Data shar-ng is not a tradition in ecology and faces multiple sociological andechnological obstacles. Overall, new practices are needed to makeata sharing fully part of the culture in Life Sciences (Pauly, 1988;eichman et al., 2011; Thessen and Patterson, 2011; Dalgleish et al.,012; Hampton et al., 2013). The two critical stages at which prac-ices have to be improved to allow for data sharing are the very first,.e., the collection of the data, and the very last, i.e., their publication.
ost of the time, biological data are not being collected with reusen mind and are then published in a narrative or summarized stylen scientific articles (Vision, 2010; Thessen and Patterson, 2011).he actual data are meant to be provided in online supplementsr upon individual requests sent to the authors, but these optionsften remain unreliable (Vision, 2010). Also, extensive data shar-ng may solve – at least in part – the problem of data loss, suchs hard-copies or computer files in outmoded format (Zeller et al.,005).
While facing the challenges of open data, ecology is more andore relying on modeling-based approaches to inform manage-ent. In aquatic ecology, the Ecopath with Ecosim (EwE) modeling
pproach has been widely applied to inform ecosystem-based man-gement (e.g., Jarre-Teichmann, 1998; Plagányi and Butterworth,004; Christensen and Walters, 2011; Coll and Libralato, 2012),ince its original development in the early 1980s (Polovina, 1984).wE is commonly described as an ecosystem model, and morerecisely corresponds to a quantitative, process-based and species-ased model, representing trophic flows in the ecosystem. The EwEodeling approach was primarily developed as a tool-box to help
sheries management and answer ‘what if’ questions about policyhat could not be addressed with single-species assessment modelsPauly et al., 2000; Christensen and Walters, 2004, 2011). Detailsn the core principles and equations of EwE can be found in thewE user guide available online (Christensen et al., 2008). The EwEoftware is user-friendly, free (under the terms of the GNU Gen-ral Public License) and downloadable online (www.ecopath.org).hus, hundreds of EwE models representing aquatic (but also someerrestrial) ecosystems have been developed and published world-ide.
Building an EwE model require the collection, compilation andarmonization of various types of information: descriptive data onpecies abundance, diet composition and catch; computed data onpecies production, consumption and ecosystem properties; andimulation data on species biomass trends, after applying alternatecenarios (Christensen et al., 2008). By summarizing all availablenowledge on the modeled ecosystems and deriving various sys-em properties, EwE models help understanding the structure andunctioning of ecosystems (Walters et al., 1997). Thus, EwE-basedtudies may be seen as important sources of information. On topf detailed information on the modeled species and food web, eachwE-based study also provides a general description of the modeledcosystem, which represents critical information to reuse theodel for performing meta-analyses. Several meta-analyses have
een performed based on a selection of EwE models, and focus-
ng, either on ecological and trophic concepts (e.g., Christensennd Pauly, 1993a; Gascuel et al., 2008; Arreguín-Sánchez, 2011), orn ecosystems and species of particular interest (e.g., Christensen,995; Christensen et al., 2003a,b; Pauly et al., 2009). However,delling 302 (2015) 42–53 43
only few meta-analyses have been using large collections (morethan 50) of EwE models (e.g., Coll et al., 2012; Pikitch et al., 2012;Heymans et al., 2014). These meta-analyses were based on indi-vidual datasets since no comprehensive, open-access, and digitalcollection of EwE models was available, and this is why EcoBase wascreated. EcoBase is an online information repository of EwE mod-els published worldwide in the scientific literature (see website athttp://sirs.agrocampus-ouest.fr/EcoBase/).
In this study, we used EcoBase to compile available metadata onall the EwE models referenced in the repository. We analyzed themetadata to give a global overview of the applications of the EwEmodeling approach in the scientific literature. We focused on somecritical aspects: the general characteristics of the modeled ecosys-tems, the objectives of the EwE-based studies, the complexity andscope of the models, and the associated publication(s). First, weproposed a general description of the EwE applications publishedworldwide. Then, based on the year of publication of the models, weanalyzed in detail the evolution of the EwE applications over the lastthree decades. Last, we performed a correspondence analysis on themetadata so as to formalize the relationships observed betweensome of the critical metadata and identify the main types of EwEmodels. We concluded with a discussion on the challenges andpotentials of compiling metadata from EwE models and conductingmeta-analyses, notably by using EcoBase. We intended to providenew insights on past, present and future usages of and interests forthe EwE modeling approach in the scientific community.
2. Methods
2.1. Compilation of the models and publications
2.1.1. Compilation of 433 EwE modelsThe EcoBase project was initiated to support and stimulate
data sharing and global meta-analyses using the EwE modelingapproach. The EcoBase models repository was developed withthe intention of making the models discoverable, accessible, andreusable to the scientific community. Details on the structure, usageand capabilities of EcoBase can be found in the report introducingEcoBase, which is available online (Colléter et al., 2013b). The maingoals of EcoBase are to (i) provide a comprehensive and up-to-datelist of published EwE models and EwE-based applications; (ii) com-pile and present information from the referenced EwE models; (iii)facilitate future meta-analyses based on EwE models.
In EcoBase, we completed an inventory of all EwE modelspublished from 1984 to 2014 (Colléter et al., 2013b). Our inven-tory intended to be as exhaustive as possible, although somemodels may be missing, especially if they were published afterOctober 2013 (date of the publication of the EcoBase reposi-tory). The EwE modeling approach and software consists of asuite of three sub-models (or routines): (i) Ecopath, a static anddescriptive model, representing a mass-balanced snapshot of thefood web; (ii) Ecosim, a dynamic and predictive model, produc-ing time-dynamic simulations for exploring alternative scenarios,based on Ecopath; and (iii) Ecospace, a spatially-explicit version ofEcosim (Christensen and Pauly, 1992; Walters et al., 1997, 1999;Christensen and Walters, 2004). In EcoBase, ‘EwE models’ primar-ily designate Ecopath models, based on which Ecosim or Ecospacemodels may have been developed later on.
We extracted a list of 433 ‘unique’ EwE models from the 571models recorded in EcoBase, since several versions of the samemodel were recorded in some cases. Unique models were defined
by the ecosystem they represented (i.e., the model area), the timeperiod they covered (i.e., the model start and end years), andthe author of the model (i.e., the first author on the referenceof the model, commonly considered as the modeler who developed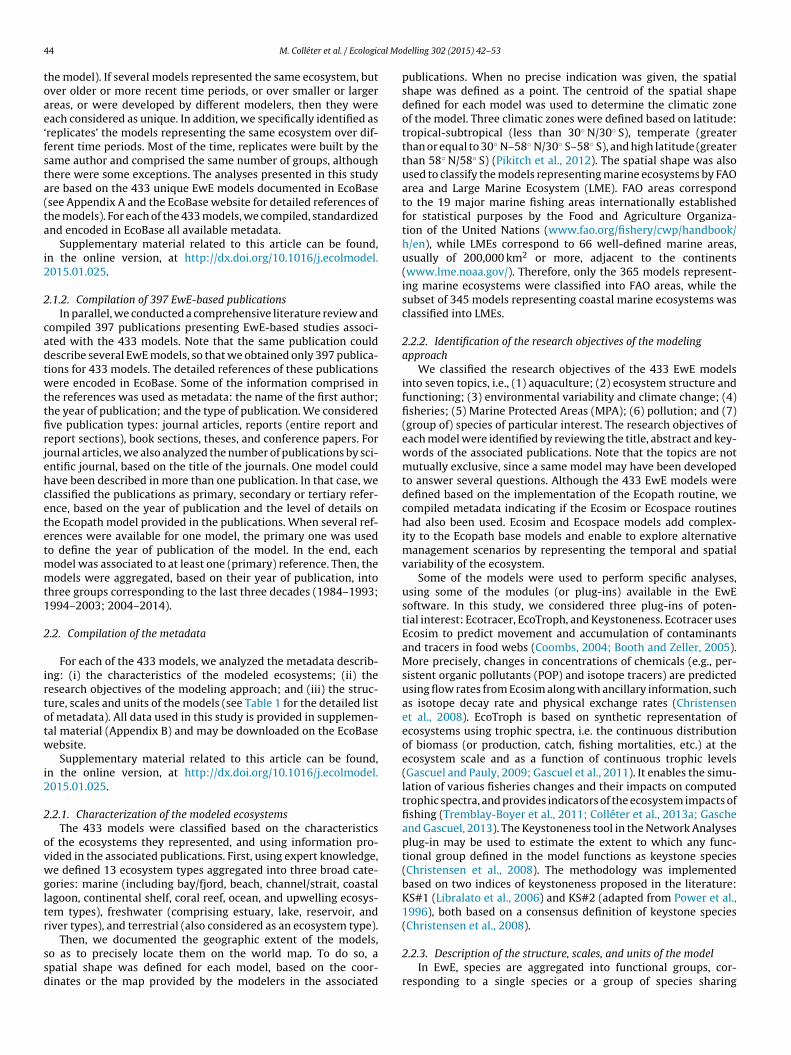
4 al Mo
toae‘fsta(ta
i2
2
cadtwttfirjehcetetmmt1
2
irtotw
i2
2
ovwgltr
ssd
4 M. Colléter et al. / Ecologic
he model). If several models represented the same ecosystem, butver older or more recent time periods, or over smaller or largerreas, or were developed by different modelers, then they wereach considered as unique. In addition, we specifically identified as
replicates’ the models representing the same ecosystem over dif-erent time periods. Most of the time, replicates were built by theame author and comprised the same number of groups, althoughhere were some exceptions. The analyses presented in this studyre based on the 433 unique EwE models documented in EcoBasesee Appendix A and the EcoBase website for detailed references ofhe models). For each of the 433 models, we compiled, standardizednd encoded in EcoBase all available metadata.
Supplementary material related to this article can be found,n the online version, at http://dx.doi.org/10.1016/j.ecolmodel.015.01.025.
.1.2. Compilation of 397 EwE-based publicationsIn parallel, we conducted a comprehensive literature review and
ompiled 397 publications presenting EwE-based studies associ-ted with the 433 models. Note that the same publication couldescribe several EwE models, so that we obtained only 397 publica-ions for 433 models. The detailed references of these publicationsere encoded in EcoBase. Some of the information comprised in
he references was used as metadata: the name of the first author;he year of publication; and the type of publication. We consideredve publication types: journal articles, reports (entire report andeport sections), book sections, theses, and conference papers. Forournal articles, we also analyzed the number of publications by sci-ntific journal, based on the title of the journals. One model couldave been described in more than one publication. In that case, welassified the publications as primary, secondary or tertiary refer-nce, based on the year of publication and the level of details onhe Ecopath model provided in the publications. When several ref-rences were available for one model, the primary one was usedo define the year of publication of the model. In the end, each
odel was associated to at least one (primary) reference. Then, theodels were aggregated, based on their year of publication, into
hree groups corresponding to the last three decades (1984–1993;994–2003; 2004–2014).
.2. Compilation of the metadata
For each of the 433 models, we analyzed the metadata describ-ng: (i) the characteristics of the modeled ecosystems; (ii) theesearch objectives of the modeling approach; and (iii) the struc-ure, scales and units of the models (see Table 1 for the detailed listf metadata). All data used in this study is provided in supplemen-al material (Appendix B) and may be downloaded on the EcoBaseebsite.
Supplementary material related to this article can be found,n the online version, at http://dx.doi.org/10.1016/j.ecolmodel.015.01.025.
.2.1. Characterization of the modeled ecosystemsThe 433 models were classified based on the characteristics
f the ecosystems they represented, and using information pro-ided in the associated publications. First, using expert knowledge,e defined 13 ecosystem types aggregated into three broad cate-
ories: marine (including bay/fjord, beach, channel/strait, coastalagoon, continental shelf, coral reef, ocean, and upwelling ecosys-em types), freshwater (comprising estuary, lake, reservoir, andiver types), and terrestrial (also considered as an ecosystem type).
Then, we documented the geographic extent of the models,o as to precisely locate them on the world map. To do so, apatial shape was defined for each model, based on the coor-inates or the map provided by the modelers in the associated
delling 302 (2015) 42–53
publications. When no precise indication was given, the spatialshape was defined as a point. The centroid of the spatial shapedefined for each model was used to determine the climatic zoneof the model. Three climatic zones were defined based on latitude:tropical-subtropical (less than 30◦ N/30◦ S), temperate (greaterthan or equal to 30◦ N–58◦ N/30◦ S–58◦ S), and high latitude (greaterthan 58◦ N/58◦ S) (Pikitch et al., 2012). The spatial shape was alsoused to classify the models representing marine ecosystems by FAOarea and Large Marine Ecosystem (LME). FAO areas correspondto the 19 major marine fishing areas internationally establishedfor statistical purposes by the Food and Agriculture Organiza-tion of the United Nations (www.fao.org/fishery/cwp/handbook/h/en), while LMEs correspond to 66 well-defined marine areas,usually of 200,000 km2 or more, adjacent to the continents(www.lme.noaa.gov/). Therefore, only the 365 models represent-ing marine ecosystems were classified into FAO areas, while thesubset of 345 models representing coastal marine ecosystems wasclassified into LMEs.
2.2.2. Identification of the research objectives of the modelingapproach
We classified the research objectives of the 433 EwE modelsinto seven topics, i.e., (1) aquaculture; (2) ecosystem structure andfunctioning; (3) environmental variability and climate change; (4)fisheries; (5) Marine Protected Areas (MPA); (6) pollution; and (7)(group of) species of particular interest. The research objectives ofeach model were identified by reviewing the title, abstract and key-words of the associated publications. Note that the topics are notmutually exclusive, since a same model may have been developedto answer several questions. Although the 433 EwE models weredefined based on the implementation of the Ecopath routine, wecompiled metadata indicating if the Ecosim or Ecospace routineshad also been used. Ecosim and Ecospace models add complex-ity to the Ecopath base models and enable to explore alternativemanagement scenarios by representing the temporal and spatialvariability of the ecosystem.
Some of the models were used to perform specific analyses,using some of the modules (or plug-ins) available in the EwEsoftware. In this study, we considered three plug-ins of poten-tial interest: Ecotracer, EcoTroph, and Keystoneness. Ecotracer usesEcosim to predict movement and accumulation of contaminantsand tracers in food webs (Coombs, 2004; Booth and Zeller, 2005).More precisely, changes in concentrations of chemicals (e.g., per-sistent organic pollutants (POP) and isotope tracers) are predictedusing flow rates from Ecosim along with ancillary information, suchas isotope decay rate and physical exchange rates (Christensenet al., 2008). EcoTroph is based on synthetic representation ofecosystems using trophic spectra, i.e. the continuous distributionof biomass (or production, catch, fishing mortalities, etc.) at theecosystem scale and as a function of continuous trophic levels(Gascuel and Pauly, 2009; Gascuel et al., 2011). It enables the simu-lation of various fisheries changes and their impacts on computedtrophic spectra, and provides indicators of the ecosystem impacts offishing (Tremblay-Boyer et al., 2011; Colléter et al., 2013a; Gascheand Gascuel, 2013). The Keystoneness tool in the Network Analysesplug-in may be used to estimate the extent to which any func-tional group defined in the model functions as keystone species(Christensen et al., 2008). The methodology was implementedbased on two indices of keystoneness proposed in the literature:KS#1 (Libralato et al., 2006) and KS#2 (adapted from Power et al.,1996), both based on a consensus definition of keystone species(Christensen et al., 2008).
2.2.3. Description of the structure, scales, and units of the modelIn EwE, species are aggregated into functional groups, cor-
responding to a single species or a group of species sharing

M. Colléter et al. / Ecological Modelling 302 (2015) 42–53 45
Table 1List of the metadata used for the analyses. Metadata are listed in alphabetical order, with their corresponding fields in EcoBase and definitions.
Metadata EcoBase field Definition
Aquaculture aquaculture Was the model developed to analyze aquaculture impact? (TRUE/FALSE)Area area Model area (in km2)Climatic zone classif Climatic zone of the modeled ecosystemCurrency unit currency units Currency unit of the model, e.g., wet weight, in t km−2
Ecopath ecopath Is the Ecopath routine used? (TRUE/FALSE)Ecosim ecosim Is the Ecosim routine used? (TRUE/FALSE)Ecospace ecospace Is the Ecospace routine used? (TRUE/FALSE)Ecosystem ecosyst functioning Was the model developed to analyze ecosystem functioning/structure? (TRUE/FALSE)Ecosystem category ecosystem categ Category of the modeled ecosystemEcosystem type ecosystem type Type of the modeled ecosystemEcotracer ecotracer Is the Ecotracer plug-in used? (TRUE/FALSE)EcoTroph ecotroph Is the EcoTroph plug-in used? (TRUE/FALSE)Environment environment variability Was the model developed to analyze environmental variability impact? (TRUE/FALSE)Fisheries fisheries Was the model developed to analyze fisheries impact? (TRUE/FALSE)Geographic extent geographic extent Spatial polygon of the model (in decimal degrees)Keystoneness keystone analysis Is the Keystoneness tool in the Network Analysis plug-in used? (TRUE/FALSE)Model model number Model number (3-digits code) as recorded in EcoBaseMPA mpa Is the modeled ecosystem a Marine Protected Area? (TRUE/FALSE)Number of groups number groups Number of functional groups included in the modelPedigree index pedigree index Pedigree index indicated in the associated reference or calculated by the modelPollution pollution Was the model developed to analyze pollution impact? (TRUE/FALSE)Publication id ref Publication number (3-digits code) as recorded in EcoBasePublication xml ref Reference in xml format (including year of publication, first author, and reference type)Reference referenced Is the reference of the model recorded in EcoBase? (TRUE/FALSE)Reference ref importance Importance of the reference (1 by default)Replicates overlapping code Model number(s) of the replicate(s) (if several, noted as 195 196)Replicates overlapping model Are there other models representing the same ecosystem but over a different time period? (TRUE/FALSE)Species species of interest Has the model been built to study a particular species/group? (TRUE/FALSE)Stanzas stanza groups Are there any stanzas in the model? (TRUE/FALSE)Time period model year end End year of the model time period
odel todeld by t
s(iohmgsstoe2cd
spbcylbstu
2
iat
Time period model year start Start year of the mTime unit time units Time unit of the mVersion ewe version original Version of EwE use
imilar ecological traits, such as size, diet, predator and life cycleChristensen et al., 2008). The number of functional groups definedn the 433 EwE models was recorded and used as a basic descriptorf model structure. Models comprising a large number of groupsave a low trophic aggregation, and thus are more complex, thanodels including few groups. Also, the inclusion of multi-stanza
roups was considered as a supplementary descriptor of modeltructure. Multi-stanza groups consist of a set of groups repre-enting different life history stages (or stanzas) that are linkedogether, and may be used for a species with a complex trophicntogeny. Thus, species defined using multi-stanza groups add lev-ls of complexity in the models. The pedigree index (Pauly et al.,000; Christensen and Walters, 2004) was also recorded when cal-ulated by the model or indicated in the publication, and used as aescriptor of the quality of the model.
When specified in the associated publications, the temporal andpatial scales of the 433 EwE models were collected. Typically, Eco-ath models represent an average situation for a period of one year,ut some models may correspond to longer time periods. Thus, weompiled as first and last years, the records of the start and endears of the modeled period, as stated by the modelers in the pub-ications. The first year was used to determine the decade coveredy the models, and the time period (in number of years) repre-ented by the models was calculated. The area (in km2) covered byhe EwE models was also documented. Lastly, currency and timenits of the models were documented.
.3. Analyses performed on the metadata
First, a descriptive analysis was performed on the metadata todentify general trends in the use of the EwE models. Second, wenalyzed the metadata aggregated based on the year of publica-ion (and using three time periods corresponding to the last three
ime period
he modeler, as mentioned in the reference
decades: 1984–1993; 1994–2003; 2004–2014), so as to describethe evolution of the EwE applications over time. Third, we carriedout a multivariate analysis as an attempt to formalize the relation-ships previously observed between some of the critical metadataand identify the main types of EwE models. To do so, we selected theresearch questions, the routines and plug-ins used in the models,the number of groups, the inclusion of multi-stanza, the charac-teristics of the modeled ecosystem (ecosystem type and climaticzone), and the publication period and type of the primary refer-ence. Some metadata were transformed into categorical variables:the research questions (ecosystem functioning only; fisheries (insome cases fisheries only, in others fisheries and ecosystem func-tioning); and other research questions), the routines (ecopath only;ecopath and ecosim; ecopath, ecosim and ecospace), and the num-ber of groups (7–19 groups, 20–29 groups, 30–171 groups). Weused a correspondence analysis, i.e., an exploratory method basedon linear algebra and using matrix decomposition and orthogonalprojection. The correspondence analysis is suitable for categoricaldata, and commonly applied to contingency tables. The analysiswas performed using the ‘ade4’ library of the R software (Drayand Dufour, 2007) on 431 EwE models only, since the routines andplug-ins metadata were missing for two models.
3. Results
3.1. General description of the EwE applications publishedworldwide
Globally, EwE models have been mainly developed to study
marine ecosystems (mostly continental shelves) in the tropical ortemperate zones, with some regions better covered than others:84% of the models (i.e. 365 models) represent marine ecosystems,whereas 15% (63 models) represent freshwater ecosystems and 1%
46 M. Colléter et al. / Ecological Modelling 302 (2015) 42–53
Fig. 1. World maps of the EwE models documented in EcoBase representing (a) the centroids of the geographic extent of the models and the number of models (b) by FAOa sentedo
(omEWrHGmmSAmI
1
rea and (c) by LME. Only the 365 models representing marine ecosystems are repren the LME map.
5 models) terrestrial ones (Fig. 1a). All FAO areas comprise at leastne model, but five areas account for the highest proportions ofodels with about 40 models each: the Northeast Atlantic and the
astern Central Atlantic comprise 10% of the models each; and theestern Central Atlantic, the Northwest Atlantic, and the Mediter-
anean and Black Sea comprise 9% of the models each (Fig. 1b). Theumboldt Current, the Gulf of Alaska, the Mediterranean and theuinea Current are the LMEs comprising the highest number ofodels (at least 5% each) (Fig. 1c). Four LMEs did not have any EwEodels: the Somali Coastal Current, the Oyashio Current, the East
iberian Sea, and the Laptev Sea. Overall, the Northern and Centraltlantic Ocean is the region with the highest proportion of EwE
odels, whereas fewer EwE models have been developed for thendian and Antarctic Oceans.The majority of the models represented ecosystems between
980 and 2009, over a time period of one year and an area ranging
on the FAO area map, and the 345 models representing coastal marine ecosystems
from 10,000 to 1,000,000 km2. Of the 433 unique models, about 30%(132 models) correspond to replicates of the same ecosystems, rep-resenting 52 different ecosystems. In particular, models developedto represent ecosystems before 1950 are almost all (93%) replicatesof models representing more recent periods. However, 41% of themodels were also used to perform time-dynamic simulations inEcosim. Moreover, most models were built to analyze ecosystemfunctioning and inform fisheries management, and comprised from10 to 40 functional groups. The pedigree index was recorded for 34models only (8% of the models), it ranged between 0.137 and 0.743with a mean value of 0.472. Details on the general description ofthe EwE applications published worldwide are provided in supple-
mental material (Appendix C). Regarding the associated references,the EwE-based studies were mainly published in the peer-reviewedliterature, with 213 research articles (54% of the references) pub-lished in 60 different scientific journals. However, only a few of
M. Colléter et al. / Ecological Modelling 302 (2015) 42–53 47
Table 2Number and percentage of articles presenting EwE-based studies, detailed byjournal.
Journal Number of articles Percentage
Ecological Modelling 76 36Estuarine, Coastal and Shelf
Science12 6
Progress in Oceanography 10 5Journal of Marine Systems 9 4Marine Ecology Progress Series 9 4Canadian Journal of Fisheries
and Aquatic Sciences8 4
African Journal of Marine Science 5 2Bulletin of Marine Science 5 2Fisheries Research 5 2ICES Journal of Marine Science 4 2Journal of Experimental Marine 4 2
tMa(
i2
3
raA1eosbian
tmpdeBtflrt1sr
apmil1bat
Biology and EcologyOthers 66 31
he journals published more than three articles (Table 2). Ecologicalodelling published the highest number of EwE-based studies (76
rticles, i.e. 36%), followed by Estuarine, Coastal and Shelf Science6%), and Progress in Oceanography (5%).
Supplementary material related to this article can be found,n the online version, at http://dx.doi.org/10.1016/j.ecolmodel.015.01.025.
.2. Evolution of the EwE applications over the last three decades
EwE applications have progressively been developed in allegions of the world’s oceans. From 1984 to 1993, only eight FAOreas were applied at least one model, and the Western Centraltlantic area has the highest number of models (Fig. 2a). Then, from994 to 2003, more models have been developed, and the North-ast Pacific and Northeast Atlantic areas show the highest numberf models, while only two FAO areas located in the Antarctic do nothow any model (Fig. 2b). From 2004 to 2014, all FAO areas haveeen applied at least one model, and the highest number of models
s observed in the Eastern Central Atlantic, while the Mediterraneannd Black Sea and the Northwest Atlantic areas also show a highumber of models (Fig. 2c).
During the first decade of its development (1984–1993),he EwE modeling approach essentially consisted of Ecopath
odels representing tropical marine systems and using a sim-le trophic structure (Fig. 3). In contrast, during the last twoecades (1994–2014), EwE models were applied to a wider vari-ty of ecosystems, including polar regions and terrestrial systems.esides, the numbers of models representing freshwater ecosys-ems has doubled over the last two decades (Fig. 3a). Nonetheless,reshwater applications represent less than 20% of the models pub-ished since 1994. Regarding climatic zones, 80% of the modelsepresented tropical systems in the first decade (1984–1993), whilehe remaining 20% represent temperate systems (Fig. 3b). Since994, the proportions of both tropical and temperate systems havetabilized between 40 and 50%. From 1994 to 2014, 32 modelsepresenting ecosystems at high latitudes have been published.
In parallel, EwE models were also progressively used to answer wider range of research questions, such as issues related toollution or aquaculture (Fig. 3c). Since 1984, the proportion ofodels developed to analyze ecosystem structure and function-
ng has remained the highest. However, the proportion of modelsooking at fisheries-related issues has significantly increased (from
0% in 1984–1993 to 30% in 1994–2003). The numbers of modelsuilt to study environmental variability (including climate change)nd MPAs both have gradually increased since 1984, althoughheir respective proportions have remained lower than 10%. TheFig. 2. World maps of the number of EwE models documented in EcoBase by FAOarea, for each of the last three decades: (a) 1984–1993; (b) 1994–2003; and (c)2004–2014.
proportion of models focusing on a particular species (or taxa) ofinterest has stayed more or less constant over time (at about 15%).
Modeling practices have also evolved toward Ecopath modelswith more complex trophic structures, shorter temporal scales, andlarger spatial scales. During the first decade of the development ofthe EwE modeling approach, the total number of groups definedin the models range from 7 to 27 (Fig. 3d). Over time, the rangeof the number of groups has expanded toward more groups, up to67 groups in the last decade (excluding the few outlier models).Besides, the median is around 15 groups in 1984–1993, while it isaround 30 groups in 2004–2014. Thus, recently developed modelstend to be less aggregated and thus more complex, although highlyaggregated models are still being proposed in recent times.
In contrast, the time period represented by the models tendsto decrease over the last 30 years (Fig. 3e). The number of yearsrepresented by the models ranges from 1 to 14 in the first decade(1984–1993), while it ranges from 1 to 8 in the last decade(2004–2014) (excluding the few outlier models). The median alsoshows a decrease over time, from 3 years in 1984–1993 to close to1 year in 2004–2014. Besides, the proportion of models correspond-ing to replicates of the same ecosystem over different (anterior orposterior) time periods has been increasing through time: from 24%of replicates published in 1984–1993, to 27% in 1994–2003, and 33%in 2004–2014. The areas covered by the models have always cov-ered a wide range (Fig. 3f). Nevertheless, in the last two decades,the range of the models area has expanded toward very large areas,
2
and the median has shifted accordingly, from about 1000 km in1984–1993 to about 100,000 km2 in 1994–2014.Lastly, the numbers of EwE-based publications has steadilyincreased (Fig. 4). The annual number of publications reached a

48 M. Colléter et al. / Ecological Modelling 302 (2015) 42–53
Fig. 3. Comparison of the classified EwE models between the last three decades: 1984–1993; 1994–2003; and 2004–2014; based on the year of publication of the models.C els; (bt ber oft e topn
pfT9
lassification of the models by: (a) category of ecosystem represented by the modhe models; (d) number of functional groups of the models; (e) time period (in numhe barplots, values are displayed in percentage on the y-axis, and in number on thumber of models.
eak in 1993, increased slowly from 1994 to 2000 and more rapidlyrom 2000 to 2004, then stabilized at around 25 references per year.hus, of the 397 EwE-based studies published over the last 30 years,% were published in 1984–1993, 29% in 1994–2003, and 62% in
) climatic zone of the modeled ecosystems; (c) research topic(s) considered using years) represented by the models; and (f) area (in km2) covered by the models. On
of each bar. On the boxplots, the horizontal line in the box represents the median
2004–2014 (respectively 35, 114, and 248 publications). Likewise,the cumulated number of EwE users (first authors on publications)has significantly increased over time, from 30 users in 1993, to 98 in2003, and 230 in 2014. Moreover, both the number and proportion
M. Colléter et al. / Ecological Mo
Fig. 4. Number of publications presenting EwE-based studies over the last 30 years.For each decade (1984–1993, 1994–2003, and 2004–2012), a pie chart shows therepartition of the publications by type. The two vertical dotted lines highlight thetransition years between the three decades. The black solid line represents the num-ber of all types of scientific publications while the gray solid line represents journalarticles only. The dotted line represents the cumulated number of first authors asso-cnt
ob1ms1
Fprglt
iated to the publications from 1984 to 2012. The year axis stops in 2012 since theumber of publications for 2013 and 2014 is incomplete and not representative ofhe actual number of publications.
f peer-reviewed publications presenting EwE applications haveeen growing over the last three decades (Fig. 4). From 1984 to
993, most publications corresponded to conference proceedings,ainly from the “Trophic Models of Aquatic Ecosystems” Themeession at the Statutory Meeting of ICES, in Copenhagen, in October990 (Christensen and Pauly, 1993b). Between 1994 and 2003,
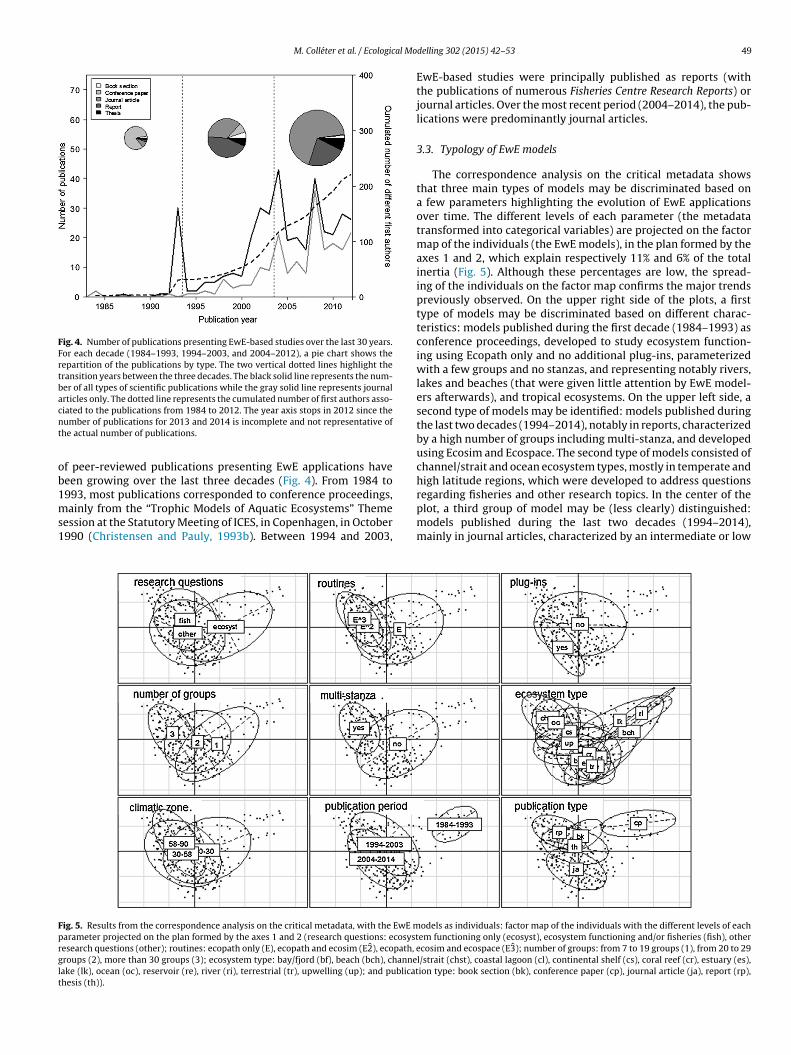
ig. 5. Results from the correspondence analysis on the critical metadata, with the EwE marameter projected on the plan formed by the axes 1 and 2 (research questions: ecosystesearch questions (other); routines: ecopath only (E), ecopath and ecosim (E2̂), ecopath, eroups (2), more than 30 groups (3); ecosystem type: bay/fjord (bf), beach (bch), channeake (lk), ocean (oc), reservoir (re), river (ri), terrestrial (tr), upwelling (up); and publicathesis (th)).
delling 302 (2015) 42–53 49
EwE-based studies were principally published as reports (withthe publications of numerous Fisheries Centre Research Reports) orjournal articles. Over the most recent period (2004–2014), the pub-lications were predominantly journal articles.
3.3. Typology of EwE models
The correspondence analysis on the critical metadata showsthat three main types of models may be discriminated based ona few parameters highlighting the evolution of EwE applicationsover time. The different levels of each parameter (the metadatatransformed into categorical variables) are projected on the factormap of the individuals (the EwE models), in the plan formed by theaxes 1 and 2, which explain respectively 11% and 6% of the totalinertia (Fig. 5). Although these percentages are low, the spread-ing of the individuals on the factor map confirms the major trendspreviously observed. On the upper right side of the plots, a firsttype of models may be discriminated based on different charac-teristics: models published during the first decade (1984–1993) asconference proceedings, developed to study ecosystem function-ing using Ecopath only and no additional plug-ins, parameterizedwith a few groups and no stanzas, and representing notably rivers,lakes and beaches (that were given little attention by EwE model-ers afterwards), and tropical ecosystems. On the upper left side, asecond type of models may be identified: models published duringthe last two decades (1994–2014), notably in reports, characterizedby a high number of groups including multi-stanza, and developedusing Ecosim and Ecospace. The second type of models consisted ofchannel/strait and ocean ecosystem types, mostly in temperate andhigh latitude regions, which were developed to address questions
regarding fisheries and other research topics. In the center of theplot, a third group of model may be (less clearly) distinguished:models published during the last two decades (1994–2014),mainly in journal articles, characterized by an intermediate or lowodels as individuals: factor map of the individuals with the different levels of eachem functioning only (ecosyst), ecosystem functioning and/or fisheries (fish), othercosim and ecospace (E3̂); number of groups: from 7 to 19 groups (1), from 20 to 29
l/strait (chst), coastal lagoon (cl), continental shelf (cs), coral reef (cr), estuary (es),ion type: book section (bk), conference paper (cp), journal article (ja), report (rp),

5 al Mo
nErctptm
4
4m
oHmcmr5mcwemt(bRaovnruatfi(ilVm1rHeribttmzgo
obEittg
0 M. Colléter et al. / Ecologic
umber of groups and no stanzas and the use of Ecopath andcosim, but rarely of the plug-ins. The third type of models rep-esented upwellings, bays/fjords, coral reefs, and estuaries, in alllimatic zones to answer a wide range of research questions. Thisype gathered a high number of models representing the averageattern in the use of the EwE model, compared to the two latterypes corresponding to the most basic and elaborated uses of the
odel.
. Discussion
.1. Challenges and potentials of the compilation andeta-analysis of EwE models
All the metadata analyzed in this study were collectedr derived from the publications presenting the EwE models.owever, detailed information on some metadata was sometimesissing for many models, which prevented us from using the whole
ollection of metadata initially envisaged. Besides, lack of infor-ation was sometimes observed for metadata of potentially high
elevance to the EwE modeling approach. For instance, we obtained% of missing data regarding the time period represented by theodels, and 17% for the area covered by the models. Though, it is
ritical to clearly define and indicate the temporal and spatial scaleshen developing a model. When the geographic extent of the mod-
ls was poorly described, no spatial shape could be defined for theseodels. Likewise, several metadata describing the physical charac-
eristics of the modeled ecosystems were considered in EcoBasee.g., temperature, depth, salinity, oxygen, primary production),ut information on abiotic conditions was lacking for most models.emarkably, information on minimum and maximum depths of therea covered by the models, which is critical to determine the typef ecosystem represented by the models, was sometimes not pro-ided in sufficient details. As a result, the proportion of models withon-available information was too high for the metadata to be rep-esentative. This was also the case with the version of the softwaresed by the modeler. Since the EwE software evolved with timend upgraded versions were successively released, we intendedo analyze the evolution of the use of the different versions. Therst version of EwE, ECOPATH, was used only in the early 1980sPolovina, 1984), and the development of a user-friendly softwaren the early 1990s (version 2, Christensen and Pauly, 1992) rapidlyed to a broader use of the model (67 models, 15% of the models).ersions 3 and 4 only had limited use (respectively 3 and 5% of theodels) and were rapidly replaced by version 5 used to develop
7% of the models (Christensen et al., 2005), which is now itselfeplaced by version 6 (8% of the models, Christensen et al., 2008).owever, the EwE software versions were only specified by model-rs for half of the models, so that the percentages obtained were notepresentative and we could not explore this aspect of the model-ng approach much further. Likewise, the pedigree index could note analyzed in many details since it was provided for only 8% ofhe models. Moreover, the compilation of the metadata was some-imes challenging due to some ambiguity in the description of the
odel. Some models included functional groups labeled as stan-as, but which were not always properly defined as multi-stanzasroups. Thus, we were not able to analyze in many details the usagef multi-stanzas groups.
The challenges we faced during the collection and compilationf the metadata emphasized the need for defining and enforcingest modeling practices (FAO, 2008). We strongly recommendwE modelers to provide critical information about their models
n sufficient details in the associated publication(s). We suggesthe following metadata to be critical: location, objectives, area,ime period, units, software version, pedigree index, number ofroups, and environmental conditions (notably the depth anddelling 302 (2015) 42–53
temperature). Requiring such critical information to be systemati-cally provided would facilitate the reuse of the models, and thusincrease the scientific value of EwE-based publications. Indeed,quality and structure are important aspect to consider when per-forming meta-analyses (Heymans et al., 2014). Thus, the criticalmetadata compiled in this study could serve as valuable criteriabased on which EwE models would be selected for future studies.By applying a scoring method on these selection criteria, a pool ofmodels of potential interest would be defined, and could then bereused to perform EwE-based meta-analyses. Such approach hasalready been implemented in the literature (e.g., Valls et al., 2015),and many more studies could exploit the wide range of informa-tion that can be derived from published EwE models, once madeavailable in EcoBase.
4.2. Challenges and potentials of using EcoBase
EcoBase offers a framework where the metadata can be stored,in a standardized and granular fashion, so that they can be eas-ily reused. Moreover, the repository has been designed to allowthe storage of all input or output data that can be derived fromEwE models (version 6.3), and the capabilities of EcoBase make ita useful tool for the scientific community (Colléter et al., 2013b).In fact, a large number of web services responding to the generalusers’ expectations are made possible by using EcoBase to load dataand metadata from EwE models. For instance, via the ‘Discoverytools’ (see website at http://sirs.agrocampus-ouest.fr/EcoBase/),users may select any of the 433 ‘unique’ models stored in therepository and analyzed in our study, to have access to additionalinformation, including a map of the spatial extent of the model.The web service is still rather limited in terms of selection criteria,but advanced search capabilities could be easily developed usingthe metadata analyzed in this study. In the mid-term, EcoBase ismeant to be used by ecosystem modelers worldwide as a platformwhere to (i) look for published models; (ii) select and access modelsof interest to one’s research work; (iii) download other’s models aswell as upload one’s own models.
Furthermore, new capabilities for future meta-analyses couldbe implemented by connecting the EwE software and the EcoBaserepository. This task is currently underway within the modelrepository working group of the Ecopath Research & DevelopmentConsortium. Two important steps have been defined. The first oneis to gather all missing data from the EwE models already docu-mented in EcoBase, while ensuring a back validation by the authorsfor a better assessment of the models. Furthermore, an open-accessagreement is proposed to the authors for each model, so as toenable other scientists to download or reuse the models. The sec-ond step is to gather new models by linking EcoBase and the EwEsoftware, using a plug-in currently under development, in orderto automatically collect the data and metadata derived from EwEmodels. Including such improvements in EcoBase would enable afiner selection of Ecopath models, and thus allow for more in-depthmeta-analyses of the EwE models than the one proposed in ourstudy.
In addition, the systematic inclusion of some quality criteria inEcoBase could enhance the selection of EwE models, as well as therefining or update of previously published models. Several toolshave been developed to quantitatively assess the quality of Eco-path models, such as for instance the pedigree index (Christensenand Walters, 2004) previously mentioned, or the “DataReli” tool-box (Lassalle et al., 2014) more recently proposed, but both arestill rarely applied. Other interesting developments could consist
of new measures that can help categorizing and ranking models inclasses for particular uses. For instance, our analysis showed thatEcopath models can be built to focus on some particular ecosystemcomponents, so that new indices could focus on the completeness
M. Colléter et al. / Ecological Modelling 302 (2015) 42–53 51
Table 3Examples of EwE models developed to answer fisheries management research questions, and to support an ecosystem approach to fisheries.
Ecosystem Author Primaryreference
Researchquestions
Spatialscale
Temporalscale
Routines Number ofgroups
Multi-stanza
Outcomes
Aleutian Islands Guénette Guénette et al.(2006)
EcosystemFisheriesSpecies
56936 1963–1963 EcopathEcosim
40 Yes Effects of differentpressures on Stellersea lions,ecosystemapproach tofisheries
Chesapeake Bay Christensen Christensenet al. (2009a)
FisheriesSpecies
18580 1950–1950 EcopathEcosim
45 Yes Ecosystem basedfisheriesmanagement in theChesapeake Bay
Gulf of Carpentaria Okey Okey et al.(2007)
EcosystemFisheriesSpecies
370200 1990–1990 EcopathEcosim
83 Yes Ecosystem basedfisheriesmanagementconsidering the
iEiat
4a
ootaa(watctt(aiaflwhsddcnbeacwttopc
n the food web representation. Finally, EcoBase does not considercosim and Ecospace models yet, but only Ecopath. It would benteresting to develop the information repository so that it couldlso compile the information derived from the dynamic and spa-ially explicit routines.
.3. Conclusions on the EwE modeling approach: past, presentnd future
The metadata compiled for this study were used to give a globalverview of the EwE applications. We also analyzed the evolutionf the EwE applications over time, based on the year of publica-ion of the models. The correspondence analysis did not express
high percentage of the total inertia due to an important vari-bility in the use of the EwE model during the last two decades1994–2014). In fact, both elaborated models and more simple onesere developed depending on the research objectives and the data
vailability. However, this analysis enabled us to distinguish threeypes of models corresponding to the evolution of the EwE appli-ations over time. The initial emphasis on the tropics was dueo the development of EwE initially being propagated by staff ofhe International Center for Living Aquatic Resources ManagementICLARM, now WorldFish), which was based in the Philippines,nd which was focused on developing methodologies for manag-ng tropical ecosystems (Christensen and Pauly, 1993b). EwE waslso early applied to freshwater ecosystems, likely due to the easeor defining the boundaries and components of systems such asakes or rivers. Over the last three decades, some regions have been
idely analyzed using the EwE modeling approach, while othersave remained poorly studied. The focus of EwE applications onome regions, such as the North and Central Atlantic Ocean, wereriven by research programs and funding opportunities, but also byata availability. In contrast, future modeling efforts could be con-entrated in the Indian and Antarctic Oceans, seeing the smallerumber of applications in these regions. Terrestrial systems haveeen very poorly studied using EwE until now. However, inter-sts have recently been growing for applying the EwE modelingpproach to terrestrial case studies (Fretzer, 2014). In parallel, theomplexity of EwE models has been increasing over time, notablyith the inclusion of a higher number of functional groups and
he evolution toward a partitioning approach for the representa-
ion the food web in some cases. However, a significant proportionf recent EwE applications focused on some species (or taxa) ofarticular interest, so that the representation of the food web wasentered on these species, using a more selective approach.effect of illegalforeign fishingfleets
Over the last three decades, the research questions addressedusing EwE models have progressively become more diversified.Particularly, the consideration of EwE models for fisheries man-agement has been growing, and their usefulness demonstratedin several cases (Plagányi, 2007). The metadata compiled in thisstudy did not account for the specific use of each model inoperational fisheries management. However, we considered threerepresentative examples of recent EwE applications supportingan ecosystem-based management approach (Table 3). These threemodels were developed during the last decade using a high num-ber of groups, including multi-stanza, and the Ecosim routine.These EwE applications were also funded by national agenciesto help developing ecosystem-based fisheries management. Moregenerally, the main strengths of EwE relate to the improved under-standing of the trophic structure of the modeled ecosystem andthe possible comparison between modeled ecosystems (Jarre-Teichmann, 1998; Plagányi and Butterworth, 2004).
Despite the development of the Ecosim routine allowing fortime-dynamic simulations (Walters et al., 1997, 2000, 2006;Walters and Christensen, 2007), the static Ecopath routine has alsobeen used to analyze changes in ecosystems over time, throughthe comparison of replicate models. Indeed, using replicates ofEcopath models may constitute an easier (and complementary)approach than performing simulations in Ecosim, which are morecomplex and data-demanding. Regardless of its complementaritywith Ecosim, the Ecospace routine has been little used to date (7%).Ecospace has been proposed more recently (Walters et al., 1999)and the latest improvements made to the routine have not beenwidely disseminated yet (Walters et al., 2010; Christensen et al.,2014). Likewise, Ecotroph is a relatively recent plug-in (Gascueland Pauly, 2009), which has thus been rarely applied, but the recentimplementation of the plug-in in R (Colléter et al., 2013a) may allowfor a wider application. With the release of EwE version 6, moreflexibility was implemented in the software and users were givenaccess to the source code of the model. Thus, EwE modelers will bemore and more inclined to develop their own plug-ins (e.g., Coll andSteenbeek, 2014) and take full advantage of the multiple potentialsof the EwE modeling approach, including the EcoBase repository.
Acknowledgements
The authors would like to thank Lyne Morissette and FranciscoArreguín-Sánchez for their help with the compilation of the mod-els in EcoBase. The authors also acknowledge the Ecopath Researchand Development Consortium for supporting the development of
5 al Mo
EiAcBeUaR
R
A
B
C
C
C
C
C
C
C
C
C
C
C
C
C
C
C
C
C
C
C
2 M. Colléter et al. / Ecologic
wE. MC, DG and JG acknowledge support from the French Min-stry of Higher Education and Research, and Agrocampus Ouest.V acknowledges support from the Nereus Program, a scientificooperation between the Nippon Foundation and the University ofritish Columbia with six additional partners. DP and MC acknowl-dge support from the Sea Around Us, a collaboration between theniversity of British Columbia and the Pew Charitable Trusts. VCcknowledges support from the National Science and Engineeringesearch Council of Canada.
eferences
rreguín-Sánchez, F., 2011. Ecosystem dynamics under top-down and bottom-upcontrol situations generated by intensive harvesting rates. Hidrobiológica 21,323–332.
ooth, S., Zeller, D., 2005. Mercury, food webs, and marine mammals: implicationsof diet and climate change for human health. Environ. Health Perspect. 113,521–526.
hristensen, V., 1995. Ecosystem maturity – towards quantification. Ecol. Model. 77,3–32.
hristensen, V., Pauly, D., 1992. The ECOPATH II – a software for balancing steady-state ecosystem models and calculating network characteristics. Ecol. Model.61, 169–185.
hristensen, V., Pauly, D., 1993a. Flow characteristics of aquatic ecosystems. In:Christensen, V., Pauly, D. (Eds.), Trophic Models of Aquatic Ecosystems. ICLARMConference Proceedings. Manila, Philippines, pp. 338–352.
hristensen, V., Pauly, D., 1993b. Trophic Models of Aquatic Ecosystems. ICLARMConference Proceedings , Manila, Philippines, p. 402.
hristensen, V., Walters, C., 2004. Ecopath with Ecosim: methods, capabilities andlimitations. Ecol. Model. 172, 109–139.
hristensen, V., Walters, C.J., 2011. Progress in the use of ecosystem modelingfor fisheries management. In: Christensen, V., Maclean, J.L. (Eds.), EcosystemApproaches to Fisheries: A Global Perspective. Cambridge University Press,Cambridge, pp. 189–205.
hristensen, V., Garces, L., Silvestre, G., Pauly, D., 2003a. Fisheries impact on theSouth China Sea large marine ecosystem: a preliminary analysis using spatially-explicit methodology. In: Assessment, Management and Future Directions forCoastal Fisheries in Asian Countries. WorldFish Center Conference Proceedings,pp. 51–62.
hristensen, V., Guenette, S., Heymans, J.J., Walters, C.J., Watson, R., Zeller, D., Pauly,D., 2003b. Hundred year decline of North Atlantic predatory fishes. Fish Fish. 4,1–24.
hristensen, V., Walters, C., Pauly, D., 2005. Ecopath with Ecosim: A User’s Guide,November 2005 Edition. Fisheries Centre, University of British Columbia, Van-couver, BC, Canada.
hristensen, V., Walters, C., Pauly, D., Forrest, R., 2008. Ecopath with Ecosim Version6: User Guide. Lenfest Ocean Futures Project.
hristensen, V., Beattie, A., Buchanan, C., Martell, S.J., Latour, R.J., Preikshot, D.,Townsend, H., Uphoff, J., Walters, C., Wood, R., 2009a. Fisheries Ecosystem Modelof the Chesapeake Bay: Methodology, Parameterization, and Model Exploration.NMFS-F/SPO-106. US Department of Commerce, National Oceanic and Atmo-spheric Administration, National Marine Fisheries Service.
hristensen, V., Walters, C., Ahrens, R., Alder, J., Buszowski, J., Christensen, L.B., Che-ung, W.W.L., Dunne, J., Froese, F., Karpouzi, V., Kaschner, K., Kearney, K., Lai,S., Lam, V.W.Y., Palomares, M.L.D., Peters-Mason, R., Piroddi, C., Sarmiento, J.L.,Steenbeek, J., Sumaila, U.R., Watson, R., Zeller, D., Pauly, D., 2009b. Database-driven models of the world’s Large Marine Ecosystems. Ecol. Model. 220,1984–1996.
hristensen, V., Coll, M., Steenbeek, J., Buszowski, J., Chagaris, D., Walters, C.J., 2014.Representing variable habitat quality in a spatial food web model. Ecosystems17, 1397–1412.
oll, M., Libralato, S., 2012. Contributions of food web modelling to the ecosystemapproach to marine resource management in the Mediterranean Sea. Fish Fish.13, 60–88.
oll, M., Steenbeek, J., 2014. New software plug-in to calculate biodiversity andconservation-based indicators from EwE food web models. In: Steenbeek, J.,Piroddi, C., Coll, M., Heymans, J.J., Villasante, S., Christensen, V. (Eds.), Ecopath30 Years Conference Proceedings: Extended Abstract. Fisheries Centre ResearchReport 22(3). Fisheries Centre, University of British Columbia, Vancouver, BC,Canada, pp. 68–69.
oll, M., Navarro, J., Olson, R.J., Christensen, V., 2012. Assessing the trophic posi-tion and ecological role of squids in marine ecosystems by means of food-webmodels. Deep Sea Res. II: Top. Stud. Oceanogr. 95, 21–36.
olléter, M., Guitton, J., Gascuel, D., 2013a. An introduction to the EcoTroph RPackage: analyzing aquatic ecosystem trophic networks. R J. 5, 98–107.
olléter, M., Valls, A., Guitton, J., Morissette, L., Arreguín-Sánchez, F., Christensen, V.,Gascuel, D., Pauly, D., 2013b. EcoBase: A Repository Solution to Gather and Com-
municate Information from EwE Models. In: Fisheries Centre Research Report21(1). University of British Columbia, Vancouver, BC, Canada.oombs, A.P., (MSc thesis) 2004. Marine Mammals and Human Health in the East-ern Bering Sea: Using an Ecosystem-Based Food Web Model to Track PCBs.University of British Columbia, Vancouver.
delling 302 (2015) 42–53
Dalgleish, R., Molero, E., Kidd, R., Jansen, M., Past, D., Robl, A., Mons, B., Diaz, C., Mons,A., Brookes, A.J., 2012. Solving bottlenecks in data sharing in the life sciences.Hum. Mutat. 33, 1494–1496.
Dray, S., Dufour, A.B., 2007. The ade4 package: implementing the duality diagramfor ecologists. J. Stat. Softw. 22, 1–20.
Edwards, P.N., 2010. A Vast Machine: Computer Models, Climate Data and the Politicsof Global Warming. MIT Press.
FAO, 2008. Fisheries Management. 2. The Ecosystem Approach to Fisheries. 2.1.Best Practices in Ecosystem Modelling for Informing an Ecosystem Approachto Fisheries. FAO, Rome.
Fretzer, S., 2014. Implementing the habitats directive in Germany: case conven-tions versus Ecopath, Ecosim and Ecospace. In: Steenbeek, J., Piroddi, C., Coll,M., Heymans, J.J., Villasante, S., Christensen, V. (Eds.), Ecopath 30 Years Confer-ence Proceedings: Extended Abstract. Fisheries Centre Research Report 22(3).Fisheries Centre, University of British Columbia, Vancouver, BC, Canada, pp.64–65.
Gasche, L., Gascuel, D., 2013. EcoTroph: a simple model to assess fishery interactionsand their impacts on ecosystems. ICES J. Mar. Sci. 70, 498–510.
Gascuel, D., Pauly, D., 2009. EcoTroph: modelling marine ecosystem functioning andimpact of fishing. Ecol. Model. 220, 2885–2898.
Gascuel, D., Morissette, L., Palomares, M.L.D., Christensen, V., 2008. Trophic flowkinetics in marine ecosystems: toward a theorical approach to ecosystem func-tioning. Ecol. Model. 217, 33–47.
Gascuel, D., Guénette, S., Pauly, D., 2011. The trophic-level based ecosystem mod-elling approach: theoretical overview and practical uses. ICES J. Mar. Sci. 68,1403–1416.
Guénette, S., Heymans, S.J., Christensen, V., Trites, A.W., 2006. Ecosystem modelsshow combined effects of fishing, predation, competition, and ocean productiv-ity on Steller sea lions (Eumetopias jubatus) in Alaska. Can. J. Fish. Aquat. Sci. 63,2495–2517.
Hampton, S.E., Strasser, C.A., Tewksbury, J.J., Gram, W.K., Budden, A.E., Batcheller,A.L., Duke, C.S., Porter, J.H., 2013. Big data and the future of ecology. Front. Ecol.Environ. 11, 156–162.
Heymans, J.J., Coll, M., Libralato, S., Morissette, L., Christensen, V., 2014. Global pat-terns in ecological indicators of marine food webs: a modelling approach. PLOSONE 9, e95845.
Jarre-Teichmann, A., 1998. The potential role of mass balance models for the man-agement of upwelling ecosystems. Ecol. Appl. 8, S93–S103.
Kelling, S., Hochachka, W.M., Fink, D., Riedewald, M., Caruana, R., Ballard, G., Hooker,G., 2009. Data intensive science: a new paradigm for biodiversity studies. Bio-science 59, 613–620.
Lassalle, G., Bourdaud, P., Saint-Béat, B., Rochette, S., Niquil, N., 2014. A toolbox toevaluate data reliability for whole-ecosystem models: application on the Bay ofBiscay continental shelf food-web model. Ecol. Model. 285, 13–21.
Libralato, S., Christensen, V., Pauly, D., 2006. A method for identifying keystonespecies in food web models. Ecol. Model. 195, 153–171.
Michener, W.H., Jones, M.B., 2012. Ecoinformatics: supporting ecology as a data-intensive science. Trends Ecol. Evol. 27, 85–93.
Okey, T.A., Griffiths, S., Pascoe, S., Kenyon, R., Miller, M., Dell, Q., Pillans, R., Buck-worth, R.C., Gribble, N., Engstrom, N., Bishop, J., Milton, D., Salini, J., Stevens, J.,2007. The Effect of Illegal Foreign Fishing on the Ecosystem in the Gulf of Carpen-taria: Management Options and Downstream Effects on Other Fisheries. CSIROMarine and Atmospheric Research, Cleveland, Australia, ISBN 1921232633.
Pauly, D., 1988. On using other people’s data. Naga 11, 6–7.Pauly, D., 1995. Anecdotes and the shifting baseline syndrome of fisheries. Trends
Ecol. Evol. 10, 430.Pauly, D., Christensen, V., Walters, C., 2000. Ecopath, Ecosim, and Ecospace as tools
for evaluating ecosystem impact of fisheries. ICES J. Mar. Sci. 57, 697–706.Pauly, D., Graham, W., Libralato, S., Morissette, L., Palomares, M.D., 2009. Jellyfish
in ecosystems, online databases, and ecosystem models. Hydrobiologia 616,67–85.
Pikitch, E.K., Rountos, K.J., Essington, T.E., Santora, C., Pauly, D., Watson, R., Sumaila,U.R., Boersma, P.D., Boyd, I.L., Conover, D.O., 2012. The global contribution offorage fish to marine fisheries and ecosystems. Fish Fish. 15, 43–64.
Piwowar, H.A., Day, R.S., Fridsma, D.B., 2007. Sharing detailed research data is asso-ciated with increased citation rate. PLoS ONE 2, e308.
Plagányi, É.E., 2007. Models for an Ecosystem Approach to Fisheries. FAO FisheriesTechnical Paper. Food and Agriculture Organisation of the United Nations, Rome.
Plagányi, É.E., Butterworth, D., 2004. A critical look at the potential of Ecopathwith Ecosim to assist in practical fisheries management. Afr. J. Mar. Sci. 26,261–287.
Polovina, J.J., 1984. Model of a coral reef ecosystem. Coral Reefs 3, 1–11.Power, M.E., Tilman, D., Estes, J.A., Menge, B.A., Bond, W.J., Mills, L.S., Daily, G., Castilla,
J.C., Lubchenco, J., Paine, R.T., 1996. Challenges in the quest for keystones. Bio-science 46, 609–620.
Reichman, O., Jones, M.B., Schildhauer, M.P., 2011. Challenges and opportunities ofopen data in ecology. Science 331, 703–705.
Thessen, A.E., Patterson, D.J., 2011. Data issues in the life sciences. ZooKeys 150,15–51.
Tremblay-Boyer, L., Gascuel, D., Watson, R., Christensen, V., Pauly, D., 2011. Mod-elling the effects of fishing on the biomass of the world’s oceans from 1950 to
2006. Mar. Ecol. Prog. Ser. 442, 169–185.Valls, A., Coll, M., Christensen, V., 2015. Keystone species: toward an operationalconcept for marine biodiversity conservation. Ecol. Monogr. 85, 29–47.
Vision, T.J., 2010. Open data and the social contract of scientific publishing. Bio-science 60, 330–331.

al Mo
W
W
W
W
Walters, C., Christensen, V., Walters, W., Rose, K., 2010. Representation of multi-stanza life histories in Ecospace models for spatial organization of ecosystemtrophic interaction patterns. Bull. Mar. Sci. 86, 439–459.
M. Colléter et al. / Ecologic
alters, C., Christensen, V., 2007. Adding realism to foraging arena predictions oftrophic flow rates in Ecosim ecosystem models: shared foraging arenas and boutfeeding. Ecol. Model. 209, 342–350.
alters, C., Christensen, V., Pauly, D., 1997. Structuring dynamic models of exploitedecosystems from trophic mass-balance assessments. Rev. Fish Biol. Fish. 7,139–172.
alters, C., Pauly, D., Christensen, V., 1999. Ecospace: prediction of mesoscale spatial
patterns in trophic relationships of exploited ecosystems, with emphasis on theimpacts of Marine Protected Areas. Ecosystems 2, 539–554.alters, C., Pauly, D., Christensen, V., Kitchell, J.F., 2000. Representing densitydependent consequences of life history strategies in aquatic ecosystems: EcosimII. Ecosystems 3, 70–83.
delling 302 (2015) 42–53 53
Walters, C., Martell, S.J., Mahmoudi, B., 2006. An Ecosim model for exploring ecosys-tem management options for the Gulf of Mexico: implications of includingmultistanza life history models for policy predictions. In: Presentation for MoteSymposium, p. 23.
Zeller, D., Froese, R., Pauly, D., 2005. On losing and recovering fisheries and marinescience data. Mar. Policy 29, 69–73.