Global Ministerial Summit on Patient Safety Bonn, … · used which focused more on EVD,...
21
Global Ministerial Summit on Patient Safety Bonn, Germany March 29 – 30, 2017
Transcript of Global Ministerial Summit on Patient Safety Bonn, … · used which focused more on EVD,...
Global Ministerial Summit on Patient SafetyBonn, Germany
March 29 – 30, 2017

Country profile
Background
Interim Assessment Tool
IAT Indicators
Methodology
Results
Conclusion

Liberia is located in
West Africa bordering
Sierra Leone, Guinea
and Ivory Coast
Has an estimated
population of 4.2 million
people.
It is divided into 15
administrative and health
regions (counties).
Liberia was at the center of an Ebola virus outbreak that occurred in
West Africa in 2014 and 2015.
By the end of the outbreak there were 10, 885 suspected, probably,
and confirmed EVD cases; 4,841: cumulative deaths.
378 confirmed cases among health workers with 192 deaths.
EVD outbreak highlighted weaknesses in the health system;
particularly IPC and gaps in quality health service delivery.
Through a National IPC Task force, the country introduced strategies
to strengthen IPC at all levels of the health system.
Introducing data monitoring tools was one approach to improve IPC
compliance.
The IPC Interim Assessment Tool (IAT) was designed as a tool to evaluate health facilities adherence to standardized infection, prevention and control practices.
The IAT indicators were extrapolated from a list of 25 IPC indicators that was been agreed to be prioritized by the 3 countries affected by Ebola (Sierra Leone, Guinea, Liberia) in collaboration with MOH and WHO
Prior to IAT the Minimum Standards Tool (MST) was used which focused more on EVD, guideline/SOP availability & infrastructure
The IAT emphasizes IPC processes and practices.
These assessments were conducted to provide a baseline data on post EVD IPC practices and for decision making.
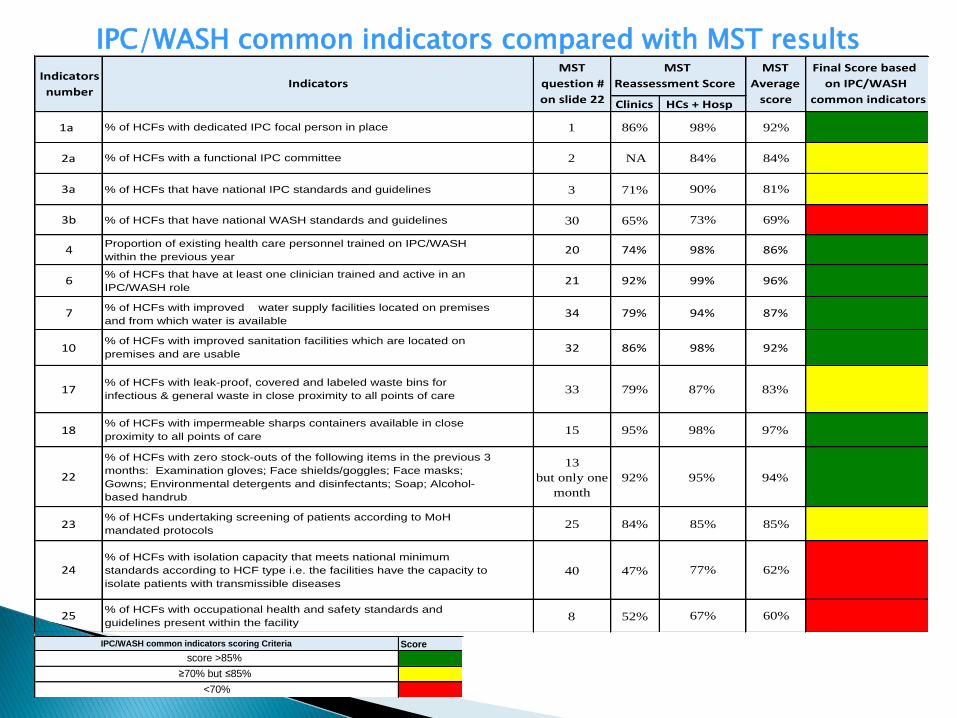
IPC/WASH common indicators compared with MST results
ScoreIPC/WASH common indicators scoring Criteria
score >85%
≥70% but ≤85%
<70%
Clinics HCs+Hosp
1a % of HCFs with dedicated IPC focal person in place 1 86% 98% 92%
2a % of HCFs with a functional IPC committee 2 NA 84% 84%
3a % of HCFs that have national IPC standards and guidelines 3 71% 90% 81%
3b % of HCFs that have national WASH standards and guidelines 30 65% 73% 69%
4Proportion of existing health care personnel trained on IPC/WASH
within the previous year20 74% 98% 86%
6% of HCFs that have at least one clinician trained and active in an
IPC/WASH role21 92% 99% 96%
7 % of HCFs with improved water supply facilities located on premises
and from which water is available34 79% 94% 87%
10% of HCFs with improved sanitation facilities which are located on
premises and are usable32 86% 98% 92%
17% of HCFs with leak-proof, covered and labeled waste bins for
infectious & general waste in close proximity to all points of care33 79% 87% 83%
18% of HCFs with impermeable sharps containers available in close
proximity to all points of care15 95% 98% 97%
22
% of HCFs with zero stock-outs of the following items in the previous 3
months: Examination gloves; Face shields/goggles; Face masks;
Gowns; Environmental detergents and disinfectants; Soap; Alcohol-
based handrub
13
but only one
month
92% 95% 94%
23% of HCFs undertaking screening of patients according to MoH
mandated protocols25 84% 85% 85%
24% of HCFs with isolation capacity that meets national minimum
standards according to HCF type i.e. the facilities have the capacity to
isolate patients with transmissible diseases
40 47% 77% 62%
25% of HCFs with occupational health and safety standards and
guidelines present within the facility8 52% 67% 60%
FinalScorebased
onIPC/WASH
commonindicators
MST
Average
score
MST
ReassessmentScore
MST
question#
onslide22
IndicatorsIndicators
number
In July 2016 the Interim Assessment Tool (IAT) was introduced to replace the Minimum standard tool (MST) in order to align with the regional monitoring mechanism.
Additionally there was a need to:◦ Shift the focus of measurement (e.g. from
infrastructure to practices)
◦ Shift priorities as country transitions (focus away from EVD priorities)
◦ Conduct more in depth measurement

Comparing the MST with the IAT revealed discrepancies in the following areas:◦ Isolation capacity: MST 62 % vs IAT ranging between 24 –
64%
◦ Zero stock outs: MST 94 % vs IAT 48%
◦ Waste management: MST 83 % vs IAT 55 %
The new tool includes 11 indicators and 64 criterion which must be met.

1. Responsible person for IPC and WASH
2. Existence of IPC Committee/Quality Management Team
3. Annual in service training plan with IPC component
4. Availability of water supply
5. Safe use of water tanks
6. Adequate, accessible and appropriate sanitation for patients, staff and care givers
7. Hand Hygiene
8. Waste Management (segregation and disposal)
9. Mechanism to track IPC supplies
10.Screening and isolation
11.Health workers exposure

The IAT is used as a monthly assessment tool athealth facilities in the counties.
The assessment team included the facility staff, thedistrict health team and (WHO) IPC focal persons.
The IAT assessment was an onsite assessmentconducted through direct observation and recordreview.
At the end of the assessment, feedback was given tothe staff on gaps identified.
The health facility with guidance from the districtteam and the WHO IPC focal person developed plansto address the gaps.
The data was then collated and submitted into anational data base for analysis.

Liberia had 770 healthcare facilities (HCFs) in its HMIS as of 2016.
◦ Facility type:
Hospitals: 5% (41/770)
Health Centers: 8% (59/770)
Clinics: 87% (670/770)
◦ Health facility ownership:
Public: 57% (438/770)
Private: 43% (332/770)
The greatest proportion of health facilities is in the capital city, Montserrado 38% (296).
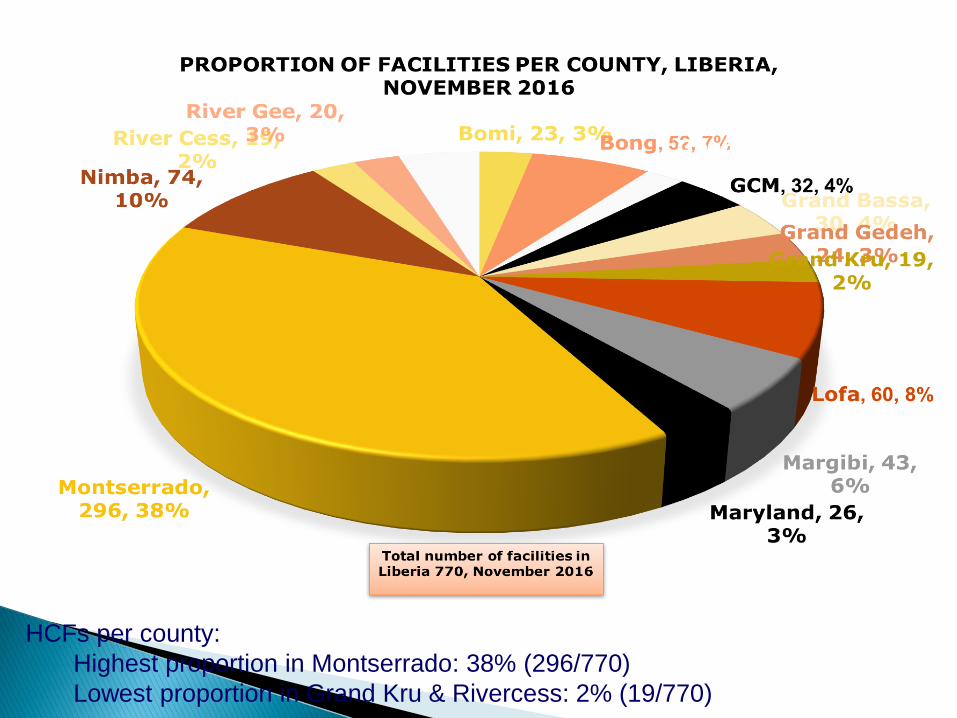
HCFs per county:
Highest proportion in Montserrado: 38% (296/770)
Lowest proportion in Grand Kru & Rivercess: 2% (19/770)
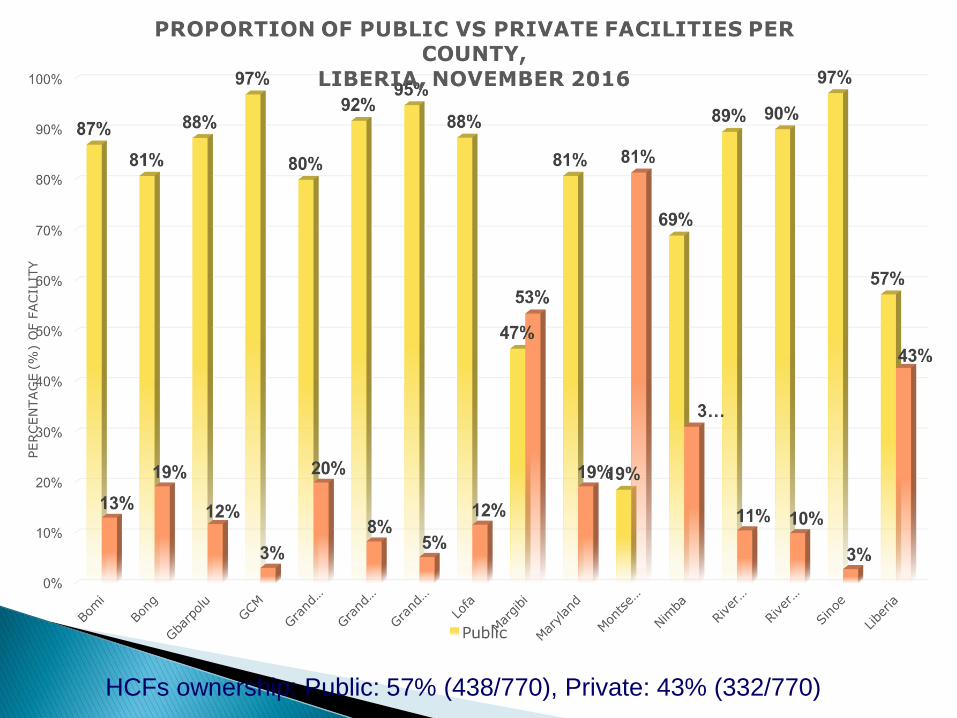
HCFs ownership: Public: 57% (438/770), Private: 43% (332/770)
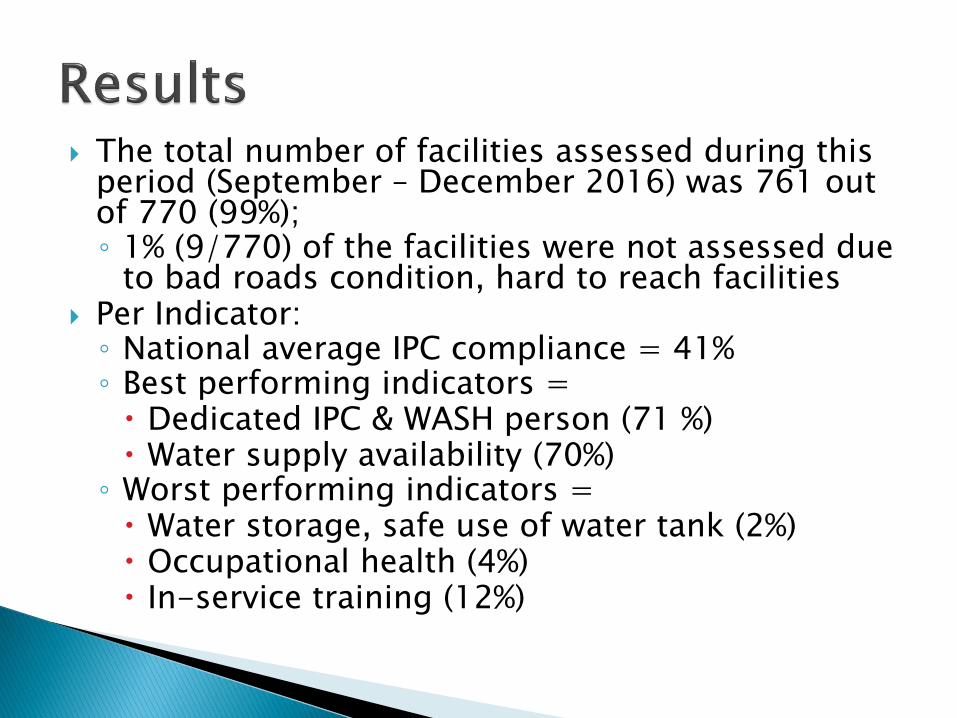
The total number of facilities assessed during this period (September – December 2016) was 761 out of 770 (99%);◦ 1% (9/770) of the facilities were not assessed due
to bad roads condition, hard to reach facilities Per Indicator:◦ National average IPC compliance = 41%◦ Best performing indicators = Dedicated IPC & WASH person (71 %) Water supply availability (70%)
◦ Worst performing indicators = Water storage, safe use of water tank (2%) Occupational health (4%) In-service training (12%)

County
ResponsibleIPC&
WASHpersonat
facility(IPC-01)
IPCorQuality
Teamcommittee
(IPC-2)
Annualin-service
training/updates
(IPC-3)
Watersupply
availablity(IPC-4)
Safeuseand
management
ofwater
supply(IPC-5)
Sanitation(IPC-
6)
HandHygiene
(IPC-7)
Waste
management
(IPC-8)
IPCsupplies
availability
(IPC-9)
Screeningand
Isolation(IPC-10)
Occupational
Health(IPC-11)Nat.Average
Sinoe 50% 3% 0% 20% 0% 37% 20% 30% 44% 47% 0% 23%
Bomi 52% 27% 5% 100% 0% 23% 29% 42% 50% 57% 0% 35%
Bong 100% 52% 0% 94% 2% 92% 68% 74% 95% 57% 1% 58%
Gbarpolu 71% 0% 0% 64% 0% 57% 29% 60% 82% 54% 0% 38%
GCM 100% 13% 0% 80% 0% 70% 60% 66% 95% 53% 0% 49%
GrandBassa 81% 38% 0% 69% 0% 3% 63% 54% 45% 78% 39%
G.Gedeh 56% 33% 4% 75% 0% 54% 67% 68% 42% 52% 2% 41%
Montserrado 51% 1% 1% 21% 1% 33% 22% 40% 34% 28% 2% 21%
G.Kru 63% 37% 0% 74% 0% 16% 42% 53% 63% 63% 5% 38%
Lofa 91% 10% 98% 78% 0% 70% 36% 70% 50% 23% 0% 48%
Margibi 98% 56% 30% 65% 9% 65% 60% 43% 21% 69% 30% 50%
Maryland 50% 27% 4% 85% 4% 42% 60% 60% 40% 48% 0% 38%
Nimba 95% 47% 31% 73% 15% 82% 65% 91% 50% 67% 11% 57%
RiverCess 58% 42% 0% 68% 0% 63% 67% 72% 42% 50% 0% 42%
RiverGee 50% 10% 0% 90% 0% 60% 52% 67% 18% 55% 5% 37%
Nat.IATaverage
perCounty71% 26% 12% 70% 2% 51% 49% 59% 51% 53% 4% 41%


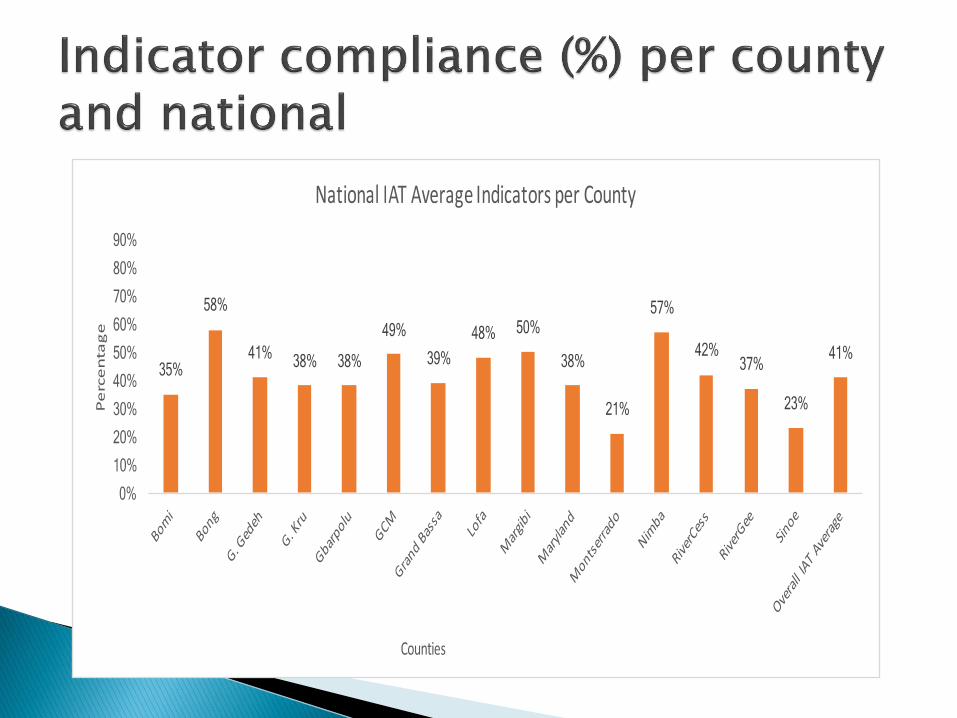
Per county:◦ Best performing counties
Bong (58%)
Nimba (57%)
◦ Worst performing counties
Montserrado (21 %)
Sinoe (23%)
Per ownership (private vs public):◦ Best performing: Public (55 %)
◦ Worst performing: Private (45 %)

Monitoring the IPC indicators is assisting the MOH in identifying the gaps in IPC implementation and developing a plan to address the gaps.
Despite the low national compliance of 41% , the MOH see a potential for improvement through working with the health facilities and the partners to find resources to improve the compliance.
The MOH believes that keeping a visible focus on the IPC practices and processes through a monitoring mechanism will ensure that IPC continues to be a priority in the health system.
In a low resource setting a system of tracking progress can assist the health sector in setting its priorities and aligning its resources to those defined priorities.
This monitoring system has contributed significantly to ensuring that patient safety and quality improvement continues to be a priority in the Liberia health system.