Global Mercury Assessment 2013 - Zaragoza · mercury is transformed into the more toxic form,...
44
United Nations Environment Programme Global Mercury Assessment 2013 Sources, Emissions, Releases and Environmental Transport
Transcript of Global Mercury Assessment 2013 - Zaragoza · mercury is transformed into the more toxic form,...
United Nations Environment Programme
Global Mercury Assessment 2013 Sources Emissions Releases and Environmental Transport
Copyright copy United Nations Environment Programme 2013
Citation UNEP 2013 Global Mercury Assessment 2013 Sources Emissions Releases and Environmental Transport UNEP Chemicals Branch Geneva Switzerland
Disclaimer The designations employed and the presentation of the material in this publication do not imply the expression of any opinion whatsoever on the part of the United Nations Environment Programme concerning the legal status of any country territory city or area or of its authorities or concerning delimitation of its frontiers or boundaries Moreover the views expressed do not necessarily represent the decision or the stated policy of the United Nations Environment Programme nor does citing of trade names or commercial processes constitute endorsement
Reproduction This publication may be produced in whole or in part and in any form for educational or non-profit purposes without special permission from the copyright holder provided acknowledgement of the source is made Material in this report can be freely quoted or reprinted UNEP would appreciate receiving a copy of any publication that uses this report as a source
No use of this publication may be made for resale or for any other commercial purpose whatsoever without prior permission in writing from the United Nations Environment Programme
Funding The work has been funded by the Governments of Canada Denmark Japan Sweden Norway the Nordic Council of Ministers and the EU
Produced by UNEP Division of Technology Industry and Economics Chemicals Branch International Environment House 1 11-13 Chemin des Aneacutemones CH -1219 Chacirctelaine Geneva Switzerland
Tel +41 (0) 22 917 12 34 Fax +41 (0) 22 797 34 60 Email metalschemicalsuneporg Website httpuneporghazardoussubstances
The report can be found on UNEP Chemicals Branchrsquos website httpwwwuneporghazardoussubstancesMercuryInformationmaterialsReportsandPublications tabid3593Defaultaspx
UNEP promotes environmentally sound practices globally and in its own activities This publication is printed on paper from environmentally-managed forests using vegetable-based inks and other eco-friendly practices Our distribution policy aims to reduce UNEPrsquos carbon footprint
Lay-out and technical production Burnthebook Design Derby DE24 8HR United Kingdom (burnthebookcouk)
Printing Narayana Press Gylling DK-8300 Odder Denmark (wwwnarayanapressdk) a swan-labelled printing company 541 562
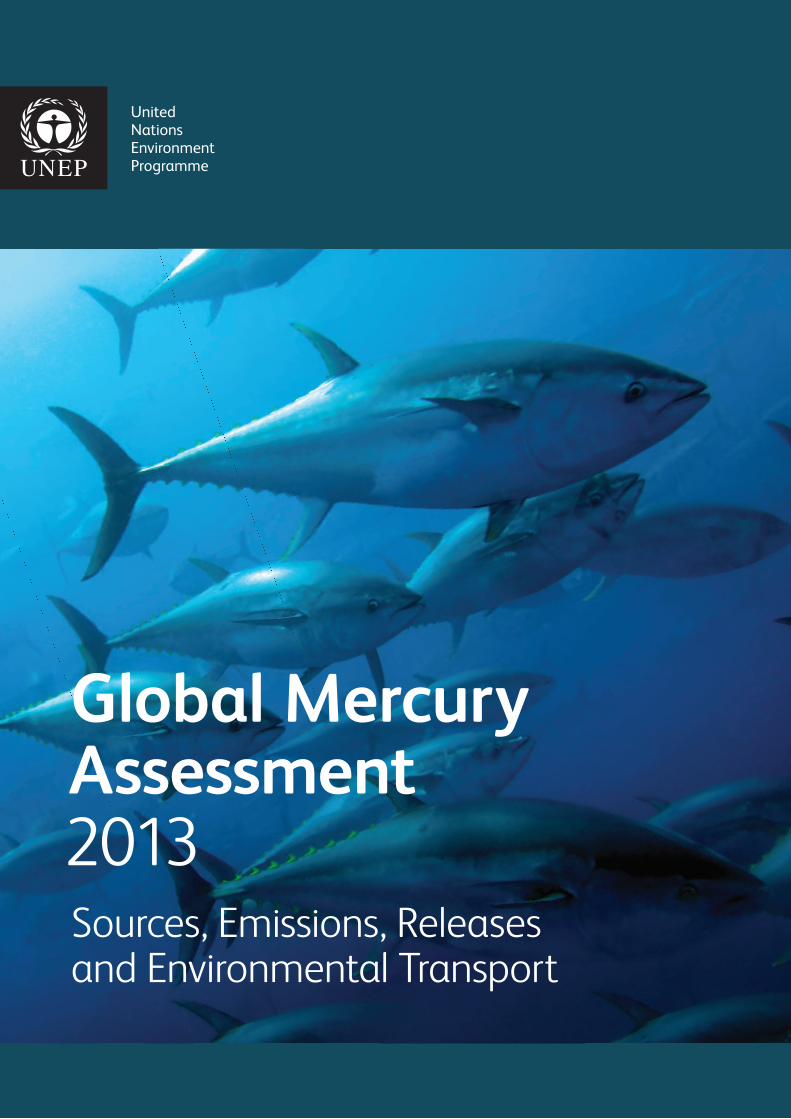
Cover photo Tuna fish (Ugo Montaldo Shutterstockcom) Marine food-webs are an important route of human dietary exposure to mercury
UNEP Global Mercury Assessment 2013
Table of Contents
Executive Summary i 1 Introduction 1 2 Sources of mercury emissions to air and releases to water 4 3 Anthropogenic emissions to the atmosphere 9 4 Trends in mercury emissions to the atmosphere 16 5 Atmospheric chemistry monitoring and trends 19 6 Atmospheric concentrations and deposition 22 7 Anthropogenic releases to the aquatic environment 24 8 Aquatic pathways transport and fate 26 9 Major gaps in knowledge 30 10 Key findings of the 2013 assessment 31
UNEP Global Mercury Assessment 2013
UNEP Global Mercury Assessment 2013
Executive Summary
Mercury is a global threat to human and environmental health This report focusing on anthropogenic emissions of mercury and their transport and transformation in the environment is a contribution to international efforts to reduce mercury pollution
This summary report and the accompanying Technical Background Report for the Global Mercury Assessment 2013 are developed in response to Decision 255 paragraph 36 of the Governing Council of the United Nations Environment Programme (UNEP) that
Requests the Executive Director in consultation with Governments to update the 2008 report entitled
ldquoGlobal Atmospheric Mercury Assessment Sources Emissions and Transportrdquo for consideration by the Governing CouncilGlobal Ministerial Environment Forum at its twenty-seventh session
The report provides the most recent information available on worldwide atmospheric mercury emissions releases to the aquatic environment and the transport and fate of mercury in the global environment The report emphasizes emissions to air from human (anthropogenic) activities but includes releases to water because the aquatic environment is the main route of exposure to humans and wildlife It is in aquatic systems that the inorganic mercury is transformed into the more toxic form methylmercury which can accumulate in fish and marine mammals consumed by humans
This Executive Summary presents an overview of the key findings of the Global Mercury Assessment 2013
Total anthropogenic emissions of mercury to the atmosphere in 2010 are estimated at 1960 tonnes2
The 2010 emissions inventory has several improvements over the previous inventory for 2005 including
bull A more detailed analysis of emissions from some major source sectors
1 tonne = 1000 kilograms
bull A more detailed consideration of the mercury content of fuels and raw materials used in different countriesregions bull New and updated information on artisanal and
small-scale gold mining bull The use of different pollution control technologies
in different countries and regions have been factored into the emissions estimates bull Emission estimates for sectors not previously
included such as aluminium production oil refining and contaminated sites bull More and better information on location of major
point sources such as individual power plants smelters and cement kilns bull Better documentation and greater transparency
with respect to the data and information behind the estimates
Using this approach the global emissions to air from anthropogenic sources is estimated as 1960 tonnes in 2010 Despite recent progress in improving the available knowledge base the emissions estimate still has large associated uncertainties giving a range of 1010-4070 tonnes The work also identifies potentially important sectors that are not yet quantified including use of mercury in vinyl-chloride monomer production secondary metals production and ferro-alloys oil and gas extraction and transport and industrial and some hazardous waste incineration
Present day anthropogenic emissions contribute to both current and future emissions to the air
Current anthropogenic sources are responsible for about 30 of annual emissions of mercury to air Another 10 comes from natural geological sources and the rest (60) is from lsquore-emissionsrsquo of previously released mercury that has built up over decades and centuries in surface soils and oceans Although the original source of this re-emitted mercury cannot be determined with certainty the fact that anthropogenic emissions have been larger than natural emissions since the start of the industrial age about 200 years
2
i
UNEP Global Mercury Assessment 2013
ago implies that most re-emitted mercury was originally from anthropogenic sources Reducing current anthropogenic sources is therefore vital to reduce the amount of mercury that is cycling in the environment
Artisanal and small-scale gold mining and coal burning are the major sources of anthropogenic mercury emissions to air
The inventory confirms the role of artisanal and small-scale gold mining (ASGM) and coal burning as the largest components of anthropogenic emissions followed by the production of ferrous and non-ferrous metals and cement production
Annual emissions from ASGM are estimated at 727 tonnes making this the largest sector accounting for more than 35 of total anthropogenic emissions This is more than twice the figure from this sector in 2005 however most of the increase is attributed to some new and better information For example West Africa was thought in 2005 to have minimal ASGM activity but is now recognized as an important source region It is thus difficult to determine whether actual emissions from this sector have changed because their estimation involves a great deal of uncertainty Much of the activity is unregulated or even illegal and thus reliable official data are still hard to obtain More work is needed to confirm the emissions estimates from this sector including field measurements around ASGM sites to better establish the amounts and fate of the mercury used
A large amount of coal is burned around the world to generate electricity to run industrial plants and for in-home heating and cooking Coal burning emitted some 475 tonnes of mercury in 2010 the majority of which is from power generation and industrial use The estimate of emissions from other coal burning (including domestic and residential burning) is lower than that reported in the previous global assessment due to differences in estimates of the amounts and mercury content of coal burned in these uses Use of coal for power generation and industry is increasing especially in Asia However wider use of air pollution controls and more stringent regulations in several countries together with improved combustion efficiency have reduced emissions from coal-burning power plants helping to offset most of the increase arising from higher coal consumption
Global anthropogenic mercury emissions from industrial sources may be rising
Emissions to air are thought to have peaked in the 1970s declined over the following two decades and have been relatively stable between 1990 and 2005 There were some indications of slight increases in emissions between 2000 and 2005
Any evaluation of trends needs to take into account changes in reporting and methods used to produce inventory estimates including the introduction of additional sectors Thus a direct comparison of the results of global inventories produced over the past 25 years is not possible A preliminary reshycalculation using the improved methodology of global anthropogenic emissions in 2005 indicates that emissions from fossil fuel combustion metal and cement production increased between 2005 and 2010 but continue to decline in other sectors such as the chlor-alkali industry Overall indications are that emissions from industrial sectors have increased again since 2005
Future emission trends have been examined using scenarios and models Without improved pollution controls or other actions to reduce mercury emissions mercury emissions are likely to be substantially higher in 2050 than they are today
Comparing emissions estimates reported under different reporting systems is not straightforward
The 2010 global inventory results were generally consistent with nationally reported emissions estimates for 2010 providing a degree of confidence in the methods used However comparing estimates for individual countries and sectors is complicated by differences in reporting methods in particular the specification and categorisation of sectors used in different national and international reporting systems National emissions estimates based on individual facility reporting and site measurements should be more accurate than those based on the global inventory methodology However this is difficult to evaluate as most nationally reported inventories lack estimation of associated uncertainties It is also important to recognize that many measurement-based estimates are based on relatively few measurements covering short periods that are then extrapolated to produce annual emissions It is important that all reporting is subject to validation and that associated uncertainties are quantified If different reporting systems are to be compared they need to be better aligned in terms of the emission sources that are identified and used
ii
UNEP Global Mercury Assessment 2013
Asia contributes almost half of global anthropogenic mercury emissions
Increasing industrialization has made Asia the main source region of mercury emissions to air with East and Southeast Asia accounting for about 40 of the global total and South Asia for a further 8 The new data on ASGM and the related increase in emission estimates from this sector have increased South America and sub-Saharan Africarsquos share of global emissions However modelling results continue to indicate that East Asia is the dominant source region for long-range airborne mercury transport worldwide
Anthropogenic releases of mercury to water total 1000 tonnes at a minimum
Previous UNEP global mercury assessments considered only atmospheric emissions The 2013 report is thus the first attempt to compile a global inventory of aquatic releases Three types of sources were considered Point sources are industrial sites such as power plants or factories and they release an estimated 185 tonnes of mercury per year Contaminated sites including old mines landfills and waste disposal locations release 8 - 33 tonnes per year Artisanal and small-scale gold mining was evaluated separately with total releases to water and land totalling more than 800 tonnes per year Deforestation mobilizes another 260 tonnes of mercury into rivers and lakes Other sources remain to be quantified and so these estimates comprise only a partial total Thus anthropogenic releases to waters are likely to be at least 1000 tonnes per year
Mercury concentrations in the oceans and in marine animals have risen due to anthropogenic emissions
Anthropogenic emissions and releases have doubled the amount of mercury in the top 100 meters of the worldrsquos oceans in the last 100 years Concentrations in deeper waters have increased by only 10-25 because of the slow transfer of mercury from surface waters into the deep oceans In some species of Arctic marine animals mercury content has increased by 12 times on average since the pre-industrial period This increase implies that on average over 90 of the mercury in these marine animals today comes from anthropogenic sources The timing of the initial stage of the increase which started in the mid-19th century and accelerated in the early 20th century before the rise of Asian industrialization indicates emissions from Europe Russia and North America were probably responsible Studies from the South China
Sea suggest a similar pattern occurring there more recently likely as a result of Asian industrialization
Monitoring capability continues to improve but whether this can be sustained is uncertain
Existing mercury monitoring networks such as the European Monitoring and Evaluation Programme (EMEP) the Arctic Monitoring and Assessment Programme (AMAP) the North American Mercury Deposition Network (NAMDN) and others in the northern hemisphere have been complemented by new monitoring sites in the southern hemisphere in particular some sites established under the Global Mercury Observing System (GMOS) initiative The longer-term status of many of the newly established sites however depends on availability of sustained funding to continue operations
Anthropogenic emissions and releases over time have increased mercury loads in the environment so the effects of reductions in emissions will often take time to become apparent
Large amounts of mainly inorganic mercury have accumulated in the environment in particular in surface soils and in the oceans as a result of past emissions and releases Owing to their larger volumes intermediate and deep ocean waters below 100 metres actually store much larger tonnages of anthropogenic mercury than surface waters There are also relatively large tonnages of natural mercury circulating in the intermediate and deep waters A significant fraction of the mercury in intermediate waters is recycled back to the surface each year by upwellings Todayrsquos anthropogenic emissions continue to load the oceans and the catchments and sediments of lakes and rivers with inorganic mercury This mercury which is the ldquofeed-stockrdquo for toxic methylmercury production is stored and reshycycled in the bioavailable part of the environment for decades or centuries before it eventually is removed by natural processes One consequence is that there will likely be a time-lag of years or decades depending on the part of the water column before emissions reductions begin to have a demonstrable effect on mercury levels throughout the environment and in the fish and marine mammals which are part of the human food-chain At the same time mercury levels in parts of the Atlantic Ocean are decreasing likely due to reduced emissions in past decades in North America and Europe indicating that emissions reductions can eventually lead to decreases in mercury levels in surface oceans This reinforces the need to continue and strengthen
iii
UNEP Global Mercury Assessment 2013
international efforts to reduce current mercury emissions and releases as delays in action now will inevitably lead to slower recovery of the worldrsquos ecosystems in future from mercury contamination
Global climate change may also complicate the response of global ecosystems to mercury emission reductions through its profound effects on many aspects of the movement and chemical transformations of mercury in the environment For example warmer temperatures may increase rates of organic productivity in freshwater and marine ecosystems and rates of bacterial activity possibly leading to faster conversion of inorganic mercury to methylmercury Thawing of the enormous areas of northern frozen peatlands may release globally-significant amounts of long-stored mercury and organic matter into Arctic lakes rivers and ocean
iv
UNEP Global Mercury Assessment 2013
Introduction
Background and mandate Global inventories for mercury emissions to air from human sources have been produced at approximately 5-year intervals since 1990 by scientific groups UNEP produced its first Global Mercury Assessment in 2002 In 2007 the Governing Council of UNEP through its decision 243 requested the Executive Director of UNEP
to prepare a report drawing on among other things ongoing work in other forums addressing
(a) Best available data on mercury atmospheric emissions and trends including where possible an analysis by country region and sector including a consideration of factors driving such trends and applicable regulatory mechanisms
(b) Current results from modelling on a global scale and from other information sources on the contribution of regional emissions to deposition which may result in adverse effects and the potential benefits from reducing such emissions taking into account the efforts of the Fate and Transport partnership established under the United Nations Environment Programme mercury programme
The results of this request were presented as a summary report entitled ldquoThe Global Atmospheric Mercury Assessment Sources Emissions and Transportrdquo released in December 2008 and an accompanying ldquoTechnical Background Report to the Global Atmospheric Mercury Assessmentrdquo
The technical background report which formed the basis for statements made in the summary report and was prepared in cooperation with the Arctic Monitoring and Assessment Programme (AMAP) Secretariat included an updated inventory of anthropogenic emissions of mercury to the atmosphere The inventory was based on national emissions data for the year 2005 submitted by governments as well as estimates prepared for countries that did not provide data and was coordinated with work related to mercury under the UN Economic Commission for Europe Convention
1
UNEPrsquos 2008 Global Atmospheric Mercury Assessment Report
on Long-range Transboundary Air Pollution (LRTAP) The report also drew on the work of the UNEP Global Mercury Partnership in particular the Mercury Air Transport and Fate Research partnership area
In 2009 the Governing Council of UNEP through its Decision 255 paragraph 36 requested the Executive Director of UNEP
hellip in consultation with Governments to update the 2008 report entitled Global Atmospheric Mercury Assessment Sources Emissions and Transport for consideration by the Governing CouncilGlobal Ministerial Environment Forum at its twenty-seventh session
This updated Global Mercury Assessment 2013 and its accompanying and updated Technical Background Report are the response to that Governing Council request
Developing the 2013 Report As in 2008 the Technical Background Report for the Global Mercury Assessment 2013 forms the basis for the statements made in the Summary
1
UNEP Global Mercury Assessment 2013
Report and is fully referenced according to standard scientific practice As such it is the single reference for the Summary Report It has again been prepared in co-operation with the Arctic Monitoring and Assessment Programme (AMAP) and uses national data and information submitted by several governments Contributions have also been incorporated from the UNEP Global Mercury Partnership in particular its partnership areas on mercury control from coal combustion reducing mercury in artisanal and small-scale gold mining (ASGM) and mercury air transport and fate AMAP mercury expert group UN Economic Commission for Europe (UN ECE) Long-range Transboundary Air Pollution (LRTAP) Convention groups industry and non-governmental organizations Each section was prepared by a team of experts and then reviewed to ensure its scientific accuracy The evaluation of information of mercury released into the aquatic environment benefits from contributions from the Group of Experts on Scientific Aspects of Marine Environmental Protection (GESAMP)
Scope and coverage This update to the Global Mercury Assessment provides the most recent information available for the worldwide emissions releases and transport of mercury in atmospheric and aquatic environments To the extent possible the information comes from the published scientific literature supplemented where necessary by other sources Since the Global Mercury Assessment is intended as a basis for decision making emphasis is given to anthropogenic emissions (mercury going into the atmosphere) and releases (mercury going into water and land) that is those associated with human activities
The Technical Background Report includes a detailed inventory of global mercury emissions to air based on data for 2010 ldquoInventoryrdquo in this context means a compilation of the estimated emissions and releases from various sectors and sources While it attempts to catalogue all major sources of mercury emissions worldwide it should not be regarded as complete and exhaustive
In addition for the first time this Global Mercury Assessment includes an evaluation of information of mercury released into the aquatic environment and its associated pathways and fate The information available for this evaluation is less complete than
that for emissions to air and is based on data from recent years The inclusion of this new element of the Global Mercury Assessment is as a response to the requests from many governments in the Intergovernmental Negotiating Committee (INC) for more information on releases to land and water The aquatic environment is the main route of exposure to humans and wildlife because it is in water that inorganic mercury is transformed into highly toxic methylmercury
The Technical Background Report includes chapters on
bull Global Emissions of Mercury to the Atmosphere describing sources anthropogenic emissions and trends in emissions bull Atmospheric Pathways Transport and Fate
examining pathways levels and trends in air and deposition and modelling of pathways and deposition bull Global Releases of Mercury to Aquatic Environments
containing global estimates of releases to water and bull Aquatic Pathways Transport and Fate examining
mercury pathways in aquatic systems that result in important routes of human exposure
Technical Background Report chapters were prepared by teams of experts and then reviewed to ensure their scientific validity This Summary Report is based on the content of the Technical Background Report and has been reviewed by the authors of the Technical Background Report It was also circulated for national review
This Summary Report provides in Chapter 2 an overview of natural and anthropogenic sources of mercury outlining the main sectors involved The global inventory of anthropogenic emissions to air is presented in Chapter 3 and Chapter 4 describes trends in mercury emissions to the atmosphere What happens after mercury is released to the atmosphere is covered in Chapter 5 on atmospheric chemistry monitoring and deposition and Chapter 6 on atmospheric concentrations and deposition Chapter 7 provides a first attempt to estimate global releases to water followed in Chapter 8 by a discussion of aquatic pathways transformations and fate A review of gaps in knowledge is given in Chapter 9 Chapter 10 summarizes key findings
2
UNEP Global Mercury Assessment 2013
Whatrsquos new in the Global Mercury Assessment 2013 Global mercury emissions inventories continue to improve as new data and better data become available concerning some sources The method for compiling the inventory of anthropogenic emissions to the atmosphere has also been revised and improved Differences in air pollution control technologies and differences in the mercury content of raw materials and fuels in different countries and regions have been factored into emissions calculations to better reflect actual conditions in each country
In the Global Mercury Assessment 2013 a new updated inventory based on data from 2010 is presented in which some new sources (including emissions from combustion of natural gas and primary aluminium production and emissions associated with oil refining) have been quantified for the first time A more detailed analysis has also been made of some of the major mercury emission sectors including the break-down of emissions from coal burning in power plants industrial and other uses In addition new information acquired through the UNEP Global Mercury Partnership area on Reducing Mercury in Artisanal and Small-scale Gold Mining in particular from the Artisanal Gold Council has resulted in a significant re-evaluation of emissions from the ASGM sector
New observational data and new modelling results provide fresh insight into atmospheric mercury transport and fate
Kevin Telmer
One of the objectives of the updated assessment has been to provide transparent documentation and comprehensive compilations of the data that form the basis for all of the estimates presented This approach will allow a more consistent and replicable method for compiling the global mercury emission inventory so that valid comparisons can be made in the future In addition a wider range of experts from around the world have been involved in preparing the Technical Background Report on which this summary is based
The inclusion of an assessment of releases of mercury to the aquatic environment and its subsequent pathways and fate is a further significant development as these topics were not addressed in the 2008 UNEP Global Atmospheric Mercury Assessment The aquatic environment is critical for three reasons
bull Hundreds of tonnes of mercury is released directly into water so an inventory limited to mercury emissions to air provides an incomplete assessment of anthropogenic impacts on the mercury cycle
bull Mercury in aquatic environments can be transformed into methylmercury which is far more toxic to humans and animals and can enter and biomagnify in food webs more readily than other forms of mercury bull Much human exposure to mercury is through
the consumption of fish and other marine foods making aquatic pathways the critical link to human health
A large open artisanal and small-scale gold mining pit
3
UNEP Global Mercury Assessment 2013
Sources of mercury emissions to air and releases to water 2 Mercury is a naturally occurring element and is found throughout the world There are thus many natural sources of mercury creating background environmental levels that have been present since long before humans appeared
Mercury is contained in many minerals including cinnabar an ore mined to produce mercury Much of the present day demand for mercury is met by supply from mercury recovered from industrial sources and stockpiles rather than from mercury mining Mercury is also present as an impurity in many other economically valuable minerals in particular the non-ferrous metals and in fossil fuels coal in particular
Human activity especially mining and the burning of coal has increased the mobilization of mercury into the environment raising the amounts in the atmosphere soils fresh waters and oceans The majority of these human emissions and releases of mercury have occurred since 1800 associated with the industrial revolution based on coal burning base-metal ore smelting and gold rushes in various parts of the world To some extent the same drivers of mercury emissions and releases are continuing with fossil-fuel-based energy generation powering industrial and economic growth in Asia and South America which in turn helps drive high demand for metals including gold spurring artisanal and small-scale gold mining (ASGM) around the world
In preparing inventories of mercury emissions and releases it is important to distinguish various categories of sources Three main types of emissions and releases can be distinguished each of which is briefly introduced here in qualitative terms with particular emphasis on anthropogenic sources
Natural sources of mercury emissions and releases Mercury in the earthrsquos crust can be emitted and released in several ways to air water and land Natural weathering of mercury-containing rocks
farbled Shutterstockcom
Cinnabar the principal ore of mercury
Year 2000
1950
1900
1850
1800
1750
1700
Mt St Helens (1980)
Industrial period
WWII manufacturing
Krakalau (1883)
Gold rush (circa 1850-84)
Tambora (1815)
Pre-industrial period
1998 core 1991 core Natural background Natural events (volcanic eruptions) Localregional anthropogenic sources Global anthropogenic (industrialization)
0 5 10 15 20 25 30 35 40 Total mercury ngL
Ice core record of deposition from Wyoming USA The elevated levels associated with the 1850-84 US gold rush probably reflect localregional sources rather than a global signature Increasing environmental levels of mercury associated with industrialization however are found in environmental archives like this ice core around the globe
4
UNEP Global Mercury Assessment 2013
Global mercury cycling Mercury is released to the environment from natural sources and processes and as a result of human activities Once it has entered the environment mercury cycles between air land and water until it is eventually removed from the system through burial in deep ocean sediments or lake sediments and
through entrapment in stable mineral compounds Methylmercury the most toxic and bioaccumulative form of mercury which presents the greatest health risk to humans and wildlife is mainly formed in aquatic environments through natural microbial processes
80shy600
3700
2000shy2950
2000 300shy600
1700shy2800
3200
380
lt600
Geogenic Anthropogenic
Anthropogenic Biomass burning
Soil and vegetation
Deposition to oceans
Rivers
Deposition to land
freshwater
Geogenic
Oceans
Anthropogenic
Natural
Re-emissions Re-mobilization
Units tonnes
1 tonne = 1000 kilograms
Global mercury budgets based on models illustrate the main environmental compartments and pathways that are of importance in the global mercury cycle and the ways in which natural and anthropogenic releases to air land and water move between these compartments Emissions to air arise from natural sources and anthropogenic sources as well as re-emissions of mercury previously deposited from air onto soils surface waters and vegetation
is continuous and ubiquitous allowing mercury to escape to air and to be washed into lakes and rivers Volcanoes emit and release mercury when they erupt Geothermal activity can also take mercury from underground and emit it to the atmosphere and release it to the deep oceans Some recent models of the flow of mercury through the environment suggest that natural sources account for about 10 of the estimated 5500-8900 tonnes of mercury currently being emitted and re-emitted to the atmosphere from all sources
onime Shutterstockcom
5
UNEP Global Mercury Assessment 2013
Anthropogenic sources of mercury emissions and releases Anthropogenic sources of mercury emissions account for about 30 of the total amount of mercury entering the atmosphere each year
As found in previous global mercury assessments the main industrial sources of atmospheric mercury are coal burning mining industrial activities that process ores to produce various metals or process other raw materials to produce cement In these activities mercury is emitted because it is present as an impurity in fuels and raw materials In these cases mercury emissions and releases are sometimes referred to as lsquoby-productrsquo or lsquounintentionalrsquo emissions or releases A second category of sources includes sectors where mercury is used intentionally Artisanal and small-scale gold mining (ASGM) is the largest of these in which mercury emissions and releases result from the intentional use of mercury to extract gold from rocks soils and sediments Other intentional-use release sectors include waste from consumer products (including metal recycling) the chlor-alkali industry and the production of vinyl-chloride monomer
Coal burning and to a lesser extent the use of other fossil fuels is one of the most significant anthropogenic source of mercury emissions to the atmosphere Coal does not contain high concentrations of mercury but the combination of the large volume of coal burned and the fact that a significant portion of the mercury present in coal is emitted to the atmosphere yield large overall emissions from this sector The mercury content of coal varies widely introducing a high degree of uncertainty in estimating mercury emissions from coal burning Data on mercury content is now available from many countries including major emitters of mercury
Mining smelting and production of iron and non-ferrous metals are also a large source of global mercury emissions to air and also a very important sector with regard to releases to water In the mining and processing of metals most of the mercury is captured and either stockpiled or sold for use in various products creating anthropogenic sources associated with intentional use discussed below Nonetheless the volume of ores and metals involved result in large total emissions and releases The relatively small volume of primary mercury production makes mercury mining a far smaller source today than it has been in the past
Cement production which typically involves the burning of fossil fuels to heat the materials required to make cement is another major anthropogenic source of mercury emissions Both the raw materials and the fuel may contain mercury and lead to emissions The amount of mercury involved varies greatly with the mercury content of these fuels and especially with the raw materials In some countries cement kilns are burning increasing amounts of alternative fuels including wastes that may contain mercury This may add to the emissions from cement kilns
Oil refining emits and releases mercury as oil deposits are known to contain mercury generally at low concentrations Mercury is removed from most petroleum products and natural gas prior to combustion and therefore combustion-related emissions are low Most of the mercury in crude oil is associated with solid waste that is disposed of in landfills However emissions and releases during refining of crude oil do occur and these have been quantified for the first time in the 2010 inventory The inventory does not quantify other emissions and releases during oil and gas extraction and transport or from flaring
Unintentional mercury emissions from these sectors can be reduced by the application of pollution control measures at power plants and industrial plants Some of the mercury captured is refined and enters the commercial supply chain however large amounts of mercury captured in materials such as fly ash and oil refinery waste need to be disposed of Some of the resulting wastes are themselves used as raw materials for example in construction materials but large amounts are disposed of in landfills which can thus become a potential source of mercury emissions and releases
Among intentional-use sectors Artisanal and small-scale gold mining is a major source for emissions and releases of mercury worldwide In ASGM miners use mercury to create an amalgam separating gold from other materials They then have to separate the mercury from the gold Calculating emissions from this sector presents a particular challenge because it is typically widely dispersed and often unregulated and may be illegal Uncertainties regarding release estimates from the ASGM sector are therefore high Furthermore the miners are typically poor and perhaps have little awareness of the hazards of mercury and pollution control devices may be hard to obtain
Wastes from consumer products containing mercury can end up in landfills or incinerators
6
UNEP Global Mercury Assessment 2013
Mercury is still used in a wide range of products including batteries paints switches electrical and electronic devices thermometers blood-pressure gauges fluorescent and energy-saving lamps pesticides fungicides medicines and cosmetics Once used many of the products and the mercury they contain enter waste streams While mercury in landfills may slowly become re-mobilized to the environment waste that is incinerated can be a major source of atmospheric mercury especially from uncontrolled incineration Incinerators with state-of-the-art controls have low emissions
Another use of mercury is in dental amalgam for filling teeth When bodies are cremated mercury in fillings can be emitted Mercury can also be emitted and released during production and preparation of fillings and from the disposal or removed fillings In addition mercury from removed fillings can be recycled or go into solid waste and wastewater
The amount of mercury released in the recycling of scrap metals for example in secondary steel and nonshyferrous metal production is generally assumed to be much lower than that released during primary metal production which is why the present global inventory only addresses primary metal production However lower emissions from recycling may not be the case in all countries Much of the scrap steel in some countries comes from automobiles that may still have devices that contain mercury and which may not be removed prior to recycling of the steel These devices are largely being phased out so mercury emissions from scrap steel may be expected to decrease However large differences exist between countries in the way they treat their mercury-containing wastes including scrap metals that are recycled in secondary metal production
Mercury is also used in a number of industrial processes A major industrial use is in the chlor-alkali industry where mercury-cell technology may be used in the production of chlorine and caustic soda
Mercury is also used as a catalyst in the production of vinyl chloride monomer (VCM) from acetylene mainly in China
Mercury releases to aquatic systems as a result of current human activities arise from many of the same uses or the presence of mercury in various products and processes that emit mercury to the air As with emissions to the atmosphere aquatic releases come from two main sources First mercury is released with water effluent from the sites where mercury is used Second mercury can leach into water from disposal sites that have mercury in the waste
zhu difeng Shutterstockcom
Tomas Pavelka Shutterstockcom
bikeriderlondon Shutterstockcom
Anthropogenic sources of mercury from industry and intentional use
Gunnar Futsaelig
ter
7
UNEP Global Mercury Assessment 2013
Arnold John Labrentz Shutterstockcom
Re-emission and re-mobilization of mercury Re-emissions constitute the third category of sources presently comprising about 60 of mercury emissions to air Mercury previously deposited from air onto soils surface waters and vegetation from past emissions can be emitted back to the air Re-emission is a result of natural processes that convert inorganic and organic forms of mercury to elemental mercury which is volatile and therefore readily returns to the air Mercury deposited to plant surfaces can be re-emitted during forest fires or biomass burning Mercury may be deposited and re-emitted many times as it cycles through the environment
It is important that re-emitted mercury should not be considered a natural source It may originally have come from natural or anthropogenic sources but by the time it is re-emitted it is difficult or impossible to identify its specific origin Nonetheless human activity has increased the environmental burden of mercury resulting in higher levels of re-emission This is compounded by changes in land use practices as well as increasing temperatures due to climate change
In the aquatic environment re-mobilization of mercury occurs when mercury deposited on and accumulated in soils or sediments is re-mobilized by for example rain or floods that cause the mercury to enter or re-enter the aquatic system Resuspension
of aquatic sediments due to wave action or storm events is an additional way for mercury to re-enter the aquatic ecosystems
Estimating re-emission and re-mobilization rates is difficult It is often done using modelling approaches These models are based on data on atmospheric levels and other observations as well as current understanding of chemical transformations and other processes that determine how mercury moves between air land and water The models aim to balance the amount of mercury in circulation at any given time while remaining consistent with observational data Temperature is a key factor With lower temperatures re-emission rates are generally lower
Re-emission is also a major factor in determining the length of time needed for anthropogenic emission reductions to be reflected in decreasing environmental levels of mercury Mercury emitted in one year may be deposited to and retained in soils and waters for some time before being re-emitted or re-mobilized in subsequent years This cycle can be repeated keeping levels in air and water elevated even after anthropogenic sources have been lowered Conversely continuing to add to the global pool will leave an ever-longer legacy of anthropogenic mercury contamination worldwide It is thus imperative that international efforts to reduce mercury emissions continue and are strengthened as soon as possible
Forest fires re-emit mercury deposited to vegetation
8
UNEP Global Mercury Assessment 2013
Anthropogenic emissions to the atmosphere 3 Global emissions inventory The global emissions inventory for 2010 estimates that 1960 tonnes of mercury was emitted to the atmosphere as a direct result of human activity The leading sectors remain the same as those identified in the 2005 inventory Improved data however have changed the relative contributions of some of these sectors as have some actual changes in emissions All coal burning emissions taken together for example represent a lower percentage of the total emissions than in the 2005 inventory This is due in part to the increased estimates from artisanal and small-scale gold mining (ASGM) and in part to much lower estimates for domestic use of coal When the actual amount of mercury emitted from coal combustions in power generation and industrial uses is considered and the estimates are based on the same 2010 methodology the emissions in 2010 are the same and perhaps slightly higher than in 2005 Even though new coal-fired power plants are being built combustion efficiency and emissions controls are also improving in most parts of the world
Results by selected sector The updated inventory of emissions to air confirms coal burning as a continuing major source of emissions responsible for some 475 tonnes of mercury emissions to air annually compared with around 10 tonnes from combustion of other fossil fuels According to the new inventory more than 85 of these emissions are from coal burning in power generation and industrial uses In the previous assessment emissions from domestic and residential coal burning were highlighted as a possible larger contribution Better information on coal consumption for domestic and residential uses indicates that these activities are a smaller contribution to total emissions from coal burning than previously thought
Emissions from the cement production industry are largely dependent on the raw materials and the fuels used The new inventory avoids double
Emissions from various sectors in tonnes per year with the range of the estimate and as a percentage of total anthropogenic emissions Note These numbers cannot be compared directly with those presented in the 2008 assessment (see Chapter 4 Trends in mercury emissions to the atmosphere)
Sector Emission (range) tonnes
By-product or unintentional emissions
Fossil fuel burning
Coal burning (all uses) 474 (304 - 678) 24
Oil and natural gas burning 99 (45 ndash 163) 1
Mining smelting amp production of metals
Primary production of 455 (205 ndash 241) 2 ferrous metals
Primary production of nonshy 193 (82 ndash 660) 10 ferrous metals (Al Cu Pb Zn)
Large-scale gold production 973 (07 ndash 247) 5
Mine production of mercury 117 (69 ndash 178) lt1
Cement production 173 (655 - 646) 9
Oil refining 16 (73 - 264) 1
Contaminated sites 825 (70 - 95) 4
Intentional uses
Artisanal and small-scale 727 (410 ndash 1040) 37 gold mining
Chlor-alkali industry 284 (102 ndash 547) 1
Consumer product waste 956 (237 ndash 330) 5
Cremation (dental amalgam) 36 (09 - 119) lt1
Grand Total 1960 (1010 ndash 4070) 100
Values rounded to 3 significant figures To nearest percent
Sectors for which emissions are not currently quantified
biofuel production and combustion
vinyl-chloride monomer production emissions during
secondary metals production and ferro-alloys
oil and gas extraction transport and processing other than refinery emissions
industrial some hazardous waste incineration and disposal
sewage sludge incineration
preparation of dental amalgam fillings and disposal of removed fillings containing mercury
9
UNEP Global Mercury Assessment 2013
Disposal of waste from
Mercury-cell chlor-alkali
industry
Relative contributions to estimated emissions to air from anthropogenic sources in 2010
Oil refining
Coal combustion
Oil and natural gas combustion
Primary ferrous metal production
Primary non-ferrous metal (Al Cu Pb Zn)
Large-scale gold production
Hg production Cement production
mercury-containing products
Contaminated sites
Cremation
Artisanal and small-scale gold production
counting of emissions from conventional fuels (such as coal and oil) that are included under the industrial fossil fuel burning emissions However it does attempt to account for emissions from other fuels including alternative fuels (such as old tyres and other wastes) and from raw materials Increasing amounts of waste are being co-incinerated in the cement industry both as fuel but also in some plants as a means of disposing of hazardous wastes some of which may contain mercury In some regions additional measures are being introduced to make sure that mercury emissions associated with waste co-incineration do not increase overall emissions from cement plants
Increased application of air pollution control devices including some mercury-specific technologies together with more stringent regulations in several countries have the effect of reducing mercury emissions from coal burning sectors and thus offset some part of the emissions arising from increased activity
Artisanal and small-scale gold mining emissions are in the 2010 inventory the major source of emissions to air at 727 tonnes per year The reasons for the large increase in the estimate compared to 2005 are discussed below (see page 16) The global estimate for emissions from ASGM includes a significant contribution from China although
recent information on this sector in China is lacking China prohibited ASGM in 1996 and therefore records no emissions from this sector
Mercury-cell technology is becoming less common in the chlor-alkali industry as other more cost-effective processes are adopted No new plants are being constructed though many older plants remain to be converted Old chlor-alkali plants and other decommissioned industrial sites may constitute contaminated sites that continue to release mercury to the environment for many years and emissions from contaminated sites are now part of the inventory
Global emissions from use of mercury in dental amalgam resulting from cremation of human remains are estimated at 36 (09 ndash 119) tonnes in 2010 Some 340 tonnes of mercury is used per year in dentistry of which about 70-100 tonnes (ie 20shy30) likely enters the solid waste stream
In the production of vinyl chloride monomer information is still lacking on the lifecycle and eventual fate of the mercury catalyst Most of this production occurs in China and about 800 tonnes of mercury is thought to have been used by this industry in China in 2012 Used mercury catalyst is recycled and reused by enterprises that hold permits for hazardous waste management The amounts that may be emitted or released are unknown
Ronald de Hom
mel
Artisanal and small-scale gold mining Unlike most small-scale gold miners the green gold miners of Oro Verde shown here employ an environmental way of mining gold that does not use mercury or other chemicals
10
UNEP Global Mercury Assessment 2013
Results by region The greatest proportion of anthropogenic mercury emissions to the atmosphere comes from Asia which contributes about 50 of the global total The majority of Asian emissions come from East and Southeast Asia China accounts for three-quarters of East and Southeast Asian emissions or about one third of the global total
New data on emissions from ASGM have increased the proportion of global emissions attributed to South America and Sub-Saharan Africa largely due to increased estimates associated with improved information about ASGM activities in these areas
Emissions to air from other major source sectors are higher in Europe North America and Oceania
Mercury emission 2010 gkm2
0 2 5 10 100 1000
Global distribution of anthropogenic mercury emissions to air in 2010
Emissions from various regions in tonnes per year with the range of the estimate and as a percentage of total global anthropogenic emissions Note These numbers cannot be compared directly with those presented in the 2008 assessment (see Chapter 4 Trends in mercury emissions to the atmosphere)
See figure on the following Region Emission (range) tonnes page for map with
Australia New Zealand amp Oceania 223 (54 - 527) 11 specification of regions Values rounded to 3 Central America and the Caribbean 472 (197 - 974) 24
significant figures CIS amp other European countries 115 (426 - 289) 59
East and Southeast Asia 777 (395 - 1690) 397
European Union (EU27) 875 (445 - 226) 45
Middle Eastern States 370 (161 - 106) 19
North Africa 136 (48 - 412) 07
North America 607 (343 - 139) 31
South America 245 (128 - 465) 125
South Asia 154 (782 - 358) 79
Sub-Saharan Africa 316 (168 - 514) 161
Undefined (global total for emissions from 825 (700 - 950) 42 contaminated sites)
Grand Total 1960 (1010 ndash 4070) 100
11
UNEP Global Mercury Assessment 2013
North America
Central America and the Caribbean
South America
Unintentional emissions
Stationary combustion (coal)
Stationary combustion (oil and gas) Oil refining
Pig iron and steel
Intentional uses
Artisanal and small-scale gold mining Chlor-alkali
EU27
North Africa
Sub-Saharan Africa
Non-ferrous metals (Cu Pb Zn Al) Mercury
Large-scale gold
Cement
Product waste
Cremation
CIS amp other European countries
500
100
Middle Eastern States East and Southeast Asia
50
10 tonnes
South Asia Australia New Zealand amp Oceania
South America
North America
Central America and the Caribbean
Sub-Saharan Africa
South Asia North Africa
Middle Eastern States
EU
East and Southeast Asia
CIS amp other European countries
Australia New Zealand amp Oceania
Estimates of 2010 anthropogenic mercury emissions to air from different main sectors in different regions ASGM is shown separately to highlight its geographic distribution and better allow regional comparisons to be made for other sectors
12
UNEP Global Mercury Assessment 2013
Compiling the 2010 inventory of anthropogenic mercury emissions to air The inventories used in successive Global Mercury Assessments continue to improve as better data become available The 2013 update presents an inventory of emissions for 2010 that has a number of improvements over the 2008 assessment and its inventory for 2005
bull A more detailed analysis of emissions from some major source sectors For example fossil fuel consumption is now broken down into categories for combustion in power plants industry and other uses The type of coal or oil used is also considered providing a more accurate estimate of mercury emissions
bull A more detailed consideration of the mercury content of fuels and raw materials used in different countries and regions bull New and updated information on ASGM bull The use of different pollution control technologies
in different countries and regions have been factored into the emissions estimate bull Emission estimates for sectors not previously
included such as aluminium production oil refining and contaminated sites bull More and better information on location of major
point sources such as individual power plants smelters and cement kilns bull Better documentation and greater transparency
with respect to the data and information behind the estimates
The methods for estimating emissions from industrial sectors is complemented by other methods used for more dispersed emissions sources For example estimating emissions from some intentional-use sectors requires intensive work with those sectors Relevant and accurate information about ASGM is generally not available through official channels Estimating mercury emissions from its intentional use in lighting batteries and other products requires analysing the entire production use and waste stream to determine where mercury is likely to be released and in what quantities The approach used in the 2013 assessment addresses the emissions from breakages and wastes resulting from use of these mercury-containing products in society the majority of
which are incinerated or end up in landfills It does not however address industrial wastes or sewage sludge incineration
Uncertainties in emission estimates Estimates of mercury emissions are just that estimates To compile a global assessment requires making a number of assumptions and generalizations Uncertainty associated with the 2010 inventory arises from each of the factors used to estimate the emissions the correctness of the activity data the validity of the emission factors applied and the validity of assumptions regarding the effectiveness and use of emission-control technologies
Based on an evaluation of these sources of uncertainty and the relative contributions of sectors with reliable information and those with less reliable data uncertainty in the 2010 inventory assessment of total anthropogenic mercury emissions to air gives a range of emissions from 1010-4070 tonnes This range is greater than that reported in some previous assessments reflecting a greater appreciation of the sources of uncertainty due to the improved estimation methods and perhaps a more realistic appraisal of the state of knowledge concerning some aspects of emissions
The best estimate taking a conservative approach is 1960 tonnes If nationally produced estimates for 2010 available from some countries (Canada Japan Korea Mexico the United States and European countries reporting to LRTAP) are introduced into the global inventory in place of the inventory estimates the corresponding estimated total global anthropogenic emission to air is 1940 tonnes As most national inventories do not include uncertainty ranges it is not possible to assign a range to this number The recognition of uncertainties is an important consideration and presenting single national estimates can convey a misleading picture of what is known and more importantly not known about emissions
The numbers derived using the methods employed to produce the global inventory for 2010 were compared with a number of national inventories and emissions reported under other systems covering the same period In general the level of agreement was good in particular when the significant uncertainties
13
UNEP Global Mercury Assessment 2013
Methods for estimating emissions All global mercury emissions inventories to date have used the same basic approach for the major sectors emitting mercury to the atmosphere For specific emission sectors national emissions estimates are calculated by multiplying the amount of activity (ie amounts of fuels burned raw materials consumed or materials produced) by an emission factor that is an estimate of the mercury emitted per unit of activity For example emissions from coal-fired power generation are estimated by multiplying the tonnes of coal used by the amount of mercury estimated to be released per tonne of coal In most such inventories ldquoabatedrdquo emission factors have been employed to quantify both the emissions of mercury that occur during the processes and the effects of mercury emission controls In the new methodology used to develop the 2013 report these components are split ldquoUnabatedrdquo emission factors are employed to quantify the emissions and ldquotechnology profilesrdquo have been developed to represent the effects of mercury emission controls
Various methods are employed to estimate emissions of mercury at individual sources and at national regional and global levels In general the methods fall under one of two main categories
bull Mass-balancesubstance-flow based estimates which are based on the principle that what goes in must come out Amounts of mercury in fuels and raw materials constitute the inputs and the outputs are the amounts of mercury emitted to air released to water or land retained in products or in wastes or otherwise recovered and stored or disposed of
involved in both global and national estimates are taken into account It is important to note that there are good reasons why estimates of mercury emissions produced in the 2010 inventory may not fully agree with national inventories made by countries using other methodologies These reasons include
bull Reporting schemes may define and distinguish emissions source sectors in very different ways and aligning these sectors may not be possible
bull Industry reporting to national government may be limited to sources with emissions above a certain threshold level so that emissions from smaller sources below the threshold are not reported Where smaller sources make up a significant part of the source category reported inventories
bull Measurement-based estimates which rely on measurements made at appropriate points in the industrial process or in the productwaste output streams These measurements are used to estimate where the mercury goes as in the method above
In principle the two approaches should produce the same results In practice mass-balance based approaches tend to result in higher emission estimates than most measurement-based estimates Since future emissions reporting is likely to involve a combination of these two approaches further work is required to understand why results may differ and to reconcile the two approaches
Since the 2008 UNEP assessment was produced the number of direct measurements of emissions from certain point sources (in particular power plants and some metal and cement production plants and waste incineration facilities) has increased considerably resulting in a much improved knowledge base
A number of countries require regular reporting of emissions Increasing use is being made in these reporting systems of measurement-based estimates and facility-level reporting in particular for major point sources In other countries national mercury emissions are only being quantified for the first time Since 2005 and the start of the UNEP negotiating process in 2010 many countries have initiated work on national emission inventories which in several cases have yielded much improved information on activity data sector characteristics and mercury emissions Such inventories often make use of the UNEP Toolkit for identification and quantification of mercury emissions
may therefore significantly underestimate total mercury emissions bull National inventories in some countries are making
increasing use of actual measurements of mercury emissions at individual facilities At the global scale it is not yet feasible to base an inventory on individual site emissions Furthermore actual measurements of mercury emissions at a source may be taken only a few times during a year and may not be fully representative of normal operations In the 2013 assessment a mass-balance based approach was employed to be consistent transparent and replicable bull National reporting and monitoring schemes
may provide information that is not available to externally produced inventories
14
UNEP Global Mercury Assessment 2013
Despite these considerations most of the discrepancies noted between the 2010 inventory mass-balance-based estimates and national estimates based on measurement- approaches are modest and within the margins of error associated with the different approaches In cases where the differences are larger it is important to recognize that there are sources of error in all methods for estimating mercury emissions
Gunnar Futsaelig
ter
Sampling of mercury emissions at the Kendal coal-fired power plant in South Africa conducted under a UNEP project A probe with mercury traps is inserted into a sampling port in the stack to collect mercury present in the flue gas The mercury traps are subsequently analysed according to the US EPA Mercury Monitoring Toolkit sampling protocol
15
UNEP Global Mercury Assessment 2013
Trends in mercury emissions to the atmosphere 4 Assessing global and sectoral trends A key question in assessing anthropogenic mercury emissions worldwide is whether they are increasing or decreasing While it is tempting simply to compare the 2010 inventory with its 2005 counterpart the results would mean little As inventory methods develop and as additional sources are considered the estimate of total anthropogenic mercury emissions worldwide also changes While some changes reflect real trends others reflect changes in methods or scope Thus comparing the results of previous assessments with the present update requires considerable care and involves an understanding of the way in which these inventories have been produced and the uncertainties associated with them
It is possible however to compare certain sectors over time by attempting to compensate for any methodological changes between the various inventories since 1990
Emissions to air are thought to have peaked in the 1970s From 1990 to 2005 total anthropogenic emissions of mercury to the atmosphere appear to
Emissions to air t
1400
1200
1000
800
600
400
200
0
1990
1995
2000
2005
Africa Asia Europe Russia North Oceania South America America
Estimates of annual anthropogenic mercury emissions from different continentsregions 1990-2005
have been relatively stable with decreases in Europe and North America being offset by increases in Asia A reanalysis of the available inventories since 1990 however indicates that emissions from industrial sectors at least may be starting to increase again
The changes introduced in the 2010 inventory methodology prevent a straight-forward continuation of this analysis However an evaluation of trends for some sectors between 2005 and 2010 has been made by applying the new methodology to activity data for 2005 This comparison suggests a further slight increase in the combined amount of mercury emitted by industrial sectors (coal combustion production of cement pig iron and steel and non-ferrous metals) The following paragraphs describe the trend results for three sectors to illustrate some of the developments between 2005 and 2010 and some of the the difficulties in comparing emissions estimates between different years made with different methods
Coal burning for power generation and for industrial purposes continues to increase especially in Asia However increases in the application of air pollution controls including some mercury specific technologies together with more stringent regulations in a number of countries have reduced mercury emissions from coal burning in power plants in particular and thus offset some part of the emissions arising from increased coal consumption
In the United States for example emissions from coal burning at power plants have reportedly decreased from about 53 tonnes in 2005 to 27 tonnes in 2010 This decrease is largely due to new regulations that have resulted in changes in the sources of the coal that is burned in large power plants and the installation of mercury controls as well as controls on sulphur dioxide and particulates that have the co-benefit of further reducing mercury emissions
In China many of the new coal-fired power plants have state-of-the-art pollution controls installed
Emissions of mercury from artisanal and small-scale gold mining (ASGM) reported for 2010 are more than twice those reported for 2005 While the
16
UNEP Global Mercury Assessment 2013
Unintentional emission sectors Coal burning ferrous- and non-ferrous (Au Cu Hg Pb Zn) metal production cement production Intentional-use sectors Disposal and incineration of product waste cremation emissions chlor-alkali industry
Comparison of emissions in 2005 and 2010 by selected sector and region
Unintentional emission sectors
Emission t
1000
800
600
400
200
0 2005 2010
Australia New Zealand amp Oceania
Central America and the Caribbean
CIS amp other European countries
East and Southeast Asia
rise in the price of gold (from USD 400 per ounce in 2005 to USD 1100 per ounce in 2010) along with increased rural poverty may indeed have caused more activity in this sector the increased estimate for mercury emissions is considered to be due primarily to some more and better data from many countries and regions West Africa for example was regarded as having minimal ASGM in 2005 but is now recognized as a region with considerable activity Thus the baseline has improved without necessarily any change in actual activity or emission levels
Waste from consumer products is affected by the amount of mercury used For most products in which mercury is used mercury-free alternatives exist Consequently many of these uses of mercury are declining at least in some regions as alternative products or processes are adopted Compact fluorescent light bulbs are an exception Even though the mercury content of individual light bulbs has decreased use of this type of light bulb is increasing rapidly
Artisanal and small-scale gold mining Intentional-use sectors
1000 1000
Step change from 2005 to 2010 due to new information 800 800 (under-estimation in 2005)
600 600
400 400
200 200
0 0 2005 2010 2005 2010
European Union (EU27) South America
Middle Eastern States South Asia
North Africa Sub-Saharan Africa
North America
In order to make valid assessments of trends in emissions from global inventories comparable data on activity levels are required together with information on changes in fuel and raw material characteristics and applied air pollution control technology One aim of the 2010 inventory methods is to create a firmer foundation for such future trend analysis
Ralf Siemieniec Shutterstockcom
Use of mercury-containing energy-saving lamps is increasing
17
UNEP Global Mercury Assessment 2013
Emission scenarios and future trends The 2008 Global Atmospheric Mercury Assessment included a first attempt at projecting future emissions inventories These were based on three scenarios continuing with the status quo applying current emissions controls worldwide and achieving maximum feasible technological reductions At the time this effort was regarded as highly provisional Since then additional studies have extended and improved this work but the results are not markedly different from earlier projections of future mercury emissions
Global mercury models have been used to evaluate future scenarios Four global and hemispheric models projected mercury levels around the world in 2020 based on the three emission scenarios described earlier In industrial regions the status quo will cause an increase in mercury levels of 2-25 and in remote areas of 15-5 The two emission control scenarios on the other hand yield a decrease in mercury in industrial areas of 25-35 and in remote areas of 15-20
Another global model was coupled with estimates of surface reservoirs of mercury in order to quantify source-receptor relationships for the present and for 2050 Under the best-case scenario of maximum feasible reductions projected estimates for deposition in 2050 is similar to estimates for today In the other scenarios increasing emissions lead to increasing deposition A greater proportion of mercury emissions is expected to be in the oxidized form so that a greater proportion will be deposited near the source instead of being transported far away
The model results support the conclusion that reducing anthropogenic emissions will slowly reduce the amount of mercury in biologically available reservoirs Over time mercury in the environment will be taken out of circulation by natural processes for example from ocean waters down into sediments and biologically available mercury will decrease Increased emissions on the other hand will continue to build up the amount of mercury in circulation
With new databases and methods it may soon be possible to create scenarios that incorporate activity levels as well as technology use for each country If this were done it would allow countries to assess the effects of different mercury reduction strategies on their national emissions For example a country could determine the relative contributions of emission reduction technology as opposed to for example changes in raw materials
18
UNEP Global Mercury Assessment 2013
Atmospheric chemistry monitoring and trends 5 Forms of mercury in air Mercury in the atmosphere is in three primary forms Gaseous elemental mercury is the most common in anthropogenic and natural emissions to the atmosphere Gaseous oxidized mercury and mercury bound to particulates are less common The transport and deposition of atmospheric mercury depend greatly on whether the mercury is elemental or oxidized Elemental mercury stays in the atmosphere long enough for it to be transported around the world whereas oxidized and particulate mercury are more readily captured in existing pollution control systems or deposited relatively rapidly after their formation As a result most mercury in the air is in the gaseous elemental phase Relatively little elemental mercury is deposited directly but instead must fi rst be oxidized
Although gaseous oxidized mercury is very important in mercury cycling between air and other environmental compartments the process of oxidation in the air is poorly understood with reactions and resulting compounds yet to be verified in observations
When mercury moves from air to water and land it is generally in an oxidized gaseous or particulate form whereas when it is re-emitted to air it has been converted back to gaseous elemental
Particulate associated mercury
Pole
Equator
Gaseous elemental mercury
Global transport
Gaseous elemental mercury can be transported globally Mercury emitted in particulate form tends to deposit closer to sources
mercury Sunlight appears to play a large role in both oxidation and reduction of mercury but temperature and biological interactions are also likely to be involved to some degree Here too much uncertainty remains Nonetheless the reactions are important in determining net deposition and fate of mercury
Monitoring of mercury in air Monitoring of mercury in air focuses on the three primary forms of mercury The measurement of gaseous elemental mercury is routine and robust Measuring gaseous oxidized mercury and particulate-bound mercury however is challenging Concentrations are typically very low and these forms are chemically unstable leading to high uncertainty in the measurements Nonetheless these forms are critical for defining and modelling the fate and transport of airborne mercury
In the past two decades coordinated mercury monitoring networks and long-term monitoring sites have been established in a number of regions measuring mercury concentrations in the air as well as deposition of mercury in precipitation In Europe and North America high-quality continuous monitoring has been going on for more than 15 years especially in the Arctic High-quality monitoring has started more recently in East Asia and South Africa as part of a global effort to expand the coverage provided by long-term monitoring sites
Measurements and trends in atmospheric mercury Monitoring stations around the world have provided information about trends in atmospheric mercury though the time periods vary depending on how long the site has been active Overall a declining trend in background mercury levels over the past decade has been recorded from monitoring stations
19
UNEP Global Mercury Assessment 2013
in many regions Other regions however show an increase in mercury levels
The sites also provide information about geographical patterns reflecting both background levels of
Trends in atmospheric measurements of mercury
Site(s) Period
Mace Head Ireland 1996-2011
North America rural sites 1995-2005
High Arctic sub-Arctic Up to 20 years of records mid-latitudes
Monitoring networks Mercury monitoring in Europe is carried out under the European Monitoring and Evaluation Programme (EMEP) one of the first international environmental measurement networks Heavy metals such as mercury have been included in the EMEP program since 1999 Mercury measurements are available only from northern and northwestern Europe
Three monitoring networks currently operate in North America providing good coverage of Canada and the United States the Mercury Deposition Network the Canadian Air and Precipitation Monitoring Network and the Atmospheric Mercury Network More recently new sites have been established in Mexico extending coverage on the continent The stations monitor atmospheric mercury and mercury in precipitation which has measured since the mid-1990s Monitoring of mercury in the air and in precipitation has been underway in Asia for nearly a decade
Alert Nord
Point Barrow
Nuuk Stoacuterhoumlfethi
Mace Head
mercury and local and regional influences Mercury concentrations at remote sites in Asia are higher than in other regions of the Northern Hemisphere Coastal cities in China have lower levels than inland sites likely due to the influence of relatively clean
Measurement Trend
Gaseous elemental mercury Decrease of 14-18 per year
Total gaseous mercury Decrease of 22 to 174 in total
Total gaseous mercury Decreasing trend at some stations increasing at others
The monitoring network of the Arctic Monitoring and Assessment Programme (AMAP) includes air and deposition monitoring sites located in Arctic regions of Canada Greenland Iceland Norway Russia and Sweden
Building on existing national and regional monitoring networks the European Union-financed project
ldquoGlobal Mercury Observation Systemrdquo (GMOS) started in November 2010 Its goal is to develop a coordinated global system for monitoring mercury including a large network of ground-based monitoring stations New sites are being installed in regions where few monitoring stations exist especially in the Southern Hemisphere Two sites have been established in Antarctica one on the Antarctic Plateau and one on the coast
Ny-Aringlesund
Amderma Pallas
Raringouml Bredkaumllen
Listvyanka Diabla Gora
Mauna Loa
Mt Bachelor
Celestuacuten Calhau
Longobucco
Iskrba Niembro Monte Cimone Cap
Ferrat Mt Waliguan Ganghwa Island
Lulin
Cape Hedo Ev-K2
Mt Changbai
Minamata Mt Ailao
Nieuw Nickerie
Kodiakanal
Maheacute Island Manaus
Bariloche Cape Point
Amsterdam Island Cape Grim
Dumont drsquoUrville
AMAP CAMnet EMEP GMOS GMOS associated NADPAIRMoN NADPMDN
Air + precipitation Air Precipitation
20
UNEP Global Mercury Assessment 2013
John Munthe
The mercury background air monitoring station at Zeppelin mountain Svalbard
air from over the ocean Sites off the Asian coast however show higher levels of gaseous elemental mercury than the Northern Hemisphere background suggesting an outflow from the Asian mainland
Weather patterns have also been found to have a strong influence on seasonal patterns in mercury levels in the air at monitoring sites At the Mount Waliguan Observatory on the Tibetan Plateau for example northeasterly and easterly winds produced the highest levels of mercury
Measurements at high altitudes Measurements from ground-based stations above 2700 meters suggest that there is an inverse relationship between gaseous elemental mercury and gaseous oxidized mercury at these elevations In other words when there is more elemental mercury there is less oxidized mercury and vice versa These measurements are in good agreement with modelling results which gives additional confidence in current understanding of the behaviour of mercury at high altitude
An inverse relationship between total gaseous mercury and particulate concentration has also been observed in the high stratosphere From the transformation rate of total gaseous mercury to particulate-bound mercury it appears that gaseous mercury lasts about two years in the stratosphere
21
UNEP Global Mercury Assessment 2013
Atmospheric concentrations and deposition 6 Measurements and trends of mercury in precipitation Mercury deposited by precipitation decreased from the 1990s into the 2000s at many but not all sites in North America and Western Europe where such measurements were taken
Regional patterns are also evident including slightly higher levels in southern Europe than northern Europe and higher levels in Asia than in North America Total mercury concentrations in precipitation in China were much higher than those in Japan and South Korea Th is was mostly attributed to higher levels of gaseous oxidized mercury and particulate-bound mercury which are readily deposited by precipitation and thus not transported far
A comparison of data from Canadian and American monitoring sites found that deposition of mercury in precipitation was highest in summer
Dry deposition of mercury which is deposition not associated with precipitation is diffi cult to measure and consequently there is little information on trends in mercury dry deposition Th is lack of information means that it is also diffi cult to validate model results for dry deposition
106 44
474 72 91
5 7 71
05 1 5 10 100 500 1000
Total mercury emission (2005) kgcell
Modelled mercury air concentrations and deposition patterns Atmospheric mercury concentrations are highest in major industrial regions Models examining global patterns show that East and South Asia Europe North America and South Africa have the highest levels of elemental mercury in the air Concentrations are generally lower in the Southern Hemisphere than the Northern Hemisphere because most industrial activity is in northern regions Th ese model results are based on simulations using the 2005 global mercury emission inventory because the 2010 inventory has only recently become available
Intercontinental transport of mercury in the air has been examined to determine its impact on regional mercury levels Four models using diff erent parameters produced consistent results Depending on the region mercury emitted by distant sources contributes between 10 and 30 of annual mercury deposition Where local sources are low mercury transported from distant emission sources can account for more than half of the deposition East Asia is the dominant source region adding 10-14 to the deposition in
Contribution from sources outside receptor region
Model 40
GEOS-Chem GLEMOS GRAHM CMAQ-Hg
30
20
10
0 Arctic Europe North East Asia South Asia
America
Receptor region
(Left ) Global distribution of anthropogenic mercury emissions in 2005 with source regions that were considered in the analysis (North America South America Europe Africa Central Asia South Asia East Asia Australia and Oceania) and (right) the contribution of anthropogenic sources outside a particular receptor region to deposition within the receptor region
22
UNEP Global Mercury Assessment 2013
Modelling atmospheric transport and deposition Global models reproduce the movement of mercury in the atmosphere during which the mercury may move between continents They have been effective in examining sources of mercury to the Arctic and also for examining the outflow of pollution from South and Southeast Asia and its impact on western North America as well as the flow from eastern North America to Europe
Regional models on the scale of a continent or a basin such as the Mediterranean can provide more detail about specific source areas even to the level of individual industrial areas Reliable results however require a detailed understanding of mercury oxidation in the atmosphere about which there is considerably uncertainty
Most atmospheric transport models consider the full chain of mercury processes in the atmosphere Some models also consider how mercury is cycled in other atmospheric compartments such as soil vegetation snow freshwater and seawater
One of the largest sources of uncertainty in mercury models is the chemical mechanism used to determine how mercury changes forms in the air Improved experimental data can help improve model performance by making sure that the correct reactions are simulated The processes that lead from deposition to re-emission also need to be understood better Advances in this area show promise with model results becoming closer to estimates based on experimental data
other regions of the world Natural emissions and re-emissions account for 35-70 of total deposition in most regions Deposition is generally greater in low and mid-latitudes due to stronger sunlight higher concentrations of oxidants and higher precipitation
Regional mercury models show patterns at the scales of continents or individual seas The Mediterranean Sea for example is a net source of mercury as it emits more than is deposited to it In that region dry deposition generally exceeds deposition of mercury in precipitation In Central and Southern Europe total gaseous mercury concentrations and deposition in precipitation were both consistently higher than the European average
Across the United States dry deposition accounts for two-thirds of total annual deposition mainly from gaseous oxidized mercury A study examining sources and deposition of mercury to assess the
benefits of proposed emission control measures found that mercury transport from outside the country accounts for 68 of mercury deposition in the Northeast and up to 91 in the west-central United States Large point sources contribute up to three-quarters of nearby deposition and power plants contributed half of the deposition in the eastern part of the country This suggests that new emissions standards would primarily benefit eastern regions of the US
In Asia studies show high seasonal variation in mercury concentration and deposition Anthropogenic emissions are responsible for about 75 of deposition in East Asia In this region there is a net removal of gaseous oxidized mercury from the atmosphere and a net export of gaseous elemental mercury
In the Arctic gaseous elemental mercury levels in the atmosphere are depleted rapidly in spring when after the long Arctic winters sunlight returns Ozone is depleted at the same time and it is believed that bromine-containing compounds are the cause of the photo-chemical reactions that deplete ozone and mercury During these events gaseous oxidized mercury and particulate-bound mercury levels increase sharply suggesting that the gaseous mercury is oxidized and deposited enhancing mercury deposition in Arctic areas in springtime Recent research however has found that 50-80 of the deposited mercury is re-emitted within a few days Similar springtime mercury depletion events have been seen in Antarctica
23
UNEP Global Mercury Assessment 2013
Anthropogenic releases to the aquatic environment 7 Global assessment Previous UNEP global mercury assessments only considered emissions to the atmosphere The 2013 Report presents the first attempt at compiling a global inventory of mercury releases to aquatic environments Releases directly into the aquatic environment present a completely different chemistry set of pathways and fate to those released to air They are also more directly linked to the risks posed by mercury to global environmental and human health Unlike mercury releases to air which are predominantly in the form of gaseous elemental mercury releases to water are predominantly inorganic mercury and to a lesser extent liquid elemental mercury
At present only some sources of aquatic releases can be quantified with any confidence Thus many sources that may be important are not included in this first assessment of global aquatic releases For example land management practices that expose new geological sources of mercury in rocks and mineral soils or that re-mobilize previously deposited mercury cannot yet be assessed Two broad categories of current anthropogenic sources are considered here point sources of mercury release to water and diffuse releases of mercury as a result of its remobilisation from areas where it was previously deposited or accumulated due to human activity (ie contaminated sites) Artisanal and small-scale gold mining (ASGM) mercury-containing pesticides and fungicides used in agriculture and deforestation are considered separately
Point source releases to water from various sectors in tonnes per year with the range of the estimate and as a percentage of total anthropogenic emissions
Sector Releases (range) tonnes
Non-ferrous metal production 925 (193 - 268)
Consumer product waste 894 (222 - 308)
Chlor-alkali production 28 (10 ndash 55)
Oil refining 06 (03 ndash 1)
Grand Total 185 (426 ndash 582)
The global estimate of mercury release to water from point sources has been derived from the atmospheric emissions assessment and the approach employed in the UNEP Toolkit to partition total mercury releases between air land and water This approach has considerable uncertainty and may omit sectors where releases to water are high but air emissions are unimportant and therefore not addressed in the inventory Global releases from point sources were estimated to be 185 tonnes per year
For diffuse sources evaluating the relative contribution of anthropogenic and natural sources to the aquatic environment requires determining considerations of the various mercury inputs For some sectors data exist that allow a preliminary assessment of the amounts of mercury re-mobilized into aquatic systems
For mercury-contaminated sites the range of average soil concentrations of mercury reported for sites where mercury was mined used or otherwise released by human activity was considered The area of contamination is then used to determine how much mercury is available in soils and when combined with a factor for how much mercury is released from those soils in a year the total release can be estimated Among identified contaminated sites mercury mining is identified as the largest sector followed by mining of precious metals Total releases to aquatic environments from contaminated sites are estimated to be 83-335 tonnes per year
Releases to water from contaminated sites in tonnes per year with the range of the estimate
Sector Releases (range) tonnes
Primary mercury mining sites 67 ndash 266
Precious metal production sites 14 ndash 55
Non-ferrous metal production sites 01 ndash 05
Chlor-alkali production sites 01 ndash 05
Other industrial sites 01 ndash 03
Grand Total 83 ndash 335
24
UNEP Global Mercury Assessment 2013
Much of the mercury released from artisanal and small-scale gold mining goes into rivers lakes soils and sediments and tailings From soils and tailings it may be re-mobilized by leaching and erosion In addition mining may disturb mercury-containing soils and sediments that may then erode more quickly releasing more mercury than would otherwise have become available from natural erosion A key factor in these processes is the local hydrological cycle of precipitation evaporation run-off and river flow To account for this in the assessment countries were designated as dry wet or intermediate to determine the relative importance of erosion The tropical and subtropical countries which have the greatest activity in this sector also tend to experience high precipitation and run-off exacerbating this source of mercury release and re-mobilization Total worldwide releases of mercury to land and water from ASGM were estimated at over 800 tonnes per year How much of this is released to water cannot yet be determined
Mercury continues to be used in pesticides and fungicides 2100 tonnes of mercury were released in the decade of the 1960s through such agrochemical uses Current data are unavailable although the use of mercury in these products has been greatly reduced
Deforestation especially in the Amazon Basin can lead to extensive soil erosion and thus the release of mercury previously accumulated in soils Using 2010 figures for deforestation rates around the world and an estimate of soil concentrations of mercury as much as 260 tonnes of mercury may have been released into rivers in 2010 as a result of deforestation worldwide
Because this is the first attempt to quantify global mercury releases to the aquatic environment there is no previous measurement against which these results can be compared Thus it is not possible at this time to evaluate trends in releases
Uncertainties in release estimates Estimating global releases of mercury to aquatic environments is being done here for the first time Many data are missing and others are imprecise A number of assumptions have been made based on what measurements are available or on other grounds to extrapolate from known quantities or to calculate aquatic releases in relation to atmospheric
or other emissions Thus the results should be treated with great caution It is nonetheless clear that anthropogenic sources and human activity contribute hundreds of tonnes of mercury to aquatic environments each year a substantial amount relative to estimated natural releases 150-960 tonnes per year from terrestrial environments
Lapshin Shutterstockcom
Phil Augustavo istockphotocom
Bureau of Land Managem
ent
Contaminated sites (top) erosion following deforestation (middle) and a flooded store of mercury-contaminated waste (lower) illustrate potential sources of mercury releases to water
25
UNEP Global Mercury Assessment 2013
Aquatic pathways transport and fate 8 Mercury in aquatic environments The pathways and fate of mercury in aquatic environments are important because it is in waters sediments and wetland soils that inorganic mercury is converted into methylmercury which is toxic and concentrates in animals The majority of human exposure to mercury and the health risk that comes with mercury exposure is from consumption of marine foods Thus this section focuses on the worldrsquos oceans Some freshwater systems however are important sources of fish for human consumption especially for subsistence and recreational fisheries often among indigenous peoples Artisanal and small-scale gold mining (ASGM) communities may also be affected through fish consumption and drinking water if those are contaminated by local releases
The major processes of mercury cycling are generally similar for all aquatic systems Inorganic mercury in dissolved or particulate form is the dominant mercury type in most marine and fresh waters Dissolved gaseous elemental mercury accounts for less than 30 of total mercury in water Methylmercury is often present at trace levels but may in some settings reach 30 of total mercury In freshwater and coastal environments inorganic mercury is transformed into methylmercury primarily in sediments In the open ocean this conversion takes place largely at intermediate depths between 200 and 1000 meters in the water column Mercury is lost from aquatic systems in two ways When inorganic mercury is reduced to elemental mercury it can be re-emitted to the atmosphere When inorganic mercury binds to particulates in water it can settle out rapidly and be buried in sediments Deep burial in ocean sediments is one of the major pathways by which mercury is removed from the biologically active environment
The global mercury cycle is chemically and physically complex Thus it is necessary to use models to study describe and predict what happens and will happen to mercury in the aquatic environment Until recently only one model existed that incorporated
air land and water into a unified whole The model has been validated against observations of mercury and represents the current scientific consensus The largest potential errors in this model in terms of the aquatic cycle concern details of the exchange of mercury between air and water
Pathways and fate of mercury in the oceans Model simulations suggest that anthropogenic impacts on mercury levels in the ocean are greatest in the surface waters the top 100 meters or so of the water column While model results vary one recent estimate suggests that anthropogenic emissions over the last 100 years have doubled the concentration of mercury in the surface layer of the ocean and increased it by 25 in intermediate waters and by 10 in deep waters The difference is due to the length of time it takes for surface waters to circulate to the depths
Models and measurements agree that direct deposition from the atmosphere is the dominant pathway by which mercury reaches the oceans The exceptions are smaller semi-enclosed basins such as the Mediterranean Sea or the Arctic Ocean where river runoff coastal erosion and ocean currents
Ugo M
ontaldo Shutterstockcom
26
UNEP Global Mercury Assessment 2013
account for about half of mercury inputs The most recent modelling effort suggests that total deposition input of mercury to the oceans in 2008 was 3700 tonnes
Other mercury pathways appear less important on a global basis Rivers are estimated to carry more than 2800 tonnes of mercury each year but only about 380 tonnes of this is transported offshore The rest is trapped by particles in estuaries Groundwater and re-mobilization from sediments provide 100shy800 tonnes of mercury to the oceans each year Undersea hydrothermal vents add less than 600 tonnes of mercury to the oceans There are high concentrations of mercury in vent fluids but a great deal of the mercury is precipitated as solids once the vent fluids enter seawater
Models suggest that globally about 70 of the mercury deposited into the ocean is re-emitted to the atmosphere Oxidized mercury in surface waters is reduced by biological and photochemical processes to the elemental form that is volatile and readily re-emitted The removal of this mercury ultimately reduces the pool of mercury that could be converted to methylmercury and be accumulated by marine organisms The re-emission process thus simultaneously prolongs the lifetime of mercury cycling through the atmosphere and upper ocean and acts to reduce mercury availability for marine food webs
Any changes in the efficiency of mercury reduction in surface waters or the rate of re-emission is likely to impact mercury concentrations in surface waters and the air One example is the effect of sea ice in the Arctic Ocean which blocks the re-emission
Tony Magdaraog Shutterstockcom
Mercury accumulated in marine food-webs can enter the human diet
of elemental mercury leaving elevated levels in waters under ice Changes in primary productivity could change the rate at which mercury is bound to particles thus affecting re-emission to the atmosphere as well as rates of downward transport in the ocean Changes in oxidant levels in the atmosphere such as ozone and bromine may also influence the rate of oxidation of gaseous elemental mercury and thus deposition rates to the ocean
Methylmercury in the ocean Natural bacterial processes in seawater and in sediments in coastal environments convert inorganic mercury to methylmercury Methylmercury levels are highest in the subsurface waters of many oceans because it is formed at these intermediate depths likely as a result of the decomposition of organic material falling from surface waters Current understanding indicates that about 300 tonnes of methylmercury is produced in the upper ocean by this and related processes By contrast only about 80 tonnes of methylmercury reaches the ocean from other sources such as atmospheric deposition rivers and diffusion from sediments
Current modelling indicates that methylmercury stays in the upper ocean for about 11 years Deshymethylation by photochemical reaction or by microbial activity is the major removal process for methylmercury in the ocean About 240 tonnes of methylmercury is removed by this process from the surface waters of the ocean per year
The other important pathway for methylmercury in seawater is uptake into marine food webs Although only about 40 tonnes per year is taken up in this way it is this fraction that poses risks to marine animals and human consumers of seafood Methylmercury is a problem for several reasons First it is taken up by plankton much more efficiently than is inorganic mercury resulting in concentrations in plankton that are as high as 10000 times the concentration in seawater Second methylmercury is absorbed through the intestine of animals much more easily than is inorganic mercury Third methylmercury biomagnifies as it moves up the food web Thus methylmercury becomes an increasingly greater proportion of the mercury in organisms higher in the food web This explains why some indigenous populations that consume top marine predators such as fish seals and whales have some of the worldrsquos highest concentrations of methylmercury giving rise to health concerns
27
UNEP Global Mercury Assessment 2013
Pathways and fate of mercury in freshwater Observations and modelling both show that there are in general many similarities between mercury chemistry pathways and fate in lakes and in the oceans but with obvious differences in scale and in the relative importance of different processes Modelling of mercury dynamics was done for four lakes with a history of direct mercury inputs from the largest freshwater lake in the world (Lake Superior) to small lakes in Ontario Canada Atmospheric deposition and river inflow were the main sources of inorganic mercury Much of the mercury input from lake and river catchments was associated with dissolved and particulate organic matter The dominant mercury removal mechanisms as in saltwater were burial in sediments and photochemical reduction of oxidized mercury to elemental mercury followed by re-emission to the air In Lake Superior and Lake Michigan there is evidence for methylation of mercury in the water column as is seen in the open ocean
Methylmercury levels in freshwater fish vary with the level of deposition of mercury from the air though other factors such as inputs from the watershed and the number of trophic levels within the lakersquos food web are also important Methylation predominantly occurred in lake sediments and wetlands and floodplain soils where sulphateshyreducing bacteria are believed to be primarily responsible Methylmercury is de-methylated in sediments and also taken away in the outlet river from each lake
Some 400-1400 tonnes of mercury are estimated globally to be trapped behind dams and other man-made impoundments each year This has in many cases led to significant increases in total mercury and methylmercury levels in water and of methylmercury in fish and other aquatic species When artificial lakes are created plant material is submerged leading to decay and anoxia In these conditions microbially driven methylation of inorganic mercury takes place In some cases the elevated mercury levels have also been observed downstream from the artificial lakes and reservoirs
Anthropogenic impacts on aquatic mercury levels Two studies have reported that the Atlantic and Pacific Oceans have shown opposing trends over recent decades While the influence of changing ocean currents and other oceanographic factors may be a factor the trends do make sense in light of patterns of anthropogenic emissions In the North Pacific Ocean mercury concentrations appear to have increased at depths between 200 and 1000 meters over the last few decades This increase coincides with the rapid industrialization of East Asia
In the North Atlantic however results from near Bermuda suggest a substantial decrease in mercury concentration and a change in the mercury profile through the water column The Mediterranean Sea too showed a decrease in mercury concentration between 1990 and 2004 These findings are consistent with atmospheric data from around the North Atlantic The conclusion is that mercury levels in seawater in the North Atlantic were elevated by human activity but may now be declining likely as a result of decreased emissions from North America and Europe
A complementary approach to measuring mercury in seawater is to measure mercury in aquatic animals which accumulate and integrate mercury over time Teeth hair feathers and eggshells are useful long-term archives of mercury concentrations and can provide data from the pre-industrial period (ie before 1800) as well as more recent periods
Among marine animals samples are available from several regions particularly from the Arctic where cold dry conditions help preserve animal tissues Mercury concentrations between the 13th and 16th
centuries were relatively stable From the mid- to late 19th century to the end of the 20th century mercury levels increased by an average of 12 times On average therefore about 92 of the mercury in Arctic marine wildlife today is likely to be of anthropogenic origin
Similar findings were found for a 700-year sequence of seabird eggshells from the South China Sea Mercury levels increased steadily between 1800 and 2000 with a particularly rapid increase after 1970 Concentrations since 2000 are about 10 times higher than pre-industrial levels with 91 of the mercury now likely to be of anthropogenic origin In the Antarctic studies of seal hairs show that pre-industrial mercury levels were only 60 of recent levels The relatively small difference
28
UNEP Global Mercury Assessment 2013
Historical Hg concentration as a proportion of present-day 100
80
60
40
20
0
Beluga teeth Human teeth
Gyrfalcon feathers Perigrine falcon feathers
Polar bear hair Ringed seal teeth
1200 1300 1400 1500 1600 1700 1800 1900 2000
between pre-industrial and modern mercury levels in Antarctic is consistent with lower mercury emissions and atmospheric concentrations in the Southern Hemisphere as compared with the Northern Hemisphere
The timing of long-term increases of mercury in aquatic animals can shed light on the likely sources of mercury emissions that were responsible The industrialization of Europe and North America appear responsible for the large increases in marine mercury levels that began in the 19th century as these increases occurred prior to recent Asian industrialization As with water concentrations in the Pacific Ocean recent rapid increases in mercury in seabird eggs in the South China Sea coincide with industrialization in Asia
The time lag in aquatic ecosystem response One important conclusion from air-ocean modeling is that the oceans have not yet reached equilibrium with current atmospheric levels of mercury This lag is due to several factors First mercury stays in the upper ocean above 200 meters depth for about 30 years and for centuries in intermediate and deep waters This is much longer than the one year residence time in the lower atmosphere Thus removal from the ocean takes much longer than does removal from the air and so concentrations will change more slowly
Second because of the long lifetime of mercury in deeper ocean waters a great deal of natural mercury is present in the ocean already about 100000 tonnes out of a total of 135000 tonnes in intermediate waters and 200000 out of 220000 tonnes in deep waters
Rune Dietz
Analysis of museum samples reflects the increase in mercury emissions and releases since the mid-19th century associated with anthropogenic activities
Third vertical transport of mercury from intermediate depths back to the surface returns a substantial amount of mercury to the biologically active zone each year As a result average mercury concentrations in seawater and marine animals are likely to increase slowly for decades if not centuries even if atmospheric levels stabilize at present levels In short the effects of historical anthropogenic emissions from Europe and North America are still being observed in the oceans at the same time that the effects of the recent rise in emissions from Asia are being seen
Regionally different trends can be expected depending on distance from sources and ocean circulation patterns In the North Atlantic north of 55deg N it will take 50-600 years to achieve equilibrium between atmospheric and seawater mercury levels In the North Pacific this process is estimated to take 500-700 years and in the Antarctic 700-1000 years The Arctic Ocean by contrast is smaller and will only take about 35 years to reflect changes in atmospheric mercury levels Surface waters of the Mediterranean Sea should show also changes within 10-50 years
Time lags in the responses of many freshwaters and their food-webs to changes in atmospheric mercury levels are also expected Although some immediate recovery following reductions in atmospheric mercury deposition rates is likely full recovery may take decades centuries or longer depending on the characteristics of the area Highly polluted freshwaters with catchments and sediments containing large amounts of anthropogenic mercury will recover most slowly as is already observed around point sources such as smelters that have closed down
29
UNEP Global Mercury Assessment 2013
Major gaps in knowledge 9 Large uncertainties remain in global estimates of mercury emissions to the air These stem from various sources including the availability of information on activity levels but mainly from the lack of information concerning the mercury content of some raw materials and the validity of assumptions regarding processes and technologies employed to reduce mercury emissions including their rates of application and effectiveness The accuracy and precision of measurement-based estimates can depend on the validity of extrapolating measurements made at infrequent intervals to longer periods or measurements made at one plant to other facilities with similar operations
Potentially important emissions sectors that are still not quantified in the emissions inventory include the use of mercury in vinyl-chloride monomer production secondary metals production oil and gas extraction transport and processing industrial and hazardous waste incineration and disposal sewage sludge incineration and dental fillings preparation and removal
Current measurements and their evaluation are inadequate for determining spatial and temporal trends Improved more extensive and better coordinated measurements are needed A permanent global integrated monitoring network for atmospheric mercury and mercury deposition is needed to achieve this goal The atmospheric network sites should be closely integrated with water soil and biological monitoring networks The results can be used for model testing and evaluation as well as for more accurately detailing the geographic impact of anthropogenic emissions Monitoring of mercury concentrations in the important marine food species is essential to understanding possible human health impacts and the effects of future emissions changes
Better data on mercury distribution in the troposphere is needed to improve understanding of long-range transport and source-receptor relationships Coordinated studies at high altitudes and by aircraft are needed This information will
also help validate regional and global scale models improving their prediction capabilities with regard to different policy scenarios
Key processes related to global transport and cycling of mercury remain inadequately understood The chemical form of gaseous oxidized mercury is unknown Reduction and oxidation rates for mercury in the presence of atmospheric oxidants need further study including determining which oxidants are important New measurements and modelling studies are needed to examine key chemical and physical processes that affect global transport and cycling
Few data are available for reporting mercury releases to aquatic systems Systematic and consistent monitoring of mercury releases to the air is required especially for contaminated systems Releases of mercury from soils into waters depend greatly on climate and topography and these parameters need to be better accounted for Consistent approaches for measuring and reporting releases from point sources are needed to ensure comparability of data from around the world In particular the actual role of artisanal and small-scale gold mining (ASGM) in emissions to air and releases to water needs to be more accurately estimated
The link between mercury deposition methylation and uptake by living organisms needs further study The parameters that determine the rates of exchange of mercury compounds between air and sea air and soil and air and vegetation are not fully understood Whole-ecosystem studies of mercury are needed to better understand biogeochemical cycling Methylationdemethylation rates and their spatial and temporal variations and relationship to climatic factors need to be determined in most of worldrsquos major ocean basins as well as in representative freshwaters
30
UNEP Global Mercury Assessment 2013
Key findings of the 2013 assessment 10 Atmosphere Total anthropogenic emissions of mercury to the atmosphere in 2010 are estimated at 1960 (1010shy4070) tonnes which is about 30 of the total mercury that was emitted and re-emitted from anthropogenic and natural sources in that year The largest anthropogenic sources are associated with artisanal and small-scale gold mining (ASGM) and coal burning which together account for about 62 of the annual total anthropogenic emissions to air Other major sectors include ferrous and non-ferrous metal production and cement production
East and Southeast Asia are responsible for about 40 of global anthropogenic emissions About 75 of the mercury from this region comes from China which is about one-third of the global total Increased estimates for emissions from ASGM largely a result of newly obtained data and improved information mean that South America and Sub-Saharan Africa are also responsible for a greater proportion of global emissions than was previously assumed
Anthropogenic emissions over time have increased mercury loads present in the environment This leads to higher rates of re-emission and also means that there will be a time lag of years or decades between emissions reductions and lower mercury levels in the food web including pathways of human exposure
Mercury emissions to the atmosphere likely peaked in the 1950s to 1970s and subsequently declined because of reductions in Europe Russia and North America Emission trends are unclear due to changes in methods employed to produce inventories and differences in the sectors that have been accounted at different times There are however some indications that emissions may be rising again with increases from East Asia offsetting continuing reductions in Europe and North America
Aquatic environments Natural processes in aquatic systems convert less toxic elemental and inorganic mercury into much more toxic methylmercury Methylmercury concentrates and accumulates in the food web leading to high concentrations in some species of seafood and fish that many people eat
Anthropogenic releases of mercury to aquatic environments contribute hundreds of tonnes to the amount of mercury cycling in the environment Diffuse releases and point sources appear equally important Atmospheric deposition however remains the most important input of mercury to land and oceans and has increased the amount of mercury in many environmental compartments by a factor of two or three since the start of the industrial age On land mercury that is deposited is largely retained in soils and vegetation increasing the available pool for re-mobilisation to adjacent aquatic systems Re-emission from soils however is a major addition to atmospheric mercury
Hydrology is the most important factor in the transport of mercury from catchments to downstream environments Relatively little of this mercury reaches the open ocean as most is captured in sediments behind dams in estuaries and near the coast Changes in land cover and land use can have a large effect on mercury mobilisation as exposed soils erode and mercury leaches into the water table
Concentrations of mercury in Arctic marine animals today are about 10-12 times higher than in preshyindustrial times (ie prior to about 1800) This means that on average about 92 of the mercury in marine predators such as seabirds seals and whales is anthropogenic in origin The timing of the increase suggest that 19th and early 20th century emissions from Europe North America and Russia were responsible Increases mercury concentrations in seabirds in the South China Sea appear to be more recent than the Arctic increases coinciding with increasing industrialisation in East and Southeast Asia
31
UNEP Global Mercury Assessment 2013
K+S Entsorgung Gm
bH
Recovered mercury is being stockpiled at long-term storage sites above- and as shown here below ground
The upper 100 meters of the oceans have twice the mercury that they did a century ago Intermediate and deeper waters have 10-25 more mercury on average reflecting the slow transport of mercury downwards in the oceans Seawater concentrations will thus be especially slow in responding to changes in mercury inputs from atmospheric deposition and river flow As a result mercury concentrations in marine biota are likely to increase slowly for decades to centuries even without an increase in atmospheric emissions
In freshwater ecosystems atmospheric deposition and re-mobilisation from soils slow the reduction of mercury levels even in regions where atmospheric concentrations have decreased due to emission controls
Further increases in atmospheric emissions will have long-term consequences for commercial fisheries and all consumers of marine and freshwater foods
It is likely to be years or decades before reductions in anthropogenic emissions and releases of mercury have a demonstrable effect on mercury levels throughout the environment and in the fish and marine mammals which are part of the human food-chain This only reinforces the need to act now to continue and strengthen international efforts to reduce current mercury emissions and releases Delays in action now will inevitably lead to slower recovery of the worldrsquos ecosystems in future from mercury contamination leaving an even greater legacy of pollution for future generations
32
Division of Technology Industry and Economics (DTIE) Chemicals Branch Geneva Switzerland January 2013
Job number DTI1636GE
Copyright copy United Nations Environment Programme 2013
Citation UNEP 2013 Global Mercury Assessment 2013 Sources Emissions Releases and Environmental Transport UNEP Chemicals Branch Geneva Switzerland
Disclaimer The designations employed and the presentation of the material in this publication do not imply the expression of any opinion whatsoever on the part of the United Nations Environment Programme concerning the legal status of any country territory city or area or of its authorities or concerning delimitation of its frontiers or boundaries Moreover the views expressed do not necessarily represent the decision or the stated policy of the United Nations Environment Programme nor does citing of trade names or commercial processes constitute endorsement
Reproduction This publication may be produced in whole or in part and in any form for educational or non-profit purposes without special permission from the copyright holder provided acknowledgement of the source is made Material in this report can be freely quoted or reprinted UNEP would appreciate receiving a copy of any publication that uses this report as a source
No use of this publication may be made for resale or for any other commercial purpose whatsoever without prior permission in writing from the United Nations Environment Programme
Funding The work has been funded by the Governments of Canada Denmark Japan Sweden Norway the Nordic Council of Ministers and the EU
Produced by UNEP Division of Technology Industry and Economics Chemicals Branch International Environment House 1 11-13 Chemin des Aneacutemones CH -1219 Chacirctelaine Geneva Switzerland
Tel +41 (0) 22 917 12 34 Fax +41 (0) 22 797 34 60 Email metalschemicalsuneporg Website httpuneporghazardoussubstances
The report can be found on UNEP Chemicals Branchrsquos website httpwwwuneporghazardoussubstancesMercuryInformationmaterialsReportsandPublications tabid3593Defaultaspx
UNEP promotes environmentally sound practices globally and in its own activities This publication is printed on paper from environmentally-managed forests using vegetable-based inks and other eco-friendly practices Our distribution policy aims to reduce UNEPrsquos carbon footprint
Lay-out and technical production Burnthebook Design Derby DE24 8HR United Kingdom (burnthebookcouk)
Printing Narayana Press Gylling DK-8300 Odder Denmark (wwwnarayanapressdk) a swan-labelled printing company 541 562
Cover photo Tuna fish (Ugo Montaldo Shutterstockcom) Marine food-webs are an important route of human dietary exposure to mercury
UNEP Global Mercury Assessment 2013
Table of Contents
Executive Summary i 1 Introduction 1 2 Sources of mercury emissions to air and releases to water 4 3 Anthropogenic emissions to the atmosphere 9 4 Trends in mercury emissions to the atmosphere 16 5 Atmospheric chemistry monitoring and trends 19 6 Atmospheric concentrations and deposition 22 7 Anthropogenic releases to the aquatic environment 24 8 Aquatic pathways transport and fate 26 9 Major gaps in knowledge 30 10 Key findings of the 2013 assessment 31
UNEP Global Mercury Assessment 2013
UNEP Global Mercury Assessment 2013
Executive Summary
Mercury is a global threat to human and environmental health This report focusing on anthropogenic emissions of mercury and their transport and transformation in the environment is a contribution to international efforts to reduce mercury pollution
This summary report and the accompanying Technical Background Report for the Global Mercury Assessment 2013 are developed in response to Decision 255 paragraph 36 of the Governing Council of the United Nations Environment Programme (UNEP) that
Requests the Executive Director in consultation with Governments to update the 2008 report entitled
ldquoGlobal Atmospheric Mercury Assessment Sources Emissions and Transportrdquo for consideration by the Governing CouncilGlobal Ministerial Environment Forum at its twenty-seventh session
The report provides the most recent information available on worldwide atmospheric mercury emissions releases to the aquatic environment and the transport and fate of mercury in the global environment The report emphasizes emissions to air from human (anthropogenic) activities but includes releases to water because the aquatic environment is the main route of exposure to humans and wildlife It is in aquatic systems that the inorganic mercury is transformed into the more toxic form methylmercury which can accumulate in fish and marine mammals consumed by humans
This Executive Summary presents an overview of the key findings of the Global Mercury Assessment 2013
Total anthropogenic emissions of mercury to the atmosphere in 2010 are estimated at 1960 tonnes2
The 2010 emissions inventory has several improvements over the previous inventory for 2005 including
bull A more detailed analysis of emissions from some major source sectors
1 tonne = 1000 kilograms
bull A more detailed consideration of the mercury content of fuels and raw materials used in different countriesregions bull New and updated information on artisanal and
small-scale gold mining bull The use of different pollution control technologies
in different countries and regions have been factored into the emissions estimates bull Emission estimates for sectors not previously
included such as aluminium production oil refining and contaminated sites bull More and better information on location of major
point sources such as individual power plants smelters and cement kilns bull Better documentation and greater transparency
with respect to the data and information behind the estimates
Using this approach the global emissions to air from anthropogenic sources is estimated as 1960 tonnes in 2010 Despite recent progress in improving the available knowledge base the emissions estimate still has large associated uncertainties giving a range of 1010-4070 tonnes The work also identifies potentially important sectors that are not yet quantified including use of mercury in vinyl-chloride monomer production secondary metals production and ferro-alloys oil and gas extraction and transport and industrial and some hazardous waste incineration
Present day anthropogenic emissions contribute to both current and future emissions to the air
Current anthropogenic sources are responsible for about 30 of annual emissions of mercury to air Another 10 comes from natural geological sources and the rest (60) is from lsquore-emissionsrsquo of previously released mercury that has built up over decades and centuries in surface soils and oceans Although the original source of this re-emitted mercury cannot be determined with certainty the fact that anthropogenic emissions have been larger than natural emissions since the start of the industrial age about 200 years
2
i
UNEP Global Mercury Assessment 2013
ago implies that most re-emitted mercury was originally from anthropogenic sources Reducing current anthropogenic sources is therefore vital to reduce the amount of mercury that is cycling in the environment
Artisanal and small-scale gold mining and coal burning are the major sources of anthropogenic mercury emissions to air
The inventory confirms the role of artisanal and small-scale gold mining (ASGM) and coal burning as the largest components of anthropogenic emissions followed by the production of ferrous and non-ferrous metals and cement production
Annual emissions from ASGM are estimated at 727 tonnes making this the largest sector accounting for more than 35 of total anthropogenic emissions This is more than twice the figure from this sector in 2005 however most of the increase is attributed to some new and better information For example West Africa was thought in 2005 to have minimal ASGM activity but is now recognized as an important source region It is thus difficult to determine whether actual emissions from this sector have changed because their estimation involves a great deal of uncertainty Much of the activity is unregulated or even illegal and thus reliable official data are still hard to obtain More work is needed to confirm the emissions estimates from this sector including field measurements around ASGM sites to better establish the amounts and fate of the mercury used
A large amount of coal is burned around the world to generate electricity to run industrial plants and for in-home heating and cooking Coal burning emitted some 475 tonnes of mercury in 2010 the majority of which is from power generation and industrial use The estimate of emissions from other coal burning (including domestic and residential burning) is lower than that reported in the previous global assessment due to differences in estimates of the amounts and mercury content of coal burned in these uses Use of coal for power generation and industry is increasing especially in Asia However wider use of air pollution controls and more stringent regulations in several countries together with improved combustion efficiency have reduced emissions from coal-burning power plants helping to offset most of the increase arising from higher coal consumption
Global anthropogenic mercury emissions from industrial sources may be rising
Emissions to air are thought to have peaked in the 1970s declined over the following two decades and have been relatively stable between 1990 and 2005 There were some indications of slight increases in emissions between 2000 and 2005
Any evaluation of trends needs to take into account changes in reporting and methods used to produce inventory estimates including the introduction of additional sectors Thus a direct comparison of the results of global inventories produced over the past 25 years is not possible A preliminary reshycalculation using the improved methodology of global anthropogenic emissions in 2005 indicates that emissions from fossil fuel combustion metal and cement production increased between 2005 and 2010 but continue to decline in other sectors such as the chlor-alkali industry Overall indications are that emissions from industrial sectors have increased again since 2005
Future emission trends have been examined using scenarios and models Without improved pollution controls or other actions to reduce mercury emissions mercury emissions are likely to be substantially higher in 2050 than they are today
Comparing emissions estimates reported under different reporting systems is not straightforward
The 2010 global inventory results were generally consistent with nationally reported emissions estimates for 2010 providing a degree of confidence in the methods used However comparing estimates for individual countries and sectors is complicated by differences in reporting methods in particular the specification and categorisation of sectors used in different national and international reporting systems National emissions estimates based on individual facility reporting and site measurements should be more accurate than those based on the global inventory methodology However this is difficult to evaluate as most nationally reported inventories lack estimation of associated uncertainties It is also important to recognize that many measurement-based estimates are based on relatively few measurements covering short periods that are then extrapolated to produce annual emissions It is important that all reporting is subject to validation and that associated uncertainties are quantified If different reporting systems are to be compared they need to be better aligned in terms of the emission sources that are identified and used
ii
UNEP Global Mercury Assessment 2013
Asia contributes almost half of global anthropogenic mercury emissions
Increasing industrialization has made Asia the main source region of mercury emissions to air with East and Southeast Asia accounting for about 40 of the global total and South Asia for a further 8 The new data on ASGM and the related increase in emission estimates from this sector have increased South America and sub-Saharan Africarsquos share of global emissions However modelling results continue to indicate that East Asia is the dominant source region for long-range airborne mercury transport worldwide
Anthropogenic releases of mercury to water total 1000 tonnes at a minimum
Previous UNEP global mercury assessments considered only atmospheric emissions The 2013 report is thus the first attempt to compile a global inventory of aquatic releases Three types of sources were considered Point sources are industrial sites such as power plants or factories and they release an estimated 185 tonnes of mercury per year Contaminated sites including old mines landfills and waste disposal locations release 8 - 33 tonnes per year Artisanal and small-scale gold mining was evaluated separately with total releases to water and land totalling more than 800 tonnes per year Deforestation mobilizes another 260 tonnes of mercury into rivers and lakes Other sources remain to be quantified and so these estimates comprise only a partial total Thus anthropogenic releases to waters are likely to be at least 1000 tonnes per year
Mercury concentrations in the oceans and in marine animals have risen due to anthropogenic emissions
Anthropogenic emissions and releases have doubled the amount of mercury in the top 100 meters of the worldrsquos oceans in the last 100 years Concentrations in deeper waters have increased by only 10-25 because of the slow transfer of mercury from surface waters into the deep oceans In some species of Arctic marine animals mercury content has increased by 12 times on average since the pre-industrial period This increase implies that on average over 90 of the mercury in these marine animals today comes from anthropogenic sources The timing of the initial stage of the increase which started in the mid-19th century and accelerated in the early 20th century before the rise of Asian industrialization indicates emissions from Europe Russia and North America were probably responsible Studies from the South China
Sea suggest a similar pattern occurring there more recently likely as a result of Asian industrialization
Monitoring capability continues to improve but whether this can be sustained is uncertain
Existing mercury monitoring networks such as the European Monitoring and Evaluation Programme (EMEP) the Arctic Monitoring and Assessment Programme (AMAP) the North American Mercury Deposition Network (NAMDN) and others in the northern hemisphere have been complemented by new monitoring sites in the southern hemisphere in particular some sites established under the Global Mercury Observing System (GMOS) initiative The longer-term status of many of the newly established sites however depends on availability of sustained funding to continue operations
Anthropogenic emissions and releases over time have increased mercury loads in the environment so the effects of reductions in emissions will often take time to become apparent
Large amounts of mainly inorganic mercury have accumulated in the environment in particular in surface soils and in the oceans as a result of past emissions and releases Owing to their larger volumes intermediate and deep ocean waters below 100 metres actually store much larger tonnages of anthropogenic mercury than surface waters There are also relatively large tonnages of natural mercury circulating in the intermediate and deep waters A significant fraction of the mercury in intermediate waters is recycled back to the surface each year by upwellings Todayrsquos anthropogenic emissions continue to load the oceans and the catchments and sediments of lakes and rivers with inorganic mercury This mercury which is the ldquofeed-stockrdquo for toxic methylmercury production is stored and reshycycled in the bioavailable part of the environment for decades or centuries before it eventually is removed by natural processes One consequence is that there will likely be a time-lag of years or decades depending on the part of the water column before emissions reductions begin to have a demonstrable effect on mercury levels throughout the environment and in the fish and marine mammals which are part of the human food-chain At the same time mercury levels in parts of the Atlantic Ocean are decreasing likely due to reduced emissions in past decades in North America and Europe indicating that emissions reductions can eventually lead to decreases in mercury levels in surface oceans This reinforces the need to continue and strengthen
iii
UNEP Global Mercury Assessment 2013
international efforts to reduce current mercury emissions and releases as delays in action now will inevitably lead to slower recovery of the worldrsquos ecosystems in future from mercury contamination
Global climate change may also complicate the response of global ecosystems to mercury emission reductions through its profound effects on many aspects of the movement and chemical transformations of mercury in the environment For example warmer temperatures may increase rates of organic productivity in freshwater and marine ecosystems and rates of bacterial activity possibly leading to faster conversion of inorganic mercury to methylmercury Thawing of the enormous areas of northern frozen peatlands may release globally-significant amounts of long-stored mercury and organic matter into Arctic lakes rivers and ocean
iv
UNEP Global Mercury Assessment 2013
Introduction
Background and mandate Global inventories for mercury emissions to air from human sources have been produced at approximately 5-year intervals since 1990 by scientific groups UNEP produced its first Global Mercury Assessment in 2002 In 2007 the Governing Council of UNEP through its decision 243 requested the Executive Director of UNEP
to prepare a report drawing on among other things ongoing work in other forums addressing
(a) Best available data on mercury atmospheric emissions and trends including where possible an analysis by country region and sector including a consideration of factors driving such trends and applicable regulatory mechanisms
(b) Current results from modelling on a global scale and from other information sources on the contribution of regional emissions to deposition which may result in adverse effects and the potential benefits from reducing such emissions taking into account the efforts of the Fate and Transport partnership established under the United Nations Environment Programme mercury programme
The results of this request were presented as a summary report entitled ldquoThe Global Atmospheric Mercury Assessment Sources Emissions and Transportrdquo released in December 2008 and an accompanying ldquoTechnical Background Report to the Global Atmospheric Mercury Assessmentrdquo
The technical background report which formed the basis for statements made in the summary report and was prepared in cooperation with the Arctic Monitoring and Assessment Programme (AMAP) Secretariat included an updated inventory of anthropogenic emissions of mercury to the atmosphere The inventory was based on national emissions data for the year 2005 submitted by governments as well as estimates prepared for countries that did not provide data and was coordinated with work related to mercury under the UN Economic Commission for Europe Convention
1
UNEPrsquos 2008 Global Atmospheric Mercury Assessment Report
on Long-range Transboundary Air Pollution (LRTAP) The report also drew on the work of the UNEP Global Mercury Partnership in particular the Mercury Air Transport and Fate Research partnership area
In 2009 the Governing Council of UNEP through its Decision 255 paragraph 36 requested the Executive Director of UNEP
hellip in consultation with Governments to update the 2008 report entitled Global Atmospheric Mercury Assessment Sources Emissions and Transport for consideration by the Governing CouncilGlobal Ministerial Environment Forum at its twenty-seventh session
This updated Global Mercury Assessment 2013 and its accompanying and updated Technical Background Report are the response to that Governing Council request
Developing the 2013 Report As in 2008 the Technical Background Report for the Global Mercury Assessment 2013 forms the basis for the statements made in the Summary
1
UNEP Global Mercury Assessment 2013
Report and is fully referenced according to standard scientific practice As such it is the single reference for the Summary Report It has again been prepared in co-operation with the Arctic Monitoring and Assessment Programme (AMAP) and uses national data and information submitted by several governments Contributions have also been incorporated from the UNEP Global Mercury Partnership in particular its partnership areas on mercury control from coal combustion reducing mercury in artisanal and small-scale gold mining (ASGM) and mercury air transport and fate AMAP mercury expert group UN Economic Commission for Europe (UN ECE) Long-range Transboundary Air Pollution (LRTAP) Convention groups industry and non-governmental organizations Each section was prepared by a team of experts and then reviewed to ensure its scientific accuracy The evaluation of information of mercury released into the aquatic environment benefits from contributions from the Group of Experts on Scientific Aspects of Marine Environmental Protection (GESAMP)
Scope and coverage This update to the Global Mercury Assessment provides the most recent information available for the worldwide emissions releases and transport of mercury in atmospheric and aquatic environments To the extent possible the information comes from the published scientific literature supplemented where necessary by other sources Since the Global Mercury Assessment is intended as a basis for decision making emphasis is given to anthropogenic emissions (mercury going into the atmosphere) and releases (mercury going into water and land) that is those associated with human activities
The Technical Background Report includes a detailed inventory of global mercury emissions to air based on data for 2010 ldquoInventoryrdquo in this context means a compilation of the estimated emissions and releases from various sectors and sources While it attempts to catalogue all major sources of mercury emissions worldwide it should not be regarded as complete and exhaustive
In addition for the first time this Global Mercury Assessment includes an evaluation of information of mercury released into the aquatic environment and its associated pathways and fate The information available for this evaluation is less complete than
that for emissions to air and is based on data from recent years The inclusion of this new element of the Global Mercury Assessment is as a response to the requests from many governments in the Intergovernmental Negotiating Committee (INC) for more information on releases to land and water The aquatic environment is the main route of exposure to humans and wildlife because it is in water that inorganic mercury is transformed into highly toxic methylmercury
The Technical Background Report includes chapters on
bull Global Emissions of Mercury to the Atmosphere describing sources anthropogenic emissions and trends in emissions bull Atmospheric Pathways Transport and Fate
examining pathways levels and trends in air and deposition and modelling of pathways and deposition bull Global Releases of Mercury to Aquatic Environments
containing global estimates of releases to water and bull Aquatic Pathways Transport and Fate examining
mercury pathways in aquatic systems that result in important routes of human exposure
Technical Background Report chapters were prepared by teams of experts and then reviewed to ensure their scientific validity This Summary Report is based on the content of the Technical Background Report and has been reviewed by the authors of the Technical Background Report It was also circulated for national review
This Summary Report provides in Chapter 2 an overview of natural and anthropogenic sources of mercury outlining the main sectors involved The global inventory of anthropogenic emissions to air is presented in Chapter 3 and Chapter 4 describes trends in mercury emissions to the atmosphere What happens after mercury is released to the atmosphere is covered in Chapter 5 on atmospheric chemistry monitoring and deposition and Chapter 6 on atmospheric concentrations and deposition Chapter 7 provides a first attempt to estimate global releases to water followed in Chapter 8 by a discussion of aquatic pathways transformations and fate A review of gaps in knowledge is given in Chapter 9 Chapter 10 summarizes key findings
2
UNEP Global Mercury Assessment 2013
Whatrsquos new in the Global Mercury Assessment 2013 Global mercury emissions inventories continue to improve as new data and better data become available concerning some sources The method for compiling the inventory of anthropogenic emissions to the atmosphere has also been revised and improved Differences in air pollution control technologies and differences in the mercury content of raw materials and fuels in different countries and regions have been factored into emissions calculations to better reflect actual conditions in each country
In the Global Mercury Assessment 2013 a new updated inventory based on data from 2010 is presented in which some new sources (including emissions from combustion of natural gas and primary aluminium production and emissions associated with oil refining) have been quantified for the first time A more detailed analysis has also been made of some of the major mercury emission sectors including the break-down of emissions from coal burning in power plants industrial and other uses In addition new information acquired through the UNEP Global Mercury Partnership area on Reducing Mercury in Artisanal and Small-scale Gold Mining in particular from the Artisanal Gold Council has resulted in a significant re-evaluation of emissions from the ASGM sector
New observational data and new modelling results provide fresh insight into atmospheric mercury transport and fate
Kevin Telmer
One of the objectives of the updated assessment has been to provide transparent documentation and comprehensive compilations of the data that form the basis for all of the estimates presented This approach will allow a more consistent and replicable method for compiling the global mercury emission inventory so that valid comparisons can be made in the future In addition a wider range of experts from around the world have been involved in preparing the Technical Background Report on which this summary is based
The inclusion of an assessment of releases of mercury to the aquatic environment and its subsequent pathways and fate is a further significant development as these topics were not addressed in the 2008 UNEP Global Atmospheric Mercury Assessment The aquatic environment is critical for three reasons
bull Hundreds of tonnes of mercury is released directly into water so an inventory limited to mercury emissions to air provides an incomplete assessment of anthropogenic impacts on the mercury cycle
bull Mercury in aquatic environments can be transformed into methylmercury which is far more toxic to humans and animals and can enter and biomagnify in food webs more readily than other forms of mercury bull Much human exposure to mercury is through
the consumption of fish and other marine foods making aquatic pathways the critical link to human health
A large open artisanal and small-scale gold mining pit
3
UNEP Global Mercury Assessment 2013
Sources of mercury emissions to air and releases to water 2 Mercury is a naturally occurring element and is found throughout the world There are thus many natural sources of mercury creating background environmental levels that have been present since long before humans appeared
Mercury is contained in many minerals including cinnabar an ore mined to produce mercury Much of the present day demand for mercury is met by supply from mercury recovered from industrial sources and stockpiles rather than from mercury mining Mercury is also present as an impurity in many other economically valuable minerals in particular the non-ferrous metals and in fossil fuels coal in particular
Human activity especially mining and the burning of coal has increased the mobilization of mercury into the environment raising the amounts in the atmosphere soils fresh waters and oceans The majority of these human emissions and releases of mercury have occurred since 1800 associated with the industrial revolution based on coal burning base-metal ore smelting and gold rushes in various parts of the world To some extent the same drivers of mercury emissions and releases are continuing with fossil-fuel-based energy generation powering industrial and economic growth in Asia and South America which in turn helps drive high demand for metals including gold spurring artisanal and small-scale gold mining (ASGM) around the world
In preparing inventories of mercury emissions and releases it is important to distinguish various categories of sources Three main types of emissions and releases can be distinguished each of which is briefly introduced here in qualitative terms with particular emphasis on anthropogenic sources
Natural sources of mercury emissions and releases Mercury in the earthrsquos crust can be emitted and released in several ways to air water and land Natural weathering of mercury-containing rocks
farbled Shutterstockcom
Cinnabar the principal ore of mercury
Year 2000
1950
1900
1850
1800
1750
1700
Mt St Helens (1980)
Industrial period
WWII manufacturing
Krakalau (1883)
Gold rush (circa 1850-84)
Tambora (1815)
Pre-industrial period
1998 core 1991 core Natural background Natural events (volcanic eruptions) Localregional anthropogenic sources Global anthropogenic (industrialization)
0 5 10 15 20 25 30 35 40 Total mercury ngL
Ice core record of deposition from Wyoming USA The elevated levels associated with the 1850-84 US gold rush probably reflect localregional sources rather than a global signature Increasing environmental levels of mercury associated with industrialization however are found in environmental archives like this ice core around the globe
4
UNEP Global Mercury Assessment 2013
Global mercury cycling Mercury is released to the environment from natural sources and processes and as a result of human activities Once it has entered the environment mercury cycles between air land and water until it is eventually removed from the system through burial in deep ocean sediments or lake sediments and
through entrapment in stable mineral compounds Methylmercury the most toxic and bioaccumulative form of mercury which presents the greatest health risk to humans and wildlife is mainly formed in aquatic environments through natural microbial processes
80shy600
3700
2000shy2950
2000 300shy600
1700shy2800
3200
380
lt600
Geogenic Anthropogenic
Anthropogenic Biomass burning
Soil and vegetation
Deposition to oceans
Rivers
Deposition to land
freshwater
Geogenic
Oceans
Anthropogenic
Natural
Re-emissions Re-mobilization
Units tonnes
1 tonne = 1000 kilograms
Global mercury budgets based on models illustrate the main environmental compartments and pathways that are of importance in the global mercury cycle and the ways in which natural and anthropogenic releases to air land and water move between these compartments Emissions to air arise from natural sources and anthropogenic sources as well as re-emissions of mercury previously deposited from air onto soils surface waters and vegetation
is continuous and ubiquitous allowing mercury to escape to air and to be washed into lakes and rivers Volcanoes emit and release mercury when they erupt Geothermal activity can also take mercury from underground and emit it to the atmosphere and release it to the deep oceans Some recent models of the flow of mercury through the environment suggest that natural sources account for about 10 of the estimated 5500-8900 tonnes of mercury currently being emitted and re-emitted to the atmosphere from all sources
onime Shutterstockcom
5
UNEP Global Mercury Assessment 2013
Anthropogenic sources of mercury emissions and releases Anthropogenic sources of mercury emissions account for about 30 of the total amount of mercury entering the atmosphere each year
As found in previous global mercury assessments the main industrial sources of atmospheric mercury are coal burning mining industrial activities that process ores to produce various metals or process other raw materials to produce cement In these activities mercury is emitted because it is present as an impurity in fuels and raw materials In these cases mercury emissions and releases are sometimes referred to as lsquoby-productrsquo or lsquounintentionalrsquo emissions or releases A second category of sources includes sectors where mercury is used intentionally Artisanal and small-scale gold mining (ASGM) is the largest of these in which mercury emissions and releases result from the intentional use of mercury to extract gold from rocks soils and sediments Other intentional-use release sectors include waste from consumer products (including metal recycling) the chlor-alkali industry and the production of vinyl-chloride monomer
Coal burning and to a lesser extent the use of other fossil fuels is one of the most significant anthropogenic source of mercury emissions to the atmosphere Coal does not contain high concentrations of mercury but the combination of the large volume of coal burned and the fact that a significant portion of the mercury present in coal is emitted to the atmosphere yield large overall emissions from this sector The mercury content of coal varies widely introducing a high degree of uncertainty in estimating mercury emissions from coal burning Data on mercury content is now available from many countries including major emitters of mercury
Mining smelting and production of iron and non-ferrous metals are also a large source of global mercury emissions to air and also a very important sector with regard to releases to water In the mining and processing of metals most of the mercury is captured and either stockpiled or sold for use in various products creating anthropogenic sources associated with intentional use discussed below Nonetheless the volume of ores and metals involved result in large total emissions and releases The relatively small volume of primary mercury production makes mercury mining a far smaller source today than it has been in the past
Cement production which typically involves the burning of fossil fuels to heat the materials required to make cement is another major anthropogenic source of mercury emissions Both the raw materials and the fuel may contain mercury and lead to emissions The amount of mercury involved varies greatly with the mercury content of these fuels and especially with the raw materials In some countries cement kilns are burning increasing amounts of alternative fuels including wastes that may contain mercury This may add to the emissions from cement kilns
Oil refining emits and releases mercury as oil deposits are known to contain mercury generally at low concentrations Mercury is removed from most petroleum products and natural gas prior to combustion and therefore combustion-related emissions are low Most of the mercury in crude oil is associated with solid waste that is disposed of in landfills However emissions and releases during refining of crude oil do occur and these have been quantified for the first time in the 2010 inventory The inventory does not quantify other emissions and releases during oil and gas extraction and transport or from flaring
Unintentional mercury emissions from these sectors can be reduced by the application of pollution control measures at power plants and industrial plants Some of the mercury captured is refined and enters the commercial supply chain however large amounts of mercury captured in materials such as fly ash and oil refinery waste need to be disposed of Some of the resulting wastes are themselves used as raw materials for example in construction materials but large amounts are disposed of in landfills which can thus become a potential source of mercury emissions and releases
Among intentional-use sectors Artisanal and small-scale gold mining is a major source for emissions and releases of mercury worldwide In ASGM miners use mercury to create an amalgam separating gold from other materials They then have to separate the mercury from the gold Calculating emissions from this sector presents a particular challenge because it is typically widely dispersed and often unregulated and may be illegal Uncertainties regarding release estimates from the ASGM sector are therefore high Furthermore the miners are typically poor and perhaps have little awareness of the hazards of mercury and pollution control devices may be hard to obtain
Wastes from consumer products containing mercury can end up in landfills or incinerators
6
UNEP Global Mercury Assessment 2013
Mercury is still used in a wide range of products including batteries paints switches electrical and electronic devices thermometers blood-pressure gauges fluorescent and energy-saving lamps pesticides fungicides medicines and cosmetics Once used many of the products and the mercury they contain enter waste streams While mercury in landfills may slowly become re-mobilized to the environment waste that is incinerated can be a major source of atmospheric mercury especially from uncontrolled incineration Incinerators with state-of-the-art controls have low emissions
Another use of mercury is in dental amalgam for filling teeth When bodies are cremated mercury in fillings can be emitted Mercury can also be emitted and released during production and preparation of fillings and from the disposal or removed fillings In addition mercury from removed fillings can be recycled or go into solid waste and wastewater
The amount of mercury released in the recycling of scrap metals for example in secondary steel and nonshyferrous metal production is generally assumed to be much lower than that released during primary metal production which is why the present global inventory only addresses primary metal production However lower emissions from recycling may not be the case in all countries Much of the scrap steel in some countries comes from automobiles that may still have devices that contain mercury and which may not be removed prior to recycling of the steel These devices are largely being phased out so mercury emissions from scrap steel may be expected to decrease However large differences exist between countries in the way they treat their mercury-containing wastes including scrap metals that are recycled in secondary metal production
Mercury is also used in a number of industrial processes A major industrial use is in the chlor-alkali industry where mercury-cell technology may be used in the production of chlorine and caustic soda
Mercury is also used as a catalyst in the production of vinyl chloride monomer (VCM) from acetylene mainly in China
Mercury releases to aquatic systems as a result of current human activities arise from many of the same uses or the presence of mercury in various products and processes that emit mercury to the air As with emissions to the atmosphere aquatic releases come from two main sources First mercury is released with water effluent from the sites where mercury is used Second mercury can leach into water from disposal sites that have mercury in the waste
zhu difeng Shutterstockcom
Tomas Pavelka Shutterstockcom
bikeriderlondon Shutterstockcom
Anthropogenic sources of mercury from industry and intentional use
Gunnar Futsaelig
ter
7
UNEP Global Mercury Assessment 2013
Arnold John Labrentz Shutterstockcom
Re-emission and re-mobilization of mercury Re-emissions constitute the third category of sources presently comprising about 60 of mercury emissions to air Mercury previously deposited from air onto soils surface waters and vegetation from past emissions can be emitted back to the air Re-emission is a result of natural processes that convert inorganic and organic forms of mercury to elemental mercury which is volatile and therefore readily returns to the air Mercury deposited to plant surfaces can be re-emitted during forest fires or biomass burning Mercury may be deposited and re-emitted many times as it cycles through the environment
It is important that re-emitted mercury should not be considered a natural source It may originally have come from natural or anthropogenic sources but by the time it is re-emitted it is difficult or impossible to identify its specific origin Nonetheless human activity has increased the environmental burden of mercury resulting in higher levels of re-emission This is compounded by changes in land use practices as well as increasing temperatures due to climate change
In the aquatic environment re-mobilization of mercury occurs when mercury deposited on and accumulated in soils or sediments is re-mobilized by for example rain or floods that cause the mercury to enter or re-enter the aquatic system Resuspension
of aquatic sediments due to wave action or storm events is an additional way for mercury to re-enter the aquatic ecosystems
Estimating re-emission and re-mobilization rates is difficult It is often done using modelling approaches These models are based on data on atmospheric levels and other observations as well as current understanding of chemical transformations and other processes that determine how mercury moves between air land and water The models aim to balance the amount of mercury in circulation at any given time while remaining consistent with observational data Temperature is a key factor With lower temperatures re-emission rates are generally lower
Re-emission is also a major factor in determining the length of time needed for anthropogenic emission reductions to be reflected in decreasing environmental levels of mercury Mercury emitted in one year may be deposited to and retained in soils and waters for some time before being re-emitted or re-mobilized in subsequent years This cycle can be repeated keeping levels in air and water elevated even after anthropogenic sources have been lowered Conversely continuing to add to the global pool will leave an ever-longer legacy of anthropogenic mercury contamination worldwide It is thus imperative that international efforts to reduce mercury emissions continue and are strengthened as soon as possible
Forest fires re-emit mercury deposited to vegetation
8
UNEP Global Mercury Assessment 2013
Anthropogenic emissions to the atmosphere 3 Global emissions inventory The global emissions inventory for 2010 estimates that 1960 tonnes of mercury was emitted to the atmosphere as a direct result of human activity The leading sectors remain the same as those identified in the 2005 inventory Improved data however have changed the relative contributions of some of these sectors as have some actual changes in emissions All coal burning emissions taken together for example represent a lower percentage of the total emissions than in the 2005 inventory This is due in part to the increased estimates from artisanal and small-scale gold mining (ASGM) and in part to much lower estimates for domestic use of coal When the actual amount of mercury emitted from coal combustions in power generation and industrial uses is considered and the estimates are based on the same 2010 methodology the emissions in 2010 are the same and perhaps slightly higher than in 2005 Even though new coal-fired power plants are being built combustion efficiency and emissions controls are also improving in most parts of the world
Results by selected sector The updated inventory of emissions to air confirms coal burning as a continuing major source of emissions responsible for some 475 tonnes of mercury emissions to air annually compared with around 10 tonnes from combustion of other fossil fuels According to the new inventory more than 85 of these emissions are from coal burning in power generation and industrial uses In the previous assessment emissions from domestic and residential coal burning were highlighted as a possible larger contribution Better information on coal consumption for domestic and residential uses indicates that these activities are a smaller contribution to total emissions from coal burning than previously thought
Emissions from the cement production industry are largely dependent on the raw materials and the fuels used The new inventory avoids double
Emissions from various sectors in tonnes per year with the range of the estimate and as a percentage of total anthropogenic emissions Note These numbers cannot be compared directly with those presented in the 2008 assessment (see Chapter 4 Trends in mercury emissions to the atmosphere)
Sector Emission (range) tonnes
By-product or unintentional emissions
Fossil fuel burning
Coal burning (all uses) 474 (304 - 678) 24
Oil and natural gas burning 99 (45 ndash 163) 1
Mining smelting amp production of metals
Primary production of 455 (205 ndash 241) 2 ferrous metals
Primary production of nonshy 193 (82 ndash 660) 10 ferrous metals (Al Cu Pb Zn)
Large-scale gold production 973 (07 ndash 247) 5
Mine production of mercury 117 (69 ndash 178) lt1
Cement production 173 (655 - 646) 9
Oil refining 16 (73 - 264) 1
Contaminated sites 825 (70 - 95) 4
Intentional uses
Artisanal and small-scale 727 (410 ndash 1040) 37 gold mining
Chlor-alkali industry 284 (102 ndash 547) 1
Consumer product waste 956 (237 ndash 330) 5
Cremation (dental amalgam) 36 (09 - 119) lt1
Grand Total 1960 (1010 ndash 4070) 100
Values rounded to 3 significant figures To nearest percent
Sectors for which emissions are not currently quantified
biofuel production and combustion
vinyl-chloride monomer production emissions during
secondary metals production and ferro-alloys
oil and gas extraction transport and processing other than refinery emissions
industrial some hazardous waste incineration and disposal
sewage sludge incineration
preparation of dental amalgam fillings and disposal of removed fillings containing mercury
9
UNEP Global Mercury Assessment 2013
Disposal of waste from
Mercury-cell chlor-alkali
industry
Relative contributions to estimated emissions to air from anthropogenic sources in 2010
Oil refining
Coal combustion
Oil and natural gas combustion
Primary ferrous metal production
Primary non-ferrous metal (Al Cu Pb Zn)
Large-scale gold production
Hg production Cement production
mercury-containing products
Contaminated sites
Cremation
Artisanal and small-scale gold production
counting of emissions from conventional fuels (such as coal and oil) that are included under the industrial fossil fuel burning emissions However it does attempt to account for emissions from other fuels including alternative fuels (such as old tyres and other wastes) and from raw materials Increasing amounts of waste are being co-incinerated in the cement industry both as fuel but also in some plants as a means of disposing of hazardous wastes some of which may contain mercury In some regions additional measures are being introduced to make sure that mercury emissions associated with waste co-incineration do not increase overall emissions from cement plants
Increased application of air pollution control devices including some mercury-specific technologies together with more stringent regulations in several countries have the effect of reducing mercury emissions from coal burning sectors and thus offset some part of the emissions arising from increased activity
Artisanal and small-scale gold mining emissions are in the 2010 inventory the major source of emissions to air at 727 tonnes per year The reasons for the large increase in the estimate compared to 2005 are discussed below (see page 16) The global estimate for emissions from ASGM includes a significant contribution from China although
recent information on this sector in China is lacking China prohibited ASGM in 1996 and therefore records no emissions from this sector
Mercury-cell technology is becoming less common in the chlor-alkali industry as other more cost-effective processes are adopted No new plants are being constructed though many older plants remain to be converted Old chlor-alkali plants and other decommissioned industrial sites may constitute contaminated sites that continue to release mercury to the environment for many years and emissions from contaminated sites are now part of the inventory
Global emissions from use of mercury in dental amalgam resulting from cremation of human remains are estimated at 36 (09 ndash 119) tonnes in 2010 Some 340 tonnes of mercury is used per year in dentistry of which about 70-100 tonnes (ie 20shy30) likely enters the solid waste stream
In the production of vinyl chloride monomer information is still lacking on the lifecycle and eventual fate of the mercury catalyst Most of this production occurs in China and about 800 tonnes of mercury is thought to have been used by this industry in China in 2012 Used mercury catalyst is recycled and reused by enterprises that hold permits for hazardous waste management The amounts that may be emitted or released are unknown
Ronald de Hom
mel
Artisanal and small-scale gold mining Unlike most small-scale gold miners the green gold miners of Oro Verde shown here employ an environmental way of mining gold that does not use mercury or other chemicals
10
UNEP Global Mercury Assessment 2013
Results by region The greatest proportion of anthropogenic mercury emissions to the atmosphere comes from Asia which contributes about 50 of the global total The majority of Asian emissions come from East and Southeast Asia China accounts for three-quarters of East and Southeast Asian emissions or about one third of the global total
New data on emissions from ASGM have increased the proportion of global emissions attributed to South America and Sub-Saharan Africa largely due to increased estimates associated with improved information about ASGM activities in these areas
Emissions to air from other major source sectors are higher in Europe North America and Oceania
Mercury emission 2010 gkm2
0 2 5 10 100 1000
Global distribution of anthropogenic mercury emissions to air in 2010
Emissions from various regions in tonnes per year with the range of the estimate and as a percentage of total global anthropogenic emissions Note These numbers cannot be compared directly with those presented in the 2008 assessment (see Chapter 4 Trends in mercury emissions to the atmosphere)
See figure on the following Region Emission (range) tonnes page for map with
Australia New Zealand amp Oceania 223 (54 - 527) 11 specification of regions Values rounded to 3 Central America and the Caribbean 472 (197 - 974) 24
significant figures CIS amp other European countries 115 (426 - 289) 59
East and Southeast Asia 777 (395 - 1690) 397
European Union (EU27) 875 (445 - 226) 45
Middle Eastern States 370 (161 - 106) 19
North Africa 136 (48 - 412) 07
North America 607 (343 - 139) 31
South America 245 (128 - 465) 125
South Asia 154 (782 - 358) 79
Sub-Saharan Africa 316 (168 - 514) 161
Undefined (global total for emissions from 825 (700 - 950) 42 contaminated sites)
Grand Total 1960 (1010 ndash 4070) 100
11
UNEP Global Mercury Assessment 2013
North America
Central America and the Caribbean
South America
Unintentional emissions
Stationary combustion (coal)
Stationary combustion (oil and gas) Oil refining
Pig iron and steel
Intentional uses
Artisanal and small-scale gold mining Chlor-alkali
EU27
North Africa
Sub-Saharan Africa
Non-ferrous metals (Cu Pb Zn Al) Mercury
Large-scale gold
Cement
Product waste
Cremation
CIS amp other European countries
500
100
Middle Eastern States East and Southeast Asia
50
10 tonnes
South Asia Australia New Zealand amp Oceania
South America
North America
Central America and the Caribbean
Sub-Saharan Africa
South Asia North Africa
Middle Eastern States
EU
East and Southeast Asia
CIS amp other European countries
Australia New Zealand amp Oceania
Estimates of 2010 anthropogenic mercury emissions to air from different main sectors in different regions ASGM is shown separately to highlight its geographic distribution and better allow regional comparisons to be made for other sectors
12
UNEP Global Mercury Assessment 2013
Compiling the 2010 inventory of anthropogenic mercury emissions to air The inventories used in successive Global Mercury Assessments continue to improve as better data become available The 2013 update presents an inventory of emissions for 2010 that has a number of improvements over the 2008 assessment and its inventory for 2005
bull A more detailed analysis of emissions from some major source sectors For example fossil fuel consumption is now broken down into categories for combustion in power plants industry and other uses The type of coal or oil used is also considered providing a more accurate estimate of mercury emissions
bull A more detailed consideration of the mercury content of fuels and raw materials used in different countries and regions bull New and updated information on ASGM bull The use of different pollution control technologies
in different countries and regions have been factored into the emissions estimate bull Emission estimates for sectors not previously
included such as aluminium production oil refining and contaminated sites bull More and better information on location of major
point sources such as individual power plants smelters and cement kilns bull Better documentation and greater transparency
with respect to the data and information behind the estimates
The methods for estimating emissions from industrial sectors is complemented by other methods used for more dispersed emissions sources For example estimating emissions from some intentional-use sectors requires intensive work with those sectors Relevant and accurate information about ASGM is generally not available through official channels Estimating mercury emissions from its intentional use in lighting batteries and other products requires analysing the entire production use and waste stream to determine where mercury is likely to be released and in what quantities The approach used in the 2013 assessment addresses the emissions from breakages and wastes resulting from use of these mercury-containing products in society the majority of
which are incinerated or end up in landfills It does not however address industrial wastes or sewage sludge incineration
Uncertainties in emission estimates Estimates of mercury emissions are just that estimates To compile a global assessment requires making a number of assumptions and generalizations Uncertainty associated with the 2010 inventory arises from each of the factors used to estimate the emissions the correctness of the activity data the validity of the emission factors applied and the validity of assumptions regarding the effectiveness and use of emission-control technologies
Based on an evaluation of these sources of uncertainty and the relative contributions of sectors with reliable information and those with less reliable data uncertainty in the 2010 inventory assessment of total anthropogenic mercury emissions to air gives a range of emissions from 1010-4070 tonnes This range is greater than that reported in some previous assessments reflecting a greater appreciation of the sources of uncertainty due to the improved estimation methods and perhaps a more realistic appraisal of the state of knowledge concerning some aspects of emissions
The best estimate taking a conservative approach is 1960 tonnes If nationally produced estimates for 2010 available from some countries (Canada Japan Korea Mexico the United States and European countries reporting to LRTAP) are introduced into the global inventory in place of the inventory estimates the corresponding estimated total global anthropogenic emission to air is 1940 tonnes As most national inventories do not include uncertainty ranges it is not possible to assign a range to this number The recognition of uncertainties is an important consideration and presenting single national estimates can convey a misleading picture of what is known and more importantly not known about emissions
The numbers derived using the methods employed to produce the global inventory for 2010 were compared with a number of national inventories and emissions reported under other systems covering the same period In general the level of agreement was good in particular when the significant uncertainties
13
UNEP Global Mercury Assessment 2013
Methods for estimating emissions All global mercury emissions inventories to date have used the same basic approach for the major sectors emitting mercury to the atmosphere For specific emission sectors national emissions estimates are calculated by multiplying the amount of activity (ie amounts of fuels burned raw materials consumed or materials produced) by an emission factor that is an estimate of the mercury emitted per unit of activity For example emissions from coal-fired power generation are estimated by multiplying the tonnes of coal used by the amount of mercury estimated to be released per tonne of coal In most such inventories ldquoabatedrdquo emission factors have been employed to quantify both the emissions of mercury that occur during the processes and the effects of mercury emission controls In the new methodology used to develop the 2013 report these components are split ldquoUnabatedrdquo emission factors are employed to quantify the emissions and ldquotechnology profilesrdquo have been developed to represent the effects of mercury emission controls
Various methods are employed to estimate emissions of mercury at individual sources and at national regional and global levels In general the methods fall under one of two main categories
bull Mass-balancesubstance-flow based estimates which are based on the principle that what goes in must come out Amounts of mercury in fuels and raw materials constitute the inputs and the outputs are the amounts of mercury emitted to air released to water or land retained in products or in wastes or otherwise recovered and stored or disposed of
involved in both global and national estimates are taken into account It is important to note that there are good reasons why estimates of mercury emissions produced in the 2010 inventory may not fully agree with national inventories made by countries using other methodologies These reasons include
bull Reporting schemes may define and distinguish emissions source sectors in very different ways and aligning these sectors may not be possible
bull Industry reporting to national government may be limited to sources with emissions above a certain threshold level so that emissions from smaller sources below the threshold are not reported Where smaller sources make up a significant part of the source category reported inventories
bull Measurement-based estimates which rely on measurements made at appropriate points in the industrial process or in the productwaste output streams These measurements are used to estimate where the mercury goes as in the method above
In principle the two approaches should produce the same results In practice mass-balance based approaches tend to result in higher emission estimates than most measurement-based estimates Since future emissions reporting is likely to involve a combination of these two approaches further work is required to understand why results may differ and to reconcile the two approaches
Since the 2008 UNEP assessment was produced the number of direct measurements of emissions from certain point sources (in particular power plants and some metal and cement production plants and waste incineration facilities) has increased considerably resulting in a much improved knowledge base
A number of countries require regular reporting of emissions Increasing use is being made in these reporting systems of measurement-based estimates and facility-level reporting in particular for major point sources In other countries national mercury emissions are only being quantified for the first time Since 2005 and the start of the UNEP negotiating process in 2010 many countries have initiated work on national emission inventories which in several cases have yielded much improved information on activity data sector characteristics and mercury emissions Such inventories often make use of the UNEP Toolkit for identification and quantification of mercury emissions
may therefore significantly underestimate total mercury emissions bull National inventories in some countries are making
increasing use of actual measurements of mercury emissions at individual facilities At the global scale it is not yet feasible to base an inventory on individual site emissions Furthermore actual measurements of mercury emissions at a source may be taken only a few times during a year and may not be fully representative of normal operations In the 2013 assessment a mass-balance based approach was employed to be consistent transparent and replicable bull National reporting and monitoring schemes
may provide information that is not available to externally produced inventories
14
UNEP Global Mercury Assessment 2013
Despite these considerations most of the discrepancies noted between the 2010 inventory mass-balance-based estimates and national estimates based on measurement- approaches are modest and within the margins of error associated with the different approaches In cases where the differences are larger it is important to recognize that there are sources of error in all methods for estimating mercury emissions
Gunnar Futsaelig
ter
Sampling of mercury emissions at the Kendal coal-fired power plant in South Africa conducted under a UNEP project A probe with mercury traps is inserted into a sampling port in the stack to collect mercury present in the flue gas The mercury traps are subsequently analysed according to the US EPA Mercury Monitoring Toolkit sampling protocol
15
UNEP Global Mercury Assessment 2013
Trends in mercury emissions to the atmosphere 4 Assessing global and sectoral trends A key question in assessing anthropogenic mercury emissions worldwide is whether they are increasing or decreasing While it is tempting simply to compare the 2010 inventory with its 2005 counterpart the results would mean little As inventory methods develop and as additional sources are considered the estimate of total anthropogenic mercury emissions worldwide also changes While some changes reflect real trends others reflect changes in methods or scope Thus comparing the results of previous assessments with the present update requires considerable care and involves an understanding of the way in which these inventories have been produced and the uncertainties associated with them
It is possible however to compare certain sectors over time by attempting to compensate for any methodological changes between the various inventories since 1990
Emissions to air are thought to have peaked in the 1970s From 1990 to 2005 total anthropogenic emissions of mercury to the atmosphere appear to
Emissions to air t
1400
1200
1000
800
600
400
200
0
1990
1995
2000
2005
Africa Asia Europe Russia North Oceania South America America
Estimates of annual anthropogenic mercury emissions from different continentsregions 1990-2005
have been relatively stable with decreases in Europe and North America being offset by increases in Asia A reanalysis of the available inventories since 1990 however indicates that emissions from industrial sectors at least may be starting to increase again
The changes introduced in the 2010 inventory methodology prevent a straight-forward continuation of this analysis However an evaluation of trends for some sectors between 2005 and 2010 has been made by applying the new methodology to activity data for 2005 This comparison suggests a further slight increase in the combined amount of mercury emitted by industrial sectors (coal combustion production of cement pig iron and steel and non-ferrous metals) The following paragraphs describe the trend results for three sectors to illustrate some of the developments between 2005 and 2010 and some of the the difficulties in comparing emissions estimates between different years made with different methods
Coal burning for power generation and for industrial purposes continues to increase especially in Asia However increases in the application of air pollution controls including some mercury specific technologies together with more stringent regulations in a number of countries have reduced mercury emissions from coal burning in power plants in particular and thus offset some part of the emissions arising from increased coal consumption
In the United States for example emissions from coal burning at power plants have reportedly decreased from about 53 tonnes in 2005 to 27 tonnes in 2010 This decrease is largely due to new regulations that have resulted in changes in the sources of the coal that is burned in large power plants and the installation of mercury controls as well as controls on sulphur dioxide and particulates that have the co-benefit of further reducing mercury emissions
In China many of the new coal-fired power plants have state-of-the-art pollution controls installed
Emissions of mercury from artisanal and small-scale gold mining (ASGM) reported for 2010 are more than twice those reported for 2005 While the
16
UNEP Global Mercury Assessment 2013
Unintentional emission sectors Coal burning ferrous- and non-ferrous (Au Cu Hg Pb Zn) metal production cement production Intentional-use sectors Disposal and incineration of product waste cremation emissions chlor-alkali industry
Comparison of emissions in 2005 and 2010 by selected sector and region
Unintentional emission sectors
Emission t
1000
800
600
400
200
0 2005 2010
Australia New Zealand amp Oceania
Central America and the Caribbean
CIS amp other European countries
East and Southeast Asia
rise in the price of gold (from USD 400 per ounce in 2005 to USD 1100 per ounce in 2010) along with increased rural poverty may indeed have caused more activity in this sector the increased estimate for mercury emissions is considered to be due primarily to some more and better data from many countries and regions West Africa for example was regarded as having minimal ASGM in 2005 but is now recognized as a region with considerable activity Thus the baseline has improved without necessarily any change in actual activity or emission levels
Waste from consumer products is affected by the amount of mercury used For most products in which mercury is used mercury-free alternatives exist Consequently many of these uses of mercury are declining at least in some regions as alternative products or processes are adopted Compact fluorescent light bulbs are an exception Even though the mercury content of individual light bulbs has decreased use of this type of light bulb is increasing rapidly
Artisanal and small-scale gold mining Intentional-use sectors
1000 1000
Step change from 2005 to 2010 due to new information 800 800 (under-estimation in 2005)
600 600
400 400
200 200
0 0 2005 2010 2005 2010
European Union (EU27) South America
Middle Eastern States South Asia
North Africa Sub-Saharan Africa
North America
In order to make valid assessments of trends in emissions from global inventories comparable data on activity levels are required together with information on changes in fuel and raw material characteristics and applied air pollution control technology One aim of the 2010 inventory methods is to create a firmer foundation for such future trend analysis
Ralf Siemieniec Shutterstockcom
Use of mercury-containing energy-saving lamps is increasing
17
UNEP Global Mercury Assessment 2013
Emission scenarios and future trends The 2008 Global Atmospheric Mercury Assessment included a first attempt at projecting future emissions inventories These were based on three scenarios continuing with the status quo applying current emissions controls worldwide and achieving maximum feasible technological reductions At the time this effort was regarded as highly provisional Since then additional studies have extended and improved this work but the results are not markedly different from earlier projections of future mercury emissions
Global mercury models have been used to evaluate future scenarios Four global and hemispheric models projected mercury levels around the world in 2020 based on the three emission scenarios described earlier In industrial regions the status quo will cause an increase in mercury levels of 2-25 and in remote areas of 15-5 The two emission control scenarios on the other hand yield a decrease in mercury in industrial areas of 25-35 and in remote areas of 15-20
Another global model was coupled with estimates of surface reservoirs of mercury in order to quantify source-receptor relationships for the present and for 2050 Under the best-case scenario of maximum feasible reductions projected estimates for deposition in 2050 is similar to estimates for today In the other scenarios increasing emissions lead to increasing deposition A greater proportion of mercury emissions is expected to be in the oxidized form so that a greater proportion will be deposited near the source instead of being transported far away
The model results support the conclusion that reducing anthropogenic emissions will slowly reduce the amount of mercury in biologically available reservoirs Over time mercury in the environment will be taken out of circulation by natural processes for example from ocean waters down into sediments and biologically available mercury will decrease Increased emissions on the other hand will continue to build up the amount of mercury in circulation
With new databases and methods it may soon be possible to create scenarios that incorporate activity levels as well as technology use for each country If this were done it would allow countries to assess the effects of different mercury reduction strategies on their national emissions For example a country could determine the relative contributions of emission reduction technology as opposed to for example changes in raw materials
18
UNEP Global Mercury Assessment 2013
Atmospheric chemistry monitoring and trends 5 Forms of mercury in air Mercury in the atmosphere is in three primary forms Gaseous elemental mercury is the most common in anthropogenic and natural emissions to the atmosphere Gaseous oxidized mercury and mercury bound to particulates are less common The transport and deposition of atmospheric mercury depend greatly on whether the mercury is elemental or oxidized Elemental mercury stays in the atmosphere long enough for it to be transported around the world whereas oxidized and particulate mercury are more readily captured in existing pollution control systems or deposited relatively rapidly after their formation As a result most mercury in the air is in the gaseous elemental phase Relatively little elemental mercury is deposited directly but instead must fi rst be oxidized
Although gaseous oxidized mercury is very important in mercury cycling between air and other environmental compartments the process of oxidation in the air is poorly understood with reactions and resulting compounds yet to be verified in observations
When mercury moves from air to water and land it is generally in an oxidized gaseous or particulate form whereas when it is re-emitted to air it has been converted back to gaseous elemental
Particulate associated mercury
Pole
Equator
Gaseous elemental mercury
Global transport
Gaseous elemental mercury can be transported globally Mercury emitted in particulate form tends to deposit closer to sources
mercury Sunlight appears to play a large role in both oxidation and reduction of mercury but temperature and biological interactions are also likely to be involved to some degree Here too much uncertainty remains Nonetheless the reactions are important in determining net deposition and fate of mercury
Monitoring of mercury in air Monitoring of mercury in air focuses on the three primary forms of mercury The measurement of gaseous elemental mercury is routine and robust Measuring gaseous oxidized mercury and particulate-bound mercury however is challenging Concentrations are typically very low and these forms are chemically unstable leading to high uncertainty in the measurements Nonetheless these forms are critical for defining and modelling the fate and transport of airborne mercury
In the past two decades coordinated mercury monitoring networks and long-term monitoring sites have been established in a number of regions measuring mercury concentrations in the air as well as deposition of mercury in precipitation In Europe and North America high-quality continuous monitoring has been going on for more than 15 years especially in the Arctic High-quality monitoring has started more recently in East Asia and South Africa as part of a global effort to expand the coverage provided by long-term monitoring sites
Measurements and trends in atmospheric mercury Monitoring stations around the world have provided information about trends in atmospheric mercury though the time periods vary depending on how long the site has been active Overall a declining trend in background mercury levels over the past decade has been recorded from monitoring stations
19
UNEP Global Mercury Assessment 2013
in many regions Other regions however show an increase in mercury levels
The sites also provide information about geographical patterns reflecting both background levels of
Trends in atmospheric measurements of mercury
Site(s) Period
Mace Head Ireland 1996-2011
North America rural sites 1995-2005
High Arctic sub-Arctic Up to 20 years of records mid-latitudes
Monitoring networks Mercury monitoring in Europe is carried out under the European Monitoring and Evaluation Programme (EMEP) one of the first international environmental measurement networks Heavy metals such as mercury have been included in the EMEP program since 1999 Mercury measurements are available only from northern and northwestern Europe
Three monitoring networks currently operate in North America providing good coverage of Canada and the United States the Mercury Deposition Network the Canadian Air and Precipitation Monitoring Network and the Atmospheric Mercury Network More recently new sites have been established in Mexico extending coverage on the continent The stations monitor atmospheric mercury and mercury in precipitation which has measured since the mid-1990s Monitoring of mercury in the air and in precipitation has been underway in Asia for nearly a decade
Alert Nord
Point Barrow
Nuuk Stoacuterhoumlfethi
Mace Head
mercury and local and regional influences Mercury concentrations at remote sites in Asia are higher than in other regions of the Northern Hemisphere Coastal cities in China have lower levels than inland sites likely due to the influence of relatively clean
Measurement Trend
Gaseous elemental mercury Decrease of 14-18 per year
Total gaseous mercury Decrease of 22 to 174 in total
Total gaseous mercury Decreasing trend at some stations increasing at others
The monitoring network of the Arctic Monitoring and Assessment Programme (AMAP) includes air and deposition monitoring sites located in Arctic regions of Canada Greenland Iceland Norway Russia and Sweden
Building on existing national and regional monitoring networks the European Union-financed project
ldquoGlobal Mercury Observation Systemrdquo (GMOS) started in November 2010 Its goal is to develop a coordinated global system for monitoring mercury including a large network of ground-based monitoring stations New sites are being installed in regions where few monitoring stations exist especially in the Southern Hemisphere Two sites have been established in Antarctica one on the Antarctic Plateau and one on the coast
Ny-Aringlesund
Amderma Pallas
Raringouml Bredkaumllen
Listvyanka Diabla Gora
Mauna Loa
Mt Bachelor
Celestuacuten Calhau
Longobucco
Iskrba Niembro Monte Cimone Cap
Ferrat Mt Waliguan Ganghwa Island
Lulin
Cape Hedo Ev-K2
Mt Changbai
Minamata Mt Ailao
Nieuw Nickerie
Kodiakanal
Maheacute Island Manaus
Bariloche Cape Point
Amsterdam Island Cape Grim
Dumont drsquoUrville
AMAP CAMnet EMEP GMOS GMOS associated NADPAIRMoN NADPMDN
Air + precipitation Air Precipitation
20
UNEP Global Mercury Assessment 2013
John Munthe
The mercury background air monitoring station at Zeppelin mountain Svalbard
air from over the ocean Sites off the Asian coast however show higher levels of gaseous elemental mercury than the Northern Hemisphere background suggesting an outflow from the Asian mainland
Weather patterns have also been found to have a strong influence on seasonal patterns in mercury levels in the air at monitoring sites At the Mount Waliguan Observatory on the Tibetan Plateau for example northeasterly and easterly winds produced the highest levels of mercury
Measurements at high altitudes Measurements from ground-based stations above 2700 meters suggest that there is an inverse relationship between gaseous elemental mercury and gaseous oxidized mercury at these elevations In other words when there is more elemental mercury there is less oxidized mercury and vice versa These measurements are in good agreement with modelling results which gives additional confidence in current understanding of the behaviour of mercury at high altitude
An inverse relationship between total gaseous mercury and particulate concentration has also been observed in the high stratosphere From the transformation rate of total gaseous mercury to particulate-bound mercury it appears that gaseous mercury lasts about two years in the stratosphere
21
UNEP Global Mercury Assessment 2013
Atmospheric concentrations and deposition 6 Measurements and trends of mercury in precipitation Mercury deposited by precipitation decreased from the 1990s into the 2000s at many but not all sites in North America and Western Europe where such measurements were taken
Regional patterns are also evident including slightly higher levels in southern Europe than northern Europe and higher levels in Asia than in North America Total mercury concentrations in precipitation in China were much higher than those in Japan and South Korea Th is was mostly attributed to higher levels of gaseous oxidized mercury and particulate-bound mercury which are readily deposited by precipitation and thus not transported far
A comparison of data from Canadian and American monitoring sites found that deposition of mercury in precipitation was highest in summer
Dry deposition of mercury which is deposition not associated with precipitation is diffi cult to measure and consequently there is little information on trends in mercury dry deposition Th is lack of information means that it is also diffi cult to validate model results for dry deposition
106 44
474 72 91
5 7 71
05 1 5 10 100 500 1000
Total mercury emission (2005) kgcell
Modelled mercury air concentrations and deposition patterns Atmospheric mercury concentrations are highest in major industrial regions Models examining global patterns show that East and South Asia Europe North America and South Africa have the highest levels of elemental mercury in the air Concentrations are generally lower in the Southern Hemisphere than the Northern Hemisphere because most industrial activity is in northern regions Th ese model results are based on simulations using the 2005 global mercury emission inventory because the 2010 inventory has only recently become available
Intercontinental transport of mercury in the air has been examined to determine its impact on regional mercury levels Four models using diff erent parameters produced consistent results Depending on the region mercury emitted by distant sources contributes between 10 and 30 of annual mercury deposition Where local sources are low mercury transported from distant emission sources can account for more than half of the deposition East Asia is the dominant source region adding 10-14 to the deposition in
Contribution from sources outside receptor region
Model 40
GEOS-Chem GLEMOS GRAHM CMAQ-Hg
30
20
10
0 Arctic Europe North East Asia South Asia
America
Receptor region
(Left ) Global distribution of anthropogenic mercury emissions in 2005 with source regions that were considered in the analysis (North America South America Europe Africa Central Asia South Asia East Asia Australia and Oceania) and (right) the contribution of anthropogenic sources outside a particular receptor region to deposition within the receptor region
22
UNEP Global Mercury Assessment 2013
Modelling atmospheric transport and deposition Global models reproduce the movement of mercury in the atmosphere during which the mercury may move between continents They have been effective in examining sources of mercury to the Arctic and also for examining the outflow of pollution from South and Southeast Asia and its impact on western North America as well as the flow from eastern North America to Europe
Regional models on the scale of a continent or a basin such as the Mediterranean can provide more detail about specific source areas even to the level of individual industrial areas Reliable results however require a detailed understanding of mercury oxidation in the atmosphere about which there is considerably uncertainty
Most atmospheric transport models consider the full chain of mercury processes in the atmosphere Some models also consider how mercury is cycled in other atmospheric compartments such as soil vegetation snow freshwater and seawater
One of the largest sources of uncertainty in mercury models is the chemical mechanism used to determine how mercury changes forms in the air Improved experimental data can help improve model performance by making sure that the correct reactions are simulated The processes that lead from deposition to re-emission also need to be understood better Advances in this area show promise with model results becoming closer to estimates based on experimental data
other regions of the world Natural emissions and re-emissions account for 35-70 of total deposition in most regions Deposition is generally greater in low and mid-latitudes due to stronger sunlight higher concentrations of oxidants and higher precipitation
Regional mercury models show patterns at the scales of continents or individual seas The Mediterranean Sea for example is a net source of mercury as it emits more than is deposited to it In that region dry deposition generally exceeds deposition of mercury in precipitation In Central and Southern Europe total gaseous mercury concentrations and deposition in precipitation were both consistently higher than the European average
Across the United States dry deposition accounts for two-thirds of total annual deposition mainly from gaseous oxidized mercury A study examining sources and deposition of mercury to assess the
benefits of proposed emission control measures found that mercury transport from outside the country accounts for 68 of mercury deposition in the Northeast and up to 91 in the west-central United States Large point sources contribute up to three-quarters of nearby deposition and power plants contributed half of the deposition in the eastern part of the country This suggests that new emissions standards would primarily benefit eastern regions of the US
In Asia studies show high seasonal variation in mercury concentration and deposition Anthropogenic emissions are responsible for about 75 of deposition in East Asia In this region there is a net removal of gaseous oxidized mercury from the atmosphere and a net export of gaseous elemental mercury
In the Arctic gaseous elemental mercury levels in the atmosphere are depleted rapidly in spring when after the long Arctic winters sunlight returns Ozone is depleted at the same time and it is believed that bromine-containing compounds are the cause of the photo-chemical reactions that deplete ozone and mercury During these events gaseous oxidized mercury and particulate-bound mercury levels increase sharply suggesting that the gaseous mercury is oxidized and deposited enhancing mercury deposition in Arctic areas in springtime Recent research however has found that 50-80 of the deposited mercury is re-emitted within a few days Similar springtime mercury depletion events have been seen in Antarctica
23
UNEP Global Mercury Assessment 2013
Anthropogenic releases to the aquatic environment 7 Global assessment Previous UNEP global mercury assessments only considered emissions to the atmosphere The 2013 Report presents the first attempt at compiling a global inventory of mercury releases to aquatic environments Releases directly into the aquatic environment present a completely different chemistry set of pathways and fate to those released to air They are also more directly linked to the risks posed by mercury to global environmental and human health Unlike mercury releases to air which are predominantly in the form of gaseous elemental mercury releases to water are predominantly inorganic mercury and to a lesser extent liquid elemental mercury
At present only some sources of aquatic releases can be quantified with any confidence Thus many sources that may be important are not included in this first assessment of global aquatic releases For example land management practices that expose new geological sources of mercury in rocks and mineral soils or that re-mobilize previously deposited mercury cannot yet be assessed Two broad categories of current anthropogenic sources are considered here point sources of mercury release to water and diffuse releases of mercury as a result of its remobilisation from areas where it was previously deposited or accumulated due to human activity (ie contaminated sites) Artisanal and small-scale gold mining (ASGM) mercury-containing pesticides and fungicides used in agriculture and deforestation are considered separately
Point source releases to water from various sectors in tonnes per year with the range of the estimate and as a percentage of total anthropogenic emissions
Sector Releases (range) tonnes
Non-ferrous metal production 925 (193 - 268)
Consumer product waste 894 (222 - 308)
Chlor-alkali production 28 (10 ndash 55)
Oil refining 06 (03 ndash 1)
Grand Total 185 (426 ndash 582)
The global estimate of mercury release to water from point sources has been derived from the atmospheric emissions assessment and the approach employed in the UNEP Toolkit to partition total mercury releases between air land and water This approach has considerable uncertainty and may omit sectors where releases to water are high but air emissions are unimportant and therefore not addressed in the inventory Global releases from point sources were estimated to be 185 tonnes per year
For diffuse sources evaluating the relative contribution of anthropogenic and natural sources to the aquatic environment requires determining considerations of the various mercury inputs For some sectors data exist that allow a preliminary assessment of the amounts of mercury re-mobilized into aquatic systems
For mercury-contaminated sites the range of average soil concentrations of mercury reported for sites where mercury was mined used or otherwise released by human activity was considered The area of contamination is then used to determine how much mercury is available in soils and when combined with a factor for how much mercury is released from those soils in a year the total release can be estimated Among identified contaminated sites mercury mining is identified as the largest sector followed by mining of precious metals Total releases to aquatic environments from contaminated sites are estimated to be 83-335 tonnes per year
Releases to water from contaminated sites in tonnes per year with the range of the estimate
Sector Releases (range) tonnes
Primary mercury mining sites 67 ndash 266
Precious metal production sites 14 ndash 55
Non-ferrous metal production sites 01 ndash 05
Chlor-alkali production sites 01 ndash 05
Other industrial sites 01 ndash 03
Grand Total 83 ndash 335
24
UNEP Global Mercury Assessment 2013
Much of the mercury released from artisanal and small-scale gold mining goes into rivers lakes soils and sediments and tailings From soils and tailings it may be re-mobilized by leaching and erosion In addition mining may disturb mercury-containing soils and sediments that may then erode more quickly releasing more mercury than would otherwise have become available from natural erosion A key factor in these processes is the local hydrological cycle of precipitation evaporation run-off and river flow To account for this in the assessment countries were designated as dry wet or intermediate to determine the relative importance of erosion The tropical and subtropical countries which have the greatest activity in this sector also tend to experience high precipitation and run-off exacerbating this source of mercury release and re-mobilization Total worldwide releases of mercury to land and water from ASGM were estimated at over 800 tonnes per year How much of this is released to water cannot yet be determined
Mercury continues to be used in pesticides and fungicides 2100 tonnes of mercury were released in the decade of the 1960s through such agrochemical uses Current data are unavailable although the use of mercury in these products has been greatly reduced
Deforestation especially in the Amazon Basin can lead to extensive soil erosion and thus the release of mercury previously accumulated in soils Using 2010 figures for deforestation rates around the world and an estimate of soil concentrations of mercury as much as 260 tonnes of mercury may have been released into rivers in 2010 as a result of deforestation worldwide
Because this is the first attempt to quantify global mercury releases to the aquatic environment there is no previous measurement against which these results can be compared Thus it is not possible at this time to evaluate trends in releases
Uncertainties in release estimates Estimating global releases of mercury to aquatic environments is being done here for the first time Many data are missing and others are imprecise A number of assumptions have been made based on what measurements are available or on other grounds to extrapolate from known quantities or to calculate aquatic releases in relation to atmospheric
or other emissions Thus the results should be treated with great caution It is nonetheless clear that anthropogenic sources and human activity contribute hundreds of tonnes of mercury to aquatic environments each year a substantial amount relative to estimated natural releases 150-960 tonnes per year from terrestrial environments
Lapshin Shutterstockcom
Phil Augustavo istockphotocom
Bureau of Land Managem
ent
Contaminated sites (top) erosion following deforestation (middle) and a flooded store of mercury-contaminated waste (lower) illustrate potential sources of mercury releases to water
25
UNEP Global Mercury Assessment 2013
Aquatic pathways transport and fate 8 Mercury in aquatic environments The pathways and fate of mercury in aquatic environments are important because it is in waters sediments and wetland soils that inorganic mercury is converted into methylmercury which is toxic and concentrates in animals The majority of human exposure to mercury and the health risk that comes with mercury exposure is from consumption of marine foods Thus this section focuses on the worldrsquos oceans Some freshwater systems however are important sources of fish for human consumption especially for subsistence and recreational fisheries often among indigenous peoples Artisanal and small-scale gold mining (ASGM) communities may also be affected through fish consumption and drinking water if those are contaminated by local releases
The major processes of mercury cycling are generally similar for all aquatic systems Inorganic mercury in dissolved or particulate form is the dominant mercury type in most marine and fresh waters Dissolved gaseous elemental mercury accounts for less than 30 of total mercury in water Methylmercury is often present at trace levels but may in some settings reach 30 of total mercury In freshwater and coastal environments inorganic mercury is transformed into methylmercury primarily in sediments In the open ocean this conversion takes place largely at intermediate depths between 200 and 1000 meters in the water column Mercury is lost from aquatic systems in two ways When inorganic mercury is reduced to elemental mercury it can be re-emitted to the atmosphere When inorganic mercury binds to particulates in water it can settle out rapidly and be buried in sediments Deep burial in ocean sediments is one of the major pathways by which mercury is removed from the biologically active environment
The global mercury cycle is chemically and physically complex Thus it is necessary to use models to study describe and predict what happens and will happen to mercury in the aquatic environment Until recently only one model existed that incorporated
air land and water into a unified whole The model has been validated against observations of mercury and represents the current scientific consensus The largest potential errors in this model in terms of the aquatic cycle concern details of the exchange of mercury between air and water
Pathways and fate of mercury in the oceans Model simulations suggest that anthropogenic impacts on mercury levels in the ocean are greatest in the surface waters the top 100 meters or so of the water column While model results vary one recent estimate suggests that anthropogenic emissions over the last 100 years have doubled the concentration of mercury in the surface layer of the ocean and increased it by 25 in intermediate waters and by 10 in deep waters The difference is due to the length of time it takes for surface waters to circulate to the depths
Models and measurements agree that direct deposition from the atmosphere is the dominant pathway by which mercury reaches the oceans The exceptions are smaller semi-enclosed basins such as the Mediterranean Sea or the Arctic Ocean where river runoff coastal erosion and ocean currents
Ugo M
ontaldo Shutterstockcom
26
UNEP Global Mercury Assessment 2013
account for about half of mercury inputs The most recent modelling effort suggests that total deposition input of mercury to the oceans in 2008 was 3700 tonnes
Other mercury pathways appear less important on a global basis Rivers are estimated to carry more than 2800 tonnes of mercury each year but only about 380 tonnes of this is transported offshore The rest is trapped by particles in estuaries Groundwater and re-mobilization from sediments provide 100shy800 tonnes of mercury to the oceans each year Undersea hydrothermal vents add less than 600 tonnes of mercury to the oceans There are high concentrations of mercury in vent fluids but a great deal of the mercury is precipitated as solids once the vent fluids enter seawater
Models suggest that globally about 70 of the mercury deposited into the ocean is re-emitted to the atmosphere Oxidized mercury in surface waters is reduced by biological and photochemical processes to the elemental form that is volatile and readily re-emitted The removal of this mercury ultimately reduces the pool of mercury that could be converted to methylmercury and be accumulated by marine organisms The re-emission process thus simultaneously prolongs the lifetime of mercury cycling through the atmosphere and upper ocean and acts to reduce mercury availability for marine food webs
Any changes in the efficiency of mercury reduction in surface waters or the rate of re-emission is likely to impact mercury concentrations in surface waters and the air One example is the effect of sea ice in the Arctic Ocean which blocks the re-emission
Tony Magdaraog Shutterstockcom
Mercury accumulated in marine food-webs can enter the human diet
of elemental mercury leaving elevated levels in waters under ice Changes in primary productivity could change the rate at which mercury is bound to particles thus affecting re-emission to the atmosphere as well as rates of downward transport in the ocean Changes in oxidant levels in the atmosphere such as ozone and bromine may also influence the rate of oxidation of gaseous elemental mercury and thus deposition rates to the ocean
Methylmercury in the ocean Natural bacterial processes in seawater and in sediments in coastal environments convert inorganic mercury to methylmercury Methylmercury levels are highest in the subsurface waters of many oceans because it is formed at these intermediate depths likely as a result of the decomposition of organic material falling from surface waters Current understanding indicates that about 300 tonnes of methylmercury is produced in the upper ocean by this and related processes By contrast only about 80 tonnes of methylmercury reaches the ocean from other sources such as atmospheric deposition rivers and diffusion from sediments
Current modelling indicates that methylmercury stays in the upper ocean for about 11 years Deshymethylation by photochemical reaction or by microbial activity is the major removal process for methylmercury in the ocean About 240 tonnes of methylmercury is removed by this process from the surface waters of the ocean per year
The other important pathway for methylmercury in seawater is uptake into marine food webs Although only about 40 tonnes per year is taken up in this way it is this fraction that poses risks to marine animals and human consumers of seafood Methylmercury is a problem for several reasons First it is taken up by plankton much more efficiently than is inorganic mercury resulting in concentrations in plankton that are as high as 10000 times the concentration in seawater Second methylmercury is absorbed through the intestine of animals much more easily than is inorganic mercury Third methylmercury biomagnifies as it moves up the food web Thus methylmercury becomes an increasingly greater proportion of the mercury in organisms higher in the food web This explains why some indigenous populations that consume top marine predators such as fish seals and whales have some of the worldrsquos highest concentrations of methylmercury giving rise to health concerns
27
UNEP Global Mercury Assessment 2013
Pathways and fate of mercury in freshwater Observations and modelling both show that there are in general many similarities between mercury chemistry pathways and fate in lakes and in the oceans but with obvious differences in scale and in the relative importance of different processes Modelling of mercury dynamics was done for four lakes with a history of direct mercury inputs from the largest freshwater lake in the world (Lake Superior) to small lakes in Ontario Canada Atmospheric deposition and river inflow were the main sources of inorganic mercury Much of the mercury input from lake and river catchments was associated with dissolved and particulate organic matter The dominant mercury removal mechanisms as in saltwater were burial in sediments and photochemical reduction of oxidized mercury to elemental mercury followed by re-emission to the air In Lake Superior and Lake Michigan there is evidence for methylation of mercury in the water column as is seen in the open ocean
Methylmercury levels in freshwater fish vary with the level of deposition of mercury from the air though other factors such as inputs from the watershed and the number of trophic levels within the lakersquos food web are also important Methylation predominantly occurred in lake sediments and wetlands and floodplain soils where sulphateshyreducing bacteria are believed to be primarily responsible Methylmercury is de-methylated in sediments and also taken away in the outlet river from each lake
Some 400-1400 tonnes of mercury are estimated globally to be trapped behind dams and other man-made impoundments each year This has in many cases led to significant increases in total mercury and methylmercury levels in water and of methylmercury in fish and other aquatic species When artificial lakes are created plant material is submerged leading to decay and anoxia In these conditions microbially driven methylation of inorganic mercury takes place In some cases the elevated mercury levels have also been observed downstream from the artificial lakes and reservoirs
Anthropogenic impacts on aquatic mercury levels Two studies have reported that the Atlantic and Pacific Oceans have shown opposing trends over recent decades While the influence of changing ocean currents and other oceanographic factors may be a factor the trends do make sense in light of patterns of anthropogenic emissions In the North Pacific Ocean mercury concentrations appear to have increased at depths between 200 and 1000 meters over the last few decades This increase coincides with the rapid industrialization of East Asia
In the North Atlantic however results from near Bermuda suggest a substantial decrease in mercury concentration and a change in the mercury profile through the water column The Mediterranean Sea too showed a decrease in mercury concentration between 1990 and 2004 These findings are consistent with atmospheric data from around the North Atlantic The conclusion is that mercury levels in seawater in the North Atlantic were elevated by human activity but may now be declining likely as a result of decreased emissions from North America and Europe
A complementary approach to measuring mercury in seawater is to measure mercury in aquatic animals which accumulate and integrate mercury over time Teeth hair feathers and eggshells are useful long-term archives of mercury concentrations and can provide data from the pre-industrial period (ie before 1800) as well as more recent periods
Among marine animals samples are available from several regions particularly from the Arctic where cold dry conditions help preserve animal tissues Mercury concentrations between the 13th and 16th
centuries were relatively stable From the mid- to late 19th century to the end of the 20th century mercury levels increased by an average of 12 times On average therefore about 92 of the mercury in Arctic marine wildlife today is likely to be of anthropogenic origin
Similar findings were found for a 700-year sequence of seabird eggshells from the South China Sea Mercury levels increased steadily between 1800 and 2000 with a particularly rapid increase after 1970 Concentrations since 2000 are about 10 times higher than pre-industrial levels with 91 of the mercury now likely to be of anthropogenic origin In the Antarctic studies of seal hairs show that pre-industrial mercury levels were only 60 of recent levels The relatively small difference
28
UNEP Global Mercury Assessment 2013
Historical Hg concentration as a proportion of present-day 100
80
60
40
20
0
Beluga teeth Human teeth
Gyrfalcon feathers Perigrine falcon feathers
Polar bear hair Ringed seal teeth
1200 1300 1400 1500 1600 1700 1800 1900 2000
between pre-industrial and modern mercury levels in Antarctic is consistent with lower mercury emissions and atmospheric concentrations in the Southern Hemisphere as compared with the Northern Hemisphere
The timing of long-term increases of mercury in aquatic animals can shed light on the likely sources of mercury emissions that were responsible The industrialization of Europe and North America appear responsible for the large increases in marine mercury levels that began in the 19th century as these increases occurred prior to recent Asian industrialization As with water concentrations in the Pacific Ocean recent rapid increases in mercury in seabird eggs in the South China Sea coincide with industrialization in Asia
The time lag in aquatic ecosystem response One important conclusion from air-ocean modeling is that the oceans have not yet reached equilibrium with current atmospheric levels of mercury This lag is due to several factors First mercury stays in the upper ocean above 200 meters depth for about 30 years and for centuries in intermediate and deep waters This is much longer than the one year residence time in the lower atmosphere Thus removal from the ocean takes much longer than does removal from the air and so concentrations will change more slowly
Second because of the long lifetime of mercury in deeper ocean waters a great deal of natural mercury is present in the ocean already about 100000 tonnes out of a total of 135000 tonnes in intermediate waters and 200000 out of 220000 tonnes in deep waters
Rune Dietz
Analysis of museum samples reflects the increase in mercury emissions and releases since the mid-19th century associated with anthropogenic activities
Third vertical transport of mercury from intermediate depths back to the surface returns a substantial amount of mercury to the biologically active zone each year As a result average mercury concentrations in seawater and marine animals are likely to increase slowly for decades if not centuries even if atmospheric levels stabilize at present levels In short the effects of historical anthropogenic emissions from Europe and North America are still being observed in the oceans at the same time that the effects of the recent rise in emissions from Asia are being seen
Regionally different trends can be expected depending on distance from sources and ocean circulation patterns In the North Atlantic north of 55deg N it will take 50-600 years to achieve equilibrium between atmospheric and seawater mercury levels In the North Pacific this process is estimated to take 500-700 years and in the Antarctic 700-1000 years The Arctic Ocean by contrast is smaller and will only take about 35 years to reflect changes in atmospheric mercury levels Surface waters of the Mediterranean Sea should show also changes within 10-50 years
Time lags in the responses of many freshwaters and their food-webs to changes in atmospheric mercury levels are also expected Although some immediate recovery following reductions in atmospheric mercury deposition rates is likely full recovery may take decades centuries or longer depending on the characteristics of the area Highly polluted freshwaters with catchments and sediments containing large amounts of anthropogenic mercury will recover most slowly as is already observed around point sources such as smelters that have closed down
29
UNEP Global Mercury Assessment 2013
Major gaps in knowledge 9 Large uncertainties remain in global estimates of mercury emissions to the air These stem from various sources including the availability of information on activity levels but mainly from the lack of information concerning the mercury content of some raw materials and the validity of assumptions regarding processes and technologies employed to reduce mercury emissions including their rates of application and effectiveness The accuracy and precision of measurement-based estimates can depend on the validity of extrapolating measurements made at infrequent intervals to longer periods or measurements made at one plant to other facilities with similar operations
Potentially important emissions sectors that are still not quantified in the emissions inventory include the use of mercury in vinyl-chloride monomer production secondary metals production oil and gas extraction transport and processing industrial and hazardous waste incineration and disposal sewage sludge incineration and dental fillings preparation and removal
Current measurements and their evaluation are inadequate for determining spatial and temporal trends Improved more extensive and better coordinated measurements are needed A permanent global integrated monitoring network for atmospheric mercury and mercury deposition is needed to achieve this goal The atmospheric network sites should be closely integrated with water soil and biological monitoring networks The results can be used for model testing and evaluation as well as for more accurately detailing the geographic impact of anthropogenic emissions Monitoring of mercury concentrations in the important marine food species is essential to understanding possible human health impacts and the effects of future emissions changes
Better data on mercury distribution in the troposphere is needed to improve understanding of long-range transport and source-receptor relationships Coordinated studies at high altitudes and by aircraft are needed This information will
also help validate regional and global scale models improving their prediction capabilities with regard to different policy scenarios
Key processes related to global transport and cycling of mercury remain inadequately understood The chemical form of gaseous oxidized mercury is unknown Reduction and oxidation rates for mercury in the presence of atmospheric oxidants need further study including determining which oxidants are important New measurements and modelling studies are needed to examine key chemical and physical processes that affect global transport and cycling
Few data are available for reporting mercury releases to aquatic systems Systematic and consistent monitoring of mercury releases to the air is required especially for contaminated systems Releases of mercury from soils into waters depend greatly on climate and topography and these parameters need to be better accounted for Consistent approaches for measuring and reporting releases from point sources are needed to ensure comparability of data from around the world In particular the actual role of artisanal and small-scale gold mining (ASGM) in emissions to air and releases to water needs to be more accurately estimated
The link between mercury deposition methylation and uptake by living organisms needs further study The parameters that determine the rates of exchange of mercury compounds between air and sea air and soil and air and vegetation are not fully understood Whole-ecosystem studies of mercury are needed to better understand biogeochemical cycling Methylationdemethylation rates and their spatial and temporal variations and relationship to climatic factors need to be determined in most of worldrsquos major ocean basins as well as in representative freshwaters
30
UNEP Global Mercury Assessment 2013
Key findings of the 2013 assessment 10 Atmosphere Total anthropogenic emissions of mercury to the atmosphere in 2010 are estimated at 1960 (1010shy4070) tonnes which is about 30 of the total mercury that was emitted and re-emitted from anthropogenic and natural sources in that year The largest anthropogenic sources are associated with artisanal and small-scale gold mining (ASGM) and coal burning which together account for about 62 of the annual total anthropogenic emissions to air Other major sectors include ferrous and non-ferrous metal production and cement production
East and Southeast Asia are responsible for about 40 of global anthropogenic emissions About 75 of the mercury from this region comes from China which is about one-third of the global total Increased estimates for emissions from ASGM largely a result of newly obtained data and improved information mean that South America and Sub-Saharan Africa are also responsible for a greater proportion of global emissions than was previously assumed
Anthropogenic emissions over time have increased mercury loads present in the environment This leads to higher rates of re-emission and also means that there will be a time lag of years or decades between emissions reductions and lower mercury levels in the food web including pathways of human exposure
Mercury emissions to the atmosphere likely peaked in the 1950s to 1970s and subsequently declined because of reductions in Europe Russia and North America Emission trends are unclear due to changes in methods employed to produce inventories and differences in the sectors that have been accounted at different times There are however some indications that emissions may be rising again with increases from East Asia offsetting continuing reductions in Europe and North America
Aquatic environments Natural processes in aquatic systems convert less toxic elemental and inorganic mercury into much more toxic methylmercury Methylmercury concentrates and accumulates in the food web leading to high concentrations in some species of seafood and fish that many people eat
Anthropogenic releases of mercury to aquatic environments contribute hundreds of tonnes to the amount of mercury cycling in the environment Diffuse releases and point sources appear equally important Atmospheric deposition however remains the most important input of mercury to land and oceans and has increased the amount of mercury in many environmental compartments by a factor of two or three since the start of the industrial age On land mercury that is deposited is largely retained in soils and vegetation increasing the available pool for re-mobilisation to adjacent aquatic systems Re-emission from soils however is a major addition to atmospheric mercury
Hydrology is the most important factor in the transport of mercury from catchments to downstream environments Relatively little of this mercury reaches the open ocean as most is captured in sediments behind dams in estuaries and near the coast Changes in land cover and land use can have a large effect on mercury mobilisation as exposed soils erode and mercury leaches into the water table
Concentrations of mercury in Arctic marine animals today are about 10-12 times higher than in preshyindustrial times (ie prior to about 1800) This means that on average about 92 of the mercury in marine predators such as seabirds seals and whales is anthropogenic in origin The timing of the increase suggest that 19th and early 20th century emissions from Europe North America and Russia were responsible Increases mercury concentrations in seabirds in the South China Sea appear to be more recent than the Arctic increases coinciding with increasing industrialisation in East and Southeast Asia
31
UNEP Global Mercury Assessment 2013
K+S Entsorgung Gm
bH
Recovered mercury is being stockpiled at long-term storage sites above- and as shown here below ground
The upper 100 meters of the oceans have twice the mercury that they did a century ago Intermediate and deeper waters have 10-25 more mercury on average reflecting the slow transport of mercury downwards in the oceans Seawater concentrations will thus be especially slow in responding to changes in mercury inputs from atmospheric deposition and river flow As a result mercury concentrations in marine biota are likely to increase slowly for decades to centuries even without an increase in atmospheric emissions
In freshwater ecosystems atmospheric deposition and re-mobilisation from soils slow the reduction of mercury levels even in regions where atmospheric concentrations have decreased due to emission controls
Further increases in atmospheric emissions will have long-term consequences for commercial fisheries and all consumers of marine and freshwater foods
It is likely to be years or decades before reductions in anthropogenic emissions and releases of mercury have a demonstrable effect on mercury levels throughout the environment and in the fish and marine mammals which are part of the human food-chain This only reinforces the need to act now to continue and strengthen international efforts to reduce current mercury emissions and releases Delays in action now will inevitably lead to slower recovery of the worldrsquos ecosystems in future from mercury contamination leaving an even greater legacy of pollution for future generations
32
Division of Technology Industry and Economics (DTIE) Chemicals Branch Geneva Switzerland January 2013
Job number DTI1636GE
UNEP Global Mercury Assessment 2013
Table of Contents
Executive Summary i 1 Introduction 1 2 Sources of mercury emissions to air and releases to water 4 3 Anthropogenic emissions to the atmosphere 9 4 Trends in mercury emissions to the atmosphere 16 5 Atmospheric chemistry monitoring and trends 19 6 Atmospheric concentrations and deposition 22 7 Anthropogenic releases to the aquatic environment 24 8 Aquatic pathways transport and fate 26 9 Major gaps in knowledge 30 10 Key findings of the 2013 assessment 31
UNEP Global Mercury Assessment 2013
UNEP Global Mercury Assessment 2013
Executive Summary
Mercury is a global threat to human and environmental health This report focusing on anthropogenic emissions of mercury and their transport and transformation in the environment is a contribution to international efforts to reduce mercury pollution
This summary report and the accompanying Technical Background Report for the Global Mercury Assessment 2013 are developed in response to Decision 255 paragraph 36 of the Governing Council of the United Nations Environment Programme (UNEP) that
Requests the Executive Director in consultation with Governments to update the 2008 report entitled
ldquoGlobal Atmospheric Mercury Assessment Sources Emissions and Transportrdquo for consideration by the Governing CouncilGlobal Ministerial Environment Forum at its twenty-seventh session
The report provides the most recent information available on worldwide atmospheric mercury emissions releases to the aquatic environment and the transport and fate of mercury in the global environment The report emphasizes emissions to air from human (anthropogenic) activities but includes releases to water because the aquatic environment is the main route of exposure to humans and wildlife It is in aquatic systems that the inorganic mercury is transformed into the more toxic form methylmercury which can accumulate in fish and marine mammals consumed by humans
This Executive Summary presents an overview of the key findings of the Global Mercury Assessment 2013
Total anthropogenic emissions of mercury to the atmosphere in 2010 are estimated at 1960 tonnes2
The 2010 emissions inventory has several improvements over the previous inventory for 2005 including
bull A more detailed analysis of emissions from some major source sectors
1 tonne = 1000 kilograms
bull A more detailed consideration of the mercury content of fuels and raw materials used in different countriesregions bull New and updated information on artisanal and
small-scale gold mining bull The use of different pollution control technologies
in different countries and regions have been factored into the emissions estimates bull Emission estimates for sectors not previously
included such as aluminium production oil refining and contaminated sites bull More and better information on location of major
point sources such as individual power plants smelters and cement kilns bull Better documentation and greater transparency
with respect to the data and information behind the estimates
Using this approach the global emissions to air from anthropogenic sources is estimated as 1960 tonnes in 2010 Despite recent progress in improving the available knowledge base the emissions estimate still has large associated uncertainties giving a range of 1010-4070 tonnes The work also identifies potentially important sectors that are not yet quantified including use of mercury in vinyl-chloride monomer production secondary metals production and ferro-alloys oil and gas extraction and transport and industrial and some hazardous waste incineration
Present day anthropogenic emissions contribute to both current and future emissions to the air
Current anthropogenic sources are responsible for about 30 of annual emissions of mercury to air Another 10 comes from natural geological sources and the rest (60) is from lsquore-emissionsrsquo of previously released mercury that has built up over decades and centuries in surface soils and oceans Although the original source of this re-emitted mercury cannot be determined with certainty the fact that anthropogenic emissions have been larger than natural emissions since the start of the industrial age about 200 years
2
i
UNEP Global Mercury Assessment 2013
ago implies that most re-emitted mercury was originally from anthropogenic sources Reducing current anthropogenic sources is therefore vital to reduce the amount of mercury that is cycling in the environment
Artisanal and small-scale gold mining and coal burning are the major sources of anthropogenic mercury emissions to air
The inventory confirms the role of artisanal and small-scale gold mining (ASGM) and coal burning as the largest components of anthropogenic emissions followed by the production of ferrous and non-ferrous metals and cement production
Annual emissions from ASGM are estimated at 727 tonnes making this the largest sector accounting for more than 35 of total anthropogenic emissions This is more than twice the figure from this sector in 2005 however most of the increase is attributed to some new and better information For example West Africa was thought in 2005 to have minimal ASGM activity but is now recognized as an important source region It is thus difficult to determine whether actual emissions from this sector have changed because their estimation involves a great deal of uncertainty Much of the activity is unregulated or even illegal and thus reliable official data are still hard to obtain More work is needed to confirm the emissions estimates from this sector including field measurements around ASGM sites to better establish the amounts and fate of the mercury used
A large amount of coal is burned around the world to generate electricity to run industrial plants and for in-home heating and cooking Coal burning emitted some 475 tonnes of mercury in 2010 the majority of which is from power generation and industrial use The estimate of emissions from other coal burning (including domestic and residential burning) is lower than that reported in the previous global assessment due to differences in estimates of the amounts and mercury content of coal burned in these uses Use of coal for power generation and industry is increasing especially in Asia However wider use of air pollution controls and more stringent regulations in several countries together with improved combustion efficiency have reduced emissions from coal-burning power plants helping to offset most of the increase arising from higher coal consumption
Global anthropogenic mercury emissions from industrial sources may be rising
Emissions to air are thought to have peaked in the 1970s declined over the following two decades and have been relatively stable between 1990 and 2005 There were some indications of slight increases in emissions between 2000 and 2005
Any evaluation of trends needs to take into account changes in reporting and methods used to produce inventory estimates including the introduction of additional sectors Thus a direct comparison of the results of global inventories produced over the past 25 years is not possible A preliminary reshycalculation using the improved methodology of global anthropogenic emissions in 2005 indicates that emissions from fossil fuel combustion metal and cement production increased between 2005 and 2010 but continue to decline in other sectors such as the chlor-alkali industry Overall indications are that emissions from industrial sectors have increased again since 2005
Future emission trends have been examined using scenarios and models Without improved pollution controls or other actions to reduce mercury emissions mercury emissions are likely to be substantially higher in 2050 than they are today
Comparing emissions estimates reported under different reporting systems is not straightforward
The 2010 global inventory results were generally consistent with nationally reported emissions estimates for 2010 providing a degree of confidence in the methods used However comparing estimates for individual countries and sectors is complicated by differences in reporting methods in particular the specification and categorisation of sectors used in different national and international reporting systems National emissions estimates based on individual facility reporting and site measurements should be more accurate than those based on the global inventory methodology However this is difficult to evaluate as most nationally reported inventories lack estimation of associated uncertainties It is also important to recognize that many measurement-based estimates are based on relatively few measurements covering short periods that are then extrapolated to produce annual emissions It is important that all reporting is subject to validation and that associated uncertainties are quantified If different reporting systems are to be compared they need to be better aligned in terms of the emission sources that are identified and used
ii
UNEP Global Mercury Assessment 2013
Asia contributes almost half of global anthropogenic mercury emissions
Increasing industrialization has made Asia the main source region of mercury emissions to air with East and Southeast Asia accounting for about 40 of the global total and South Asia for a further 8 The new data on ASGM and the related increase in emission estimates from this sector have increased South America and sub-Saharan Africarsquos share of global emissions However modelling results continue to indicate that East Asia is the dominant source region for long-range airborne mercury transport worldwide
Anthropogenic releases of mercury to water total 1000 tonnes at a minimum
Previous UNEP global mercury assessments considered only atmospheric emissions The 2013 report is thus the first attempt to compile a global inventory of aquatic releases Three types of sources were considered Point sources are industrial sites such as power plants or factories and they release an estimated 185 tonnes of mercury per year Contaminated sites including old mines landfills and waste disposal locations release 8 - 33 tonnes per year Artisanal and small-scale gold mining was evaluated separately with total releases to water and land totalling more than 800 tonnes per year Deforestation mobilizes another 260 tonnes of mercury into rivers and lakes Other sources remain to be quantified and so these estimates comprise only a partial total Thus anthropogenic releases to waters are likely to be at least 1000 tonnes per year
Mercury concentrations in the oceans and in marine animals have risen due to anthropogenic emissions
Anthropogenic emissions and releases have doubled the amount of mercury in the top 100 meters of the worldrsquos oceans in the last 100 years Concentrations in deeper waters have increased by only 10-25 because of the slow transfer of mercury from surface waters into the deep oceans In some species of Arctic marine animals mercury content has increased by 12 times on average since the pre-industrial period This increase implies that on average over 90 of the mercury in these marine animals today comes from anthropogenic sources The timing of the initial stage of the increase which started in the mid-19th century and accelerated in the early 20th century before the rise of Asian industrialization indicates emissions from Europe Russia and North America were probably responsible Studies from the South China
Sea suggest a similar pattern occurring there more recently likely as a result of Asian industrialization
Monitoring capability continues to improve but whether this can be sustained is uncertain
Existing mercury monitoring networks such as the European Monitoring and Evaluation Programme (EMEP) the Arctic Monitoring and Assessment Programme (AMAP) the North American Mercury Deposition Network (NAMDN) and others in the northern hemisphere have been complemented by new monitoring sites in the southern hemisphere in particular some sites established under the Global Mercury Observing System (GMOS) initiative The longer-term status of many of the newly established sites however depends on availability of sustained funding to continue operations
Anthropogenic emissions and releases over time have increased mercury loads in the environment so the effects of reductions in emissions will often take time to become apparent
Large amounts of mainly inorganic mercury have accumulated in the environment in particular in surface soils and in the oceans as a result of past emissions and releases Owing to their larger volumes intermediate and deep ocean waters below 100 metres actually store much larger tonnages of anthropogenic mercury than surface waters There are also relatively large tonnages of natural mercury circulating in the intermediate and deep waters A significant fraction of the mercury in intermediate waters is recycled back to the surface each year by upwellings Todayrsquos anthropogenic emissions continue to load the oceans and the catchments and sediments of lakes and rivers with inorganic mercury This mercury which is the ldquofeed-stockrdquo for toxic methylmercury production is stored and reshycycled in the bioavailable part of the environment for decades or centuries before it eventually is removed by natural processes One consequence is that there will likely be a time-lag of years or decades depending on the part of the water column before emissions reductions begin to have a demonstrable effect on mercury levels throughout the environment and in the fish and marine mammals which are part of the human food-chain At the same time mercury levels in parts of the Atlantic Ocean are decreasing likely due to reduced emissions in past decades in North America and Europe indicating that emissions reductions can eventually lead to decreases in mercury levels in surface oceans This reinforces the need to continue and strengthen
iii
UNEP Global Mercury Assessment 2013
international efforts to reduce current mercury emissions and releases as delays in action now will inevitably lead to slower recovery of the worldrsquos ecosystems in future from mercury contamination
Global climate change may also complicate the response of global ecosystems to mercury emission reductions through its profound effects on many aspects of the movement and chemical transformations of mercury in the environment For example warmer temperatures may increase rates of organic productivity in freshwater and marine ecosystems and rates of bacterial activity possibly leading to faster conversion of inorganic mercury to methylmercury Thawing of the enormous areas of northern frozen peatlands may release globally-significant amounts of long-stored mercury and organic matter into Arctic lakes rivers and ocean
iv
UNEP Global Mercury Assessment 2013
Introduction
Background and mandate Global inventories for mercury emissions to air from human sources have been produced at approximately 5-year intervals since 1990 by scientific groups UNEP produced its first Global Mercury Assessment in 2002 In 2007 the Governing Council of UNEP through its decision 243 requested the Executive Director of UNEP
to prepare a report drawing on among other things ongoing work in other forums addressing
(a) Best available data on mercury atmospheric emissions and trends including where possible an analysis by country region and sector including a consideration of factors driving such trends and applicable regulatory mechanisms
(b) Current results from modelling on a global scale and from other information sources on the contribution of regional emissions to deposition which may result in adverse effects and the potential benefits from reducing such emissions taking into account the efforts of the Fate and Transport partnership established under the United Nations Environment Programme mercury programme
The results of this request were presented as a summary report entitled ldquoThe Global Atmospheric Mercury Assessment Sources Emissions and Transportrdquo released in December 2008 and an accompanying ldquoTechnical Background Report to the Global Atmospheric Mercury Assessmentrdquo
The technical background report which formed the basis for statements made in the summary report and was prepared in cooperation with the Arctic Monitoring and Assessment Programme (AMAP) Secretariat included an updated inventory of anthropogenic emissions of mercury to the atmosphere The inventory was based on national emissions data for the year 2005 submitted by governments as well as estimates prepared for countries that did not provide data and was coordinated with work related to mercury under the UN Economic Commission for Europe Convention
1
UNEPrsquos 2008 Global Atmospheric Mercury Assessment Report
on Long-range Transboundary Air Pollution (LRTAP) The report also drew on the work of the UNEP Global Mercury Partnership in particular the Mercury Air Transport and Fate Research partnership area
In 2009 the Governing Council of UNEP through its Decision 255 paragraph 36 requested the Executive Director of UNEP
hellip in consultation with Governments to update the 2008 report entitled Global Atmospheric Mercury Assessment Sources Emissions and Transport for consideration by the Governing CouncilGlobal Ministerial Environment Forum at its twenty-seventh session
This updated Global Mercury Assessment 2013 and its accompanying and updated Technical Background Report are the response to that Governing Council request
Developing the 2013 Report As in 2008 the Technical Background Report for the Global Mercury Assessment 2013 forms the basis for the statements made in the Summary
1
UNEP Global Mercury Assessment 2013
Report and is fully referenced according to standard scientific practice As such it is the single reference for the Summary Report It has again been prepared in co-operation with the Arctic Monitoring and Assessment Programme (AMAP) and uses national data and information submitted by several governments Contributions have also been incorporated from the UNEP Global Mercury Partnership in particular its partnership areas on mercury control from coal combustion reducing mercury in artisanal and small-scale gold mining (ASGM) and mercury air transport and fate AMAP mercury expert group UN Economic Commission for Europe (UN ECE) Long-range Transboundary Air Pollution (LRTAP) Convention groups industry and non-governmental organizations Each section was prepared by a team of experts and then reviewed to ensure its scientific accuracy The evaluation of information of mercury released into the aquatic environment benefits from contributions from the Group of Experts on Scientific Aspects of Marine Environmental Protection (GESAMP)
Scope and coverage This update to the Global Mercury Assessment provides the most recent information available for the worldwide emissions releases and transport of mercury in atmospheric and aquatic environments To the extent possible the information comes from the published scientific literature supplemented where necessary by other sources Since the Global Mercury Assessment is intended as a basis for decision making emphasis is given to anthropogenic emissions (mercury going into the atmosphere) and releases (mercury going into water and land) that is those associated with human activities
The Technical Background Report includes a detailed inventory of global mercury emissions to air based on data for 2010 ldquoInventoryrdquo in this context means a compilation of the estimated emissions and releases from various sectors and sources While it attempts to catalogue all major sources of mercury emissions worldwide it should not be regarded as complete and exhaustive
In addition for the first time this Global Mercury Assessment includes an evaluation of information of mercury released into the aquatic environment and its associated pathways and fate The information available for this evaluation is less complete than
that for emissions to air and is based on data from recent years The inclusion of this new element of the Global Mercury Assessment is as a response to the requests from many governments in the Intergovernmental Negotiating Committee (INC) for more information on releases to land and water The aquatic environment is the main route of exposure to humans and wildlife because it is in water that inorganic mercury is transformed into highly toxic methylmercury
The Technical Background Report includes chapters on
bull Global Emissions of Mercury to the Atmosphere describing sources anthropogenic emissions and trends in emissions bull Atmospheric Pathways Transport and Fate
examining pathways levels and trends in air and deposition and modelling of pathways and deposition bull Global Releases of Mercury to Aquatic Environments
containing global estimates of releases to water and bull Aquatic Pathways Transport and Fate examining
mercury pathways in aquatic systems that result in important routes of human exposure
Technical Background Report chapters were prepared by teams of experts and then reviewed to ensure their scientific validity This Summary Report is based on the content of the Technical Background Report and has been reviewed by the authors of the Technical Background Report It was also circulated for national review
This Summary Report provides in Chapter 2 an overview of natural and anthropogenic sources of mercury outlining the main sectors involved The global inventory of anthropogenic emissions to air is presented in Chapter 3 and Chapter 4 describes trends in mercury emissions to the atmosphere What happens after mercury is released to the atmosphere is covered in Chapter 5 on atmospheric chemistry monitoring and deposition and Chapter 6 on atmospheric concentrations and deposition Chapter 7 provides a first attempt to estimate global releases to water followed in Chapter 8 by a discussion of aquatic pathways transformations and fate A review of gaps in knowledge is given in Chapter 9 Chapter 10 summarizes key findings
2
UNEP Global Mercury Assessment 2013
Whatrsquos new in the Global Mercury Assessment 2013 Global mercury emissions inventories continue to improve as new data and better data become available concerning some sources The method for compiling the inventory of anthropogenic emissions to the atmosphere has also been revised and improved Differences in air pollution control technologies and differences in the mercury content of raw materials and fuels in different countries and regions have been factored into emissions calculations to better reflect actual conditions in each country
In the Global Mercury Assessment 2013 a new updated inventory based on data from 2010 is presented in which some new sources (including emissions from combustion of natural gas and primary aluminium production and emissions associated with oil refining) have been quantified for the first time A more detailed analysis has also been made of some of the major mercury emission sectors including the break-down of emissions from coal burning in power plants industrial and other uses In addition new information acquired through the UNEP Global Mercury Partnership area on Reducing Mercury in Artisanal and Small-scale Gold Mining in particular from the Artisanal Gold Council has resulted in a significant re-evaluation of emissions from the ASGM sector
New observational data and new modelling results provide fresh insight into atmospheric mercury transport and fate
Kevin Telmer
One of the objectives of the updated assessment has been to provide transparent documentation and comprehensive compilations of the data that form the basis for all of the estimates presented This approach will allow a more consistent and replicable method for compiling the global mercury emission inventory so that valid comparisons can be made in the future In addition a wider range of experts from around the world have been involved in preparing the Technical Background Report on which this summary is based
The inclusion of an assessment of releases of mercury to the aquatic environment and its subsequent pathways and fate is a further significant development as these topics were not addressed in the 2008 UNEP Global Atmospheric Mercury Assessment The aquatic environment is critical for three reasons
bull Hundreds of tonnes of mercury is released directly into water so an inventory limited to mercury emissions to air provides an incomplete assessment of anthropogenic impacts on the mercury cycle
bull Mercury in aquatic environments can be transformed into methylmercury which is far more toxic to humans and animals and can enter and biomagnify in food webs more readily than other forms of mercury bull Much human exposure to mercury is through
the consumption of fish and other marine foods making aquatic pathways the critical link to human health
A large open artisanal and small-scale gold mining pit
3
UNEP Global Mercury Assessment 2013
Sources of mercury emissions to air and releases to water 2 Mercury is a naturally occurring element and is found throughout the world There are thus many natural sources of mercury creating background environmental levels that have been present since long before humans appeared
Mercury is contained in many minerals including cinnabar an ore mined to produce mercury Much of the present day demand for mercury is met by supply from mercury recovered from industrial sources and stockpiles rather than from mercury mining Mercury is also present as an impurity in many other economically valuable minerals in particular the non-ferrous metals and in fossil fuels coal in particular
Human activity especially mining and the burning of coal has increased the mobilization of mercury into the environment raising the amounts in the atmosphere soils fresh waters and oceans The majority of these human emissions and releases of mercury have occurred since 1800 associated with the industrial revolution based on coal burning base-metal ore smelting and gold rushes in various parts of the world To some extent the same drivers of mercury emissions and releases are continuing with fossil-fuel-based energy generation powering industrial and economic growth in Asia and South America which in turn helps drive high demand for metals including gold spurring artisanal and small-scale gold mining (ASGM) around the world
In preparing inventories of mercury emissions and releases it is important to distinguish various categories of sources Three main types of emissions and releases can be distinguished each of which is briefly introduced here in qualitative terms with particular emphasis on anthropogenic sources
Natural sources of mercury emissions and releases Mercury in the earthrsquos crust can be emitted and released in several ways to air water and land Natural weathering of mercury-containing rocks
farbled Shutterstockcom
Cinnabar the principal ore of mercury
Year 2000
1950
1900
1850
1800
1750
1700
Mt St Helens (1980)
Industrial period
WWII manufacturing
Krakalau (1883)
Gold rush (circa 1850-84)
Tambora (1815)
Pre-industrial period
1998 core 1991 core Natural background Natural events (volcanic eruptions) Localregional anthropogenic sources Global anthropogenic (industrialization)
0 5 10 15 20 25 30 35 40 Total mercury ngL
Ice core record of deposition from Wyoming USA The elevated levels associated with the 1850-84 US gold rush probably reflect localregional sources rather than a global signature Increasing environmental levels of mercury associated with industrialization however are found in environmental archives like this ice core around the globe
4
UNEP Global Mercury Assessment 2013
Global mercury cycling Mercury is released to the environment from natural sources and processes and as a result of human activities Once it has entered the environment mercury cycles between air land and water until it is eventually removed from the system through burial in deep ocean sediments or lake sediments and
through entrapment in stable mineral compounds Methylmercury the most toxic and bioaccumulative form of mercury which presents the greatest health risk to humans and wildlife is mainly formed in aquatic environments through natural microbial processes
80shy600
3700
2000shy2950
2000 300shy600
1700shy2800
3200
380
lt600
Geogenic Anthropogenic
Anthropogenic Biomass burning
Soil and vegetation
Deposition to oceans
Rivers
Deposition to land
freshwater
Geogenic
Oceans
Anthropogenic
Natural
Re-emissions Re-mobilization
Units tonnes
1 tonne = 1000 kilograms
Global mercury budgets based on models illustrate the main environmental compartments and pathways that are of importance in the global mercury cycle and the ways in which natural and anthropogenic releases to air land and water move between these compartments Emissions to air arise from natural sources and anthropogenic sources as well as re-emissions of mercury previously deposited from air onto soils surface waters and vegetation
is continuous and ubiquitous allowing mercury to escape to air and to be washed into lakes and rivers Volcanoes emit and release mercury when they erupt Geothermal activity can also take mercury from underground and emit it to the atmosphere and release it to the deep oceans Some recent models of the flow of mercury through the environment suggest that natural sources account for about 10 of the estimated 5500-8900 tonnes of mercury currently being emitted and re-emitted to the atmosphere from all sources
onime Shutterstockcom
5
UNEP Global Mercury Assessment 2013
Anthropogenic sources of mercury emissions and releases Anthropogenic sources of mercury emissions account for about 30 of the total amount of mercury entering the atmosphere each year
As found in previous global mercury assessments the main industrial sources of atmospheric mercury are coal burning mining industrial activities that process ores to produce various metals or process other raw materials to produce cement In these activities mercury is emitted because it is present as an impurity in fuels and raw materials In these cases mercury emissions and releases are sometimes referred to as lsquoby-productrsquo or lsquounintentionalrsquo emissions or releases A second category of sources includes sectors where mercury is used intentionally Artisanal and small-scale gold mining (ASGM) is the largest of these in which mercury emissions and releases result from the intentional use of mercury to extract gold from rocks soils and sediments Other intentional-use release sectors include waste from consumer products (including metal recycling) the chlor-alkali industry and the production of vinyl-chloride monomer
Coal burning and to a lesser extent the use of other fossil fuels is one of the most significant anthropogenic source of mercury emissions to the atmosphere Coal does not contain high concentrations of mercury but the combination of the large volume of coal burned and the fact that a significant portion of the mercury present in coal is emitted to the atmosphere yield large overall emissions from this sector The mercury content of coal varies widely introducing a high degree of uncertainty in estimating mercury emissions from coal burning Data on mercury content is now available from many countries including major emitters of mercury
Mining smelting and production of iron and non-ferrous metals are also a large source of global mercury emissions to air and also a very important sector with regard to releases to water In the mining and processing of metals most of the mercury is captured and either stockpiled or sold for use in various products creating anthropogenic sources associated with intentional use discussed below Nonetheless the volume of ores and metals involved result in large total emissions and releases The relatively small volume of primary mercury production makes mercury mining a far smaller source today than it has been in the past
Cement production which typically involves the burning of fossil fuels to heat the materials required to make cement is another major anthropogenic source of mercury emissions Both the raw materials and the fuel may contain mercury and lead to emissions The amount of mercury involved varies greatly with the mercury content of these fuels and especially with the raw materials In some countries cement kilns are burning increasing amounts of alternative fuels including wastes that may contain mercury This may add to the emissions from cement kilns
Oil refining emits and releases mercury as oil deposits are known to contain mercury generally at low concentrations Mercury is removed from most petroleum products and natural gas prior to combustion and therefore combustion-related emissions are low Most of the mercury in crude oil is associated with solid waste that is disposed of in landfills However emissions and releases during refining of crude oil do occur and these have been quantified for the first time in the 2010 inventory The inventory does not quantify other emissions and releases during oil and gas extraction and transport or from flaring
Unintentional mercury emissions from these sectors can be reduced by the application of pollution control measures at power plants and industrial plants Some of the mercury captured is refined and enters the commercial supply chain however large amounts of mercury captured in materials such as fly ash and oil refinery waste need to be disposed of Some of the resulting wastes are themselves used as raw materials for example in construction materials but large amounts are disposed of in landfills which can thus become a potential source of mercury emissions and releases
Among intentional-use sectors Artisanal and small-scale gold mining is a major source for emissions and releases of mercury worldwide In ASGM miners use mercury to create an amalgam separating gold from other materials They then have to separate the mercury from the gold Calculating emissions from this sector presents a particular challenge because it is typically widely dispersed and often unregulated and may be illegal Uncertainties regarding release estimates from the ASGM sector are therefore high Furthermore the miners are typically poor and perhaps have little awareness of the hazards of mercury and pollution control devices may be hard to obtain
Wastes from consumer products containing mercury can end up in landfills or incinerators
6
UNEP Global Mercury Assessment 2013
Mercury is still used in a wide range of products including batteries paints switches electrical and electronic devices thermometers blood-pressure gauges fluorescent and energy-saving lamps pesticides fungicides medicines and cosmetics Once used many of the products and the mercury they contain enter waste streams While mercury in landfills may slowly become re-mobilized to the environment waste that is incinerated can be a major source of atmospheric mercury especially from uncontrolled incineration Incinerators with state-of-the-art controls have low emissions
Another use of mercury is in dental amalgam for filling teeth When bodies are cremated mercury in fillings can be emitted Mercury can also be emitted and released during production and preparation of fillings and from the disposal or removed fillings In addition mercury from removed fillings can be recycled or go into solid waste and wastewater
The amount of mercury released in the recycling of scrap metals for example in secondary steel and nonshyferrous metal production is generally assumed to be much lower than that released during primary metal production which is why the present global inventory only addresses primary metal production However lower emissions from recycling may not be the case in all countries Much of the scrap steel in some countries comes from automobiles that may still have devices that contain mercury and which may not be removed prior to recycling of the steel These devices are largely being phased out so mercury emissions from scrap steel may be expected to decrease However large differences exist between countries in the way they treat their mercury-containing wastes including scrap metals that are recycled in secondary metal production
Mercury is also used in a number of industrial processes A major industrial use is in the chlor-alkali industry where mercury-cell technology may be used in the production of chlorine and caustic soda
Mercury is also used as a catalyst in the production of vinyl chloride monomer (VCM) from acetylene mainly in China
Mercury releases to aquatic systems as a result of current human activities arise from many of the same uses or the presence of mercury in various products and processes that emit mercury to the air As with emissions to the atmosphere aquatic releases come from two main sources First mercury is released with water effluent from the sites where mercury is used Second mercury can leach into water from disposal sites that have mercury in the waste
zhu difeng Shutterstockcom
Tomas Pavelka Shutterstockcom
bikeriderlondon Shutterstockcom
Anthropogenic sources of mercury from industry and intentional use
Gunnar Futsaelig
ter
7
UNEP Global Mercury Assessment 2013
Arnold John Labrentz Shutterstockcom
Re-emission and re-mobilization of mercury Re-emissions constitute the third category of sources presently comprising about 60 of mercury emissions to air Mercury previously deposited from air onto soils surface waters and vegetation from past emissions can be emitted back to the air Re-emission is a result of natural processes that convert inorganic and organic forms of mercury to elemental mercury which is volatile and therefore readily returns to the air Mercury deposited to plant surfaces can be re-emitted during forest fires or biomass burning Mercury may be deposited and re-emitted many times as it cycles through the environment
It is important that re-emitted mercury should not be considered a natural source It may originally have come from natural or anthropogenic sources but by the time it is re-emitted it is difficult or impossible to identify its specific origin Nonetheless human activity has increased the environmental burden of mercury resulting in higher levels of re-emission This is compounded by changes in land use practices as well as increasing temperatures due to climate change
In the aquatic environment re-mobilization of mercury occurs when mercury deposited on and accumulated in soils or sediments is re-mobilized by for example rain or floods that cause the mercury to enter or re-enter the aquatic system Resuspension
of aquatic sediments due to wave action or storm events is an additional way for mercury to re-enter the aquatic ecosystems
Estimating re-emission and re-mobilization rates is difficult It is often done using modelling approaches These models are based on data on atmospheric levels and other observations as well as current understanding of chemical transformations and other processes that determine how mercury moves between air land and water The models aim to balance the amount of mercury in circulation at any given time while remaining consistent with observational data Temperature is a key factor With lower temperatures re-emission rates are generally lower
Re-emission is also a major factor in determining the length of time needed for anthropogenic emission reductions to be reflected in decreasing environmental levels of mercury Mercury emitted in one year may be deposited to and retained in soils and waters for some time before being re-emitted or re-mobilized in subsequent years This cycle can be repeated keeping levels in air and water elevated even after anthropogenic sources have been lowered Conversely continuing to add to the global pool will leave an ever-longer legacy of anthropogenic mercury contamination worldwide It is thus imperative that international efforts to reduce mercury emissions continue and are strengthened as soon as possible
Forest fires re-emit mercury deposited to vegetation
8
UNEP Global Mercury Assessment 2013
Anthropogenic emissions to the atmosphere 3 Global emissions inventory The global emissions inventory for 2010 estimates that 1960 tonnes of mercury was emitted to the atmosphere as a direct result of human activity The leading sectors remain the same as those identified in the 2005 inventory Improved data however have changed the relative contributions of some of these sectors as have some actual changes in emissions All coal burning emissions taken together for example represent a lower percentage of the total emissions than in the 2005 inventory This is due in part to the increased estimates from artisanal and small-scale gold mining (ASGM) and in part to much lower estimates for domestic use of coal When the actual amount of mercury emitted from coal combustions in power generation and industrial uses is considered and the estimates are based on the same 2010 methodology the emissions in 2010 are the same and perhaps slightly higher than in 2005 Even though new coal-fired power plants are being built combustion efficiency and emissions controls are also improving in most parts of the world
Results by selected sector The updated inventory of emissions to air confirms coal burning as a continuing major source of emissions responsible for some 475 tonnes of mercury emissions to air annually compared with around 10 tonnes from combustion of other fossil fuels According to the new inventory more than 85 of these emissions are from coal burning in power generation and industrial uses In the previous assessment emissions from domestic and residential coal burning were highlighted as a possible larger contribution Better information on coal consumption for domestic and residential uses indicates that these activities are a smaller contribution to total emissions from coal burning than previously thought
Emissions from the cement production industry are largely dependent on the raw materials and the fuels used The new inventory avoids double
Emissions from various sectors in tonnes per year with the range of the estimate and as a percentage of total anthropogenic emissions Note These numbers cannot be compared directly with those presented in the 2008 assessment (see Chapter 4 Trends in mercury emissions to the atmosphere)
Sector Emission (range) tonnes
By-product or unintentional emissions
Fossil fuel burning
Coal burning (all uses) 474 (304 - 678) 24
Oil and natural gas burning 99 (45 ndash 163) 1
Mining smelting amp production of metals
Primary production of 455 (205 ndash 241) 2 ferrous metals
Primary production of nonshy 193 (82 ndash 660) 10 ferrous metals (Al Cu Pb Zn)
Large-scale gold production 973 (07 ndash 247) 5
Mine production of mercury 117 (69 ndash 178) lt1
Cement production 173 (655 - 646) 9
Oil refining 16 (73 - 264) 1
Contaminated sites 825 (70 - 95) 4
Intentional uses
Artisanal and small-scale 727 (410 ndash 1040) 37 gold mining
Chlor-alkali industry 284 (102 ndash 547) 1
Consumer product waste 956 (237 ndash 330) 5
Cremation (dental amalgam) 36 (09 - 119) lt1
Grand Total 1960 (1010 ndash 4070) 100
Values rounded to 3 significant figures To nearest percent
Sectors for which emissions are not currently quantified
biofuel production and combustion
vinyl-chloride monomer production emissions during
secondary metals production and ferro-alloys
oil and gas extraction transport and processing other than refinery emissions
industrial some hazardous waste incineration and disposal
sewage sludge incineration
preparation of dental amalgam fillings and disposal of removed fillings containing mercury
9
UNEP Global Mercury Assessment 2013
Disposal of waste from
Mercury-cell chlor-alkali
industry
Relative contributions to estimated emissions to air from anthropogenic sources in 2010
Oil refining
Coal combustion
Oil and natural gas combustion
Primary ferrous metal production
Primary non-ferrous metal (Al Cu Pb Zn)
Large-scale gold production
Hg production Cement production
mercury-containing products
Contaminated sites
Cremation
Artisanal and small-scale gold production
counting of emissions from conventional fuels (such as coal and oil) that are included under the industrial fossil fuel burning emissions However it does attempt to account for emissions from other fuels including alternative fuels (such as old tyres and other wastes) and from raw materials Increasing amounts of waste are being co-incinerated in the cement industry both as fuel but also in some plants as a means of disposing of hazardous wastes some of which may contain mercury In some regions additional measures are being introduced to make sure that mercury emissions associated with waste co-incineration do not increase overall emissions from cement plants
Increased application of air pollution control devices including some mercury-specific technologies together with more stringent regulations in several countries have the effect of reducing mercury emissions from coal burning sectors and thus offset some part of the emissions arising from increased activity
Artisanal and small-scale gold mining emissions are in the 2010 inventory the major source of emissions to air at 727 tonnes per year The reasons for the large increase in the estimate compared to 2005 are discussed below (see page 16) The global estimate for emissions from ASGM includes a significant contribution from China although
recent information on this sector in China is lacking China prohibited ASGM in 1996 and therefore records no emissions from this sector
Mercury-cell technology is becoming less common in the chlor-alkali industry as other more cost-effective processes are adopted No new plants are being constructed though many older plants remain to be converted Old chlor-alkali plants and other decommissioned industrial sites may constitute contaminated sites that continue to release mercury to the environment for many years and emissions from contaminated sites are now part of the inventory
Global emissions from use of mercury in dental amalgam resulting from cremation of human remains are estimated at 36 (09 ndash 119) tonnes in 2010 Some 340 tonnes of mercury is used per year in dentistry of which about 70-100 tonnes (ie 20shy30) likely enters the solid waste stream
In the production of vinyl chloride monomer information is still lacking on the lifecycle and eventual fate of the mercury catalyst Most of this production occurs in China and about 800 tonnes of mercury is thought to have been used by this industry in China in 2012 Used mercury catalyst is recycled and reused by enterprises that hold permits for hazardous waste management The amounts that may be emitted or released are unknown
Ronald de Hom
mel
Artisanal and small-scale gold mining Unlike most small-scale gold miners the green gold miners of Oro Verde shown here employ an environmental way of mining gold that does not use mercury or other chemicals
10
UNEP Global Mercury Assessment 2013
Results by region The greatest proportion of anthropogenic mercury emissions to the atmosphere comes from Asia which contributes about 50 of the global total The majority of Asian emissions come from East and Southeast Asia China accounts for three-quarters of East and Southeast Asian emissions or about one third of the global total
New data on emissions from ASGM have increased the proportion of global emissions attributed to South America and Sub-Saharan Africa largely due to increased estimates associated with improved information about ASGM activities in these areas
Emissions to air from other major source sectors are higher in Europe North America and Oceania
Mercury emission 2010 gkm2
0 2 5 10 100 1000
Global distribution of anthropogenic mercury emissions to air in 2010
Emissions from various regions in tonnes per year with the range of the estimate and as a percentage of total global anthropogenic emissions Note These numbers cannot be compared directly with those presented in the 2008 assessment (see Chapter 4 Trends in mercury emissions to the atmosphere)
See figure on the following Region Emission (range) tonnes page for map with
Australia New Zealand amp Oceania 223 (54 - 527) 11 specification of regions Values rounded to 3 Central America and the Caribbean 472 (197 - 974) 24
significant figures CIS amp other European countries 115 (426 - 289) 59
East and Southeast Asia 777 (395 - 1690) 397
European Union (EU27) 875 (445 - 226) 45
Middle Eastern States 370 (161 - 106) 19
North Africa 136 (48 - 412) 07
North America 607 (343 - 139) 31
South America 245 (128 - 465) 125
South Asia 154 (782 - 358) 79
Sub-Saharan Africa 316 (168 - 514) 161
Undefined (global total for emissions from 825 (700 - 950) 42 contaminated sites)
Grand Total 1960 (1010 ndash 4070) 100
11
UNEP Global Mercury Assessment 2013
North America
Central America and the Caribbean
South America
Unintentional emissions
Stationary combustion (coal)
Stationary combustion (oil and gas) Oil refining
Pig iron and steel
Intentional uses
Artisanal and small-scale gold mining Chlor-alkali
EU27
North Africa
Sub-Saharan Africa
Non-ferrous metals (Cu Pb Zn Al) Mercury
Large-scale gold
Cement
Product waste
Cremation
CIS amp other European countries
500
100
Middle Eastern States East and Southeast Asia
50
10 tonnes
South Asia Australia New Zealand amp Oceania
South America
North America
Central America and the Caribbean
Sub-Saharan Africa
South Asia North Africa
Middle Eastern States
EU
East and Southeast Asia
CIS amp other European countries
Australia New Zealand amp Oceania
Estimates of 2010 anthropogenic mercury emissions to air from different main sectors in different regions ASGM is shown separately to highlight its geographic distribution and better allow regional comparisons to be made for other sectors
12
UNEP Global Mercury Assessment 2013
Compiling the 2010 inventory of anthropogenic mercury emissions to air The inventories used in successive Global Mercury Assessments continue to improve as better data become available The 2013 update presents an inventory of emissions for 2010 that has a number of improvements over the 2008 assessment and its inventory for 2005
bull A more detailed analysis of emissions from some major source sectors For example fossil fuel consumption is now broken down into categories for combustion in power plants industry and other uses The type of coal or oil used is also considered providing a more accurate estimate of mercury emissions
bull A more detailed consideration of the mercury content of fuels and raw materials used in different countries and regions bull New and updated information on ASGM bull The use of different pollution control technologies
in different countries and regions have been factored into the emissions estimate bull Emission estimates for sectors not previously
included such as aluminium production oil refining and contaminated sites bull More and better information on location of major
point sources such as individual power plants smelters and cement kilns bull Better documentation and greater transparency
with respect to the data and information behind the estimates
The methods for estimating emissions from industrial sectors is complemented by other methods used for more dispersed emissions sources For example estimating emissions from some intentional-use sectors requires intensive work with those sectors Relevant and accurate information about ASGM is generally not available through official channels Estimating mercury emissions from its intentional use in lighting batteries and other products requires analysing the entire production use and waste stream to determine where mercury is likely to be released and in what quantities The approach used in the 2013 assessment addresses the emissions from breakages and wastes resulting from use of these mercury-containing products in society the majority of
which are incinerated or end up in landfills It does not however address industrial wastes or sewage sludge incineration
Uncertainties in emission estimates Estimates of mercury emissions are just that estimates To compile a global assessment requires making a number of assumptions and generalizations Uncertainty associated with the 2010 inventory arises from each of the factors used to estimate the emissions the correctness of the activity data the validity of the emission factors applied and the validity of assumptions regarding the effectiveness and use of emission-control technologies
Based on an evaluation of these sources of uncertainty and the relative contributions of sectors with reliable information and those with less reliable data uncertainty in the 2010 inventory assessment of total anthropogenic mercury emissions to air gives a range of emissions from 1010-4070 tonnes This range is greater than that reported in some previous assessments reflecting a greater appreciation of the sources of uncertainty due to the improved estimation methods and perhaps a more realistic appraisal of the state of knowledge concerning some aspects of emissions
The best estimate taking a conservative approach is 1960 tonnes If nationally produced estimates for 2010 available from some countries (Canada Japan Korea Mexico the United States and European countries reporting to LRTAP) are introduced into the global inventory in place of the inventory estimates the corresponding estimated total global anthropogenic emission to air is 1940 tonnes As most national inventories do not include uncertainty ranges it is not possible to assign a range to this number The recognition of uncertainties is an important consideration and presenting single national estimates can convey a misleading picture of what is known and more importantly not known about emissions
The numbers derived using the methods employed to produce the global inventory for 2010 were compared with a number of national inventories and emissions reported under other systems covering the same period In general the level of agreement was good in particular when the significant uncertainties
13
UNEP Global Mercury Assessment 2013
Methods for estimating emissions All global mercury emissions inventories to date have used the same basic approach for the major sectors emitting mercury to the atmosphere For specific emission sectors national emissions estimates are calculated by multiplying the amount of activity (ie amounts of fuels burned raw materials consumed or materials produced) by an emission factor that is an estimate of the mercury emitted per unit of activity For example emissions from coal-fired power generation are estimated by multiplying the tonnes of coal used by the amount of mercury estimated to be released per tonne of coal In most such inventories ldquoabatedrdquo emission factors have been employed to quantify both the emissions of mercury that occur during the processes and the effects of mercury emission controls In the new methodology used to develop the 2013 report these components are split ldquoUnabatedrdquo emission factors are employed to quantify the emissions and ldquotechnology profilesrdquo have been developed to represent the effects of mercury emission controls
Various methods are employed to estimate emissions of mercury at individual sources and at national regional and global levels In general the methods fall under one of two main categories
bull Mass-balancesubstance-flow based estimates which are based on the principle that what goes in must come out Amounts of mercury in fuels and raw materials constitute the inputs and the outputs are the amounts of mercury emitted to air released to water or land retained in products or in wastes or otherwise recovered and stored or disposed of
involved in both global and national estimates are taken into account It is important to note that there are good reasons why estimates of mercury emissions produced in the 2010 inventory may not fully agree with national inventories made by countries using other methodologies These reasons include
bull Reporting schemes may define and distinguish emissions source sectors in very different ways and aligning these sectors may not be possible
bull Industry reporting to national government may be limited to sources with emissions above a certain threshold level so that emissions from smaller sources below the threshold are not reported Where smaller sources make up a significant part of the source category reported inventories
bull Measurement-based estimates which rely on measurements made at appropriate points in the industrial process or in the productwaste output streams These measurements are used to estimate where the mercury goes as in the method above
In principle the two approaches should produce the same results In practice mass-balance based approaches tend to result in higher emission estimates than most measurement-based estimates Since future emissions reporting is likely to involve a combination of these two approaches further work is required to understand why results may differ and to reconcile the two approaches
Since the 2008 UNEP assessment was produced the number of direct measurements of emissions from certain point sources (in particular power plants and some metal and cement production plants and waste incineration facilities) has increased considerably resulting in a much improved knowledge base
A number of countries require regular reporting of emissions Increasing use is being made in these reporting systems of measurement-based estimates and facility-level reporting in particular for major point sources In other countries national mercury emissions are only being quantified for the first time Since 2005 and the start of the UNEP negotiating process in 2010 many countries have initiated work on national emission inventories which in several cases have yielded much improved information on activity data sector characteristics and mercury emissions Such inventories often make use of the UNEP Toolkit for identification and quantification of mercury emissions
may therefore significantly underestimate total mercury emissions bull National inventories in some countries are making
increasing use of actual measurements of mercury emissions at individual facilities At the global scale it is not yet feasible to base an inventory on individual site emissions Furthermore actual measurements of mercury emissions at a source may be taken only a few times during a year and may not be fully representative of normal operations In the 2013 assessment a mass-balance based approach was employed to be consistent transparent and replicable bull National reporting and monitoring schemes
may provide information that is not available to externally produced inventories
14
UNEP Global Mercury Assessment 2013
Despite these considerations most of the discrepancies noted between the 2010 inventory mass-balance-based estimates and national estimates based on measurement- approaches are modest and within the margins of error associated with the different approaches In cases where the differences are larger it is important to recognize that there are sources of error in all methods for estimating mercury emissions
Gunnar Futsaelig
ter
Sampling of mercury emissions at the Kendal coal-fired power plant in South Africa conducted under a UNEP project A probe with mercury traps is inserted into a sampling port in the stack to collect mercury present in the flue gas The mercury traps are subsequently analysed according to the US EPA Mercury Monitoring Toolkit sampling protocol
15
UNEP Global Mercury Assessment 2013
Trends in mercury emissions to the atmosphere 4 Assessing global and sectoral trends A key question in assessing anthropogenic mercury emissions worldwide is whether they are increasing or decreasing While it is tempting simply to compare the 2010 inventory with its 2005 counterpart the results would mean little As inventory methods develop and as additional sources are considered the estimate of total anthropogenic mercury emissions worldwide also changes While some changes reflect real trends others reflect changes in methods or scope Thus comparing the results of previous assessments with the present update requires considerable care and involves an understanding of the way in which these inventories have been produced and the uncertainties associated with them
It is possible however to compare certain sectors over time by attempting to compensate for any methodological changes between the various inventories since 1990
Emissions to air are thought to have peaked in the 1970s From 1990 to 2005 total anthropogenic emissions of mercury to the atmosphere appear to
Emissions to air t
1400
1200
1000
800
600
400
200
0
1990
1995
2000
2005
Africa Asia Europe Russia North Oceania South America America
Estimates of annual anthropogenic mercury emissions from different continentsregions 1990-2005
have been relatively stable with decreases in Europe and North America being offset by increases in Asia A reanalysis of the available inventories since 1990 however indicates that emissions from industrial sectors at least may be starting to increase again
The changes introduced in the 2010 inventory methodology prevent a straight-forward continuation of this analysis However an evaluation of trends for some sectors between 2005 and 2010 has been made by applying the new methodology to activity data for 2005 This comparison suggests a further slight increase in the combined amount of mercury emitted by industrial sectors (coal combustion production of cement pig iron and steel and non-ferrous metals) The following paragraphs describe the trend results for three sectors to illustrate some of the developments between 2005 and 2010 and some of the the difficulties in comparing emissions estimates between different years made with different methods
Coal burning for power generation and for industrial purposes continues to increase especially in Asia However increases in the application of air pollution controls including some mercury specific technologies together with more stringent regulations in a number of countries have reduced mercury emissions from coal burning in power plants in particular and thus offset some part of the emissions arising from increased coal consumption
In the United States for example emissions from coal burning at power plants have reportedly decreased from about 53 tonnes in 2005 to 27 tonnes in 2010 This decrease is largely due to new regulations that have resulted in changes in the sources of the coal that is burned in large power plants and the installation of mercury controls as well as controls on sulphur dioxide and particulates that have the co-benefit of further reducing mercury emissions
In China many of the new coal-fired power plants have state-of-the-art pollution controls installed
Emissions of mercury from artisanal and small-scale gold mining (ASGM) reported for 2010 are more than twice those reported for 2005 While the
16
UNEP Global Mercury Assessment 2013
Unintentional emission sectors Coal burning ferrous- and non-ferrous (Au Cu Hg Pb Zn) metal production cement production Intentional-use sectors Disposal and incineration of product waste cremation emissions chlor-alkali industry
Comparison of emissions in 2005 and 2010 by selected sector and region
Unintentional emission sectors
Emission t
1000
800
600
400
200
0 2005 2010
Australia New Zealand amp Oceania
Central America and the Caribbean
CIS amp other European countries
East and Southeast Asia
rise in the price of gold (from USD 400 per ounce in 2005 to USD 1100 per ounce in 2010) along with increased rural poverty may indeed have caused more activity in this sector the increased estimate for mercury emissions is considered to be due primarily to some more and better data from many countries and regions West Africa for example was regarded as having minimal ASGM in 2005 but is now recognized as a region with considerable activity Thus the baseline has improved without necessarily any change in actual activity or emission levels
Waste from consumer products is affected by the amount of mercury used For most products in which mercury is used mercury-free alternatives exist Consequently many of these uses of mercury are declining at least in some regions as alternative products or processes are adopted Compact fluorescent light bulbs are an exception Even though the mercury content of individual light bulbs has decreased use of this type of light bulb is increasing rapidly
Artisanal and small-scale gold mining Intentional-use sectors
1000 1000
Step change from 2005 to 2010 due to new information 800 800 (under-estimation in 2005)
600 600
400 400
200 200
0 0 2005 2010 2005 2010
European Union (EU27) South America
Middle Eastern States South Asia
North Africa Sub-Saharan Africa
North America
In order to make valid assessments of trends in emissions from global inventories comparable data on activity levels are required together with information on changes in fuel and raw material characteristics and applied air pollution control technology One aim of the 2010 inventory methods is to create a firmer foundation for such future trend analysis
Ralf Siemieniec Shutterstockcom
Use of mercury-containing energy-saving lamps is increasing
17
UNEP Global Mercury Assessment 2013
Emission scenarios and future trends The 2008 Global Atmospheric Mercury Assessment included a first attempt at projecting future emissions inventories These were based on three scenarios continuing with the status quo applying current emissions controls worldwide and achieving maximum feasible technological reductions At the time this effort was regarded as highly provisional Since then additional studies have extended and improved this work but the results are not markedly different from earlier projections of future mercury emissions
Global mercury models have been used to evaluate future scenarios Four global and hemispheric models projected mercury levels around the world in 2020 based on the three emission scenarios described earlier In industrial regions the status quo will cause an increase in mercury levels of 2-25 and in remote areas of 15-5 The two emission control scenarios on the other hand yield a decrease in mercury in industrial areas of 25-35 and in remote areas of 15-20
Another global model was coupled with estimates of surface reservoirs of mercury in order to quantify source-receptor relationships for the present and for 2050 Under the best-case scenario of maximum feasible reductions projected estimates for deposition in 2050 is similar to estimates for today In the other scenarios increasing emissions lead to increasing deposition A greater proportion of mercury emissions is expected to be in the oxidized form so that a greater proportion will be deposited near the source instead of being transported far away
The model results support the conclusion that reducing anthropogenic emissions will slowly reduce the amount of mercury in biologically available reservoirs Over time mercury in the environment will be taken out of circulation by natural processes for example from ocean waters down into sediments and biologically available mercury will decrease Increased emissions on the other hand will continue to build up the amount of mercury in circulation
With new databases and methods it may soon be possible to create scenarios that incorporate activity levels as well as technology use for each country If this were done it would allow countries to assess the effects of different mercury reduction strategies on their national emissions For example a country could determine the relative contributions of emission reduction technology as opposed to for example changes in raw materials
18
UNEP Global Mercury Assessment 2013
Atmospheric chemistry monitoring and trends 5 Forms of mercury in air Mercury in the atmosphere is in three primary forms Gaseous elemental mercury is the most common in anthropogenic and natural emissions to the atmosphere Gaseous oxidized mercury and mercury bound to particulates are less common The transport and deposition of atmospheric mercury depend greatly on whether the mercury is elemental or oxidized Elemental mercury stays in the atmosphere long enough for it to be transported around the world whereas oxidized and particulate mercury are more readily captured in existing pollution control systems or deposited relatively rapidly after their formation As a result most mercury in the air is in the gaseous elemental phase Relatively little elemental mercury is deposited directly but instead must fi rst be oxidized
Although gaseous oxidized mercury is very important in mercury cycling between air and other environmental compartments the process of oxidation in the air is poorly understood with reactions and resulting compounds yet to be verified in observations
When mercury moves from air to water and land it is generally in an oxidized gaseous or particulate form whereas when it is re-emitted to air it has been converted back to gaseous elemental
Particulate associated mercury
Pole
Equator
Gaseous elemental mercury
Global transport
Gaseous elemental mercury can be transported globally Mercury emitted in particulate form tends to deposit closer to sources
mercury Sunlight appears to play a large role in both oxidation and reduction of mercury but temperature and biological interactions are also likely to be involved to some degree Here too much uncertainty remains Nonetheless the reactions are important in determining net deposition and fate of mercury
Monitoring of mercury in air Monitoring of mercury in air focuses on the three primary forms of mercury The measurement of gaseous elemental mercury is routine and robust Measuring gaseous oxidized mercury and particulate-bound mercury however is challenging Concentrations are typically very low and these forms are chemically unstable leading to high uncertainty in the measurements Nonetheless these forms are critical for defining and modelling the fate and transport of airborne mercury
In the past two decades coordinated mercury monitoring networks and long-term monitoring sites have been established in a number of regions measuring mercury concentrations in the air as well as deposition of mercury in precipitation In Europe and North America high-quality continuous monitoring has been going on for more than 15 years especially in the Arctic High-quality monitoring has started more recently in East Asia and South Africa as part of a global effort to expand the coverage provided by long-term monitoring sites
Measurements and trends in atmospheric mercury Monitoring stations around the world have provided information about trends in atmospheric mercury though the time periods vary depending on how long the site has been active Overall a declining trend in background mercury levels over the past decade has been recorded from monitoring stations
19
UNEP Global Mercury Assessment 2013
in many regions Other regions however show an increase in mercury levels
The sites also provide information about geographical patterns reflecting both background levels of
Trends in atmospheric measurements of mercury
Site(s) Period
Mace Head Ireland 1996-2011
North America rural sites 1995-2005
High Arctic sub-Arctic Up to 20 years of records mid-latitudes
Monitoring networks Mercury monitoring in Europe is carried out under the European Monitoring and Evaluation Programme (EMEP) one of the first international environmental measurement networks Heavy metals such as mercury have been included in the EMEP program since 1999 Mercury measurements are available only from northern and northwestern Europe
Three monitoring networks currently operate in North America providing good coverage of Canada and the United States the Mercury Deposition Network the Canadian Air and Precipitation Monitoring Network and the Atmospheric Mercury Network More recently new sites have been established in Mexico extending coverage on the continent The stations monitor atmospheric mercury and mercury in precipitation which has measured since the mid-1990s Monitoring of mercury in the air and in precipitation has been underway in Asia for nearly a decade
Alert Nord
Point Barrow
Nuuk Stoacuterhoumlfethi
Mace Head
mercury and local and regional influences Mercury concentrations at remote sites in Asia are higher than in other regions of the Northern Hemisphere Coastal cities in China have lower levels than inland sites likely due to the influence of relatively clean
Measurement Trend
Gaseous elemental mercury Decrease of 14-18 per year
Total gaseous mercury Decrease of 22 to 174 in total
Total gaseous mercury Decreasing trend at some stations increasing at others
The monitoring network of the Arctic Monitoring and Assessment Programme (AMAP) includes air and deposition monitoring sites located in Arctic regions of Canada Greenland Iceland Norway Russia and Sweden
Building on existing national and regional monitoring networks the European Union-financed project
ldquoGlobal Mercury Observation Systemrdquo (GMOS) started in November 2010 Its goal is to develop a coordinated global system for monitoring mercury including a large network of ground-based monitoring stations New sites are being installed in regions where few monitoring stations exist especially in the Southern Hemisphere Two sites have been established in Antarctica one on the Antarctic Plateau and one on the coast
Ny-Aringlesund
Amderma Pallas
Raringouml Bredkaumllen
Listvyanka Diabla Gora
Mauna Loa
Mt Bachelor
Celestuacuten Calhau
Longobucco
Iskrba Niembro Monte Cimone Cap
Ferrat Mt Waliguan Ganghwa Island
Lulin
Cape Hedo Ev-K2
Mt Changbai
Minamata Mt Ailao
Nieuw Nickerie
Kodiakanal
Maheacute Island Manaus
Bariloche Cape Point
Amsterdam Island Cape Grim
Dumont drsquoUrville
AMAP CAMnet EMEP GMOS GMOS associated NADPAIRMoN NADPMDN
Air + precipitation Air Precipitation
20
UNEP Global Mercury Assessment 2013
John Munthe
The mercury background air monitoring station at Zeppelin mountain Svalbard
air from over the ocean Sites off the Asian coast however show higher levels of gaseous elemental mercury than the Northern Hemisphere background suggesting an outflow from the Asian mainland
Weather patterns have also been found to have a strong influence on seasonal patterns in mercury levels in the air at monitoring sites At the Mount Waliguan Observatory on the Tibetan Plateau for example northeasterly and easterly winds produced the highest levels of mercury
Measurements at high altitudes Measurements from ground-based stations above 2700 meters suggest that there is an inverse relationship between gaseous elemental mercury and gaseous oxidized mercury at these elevations In other words when there is more elemental mercury there is less oxidized mercury and vice versa These measurements are in good agreement with modelling results which gives additional confidence in current understanding of the behaviour of mercury at high altitude
An inverse relationship between total gaseous mercury and particulate concentration has also been observed in the high stratosphere From the transformation rate of total gaseous mercury to particulate-bound mercury it appears that gaseous mercury lasts about two years in the stratosphere
21
UNEP Global Mercury Assessment 2013
Atmospheric concentrations and deposition 6 Measurements and trends of mercury in precipitation Mercury deposited by precipitation decreased from the 1990s into the 2000s at many but not all sites in North America and Western Europe where such measurements were taken
Regional patterns are also evident including slightly higher levels in southern Europe than northern Europe and higher levels in Asia than in North America Total mercury concentrations in precipitation in China were much higher than those in Japan and South Korea Th is was mostly attributed to higher levels of gaseous oxidized mercury and particulate-bound mercury which are readily deposited by precipitation and thus not transported far
A comparison of data from Canadian and American monitoring sites found that deposition of mercury in precipitation was highest in summer
Dry deposition of mercury which is deposition not associated with precipitation is diffi cult to measure and consequently there is little information on trends in mercury dry deposition Th is lack of information means that it is also diffi cult to validate model results for dry deposition
106 44
474 72 91
5 7 71
05 1 5 10 100 500 1000
Total mercury emission (2005) kgcell
Modelled mercury air concentrations and deposition patterns Atmospheric mercury concentrations are highest in major industrial regions Models examining global patterns show that East and South Asia Europe North America and South Africa have the highest levels of elemental mercury in the air Concentrations are generally lower in the Southern Hemisphere than the Northern Hemisphere because most industrial activity is in northern regions Th ese model results are based on simulations using the 2005 global mercury emission inventory because the 2010 inventory has only recently become available
Intercontinental transport of mercury in the air has been examined to determine its impact on regional mercury levels Four models using diff erent parameters produced consistent results Depending on the region mercury emitted by distant sources contributes between 10 and 30 of annual mercury deposition Where local sources are low mercury transported from distant emission sources can account for more than half of the deposition East Asia is the dominant source region adding 10-14 to the deposition in
Contribution from sources outside receptor region
Model 40
GEOS-Chem GLEMOS GRAHM CMAQ-Hg
30
20
10
0 Arctic Europe North East Asia South Asia
America
Receptor region
(Left ) Global distribution of anthropogenic mercury emissions in 2005 with source regions that were considered in the analysis (North America South America Europe Africa Central Asia South Asia East Asia Australia and Oceania) and (right) the contribution of anthropogenic sources outside a particular receptor region to deposition within the receptor region
22
UNEP Global Mercury Assessment 2013
Modelling atmospheric transport and deposition Global models reproduce the movement of mercury in the atmosphere during which the mercury may move between continents They have been effective in examining sources of mercury to the Arctic and also for examining the outflow of pollution from South and Southeast Asia and its impact on western North America as well as the flow from eastern North America to Europe
Regional models on the scale of a continent or a basin such as the Mediterranean can provide more detail about specific source areas even to the level of individual industrial areas Reliable results however require a detailed understanding of mercury oxidation in the atmosphere about which there is considerably uncertainty
Most atmospheric transport models consider the full chain of mercury processes in the atmosphere Some models also consider how mercury is cycled in other atmospheric compartments such as soil vegetation snow freshwater and seawater
One of the largest sources of uncertainty in mercury models is the chemical mechanism used to determine how mercury changes forms in the air Improved experimental data can help improve model performance by making sure that the correct reactions are simulated The processes that lead from deposition to re-emission also need to be understood better Advances in this area show promise with model results becoming closer to estimates based on experimental data
other regions of the world Natural emissions and re-emissions account for 35-70 of total deposition in most regions Deposition is generally greater in low and mid-latitudes due to stronger sunlight higher concentrations of oxidants and higher precipitation
Regional mercury models show patterns at the scales of continents or individual seas The Mediterranean Sea for example is a net source of mercury as it emits more than is deposited to it In that region dry deposition generally exceeds deposition of mercury in precipitation In Central and Southern Europe total gaseous mercury concentrations and deposition in precipitation were both consistently higher than the European average
Across the United States dry deposition accounts for two-thirds of total annual deposition mainly from gaseous oxidized mercury A study examining sources and deposition of mercury to assess the
benefits of proposed emission control measures found that mercury transport from outside the country accounts for 68 of mercury deposition in the Northeast and up to 91 in the west-central United States Large point sources contribute up to three-quarters of nearby deposition and power plants contributed half of the deposition in the eastern part of the country This suggests that new emissions standards would primarily benefit eastern regions of the US
In Asia studies show high seasonal variation in mercury concentration and deposition Anthropogenic emissions are responsible for about 75 of deposition in East Asia In this region there is a net removal of gaseous oxidized mercury from the atmosphere and a net export of gaseous elemental mercury
In the Arctic gaseous elemental mercury levels in the atmosphere are depleted rapidly in spring when after the long Arctic winters sunlight returns Ozone is depleted at the same time and it is believed that bromine-containing compounds are the cause of the photo-chemical reactions that deplete ozone and mercury During these events gaseous oxidized mercury and particulate-bound mercury levels increase sharply suggesting that the gaseous mercury is oxidized and deposited enhancing mercury deposition in Arctic areas in springtime Recent research however has found that 50-80 of the deposited mercury is re-emitted within a few days Similar springtime mercury depletion events have been seen in Antarctica
23
UNEP Global Mercury Assessment 2013
Anthropogenic releases to the aquatic environment 7 Global assessment Previous UNEP global mercury assessments only considered emissions to the atmosphere The 2013 Report presents the first attempt at compiling a global inventory of mercury releases to aquatic environments Releases directly into the aquatic environment present a completely different chemistry set of pathways and fate to those released to air They are also more directly linked to the risks posed by mercury to global environmental and human health Unlike mercury releases to air which are predominantly in the form of gaseous elemental mercury releases to water are predominantly inorganic mercury and to a lesser extent liquid elemental mercury
At present only some sources of aquatic releases can be quantified with any confidence Thus many sources that may be important are not included in this first assessment of global aquatic releases For example land management practices that expose new geological sources of mercury in rocks and mineral soils or that re-mobilize previously deposited mercury cannot yet be assessed Two broad categories of current anthropogenic sources are considered here point sources of mercury release to water and diffuse releases of mercury as a result of its remobilisation from areas where it was previously deposited or accumulated due to human activity (ie contaminated sites) Artisanal and small-scale gold mining (ASGM) mercury-containing pesticides and fungicides used in agriculture and deforestation are considered separately
Point source releases to water from various sectors in tonnes per year with the range of the estimate and as a percentage of total anthropogenic emissions
Sector Releases (range) tonnes
Non-ferrous metal production 925 (193 - 268)
Consumer product waste 894 (222 - 308)
Chlor-alkali production 28 (10 ndash 55)
Oil refining 06 (03 ndash 1)
Grand Total 185 (426 ndash 582)
The global estimate of mercury release to water from point sources has been derived from the atmospheric emissions assessment and the approach employed in the UNEP Toolkit to partition total mercury releases between air land and water This approach has considerable uncertainty and may omit sectors where releases to water are high but air emissions are unimportant and therefore not addressed in the inventory Global releases from point sources were estimated to be 185 tonnes per year
For diffuse sources evaluating the relative contribution of anthropogenic and natural sources to the aquatic environment requires determining considerations of the various mercury inputs For some sectors data exist that allow a preliminary assessment of the amounts of mercury re-mobilized into aquatic systems
For mercury-contaminated sites the range of average soil concentrations of mercury reported for sites where mercury was mined used or otherwise released by human activity was considered The area of contamination is then used to determine how much mercury is available in soils and when combined with a factor for how much mercury is released from those soils in a year the total release can be estimated Among identified contaminated sites mercury mining is identified as the largest sector followed by mining of precious metals Total releases to aquatic environments from contaminated sites are estimated to be 83-335 tonnes per year
Releases to water from contaminated sites in tonnes per year with the range of the estimate
Sector Releases (range) tonnes
Primary mercury mining sites 67 ndash 266
Precious metal production sites 14 ndash 55
Non-ferrous metal production sites 01 ndash 05
Chlor-alkali production sites 01 ndash 05
Other industrial sites 01 ndash 03
Grand Total 83 ndash 335
24
UNEP Global Mercury Assessment 2013
Much of the mercury released from artisanal and small-scale gold mining goes into rivers lakes soils and sediments and tailings From soils and tailings it may be re-mobilized by leaching and erosion In addition mining may disturb mercury-containing soils and sediments that may then erode more quickly releasing more mercury than would otherwise have become available from natural erosion A key factor in these processes is the local hydrological cycle of precipitation evaporation run-off and river flow To account for this in the assessment countries were designated as dry wet or intermediate to determine the relative importance of erosion The tropical and subtropical countries which have the greatest activity in this sector also tend to experience high precipitation and run-off exacerbating this source of mercury release and re-mobilization Total worldwide releases of mercury to land and water from ASGM were estimated at over 800 tonnes per year How much of this is released to water cannot yet be determined
Mercury continues to be used in pesticides and fungicides 2100 tonnes of mercury were released in the decade of the 1960s through such agrochemical uses Current data are unavailable although the use of mercury in these products has been greatly reduced
Deforestation especially in the Amazon Basin can lead to extensive soil erosion and thus the release of mercury previously accumulated in soils Using 2010 figures for deforestation rates around the world and an estimate of soil concentrations of mercury as much as 260 tonnes of mercury may have been released into rivers in 2010 as a result of deforestation worldwide
Because this is the first attempt to quantify global mercury releases to the aquatic environment there is no previous measurement against which these results can be compared Thus it is not possible at this time to evaluate trends in releases
Uncertainties in release estimates Estimating global releases of mercury to aquatic environments is being done here for the first time Many data are missing and others are imprecise A number of assumptions have been made based on what measurements are available or on other grounds to extrapolate from known quantities or to calculate aquatic releases in relation to atmospheric
or other emissions Thus the results should be treated with great caution It is nonetheless clear that anthropogenic sources and human activity contribute hundreds of tonnes of mercury to aquatic environments each year a substantial amount relative to estimated natural releases 150-960 tonnes per year from terrestrial environments
Lapshin Shutterstockcom
Phil Augustavo istockphotocom
Bureau of Land Managem
ent
Contaminated sites (top) erosion following deforestation (middle) and a flooded store of mercury-contaminated waste (lower) illustrate potential sources of mercury releases to water
25
UNEP Global Mercury Assessment 2013
Aquatic pathways transport and fate 8 Mercury in aquatic environments The pathways and fate of mercury in aquatic environments are important because it is in waters sediments and wetland soils that inorganic mercury is converted into methylmercury which is toxic and concentrates in animals The majority of human exposure to mercury and the health risk that comes with mercury exposure is from consumption of marine foods Thus this section focuses on the worldrsquos oceans Some freshwater systems however are important sources of fish for human consumption especially for subsistence and recreational fisheries often among indigenous peoples Artisanal and small-scale gold mining (ASGM) communities may also be affected through fish consumption and drinking water if those are contaminated by local releases
The major processes of mercury cycling are generally similar for all aquatic systems Inorganic mercury in dissolved or particulate form is the dominant mercury type in most marine and fresh waters Dissolved gaseous elemental mercury accounts for less than 30 of total mercury in water Methylmercury is often present at trace levels but may in some settings reach 30 of total mercury In freshwater and coastal environments inorganic mercury is transformed into methylmercury primarily in sediments In the open ocean this conversion takes place largely at intermediate depths between 200 and 1000 meters in the water column Mercury is lost from aquatic systems in two ways When inorganic mercury is reduced to elemental mercury it can be re-emitted to the atmosphere When inorganic mercury binds to particulates in water it can settle out rapidly and be buried in sediments Deep burial in ocean sediments is one of the major pathways by which mercury is removed from the biologically active environment
The global mercury cycle is chemically and physically complex Thus it is necessary to use models to study describe and predict what happens and will happen to mercury in the aquatic environment Until recently only one model existed that incorporated
air land and water into a unified whole The model has been validated against observations of mercury and represents the current scientific consensus The largest potential errors in this model in terms of the aquatic cycle concern details of the exchange of mercury between air and water
Pathways and fate of mercury in the oceans Model simulations suggest that anthropogenic impacts on mercury levels in the ocean are greatest in the surface waters the top 100 meters or so of the water column While model results vary one recent estimate suggests that anthropogenic emissions over the last 100 years have doubled the concentration of mercury in the surface layer of the ocean and increased it by 25 in intermediate waters and by 10 in deep waters The difference is due to the length of time it takes for surface waters to circulate to the depths
Models and measurements agree that direct deposition from the atmosphere is the dominant pathway by which mercury reaches the oceans The exceptions are smaller semi-enclosed basins such as the Mediterranean Sea or the Arctic Ocean where river runoff coastal erosion and ocean currents
Ugo M
ontaldo Shutterstockcom
26
UNEP Global Mercury Assessment 2013
account for about half of mercury inputs The most recent modelling effort suggests that total deposition input of mercury to the oceans in 2008 was 3700 tonnes
Other mercury pathways appear less important on a global basis Rivers are estimated to carry more than 2800 tonnes of mercury each year but only about 380 tonnes of this is transported offshore The rest is trapped by particles in estuaries Groundwater and re-mobilization from sediments provide 100shy800 tonnes of mercury to the oceans each year Undersea hydrothermal vents add less than 600 tonnes of mercury to the oceans There are high concentrations of mercury in vent fluids but a great deal of the mercury is precipitated as solids once the vent fluids enter seawater
Models suggest that globally about 70 of the mercury deposited into the ocean is re-emitted to the atmosphere Oxidized mercury in surface waters is reduced by biological and photochemical processes to the elemental form that is volatile and readily re-emitted The removal of this mercury ultimately reduces the pool of mercury that could be converted to methylmercury and be accumulated by marine organisms The re-emission process thus simultaneously prolongs the lifetime of mercury cycling through the atmosphere and upper ocean and acts to reduce mercury availability for marine food webs
Any changes in the efficiency of mercury reduction in surface waters or the rate of re-emission is likely to impact mercury concentrations in surface waters and the air One example is the effect of sea ice in the Arctic Ocean which blocks the re-emission
Tony Magdaraog Shutterstockcom
Mercury accumulated in marine food-webs can enter the human diet
of elemental mercury leaving elevated levels in waters under ice Changes in primary productivity could change the rate at which mercury is bound to particles thus affecting re-emission to the atmosphere as well as rates of downward transport in the ocean Changes in oxidant levels in the atmosphere such as ozone and bromine may also influence the rate of oxidation of gaseous elemental mercury and thus deposition rates to the ocean
Methylmercury in the ocean Natural bacterial processes in seawater and in sediments in coastal environments convert inorganic mercury to methylmercury Methylmercury levels are highest in the subsurface waters of many oceans because it is formed at these intermediate depths likely as a result of the decomposition of organic material falling from surface waters Current understanding indicates that about 300 tonnes of methylmercury is produced in the upper ocean by this and related processes By contrast only about 80 tonnes of methylmercury reaches the ocean from other sources such as atmospheric deposition rivers and diffusion from sediments
Current modelling indicates that methylmercury stays in the upper ocean for about 11 years Deshymethylation by photochemical reaction or by microbial activity is the major removal process for methylmercury in the ocean About 240 tonnes of methylmercury is removed by this process from the surface waters of the ocean per year
The other important pathway for methylmercury in seawater is uptake into marine food webs Although only about 40 tonnes per year is taken up in this way it is this fraction that poses risks to marine animals and human consumers of seafood Methylmercury is a problem for several reasons First it is taken up by plankton much more efficiently than is inorganic mercury resulting in concentrations in plankton that are as high as 10000 times the concentration in seawater Second methylmercury is absorbed through the intestine of animals much more easily than is inorganic mercury Third methylmercury biomagnifies as it moves up the food web Thus methylmercury becomes an increasingly greater proportion of the mercury in organisms higher in the food web This explains why some indigenous populations that consume top marine predators such as fish seals and whales have some of the worldrsquos highest concentrations of methylmercury giving rise to health concerns
27
UNEP Global Mercury Assessment 2013
Pathways and fate of mercury in freshwater Observations and modelling both show that there are in general many similarities between mercury chemistry pathways and fate in lakes and in the oceans but with obvious differences in scale and in the relative importance of different processes Modelling of mercury dynamics was done for four lakes with a history of direct mercury inputs from the largest freshwater lake in the world (Lake Superior) to small lakes in Ontario Canada Atmospheric deposition and river inflow were the main sources of inorganic mercury Much of the mercury input from lake and river catchments was associated with dissolved and particulate organic matter The dominant mercury removal mechanisms as in saltwater were burial in sediments and photochemical reduction of oxidized mercury to elemental mercury followed by re-emission to the air In Lake Superior and Lake Michigan there is evidence for methylation of mercury in the water column as is seen in the open ocean
Methylmercury levels in freshwater fish vary with the level of deposition of mercury from the air though other factors such as inputs from the watershed and the number of trophic levels within the lakersquos food web are also important Methylation predominantly occurred in lake sediments and wetlands and floodplain soils where sulphateshyreducing bacteria are believed to be primarily responsible Methylmercury is de-methylated in sediments and also taken away in the outlet river from each lake
Some 400-1400 tonnes of mercury are estimated globally to be trapped behind dams and other man-made impoundments each year This has in many cases led to significant increases in total mercury and methylmercury levels in water and of methylmercury in fish and other aquatic species When artificial lakes are created plant material is submerged leading to decay and anoxia In these conditions microbially driven methylation of inorganic mercury takes place In some cases the elevated mercury levels have also been observed downstream from the artificial lakes and reservoirs
Anthropogenic impacts on aquatic mercury levels Two studies have reported that the Atlantic and Pacific Oceans have shown opposing trends over recent decades While the influence of changing ocean currents and other oceanographic factors may be a factor the trends do make sense in light of patterns of anthropogenic emissions In the North Pacific Ocean mercury concentrations appear to have increased at depths between 200 and 1000 meters over the last few decades This increase coincides with the rapid industrialization of East Asia
In the North Atlantic however results from near Bermuda suggest a substantial decrease in mercury concentration and a change in the mercury profile through the water column The Mediterranean Sea too showed a decrease in mercury concentration between 1990 and 2004 These findings are consistent with atmospheric data from around the North Atlantic The conclusion is that mercury levels in seawater in the North Atlantic were elevated by human activity but may now be declining likely as a result of decreased emissions from North America and Europe
A complementary approach to measuring mercury in seawater is to measure mercury in aquatic animals which accumulate and integrate mercury over time Teeth hair feathers and eggshells are useful long-term archives of mercury concentrations and can provide data from the pre-industrial period (ie before 1800) as well as more recent periods
Among marine animals samples are available from several regions particularly from the Arctic where cold dry conditions help preserve animal tissues Mercury concentrations between the 13th and 16th
centuries were relatively stable From the mid- to late 19th century to the end of the 20th century mercury levels increased by an average of 12 times On average therefore about 92 of the mercury in Arctic marine wildlife today is likely to be of anthropogenic origin
Similar findings were found for a 700-year sequence of seabird eggshells from the South China Sea Mercury levels increased steadily between 1800 and 2000 with a particularly rapid increase after 1970 Concentrations since 2000 are about 10 times higher than pre-industrial levels with 91 of the mercury now likely to be of anthropogenic origin In the Antarctic studies of seal hairs show that pre-industrial mercury levels were only 60 of recent levels The relatively small difference
28
UNEP Global Mercury Assessment 2013
Historical Hg concentration as a proportion of present-day 100
80
60
40
20
0
Beluga teeth Human teeth
Gyrfalcon feathers Perigrine falcon feathers
Polar bear hair Ringed seal teeth
1200 1300 1400 1500 1600 1700 1800 1900 2000
between pre-industrial and modern mercury levels in Antarctic is consistent with lower mercury emissions and atmospheric concentrations in the Southern Hemisphere as compared with the Northern Hemisphere
The timing of long-term increases of mercury in aquatic animals can shed light on the likely sources of mercury emissions that were responsible The industrialization of Europe and North America appear responsible for the large increases in marine mercury levels that began in the 19th century as these increases occurred prior to recent Asian industrialization As with water concentrations in the Pacific Ocean recent rapid increases in mercury in seabird eggs in the South China Sea coincide with industrialization in Asia
The time lag in aquatic ecosystem response One important conclusion from air-ocean modeling is that the oceans have not yet reached equilibrium with current atmospheric levels of mercury This lag is due to several factors First mercury stays in the upper ocean above 200 meters depth for about 30 years and for centuries in intermediate and deep waters This is much longer than the one year residence time in the lower atmosphere Thus removal from the ocean takes much longer than does removal from the air and so concentrations will change more slowly
Second because of the long lifetime of mercury in deeper ocean waters a great deal of natural mercury is present in the ocean already about 100000 tonnes out of a total of 135000 tonnes in intermediate waters and 200000 out of 220000 tonnes in deep waters
Rune Dietz
Analysis of museum samples reflects the increase in mercury emissions and releases since the mid-19th century associated with anthropogenic activities
Third vertical transport of mercury from intermediate depths back to the surface returns a substantial amount of mercury to the biologically active zone each year As a result average mercury concentrations in seawater and marine animals are likely to increase slowly for decades if not centuries even if atmospheric levels stabilize at present levels In short the effects of historical anthropogenic emissions from Europe and North America are still being observed in the oceans at the same time that the effects of the recent rise in emissions from Asia are being seen
Regionally different trends can be expected depending on distance from sources and ocean circulation patterns In the North Atlantic north of 55deg N it will take 50-600 years to achieve equilibrium between atmospheric and seawater mercury levels In the North Pacific this process is estimated to take 500-700 years and in the Antarctic 700-1000 years The Arctic Ocean by contrast is smaller and will only take about 35 years to reflect changes in atmospheric mercury levels Surface waters of the Mediterranean Sea should show also changes within 10-50 years
Time lags in the responses of many freshwaters and their food-webs to changes in atmospheric mercury levels are also expected Although some immediate recovery following reductions in atmospheric mercury deposition rates is likely full recovery may take decades centuries or longer depending on the characteristics of the area Highly polluted freshwaters with catchments and sediments containing large amounts of anthropogenic mercury will recover most slowly as is already observed around point sources such as smelters that have closed down
29
UNEP Global Mercury Assessment 2013
Major gaps in knowledge 9 Large uncertainties remain in global estimates of mercury emissions to the air These stem from various sources including the availability of information on activity levels but mainly from the lack of information concerning the mercury content of some raw materials and the validity of assumptions regarding processes and technologies employed to reduce mercury emissions including their rates of application and effectiveness The accuracy and precision of measurement-based estimates can depend on the validity of extrapolating measurements made at infrequent intervals to longer periods or measurements made at one plant to other facilities with similar operations
Potentially important emissions sectors that are still not quantified in the emissions inventory include the use of mercury in vinyl-chloride monomer production secondary metals production oil and gas extraction transport and processing industrial and hazardous waste incineration and disposal sewage sludge incineration and dental fillings preparation and removal
Current measurements and their evaluation are inadequate for determining spatial and temporal trends Improved more extensive and better coordinated measurements are needed A permanent global integrated monitoring network for atmospheric mercury and mercury deposition is needed to achieve this goal The atmospheric network sites should be closely integrated with water soil and biological monitoring networks The results can be used for model testing and evaluation as well as for more accurately detailing the geographic impact of anthropogenic emissions Monitoring of mercury concentrations in the important marine food species is essential to understanding possible human health impacts and the effects of future emissions changes
Better data on mercury distribution in the troposphere is needed to improve understanding of long-range transport and source-receptor relationships Coordinated studies at high altitudes and by aircraft are needed This information will
also help validate regional and global scale models improving their prediction capabilities with regard to different policy scenarios
Key processes related to global transport and cycling of mercury remain inadequately understood The chemical form of gaseous oxidized mercury is unknown Reduction and oxidation rates for mercury in the presence of atmospheric oxidants need further study including determining which oxidants are important New measurements and modelling studies are needed to examine key chemical and physical processes that affect global transport and cycling
Few data are available for reporting mercury releases to aquatic systems Systematic and consistent monitoring of mercury releases to the air is required especially for contaminated systems Releases of mercury from soils into waters depend greatly on climate and topography and these parameters need to be better accounted for Consistent approaches for measuring and reporting releases from point sources are needed to ensure comparability of data from around the world In particular the actual role of artisanal and small-scale gold mining (ASGM) in emissions to air and releases to water needs to be more accurately estimated
The link between mercury deposition methylation and uptake by living organisms needs further study The parameters that determine the rates of exchange of mercury compounds between air and sea air and soil and air and vegetation are not fully understood Whole-ecosystem studies of mercury are needed to better understand biogeochemical cycling Methylationdemethylation rates and their spatial and temporal variations and relationship to climatic factors need to be determined in most of worldrsquos major ocean basins as well as in representative freshwaters
30
UNEP Global Mercury Assessment 2013
Key findings of the 2013 assessment 10 Atmosphere Total anthropogenic emissions of mercury to the atmosphere in 2010 are estimated at 1960 (1010shy4070) tonnes which is about 30 of the total mercury that was emitted and re-emitted from anthropogenic and natural sources in that year The largest anthropogenic sources are associated with artisanal and small-scale gold mining (ASGM) and coal burning which together account for about 62 of the annual total anthropogenic emissions to air Other major sectors include ferrous and non-ferrous metal production and cement production
East and Southeast Asia are responsible for about 40 of global anthropogenic emissions About 75 of the mercury from this region comes from China which is about one-third of the global total Increased estimates for emissions from ASGM largely a result of newly obtained data and improved information mean that South America and Sub-Saharan Africa are also responsible for a greater proportion of global emissions than was previously assumed
Anthropogenic emissions over time have increased mercury loads present in the environment This leads to higher rates of re-emission and also means that there will be a time lag of years or decades between emissions reductions and lower mercury levels in the food web including pathways of human exposure
Mercury emissions to the atmosphere likely peaked in the 1950s to 1970s and subsequently declined because of reductions in Europe Russia and North America Emission trends are unclear due to changes in methods employed to produce inventories and differences in the sectors that have been accounted at different times There are however some indications that emissions may be rising again with increases from East Asia offsetting continuing reductions in Europe and North America
Aquatic environments Natural processes in aquatic systems convert less toxic elemental and inorganic mercury into much more toxic methylmercury Methylmercury concentrates and accumulates in the food web leading to high concentrations in some species of seafood and fish that many people eat
Anthropogenic releases of mercury to aquatic environments contribute hundreds of tonnes to the amount of mercury cycling in the environment Diffuse releases and point sources appear equally important Atmospheric deposition however remains the most important input of mercury to land and oceans and has increased the amount of mercury in many environmental compartments by a factor of two or three since the start of the industrial age On land mercury that is deposited is largely retained in soils and vegetation increasing the available pool for re-mobilisation to adjacent aquatic systems Re-emission from soils however is a major addition to atmospheric mercury
Hydrology is the most important factor in the transport of mercury from catchments to downstream environments Relatively little of this mercury reaches the open ocean as most is captured in sediments behind dams in estuaries and near the coast Changes in land cover and land use can have a large effect on mercury mobilisation as exposed soils erode and mercury leaches into the water table
Concentrations of mercury in Arctic marine animals today are about 10-12 times higher than in preshyindustrial times (ie prior to about 1800) This means that on average about 92 of the mercury in marine predators such as seabirds seals and whales is anthropogenic in origin The timing of the increase suggest that 19th and early 20th century emissions from Europe North America and Russia were responsible Increases mercury concentrations in seabirds in the South China Sea appear to be more recent than the Arctic increases coinciding with increasing industrialisation in East and Southeast Asia
31
UNEP Global Mercury Assessment 2013
K+S Entsorgung Gm
bH
Recovered mercury is being stockpiled at long-term storage sites above- and as shown here below ground
The upper 100 meters of the oceans have twice the mercury that they did a century ago Intermediate and deeper waters have 10-25 more mercury on average reflecting the slow transport of mercury downwards in the oceans Seawater concentrations will thus be especially slow in responding to changes in mercury inputs from atmospheric deposition and river flow As a result mercury concentrations in marine biota are likely to increase slowly for decades to centuries even without an increase in atmospheric emissions
In freshwater ecosystems atmospheric deposition and re-mobilisation from soils slow the reduction of mercury levels even in regions where atmospheric concentrations have decreased due to emission controls
Further increases in atmospheric emissions will have long-term consequences for commercial fisheries and all consumers of marine and freshwater foods
It is likely to be years or decades before reductions in anthropogenic emissions and releases of mercury have a demonstrable effect on mercury levels throughout the environment and in the fish and marine mammals which are part of the human food-chain This only reinforces the need to act now to continue and strengthen international efforts to reduce current mercury emissions and releases Delays in action now will inevitably lead to slower recovery of the worldrsquos ecosystems in future from mercury contamination leaving an even greater legacy of pollution for future generations
32
Division of Technology Industry and Economics (DTIE) Chemicals Branch Geneva Switzerland January 2013
Job number DTI1636GE

UNEP Global Mercury Assessment 2013
UNEP Global Mercury Assessment 2013
Executive Summary
Mercury is a global threat to human and environmental health This report focusing on anthropogenic emissions of mercury and their transport and transformation in the environment is a contribution to international efforts to reduce mercury pollution
This summary report and the accompanying Technical Background Report for the Global Mercury Assessment 2013 are developed in response to Decision 255 paragraph 36 of the Governing Council of the United Nations Environment Programme (UNEP) that
Requests the Executive Director in consultation with Governments to update the 2008 report entitled
ldquoGlobal Atmospheric Mercury Assessment Sources Emissions and Transportrdquo for consideration by the Governing CouncilGlobal Ministerial Environment Forum at its twenty-seventh session
The report provides the most recent information available on worldwide atmospheric mercury emissions releases to the aquatic environment and the transport and fate of mercury in the global environment The report emphasizes emissions to air from human (anthropogenic) activities but includes releases to water because the aquatic environment is the main route of exposure to humans and wildlife It is in aquatic systems that the inorganic mercury is transformed into the more toxic form methylmercury which can accumulate in fish and marine mammals consumed by humans
This Executive Summary presents an overview of the key findings of the Global Mercury Assessment 2013
Total anthropogenic emissions of mercury to the atmosphere in 2010 are estimated at 1960 tonnes2
The 2010 emissions inventory has several improvements over the previous inventory for 2005 including
bull A more detailed analysis of emissions from some major source sectors
1 tonne = 1000 kilograms
bull A more detailed consideration of the mercury content of fuels and raw materials used in different countriesregions bull New and updated information on artisanal and
small-scale gold mining bull The use of different pollution control technologies
in different countries and regions have been factored into the emissions estimates bull Emission estimates for sectors not previously
included such as aluminium production oil refining and contaminated sites bull More and better information on location of major
point sources such as individual power plants smelters and cement kilns bull Better documentation and greater transparency
with respect to the data and information behind the estimates
Using this approach the global emissions to air from anthropogenic sources is estimated as 1960 tonnes in 2010 Despite recent progress in improving the available knowledge base the emissions estimate still has large associated uncertainties giving a range of 1010-4070 tonnes The work also identifies potentially important sectors that are not yet quantified including use of mercury in vinyl-chloride monomer production secondary metals production and ferro-alloys oil and gas extraction and transport and industrial and some hazardous waste incineration
Present day anthropogenic emissions contribute to both current and future emissions to the air
Current anthropogenic sources are responsible for about 30 of annual emissions of mercury to air Another 10 comes from natural geological sources and the rest (60) is from lsquore-emissionsrsquo of previously released mercury that has built up over decades and centuries in surface soils and oceans Although the original source of this re-emitted mercury cannot be determined with certainty the fact that anthropogenic emissions have been larger than natural emissions since the start of the industrial age about 200 years
2
i
UNEP Global Mercury Assessment 2013
ago implies that most re-emitted mercury was originally from anthropogenic sources Reducing current anthropogenic sources is therefore vital to reduce the amount of mercury that is cycling in the environment
Artisanal and small-scale gold mining and coal burning are the major sources of anthropogenic mercury emissions to air
The inventory confirms the role of artisanal and small-scale gold mining (ASGM) and coal burning as the largest components of anthropogenic emissions followed by the production of ferrous and non-ferrous metals and cement production
Annual emissions from ASGM are estimated at 727 tonnes making this the largest sector accounting for more than 35 of total anthropogenic emissions This is more than twice the figure from this sector in 2005 however most of the increase is attributed to some new and better information For example West Africa was thought in 2005 to have minimal ASGM activity but is now recognized as an important source region It is thus difficult to determine whether actual emissions from this sector have changed because their estimation involves a great deal of uncertainty Much of the activity is unregulated or even illegal and thus reliable official data are still hard to obtain More work is needed to confirm the emissions estimates from this sector including field measurements around ASGM sites to better establish the amounts and fate of the mercury used
A large amount of coal is burned around the world to generate electricity to run industrial plants and for in-home heating and cooking Coal burning emitted some 475 tonnes of mercury in 2010 the majority of which is from power generation and industrial use The estimate of emissions from other coal burning (including domestic and residential burning) is lower than that reported in the previous global assessment due to differences in estimates of the amounts and mercury content of coal burned in these uses Use of coal for power generation and industry is increasing especially in Asia However wider use of air pollution controls and more stringent regulations in several countries together with improved combustion efficiency have reduced emissions from coal-burning power plants helping to offset most of the increase arising from higher coal consumption
Global anthropogenic mercury emissions from industrial sources may be rising
Emissions to air are thought to have peaked in the 1970s declined over the following two decades and have been relatively stable between 1990 and 2005 There were some indications of slight increases in emissions between 2000 and 2005
Any evaluation of trends needs to take into account changes in reporting and methods used to produce inventory estimates including the introduction of additional sectors Thus a direct comparison of the results of global inventories produced over the past 25 years is not possible A preliminary reshycalculation using the improved methodology of global anthropogenic emissions in 2005 indicates that emissions from fossil fuel combustion metal and cement production increased between 2005 and 2010 but continue to decline in other sectors such as the chlor-alkali industry Overall indications are that emissions from industrial sectors have increased again since 2005
Future emission trends have been examined using scenarios and models Without improved pollution controls or other actions to reduce mercury emissions mercury emissions are likely to be substantially higher in 2050 than they are today
Comparing emissions estimates reported under different reporting systems is not straightforward
The 2010 global inventory results were generally consistent with nationally reported emissions estimates for 2010 providing a degree of confidence in the methods used However comparing estimates for individual countries and sectors is complicated by differences in reporting methods in particular the specification and categorisation of sectors used in different national and international reporting systems National emissions estimates based on individual facility reporting and site measurements should be more accurate than those based on the global inventory methodology However this is difficult to evaluate as most nationally reported inventories lack estimation of associated uncertainties It is also important to recognize that many measurement-based estimates are based on relatively few measurements covering short periods that are then extrapolated to produce annual emissions It is important that all reporting is subject to validation and that associated uncertainties are quantified If different reporting systems are to be compared they need to be better aligned in terms of the emission sources that are identified and used
ii
UNEP Global Mercury Assessment 2013
Asia contributes almost half of global anthropogenic mercury emissions
Increasing industrialization has made Asia the main source region of mercury emissions to air with East and Southeast Asia accounting for about 40 of the global total and South Asia for a further 8 The new data on ASGM and the related increase in emission estimates from this sector have increased South America and sub-Saharan Africarsquos share of global emissions However modelling results continue to indicate that East Asia is the dominant source region for long-range airborne mercury transport worldwide
Anthropogenic releases of mercury to water total 1000 tonnes at a minimum
Previous UNEP global mercury assessments considered only atmospheric emissions The 2013 report is thus the first attempt to compile a global inventory of aquatic releases Three types of sources were considered Point sources are industrial sites such as power plants or factories and they release an estimated 185 tonnes of mercury per year Contaminated sites including old mines landfills and waste disposal locations release 8 - 33 tonnes per year Artisanal and small-scale gold mining was evaluated separately with total releases to water and land totalling more than 800 tonnes per year Deforestation mobilizes another 260 tonnes of mercury into rivers and lakes Other sources remain to be quantified and so these estimates comprise only a partial total Thus anthropogenic releases to waters are likely to be at least 1000 tonnes per year
Mercury concentrations in the oceans and in marine animals have risen due to anthropogenic emissions
Anthropogenic emissions and releases have doubled the amount of mercury in the top 100 meters of the worldrsquos oceans in the last 100 years Concentrations in deeper waters have increased by only 10-25 because of the slow transfer of mercury from surface waters into the deep oceans In some species of Arctic marine animals mercury content has increased by 12 times on average since the pre-industrial period This increase implies that on average over 90 of the mercury in these marine animals today comes from anthropogenic sources The timing of the initial stage of the increase which started in the mid-19th century and accelerated in the early 20th century before the rise of Asian industrialization indicates emissions from Europe Russia and North America were probably responsible Studies from the South China
Sea suggest a similar pattern occurring there more recently likely as a result of Asian industrialization
Monitoring capability continues to improve but whether this can be sustained is uncertain
Existing mercury monitoring networks such as the European Monitoring and Evaluation Programme (EMEP) the Arctic Monitoring and Assessment Programme (AMAP) the North American Mercury Deposition Network (NAMDN) and others in the northern hemisphere have been complemented by new monitoring sites in the southern hemisphere in particular some sites established under the Global Mercury Observing System (GMOS) initiative The longer-term status of many of the newly established sites however depends on availability of sustained funding to continue operations
Anthropogenic emissions and releases over time have increased mercury loads in the environment so the effects of reductions in emissions will often take time to become apparent
Large amounts of mainly inorganic mercury have accumulated in the environment in particular in surface soils and in the oceans as a result of past emissions and releases Owing to their larger volumes intermediate and deep ocean waters below 100 metres actually store much larger tonnages of anthropogenic mercury than surface waters There are also relatively large tonnages of natural mercury circulating in the intermediate and deep waters A significant fraction of the mercury in intermediate waters is recycled back to the surface each year by upwellings Todayrsquos anthropogenic emissions continue to load the oceans and the catchments and sediments of lakes and rivers with inorganic mercury This mercury which is the ldquofeed-stockrdquo for toxic methylmercury production is stored and reshycycled in the bioavailable part of the environment for decades or centuries before it eventually is removed by natural processes One consequence is that there will likely be a time-lag of years or decades depending on the part of the water column before emissions reductions begin to have a demonstrable effect on mercury levels throughout the environment and in the fish and marine mammals which are part of the human food-chain At the same time mercury levels in parts of the Atlantic Ocean are decreasing likely due to reduced emissions in past decades in North America and Europe indicating that emissions reductions can eventually lead to decreases in mercury levels in surface oceans This reinforces the need to continue and strengthen
iii
UNEP Global Mercury Assessment 2013
international efforts to reduce current mercury emissions and releases as delays in action now will inevitably lead to slower recovery of the worldrsquos ecosystems in future from mercury contamination
Global climate change may also complicate the response of global ecosystems to mercury emission reductions through its profound effects on many aspects of the movement and chemical transformations of mercury in the environment For example warmer temperatures may increase rates of organic productivity in freshwater and marine ecosystems and rates of bacterial activity possibly leading to faster conversion of inorganic mercury to methylmercury Thawing of the enormous areas of northern frozen peatlands may release globally-significant amounts of long-stored mercury and organic matter into Arctic lakes rivers and ocean
iv
UNEP Global Mercury Assessment 2013
Introduction
Background and mandate Global inventories for mercury emissions to air from human sources have been produced at approximately 5-year intervals since 1990 by scientific groups UNEP produced its first Global Mercury Assessment in 2002 In 2007 the Governing Council of UNEP through its decision 243 requested the Executive Director of UNEP
to prepare a report drawing on among other things ongoing work in other forums addressing
(a) Best available data on mercury atmospheric emissions and trends including where possible an analysis by country region and sector including a consideration of factors driving such trends and applicable regulatory mechanisms
(b) Current results from modelling on a global scale and from other information sources on the contribution of regional emissions to deposition which may result in adverse effects and the potential benefits from reducing such emissions taking into account the efforts of the Fate and Transport partnership established under the United Nations Environment Programme mercury programme
The results of this request were presented as a summary report entitled ldquoThe Global Atmospheric Mercury Assessment Sources Emissions and Transportrdquo released in December 2008 and an accompanying ldquoTechnical Background Report to the Global Atmospheric Mercury Assessmentrdquo
The technical background report which formed the basis for statements made in the summary report and was prepared in cooperation with the Arctic Monitoring and Assessment Programme (AMAP) Secretariat included an updated inventory of anthropogenic emissions of mercury to the atmosphere The inventory was based on national emissions data for the year 2005 submitted by governments as well as estimates prepared for countries that did not provide data and was coordinated with work related to mercury under the UN Economic Commission for Europe Convention
1
UNEPrsquos 2008 Global Atmospheric Mercury Assessment Report
on Long-range Transboundary Air Pollution (LRTAP) The report also drew on the work of the UNEP Global Mercury Partnership in particular the Mercury Air Transport and Fate Research partnership area
In 2009 the Governing Council of UNEP through its Decision 255 paragraph 36 requested the Executive Director of UNEP
hellip in consultation with Governments to update the 2008 report entitled Global Atmospheric Mercury Assessment Sources Emissions and Transport for consideration by the Governing CouncilGlobal Ministerial Environment Forum at its twenty-seventh session
This updated Global Mercury Assessment 2013 and its accompanying and updated Technical Background Report are the response to that Governing Council request
Developing the 2013 Report As in 2008 the Technical Background Report for the Global Mercury Assessment 2013 forms the basis for the statements made in the Summary
1
UNEP Global Mercury Assessment 2013
Report and is fully referenced according to standard scientific practice As such it is the single reference for the Summary Report It has again been prepared in co-operation with the Arctic Monitoring and Assessment Programme (AMAP) and uses national data and information submitted by several governments Contributions have also been incorporated from the UNEP Global Mercury Partnership in particular its partnership areas on mercury control from coal combustion reducing mercury in artisanal and small-scale gold mining (ASGM) and mercury air transport and fate AMAP mercury expert group UN Economic Commission for Europe (UN ECE) Long-range Transboundary Air Pollution (LRTAP) Convention groups industry and non-governmental organizations Each section was prepared by a team of experts and then reviewed to ensure its scientific accuracy The evaluation of information of mercury released into the aquatic environment benefits from contributions from the Group of Experts on Scientific Aspects of Marine Environmental Protection (GESAMP)
Scope and coverage This update to the Global Mercury Assessment provides the most recent information available for the worldwide emissions releases and transport of mercury in atmospheric and aquatic environments To the extent possible the information comes from the published scientific literature supplemented where necessary by other sources Since the Global Mercury Assessment is intended as a basis for decision making emphasis is given to anthropogenic emissions (mercury going into the atmosphere) and releases (mercury going into water and land) that is those associated with human activities
The Technical Background Report includes a detailed inventory of global mercury emissions to air based on data for 2010 ldquoInventoryrdquo in this context means a compilation of the estimated emissions and releases from various sectors and sources While it attempts to catalogue all major sources of mercury emissions worldwide it should not be regarded as complete and exhaustive
In addition for the first time this Global Mercury Assessment includes an evaluation of information of mercury released into the aquatic environment and its associated pathways and fate The information available for this evaluation is less complete than
that for emissions to air and is based on data from recent years The inclusion of this new element of the Global Mercury Assessment is as a response to the requests from many governments in the Intergovernmental Negotiating Committee (INC) for more information on releases to land and water The aquatic environment is the main route of exposure to humans and wildlife because it is in water that inorganic mercury is transformed into highly toxic methylmercury
The Technical Background Report includes chapters on
bull Global Emissions of Mercury to the Atmosphere describing sources anthropogenic emissions and trends in emissions bull Atmospheric Pathways Transport and Fate
examining pathways levels and trends in air and deposition and modelling of pathways and deposition bull Global Releases of Mercury to Aquatic Environments
containing global estimates of releases to water and bull Aquatic Pathways Transport and Fate examining
mercury pathways in aquatic systems that result in important routes of human exposure
Technical Background Report chapters were prepared by teams of experts and then reviewed to ensure their scientific validity This Summary Report is based on the content of the Technical Background Report and has been reviewed by the authors of the Technical Background Report It was also circulated for national review
This Summary Report provides in Chapter 2 an overview of natural and anthropogenic sources of mercury outlining the main sectors involved The global inventory of anthropogenic emissions to air is presented in Chapter 3 and Chapter 4 describes trends in mercury emissions to the atmosphere What happens after mercury is released to the atmosphere is covered in Chapter 5 on atmospheric chemistry monitoring and deposition and Chapter 6 on atmospheric concentrations and deposition Chapter 7 provides a first attempt to estimate global releases to water followed in Chapter 8 by a discussion of aquatic pathways transformations and fate A review of gaps in knowledge is given in Chapter 9 Chapter 10 summarizes key findings
2
UNEP Global Mercury Assessment 2013
Whatrsquos new in the Global Mercury Assessment 2013 Global mercury emissions inventories continue to improve as new data and better data become available concerning some sources The method for compiling the inventory of anthropogenic emissions to the atmosphere has also been revised and improved Differences in air pollution control technologies and differences in the mercury content of raw materials and fuels in different countries and regions have been factored into emissions calculations to better reflect actual conditions in each country
In the Global Mercury Assessment 2013 a new updated inventory based on data from 2010 is presented in which some new sources (including emissions from combustion of natural gas and primary aluminium production and emissions associated with oil refining) have been quantified for the first time A more detailed analysis has also been made of some of the major mercury emission sectors including the break-down of emissions from coal burning in power plants industrial and other uses In addition new information acquired through the UNEP Global Mercury Partnership area on Reducing Mercury in Artisanal and Small-scale Gold Mining in particular from the Artisanal Gold Council has resulted in a significant re-evaluation of emissions from the ASGM sector
New observational data and new modelling results provide fresh insight into atmospheric mercury transport and fate
Kevin Telmer
One of the objectives of the updated assessment has been to provide transparent documentation and comprehensive compilations of the data that form the basis for all of the estimates presented This approach will allow a more consistent and replicable method for compiling the global mercury emission inventory so that valid comparisons can be made in the future In addition a wider range of experts from around the world have been involved in preparing the Technical Background Report on which this summary is based
The inclusion of an assessment of releases of mercury to the aquatic environment and its subsequent pathways and fate is a further significant development as these topics were not addressed in the 2008 UNEP Global Atmospheric Mercury Assessment The aquatic environment is critical for three reasons
bull Hundreds of tonnes of mercury is released directly into water so an inventory limited to mercury emissions to air provides an incomplete assessment of anthropogenic impacts on the mercury cycle
bull Mercury in aquatic environments can be transformed into methylmercury which is far more toxic to humans and animals and can enter and biomagnify in food webs more readily than other forms of mercury bull Much human exposure to mercury is through
the consumption of fish and other marine foods making aquatic pathways the critical link to human health
A large open artisanal and small-scale gold mining pit
3
UNEP Global Mercury Assessment 2013
Sources of mercury emissions to air and releases to water 2 Mercury is a naturally occurring element and is found throughout the world There are thus many natural sources of mercury creating background environmental levels that have been present since long before humans appeared
Mercury is contained in many minerals including cinnabar an ore mined to produce mercury Much of the present day demand for mercury is met by supply from mercury recovered from industrial sources and stockpiles rather than from mercury mining Mercury is also present as an impurity in many other economically valuable minerals in particular the non-ferrous metals and in fossil fuels coal in particular
Human activity especially mining and the burning of coal has increased the mobilization of mercury into the environment raising the amounts in the atmosphere soils fresh waters and oceans The majority of these human emissions and releases of mercury have occurred since 1800 associated with the industrial revolution based on coal burning base-metal ore smelting and gold rushes in various parts of the world To some extent the same drivers of mercury emissions and releases are continuing with fossil-fuel-based energy generation powering industrial and economic growth in Asia and South America which in turn helps drive high demand for metals including gold spurring artisanal and small-scale gold mining (ASGM) around the world
In preparing inventories of mercury emissions and releases it is important to distinguish various categories of sources Three main types of emissions and releases can be distinguished each of which is briefly introduced here in qualitative terms with particular emphasis on anthropogenic sources
Natural sources of mercury emissions and releases Mercury in the earthrsquos crust can be emitted and released in several ways to air water and land Natural weathering of mercury-containing rocks
farbled Shutterstockcom
Cinnabar the principal ore of mercury
Year 2000
1950
1900
1850
1800
1750
1700
Mt St Helens (1980)
Industrial period
WWII manufacturing
Krakalau (1883)
Gold rush (circa 1850-84)
Tambora (1815)
Pre-industrial period
1998 core 1991 core Natural background Natural events (volcanic eruptions) Localregional anthropogenic sources Global anthropogenic (industrialization)
0 5 10 15 20 25 30 35 40 Total mercury ngL
Ice core record of deposition from Wyoming USA The elevated levels associated with the 1850-84 US gold rush probably reflect localregional sources rather than a global signature Increasing environmental levels of mercury associated with industrialization however are found in environmental archives like this ice core around the globe
4
UNEP Global Mercury Assessment 2013
Global mercury cycling Mercury is released to the environment from natural sources and processes and as a result of human activities Once it has entered the environment mercury cycles between air land and water until it is eventually removed from the system through burial in deep ocean sediments or lake sediments and
through entrapment in stable mineral compounds Methylmercury the most toxic and bioaccumulative form of mercury which presents the greatest health risk to humans and wildlife is mainly formed in aquatic environments through natural microbial processes
80shy600
3700
2000shy2950
2000 300shy600
1700shy2800
3200
380
lt600
Geogenic Anthropogenic
Anthropogenic Biomass burning
Soil and vegetation
Deposition to oceans
Rivers
Deposition to land
freshwater
Geogenic
Oceans
Anthropogenic
Natural
Re-emissions Re-mobilization
Units tonnes
1 tonne = 1000 kilograms
Global mercury budgets based on models illustrate the main environmental compartments and pathways that are of importance in the global mercury cycle and the ways in which natural and anthropogenic releases to air land and water move between these compartments Emissions to air arise from natural sources and anthropogenic sources as well as re-emissions of mercury previously deposited from air onto soils surface waters and vegetation
is continuous and ubiquitous allowing mercury to escape to air and to be washed into lakes and rivers Volcanoes emit and release mercury when they erupt Geothermal activity can also take mercury from underground and emit it to the atmosphere and release it to the deep oceans Some recent models of the flow of mercury through the environment suggest that natural sources account for about 10 of the estimated 5500-8900 tonnes of mercury currently being emitted and re-emitted to the atmosphere from all sources
onime Shutterstockcom
5
UNEP Global Mercury Assessment 2013
Anthropogenic sources of mercury emissions and releases Anthropogenic sources of mercury emissions account for about 30 of the total amount of mercury entering the atmosphere each year
As found in previous global mercury assessments the main industrial sources of atmospheric mercury are coal burning mining industrial activities that process ores to produce various metals or process other raw materials to produce cement In these activities mercury is emitted because it is present as an impurity in fuels and raw materials In these cases mercury emissions and releases are sometimes referred to as lsquoby-productrsquo or lsquounintentionalrsquo emissions or releases A second category of sources includes sectors where mercury is used intentionally Artisanal and small-scale gold mining (ASGM) is the largest of these in which mercury emissions and releases result from the intentional use of mercury to extract gold from rocks soils and sediments Other intentional-use release sectors include waste from consumer products (including metal recycling) the chlor-alkali industry and the production of vinyl-chloride monomer
Coal burning and to a lesser extent the use of other fossil fuels is one of the most significant anthropogenic source of mercury emissions to the atmosphere Coal does not contain high concentrations of mercury but the combination of the large volume of coal burned and the fact that a significant portion of the mercury present in coal is emitted to the atmosphere yield large overall emissions from this sector The mercury content of coal varies widely introducing a high degree of uncertainty in estimating mercury emissions from coal burning Data on mercury content is now available from many countries including major emitters of mercury
Mining smelting and production of iron and non-ferrous metals are also a large source of global mercury emissions to air and also a very important sector with regard to releases to water In the mining and processing of metals most of the mercury is captured and either stockpiled or sold for use in various products creating anthropogenic sources associated with intentional use discussed below Nonetheless the volume of ores and metals involved result in large total emissions and releases The relatively small volume of primary mercury production makes mercury mining a far smaller source today than it has been in the past
Cement production which typically involves the burning of fossil fuels to heat the materials required to make cement is another major anthropogenic source of mercury emissions Both the raw materials and the fuel may contain mercury and lead to emissions The amount of mercury involved varies greatly with the mercury content of these fuels and especially with the raw materials In some countries cement kilns are burning increasing amounts of alternative fuels including wastes that may contain mercury This may add to the emissions from cement kilns
Oil refining emits and releases mercury as oil deposits are known to contain mercury generally at low concentrations Mercury is removed from most petroleum products and natural gas prior to combustion and therefore combustion-related emissions are low Most of the mercury in crude oil is associated with solid waste that is disposed of in landfills However emissions and releases during refining of crude oil do occur and these have been quantified for the first time in the 2010 inventory The inventory does not quantify other emissions and releases during oil and gas extraction and transport or from flaring
Unintentional mercury emissions from these sectors can be reduced by the application of pollution control measures at power plants and industrial plants Some of the mercury captured is refined and enters the commercial supply chain however large amounts of mercury captured in materials such as fly ash and oil refinery waste need to be disposed of Some of the resulting wastes are themselves used as raw materials for example in construction materials but large amounts are disposed of in landfills which can thus become a potential source of mercury emissions and releases
Among intentional-use sectors Artisanal and small-scale gold mining is a major source for emissions and releases of mercury worldwide In ASGM miners use mercury to create an amalgam separating gold from other materials They then have to separate the mercury from the gold Calculating emissions from this sector presents a particular challenge because it is typically widely dispersed and often unregulated and may be illegal Uncertainties regarding release estimates from the ASGM sector are therefore high Furthermore the miners are typically poor and perhaps have little awareness of the hazards of mercury and pollution control devices may be hard to obtain
Wastes from consumer products containing mercury can end up in landfills or incinerators
6
UNEP Global Mercury Assessment 2013
Mercury is still used in a wide range of products including batteries paints switches electrical and electronic devices thermometers blood-pressure gauges fluorescent and energy-saving lamps pesticides fungicides medicines and cosmetics Once used many of the products and the mercury they contain enter waste streams While mercury in landfills may slowly become re-mobilized to the environment waste that is incinerated can be a major source of atmospheric mercury especially from uncontrolled incineration Incinerators with state-of-the-art controls have low emissions
Another use of mercury is in dental amalgam for filling teeth When bodies are cremated mercury in fillings can be emitted Mercury can also be emitted and released during production and preparation of fillings and from the disposal or removed fillings In addition mercury from removed fillings can be recycled or go into solid waste and wastewater
The amount of mercury released in the recycling of scrap metals for example in secondary steel and nonshyferrous metal production is generally assumed to be much lower than that released during primary metal production which is why the present global inventory only addresses primary metal production However lower emissions from recycling may not be the case in all countries Much of the scrap steel in some countries comes from automobiles that may still have devices that contain mercury and which may not be removed prior to recycling of the steel These devices are largely being phased out so mercury emissions from scrap steel may be expected to decrease However large differences exist between countries in the way they treat their mercury-containing wastes including scrap metals that are recycled in secondary metal production
Mercury is also used in a number of industrial processes A major industrial use is in the chlor-alkali industry where mercury-cell technology may be used in the production of chlorine and caustic soda
Mercury is also used as a catalyst in the production of vinyl chloride monomer (VCM) from acetylene mainly in China
Mercury releases to aquatic systems as a result of current human activities arise from many of the same uses or the presence of mercury in various products and processes that emit mercury to the air As with emissions to the atmosphere aquatic releases come from two main sources First mercury is released with water effluent from the sites where mercury is used Second mercury can leach into water from disposal sites that have mercury in the waste
zhu difeng Shutterstockcom
Tomas Pavelka Shutterstockcom
bikeriderlondon Shutterstockcom
Anthropogenic sources of mercury from industry and intentional use
Gunnar Futsaelig
ter
7
UNEP Global Mercury Assessment 2013
Arnold John Labrentz Shutterstockcom
Re-emission and re-mobilization of mercury Re-emissions constitute the third category of sources presently comprising about 60 of mercury emissions to air Mercury previously deposited from air onto soils surface waters and vegetation from past emissions can be emitted back to the air Re-emission is a result of natural processes that convert inorganic and organic forms of mercury to elemental mercury which is volatile and therefore readily returns to the air Mercury deposited to plant surfaces can be re-emitted during forest fires or biomass burning Mercury may be deposited and re-emitted many times as it cycles through the environment
It is important that re-emitted mercury should not be considered a natural source It may originally have come from natural or anthropogenic sources but by the time it is re-emitted it is difficult or impossible to identify its specific origin Nonetheless human activity has increased the environmental burden of mercury resulting in higher levels of re-emission This is compounded by changes in land use practices as well as increasing temperatures due to climate change
In the aquatic environment re-mobilization of mercury occurs when mercury deposited on and accumulated in soils or sediments is re-mobilized by for example rain or floods that cause the mercury to enter or re-enter the aquatic system Resuspension
of aquatic sediments due to wave action or storm events is an additional way for mercury to re-enter the aquatic ecosystems
Estimating re-emission and re-mobilization rates is difficult It is often done using modelling approaches These models are based on data on atmospheric levels and other observations as well as current understanding of chemical transformations and other processes that determine how mercury moves between air land and water The models aim to balance the amount of mercury in circulation at any given time while remaining consistent with observational data Temperature is a key factor With lower temperatures re-emission rates are generally lower
Re-emission is also a major factor in determining the length of time needed for anthropogenic emission reductions to be reflected in decreasing environmental levels of mercury Mercury emitted in one year may be deposited to and retained in soils and waters for some time before being re-emitted or re-mobilized in subsequent years This cycle can be repeated keeping levels in air and water elevated even after anthropogenic sources have been lowered Conversely continuing to add to the global pool will leave an ever-longer legacy of anthropogenic mercury contamination worldwide It is thus imperative that international efforts to reduce mercury emissions continue and are strengthened as soon as possible
Forest fires re-emit mercury deposited to vegetation
8
UNEP Global Mercury Assessment 2013
Anthropogenic emissions to the atmosphere 3 Global emissions inventory The global emissions inventory for 2010 estimates that 1960 tonnes of mercury was emitted to the atmosphere as a direct result of human activity The leading sectors remain the same as those identified in the 2005 inventory Improved data however have changed the relative contributions of some of these sectors as have some actual changes in emissions All coal burning emissions taken together for example represent a lower percentage of the total emissions than in the 2005 inventory This is due in part to the increased estimates from artisanal and small-scale gold mining (ASGM) and in part to much lower estimates for domestic use of coal When the actual amount of mercury emitted from coal combustions in power generation and industrial uses is considered and the estimates are based on the same 2010 methodology the emissions in 2010 are the same and perhaps slightly higher than in 2005 Even though new coal-fired power plants are being built combustion efficiency and emissions controls are also improving in most parts of the world
Results by selected sector The updated inventory of emissions to air confirms coal burning as a continuing major source of emissions responsible for some 475 tonnes of mercury emissions to air annually compared with around 10 tonnes from combustion of other fossil fuels According to the new inventory more than 85 of these emissions are from coal burning in power generation and industrial uses In the previous assessment emissions from domestic and residential coal burning were highlighted as a possible larger contribution Better information on coal consumption for domestic and residential uses indicates that these activities are a smaller contribution to total emissions from coal burning than previously thought
Emissions from the cement production industry are largely dependent on the raw materials and the fuels used The new inventory avoids double
Emissions from various sectors in tonnes per year with the range of the estimate and as a percentage of total anthropogenic emissions Note These numbers cannot be compared directly with those presented in the 2008 assessment (see Chapter 4 Trends in mercury emissions to the atmosphere)
Sector Emission (range) tonnes
By-product or unintentional emissions
Fossil fuel burning
Coal burning (all uses) 474 (304 - 678) 24
Oil and natural gas burning 99 (45 ndash 163) 1
Mining smelting amp production of metals
Primary production of 455 (205 ndash 241) 2 ferrous metals
Primary production of nonshy 193 (82 ndash 660) 10 ferrous metals (Al Cu Pb Zn)
Large-scale gold production 973 (07 ndash 247) 5
Mine production of mercury 117 (69 ndash 178) lt1
Cement production 173 (655 - 646) 9
Oil refining 16 (73 - 264) 1
Contaminated sites 825 (70 - 95) 4
Intentional uses
Artisanal and small-scale 727 (410 ndash 1040) 37 gold mining
Chlor-alkali industry 284 (102 ndash 547) 1
Consumer product waste 956 (237 ndash 330) 5
Cremation (dental amalgam) 36 (09 - 119) lt1
Grand Total 1960 (1010 ndash 4070) 100
Values rounded to 3 significant figures To nearest percent
Sectors for which emissions are not currently quantified
biofuel production and combustion
vinyl-chloride monomer production emissions during
secondary metals production and ferro-alloys
oil and gas extraction transport and processing other than refinery emissions
industrial some hazardous waste incineration and disposal
sewage sludge incineration
preparation of dental amalgam fillings and disposal of removed fillings containing mercury
9
UNEP Global Mercury Assessment 2013
Disposal of waste from
Mercury-cell chlor-alkali
industry
Relative contributions to estimated emissions to air from anthropogenic sources in 2010
Oil refining
Coal combustion
Oil and natural gas combustion
Primary ferrous metal production
Primary non-ferrous metal (Al Cu Pb Zn)
Large-scale gold production
Hg production Cement production
mercury-containing products
Contaminated sites
Cremation
Artisanal and small-scale gold production
counting of emissions from conventional fuels (such as coal and oil) that are included under the industrial fossil fuel burning emissions However it does attempt to account for emissions from other fuels including alternative fuels (such as old tyres and other wastes) and from raw materials Increasing amounts of waste are being co-incinerated in the cement industry both as fuel but also in some plants as a means of disposing of hazardous wastes some of which may contain mercury In some regions additional measures are being introduced to make sure that mercury emissions associated with waste co-incineration do not increase overall emissions from cement plants
Increased application of air pollution control devices including some mercury-specific technologies together with more stringent regulations in several countries have the effect of reducing mercury emissions from coal burning sectors and thus offset some part of the emissions arising from increased activity
Artisanal and small-scale gold mining emissions are in the 2010 inventory the major source of emissions to air at 727 tonnes per year The reasons for the large increase in the estimate compared to 2005 are discussed below (see page 16) The global estimate for emissions from ASGM includes a significant contribution from China although
recent information on this sector in China is lacking China prohibited ASGM in 1996 and therefore records no emissions from this sector
Mercury-cell technology is becoming less common in the chlor-alkali industry as other more cost-effective processes are adopted No new plants are being constructed though many older plants remain to be converted Old chlor-alkali plants and other decommissioned industrial sites may constitute contaminated sites that continue to release mercury to the environment for many years and emissions from contaminated sites are now part of the inventory
Global emissions from use of mercury in dental amalgam resulting from cremation of human remains are estimated at 36 (09 ndash 119) tonnes in 2010 Some 340 tonnes of mercury is used per year in dentistry of which about 70-100 tonnes (ie 20shy30) likely enters the solid waste stream
In the production of vinyl chloride monomer information is still lacking on the lifecycle and eventual fate of the mercury catalyst Most of this production occurs in China and about 800 tonnes of mercury is thought to have been used by this industry in China in 2012 Used mercury catalyst is recycled and reused by enterprises that hold permits for hazardous waste management The amounts that may be emitted or released are unknown
Ronald de Hom
mel
Artisanal and small-scale gold mining Unlike most small-scale gold miners the green gold miners of Oro Verde shown here employ an environmental way of mining gold that does not use mercury or other chemicals
10
UNEP Global Mercury Assessment 2013
Results by region The greatest proportion of anthropogenic mercury emissions to the atmosphere comes from Asia which contributes about 50 of the global total The majority of Asian emissions come from East and Southeast Asia China accounts for three-quarters of East and Southeast Asian emissions or about one third of the global total
New data on emissions from ASGM have increased the proportion of global emissions attributed to South America and Sub-Saharan Africa largely due to increased estimates associated with improved information about ASGM activities in these areas
Emissions to air from other major source sectors are higher in Europe North America and Oceania
Mercury emission 2010 gkm2
0 2 5 10 100 1000
Global distribution of anthropogenic mercury emissions to air in 2010
Emissions from various regions in tonnes per year with the range of the estimate and as a percentage of total global anthropogenic emissions Note These numbers cannot be compared directly with those presented in the 2008 assessment (see Chapter 4 Trends in mercury emissions to the atmosphere)
See figure on the following Region Emission (range) tonnes page for map with
Australia New Zealand amp Oceania 223 (54 - 527) 11 specification of regions Values rounded to 3 Central America and the Caribbean 472 (197 - 974) 24
significant figures CIS amp other European countries 115 (426 - 289) 59
East and Southeast Asia 777 (395 - 1690) 397
European Union (EU27) 875 (445 - 226) 45
Middle Eastern States 370 (161 - 106) 19
North Africa 136 (48 - 412) 07
North America 607 (343 - 139) 31
South America 245 (128 - 465) 125
South Asia 154 (782 - 358) 79
Sub-Saharan Africa 316 (168 - 514) 161
Undefined (global total for emissions from 825 (700 - 950) 42 contaminated sites)
Grand Total 1960 (1010 ndash 4070) 100
11
UNEP Global Mercury Assessment 2013
North America
Central America and the Caribbean
South America
Unintentional emissions
Stationary combustion (coal)
Stationary combustion (oil and gas) Oil refining
Pig iron and steel
Intentional uses
Artisanal and small-scale gold mining Chlor-alkali
EU27
North Africa
Sub-Saharan Africa
Non-ferrous metals (Cu Pb Zn Al) Mercury
Large-scale gold
Cement
Product waste
Cremation
CIS amp other European countries
500
100
Middle Eastern States East and Southeast Asia
50
10 tonnes
South Asia Australia New Zealand amp Oceania
South America
North America
Central America and the Caribbean
Sub-Saharan Africa
South Asia North Africa
Middle Eastern States
EU
East and Southeast Asia
CIS amp other European countries
Australia New Zealand amp Oceania
Estimates of 2010 anthropogenic mercury emissions to air from different main sectors in different regions ASGM is shown separately to highlight its geographic distribution and better allow regional comparisons to be made for other sectors
12
UNEP Global Mercury Assessment 2013
Compiling the 2010 inventory of anthropogenic mercury emissions to air The inventories used in successive Global Mercury Assessments continue to improve as better data become available The 2013 update presents an inventory of emissions for 2010 that has a number of improvements over the 2008 assessment and its inventory for 2005
bull A more detailed analysis of emissions from some major source sectors For example fossil fuel consumption is now broken down into categories for combustion in power plants industry and other uses The type of coal or oil used is also considered providing a more accurate estimate of mercury emissions
bull A more detailed consideration of the mercury content of fuels and raw materials used in different countries and regions bull New and updated information on ASGM bull The use of different pollution control technologies
in different countries and regions have been factored into the emissions estimate bull Emission estimates for sectors not previously
included such as aluminium production oil refining and contaminated sites bull More and better information on location of major
point sources such as individual power plants smelters and cement kilns bull Better documentation and greater transparency
with respect to the data and information behind the estimates
The methods for estimating emissions from industrial sectors is complemented by other methods used for more dispersed emissions sources For example estimating emissions from some intentional-use sectors requires intensive work with those sectors Relevant and accurate information about ASGM is generally not available through official channels Estimating mercury emissions from its intentional use in lighting batteries and other products requires analysing the entire production use and waste stream to determine where mercury is likely to be released and in what quantities The approach used in the 2013 assessment addresses the emissions from breakages and wastes resulting from use of these mercury-containing products in society the majority of
which are incinerated or end up in landfills It does not however address industrial wastes or sewage sludge incineration
Uncertainties in emission estimates Estimates of mercury emissions are just that estimates To compile a global assessment requires making a number of assumptions and generalizations Uncertainty associated with the 2010 inventory arises from each of the factors used to estimate the emissions the correctness of the activity data the validity of the emission factors applied and the validity of assumptions regarding the effectiveness and use of emission-control technologies
Based on an evaluation of these sources of uncertainty and the relative contributions of sectors with reliable information and those with less reliable data uncertainty in the 2010 inventory assessment of total anthropogenic mercury emissions to air gives a range of emissions from 1010-4070 tonnes This range is greater than that reported in some previous assessments reflecting a greater appreciation of the sources of uncertainty due to the improved estimation methods and perhaps a more realistic appraisal of the state of knowledge concerning some aspects of emissions
The best estimate taking a conservative approach is 1960 tonnes If nationally produced estimates for 2010 available from some countries (Canada Japan Korea Mexico the United States and European countries reporting to LRTAP) are introduced into the global inventory in place of the inventory estimates the corresponding estimated total global anthropogenic emission to air is 1940 tonnes As most national inventories do not include uncertainty ranges it is not possible to assign a range to this number The recognition of uncertainties is an important consideration and presenting single national estimates can convey a misleading picture of what is known and more importantly not known about emissions
The numbers derived using the methods employed to produce the global inventory for 2010 were compared with a number of national inventories and emissions reported under other systems covering the same period In general the level of agreement was good in particular when the significant uncertainties
13
UNEP Global Mercury Assessment 2013
Methods for estimating emissions All global mercury emissions inventories to date have used the same basic approach for the major sectors emitting mercury to the atmosphere For specific emission sectors national emissions estimates are calculated by multiplying the amount of activity (ie amounts of fuels burned raw materials consumed or materials produced) by an emission factor that is an estimate of the mercury emitted per unit of activity For example emissions from coal-fired power generation are estimated by multiplying the tonnes of coal used by the amount of mercury estimated to be released per tonne of coal In most such inventories ldquoabatedrdquo emission factors have been employed to quantify both the emissions of mercury that occur during the processes and the effects of mercury emission controls In the new methodology used to develop the 2013 report these components are split ldquoUnabatedrdquo emission factors are employed to quantify the emissions and ldquotechnology profilesrdquo have been developed to represent the effects of mercury emission controls
Various methods are employed to estimate emissions of mercury at individual sources and at national regional and global levels In general the methods fall under one of two main categories
bull Mass-balancesubstance-flow based estimates which are based on the principle that what goes in must come out Amounts of mercury in fuels and raw materials constitute the inputs and the outputs are the amounts of mercury emitted to air released to water or land retained in products or in wastes or otherwise recovered and stored or disposed of
involved in both global and national estimates are taken into account It is important to note that there are good reasons why estimates of mercury emissions produced in the 2010 inventory may not fully agree with national inventories made by countries using other methodologies These reasons include
bull Reporting schemes may define and distinguish emissions source sectors in very different ways and aligning these sectors may not be possible
bull Industry reporting to national government may be limited to sources with emissions above a certain threshold level so that emissions from smaller sources below the threshold are not reported Where smaller sources make up a significant part of the source category reported inventories
bull Measurement-based estimates which rely on measurements made at appropriate points in the industrial process or in the productwaste output streams These measurements are used to estimate where the mercury goes as in the method above
In principle the two approaches should produce the same results In practice mass-balance based approaches tend to result in higher emission estimates than most measurement-based estimates Since future emissions reporting is likely to involve a combination of these two approaches further work is required to understand why results may differ and to reconcile the two approaches
Since the 2008 UNEP assessment was produced the number of direct measurements of emissions from certain point sources (in particular power plants and some metal and cement production plants and waste incineration facilities) has increased considerably resulting in a much improved knowledge base
A number of countries require regular reporting of emissions Increasing use is being made in these reporting systems of measurement-based estimates and facility-level reporting in particular for major point sources In other countries national mercury emissions are only being quantified for the first time Since 2005 and the start of the UNEP negotiating process in 2010 many countries have initiated work on national emission inventories which in several cases have yielded much improved information on activity data sector characteristics and mercury emissions Such inventories often make use of the UNEP Toolkit for identification and quantification of mercury emissions
may therefore significantly underestimate total mercury emissions bull National inventories in some countries are making
increasing use of actual measurements of mercury emissions at individual facilities At the global scale it is not yet feasible to base an inventory on individual site emissions Furthermore actual measurements of mercury emissions at a source may be taken only a few times during a year and may not be fully representative of normal operations In the 2013 assessment a mass-balance based approach was employed to be consistent transparent and replicable bull National reporting and monitoring schemes
may provide information that is not available to externally produced inventories
14
UNEP Global Mercury Assessment 2013
Despite these considerations most of the discrepancies noted between the 2010 inventory mass-balance-based estimates and national estimates based on measurement- approaches are modest and within the margins of error associated with the different approaches In cases where the differences are larger it is important to recognize that there are sources of error in all methods for estimating mercury emissions
Gunnar Futsaelig
ter
Sampling of mercury emissions at the Kendal coal-fired power plant in South Africa conducted under a UNEP project A probe with mercury traps is inserted into a sampling port in the stack to collect mercury present in the flue gas The mercury traps are subsequently analysed according to the US EPA Mercury Monitoring Toolkit sampling protocol
15
UNEP Global Mercury Assessment 2013
Trends in mercury emissions to the atmosphere 4 Assessing global and sectoral trends A key question in assessing anthropogenic mercury emissions worldwide is whether they are increasing or decreasing While it is tempting simply to compare the 2010 inventory with its 2005 counterpart the results would mean little As inventory methods develop and as additional sources are considered the estimate of total anthropogenic mercury emissions worldwide also changes While some changes reflect real trends others reflect changes in methods or scope Thus comparing the results of previous assessments with the present update requires considerable care and involves an understanding of the way in which these inventories have been produced and the uncertainties associated with them
It is possible however to compare certain sectors over time by attempting to compensate for any methodological changes between the various inventories since 1990
Emissions to air are thought to have peaked in the 1970s From 1990 to 2005 total anthropogenic emissions of mercury to the atmosphere appear to
Emissions to air t
1400
1200
1000
800
600
400
200
0
1990
1995
2000
2005
Africa Asia Europe Russia North Oceania South America America
Estimates of annual anthropogenic mercury emissions from different continentsregions 1990-2005
have been relatively stable with decreases in Europe and North America being offset by increases in Asia A reanalysis of the available inventories since 1990 however indicates that emissions from industrial sectors at least may be starting to increase again
The changes introduced in the 2010 inventory methodology prevent a straight-forward continuation of this analysis However an evaluation of trends for some sectors between 2005 and 2010 has been made by applying the new methodology to activity data for 2005 This comparison suggests a further slight increase in the combined amount of mercury emitted by industrial sectors (coal combustion production of cement pig iron and steel and non-ferrous metals) The following paragraphs describe the trend results for three sectors to illustrate some of the developments between 2005 and 2010 and some of the the difficulties in comparing emissions estimates between different years made with different methods
Coal burning for power generation and for industrial purposes continues to increase especially in Asia However increases in the application of air pollution controls including some mercury specific technologies together with more stringent regulations in a number of countries have reduced mercury emissions from coal burning in power plants in particular and thus offset some part of the emissions arising from increased coal consumption
In the United States for example emissions from coal burning at power plants have reportedly decreased from about 53 tonnes in 2005 to 27 tonnes in 2010 This decrease is largely due to new regulations that have resulted in changes in the sources of the coal that is burned in large power plants and the installation of mercury controls as well as controls on sulphur dioxide and particulates that have the co-benefit of further reducing mercury emissions
In China many of the new coal-fired power plants have state-of-the-art pollution controls installed
Emissions of mercury from artisanal and small-scale gold mining (ASGM) reported for 2010 are more than twice those reported for 2005 While the
16
UNEP Global Mercury Assessment 2013
Unintentional emission sectors Coal burning ferrous- and non-ferrous (Au Cu Hg Pb Zn) metal production cement production Intentional-use sectors Disposal and incineration of product waste cremation emissions chlor-alkali industry
Comparison of emissions in 2005 and 2010 by selected sector and region
Unintentional emission sectors
Emission t
1000
800
600
400
200
0 2005 2010
Australia New Zealand amp Oceania
Central America and the Caribbean
CIS amp other European countries
East and Southeast Asia
rise in the price of gold (from USD 400 per ounce in 2005 to USD 1100 per ounce in 2010) along with increased rural poverty may indeed have caused more activity in this sector the increased estimate for mercury emissions is considered to be due primarily to some more and better data from many countries and regions West Africa for example was regarded as having minimal ASGM in 2005 but is now recognized as a region with considerable activity Thus the baseline has improved without necessarily any change in actual activity or emission levels
Waste from consumer products is affected by the amount of mercury used For most products in which mercury is used mercury-free alternatives exist Consequently many of these uses of mercury are declining at least in some regions as alternative products or processes are adopted Compact fluorescent light bulbs are an exception Even though the mercury content of individual light bulbs has decreased use of this type of light bulb is increasing rapidly
Artisanal and small-scale gold mining Intentional-use sectors
1000 1000
Step change from 2005 to 2010 due to new information 800 800 (under-estimation in 2005)
600 600
400 400
200 200
0 0 2005 2010 2005 2010
European Union (EU27) South America
Middle Eastern States South Asia
North Africa Sub-Saharan Africa
North America
In order to make valid assessments of trends in emissions from global inventories comparable data on activity levels are required together with information on changes in fuel and raw material characteristics and applied air pollution control technology One aim of the 2010 inventory methods is to create a firmer foundation for such future trend analysis
Ralf Siemieniec Shutterstockcom
Use of mercury-containing energy-saving lamps is increasing
17
UNEP Global Mercury Assessment 2013
Emission scenarios and future trends The 2008 Global Atmospheric Mercury Assessment included a first attempt at projecting future emissions inventories These were based on three scenarios continuing with the status quo applying current emissions controls worldwide and achieving maximum feasible technological reductions At the time this effort was regarded as highly provisional Since then additional studies have extended and improved this work but the results are not markedly different from earlier projections of future mercury emissions
Global mercury models have been used to evaluate future scenarios Four global and hemispheric models projected mercury levels around the world in 2020 based on the three emission scenarios described earlier In industrial regions the status quo will cause an increase in mercury levels of 2-25 and in remote areas of 15-5 The two emission control scenarios on the other hand yield a decrease in mercury in industrial areas of 25-35 and in remote areas of 15-20
Another global model was coupled with estimates of surface reservoirs of mercury in order to quantify source-receptor relationships for the present and for 2050 Under the best-case scenario of maximum feasible reductions projected estimates for deposition in 2050 is similar to estimates for today In the other scenarios increasing emissions lead to increasing deposition A greater proportion of mercury emissions is expected to be in the oxidized form so that a greater proportion will be deposited near the source instead of being transported far away
The model results support the conclusion that reducing anthropogenic emissions will slowly reduce the amount of mercury in biologically available reservoirs Over time mercury in the environment will be taken out of circulation by natural processes for example from ocean waters down into sediments and biologically available mercury will decrease Increased emissions on the other hand will continue to build up the amount of mercury in circulation
With new databases and methods it may soon be possible to create scenarios that incorporate activity levels as well as technology use for each country If this were done it would allow countries to assess the effects of different mercury reduction strategies on their national emissions For example a country could determine the relative contributions of emission reduction technology as opposed to for example changes in raw materials
18
UNEP Global Mercury Assessment 2013
Atmospheric chemistry monitoring and trends 5 Forms of mercury in air Mercury in the atmosphere is in three primary forms Gaseous elemental mercury is the most common in anthropogenic and natural emissions to the atmosphere Gaseous oxidized mercury and mercury bound to particulates are less common The transport and deposition of atmospheric mercury depend greatly on whether the mercury is elemental or oxidized Elemental mercury stays in the atmosphere long enough for it to be transported around the world whereas oxidized and particulate mercury are more readily captured in existing pollution control systems or deposited relatively rapidly after their formation As a result most mercury in the air is in the gaseous elemental phase Relatively little elemental mercury is deposited directly but instead must fi rst be oxidized
Although gaseous oxidized mercury is very important in mercury cycling between air and other environmental compartments the process of oxidation in the air is poorly understood with reactions and resulting compounds yet to be verified in observations
When mercury moves from air to water and land it is generally in an oxidized gaseous or particulate form whereas when it is re-emitted to air it has been converted back to gaseous elemental
Particulate associated mercury
Pole
Equator
Gaseous elemental mercury
Global transport
Gaseous elemental mercury can be transported globally Mercury emitted in particulate form tends to deposit closer to sources
mercury Sunlight appears to play a large role in both oxidation and reduction of mercury but temperature and biological interactions are also likely to be involved to some degree Here too much uncertainty remains Nonetheless the reactions are important in determining net deposition and fate of mercury
Monitoring of mercury in air Monitoring of mercury in air focuses on the three primary forms of mercury The measurement of gaseous elemental mercury is routine and robust Measuring gaseous oxidized mercury and particulate-bound mercury however is challenging Concentrations are typically very low and these forms are chemically unstable leading to high uncertainty in the measurements Nonetheless these forms are critical for defining and modelling the fate and transport of airborne mercury
In the past two decades coordinated mercury monitoring networks and long-term monitoring sites have been established in a number of regions measuring mercury concentrations in the air as well as deposition of mercury in precipitation In Europe and North America high-quality continuous monitoring has been going on for more than 15 years especially in the Arctic High-quality monitoring has started more recently in East Asia and South Africa as part of a global effort to expand the coverage provided by long-term monitoring sites
Measurements and trends in atmospheric mercury Monitoring stations around the world have provided information about trends in atmospheric mercury though the time periods vary depending on how long the site has been active Overall a declining trend in background mercury levels over the past decade has been recorded from monitoring stations
19
UNEP Global Mercury Assessment 2013
in many regions Other regions however show an increase in mercury levels
The sites also provide information about geographical patterns reflecting both background levels of
Trends in atmospheric measurements of mercury
Site(s) Period
Mace Head Ireland 1996-2011
North America rural sites 1995-2005
High Arctic sub-Arctic Up to 20 years of records mid-latitudes
Monitoring networks Mercury monitoring in Europe is carried out under the European Monitoring and Evaluation Programme (EMEP) one of the first international environmental measurement networks Heavy metals such as mercury have been included in the EMEP program since 1999 Mercury measurements are available only from northern and northwestern Europe
Three monitoring networks currently operate in North America providing good coverage of Canada and the United States the Mercury Deposition Network the Canadian Air and Precipitation Monitoring Network and the Atmospheric Mercury Network More recently new sites have been established in Mexico extending coverage on the continent The stations monitor atmospheric mercury and mercury in precipitation which has measured since the mid-1990s Monitoring of mercury in the air and in precipitation has been underway in Asia for nearly a decade
Alert Nord
Point Barrow
Nuuk Stoacuterhoumlfethi
Mace Head
mercury and local and regional influences Mercury concentrations at remote sites in Asia are higher than in other regions of the Northern Hemisphere Coastal cities in China have lower levels than inland sites likely due to the influence of relatively clean
Measurement Trend
Gaseous elemental mercury Decrease of 14-18 per year
Total gaseous mercury Decrease of 22 to 174 in total
Total gaseous mercury Decreasing trend at some stations increasing at others
The monitoring network of the Arctic Monitoring and Assessment Programme (AMAP) includes air and deposition monitoring sites located in Arctic regions of Canada Greenland Iceland Norway Russia and Sweden
Building on existing national and regional monitoring networks the European Union-financed project
ldquoGlobal Mercury Observation Systemrdquo (GMOS) started in November 2010 Its goal is to develop a coordinated global system for monitoring mercury including a large network of ground-based monitoring stations New sites are being installed in regions where few monitoring stations exist especially in the Southern Hemisphere Two sites have been established in Antarctica one on the Antarctic Plateau and one on the coast
Ny-Aringlesund
Amderma Pallas
Raringouml Bredkaumllen
Listvyanka Diabla Gora
Mauna Loa
Mt Bachelor
Celestuacuten Calhau
Longobucco
Iskrba Niembro Monte Cimone Cap
Ferrat Mt Waliguan Ganghwa Island
Lulin
Cape Hedo Ev-K2
Mt Changbai
Minamata Mt Ailao
Nieuw Nickerie
Kodiakanal
Maheacute Island Manaus
Bariloche Cape Point
Amsterdam Island Cape Grim
Dumont drsquoUrville
AMAP CAMnet EMEP GMOS GMOS associated NADPAIRMoN NADPMDN
Air + precipitation Air Precipitation
20
UNEP Global Mercury Assessment 2013
John Munthe
The mercury background air monitoring station at Zeppelin mountain Svalbard
air from over the ocean Sites off the Asian coast however show higher levels of gaseous elemental mercury than the Northern Hemisphere background suggesting an outflow from the Asian mainland
Weather patterns have also been found to have a strong influence on seasonal patterns in mercury levels in the air at monitoring sites At the Mount Waliguan Observatory on the Tibetan Plateau for example northeasterly and easterly winds produced the highest levels of mercury
Measurements at high altitudes Measurements from ground-based stations above 2700 meters suggest that there is an inverse relationship between gaseous elemental mercury and gaseous oxidized mercury at these elevations In other words when there is more elemental mercury there is less oxidized mercury and vice versa These measurements are in good agreement with modelling results which gives additional confidence in current understanding of the behaviour of mercury at high altitude
An inverse relationship between total gaseous mercury and particulate concentration has also been observed in the high stratosphere From the transformation rate of total gaseous mercury to particulate-bound mercury it appears that gaseous mercury lasts about two years in the stratosphere
21
UNEP Global Mercury Assessment 2013
Atmospheric concentrations and deposition 6 Measurements and trends of mercury in precipitation Mercury deposited by precipitation decreased from the 1990s into the 2000s at many but not all sites in North America and Western Europe where such measurements were taken
Regional patterns are also evident including slightly higher levels in southern Europe than northern Europe and higher levels in Asia than in North America Total mercury concentrations in precipitation in China were much higher than those in Japan and South Korea Th is was mostly attributed to higher levels of gaseous oxidized mercury and particulate-bound mercury which are readily deposited by precipitation and thus not transported far
A comparison of data from Canadian and American monitoring sites found that deposition of mercury in precipitation was highest in summer
Dry deposition of mercury which is deposition not associated with precipitation is diffi cult to measure and consequently there is little information on trends in mercury dry deposition Th is lack of information means that it is also diffi cult to validate model results for dry deposition
106 44
474 72 91
5 7 71
05 1 5 10 100 500 1000
Total mercury emission (2005) kgcell
Modelled mercury air concentrations and deposition patterns Atmospheric mercury concentrations are highest in major industrial regions Models examining global patterns show that East and South Asia Europe North America and South Africa have the highest levels of elemental mercury in the air Concentrations are generally lower in the Southern Hemisphere than the Northern Hemisphere because most industrial activity is in northern regions Th ese model results are based on simulations using the 2005 global mercury emission inventory because the 2010 inventory has only recently become available
Intercontinental transport of mercury in the air has been examined to determine its impact on regional mercury levels Four models using diff erent parameters produced consistent results Depending on the region mercury emitted by distant sources contributes between 10 and 30 of annual mercury deposition Where local sources are low mercury transported from distant emission sources can account for more than half of the deposition East Asia is the dominant source region adding 10-14 to the deposition in
Contribution from sources outside receptor region
Model 40
GEOS-Chem GLEMOS GRAHM CMAQ-Hg
30
20
10
0 Arctic Europe North East Asia South Asia
America
Receptor region
(Left ) Global distribution of anthropogenic mercury emissions in 2005 with source regions that were considered in the analysis (North America South America Europe Africa Central Asia South Asia East Asia Australia and Oceania) and (right) the contribution of anthropogenic sources outside a particular receptor region to deposition within the receptor region
22
UNEP Global Mercury Assessment 2013
Modelling atmospheric transport and deposition Global models reproduce the movement of mercury in the atmosphere during which the mercury may move between continents They have been effective in examining sources of mercury to the Arctic and also for examining the outflow of pollution from South and Southeast Asia and its impact on western North America as well as the flow from eastern North America to Europe
Regional models on the scale of a continent or a basin such as the Mediterranean can provide more detail about specific source areas even to the level of individual industrial areas Reliable results however require a detailed understanding of mercury oxidation in the atmosphere about which there is considerably uncertainty
Most atmospheric transport models consider the full chain of mercury processes in the atmosphere Some models also consider how mercury is cycled in other atmospheric compartments such as soil vegetation snow freshwater and seawater
One of the largest sources of uncertainty in mercury models is the chemical mechanism used to determine how mercury changes forms in the air Improved experimental data can help improve model performance by making sure that the correct reactions are simulated The processes that lead from deposition to re-emission also need to be understood better Advances in this area show promise with model results becoming closer to estimates based on experimental data
other regions of the world Natural emissions and re-emissions account for 35-70 of total deposition in most regions Deposition is generally greater in low and mid-latitudes due to stronger sunlight higher concentrations of oxidants and higher precipitation
Regional mercury models show patterns at the scales of continents or individual seas The Mediterranean Sea for example is a net source of mercury as it emits more than is deposited to it In that region dry deposition generally exceeds deposition of mercury in precipitation In Central and Southern Europe total gaseous mercury concentrations and deposition in precipitation were both consistently higher than the European average
Across the United States dry deposition accounts for two-thirds of total annual deposition mainly from gaseous oxidized mercury A study examining sources and deposition of mercury to assess the
benefits of proposed emission control measures found that mercury transport from outside the country accounts for 68 of mercury deposition in the Northeast and up to 91 in the west-central United States Large point sources contribute up to three-quarters of nearby deposition and power plants contributed half of the deposition in the eastern part of the country This suggests that new emissions standards would primarily benefit eastern regions of the US
In Asia studies show high seasonal variation in mercury concentration and deposition Anthropogenic emissions are responsible for about 75 of deposition in East Asia In this region there is a net removal of gaseous oxidized mercury from the atmosphere and a net export of gaseous elemental mercury
In the Arctic gaseous elemental mercury levels in the atmosphere are depleted rapidly in spring when after the long Arctic winters sunlight returns Ozone is depleted at the same time and it is believed that bromine-containing compounds are the cause of the photo-chemical reactions that deplete ozone and mercury During these events gaseous oxidized mercury and particulate-bound mercury levels increase sharply suggesting that the gaseous mercury is oxidized and deposited enhancing mercury deposition in Arctic areas in springtime Recent research however has found that 50-80 of the deposited mercury is re-emitted within a few days Similar springtime mercury depletion events have been seen in Antarctica
23
UNEP Global Mercury Assessment 2013
Anthropogenic releases to the aquatic environment 7 Global assessment Previous UNEP global mercury assessments only considered emissions to the atmosphere The 2013 Report presents the first attempt at compiling a global inventory of mercury releases to aquatic environments Releases directly into the aquatic environment present a completely different chemistry set of pathways and fate to those released to air They are also more directly linked to the risks posed by mercury to global environmental and human health Unlike mercury releases to air which are predominantly in the form of gaseous elemental mercury releases to water are predominantly inorganic mercury and to a lesser extent liquid elemental mercury
At present only some sources of aquatic releases can be quantified with any confidence Thus many sources that may be important are not included in this first assessment of global aquatic releases For example land management practices that expose new geological sources of mercury in rocks and mineral soils or that re-mobilize previously deposited mercury cannot yet be assessed Two broad categories of current anthropogenic sources are considered here point sources of mercury release to water and diffuse releases of mercury as a result of its remobilisation from areas where it was previously deposited or accumulated due to human activity (ie contaminated sites) Artisanal and small-scale gold mining (ASGM) mercury-containing pesticides and fungicides used in agriculture and deforestation are considered separately
Point source releases to water from various sectors in tonnes per year with the range of the estimate and as a percentage of total anthropogenic emissions
Sector Releases (range) tonnes
Non-ferrous metal production 925 (193 - 268)
Consumer product waste 894 (222 - 308)
Chlor-alkali production 28 (10 ndash 55)
Oil refining 06 (03 ndash 1)
Grand Total 185 (426 ndash 582)
The global estimate of mercury release to water from point sources has been derived from the atmospheric emissions assessment and the approach employed in the UNEP Toolkit to partition total mercury releases between air land and water This approach has considerable uncertainty and may omit sectors where releases to water are high but air emissions are unimportant and therefore not addressed in the inventory Global releases from point sources were estimated to be 185 tonnes per year
For diffuse sources evaluating the relative contribution of anthropogenic and natural sources to the aquatic environment requires determining considerations of the various mercury inputs For some sectors data exist that allow a preliminary assessment of the amounts of mercury re-mobilized into aquatic systems
For mercury-contaminated sites the range of average soil concentrations of mercury reported for sites where mercury was mined used or otherwise released by human activity was considered The area of contamination is then used to determine how much mercury is available in soils and when combined with a factor for how much mercury is released from those soils in a year the total release can be estimated Among identified contaminated sites mercury mining is identified as the largest sector followed by mining of precious metals Total releases to aquatic environments from contaminated sites are estimated to be 83-335 tonnes per year
Releases to water from contaminated sites in tonnes per year with the range of the estimate
Sector Releases (range) tonnes
Primary mercury mining sites 67 ndash 266
Precious metal production sites 14 ndash 55
Non-ferrous metal production sites 01 ndash 05
Chlor-alkali production sites 01 ndash 05
Other industrial sites 01 ndash 03
Grand Total 83 ndash 335
24
UNEP Global Mercury Assessment 2013
Much of the mercury released from artisanal and small-scale gold mining goes into rivers lakes soils and sediments and tailings From soils and tailings it may be re-mobilized by leaching and erosion In addition mining may disturb mercury-containing soils and sediments that may then erode more quickly releasing more mercury than would otherwise have become available from natural erosion A key factor in these processes is the local hydrological cycle of precipitation evaporation run-off and river flow To account for this in the assessment countries were designated as dry wet or intermediate to determine the relative importance of erosion The tropical and subtropical countries which have the greatest activity in this sector also tend to experience high precipitation and run-off exacerbating this source of mercury release and re-mobilization Total worldwide releases of mercury to land and water from ASGM were estimated at over 800 tonnes per year How much of this is released to water cannot yet be determined
Mercury continues to be used in pesticides and fungicides 2100 tonnes of mercury were released in the decade of the 1960s through such agrochemical uses Current data are unavailable although the use of mercury in these products has been greatly reduced
Deforestation especially in the Amazon Basin can lead to extensive soil erosion and thus the release of mercury previously accumulated in soils Using 2010 figures for deforestation rates around the world and an estimate of soil concentrations of mercury as much as 260 tonnes of mercury may have been released into rivers in 2010 as a result of deforestation worldwide
Because this is the first attempt to quantify global mercury releases to the aquatic environment there is no previous measurement against which these results can be compared Thus it is not possible at this time to evaluate trends in releases
Uncertainties in release estimates Estimating global releases of mercury to aquatic environments is being done here for the first time Many data are missing and others are imprecise A number of assumptions have been made based on what measurements are available or on other grounds to extrapolate from known quantities or to calculate aquatic releases in relation to atmospheric
or other emissions Thus the results should be treated with great caution It is nonetheless clear that anthropogenic sources and human activity contribute hundreds of tonnes of mercury to aquatic environments each year a substantial amount relative to estimated natural releases 150-960 tonnes per year from terrestrial environments
Lapshin Shutterstockcom
Phil Augustavo istockphotocom
Bureau of Land Managem
ent
Contaminated sites (top) erosion following deforestation (middle) and a flooded store of mercury-contaminated waste (lower) illustrate potential sources of mercury releases to water
25
UNEP Global Mercury Assessment 2013
Aquatic pathways transport and fate 8 Mercury in aquatic environments The pathways and fate of mercury in aquatic environments are important because it is in waters sediments and wetland soils that inorganic mercury is converted into methylmercury which is toxic and concentrates in animals The majority of human exposure to mercury and the health risk that comes with mercury exposure is from consumption of marine foods Thus this section focuses on the worldrsquos oceans Some freshwater systems however are important sources of fish for human consumption especially for subsistence and recreational fisheries often among indigenous peoples Artisanal and small-scale gold mining (ASGM) communities may also be affected through fish consumption and drinking water if those are contaminated by local releases
The major processes of mercury cycling are generally similar for all aquatic systems Inorganic mercury in dissolved or particulate form is the dominant mercury type in most marine and fresh waters Dissolved gaseous elemental mercury accounts for less than 30 of total mercury in water Methylmercury is often present at trace levels but may in some settings reach 30 of total mercury In freshwater and coastal environments inorganic mercury is transformed into methylmercury primarily in sediments In the open ocean this conversion takes place largely at intermediate depths between 200 and 1000 meters in the water column Mercury is lost from aquatic systems in two ways When inorganic mercury is reduced to elemental mercury it can be re-emitted to the atmosphere When inorganic mercury binds to particulates in water it can settle out rapidly and be buried in sediments Deep burial in ocean sediments is one of the major pathways by which mercury is removed from the biologically active environment
The global mercury cycle is chemically and physically complex Thus it is necessary to use models to study describe and predict what happens and will happen to mercury in the aquatic environment Until recently only one model existed that incorporated
air land and water into a unified whole The model has been validated against observations of mercury and represents the current scientific consensus The largest potential errors in this model in terms of the aquatic cycle concern details of the exchange of mercury between air and water
Pathways and fate of mercury in the oceans Model simulations suggest that anthropogenic impacts on mercury levels in the ocean are greatest in the surface waters the top 100 meters or so of the water column While model results vary one recent estimate suggests that anthropogenic emissions over the last 100 years have doubled the concentration of mercury in the surface layer of the ocean and increased it by 25 in intermediate waters and by 10 in deep waters The difference is due to the length of time it takes for surface waters to circulate to the depths
Models and measurements agree that direct deposition from the atmosphere is the dominant pathway by which mercury reaches the oceans The exceptions are smaller semi-enclosed basins such as the Mediterranean Sea or the Arctic Ocean where river runoff coastal erosion and ocean currents
Ugo M
ontaldo Shutterstockcom
26
UNEP Global Mercury Assessment 2013
account for about half of mercury inputs The most recent modelling effort suggests that total deposition input of mercury to the oceans in 2008 was 3700 tonnes
Other mercury pathways appear less important on a global basis Rivers are estimated to carry more than 2800 tonnes of mercury each year but only about 380 tonnes of this is transported offshore The rest is trapped by particles in estuaries Groundwater and re-mobilization from sediments provide 100shy800 tonnes of mercury to the oceans each year Undersea hydrothermal vents add less than 600 tonnes of mercury to the oceans There are high concentrations of mercury in vent fluids but a great deal of the mercury is precipitated as solids once the vent fluids enter seawater
Models suggest that globally about 70 of the mercury deposited into the ocean is re-emitted to the atmosphere Oxidized mercury in surface waters is reduced by biological and photochemical processes to the elemental form that is volatile and readily re-emitted The removal of this mercury ultimately reduces the pool of mercury that could be converted to methylmercury and be accumulated by marine organisms The re-emission process thus simultaneously prolongs the lifetime of mercury cycling through the atmosphere and upper ocean and acts to reduce mercury availability for marine food webs
Any changes in the efficiency of mercury reduction in surface waters or the rate of re-emission is likely to impact mercury concentrations in surface waters and the air One example is the effect of sea ice in the Arctic Ocean which blocks the re-emission
Tony Magdaraog Shutterstockcom
Mercury accumulated in marine food-webs can enter the human diet
of elemental mercury leaving elevated levels in waters under ice Changes in primary productivity could change the rate at which mercury is bound to particles thus affecting re-emission to the atmosphere as well as rates of downward transport in the ocean Changes in oxidant levels in the atmosphere such as ozone and bromine may also influence the rate of oxidation of gaseous elemental mercury and thus deposition rates to the ocean
Methylmercury in the ocean Natural bacterial processes in seawater and in sediments in coastal environments convert inorganic mercury to methylmercury Methylmercury levels are highest in the subsurface waters of many oceans because it is formed at these intermediate depths likely as a result of the decomposition of organic material falling from surface waters Current understanding indicates that about 300 tonnes of methylmercury is produced in the upper ocean by this and related processes By contrast only about 80 tonnes of methylmercury reaches the ocean from other sources such as atmospheric deposition rivers and diffusion from sediments
Current modelling indicates that methylmercury stays in the upper ocean for about 11 years Deshymethylation by photochemical reaction or by microbial activity is the major removal process for methylmercury in the ocean About 240 tonnes of methylmercury is removed by this process from the surface waters of the ocean per year
The other important pathway for methylmercury in seawater is uptake into marine food webs Although only about 40 tonnes per year is taken up in this way it is this fraction that poses risks to marine animals and human consumers of seafood Methylmercury is a problem for several reasons First it is taken up by plankton much more efficiently than is inorganic mercury resulting in concentrations in plankton that are as high as 10000 times the concentration in seawater Second methylmercury is absorbed through the intestine of animals much more easily than is inorganic mercury Third methylmercury biomagnifies as it moves up the food web Thus methylmercury becomes an increasingly greater proportion of the mercury in organisms higher in the food web This explains why some indigenous populations that consume top marine predators such as fish seals and whales have some of the worldrsquos highest concentrations of methylmercury giving rise to health concerns
27
UNEP Global Mercury Assessment 2013
Pathways and fate of mercury in freshwater Observations and modelling both show that there are in general many similarities between mercury chemistry pathways and fate in lakes and in the oceans but with obvious differences in scale and in the relative importance of different processes Modelling of mercury dynamics was done for four lakes with a history of direct mercury inputs from the largest freshwater lake in the world (Lake Superior) to small lakes in Ontario Canada Atmospheric deposition and river inflow were the main sources of inorganic mercury Much of the mercury input from lake and river catchments was associated with dissolved and particulate organic matter The dominant mercury removal mechanisms as in saltwater were burial in sediments and photochemical reduction of oxidized mercury to elemental mercury followed by re-emission to the air In Lake Superior and Lake Michigan there is evidence for methylation of mercury in the water column as is seen in the open ocean
Methylmercury levels in freshwater fish vary with the level of deposition of mercury from the air though other factors such as inputs from the watershed and the number of trophic levels within the lakersquos food web are also important Methylation predominantly occurred in lake sediments and wetlands and floodplain soils where sulphateshyreducing bacteria are believed to be primarily responsible Methylmercury is de-methylated in sediments and also taken away in the outlet river from each lake
Some 400-1400 tonnes of mercury are estimated globally to be trapped behind dams and other man-made impoundments each year This has in many cases led to significant increases in total mercury and methylmercury levels in water and of methylmercury in fish and other aquatic species When artificial lakes are created plant material is submerged leading to decay and anoxia In these conditions microbially driven methylation of inorganic mercury takes place In some cases the elevated mercury levels have also been observed downstream from the artificial lakes and reservoirs
Anthropogenic impacts on aquatic mercury levels Two studies have reported that the Atlantic and Pacific Oceans have shown opposing trends over recent decades While the influence of changing ocean currents and other oceanographic factors may be a factor the trends do make sense in light of patterns of anthropogenic emissions In the North Pacific Ocean mercury concentrations appear to have increased at depths between 200 and 1000 meters over the last few decades This increase coincides with the rapid industrialization of East Asia
In the North Atlantic however results from near Bermuda suggest a substantial decrease in mercury concentration and a change in the mercury profile through the water column The Mediterranean Sea too showed a decrease in mercury concentration between 1990 and 2004 These findings are consistent with atmospheric data from around the North Atlantic The conclusion is that mercury levels in seawater in the North Atlantic were elevated by human activity but may now be declining likely as a result of decreased emissions from North America and Europe
A complementary approach to measuring mercury in seawater is to measure mercury in aquatic animals which accumulate and integrate mercury over time Teeth hair feathers and eggshells are useful long-term archives of mercury concentrations and can provide data from the pre-industrial period (ie before 1800) as well as more recent periods
Among marine animals samples are available from several regions particularly from the Arctic where cold dry conditions help preserve animal tissues Mercury concentrations between the 13th and 16th
centuries were relatively stable From the mid- to late 19th century to the end of the 20th century mercury levels increased by an average of 12 times On average therefore about 92 of the mercury in Arctic marine wildlife today is likely to be of anthropogenic origin
Similar findings were found for a 700-year sequence of seabird eggshells from the South China Sea Mercury levels increased steadily between 1800 and 2000 with a particularly rapid increase after 1970 Concentrations since 2000 are about 10 times higher than pre-industrial levels with 91 of the mercury now likely to be of anthropogenic origin In the Antarctic studies of seal hairs show that pre-industrial mercury levels were only 60 of recent levels The relatively small difference
28
UNEP Global Mercury Assessment 2013
Historical Hg concentration as a proportion of present-day 100
80
60
40
20
0
Beluga teeth Human teeth
Gyrfalcon feathers Perigrine falcon feathers
Polar bear hair Ringed seal teeth
1200 1300 1400 1500 1600 1700 1800 1900 2000
between pre-industrial and modern mercury levels in Antarctic is consistent with lower mercury emissions and atmospheric concentrations in the Southern Hemisphere as compared with the Northern Hemisphere
The timing of long-term increases of mercury in aquatic animals can shed light on the likely sources of mercury emissions that were responsible The industrialization of Europe and North America appear responsible for the large increases in marine mercury levels that began in the 19th century as these increases occurred prior to recent Asian industrialization As with water concentrations in the Pacific Ocean recent rapid increases in mercury in seabird eggs in the South China Sea coincide with industrialization in Asia
The time lag in aquatic ecosystem response One important conclusion from air-ocean modeling is that the oceans have not yet reached equilibrium with current atmospheric levels of mercury This lag is due to several factors First mercury stays in the upper ocean above 200 meters depth for about 30 years and for centuries in intermediate and deep waters This is much longer than the one year residence time in the lower atmosphere Thus removal from the ocean takes much longer than does removal from the air and so concentrations will change more slowly
Second because of the long lifetime of mercury in deeper ocean waters a great deal of natural mercury is present in the ocean already about 100000 tonnes out of a total of 135000 tonnes in intermediate waters and 200000 out of 220000 tonnes in deep waters
Rune Dietz
Analysis of museum samples reflects the increase in mercury emissions and releases since the mid-19th century associated with anthropogenic activities
Third vertical transport of mercury from intermediate depths back to the surface returns a substantial amount of mercury to the biologically active zone each year As a result average mercury concentrations in seawater and marine animals are likely to increase slowly for decades if not centuries even if atmospheric levels stabilize at present levels In short the effects of historical anthropogenic emissions from Europe and North America are still being observed in the oceans at the same time that the effects of the recent rise in emissions from Asia are being seen
Regionally different trends can be expected depending on distance from sources and ocean circulation patterns In the North Atlantic north of 55deg N it will take 50-600 years to achieve equilibrium between atmospheric and seawater mercury levels In the North Pacific this process is estimated to take 500-700 years and in the Antarctic 700-1000 years The Arctic Ocean by contrast is smaller and will only take about 35 years to reflect changes in atmospheric mercury levels Surface waters of the Mediterranean Sea should show also changes within 10-50 years
Time lags in the responses of many freshwaters and their food-webs to changes in atmospheric mercury levels are also expected Although some immediate recovery following reductions in atmospheric mercury deposition rates is likely full recovery may take decades centuries or longer depending on the characteristics of the area Highly polluted freshwaters with catchments and sediments containing large amounts of anthropogenic mercury will recover most slowly as is already observed around point sources such as smelters that have closed down
29
UNEP Global Mercury Assessment 2013
Major gaps in knowledge 9 Large uncertainties remain in global estimates of mercury emissions to the air These stem from various sources including the availability of information on activity levels but mainly from the lack of information concerning the mercury content of some raw materials and the validity of assumptions regarding processes and technologies employed to reduce mercury emissions including their rates of application and effectiveness The accuracy and precision of measurement-based estimates can depend on the validity of extrapolating measurements made at infrequent intervals to longer periods or measurements made at one plant to other facilities with similar operations
Potentially important emissions sectors that are still not quantified in the emissions inventory include the use of mercury in vinyl-chloride monomer production secondary metals production oil and gas extraction transport and processing industrial and hazardous waste incineration and disposal sewage sludge incineration and dental fillings preparation and removal
Current measurements and their evaluation are inadequate for determining spatial and temporal trends Improved more extensive and better coordinated measurements are needed A permanent global integrated monitoring network for atmospheric mercury and mercury deposition is needed to achieve this goal The atmospheric network sites should be closely integrated with water soil and biological monitoring networks The results can be used for model testing and evaluation as well as for more accurately detailing the geographic impact of anthropogenic emissions Monitoring of mercury concentrations in the important marine food species is essential to understanding possible human health impacts and the effects of future emissions changes
Better data on mercury distribution in the troposphere is needed to improve understanding of long-range transport and source-receptor relationships Coordinated studies at high altitudes and by aircraft are needed This information will
also help validate regional and global scale models improving their prediction capabilities with regard to different policy scenarios
Key processes related to global transport and cycling of mercury remain inadequately understood The chemical form of gaseous oxidized mercury is unknown Reduction and oxidation rates for mercury in the presence of atmospheric oxidants need further study including determining which oxidants are important New measurements and modelling studies are needed to examine key chemical and physical processes that affect global transport and cycling
Few data are available for reporting mercury releases to aquatic systems Systematic and consistent monitoring of mercury releases to the air is required especially for contaminated systems Releases of mercury from soils into waters depend greatly on climate and topography and these parameters need to be better accounted for Consistent approaches for measuring and reporting releases from point sources are needed to ensure comparability of data from around the world In particular the actual role of artisanal and small-scale gold mining (ASGM) in emissions to air and releases to water needs to be more accurately estimated
The link between mercury deposition methylation and uptake by living organisms needs further study The parameters that determine the rates of exchange of mercury compounds between air and sea air and soil and air and vegetation are not fully understood Whole-ecosystem studies of mercury are needed to better understand biogeochemical cycling Methylationdemethylation rates and their spatial and temporal variations and relationship to climatic factors need to be determined in most of worldrsquos major ocean basins as well as in representative freshwaters
30
UNEP Global Mercury Assessment 2013
Key findings of the 2013 assessment 10 Atmosphere Total anthropogenic emissions of mercury to the atmosphere in 2010 are estimated at 1960 (1010shy4070) tonnes which is about 30 of the total mercury that was emitted and re-emitted from anthropogenic and natural sources in that year The largest anthropogenic sources are associated with artisanal and small-scale gold mining (ASGM) and coal burning which together account for about 62 of the annual total anthropogenic emissions to air Other major sectors include ferrous and non-ferrous metal production and cement production
East and Southeast Asia are responsible for about 40 of global anthropogenic emissions About 75 of the mercury from this region comes from China which is about one-third of the global total Increased estimates for emissions from ASGM largely a result of newly obtained data and improved information mean that South America and Sub-Saharan Africa are also responsible for a greater proportion of global emissions than was previously assumed
Anthropogenic emissions over time have increased mercury loads present in the environment This leads to higher rates of re-emission and also means that there will be a time lag of years or decades between emissions reductions and lower mercury levels in the food web including pathways of human exposure
Mercury emissions to the atmosphere likely peaked in the 1950s to 1970s and subsequently declined because of reductions in Europe Russia and North America Emission trends are unclear due to changes in methods employed to produce inventories and differences in the sectors that have been accounted at different times There are however some indications that emissions may be rising again with increases from East Asia offsetting continuing reductions in Europe and North America
Aquatic environments Natural processes in aquatic systems convert less toxic elemental and inorganic mercury into much more toxic methylmercury Methylmercury concentrates and accumulates in the food web leading to high concentrations in some species of seafood and fish that many people eat
Anthropogenic releases of mercury to aquatic environments contribute hundreds of tonnes to the amount of mercury cycling in the environment Diffuse releases and point sources appear equally important Atmospheric deposition however remains the most important input of mercury to land and oceans and has increased the amount of mercury in many environmental compartments by a factor of two or three since the start of the industrial age On land mercury that is deposited is largely retained in soils and vegetation increasing the available pool for re-mobilisation to adjacent aquatic systems Re-emission from soils however is a major addition to atmospheric mercury
Hydrology is the most important factor in the transport of mercury from catchments to downstream environments Relatively little of this mercury reaches the open ocean as most is captured in sediments behind dams in estuaries and near the coast Changes in land cover and land use can have a large effect on mercury mobilisation as exposed soils erode and mercury leaches into the water table
Concentrations of mercury in Arctic marine animals today are about 10-12 times higher than in preshyindustrial times (ie prior to about 1800) This means that on average about 92 of the mercury in marine predators such as seabirds seals and whales is anthropogenic in origin The timing of the increase suggest that 19th and early 20th century emissions from Europe North America and Russia were responsible Increases mercury concentrations in seabirds in the South China Sea appear to be more recent than the Arctic increases coinciding with increasing industrialisation in East and Southeast Asia
31
UNEP Global Mercury Assessment 2013
K+S Entsorgung Gm
bH
Recovered mercury is being stockpiled at long-term storage sites above- and as shown here below ground
The upper 100 meters of the oceans have twice the mercury that they did a century ago Intermediate and deeper waters have 10-25 more mercury on average reflecting the slow transport of mercury downwards in the oceans Seawater concentrations will thus be especially slow in responding to changes in mercury inputs from atmospheric deposition and river flow As a result mercury concentrations in marine biota are likely to increase slowly for decades to centuries even without an increase in atmospheric emissions
In freshwater ecosystems atmospheric deposition and re-mobilisation from soils slow the reduction of mercury levels even in regions where atmospheric concentrations have decreased due to emission controls
Further increases in atmospheric emissions will have long-term consequences for commercial fisheries and all consumers of marine and freshwater foods
It is likely to be years or decades before reductions in anthropogenic emissions and releases of mercury have a demonstrable effect on mercury levels throughout the environment and in the fish and marine mammals which are part of the human food-chain This only reinforces the need to act now to continue and strengthen international efforts to reduce current mercury emissions and releases Delays in action now will inevitably lead to slower recovery of the worldrsquos ecosystems in future from mercury contamination leaving an even greater legacy of pollution for future generations
32
Division of Technology Industry and Economics (DTIE) Chemicals Branch Geneva Switzerland January 2013
Job number DTI1636GE
UNEP Global Mercury Assessment 2013
international efforts to reduce current mercury emissions and releases as delays in action now will inevitably lead to slower recovery of the worldrsquos ecosystems in future from mercury contamination
Global climate change may also complicate the response of global ecosystems to mercury emission reductions through its profound effects on many aspects of the movement and chemical transformations of mercury in the environment For example warmer temperatures may increase rates of organic productivity in freshwater and marine ecosystems and rates of bacterial activity possibly leading to faster conversion of inorganic mercury to methylmercury Thawing of the enormous areas of northern frozen peatlands may release globally-significant amounts of long-stored mercury and organic matter into Arctic lakes rivers and ocean
iv
UNEP Global Mercury Assessment 2013
Introduction
Background and mandate Global inventories for mercury emissions to air from human sources have been produced at approximately 5-year intervals since 1990 by scientific groups UNEP produced its first Global Mercury Assessment in 2002 In 2007 the Governing Council of UNEP through its decision 243 requested the Executive Director of UNEP
to prepare a report drawing on among other things ongoing work in other forums addressing
(a) Best available data on mercury atmospheric emissions and trends including where possible an analysis by country region and sector including a consideration of factors driving such trends and applicable regulatory mechanisms
(b) Current results from modelling on a global scale and from other information sources on the contribution of regional emissions to deposition which may result in adverse effects and the potential benefits from reducing such emissions taking into account the efforts of the Fate and Transport partnership established under the United Nations Environment Programme mercury programme
The results of this request were presented as a summary report entitled ldquoThe Global Atmospheric Mercury Assessment Sources Emissions and Transportrdquo released in December 2008 and an accompanying ldquoTechnical Background Report to the Global Atmospheric Mercury Assessmentrdquo
The technical background report which formed the basis for statements made in the summary report and was prepared in cooperation with the Arctic Monitoring and Assessment Programme (AMAP) Secretariat included an updated inventory of anthropogenic emissions of mercury to the atmosphere The inventory was based on national emissions data for the year 2005 submitted by governments as well as estimates prepared for countries that did not provide data and was coordinated with work related to mercury under the UN Economic Commission for Europe Convention
1
UNEPrsquos 2008 Global Atmospheric Mercury Assessment Report
on Long-range Transboundary Air Pollution (LRTAP) The report also drew on the work of the UNEP Global Mercury Partnership in particular the Mercury Air Transport and Fate Research partnership area
In 2009 the Governing Council of UNEP through its Decision 255 paragraph 36 requested the Executive Director of UNEP
hellip in consultation with Governments to update the 2008 report entitled Global Atmospheric Mercury Assessment Sources Emissions and Transport for consideration by the Governing CouncilGlobal Ministerial Environment Forum at its twenty-seventh session
This updated Global Mercury Assessment 2013 and its accompanying and updated Technical Background Report are the response to that Governing Council request
Developing the 2013 Report As in 2008 the Technical Background Report for the Global Mercury Assessment 2013 forms the basis for the statements made in the Summary
1
UNEP Global Mercury Assessment 2013
Report and is fully referenced according to standard scientific practice As such it is the single reference for the Summary Report It has again been prepared in co-operation with the Arctic Monitoring and Assessment Programme (AMAP) and uses national data and information submitted by several governments Contributions have also been incorporated from the UNEP Global Mercury Partnership in particular its partnership areas on mercury control from coal combustion reducing mercury in artisanal and small-scale gold mining (ASGM) and mercury air transport and fate AMAP mercury expert group UN Economic Commission for Europe (UN ECE) Long-range Transboundary Air Pollution (LRTAP) Convention groups industry and non-governmental organizations Each section was prepared by a team of experts and then reviewed to ensure its scientific accuracy The evaluation of information of mercury released into the aquatic environment benefits from contributions from the Group of Experts on Scientific Aspects of Marine Environmental Protection (GESAMP)
Scope and coverage This update to the Global Mercury Assessment provides the most recent information available for the worldwide emissions releases and transport of mercury in atmospheric and aquatic environments To the extent possible the information comes from the published scientific literature supplemented where necessary by other sources Since the Global Mercury Assessment is intended as a basis for decision making emphasis is given to anthropogenic emissions (mercury going into the atmosphere) and releases (mercury going into water and land) that is those associated with human activities
The Technical Background Report includes a detailed inventory of global mercury emissions to air based on data for 2010 ldquoInventoryrdquo in this context means a compilation of the estimated emissions and releases from various sectors and sources While it attempts to catalogue all major sources of mercury emissions worldwide it should not be regarded as complete and exhaustive
In addition for the first time this Global Mercury Assessment includes an evaluation of information of mercury released into the aquatic environment and its associated pathways and fate The information available for this evaluation is less complete than
that for emissions to air and is based on data from recent years The inclusion of this new element of the Global Mercury Assessment is as a response to the requests from many governments in the Intergovernmental Negotiating Committee (INC) for more information on releases to land and water The aquatic environment is the main route of exposure to humans and wildlife because it is in water that inorganic mercury is transformed into highly toxic methylmercury
The Technical Background Report includes chapters on
bull Global Emissions of Mercury to the Atmosphere describing sources anthropogenic emissions and trends in emissions bull Atmospheric Pathways Transport and Fate
examining pathways levels and trends in air and deposition and modelling of pathways and deposition bull Global Releases of Mercury to Aquatic Environments
containing global estimates of releases to water and bull Aquatic Pathways Transport and Fate examining
mercury pathways in aquatic systems that result in important routes of human exposure
Technical Background Report chapters were prepared by teams of experts and then reviewed to ensure their scientific validity This Summary Report is based on the content of the Technical Background Report and has been reviewed by the authors of the Technical Background Report It was also circulated for national review
This Summary Report provides in Chapter 2 an overview of natural and anthropogenic sources of mercury outlining the main sectors involved The global inventory of anthropogenic emissions to air is presented in Chapter 3 and Chapter 4 describes trends in mercury emissions to the atmosphere What happens after mercury is released to the atmosphere is covered in Chapter 5 on atmospheric chemistry monitoring and deposition and Chapter 6 on atmospheric concentrations and deposition Chapter 7 provides a first attempt to estimate global releases to water followed in Chapter 8 by a discussion of aquatic pathways transformations and fate A review of gaps in knowledge is given in Chapter 9 Chapter 10 summarizes key findings
2
UNEP Global Mercury Assessment 2013
Whatrsquos new in the Global Mercury Assessment 2013 Global mercury emissions inventories continue to improve as new data and better data become available concerning some sources The method for compiling the inventory of anthropogenic emissions to the atmosphere has also been revised and improved Differences in air pollution control technologies and differences in the mercury content of raw materials and fuels in different countries and regions have been factored into emissions calculations to better reflect actual conditions in each country
In the Global Mercury Assessment 2013 a new updated inventory based on data from 2010 is presented in which some new sources (including emissions from combustion of natural gas and primary aluminium production and emissions associated with oil refining) have been quantified for the first time A more detailed analysis has also been made of some of the major mercury emission sectors including the break-down of emissions from coal burning in power plants industrial and other uses In addition new information acquired through the UNEP Global Mercury Partnership area on Reducing Mercury in Artisanal and Small-scale Gold Mining in particular from the Artisanal Gold Council has resulted in a significant re-evaluation of emissions from the ASGM sector
New observational data and new modelling results provide fresh insight into atmospheric mercury transport and fate
Kevin Telmer
One of the objectives of the updated assessment has been to provide transparent documentation and comprehensive compilations of the data that form the basis for all of the estimates presented This approach will allow a more consistent and replicable method for compiling the global mercury emission inventory so that valid comparisons can be made in the future In addition a wider range of experts from around the world have been involved in preparing the Technical Background Report on which this summary is based
The inclusion of an assessment of releases of mercury to the aquatic environment and its subsequent pathways and fate is a further significant development as these topics were not addressed in the 2008 UNEP Global Atmospheric Mercury Assessment The aquatic environment is critical for three reasons
bull Hundreds of tonnes of mercury is released directly into water so an inventory limited to mercury emissions to air provides an incomplete assessment of anthropogenic impacts on the mercury cycle
bull Mercury in aquatic environments can be transformed into methylmercury which is far more toxic to humans and animals and can enter and biomagnify in food webs more readily than other forms of mercury bull Much human exposure to mercury is through
the consumption of fish and other marine foods making aquatic pathways the critical link to human health
A large open artisanal and small-scale gold mining pit
3
UNEP Global Mercury Assessment 2013
Sources of mercury emissions to air and releases to water 2 Mercury is a naturally occurring element and is found throughout the world There are thus many natural sources of mercury creating background environmental levels that have been present since long before humans appeared
Mercury is contained in many minerals including cinnabar an ore mined to produce mercury Much of the present day demand for mercury is met by supply from mercury recovered from industrial sources and stockpiles rather than from mercury mining Mercury is also present as an impurity in many other economically valuable minerals in particular the non-ferrous metals and in fossil fuels coal in particular
Human activity especially mining and the burning of coal has increased the mobilization of mercury into the environment raising the amounts in the atmosphere soils fresh waters and oceans The majority of these human emissions and releases of mercury have occurred since 1800 associated with the industrial revolution based on coal burning base-metal ore smelting and gold rushes in various parts of the world To some extent the same drivers of mercury emissions and releases are continuing with fossil-fuel-based energy generation powering industrial and economic growth in Asia and South America which in turn helps drive high demand for metals including gold spurring artisanal and small-scale gold mining (ASGM) around the world
In preparing inventories of mercury emissions and releases it is important to distinguish various categories of sources Three main types of emissions and releases can be distinguished each of which is briefly introduced here in qualitative terms with particular emphasis on anthropogenic sources
Natural sources of mercury emissions and releases Mercury in the earthrsquos crust can be emitted and released in several ways to air water and land Natural weathering of mercury-containing rocks
farbled Shutterstockcom
Cinnabar the principal ore of mercury
Year 2000
1950
1900
1850
1800
1750
1700
Mt St Helens (1980)
Industrial period
WWII manufacturing
Krakalau (1883)
Gold rush (circa 1850-84)
Tambora (1815)
Pre-industrial period
1998 core 1991 core Natural background Natural events (volcanic eruptions) Localregional anthropogenic sources Global anthropogenic (industrialization)
0 5 10 15 20 25 30 35 40 Total mercury ngL
Ice core record of deposition from Wyoming USA The elevated levels associated with the 1850-84 US gold rush probably reflect localregional sources rather than a global signature Increasing environmental levels of mercury associated with industrialization however are found in environmental archives like this ice core around the globe
4
UNEP Global Mercury Assessment 2013
Global mercury cycling Mercury is released to the environment from natural sources and processes and as a result of human activities Once it has entered the environment mercury cycles between air land and water until it is eventually removed from the system through burial in deep ocean sediments or lake sediments and
through entrapment in stable mineral compounds Methylmercury the most toxic and bioaccumulative form of mercury which presents the greatest health risk to humans and wildlife is mainly formed in aquatic environments through natural microbial processes
80shy600
3700
2000shy2950
2000 300shy600
1700shy2800
3200
380
lt600
Geogenic Anthropogenic
Anthropogenic Biomass burning
Soil and vegetation
Deposition to oceans
Rivers
Deposition to land
freshwater
Geogenic
Oceans
Anthropogenic
Natural
Re-emissions Re-mobilization
Units tonnes
1 tonne = 1000 kilograms
Global mercury budgets based on models illustrate the main environmental compartments and pathways that are of importance in the global mercury cycle and the ways in which natural and anthropogenic releases to air land and water move between these compartments Emissions to air arise from natural sources and anthropogenic sources as well as re-emissions of mercury previously deposited from air onto soils surface waters and vegetation
is continuous and ubiquitous allowing mercury to escape to air and to be washed into lakes and rivers Volcanoes emit and release mercury when they erupt Geothermal activity can also take mercury from underground and emit it to the atmosphere and release it to the deep oceans Some recent models of the flow of mercury through the environment suggest that natural sources account for about 10 of the estimated 5500-8900 tonnes of mercury currently being emitted and re-emitted to the atmosphere from all sources
onime Shutterstockcom
5
UNEP Global Mercury Assessment 2013
Anthropogenic sources of mercury emissions and releases Anthropogenic sources of mercury emissions account for about 30 of the total amount of mercury entering the atmosphere each year
As found in previous global mercury assessments the main industrial sources of atmospheric mercury are coal burning mining industrial activities that process ores to produce various metals or process other raw materials to produce cement In these activities mercury is emitted because it is present as an impurity in fuels and raw materials In these cases mercury emissions and releases are sometimes referred to as lsquoby-productrsquo or lsquounintentionalrsquo emissions or releases A second category of sources includes sectors where mercury is used intentionally Artisanal and small-scale gold mining (ASGM) is the largest of these in which mercury emissions and releases result from the intentional use of mercury to extract gold from rocks soils and sediments Other intentional-use release sectors include waste from consumer products (including metal recycling) the chlor-alkali industry and the production of vinyl-chloride monomer
Coal burning and to a lesser extent the use of other fossil fuels is one of the most significant anthropogenic source of mercury emissions to the atmosphere Coal does not contain high concentrations of mercury but the combination of the large volume of coal burned and the fact that a significant portion of the mercury present in coal is emitted to the atmosphere yield large overall emissions from this sector The mercury content of coal varies widely introducing a high degree of uncertainty in estimating mercury emissions from coal burning Data on mercury content is now available from many countries including major emitters of mercury
Mining smelting and production of iron and non-ferrous metals are also a large source of global mercury emissions to air and also a very important sector with regard to releases to water In the mining and processing of metals most of the mercury is captured and either stockpiled or sold for use in various products creating anthropogenic sources associated with intentional use discussed below Nonetheless the volume of ores and metals involved result in large total emissions and releases The relatively small volume of primary mercury production makes mercury mining a far smaller source today than it has been in the past
Cement production which typically involves the burning of fossil fuels to heat the materials required to make cement is another major anthropogenic source of mercury emissions Both the raw materials and the fuel may contain mercury and lead to emissions The amount of mercury involved varies greatly with the mercury content of these fuels and especially with the raw materials In some countries cement kilns are burning increasing amounts of alternative fuels including wastes that may contain mercury This may add to the emissions from cement kilns
Oil refining emits and releases mercury as oil deposits are known to contain mercury generally at low concentrations Mercury is removed from most petroleum products and natural gas prior to combustion and therefore combustion-related emissions are low Most of the mercury in crude oil is associated with solid waste that is disposed of in landfills However emissions and releases during refining of crude oil do occur and these have been quantified for the first time in the 2010 inventory The inventory does not quantify other emissions and releases during oil and gas extraction and transport or from flaring
Unintentional mercury emissions from these sectors can be reduced by the application of pollution control measures at power plants and industrial plants Some of the mercury captured is refined and enters the commercial supply chain however large amounts of mercury captured in materials such as fly ash and oil refinery waste need to be disposed of Some of the resulting wastes are themselves used as raw materials for example in construction materials but large amounts are disposed of in landfills which can thus become a potential source of mercury emissions and releases
Among intentional-use sectors Artisanal and small-scale gold mining is a major source for emissions and releases of mercury worldwide In ASGM miners use mercury to create an amalgam separating gold from other materials They then have to separate the mercury from the gold Calculating emissions from this sector presents a particular challenge because it is typically widely dispersed and often unregulated and may be illegal Uncertainties regarding release estimates from the ASGM sector are therefore high Furthermore the miners are typically poor and perhaps have little awareness of the hazards of mercury and pollution control devices may be hard to obtain
Wastes from consumer products containing mercury can end up in landfills or incinerators
6
UNEP Global Mercury Assessment 2013
Mercury is still used in a wide range of products including batteries paints switches electrical and electronic devices thermometers blood-pressure gauges fluorescent and energy-saving lamps pesticides fungicides medicines and cosmetics Once used many of the products and the mercury they contain enter waste streams While mercury in landfills may slowly become re-mobilized to the environment waste that is incinerated can be a major source of atmospheric mercury especially from uncontrolled incineration Incinerators with state-of-the-art controls have low emissions
Another use of mercury is in dental amalgam for filling teeth When bodies are cremated mercury in fillings can be emitted Mercury can also be emitted and released during production and preparation of fillings and from the disposal or removed fillings In addition mercury from removed fillings can be recycled or go into solid waste and wastewater
The amount of mercury released in the recycling of scrap metals for example in secondary steel and nonshyferrous metal production is generally assumed to be much lower than that released during primary metal production which is why the present global inventory only addresses primary metal production However lower emissions from recycling may not be the case in all countries Much of the scrap steel in some countries comes from automobiles that may still have devices that contain mercury and which may not be removed prior to recycling of the steel These devices are largely being phased out so mercury emissions from scrap steel may be expected to decrease However large differences exist between countries in the way they treat their mercury-containing wastes including scrap metals that are recycled in secondary metal production
Mercury is also used in a number of industrial processes A major industrial use is in the chlor-alkali industry where mercury-cell technology may be used in the production of chlorine and caustic soda
Mercury is also used as a catalyst in the production of vinyl chloride monomer (VCM) from acetylene mainly in China
Mercury releases to aquatic systems as a result of current human activities arise from many of the same uses or the presence of mercury in various products and processes that emit mercury to the air As with emissions to the atmosphere aquatic releases come from two main sources First mercury is released with water effluent from the sites where mercury is used Second mercury can leach into water from disposal sites that have mercury in the waste
zhu difeng Shutterstockcom
Tomas Pavelka Shutterstockcom
bikeriderlondon Shutterstockcom
Anthropogenic sources of mercury from industry and intentional use
Gunnar Futsaelig
ter
7
UNEP Global Mercury Assessment 2013
Arnold John Labrentz Shutterstockcom
Re-emission and re-mobilization of mercury Re-emissions constitute the third category of sources presently comprising about 60 of mercury emissions to air Mercury previously deposited from air onto soils surface waters and vegetation from past emissions can be emitted back to the air Re-emission is a result of natural processes that convert inorganic and organic forms of mercury to elemental mercury which is volatile and therefore readily returns to the air Mercury deposited to plant surfaces can be re-emitted during forest fires or biomass burning Mercury may be deposited and re-emitted many times as it cycles through the environment
It is important that re-emitted mercury should not be considered a natural source It may originally have come from natural or anthropogenic sources but by the time it is re-emitted it is difficult or impossible to identify its specific origin Nonetheless human activity has increased the environmental burden of mercury resulting in higher levels of re-emission This is compounded by changes in land use practices as well as increasing temperatures due to climate change
In the aquatic environment re-mobilization of mercury occurs when mercury deposited on and accumulated in soils or sediments is re-mobilized by for example rain or floods that cause the mercury to enter or re-enter the aquatic system Resuspension
of aquatic sediments due to wave action or storm events is an additional way for mercury to re-enter the aquatic ecosystems
Estimating re-emission and re-mobilization rates is difficult It is often done using modelling approaches These models are based on data on atmospheric levels and other observations as well as current understanding of chemical transformations and other processes that determine how mercury moves between air land and water The models aim to balance the amount of mercury in circulation at any given time while remaining consistent with observational data Temperature is a key factor With lower temperatures re-emission rates are generally lower
Re-emission is also a major factor in determining the length of time needed for anthropogenic emission reductions to be reflected in decreasing environmental levels of mercury Mercury emitted in one year may be deposited to and retained in soils and waters for some time before being re-emitted or re-mobilized in subsequent years This cycle can be repeated keeping levels in air and water elevated even after anthropogenic sources have been lowered Conversely continuing to add to the global pool will leave an ever-longer legacy of anthropogenic mercury contamination worldwide It is thus imperative that international efforts to reduce mercury emissions continue and are strengthened as soon as possible
Forest fires re-emit mercury deposited to vegetation
8
UNEP Global Mercury Assessment 2013
Anthropogenic emissions to the atmosphere 3 Global emissions inventory The global emissions inventory for 2010 estimates that 1960 tonnes of mercury was emitted to the atmosphere as a direct result of human activity The leading sectors remain the same as those identified in the 2005 inventory Improved data however have changed the relative contributions of some of these sectors as have some actual changes in emissions All coal burning emissions taken together for example represent a lower percentage of the total emissions than in the 2005 inventory This is due in part to the increased estimates from artisanal and small-scale gold mining (ASGM) and in part to much lower estimates for domestic use of coal When the actual amount of mercury emitted from coal combustions in power generation and industrial uses is considered and the estimates are based on the same 2010 methodology the emissions in 2010 are the same and perhaps slightly higher than in 2005 Even though new coal-fired power plants are being built combustion efficiency and emissions controls are also improving in most parts of the world
Results by selected sector The updated inventory of emissions to air confirms coal burning as a continuing major source of emissions responsible for some 475 tonnes of mercury emissions to air annually compared with around 10 tonnes from combustion of other fossil fuels According to the new inventory more than 85 of these emissions are from coal burning in power generation and industrial uses In the previous assessment emissions from domestic and residential coal burning were highlighted as a possible larger contribution Better information on coal consumption for domestic and residential uses indicates that these activities are a smaller contribution to total emissions from coal burning than previously thought
Emissions from the cement production industry are largely dependent on the raw materials and the fuels used The new inventory avoids double
Emissions from various sectors in tonnes per year with the range of the estimate and as a percentage of total anthropogenic emissions Note These numbers cannot be compared directly with those presented in the 2008 assessment (see Chapter 4 Trends in mercury emissions to the atmosphere)
Sector Emission (range) tonnes
By-product or unintentional emissions
Fossil fuel burning
Coal burning (all uses) 474 (304 - 678) 24
Oil and natural gas burning 99 (45 ndash 163) 1
Mining smelting amp production of metals
Primary production of 455 (205 ndash 241) 2 ferrous metals
Primary production of nonshy 193 (82 ndash 660) 10 ferrous metals (Al Cu Pb Zn)
Large-scale gold production 973 (07 ndash 247) 5
Mine production of mercury 117 (69 ndash 178) lt1
Cement production 173 (655 - 646) 9
Oil refining 16 (73 - 264) 1
Contaminated sites 825 (70 - 95) 4
Intentional uses
Artisanal and small-scale 727 (410 ndash 1040) 37 gold mining
Chlor-alkali industry 284 (102 ndash 547) 1
Consumer product waste 956 (237 ndash 330) 5
Cremation (dental amalgam) 36 (09 - 119) lt1
Grand Total 1960 (1010 ndash 4070) 100
Values rounded to 3 significant figures To nearest percent
Sectors for which emissions are not currently quantified
biofuel production and combustion
vinyl-chloride monomer production emissions during
secondary metals production and ferro-alloys
oil and gas extraction transport and processing other than refinery emissions
industrial some hazardous waste incineration and disposal
sewage sludge incineration
preparation of dental amalgam fillings and disposal of removed fillings containing mercury
9
UNEP Global Mercury Assessment 2013
Disposal of waste from
Mercury-cell chlor-alkali
industry
Relative contributions to estimated emissions to air from anthropogenic sources in 2010
Oil refining
Coal combustion
Oil and natural gas combustion
Primary ferrous metal production
Primary non-ferrous metal (Al Cu Pb Zn)
Large-scale gold production
Hg production Cement production
mercury-containing products
Contaminated sites
Cremation
Artisanal and small-scale gold production
counting of emissions from conventional fuels (such as coal and oil) that are included under the industrial fossil fuel burning emissions However it does attempt to account for emissions from other fuels including alternative fuels (such as old tyres and other wastes) and from raw materials Increasing amounts of waste are being co-incinerated in the cement industry both as fuel but also in some plants as a means of disposing of hazardous wastes some of which may contain mercury In some regions additional measures are being introduced to make sure that mercury emissions associated with waste co-incineration do not increase overall emissions from cement plants
Increased application of air pollution control devices including some mercury-specific technologies together with more stringent regulations in several countries have the effect of reducing mercury emissions from coal burning sectors and thus offset some part of the emissions arising from increased activity
Artisanal and small-scale gold mining emissions are in the 2010 inventory the major source of emissions to air at 727 tonnes per year The reasons for the large increase in the estimate compared to 2005 are discussed below (see page 16) The global estimate for emissions from ASGM includes a significant contribution from China although
recent information on this sector in China is lacking China prohibited ASGM in 1996 and therefore records no emissions from this sector
Mercury-cell technology is becoming less common in the chlor-alkali industry as other more cost-effective processes are adopted No new plants are being constructed though many older plants remain to be converted Old chlor-alkali plants and other decommissioned industrial sites may constitute contaminated sites that continue to release mercury to the environment for many years and emissions from contaminated sites are now part of the inventory
Global emissions from use of mercury in dental amalgam resulting from cremation of human remains are estimated at 36 (09 ndash 119) tonnes in 2010 Some 340 tonnes of mercury is used per year in dentistry of which about 70-100 tonnes (ie 20shy30) likely enters the solid waste stream
In the production of vinyl chloride monomer information is still lacking on the lifecycle and eventual fate of the mercury catalyst Most of this production occurs in China and about 800 tonnes of mercury is thought to have been used by this industry in China in 2012 Used mercury catalyst is recycled and reused by enterprises that hold permits for hazardous waste management The amounts that may be emitted or released are unknown
Ronald de Hom
mel
Artisanal and small-scale gold mining Unlike most small-scale gold miners the green gold miners of Oro Verde shown here employ an environmental way of mining gold that does not use mercury or other chemicals
10
UNEP Global Mercury Assessment 2013
Results by region The greatest proportion of anthropogenic mercury emissions to the atmosphere comes from Asia which contributes about 50 of the global total The majority of Asian emissions come from East and Southeast Asia China accounts for three-quarters of East and Southeast Asian emissions or about one third of the global total
New data on emissions from ASGM have increased the proportion of global emissions attributed to South America and Sub-Saharan Africa largely due to increased estimates associated with improved information about ASGM activities in these areas
Emissions to air from other major source sectors are higher in Europe North America and Oceania
Mercury emission 2010 gkm2
0 2 5 10 100 1000
Global distribution of anthropogenic mercury emissions to air in 2010
Emissions from various regions in tonnes per year with the range of the estimate and as a percentage of total global anthropogenic emissions Note These numbers cannot be compared directly with those presented in the 2008 assessment (see Chapter 4 Trends in mercury emissions to the atmosphere)
See figure on the following Region Emission (range) tonnes page for map with
Australia New Zealand amp Oceania 223 (54 - 527) 11 specification of regions Values rounded to 3 Central America and the Caribbean 472 (197 - 974) 24
significant figures CIS amp other European countries 115 (426 - 289) 59
East and Southeast Asia 777 (395 - 1690) 397
European Union (EU27) 875 (445 - 226) 45
Middle Eastern States 370 (161 - 106) 19
North Africa 136 (48 - 412) 07
North America 607 (343 - 139) 31
South America 245 (128 - 465) 125
South Asia 154 (782 - 358) 79
Sub-Saharan Africa 316 (168 - 514) 161
Undefined (global total for emissions from 825 (700 - 950) 42 contaminated sites)
Grand Total 1960 (1010 ndash 4070) 100
11
UNEP Global Mercury Assessment 2013
North America
Central America and the Caribbean
South America
Unintentional emissions
Stationary combustion (coal)
Stationary combustion (oil and gas) Oil refining
Pig iron and steel
Intentional uses
Artisanal and small-scale gold mining Chlor-alkali
EU27
North Africa
Sub-Saharan Africa
Non-ferrous metals (Cu Pb Zn Al) Mercury
Large-scale gold
Cement
Product waste
Cremation
CIS amp other European countries
500
100
Middle Eastern States East and Southeast Asia
50
10 tonnes
South Asia Australia New Zealand amp Oceania
South America
North America
Central America and the Caribbean
Sub-Saharan Africa
South Asia North Africa
Middle Eastern States
EU
East and Southeast Asia
CIS amp other European countries
Australia New Zealand amp Oceania
Estimates of 2010 anthropogenic mercury emissions to air from different main sectors in different regions ASGM is shown separately to highlight its geographic distribution and better allow regional comparisons to be made for other sectors
12
UNEP Global Mercury Assessment 2013
Compiling the 2010 inventory of anthropogenic mercury emissions to air The inventories used in successive Global Mercury Assessments continue to improve as better data become available The 2013 update presents an inventory of emissions for 2010 that has a number of improvements over the 2008 assessment and its inventory for 2005
bull A more detailed analysis of emissions from some major source sectors For example fossil fuel consumption is now broken down into categories for combustion in power plants industry and other uses The type of coal or oil used is also considered providing a more accurate estimate of mercury emissions
bull A more detailed consideration of the mercury content of fuels and raw materials used in different countries and regions bull New and updated information on ASGM bull The use of different pollution control technologies
in different countries and regions have been factored into the emissions estimate bull Emission estimates for sectors not previously
included such as aluminium production oil refining and contaminated sites bull More and better information on location of major
point sources such as individual power plants smelters and cement kilns bull Better documentation and greater transparency
with respect to the data and information behind the estimates
The methods for estimating emissions from industrial sectors is complemented by other methods used for more dispersed emissions sources For example estimating emissions from some intentional-use sectors requires intensive work with those sectors Relevant and accurate information about ASGM is generally not available through official channels Estimating mercury emissions from its intentional use in lighting batteries and other products requires analysing the entire production use and waste stream to determine where mercury is likely to be released and in what quantities The approach used in the 2013 assessment addresses the emissions from breakages and wastes resulting from use of these mercury-containing products in society the majority of
which are incinerated or end up in landfills It does not however address industrial wastes or sewage sludge incineration
Uncertainties in emission estimates Estimates of mercury emissions are just that estimates To compile a global assessment requires making a number of assumptions and generalizations Uncertainty associated with the 2010 inventory arises from each of the factors used to estimate the emissions the correctness of the activity data the validity of the emission factors applied and the validity of assumptions regarding the effectiveness and use of emission-control technologies
Based on an evaluation of these sources of uncertainty and the relative contributions of sectors with reliable information and those with less reliable data uncertainty in the 2010 inventory assessment of total anthropogenic mercury emissions to air gives a range of emissions from 1010-4070 tonnes This range is greater than that reported in some previous assessments reflecting a greater appreciation of the sources of uncertainty due to the improved estimation methods and perhaps a more realistic appraisal of the state of knowledge concerning some aspects of emissions
The best estimate taking a conservative approach is 1960 tonnes If nationally produced estimates for 2010 available from some countries (Canada Japan Korea Mexico the United States and European countries reporting to LRTAP) are introduced into the global inventory in place of the inventory estimates the corresponding estimated total global anthropogenic emission to air is 1940 tonnes As most national inventories do not include uncertainty ranges it is not possible to assign a range to this number The recognition of uncertainties is an important consideration and presenting single national estimates can convey a misleading picture of what is known and more importantly not known about emissions
The numbers derived using the methods employed to produce the global inventory for 2010 were compared with a number of national inventories and emissions reported under other systems covering the same period In general the level of agreement was good in particular when the significant uncertainties
13
UNEP Global Mercury Assessment 2013
Methods for estimating emissions All global mercury emissions inventories to date have used the same basic approach for the major sectors emitting mercury to the atmosphere For specific emission sectors national emissions estimates are calculated by multiplying the amount of activity (ie amounts of fuels burned raw materials consumed or materials produced) by an emission factor that is an estimate of the mercury emitted per unit of activity For example emissions from coal-fired power generation are estimated by multiplying the tonnes of coal used by the amount of mercury estimated to be released per tonne of coal In most such inventories ldquoabatedrdquo emission factors have been employed to quantify both the emissions of mercury that occur during the processes and the effects of mercury emission controls In the new methodology used to develop the 2013 report these components are split ldquoUnabatedrdquo emission factors are employed to quantify the emissions and ldquotechnology profilesrdquo have been developed to represent the effects of mercury emission controls
Various methods are employed to estimate emissions of mercury at individual sources and at national regional and global levels In general the methods fall under one of two main categories
bull Mass-balancesubstance-flow based estimates which are based on the principle that what goes in must come out Amounts of mercury in fuels and raw materials constitute the inputs and the outputs are the amounts of mercury emitted to air released to water or land retained in products or in wastes or otherwise recovered and stored or disposed of
involved in both global and national estimates are taken into account It is important to note that there are good reasons why estimates of mercury emissions produced in the 2010 inventory may not fully agree with national inventories made by countries using other methodologies These reasons include
bull Reporting schemes may define and distinguish emissions source sectors in very different ways and aligning these sectors may not be possible
bull Industry reporting to national government may be limited to sources with emissions above a certain threshold level so that emissions from smaller sources below the threshold are not reported Where smaller sources make up a significant part of the source category reported inventories
bull Measurement-based estimates which rely on measurements made at appropriate points in the industrial process or in the productwaste output streams These measurements are used to estimate where the mercury goes as in the method above
In principle the two approaches should produce the same results In practice mass-balance based approaches tend to result in higher emission estimates than most measurement-based estimates Since future emissions reporting is likely to involve a combination of these two approaches further work is required to understand why results may differ and to reconcile the two approaches
Since the 2008 UNEP assessment was produced the number of direct measurements of emissions from certain point sources (in particular power plants and some metal and cement production plants and waste incineration facilities) has increased considerably resulting in a much improved knowledge base
A number of countries require regular reporting of emissions Increasing use is being made in these reporting systems of measurement-based estimates and facility-level reporting in particular for major point sources In other countries national mercury emissions are only being quantified for the first time Since 2005 and the start of the UNEP negotiating process in 2010 many countries have initiated work on national emission inventories which in several cases have yielded much improved information on activity data sector characteristics and mercury emissions Such inventories often make use of the UNEP Toolkit for identification and quantification of mercury emissions
may therefore significantly underestimate total mercury emissions bull National inventories in some countries are making
increasing use of actual measurements of mercury emissions at individual facilities At the global scale it is not yet feasible to base an inventory on individual site emissions Furthermore actual measurements of mercury emissions at a source may be taken only a few times during a year and may not be fully representative of normal operations In the 2013 assessment a mass-balance based approach was employed to be consistent transparent and replicable bull National reporting and monitoring schemes
may provide information that is not available to externally produced inventories
14
UNEP Global Mercury Assessment 2013
Despite these considerations most of the discrepancies noted between the 2010 inventory mass-balance-based estimates and national estimates based on measurement- approaches are modest and within the margins of error associated with the different approaches In cases where the differences are larger it is important to recognize that there are sources of error in all methods for estimating mercury emissions
Gunnar Futsaelig
ter
Sampling of mercury emissions at the Kendal coal-fired power plant in South Africa conducted under a UNEP project A probe with mercury traps is inserted into a sampling port in the stack to collect mercury present in the flue gas The mercury traps are subsequently analysed according to the US EPA Mercury Monitoring Toolkit sampling protocol
15
UNEP Global Mercury Assessment 2013
Trends in mercury emissions to the atmosphere 4 Assessing global and sectoral trends A key question in assessing anthropogenic mercury emissions worldwide is whether they are increasing or decreasing While it is tempting simply to compare the 2010 inventory with its 2005 counterpart the results would mean little As inventory methods develop and as additional sources are considered the estimate of total anthropogenic mercury emissions worldwide also changes While some changes reflect real trends others reflect changes in methods or scope Thus comparing the results of previous assessments with the present update requires considerable care and involves an understanding of the way in which these inventories have been produced and the uncertainties associated with them
It is possible however to compare certain sectors over time by attempting to compensate for any methodological changes between the various inventories since 1990
Emissions to air are thought to have peaked in the 1970s From 1990 to 2005 total anthropogenic emissions of mercury to the atmosphere appear to
Emissions to air t
1400
1200
1000
800
600
400
200
0
1990
1995
2000
2005
Africa Asia Europe Russia North Oceania South America America
Estimates of annual anthropogenic mercury emissions from different continentsregions 1990-2005
have been relatively stable with decreases in Europe and North America being offset by increases in Asia A reanalysis of the available inventories since 1990 however indicates that emissions from industrial sectors at least may be starting to increase again
The changes introduced in the 2010 inventory methodology prevent a straight-forward continuation of this analysis However an evaluation of trends for some sectors between 2005 and 2010 has been made by applying the new methodology to activity data for 2005 This comparison suggests a further slight increase in the combined amount of mercury emitted by industrial sectors (coal combustion production of cement pig iron and steel and non-ferrous metals) The following paragraphs describe the trend results for three sectors to illustrate some of the developments between 2005 and 2010 and some of the the difficulties in comparing emissions estimates between different years made with different methods
Coal burning for power generation and for industrial purposes continues to increase especially in Asia However increases in the application of air pollution controls including some mercury specific technologies together with more stringent regulations in a number of countries have reduced mercury emissions from coal burning in power plants in particular and thus offset some part of the emissions arising from increased coal consumption
In the United States for example emissions from coal burning at power plants have reportedly decreased from about 53 tonnes in 2005 to 27 tonnes in 2010 This decrease is largely due to new regulations that have resulted in changes in the sources of the coal that is burned in large power plants and the installation of mercury controls as well as controls on sulphur dioxide and particulates that have the co-benefit of further reducing mercury emissions
In China many of the new coal-fired power plants have state-of-the-art pollution controls installed
Emissions of mercury from artisanal and small-scale gold mining (ASGM) reported for 2010 are more than twice those reported for 2005 While the
16
UNEP Global Mercury Assessment 2013
Unintentional emission sectors Coal burning ferrous- and non-ferrous (Au Cu Hg Pb Zn) metal production cement production Intentional-use sectors Disposal and incineration of product waste cremation emissions chlor-alkali industry
Comparison of emissions in 2005 and 2010 by selected sector and region
Unintentional emission sectors
Emission t
1000
800
600
400
200
0 2005 2010
Australia New Zealand amp Oceania
Central America and the Caribbean
CIS amp other European countries
East and Southeast Asia
rise in the price of gold (from USD 400 per ounce in 2005 to USD 1100 per ounce in 2010) along with increased rural poverty may indeed have caused more activity in this sector the increased estimate for mercury emissions is considered to be due primarily to some more and better data from many countries and regions West Africa for example was regarded as having minimal ASGM in 2005 but is now recognized as a region with considerable activity Thus the baseline has improved without necessarily any change in actual activity or emission levels
Waste from consumer products is affected by the amount of mercury used For most products in which mercury is used mercury-free alternatives exist Consequently many of these uses of mercury are declining at least in some regions as alternative products or processes are adopted Compact fluorescent light bulbs are an exception Even though the mercury content of individual light bulbs has decreased use of this type of light bulb is increasing rapidly
Artisanal and small-scale gold mining Intentional-use sectors
1000 1000
Step change from 2005 to 2010 due to new information 800 800 (under-estimation in 2005)
600 600
400 400
200 200
0 0 2005 2010 2005 2010
European Union (EU27) South America
Middle Eastern States South Asia
North Africa Sub-Saharan Africa
North America
In order to make valid assessments of trends in emissions from global inventories comparable data on activity levels are required together with information on changes in fuel and raw material characteristics and applied air pollution control technology One aim of the 2010 inventory methods is to create a firmer foundation for such future trend analysis
Ralf Siemieniec Shutterstockcom
Use of mercury-containing energy-saving lamps is increasing
17
UNEP Global Mercury Assessment 2013
Emission scenarios and future trends The 2008 Global Atmospheric Mercury Assessment included a first attempt at projecting future emissions inventories These were based on three scenarios continuing with the status quo applying current emissions controls worldwide and achieving maximum feasible technological reductions At the time this effort was regarded as highly provisional Since then additional studies have extended and improved this work but the results are not markedly different from earlier projections of future mercury emissions
Global mercury models have been used to evaluate future scenarios Four global and hemispheric models projected mercury levels around the world in 2020 based on the three emission scenarios described earlier In industrial regions the status quo will cause an increase in mercury levels of 2-25 and in remote areas of 15-5 The two emission control scenarios on the other hand yield a decrease in mercury in industrial areas of 25-35 and in remote areas of 15-20
Another global model was coupled with estimates of surface reservoirs of mercury in order to quantify source-receptor relationships for the present and for 2050 Under the best-case scenario of maximum feasible reductions projected estimates for deposition in 2050 is similar to estimates for today In the other scenarios increasing emissions lead to increasing deposition A greater proportion of mercury emissions is expected to be in the oxidized form so that a greater proportion will be deposited near the source instead of being transported far away
The model results support the conclusion that reducing anthropogenic emissions will slowly reduce the amount of mercury in biologically available reservoirs Over time mercury in the environment will be taken out of circulation by natural processes for example from ocean waters down into sediments and biologically available mercury will decrease Increased emissions on the other hand will continue to build up the amount of mercury in circulation
With new databases and methods it may soon be possible to create scenarios that incorporate activity levels as well as technology use for each country If this were done it would allow countries to assess the effects of different mercury reduction strategies on their national emissions For example a country could determine the relative contributions of emission reduction technology as opposed to for example changes in raw materials
18
UNEP Global Mercury Assessment 2013
Atmospheric chemistry monitoring and trends 5 Forms of mercury in air Mercury in the atmosphere is in three primary forms Gaseous elemental mercury is the most common in anthropogenic and natural emissions to the atmosphere Gaseous oxidized mercury and mercury bound to particulates are less common The transport and deposition of atmospheric mercury depend greatly on whether the mercury is elemental or oxidized Elemental mercury stays in the atmosphere long enough for it to be transported around the world whereas oxidized and particulate mercury are more readily captured in existing pollution control systems or deposited relatively rapidly after their formation As a result most mercury in the air is in the gaseous elemental phase Relatively little elemental mercury is deposited directly but instead must fi rst be oxidized
Although gaseous oxidized mercury is very important in mercury cycling between air and other environmental compartments the process of oxidation in the air is poorly understood with reactions and resulting compounds yet to be verified in observations
When mercury moves from air to water and land it is generally in an oxidized gaseous or particulate form whereas when it is re-emitted to air it has been converted back to gaseous elemental
Particulate associated mercury
Pole
Equator
Gaseous elemental mercury
Global transport
Gaseous elemental mercury can be transported globally Mercury emitted in particulate form tends to deposit closer to sources
mercury Sunlight appears to play a large role in both oxidation and reduction of mercury but temperature and biological interactions are also likely to be involved to some degree Here too much uncertainty remains Nonetheless the reactions are important in determining net deposition and fate of mercury
Monitoring of mercury in air Monitoring of mercury in air focuses on the three primary forms of mercury The measurement of gaseous elemental mercury is routine and robust Measuring gaseous oxidized mercury and particulate-bound mercury however is challenging Concentrations are typically very low and these forms are chemically unstable leading to high uncertainty in the measurements Nonetheless these forms are critical for defining and modelling the fate and transport of airborne mercury
In the past two decades coordinated mercury monitoring networks and long-term monitoring sites have been established in a number of regions measuring mercury concentrations in the air as well as deposition of mercury in precipitation In Europe and North America high-quality continuous monitoring has been going on for more than 15 years especially in the Arctic High-quality monitoring has started more recently in East Asia and South Africa as part of a global effort to expand the coverage provided by long-term monitoring sites
Measurements and trends in atmospheric mercury Monitoring stations around the world have provided information about trends in atmospheric mercury though the time periods vary depending on how long the site has been active Overall a declining trend in background mercury levels over the past decade has been recorded from monitoring stations
19
UNEP Global Mercury Assessment 2013
in many regions Other regions however show an increase in mercury levels
The sites also provide information about geographical patterns reflecting both background levels of
Trends in atmospheric measurements of mercury
Site(s) Period
Mace Head Ireland 1996-2011
North America rural sites 1995-2005
High Arctic sub-Arctic Up to 20 years of records mid-latitudes
Monitoring networks Mercury monitoring in Europe is carried out under the European Monitoring and Evaluation Programme (EMEP) one of the first international environmental measurement networks Heavy metals such as mercury have been included in the EMEP program since 1999 Mercury measurements are available only from northern and northwestern Europe
Three monitoring networks currently operate in North America providing good coverage of Canada and the United States the Mercury Deposition Network the Canadian Air and Precipitation Monitoring Network and the Atmospheric Mercury Network More recently new sites have been established in Mexico extending coverage on the continent The stations monitor atmospheric mercury and mercury in precipitation which has measured since the mid-1990s Monitoring of mercury in the air and in precipitation has been underway in Asia for nearly a decade
Alert Nord
Point Barrow
Nuuk Stoacuterhoumlfethi
Mace Head
mercury and local and regional influences Mercury concentrations at remote sites in Asia are higher than in other regions of the Northern Hemisphere Coastal cities in China have lower levels than inland sites likely due to the influence of relatively clean
Measurement Trend
Gaseous elemental mercury Decrease of 14-18 per year
Total gaseous mercury Decrease of 22 to 174 in total
Total gaseous mercury Decreasing trend at some stations increasing at others
The monitoring network of the Arctic Monitoring and Assessment Programme (AMAP) includes air and deposition monitoring sites located in Arctic regions of Canada Greenland Iceland Norway Russia and Sweden
Building on existing national and regional monitoring networks the European Union-financed project
ldquoGlobal Mercury Observation Systemrdquo (GMOS) started in November 2010 Its goal is to develop a coordinated global system for monitoring mercury including a large network of ground-based monitoring stations New sites are being installed in regions where few monitoring stations exist especially in the Southern Hemisphere Two sites have been established in Antarctica one on the Antarctic Plateau and one on the coast
Ny-Aringlesund
Amderma Pallas
Raringouml Bredkaumllen
Listvyanka Diabla Gora
Mauna Loa
Mt Bachelor
Celestuacuten Calhau
Longobucco
Iskrba Niembro Monte Cimone Cap
Ferrat Mt Waliguan Ganghwa Island
Lulin
Cape Hedo Ev-K2
Mt Changbai
Minamata Mt Ailao
Nieuw Nickerie
Kodiakanal
Maheacute Island Manaus
Bariloche Cape Point
Amsterdam Island Cape Grim
Dumont drsquoUrville
AMAP CAMnet EMEP GMOS GMOS associated NADPAIRMoN NADPMDN
Air + precipitation Air Precipitation
20
UNEP Global Mercury Assessment 2013
John Munthe
The mercury background air monitoring station at Zeppelin mountain Svalbard
air from over the ocean Sites off the Asian coast however show higher levels of gaseous elemental mercury than the Northern Hemisphere background suggesting an outflow from the Asian mainland
Weather patterns have also been found to have a strong influence on seasonal patterns in mercury levels in the air at monitoring sites At the Mount Waliguan Observatory on the Tibetan Plateau for example northeasterly and easterly winds produced the highest levels of mercury
Measurements at high altitudes Measurements from ground-based stations above 2700 meters suggest that there is an inverse relationship between gaseous elemental mercury and gaseous oxidized mercury at these elevations In other words when there is more elemental mercury there is less oxidized mercury and vice versa These measurements are in good agreement with modelling results which gives additional confidence in current understanding of the behaviour of mercury at high altitude
An inverse relationship between total gaseous mercury and particulate concentration has also been observed in the high stratosphere From the transformation rate of total gaseous mercury to particulate-bound mercury it appears that gaseous mercury lasts about two years in the stratosphere
21
UNEP Global Mercury Assessment 2013
Atmospheric concentrations and deposition 6 Measurements and trends of mercury in precipitation Mercury deposited by precipitation decreased from the 1990s into the 2000s at many but not all sites in North America and Western Europe where such measurements were taken
Regional patterns are also evident including slightly higher levels in southern Europe than northern Europe and higher levels in Asia than in North America Total mercury concentrations in precipitation in China were much higher than those in Japan and South Korea Th is was mostly attributed to higher levels of gaseous oxidized mercury and particulate-bound mercury which are readily deposited by precipitation and thus not transported far
A comparison of data from Canadian and American monitoring sites found that deposition of mercury in precipitation was highest in summer
Dry deposition of mercury which is deposition not associated with precipitation is diffi cult to measure and consequently there is little information on trends in mercury dry deposition Th is lack of information means that it is also diffi cult to validate model results for dry deposition
106 44
474 72 91
5 7 71
05 1 5 10 100 500 1000
Total mercury emission (2005) kgcell
Modelled mercury air concentrations and deposition patterns Atmospheric mercury concentrations are highest in major industrial regions Models examining global patterns show that East and South Asia Europe North America and South Africa have the highest levels of elemental mercury in the air Concentrations are generally lower in the Southern Hemisphere than the Northern Hemisphere because most industrial activity is in northern regions Th ese model results are based on simulations using the 2005 global mercury emission inventory because the 2010 inventory has only recently become available
Intercontinental transport of mercury in the air has been examined to determine its impact on regional mercury levels Four models using diff erent parameters produced consistent results Depending on the region mercury emitted by distant sources contributes between 10 and 30 of annual mercury deposition Where local sources are low mercury transported from distant emission sources can account for more than half of the deposition East Asia is the dominant source region adding 10-14 to the deposition in
Contribution from sources outside receptor region
Model 40
GEOS-Chem GLEMOS GRAHM CMAQ-Hg
30
20
10
0 Arctic Europe North East Asia South Asia
America
Receptor region
(Left ) Global distribution of anthropogenic mercury emissions in 2005 with source regions that were considered in the analysis (North America South America Europe Africa Central Asia South Asia East Asia Australia and Oceania) and (right) the contribution of anthropogenic sources outside a particular receptor region to deposition within the receptor region
22
UNEP Global Mercury Assessment 2013
Modelling atmospheric transport and deposition Global models reproduce the movement of mercury in the atmosphere during which the mercury may move between continents They have been effective in examining sources of mercury to the Arctic and also for examining the outflow of pollution from South and Southeast Asia and its impact on western North America as well as the flow from eastern North America to Europe
Regional models on the scale of a continent or a basin such as the Mediterranean can provide more detail about specific source areas even to the level of individual industrial areas Reliable results however require a detailed understanding of mercury oxidation in the atmosphere about which there is considerably uncertainty
Most atmospheric transport models consider the full chain of mercury processes in the atmosphere Some models also consider how mercury is cycled in other atmospheric compartments such as soil vegetation snow freshwater and seawater
One of the largest sources of uncertainty in mercury models is the chemical mechanism used to determine how mercury changes forms in the air Improved experimental data can help improve model performance by making sure that the correct reactions are simulated The processes that lead from deposition to re-emission also need to be understood better Advances in this area show promise with model results becoming closer to estimates based on experimental data
other regions of the world Natural emissions and re-emissions account for 35-70 of total deposition in most regions Deposition is generally greater in low and mid-latitudes due to stronger sunlight higher concentrations of oxidants and higher precipitation
Regional mercury models show patterns at the scales of continents or individual seas The Mediterranean Sea for example is a net source of mercury as it emits more than is deposited to it In that region dry deposition generally exceeds deposition of mercury in precipitation In Central and Southern Europe total gaseous mercury concentrations and deposition in precipitation were both consistently higher than the European average
Across the United States dry deposition accounts for two-thirds of total annual deposition mainly from gaseous oxidized mercury A study examining sources and deposition of mercury to assess the
benefits of proposed emission control measures found that mercury transport from outside the country accounts for 68 of mercury deposition in the Northeast and up to 91 in the west-central United States Large point sources contribute up to three-quarters of nearby deposition and power plants contributed half of the deposition in the eastern part of the country This suggests that new emissions standards would primarily benefit eastern regions of the US
In Asia studies show high seasonal variation in mercury concentration and deposition Anthropogenic emissions are responsible for about 75 of deposition in East Asia In this region there is a net removal of gaseous oxidized mercury from the atmosphere and a net export of gaseous elemental mercury
In the Arctic gaseous elemental mercury levels in the atmosphere are depleted rapidly in spring when after the long Arctic winters sunlight returns Ozone is depleted at the same time and it is believed that bromine-containing compounds are the cause of the photo-chemical reactions that deplete ozone and mercury During these events gaseous oxidized mercury and particulate-bound mercury levels increase sharply suggesting that the gaseous mercury is oxidized and deposited enhancing mercury deposition in Arctic areas in springtime Recent research however has found that 50-80 of the deposited mercury is re-emitted within a few days Similar springtime mercury depletion events have been seen in Antarctica
23
UNEP Global Mercury Assessment 2013
Anthropogenic releases to the aquatic environment 7 Global assessment Previous UNEP global mercury assessments only considered emissions to the atmosphere The 2013 Report presents the first attempt at compiling a global inventory of mercury releases to aquatic environments Releases directly into the aquatic environment present a completely different chemistry set of pathways and fate to those released to air They are also more directly linked to the risks posed by mercury to global environmental and human health Unlike mercury releases to air which are predominantly in the form of gaseous elemental mercury releases to water are predominantly inorganic mercury and to a lesser extent liquid elemental mercury
At present only some sources of aquatic releases can be quantified with any confidence Thus many sources that may be important are not included in this first assessment of global aquatic releases For example land management practices that expose new geological sources of mercury in rocks and mineral soils or that re-mobilize previously deposited mercury cannot yet be assessed Two broad categories of current anthropogenic sources are considered here point sources of mercury release to water and diffuse releases of mercury as a result of its remobilisation from areas where it was previously deposited or accumulated due to human activity (ie contaminated sites) Artisanal and small-scale gold mining (ASGM) mercury-containing pesticides and fungicides used in agriculture and deforestation are considered separately
Point source releases to water from various sectors in tonnes per year with the range of the estimate and as a percentage of total anthropogenic emissions
Sector Releases (range) tonnes
Non-ferrous metal production 925 (193 - 268)
Consumer product waste 894 (222 - 308)
Chlor-alkali production 28 (10 ndash 55)
Oil refining 06 (03 ndash 1)
Grand Total 185 (426 ndash 582)
The global estimate of mercury release to water from point sources has been derived from the atmospheric emissions assessment and the approach employed in the UNEP Toolkit to partition total mercury releases between air land and water This approach has considerable uncertainty and may omit sectors where releases to water are high but air emissions are unimportant and therefore not addressed in the inventory Global releases from point sources were estimated to be 185 tonnes per year
For diffuse sources evaluating the relative contribution of anthropogenic and natural sources to the aquatic environment requires determining considerations of the various mercury inputs For some sectors data exist that allow a preliminary assessment of the amounts of mercury re-mobilized into aquatic systems
For mercury-contaminated sites the range of average soil concentrations of mercury reported for sites where mercury was mined used or otherwise released by human activity was considered The area of contamination is then used to determine how much mercury is available in soils and when combined with a factor for how much mercury is released from those soils in a year the total release can be estimated Among identified contaminated sites mercury mining is identified as the largest sector followed by mining of precious metals Total releases to aquatic environments from contaminated sites are estimated to be 83-335 tonnes per year
Releases to water from contaminated sites in tonnes per year with the range of the estimate
Sector Releases (range) tonnes
Primary mercury mining sites 67 ndash 266
Precious metal production sites 14 ndash 55
Non-ferrous metal production sites 01 ndash 05
Chlor-alkali production sites 01 ndash 05
Other industrial sites 01 ndash 03
Grand Total 83 ndash 335
24
UNEP Global Mercury Assessment 2013
Much of the mercury released from artisanal and small-scale gold mining goes into rivers lakes soils and sediments and tailings From soils and tailings it may be re-mobilized by leaching and erosion In addition mining may disturb mercury-containing soils and sediments that may then erode more quickly releasing more mercury than would otherwise have become available from natural erosion A key factor in these processes is the local hydrological cycle of precipitation evaporation run-off and river flow To account for this in the assessment countries were designated as dry wet or intermediate to determine the relative importance of erosion The tropical and subtropical countries which have the greatest activity in this sector also tend to experience high precipitation and run-off exacerbating this source of mercury release and re-mobilization Total worldwide releases of mercury to land and water from ASGM were estimated at over 800 tonnes per year How much of this is released to water cannot yet be determined
Mercury continues to be used in pesticides and fungicides 2100 tonnes of mercury were released in the decade of the 1960s through such agrochemical uses Current data are unavailable although the use of mercury in these products has been greatly reduced
Deforestation especially in the Amazon Basin can lead to extensive soil erosion and thus the release of mercury previously accumulated in soils Using 2010 figures for deforestation rates around the world and an estimate of soil concentrations of mercury as much as 260 tonnes of mercury may have been released into rivers in 2010 as a result of deforestation worldwide
Because this is the first attempt to quantify global mercury releases to the aquatic environment there is no previous measurement against which these results can be compared Thus it is not possible at this time to evaluate trends in releases
Uncertainties in release estimates Estimating global releases of mercury to aquatic environments is being done here for the first time Many data are missing and others are imprecise A number of assumptions have been made based on what measurements are available or on other grounds to extrapolate from known quantities or to calculate aquatic releases in relation to atmospheric
or other emissions Thus the results should be treated with great caution It is nonetheless clear that anthropogenic sources and human activity contribute hundreds of tonnes of mercury to aquatic environments each year a substantial amount relative to estimated natural releases 150-960 tonnes per year from terrestrial environments
Lapshin Shutterstockcom
Phil Augustavo istockphotocom
Bureau of Land Managem
ent
Contaminated sites (top) erosion following deforestation (middle) and a flooded store of mercury-contaminated waste (lower) illustrate potential sources of mercury releases to water
25
UNEP Global Mercury Assessment 2013
Aquatic pathways transport and fate 8 Mercury in aquatic environments The pathways and fate of mercury in aquatic environments are important because it is in waters sediments and wetland soils that inorganic mercury is converted into methylmercury which is toxic and concentrates in animals The majority of human exposure to mercury and the health risk that comes with mercury exposure is from consumption of marine foods Thus this section focuses on the worldrsquos oceans Some freshwater systems however are important sources of fish for human consumption especially for subsistence and recreational fisheries often among indigenous peoples Artisanal and small-scale gold mining (ASGM) communities may also be affected through fish consumption and drinking water if those are contaminated by local releases
The major processes of mercury cycling are generally similar for all aquatic systems Inorganic mercury in dissolved or particulate form is the dominant mercury type in most marine and fresh waters Dissolved gaseous elemental mercury accounts for less than 30 of total mercury in water Methylmercury is often present at trace levels but may in some settings reach 30 of total mercury In freshwater and coastal environments inorganic mercury is transformed into methylmercury primarily in sediments In the open ocean this conversion takes place largely at intermediate depths between 200 and 1000 meters in the water column Mercury is lost from aquatic systems in two ways When inorganic mercury is reduced to elemental mercury it can be re-emitted to the atmosphere When inorganic mercury binds to particulates in water it can settle out rapidly and be buried in sediments Deep burial in ocean sediments is one of the major pathways by which mercury is removed from the biologically active environment
The global mercury cycle is chemically and physically complex Thus it is necessary to use models to study describe and predict what happens and will happen to mercury in the aquatic environment Until recently only one model existed that incorporated
air land and water into a unified whole The model has been validated against observations of mercury and represents the current scientific consensus The largest potential errors in this model in terms of the aquatic cycle concern details of the exchange of mercury between air and water
Pathways and fate of mercury in the oceans Model simulations suggest that anthropogenic impacts on mercury levels in the ocean are greatest in the surface waters the top 100 meters or so of the water column While model results vary one recent estimate suggests that anthropogenic emissions over the last 100 years have doubled the concentration of mercury in the surface layer of the ocean and increased it by 25 in intermediate waters and by 10 in deep waters The difference is due to the length of time it takes for surface waters to circulate to the depths
Models and measurements agree that direct deposition from the atmosphere is the dominant pathway by which mercury reaches the oceans The exceptions are smaller semi-enclosed basins such as the Mediterranean Sea or the Arctic Ocean where river runoff coastal erosion and ocean currents
Ugo M
ontaldo Shutterstockcom
26
UNEP Global Mercury Assessment 2013
account for about half of mercury inputs The most recent modelling effort suggests that total deposition input of mercury to the oceans in 2008 was 3700 tonnes
Other mercury pathways appear less important on a global basis Rivers are estimated to carry more than 2800 tonnes of mercury each year but only about 380 tonnes of this is transported offshore The rest is trapped by particles in estuaries Groundwater and re-mobilization from sediments provide 100shy800 tonnes of mercury to the oceans each year Undersea hydrothermal vents add less than 600 tonnes of mercury to the oceans There are high concentrations of mercury in vent fluids but a great deal of the mercury is precipitated as solids once the vent fluids enter seawater
Models suggest that globally about 70 of the mercury deposited into the ocean is re-emitted to the atmosphere Oxidized mercury in surface waters is reduced by biological and photochemical processes to the elemental form that is volatile and readily re-emitted The removal of this mercury ultimately reduces the pool of mercury that could be converted to methylmercury and be accumulated by marine organisms The re-emission process thus simultaneously prolongs the lifetime of mercury cycling through the atmosphere and upper ocean and acts to reduce mercury availability for marine food webs
Any changes in the efficiency of mercury reduction in surface waters or the rate of re-emission is likely to impact mercury concentrations in surface waters and the air One example is the effect of sea ice in the Arctic Ocean which blocks the re-emission
Tony Magdaraog Shutterstockcom
Mercury accumulated in marine food-webs can enter the human diet
of elemental mercury leaving elevated levels in waters under ice Changes in primary productivity could change the rate at which mercury is bound to particles thus affecting re-emission to the atmosphere as well as rates of downward transport in the ocean Changes in oxidant levels in the atmosphere such as ozone and bromine may also influence the rate of oxidation of gaseous elemental mercury and thus deposition rates to the ocean
Methylmercury in the ocean Natural bacterial processes in seawater and in sediments in coastal environments convert inorganic mercury to methylmercury Methylmercury levels are highest in the subsurface waters of many oceans because it is formed at these intermediate depths likely as a result of the decomposition of organic material falling from surface waters Current understanding indicates that about 300 tonnes of methylmercury is produced in the upper ocean by this and related processes By contrast only about 80 tonnes of methylmercury reaches the ocean from other sources such as atmospheric deposition rivers and diffusion from sediments
Current modelling indicates that methylmercury stays in the upper ocean for about 11 years Deshymethylation by photochemical reaction or by microbial activity is the major removal process for methylmercury in the ocean About 240 tonnes of methylmercury is removed by this process from the surface waters of the ocean per year
The other important pathway for methylmercury in seawater is uptake into marine food webs Although only about 40 tonnes per year is taken up in this way it is this fraction that poses risks to marine animals and human consumers of seafood Methylmercury is a problem for several reasons First it is taken up by plankton much more efficiently than is inorganic mercury resulting in concentrations in plankton that are as high as 10000 times the concentration in seawater Second methylmercury is absorbed through the intestine of animals much more easily than is inorganic mercury Third methylmercury biomagnifies as it moves up the food web Thus methylmercury becomes an increasingly greater proportion of the mercury in organisms higher in the food web This explains why some indigenous populations that consume top marine predators such as fish seals and whales have some of the worldrsquos highest concentrations of methylmercury giving rise to health concerns
27
UNEP Global Mercury Assessment 2013
Pathways and fate of mercury in freshwater Observations and modelling both show that there are in general many similarities between mercury chemistry pathways and fate in lakes and in the oceans but with obvious differences in scale and in the relative importance of different processes Modelling of mercury dynamics was done for four lakes with a history of direct mercury inputs from the largest freshwater lake in the world (Lake Superior) to small lakes in Ontario Canada Atmospheric deposition and river inflow were the main sources of inorganic mercury Much of the mercury input from lake and river catchments was associated with dissolved and particulate organic matter The dominant mercury removal mechanisms as in saltwater were burial in sediments and photochemical reduction of oxidized mercury to elemental mercury followed by re-emission to the air In Lake Superior and Lake Michigan there is evidence for methylation of mercury in the water column as is seen in the open ocean
Methylmercury levels in freshwater fish vary with the level of deposition of mercury from the air though other factors such as inputs from the watershed and the number of trophic levels within the lakersquos food web are also important Methylation predominantly occurred in lake sediments and wetlands and floodplain soils where sulphateshyreducing bacteria are believed to be primarily responsible Methylmercury is de-methylated in sediments and also taken away in the outlet river from each lake
Some 400-1400 tonnes of mercury are estimated globally to be trapped behind dams and other man-made impoundments each year This has in many cases led to significant increases in total mercury and methylmercury levels in water and of methylmercury in fish and other aquatic species When artificial lakes are created plant material is submerged leading to decay and anoxia In these conditions microbially driven methylation of inorganic mercury takes place In some cases the elevated mercury levels have also been observed downstream from the artificial lakes and reservoirs
Anthropogenic impacts on aquatic mercury levels Two studies have reported that the Atlantic and Pacific Oceans have shown opposing trends over recent decades While the influence of changing ocean currents and other oceanographic factors may be a factor the trends do make sense in light of patterns of anthropogenic emissions In the North Pacific Ocean mercury concentrations appear to have increased at depths between 200 and 1000 meters over the last few decades This increase coincides with the rapid industrialization of East Asia
In the North Atlantic however results from near Bermuda suggest a substantial decrease in mercury concentration and a change in the mercury profile through the water column The Mediterranean Sea too showed a decrease in mercury concentration between 1990 and 2004 These findings are consistent with atmospheric data from around the North Atlantic The conclusion is that mercury levels in seawater in the North Atlantic were elevated by human activity but may now be declining likely as a result of decreased emissions from North America and Europe
A complementary approach to measuring mercury in seawater is to measure mercury in aquatic animals which accumulate and integrate mercury over time Teeth hair feathers and eggshells are useful long-term archives of mercury concentrations and can provide data from the pre-industrial period (ie before 1800) as well as more recent periods
Among marine animals samples are available from several regions particularly from the Arctic where cold dry conditions help preserve animal tissues Mercury concentrations between the 13th and 16th
centuries were relatively stable From the mid- to late 19th century to the end of the 20th century mercury levels increased by an average of 12 times On average therefore about 92 of the mercury in Arctic marine wildlife today is likely to be of anthropogenic origin
Similar findings were found for a 700-year sequence of seabird eggshells from the South China Sea Mercury levels increased steadily between 1800 and 2000 with a particularly rapid increase after 1970 Concentrations since 2000 are about 10 times higher than pre-industrial levels with 91 of the mercury now likely to be of anthropogenic origin In the Antarctic studies of seal hairs show that pre-industrial mercury levels were only 60 of recent levels The relatively small difference
28
UNEP Global Mercury Assessment 2013
Historical Hg concentration as a proportion of present-day 100
80
60
40
20
0
Beluga teeth Human teeth
Gyrfalcon feathers Perigrine falcon feathers
Polar bear hair Ringed seal teeth
1200 1300 1400 1500 1600 1700 1800 1900 2000
between pre-industrial and modern mercury levels in Antarctic is consistent with lower mercury emissions and atmospheric concentrations in the Southern Hemisphere as compared with the Northern Hemisphere
The timing of long-term increases of mercury in aquatic animals can shed light on the likely sources of mercury emissions that were responsible The industrialization of Europe and North America appear responsible for the large increases in marine mercury levels that began in the 19th century as these increases occurred prior to recent Asian industrialization As with water concentrations in the Pacific Ocean recent rapid increases in mercury in seabird eggs in the South China Sea coincide with industrialization in Asia
The time lag in aquatic ecosystem response One important conclusion from air-ocean modeling is that the oceans have not yet reached equilibrium with current atmospheric levels of mercury This lag is due to several factors First mercury stays in the upper ocean above 200 meters depth for about 30 years and for centuries in intermediate and deep waters This is much longer than the one year residence time in the lower atmosphere Thus removal from the ocean takes much longer than does removal from the air and so concentrations will change more slowly
Second because of the long lifetime of mercury in deeper ocean waters a great deal of natural mercury is present in the ocean already about 100000 tonnes out of a total of 135000 tonnes in intermediate waters and 200000 out of 220000 tonnes in deep waters
Rune Dietz
Analysis of museum samples reflects the increase in mercury emissions and releases since the mid-19th century associated with anthropogenic activities
Third vertical transport of mercury from intermediate depths back to the surface returns a substantial amount of mercury to the biologically active zone each year As a result average mercury concentrations in seawater and marine animals are likely to increase slowly for decades if not centuries even if atmospheric levels stabilize at present levels In short the effects of historical anthropogenic emissions from Europe and North America are still being observed in the oceans at the same time that the effects of the recent rise in emissions from Asia are being seen
Regionally different trends can be expected depending on distance from sources and ocean circulation patterns In the North Atlantic north of 55deg N it will take 50-600 years to achieve equilibrium between atmospheric and seawater mercury levels In the North Pacific this process is estimated to take 500-700 years and in the Antarctic 700-1000 years The Arctic Ocean by contrast is smaller and will only take about 35 years to reflect changes in atmospheric mercury levels Surface waters of the Mediterranean Sea should show also changes within 10-50 years
Time lags in the responses of many freshwaters and their food-webs to changes in atmospheric mercury levels are also expected Although some immediate recovery following reductions in atmospheric mercury deposition rates is likely full recovery may take decades centuries or longer depending on the characteristics of the area Highly polluted freshwaters with catchments and sediments containing large amounts of anthropogenic mercury will recover most slowly as is already observed around point sources such as smelters that have closed down
29
UNEP Global Mercury Assessment 2013
Major gaps in knowledge 9 Large uncertainties remain in global estimates of mercury emissions to the air These stem from various sources including the availability of information on activity levels but mainly from the lack of information concerning the mercury content of some raw materials and the validity of assumptions regarding processes and technologies employed to reduce mercury emissions including their rates of application and effectiveness The accuracy and precision of measurement-based estimates can depend on the validity of extrapolating measurements made at infrequent intervals to longer periods or measurements made at one plant to other facilities with similar operations
Potentially important emissions sectors that are still not quantified in the emissions inventory include the use of mercury in vinyl-chloride monomer production secondary metals production oil and gas extraction transport and processing industrial and hazardous waste incineration and disposal sewage sludge incineration and dental fillings preparation and removal
Current measurements and their evaluation are inadequate for determining spatial and temporal trends Improved more extensive and better coordinated measurements are needed A permanent global integrated monitoring network for atmospheric mercury and mercury deposition is needed to achieve this goal The atmospheric network sites should be closely integrated with water soil and biological monitoring networks The results can be used for model testing and evaluation as well as for more accurately detailing the geographic impact of anthropogenic emissions Monitoring of mercury concentrations in the important marine food species is essential to understanding possible human health impacts and the effects of future emissions changes
Better data on mercury distribution in the troposphere is needed to improve understanding of long-range transport and source-receptor relationships Coordinated studies at high altitudes and by aircraft are needed This information will
also help validate regional and global scale models improving their prediction capabilities with regard to different policy scenarios
Key processes related to global transport and cycling of mercury remain inadequately understood The chemical form of gaseous oxidized mercury is unknown Reduction and oxidation rates for mercury in the presence of atmospheric oxidants need further study including determining which oxidants are important New measurements and modelling studies are needed to examine key chemical and physical processes that affect global transport and cycling
Few data are available for reporting mercury releases to aquatic systems Systematic and consistent monitoring of mercury releases to the air is required especially for contaminated systems Releases of mercury from soils into waters depend greatly on climate and topography and these parameters need to be better accounted for Consistent approaches for measuring and reporting releases from point sources are needed to ensure comparability of data from around the world In particular the actual role of artisanal and small-scale gold mining (ASGM) in emissions to air and releases to water needs to be more accurately estimated
The link between mercury deposition methylation and uptake by living organisms needs further study The parameters that determine the rates of exchange of mercury compounds between air and sea air and soil and air and vegetation are not fully understood Whole-ecosystem studies of mercury are needed to better understand biogeochemical cycling Methylationdemethylation rates and their spatial and temporal variations and relationship to climatic factors need to be determined in most of worldrsquos major ocean basins as well as in representative freshwaters
30
UNEP Global Mercury Assessment 2013
Key findings of the 2013 assessment 10 Atmosphere Total anthropogenic emissions of mercury to the atmosphere in 2010 are estimated at 1960 (1010shy4070) tonnes which is about 30 of the total mercury that was emitted and re-emitted from anthropogenic and natural sources in that year The largest anthropogenic sources are associated with artisanal and small-scale gold mining (ASGM) and coal burning which together account for about 62 of the annual total anthropogenic emissions to air Other major sectors include ferrous and non-ferrous metal production and cement production
East and Southeast Asia are responsible for about 40 of global anthropogenic emissions About 75 of the mercury from this region comes from China which is about one-third of the global total Increased estimates for emissions from ASGM largely a result of newly obtained data and improved information mean that South America and Sub-Saharan Africa are also responsible for a greater proportion of global emissions than was previously assumed
Anthropogenic emissions over time have increased mercury loads present in the environment This leads to higher rates of re-emission and also means that there will be a time lag of years or decades between emissions reductions and lower mercury levels in the food web including pathways of human exposure
Mercury emissions to the atmosphere likely peaked in the 1950s to 1970s and subsequently declined because of reductions in Europe Russia and North America Emission trends are unclear due to changes in methods employed to produce inventories and differences in the sectors that have been accounted at different times There are however some indications that emissions may be rising again with increases from East Asia offsetting continuing reductions in Europe and North America
Aquatic environments Natural processes in aquatic systems convert less toxic elemental and inorganic mercury into much more toxic methylmercury Methylmercury concentrates and accumulates in the food web leading to high concentrations in some species of seafood and fish that many people eat
Anthropogenic releases of mercury to aquatic environments contribute hundreds of tonnes to the amount of mercury cycling in the environment Diffuse releases and point sources appear equally important Atmospheric deposition however remains the most important input of mercury to land and oceans and has increased the amount of mercury in many environmental compartments by a factor of two or three since the start of the industrial age On land mercury that is deposited is largely retained in soils and vegetation increasing the available pool for re-mobilisation to adjacent aquatic systems Re-emission from soils however is a major addition to atmospheric mercury
Hydrology is the most important factor in the transport of mercury from catchments to downstream environments Relatively little of this mercury reaches the open ocean as most is captured in sediments behind dams in estuaries and near the coast Changes in land cover and land use can have a large effect on mercury mobilisation as exposed soils erode and mercury leaches into the water table
Concentrations of mercury in Arctic marine animals today are about 10-12 times higher than in preshyindustrial times (ie prior to about 1800) This means that on average about 92 of the mercury in marine predators such as seabirds seals and whales is anthropogenic in origin The timing of the increase suggest that 19th and early 20th century emissions from Europe North America and Russia were responsible Increases mercury concentrations in seabirds in the South China Sea appear to be more recent than the Arctic increases coinciding with increasing industrialisation in East and Southeast Asia
31
UNEP Global Mercury Assessment 2013
K+S Entsorgung Gm
bH
Recovered mercury is being stockpiled at long-term storage sites above- and as shown here below ground
The upper 100 meters of the oceans have twice the mercury that they did a century ago Intermediate and deeper waters have 10-25 more mercury on average reflecting the slow transport of mercury downwards in the oceans Seawater concentrations will thus be especially slow in responding to changes in mercury inputs from atmospheric deposition and river flow As a result mercury concentrations in marine biota are likely to increase slowly for decades to centuries even without an increase in atmospheric emissions
In freshwater ecosystems atmospheric deposition and re-mobilisation from soils slow the reduction of mercury levels even in regions where atmospheric concentrations have decreased due to emission controls
Further increases in atmospheric emissions will have long-term consequences for commercial fisheries and all consumers of marine and freshwater foods
It is likely to be years or decades before reductions in anthropogenic emissions and releases of mercury have a demonstrable effect on mercury levels throughout the environment and in the fish and marine mammals which are part of the human food-chain This only reinforces the need to act now to continue and strengthen international efforts to reduce current mercury emissions and releases Delays in action now will inevitably lead to slower recovery of the worldrsquos ecosystems in future from mercury contamination leaving an even greater legacy of pollution for future generations
32
Division of Technology Industry and Economics (DTIE) Chemicals Branch Geneva Switzerland January 2013
Job number DTI1636GE
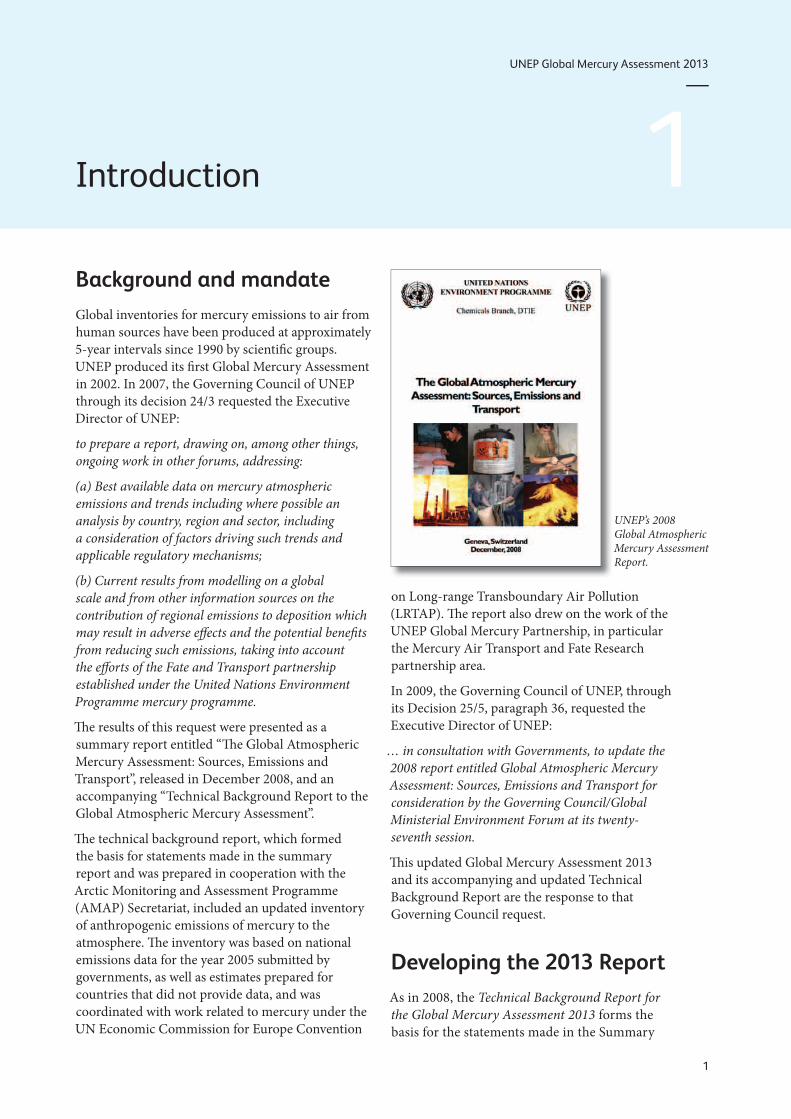
UNEP Global Mercury Assessment 2013
Introduction
Background and mandate Global inventories for mercury emissions to air from human sources have been produced at approximately 5-year intervals since 1990 by scientific groups UNEP produced its first Global Mercury Assessment in 2002 In 2007 the Governing Council of UNEP through its decision 243 requested the Executive Director of UNEP
to prepare a report drawing on among other things ongoing work in other forums addressing
(a) Best available data on mercury atmospheric emissions and trends including where possible an analysis by country region and sector including a consideration of factors driving such trends and applicable regulatory mechanisms
(b) Current results from modelling on a global scale and from other information sources on the contribution of regional emissions to deposition which may result in adverse effects and the potential benefits from reducing such emissions taking into account the efforts of the Fate and Transport partnership established under the United Nations Environment Programme mercury programme
The results of this request were presented as a summary report entitled ldquoThe Global Atmospheric Mercury Assessment Sources Emissions and Transportrdquo released in December 2008 and an accompanying ldquoTechnical Background Report to the Global Atmospheric Mercury Assessmentrdquo
The technical background report which formed the basis for statements made in the summary report and was prepared in cooperation with the Arctic Monitoring and Assessment Programme (AMAP) Secretariat included an updated inventory of anthropogenic emissions of mercury to the atmosphere The inventory was based on national emissions data for the year 2005 submitted by governments as well as estimates prepared for countries that did not provide data and was coordinated with work related to mercury under the UN Economic Commission for Europe Convention
1
UNEPrsquos 2008 Global Atmospheric Mercury Assessment Report
on Long-range Transboundary Air Pollution (LRTAP) The report also drew on the work of the UNEP Global Mercury Partnership in particular the Mercury Air Transport and Fate Research partnership area
In 2009 the Governing Council of UNEP through its Decision 255 paragraph 36 requested the Executive Director of UNEP
hellip in consultation with Governments to update the 2008 report entitled Global Atmospheric Mercury Assessment Sources Emissions and Transport for consideration by the Governing CouncilGlobal Ministerial Environment Forum at its twenty-seventh session
This updated Global Mercury Assessment 2013 and its accompanying and updated Technical Background Report are the response to that Governing Council request
Developing the 2013 Report As in 2008 the Technical Background Report for the Global Mercury Assessment 2013 forms the basis for the statements made in the Summary
1
UNEP Global Mercury Assessment 2013
Report and is fully referenced according to standard scientific practice As such it is the single reference for the Summary Report It has again been prepared in co-operation with the Arctic Monitoring and Assessment Programme (AMAP) and uses national data and information submitted by several governments Contributions have also been incorporated from the UNEP Global Mercury Partnership in particular its partnership areas on mercury control from coal combustion reducing mercury in artisanal and small-scale gold mining (ASGM) and mercury air transport and fate AMAP mercury expert group UN Economic Commission for Europe (UN ECE) Long-range Transboundary Air Pollution (LRTAP) Convention groups industry and non-governmental organizations Each section was prepared by a team of experts and then reviewed to ensure its scientific accuracy The evaluation of information of mercury released into the aquatic environment benefits from contributions from the Group of Experts on Scientific Aspects of Marine Environmental Protection (GESAMP)
Scope and coverage This update to the Global Mercury Assessment provides the most recent information available for the worldwide emissions releases and transport of mercury in atmospheric and aquatic environments To the extent possible the information comes from the published scientific literature supplemented where necessary by other sources Since the Global Mercury Assessment is intended as a basis for decision making emphasis is given to anthropogenic emissions (mercury going into the atmosphere) and releases (mercury going into water and land) that is those associated with human activities
The Technical Background Report includes a detailed inventory of global mercury emissions to air based on data for 2010 ldquoInventoryrdquo in this context means a compilation of the estimated emissions and releases from various sectors and sources While it attempts to catalogue all major sources of mercury emissions worldwide it should not be regarded as complete and exhaustive
In addition for the first time this Global Mercury Assessment includes an evaluation of information of mercury released into the aquatic environment and its associated pathways and fate The information available for this evaluation is less complete than
that for emissions to air and is based on data from recent years The inclusion of this new element of the Global Mercury Assessment is as a response to the requests from many governments in the Intergovernmental Negotiating Committee (INC) for more information on releases to land and water The aquatic environment is the main route of exposure to humans and wildlife because it is in water that inorganic mercury is transformed into highly toxic methylmercury
The Technical Background Report includes chapters on
bull Global Emissions of Mercury to the Atmosphere describing sources anthropogenic emissions and trends in emissions bull Atmospheric Pathways Transport and Fate
examining pathways levels and trends in air and deposition and modelling of pathways and deposition bull Global Releases of Mercury to Aquatic Environments
containing global estimates of releases to water and bull Aquatic Pathways Transport and Fate examining
mercury pathways in aquatic systems that result in important routes of human exposure
Technical Background Report chapters were prepared by teams of experts and then reviewed to ensure their scientific validity This Summary Report is based on the content of the Technical Background Report and has been reviewed by the authors of the Technical Background Report It was also circulated for national review
This Summary Report provides in Chapter 2 an overview of natural and anthropogenic sources of mercury outlining the main sectors involved The global inventory of anthropogenic emissions to air is presented in Chapter 3 and Chapter 4 describes trends in mercury emissions to the atmosphere What happens after mercury is released to the atmosphere is covered in Chapter 5 on atmospheric chemistry monitoring and deposition and Chapter 6 on atmospheric concentrations and deposition Chapter 7 provides a first attempt to estimate global releases to water followed in Chapter 8 by a discussion of aquatic pathways transformations and fate A review of gaps in knowledge is given in Chapter 9 Chapter 10 summarizes key findings
2
UNEP Global Mercury Assessment 2013
Whatrsquos new in the Global Mercury Assessment 2013 Global mercury emissions inventories continue to improve as new data and better data become available concerning some sources The method for compiling the inventory of anthropogenic emissions to the atmosphere has also been revised and improved Differences in air pollution control technologies and differences in the mercury content of raw materials and fuels in different countries and regions have been factored into emissions calculations to better reflect actual conditions in each country
In the Global Mercury Assessment 2013 a new updated inventory based on data from 2010 is presented in which some new sources (including emissions from combustion of natural gas and primary aluminium production and emissions associated with oil refining) have been quantified for the first time A more detailed analysis has also been made of some of the major mercury emission sectors including the break-down of emissions from coal burning in power plants industrial and other uses In addition new information acquired through the UNEP Global Mercury Partnership area on Reducing Mercury in Artisanal and Small-scale Gold Mining in particular from the Artisanal Gold Council has resulted in a significant re-evaluation of emissions from the ASGM sector
New observational data and new modelling results provide fresh insight into atmospheric mercury transport and fate
Kevin Telmer
One of the objectives of the updated assessment has been to provide transparent documentation and comprehensive compilations of the data that form the basis for all of the estimates presented This approach will allow a more consistent and replicable method for compiling the global mercury emission inventory so that valid comparisons can be made in the future In addition a wider range of experts from around the world have been involved in preparing the Technical Background Report on which this summary is based
The inclusion of an assessment of releases of mercury to the aquatic environment and its subsequent pathways and fate is a further significant development as these topics were not addressed in the 2008 UNEP Global Atmospheric Mercury Assessment The aquatic environment is critical for three reasons
bull Hundreds of tonnes of mercury is released directly into water so an inventory limited to mercury emissions to air provides an incomplete assessment of anthropogenic impacts on the mercury cycle
bull Mercury in aquatic environments can be transformed into methylmercury which is far more toxic to humans and animals and can enter and biomagnify in food webs more readily than other forms of mercury bull Much human exposure to mercury is through
the consumption of fish and other marine foods making aquatic pathways the critical link to human health
A large open artisanal and small-scale gold mining pit
3
UNEP Global Mercury Assessment 2013
Sources of mercury emissions to air and releases to water 2 Mercury is a naturally occurring element and is found throughout the world There are thus many natural sources of mercury creating background environmental levels that have been present since long before humans appeared
Mercury is contained in many minerals including cinnabar an ore mined to produce mercury Much of the present day demand for mercury is met by supply from mercury recovered from industrial sources and stockpiles rather than from mercury mining Mercury is also present as an impurity in many other economically valuable minerals in particular the non-ferrous metals and in fossil fuels coal in particular
Human activity especially mining and the burning of coal has increased the mobilization of mercury into the environment raising the amounts in the atmosphere soils fresh waters and oceans The majority of these human emissions and releases of mercury have occurred since 1800 associated with the industrial revolution based on coal burning base-metal ore smelting and gold rushes in various parts of the world To some extent the same drivers of mercury emissions and releases are continuing with fossil-fuel-based energy generation powering industrial and economic growth in Asia and South America which in turn helps drive high demand for metals including gold spurring artisanal and small-scale gold mining (ASGM) around the world
In preparing inventories of mercury emissions and releases it is important to distinguish various categories of sources Three main types of emissions and releases can be distinguished each of which is briefly introduced here in qualitative terms with particular emphasis on anthropogenic sources
Natural sources of mercury emissions and releases Mercury in the earthrsquos crust can be emitted and released in several ways to air water and land Natural weathering of mercury-containing rocks
farbled Shutterstockcom
Cinnabar the principal ore of mercury
Year 2000
1950
1900
1850
1800
1750
1700
Mt St Helens (1980)
Industrial period
WWII manufacturing
Krakalau (1883)
Gold rush (circa 1850-84)
Tambora (1815)
Pre-industrial period
1998 core 1991 core Natural background Natural events (volcanic eruptions) Localregional anthropogenic sources Global anthropogenic (industrialization)
0 5 10 15 20 25 30 35 40 Total mercury ngL
Ice core record of deposition from Wyoming USA The elevated levels associated with the 1850-84 US gold rush probably reflect localregional sources rather than a global signature Increasing environmental levels of mercury associated with industrialization however are found in environmental archives like this ice core around the globe
4
UNEP Global Mercury Assessment 2013
Global mercury cycling Mercury is released to the environment from natural sources and processes and as a result of human activities Once it has entered the environment mercury cycles between air land and water until it is eventually removed from the system through burial in deep ocean sediments or lake sediments and
through entrapment in stable mineral compounds Methylmercury the most toxic and bioaccumulative form of mercury which presents the greatest health risk to humans and wildlife is mainly formed in aquatic environments through natural microbial processes
80shy600
3700
2000shy2950
2000 300shy600
1700shy2800
3200
380
lt600
Geogenic Anthropogenic
Anthropogenic Biomass burning
Soil and vegetation
Deposition to oceans
Rivers
Deposition to land
freshwater
Geogenic
Oceans
Anthropogenic
Natural
Re-emissions Re-mobilization
Units tonnes
1 tonne = 1000 kilograms
Global mercury budgets based on models illustrate the main environmental compartments and pathways that are of importance in the global mercury cycle and the ways in which natural and anthropogenic releases to air land and water move between these compartments Emissions to air arise from natural sources and anthropogenic sources as well as re-emissions of mercury previously deposited from air onto soils surface waters and vegetation
is continuous and ubiquitous allowing mercury to escape to air and to be washed into lakes and rivers Volcanoes emit and release mercury when they erupt Geothermal activity can also take mercury from underground and emit it to the atmosphere and release it to the deep oceans Some recent models of the flow of mercury through the environment suggest that natural sources account for about 10 of the estimated 5500-8900 tonnes of mercury currently being emitted and re-emitted to the atmosphere from all sources
onime Shutterstockcom
5
UNEP Global Mercury Assessment 2013
Anthropogenic sources of mercury emissions and releases Anthropogenic sources of mercury emissions account for about 30 of the total amount of mercury entering the atmosphere each year
As found in previous global mercury assessments the main industrial sources of atmospheric mercury are coal burning mining industrial activities that process ores to produce various metals or process other raw materials to produce cement In these activities mercury is emitted because it is present as an impurity in fuels and raw materials In these cases mercury emissions and releases are sometimes referred to as lsquoby-productrsquo or lsquounintentionalrsquo emissions or releases A second category of sources includes sectors where mercury is used intentionally Artisanal and small-scale gold mining (ASGM) is the largest of these in which mercury emissions and releases result from the intentional use of mercury to extract gold from rocks soils and sediments Other intentional-use release sectors include waste from consumer products (including metal recycling) the chlor-alkali industry and the production of vinyl-chloride monomer
Coal burning and to a lesser extent the use of other fossil fuels is one of the most significant anthropogenic source of mercury emissions to the atmosphere Coal does not contain high concentrations of mercury but the combination of the large volume of coal burned and the fact that a significant portion of the mercury present in coal is emitted to the atmosphere yield large overall emissions from this sector The mercury content of coal varies widely introducing a high degree of uncertainty in estimating mercury emissions from coal burning Data on mercury content is now available from many countries including major emitters of mercury
Mining smelting and production of iron and non-ferrous metals are also a large source of global mercury emissions to air and also a very important sector with regard to releases to water In the mining and processing of metals most of the mercury is captured and either stockpiled or sold for use in various products creating anthropogenic sources associated with intentional use discussed below Nonetheless the volume of ores and metals involved result in large total emissions and releases The relatively small volume of primary mercury production makes mercury mining a far smaller source today than it has been in the past
Cement production which typically involves the burning of fossil fuels to heat the materials required to make cement is another major anthropogenic source of mercury emissions Both the raw materials and the fuel may contain mercury and lead to emissions The amount of mercury involved varies greatly with the mercury content of these fuels and especially with the raw materials In some countries cement kilns are burning increasing amounts of alternative fuels including wastes that may contain mercury This may add to the emissions from cement kilns
Oil refining emits and releases mercury as oil deposits are known to contain mercury generally at low concentrations Mercury is removed from most petroleum products and natural gas prior to combustion and therefore combustion-related emissions are low Most of the mercury in crude oil is associated with solid waste that is disposed of in landfills However emissions and releases during refining of crude oil do occur and these have been quantified for the first time in the 2010 inventory The inventory does not quantify other emissions and releases during oil and gas extraction and transport or from flaring
Unintentional mercury emissions from these sectors can be reduced by the application of pollution control measures at power plants and industrial plants Some of the mercury captured is refined and enters the commercial supply chain however large amounts of mercury captured in materials such as fly ash and oil refinery waste need to be disposed of Some of the resulting wastes are themselves used as raw materials for example in construction materials but large amounts are disposed of in landfills which can thus become a potential source of mercury emissions and releases
Among intentional-use sectors Artisanal and small-scale gold mining is a major source for emissions and releases of mercury worldwide In ASGM miners use mercury to create an amalgam separating gold from other materials They then have to separate the mercury from the gold Calculating emissions from this sector presents a particular challenge because it is typically widely dispersed and often unregulated and may be illegal Uncertainties regarding release estimates from the ASGM sector are therefore high Furthermore the miners are typically poor and perhaps have little awareness of the hazards of mercury and pollution control devices may be hard to obtain
Wastes from consumer products containing mercury can end up in landfills or incinerators
6
UNEP Global Mercury Assessment 2013
Mercury is still used in a wide range of products including batteries paints switches electrical and electronic devices thermometers blood-pressure gauges fluorescent and energy-saving lamps pesticides fungicides medicines and cosmetics Once used many of the products and the mercury they contain enter waste streams While mercury in landfills may slowly become re-mobilized to the environment waste that is incinerated can be a major source of atmospheric mercury especially from uncontrolled incineration Incinerators with state-of-the-art controls have low emissions
Another use of mercury is in dental amalgam for filling teeth When bodies are cremated mercury in fillings can be emitted Mercury can also be emitted and released during production and preparation of fillings and from the disposal or removed fillings In addition mercury from removed fillings can be recycled or go into solid waste and wastewater
The amount of mercury released in the recycling of scrap metals for example in secondary steel and nonshyferrous metal production is generally assumed to be much lower than that released during primary metal production which is why the present global inventory only addresses primary metal production However lower emissions from recycling may not be the case in all countries Much of the scrap steel in some countries comes from automobiles that may still have devices that contain mercury and which may not be removed prior to recycling of the steel These devices are largely being phased out so mercury emissions from scrap steel may be expected to decrease However large differences exist between countries in the way they treat their mercury-containing wastes including scrap metals that are recycled in secondary metal production
Mercury is also used in a number of industrial processes A major industrial use is in the chlor-alkali industry where mercury-cell technology may be used in the production of chlorine and caustic soda
Mercury is also used as a catalyst in the production of vinyl chloride monomer (VCM) from acetylene mainly in China
Mercury releases to aquatic systems as a result of current human activities arise from many of the same uses or the presence of mercury in various products and processes that emit mercury to the air As with emissions to the atmosphere aquatic releases come from two main sources First mercury is released with water effluent from the sites where mercury is used Second mercury can leach into water from disposal sites that have mercury in the waste
zhu difeng Shutterstockcom
Tomas Pavelka Shutterstockcom
bikeriderlondon Shutterstockcom
Anthropogenic sources of mercury from industry and intentional use
Gunnar Futsaelig
ter
7
UNEP Global Mercury Assessment 2013
Arnold John Labrentz Shutterstockcom
Re-emission and re-mobilization of mercury Re-emissions constitute the third category of sources presently comprising about 60 of mercury emissions to air Mercury previously deposited from air onto soils surface waters and vegetation from past emissions can be emitted back to the air Re-emission is a result of natural processes that convert inorganic and organic forms of mercury to elemental mercury which is volatile and therefore readily returns to the air Mercury deposited to plant surfaces can be re-emitted during forest fires or biomass burning Mercury may be deposited and re-emitted many times as it cycles through the environment
It is important that re-emitted mercury should not be considered a natural source It may originally have come from natural or anthropogenic sources but by the time it is re-emitted it is difficult or impossible to identify its specific origin Nonetheless human activity has increased the environmental burden of mercury resulting in higher levels of re-emission This is compounded by changes in land use practices as well as increasing temperatures due to climate change
In the aquatic environment re-mobilization of mercury occurs when mercury deposited on and accumulated in soils or sediments is re-mobilized by for example rain or floods that cause the mercury to enter or re-enter the aquatic system Resuspension
of aquatic sediments due to wave action or storm events is an additional way for mercury to re-enter the aquatic ecosystems
Estimating re-emission and re-mobilization rates is difficult It is often done using modelling approaches These models are based on data on atmospheric levels and other observations as well as current understanding of chemical transformations and other processes that determine how mercury moves between air land and water The models aim to balance the amount of mercury in circulation at any given time while remaining consistent with observational data Temperature is a key factor With lower temperatures re-emission rates are generally lower
Re-emission is also a major factor in determining the length of time needed for anthropogenic emission reductions to be reflected in decreasing environmental levels of mercury Mercury emitted in one year may be deposited to and retained in soils and waters for some time before being re-emitted or re-mobilized in subsequent years This cycle can be repeated keeping levels in air and water elevated even after anthropogenic sources have been lowered Conversely continuing to add to the global pool will leave an ever-longer legacy of anthropogenic mercury contamination worldwide It is thus imperative that international efforts to reduce mercury emissions continue and are strengthened as soon as possible
Forest fires re-emit mercury deposited to vegetation
8
UNEP Global Mercury Assessment 2013
Anthropogenic emissions to the atmosphere 3 Global emissions inventory The global emissions inventory for 2010 estimates that 1960 tonnes of mercury was emitted to the atmosphere as a direct result of human activity The leading sectors remain the same as those identified in the 2005 inventory Improved data however have changed the relative contributions of some of these sectors as have some actual changes in emissions All coal burning emissions taken together for example represent a lower percentage of the total emissions than in the 2005 inventory This is due in part to the increased estimates from artisanal and small-scale gold mining (ASGM) and in part to much lower estimates for domestic use of coal When the actual amount of mercury emitted from coal combustions in power generation and industrial uses is considered and the estimates are based on the same 2010 methodology the emissions in 2010 are the same and perhaps slightly higher than in 2005 Even though new coal-fired power plants are being built combustion efficiency and emissions controls are also improving in most parts of the world
Results by selected sector The updated inventory of emissions to air confirms coal burning as a continuing major source of emissions responsible for some 475 tonnes of mercury emissions to air annually compared with around 10 tonnes from combustion of other fossil fuels According to the new inventory more than 85 of these emissions are from coal burning in power generation and industrial uses In the previous assessment emissions from domestic and residential coal burning were highlighted as a possible larger contribution Better information on coal consumption for domestic and residential uses indicates that these activities are a smaller contribution to total emissions from coal burning than previously thought
Emissions from the cement production industry are largely dependent on the raw materials and the fuels used The new inventory avoids double
Emissions from various sectors in tonnes per year with the range of the estimate and as a percentage of total anthropogenic emissions Note These numbers cannot be compared directly with those presented in the 2008 assessment (see Chapter 4 Trends in mercury emissions to the atmosphere)
Sector Emission (range) tonnes
By-product or unintentional emissions
Fossil fuel burning
Coal burning (all uses) 474 (304 - 678) 24
Oil and natural gas burning 99 (45 ndash 163) 1
Mining smelting amp production of metals
Primary production of 455 (205 ndash 241) 2 ferrous metals
Primary production of nonshy 193 (82 ndash 660) 10 ferrous metals (Al Cu Pb Zn)
Large-scale gold production 973 (07 ndash 247) 5
Mine production of mercury 117 (69 ndash 178) lt1
Cement production 173 (655 - 646) 9
Oil refining 16 (73 - 264) 1
Contaminated sites 825 (70 - 95) 4
Intentional uses
Artisanal and small-scale 727 (410 ndash 1040) 37 gold mining
Chlor-alkali industry 284 (102 ndash 547) 1
Consumer product waste 956 (237 ndash 330) 5
Cremation (dental amalgam) 36 (09 - 119) lt1
Grand Total 1960 (1010 ndash 4070) 100
Values rounded to 3 significant figures To nearest percent
Sectors for which emissions are not currently quantified
biofuel production and combustion
vinyl-chloride monomer production emissions during
secondary metals production and ferro-alloys
oil and gas extraction transport and processing other than refinery emissions
industrial some hazardous waste incineration and disposal
sewage sludge incineration
preparation of dental amalgam fillings and disposal of removed fillings containing mercury
9
UNEP Global Mercury Assessment 2013
Disposal of waste from
Mercury-cell chlor-alkali
industry
Relative contributions to estimated emissions to air from anthropogenic sources in 2010
Oil refining
Coal combustion
Oil and natural gas combustion
Primary ferrous metal production
Primary non-ferrous metal (Al Cu Pb Zn)
Large-scale gold production
Hg production Cement production
mercury-containing products
Contaminated sites
Cremation
Artisanal and small-scale gold production
counting of emissions from conventional fuels (such as coal and oil) that are included under the industrial fossil fuel burning emissions However it does attempt to account for emissions from other fuels including alternative fuels (such as old tyres and other wastes) and from raw materials Increasing amounts of waste are being co-incinerated in the cement industry both as fuel but also in some plants as a means of disposing of hazardous wastes some of which may contain mercury In some regions additional measures are being introduced to make sure that mercury emissions associated with waste co-incineration do not increase overall emissions from cement plants
Increased application of air pollution control devices including some mercury-specific technologies together with more stringent regulations in several countries have the effect of reducing mercury emissions from coal burning sectors and thus offset some part of the emissions arising from increased activity
Artisanal and small-scale gold mining emissions are in the 2010 inventory the major source of emissions to air at 727 tonnes per year The reasons for the large increase in the estimate compared to 2005 are discussed below (see page 16) The global estimate for emissions from ASGM includes a significant contribution from China although
recent information on this sector in China is lacking China prohibited ASGM in 1996 and therefore records no emissions from this sector
Mercury-cell technology is becoming less common in the chlor-alkali industry as other more cost-effective processes are adopted No new plants are being constructed though many older plants remain to be converted Old chlor-alkali plants and other decommissioned industrial sites may constitute contaminated sites that continue to release mercury to the environment for many years and emissions from contaminated sites are now part of the inventory
Global emissions from use of mercury in dental amalgam resulting from cremation of human remains are estimated at 36 (09 ndash 119) tonnes in 2010 Some 340 tonnes of mercury is used per year in dentistry of which about 70-100 tonnes (ie 20shy30) likely enters the solid waste stream
In the production of vinyl chloride monomer information is still lacking on the lifecycle and eventual fate of the mercury catalyst Most of this production occurs in China and about 800 tonnes of mercury is thought to have been used by this industry in China in 2012 Used mercury catalyst is recycled and reused by enterprises that hold permits for hazardous waste management The amounts that may be emitted or released are unknown
Ronald de Hom
mel
Artisanal and small-scale gold mining Unlike most small-scale gold miners the green gold miners of Oro Verde shown here employ an environmental way of mining gold that does not use mercury or other chemicals
10
UNEP Global Mercury Assessment 2013
Results by region The greatest proportion of anthropogenic mercury emissions to the atmosphere comes from Asia which contributes about 50 of the global total The majority of Asian emissions come from East and Southeast Asia China accounts for three-quarters of East and Southeast Asian emissions or about one third of the global total
New data on emissions from ASGM have increased the proportion of global emissions attributed to South America and Sub-Saharan Africa largely due to increased estimates associated with improved information about ASGM activities in these areas
Emissions to air from other major source sectors are higher in Europe North America and Oceania
Mercury emission 2010 gkm2
0 2 5 10 100 1000
Global distribution of anthropogenic mercury emissions to air in 2010
Emissions from various regions in tonnes per year with the range of the estimate and as a percentage of total global anthropogenic emissions Note These numbers cannot be compared directly with those presented in the 2008 assessment (see Chapter 4 Trends in mercury emissions to the atmosphere)
See figure on the following Region Emission (range) tonnes page for map with
Australia New Zealand amp Oceania 223 (54 - 527) 11 specification of regions Values rounded to 3 Central America and the Caribbean 472 (197 - 974) 24
significant figures CIS amp other European countries 115 (426 - 289) 59
East and Southeast Asia 777 (395 - 1690) 397
European Union (EU27) 875 (445 - 226) 45
Middle Eastern States 370 (161 - 106) 19
North Africa 136 (48 - 412) 07
North America 607 (343 - 139) 31
South America 245 (128 - 465) 125
South Asia 154 (782 - 358) 79
Sub-Saharan Africa 316 (168 - 514) 161
Undefined (global total for emissions from 825 (700 - 950) 42 contaminated sites)
Grand Total 1960 (1010 ndash 4070) 100
11
UNEP Global Mercury Assessment 2013
North America
Central America and the Caribbean
South America
Unintentional emissions
Stationary combustion (coal)
Stationary combustion (oil and gas) Oil refining
Pig iron and steel
Intentional uses
Artisanal and small-scale gold mining Chlor-alkali
EU27
North Africa
Sub-Saharan Africa
Non-ferrous metals (Cu Pb Zn Al) Mercury
Large-scale gold
Cement
Product waste
Cremation
CIS amp other European countries
500
100
Middle Eastern States East and Southeast Asia
50
10 tonnes
South Asia Australia New Zealand amp Oceania
South America
North America
Central America and the Caribbean
Sub-Saharan Africa
South Asia North Africa
Middle Eastern States
EU
East and Southeast Asia
CIS amp other European countries
Australia New Zealand amp Oceania
Estimates of 2010 anthropogenic mercury emissions to air from different main sectors in different regions ASGM is shown separately to highlight its geographic distribution and better allow regional comparisons to be made for other sectors
12
UNEP Global Mercury Assessment 2013
Compiling the 2010 inventory of anthropogenic mercury emissions to air The inventories used in successive Global Mercury Assessments continue to improve as better data become available The 2013 update presents an inventory of emissions for 2010 that has a number of improvements over the 2008 assessment and its inventory for 2005
bull A more detailed analysis of emissions from some major source sectors For example fossil fuel consumption is now broken down into categories for combustion in power plants industry and other uses The type of coal or oil used is also considered providing a more accurate estimate of mercury emissions
bull A more detailed consideration of the mercury content of fuels and raw materials used in different countries and regions bull New and updated information on ASGM bull The use of different pollution control technologies
in different countries and regions have been factored into the emissions estimate bull Emission estimates for sectors not previously
included such as aluminium production oil refining and contaminated sites bull More and better information on location of major
point sources such as individual power plants smelters and cement kilns bull Better documentation and greater transparency
with respect to the data and information behind the estimates
The methods for estimating emissions from industrial sectors is complemented by other methods used for more dispersed emissions sources For example estimating emissions from some intentional-use sectors requires intensive work with those sectors Relevant and accurate information about ASGM is generally not available through official channels Estimating mercury emissions from its intentional use in lighting batteries and other products requires analysing the entire production use and waste stream to determine where mercury is likely to be released and in what quantities The approach used in the 2013 assessment addresses the emissions from breakages and wastes resulting from use of these mercury-containing products in society the majority of
which are incinerated or end up in landfills It does not however address industrial wastes or sewage sludge incineration
Uncertainties in emission estimates Estimates of mercury emissions are just that estimates To compile a global assessment requires making a number of assumptions and generalizations Uncertainty associated with the 2010 inventory arises from each of the factors used to estimate the emissions the correctness of the activity data the validity of the emission factors applied and the validity of assumptions regarding the effectiveness and use of emission-control technologies
Based on an evaluation of these sources of uncertainty and the relative contributions of sectors with reliable information and those with less reliable data uncertainty in the 2010 inventory assessment of total anthropogenic mercury emissions to air gives a range of emissions from 1010-4070 tonnes This range is greater than that reported in some previous assessments reflecting a greater appreciation of the sources of uncertainty due to the improved estimation methods and perhaps a more realistic appraisal of the state of knowledge concerning some aspects of emissions
The best estimate taking a conservative approach is 1960 tonnes If nationally produced estimates for 2010 available from some countries (Canada Japan Korea Mexico the United States and European countries reporting to LRTAP) are introduced into the global inventory in place of the inventory estimates the corresponding estimated total global anthropogenic emission to air is 1940 tonnes As most national inventories do not include uncertainty ranges it is not possible to assign a range to this number The recognition of uncertainties is an important consideration and presenting single national estimates can convey a misleading picture of what is known and more importantly not known about emissions
The numbers derived using the methods employed to produce the global inventory for 2010 were compared with a number of national inventories and emissions reported under other systems covering the same period In general the level of agreement was good in particular when the significant uncertainties
13
UNEP Global Mercury Assessment 2013
Methods for estimating emissions All global mercury emissions inventories to date have used the same basic approach for the major sectors emitting mercury to the atmosphere For specific emission sectors national emissions estimates are calculated by multiplying the amount of activity (ie amounts of fuels burned raw materials consumed or materials produced) by an emission factor that is an estimate of the mercury emitted per unit of activity For example emissions from coal-fired power generation are estimated by multiplying the tonnes of coal used by the amount of mercury estimated to be released per tonne of coal In most such inventories ldquoabatedrdquo emission factors have been employed to quantify both the emissions of mercury that occur during the processes and the effects of mercury emission controls In the new methodology used to develop the 2013 report these components are split ldquoUnabatedrdquo emission factors are employed to quantify the emissions and ldquotechnology profilesrdquo have been developed to represent the effects of mercury emission controls
Various methods are employed to estimate emissions of mercury at individual sources and at national regional and global levels In general the methods fall under one of two main categories
bull Mass-balancesubstance-flow based estimates which are based on the principle that what goes in must come out Amounts of mercury in fuels and raw materials constitute the inputs and the outputs are the amounts of mercury emitted to air released to water or land retained in products or in wastes or otherwise recovered and stored or disposed of
involved in both global and national estimates are taken into account It is important to note that there are good reasons why estimates of mercury emissions produced in the 2010 inventory may not fully agree with national inventories made by countries using other methodologies These reasons include
bull Reporting schemes may define and distinguish emissions source sectors in very different ways and aligning these sectors may not be possible
bull Industry reporting to national government may be limited to sources with emissions above a certain threshold level so that emissions from smaller sources below the threshold are not reported Where smaller sources make up a significant part of the source category reported inventories
bull Measurement-based estimates which rely on measurements made at appropriate points in the industrial process or in the productwaste output streams These measurements are used to estimate where the mercury goes as in the method above
In principle the two approaches should produce the same results In practice mass-balance based approaches tend to result in higher emission estimates than most measurement-based estimates Since future emissions reporting is likely to involve a combination of these two approaches further work is required to understand why results may differ and to reconcile the two approaches
Since the 2008 UNEP assessment was produced the number of direct measurements of emissions from certain point sources (in particular power plants and some metal and cement production plants and waste incineration facilities) has increased considerably resulting in a much improved knowledge base
A number of countries require regular reporting of emissions Increasing use is being made in these reporting systems of measurement-based estimates and facility-level reporting in particular for major point sources In other countries national mercury emissions are only being quantified for the first time Since 2005 and the start of the UNEP negotiating process in 2010 many countries have initiated work on national emission inventories which in several cases have yielded much improved information on activity data sector characteristics and mercury emissions Such inventories often make use of the UNEP Toolkit for identification and quantification of mercury emissions
may therefore significantly underestimate total mercury emissions bull National inventories in some countries are making
increasing use of actual measurements of mercury emissions at individual facilities At the global scale it is not yet feasible to base an inventory on individual site emissions Furthermore actual measurements of mercury emissions at a source may be taken only a few times during a year and may not be fully representative of normal operations In the 2013 assessment a mass-balance based approach was employed to be consistent transparent and replicable bull National reporting and monitoring schemes
may provide information that is not available to externally produced inventories
14
UNEP Global Mercury Assessment 2013
Despite these considerations most of the discrepancies noted between the 2010 inventory mass-balance-based estimates and national estimates based on measurement- approaches are modest and within the margins of error associated with the different approaches In cases where the differences are larger it is important to recognize that there are sources of error in all methods for estimating mercury emissions
Gunnar Futsaelig
ter
Sampling of mercury emissions at the Kendal coal-fired power plant in South Africa conducted under a UNEP project A probe with mercury traps is inserted into a sampling port in the stack to collect mercury present in the flue gas The mercury traps are subsequently analysed according to the US EPA Mercury Monitoring Toolkit sampling protocol
15
UNEP Global Mercury Assessment 2013
Trends in mercury emissions to the atmosphere 4 Assessing global and sectoral trends A key question in assessing anthropogenic mercury emissions worldwide is whether they are increasing or decreasing While it is tempting simply to compare the 2010 inventory with its 2005 counterpart the results would mean little As inventory methods develop and as additional sources are considered the estimate of total anthropogenic mercury emissions worldwide also changes While some changes reflect real trends others reflect changes in methods or scope Thus comparing the results of previous assessments with the present update requires considerable care and involves an understanding of the way in which these inventories have been produced and the uncertainties associated with them
It is possible however to compare certain sectors over time by attempting to compensate for any methodological changes between the various inventories since 1990
Emissions to air are thought to have peaked in the 1970s From 1990 to 2005 total anthropogenic emissions of mercury to the atmosphere appear to
Emissions to air t
1400
1200
1000
800
600
400
200
0
1990
1995
2000
2005
Africa Asia Europe Russia North Oceania South America America
Estimates of annual anthropogenic mercury emissions from different continentsregions 1990-2005
have been relatively stable with decreases in Europe and North America being offset by increases in Asia A reanalysis of the available inventories since 1990 however indicates that emissions from industrial sectors at least may be starting to increase again
The changes introduced in the 2010 inventory methodology prevent a straight-forward continuation of this analysis However an evaluation of trends for some sectors between 2005 and 2010 has been made by applying the new methodology to activity data for 2005 This comparison suggests a further slight increase in the combined amount of mercury emitted by industrial sectors (coal combustion production of cement pig iron and steel and non-ferrous metals) The following paragraphs describe the trend results for three sectors to illustrate some of the developments between 2005 and 2010 and some of the the difficulties in comparing emissions estimates between different years made with different methods
Coal burning for power generation and for industrial purposes continues to increase especially in Asia However increases in the application of air pollution controls including some mercury specific technologies together with more stringent regulations in a number of countries have reduced mercury emissions from coal burning in power plants in particular and thus offset some part of the emissions arising from increased coal consumption
In the United States for example emissions from coal burning at power plants have reportedly decreased from about 53 tonnes in 2005 to 27 tonnes in 2010 This decrease is largely due to new regulations that have resulted in changes in the sources of the coal that is burned in large power plants and the installation of mercury controls as well as controls on sulphur dioxide and particulates that have the co-benefit of further reducing mercury emissions
In China many of the new coal-fired power plants have state-of-the-art pollution controls installed
Emissions of mercury from artisanal and small-scale gold mining (ASGM) reported for 2010 are more than twice those reported for 2005 While the
16
UNEP Global Mercury Assessment 2013
Unintentional emission sectors Coal burning ferrous- and non-ferrous (Au Cu Hg Pb Zn) metal production cement production Intentional-use sectors Disposal and incineration of product waste cremation emissions chlor-alkali industry
Comparison of emissions in 2005 and 2010 by selected sector and region
Unintentional emission sectors
Emission t
1000
800
600
400
200
0 2005 2010
Australia New Zealand amp Oceania
Central America and the Caribbean
CIS amp other European countries
East and Southeast Asia
rise in the price of gold (from USD 400 per ounce in 2005 to USD 1100 per ounce in 2010) along with increased rural poverty may indeed have caused more activity in this sector the increased estimate for mercury emissions is considered to be due primarily to some more and better data from many countries and regions West Africa for example was regarded as having minimal ASGM in 2005 but is now recognized as a region with considerable activity Thus the baseline has improved without necessarily any change in actual activity or emission levels
Waste from consumer products is affected by the amount of mercury used For most products in which mercury is used mercury-free alternatives exist Consequently many of these uses of mercury are declining at least in some regions as alternative products or processes are adopted Compact fluorescent light bulbs are an exception Even though the mercury content of individual light bulbs has decreased use of this type of light bulb is increasing rapidly
Artisanal and small-scale gold mining Intentional-use sectors
1000 1000
Step change from 2005 to 2010 due to new information 800 800 (under-estimation in 2005)
600 600
400 400
200 200
0 0 2005 2010 2005 2010
European Union (EU27) South America
Middle Eastern States South Asia
North Africa Sub-Saharan Africa
North America
In order to make valid assessments of trends in emissions from global inventories comparable data on activity levels are required together with information on changes in fuel and raw material characteristics and applied air pollution control technology One aim of the 2010 inventory methods is to create a firmer foundation for such future trend analysis
Ralf Siemieniec Shutterstockcom
Use of mercury-containing energy-saving lamps is increasing
17
UNEP Global Mercury Assessment 2013
Emission scenarios and future trends The 2008 Global Atmospheric Mercury Assessment included a first attempt at projecting future emissions inventories These were based on three scenarios continuing with the status quo applying current emissions controls worldwide and achieving maximum feasible technological reductions At the time this effort was regarded as highly provisional Since then additional studies have extended and improved this work but the results are not markedly different from earlier projections of future mercury emissions
Global mercury models have been used to evaluate future scenarios Four global and hemispheric models projected mercury levels around the world in 2020 based on the three emission scenarios described earlier In industrial regions the status quo will cause an increase in mercury levels of 2-25 and in remote areas of 15-5 The two emission control scenarios on the other hand yield a decrease in mercury in industrial areas of 25-35 and in remote areas of 15-20
Another global model was coupled with estimates of surface reservoirs of mercury in order to quantify source-receptor relationships for the present and for 2050 Under the best-case scenario of maximum feasible reductions projected estimates for deposition in 2050 is similar to estimates for today In the other scenarios increasing emissions lead to increasing deposition A greater proportion of mercury emissions is expected to be in the oxidized form so that a greater proportion will be deposited near the source instead of being transported far away
The model results support the conclusion that reducing anthropogenic emissions will slowly reduce the amount of mercury in biologically available reservoirs Over time mercury in the environment will be taken out of circulation by natural processes for example from ocean waters down into sediments and biologically available mercury will decrease Increased emissions on the other hand will continue to build up the amount of mercury in circulation
With new databases and methods it may soon be possible to create scenarios that incorporate activity levels as well as technology use for each country If this were done it would allow countries to assess the effects of different mercury reduction strategies on their national emissions For example a country could determine the relative contributions of emission reduction technology as opposed to for example changes in raw materials
18
UNEP Global Mercury Assessment 2013
Atmospheric chemistry monitoring and trends 5 Forms of mercury in air Mercury in the atmosphere is in three primary forms Gaseous elemental mercury is the most common in anthropogenic and natural emissions to the atmosphere Gaseous oxidized mercury and mercury bound to particulates are less common The transport and deposition of atmospheric mercury depend greatly on whether the mercury is elemental or oxidized Elemental mercury stays in the atmosphere long enough for it to be transported around the world whereas oxidized and particulate mercury are more readily captured in existing pollution control systems or deposited relatively rapidly after their formation As a result most mercury in the air is in the gaseous elemental phase Relatively little elemental mercury is deposited directly but instead must fi rst be oxidized
Although gaseous oxidized mercury is very important in mercury cycling between air and other environmental compartments the process of oxidation in the air is poorly understood with reactions and resulting compounds yet to be verified in observations
When mercury moves from air to water and land it is generally in an oxidized gaseous or particulate form whereas when it is re-emitted to air it has been converted back to gaseous elemental
Particulate associated mercury
Pole
Equator
Gaseous elemental mercury
Global transport
Gaseous elemental mercury can be transported globally Mercury emitted in particulate form tends to deposit closer to sources
mercury Sunlight appears to play a large role in both oxidation and reduction of mercury but temperature and biological interactions are also likely to be involved to some degree Here too much uncertainty remains Nonetheless the reactions are important in determining net deposition and fate of mercury
Monitoring of mercury in air Monitoring of mercury in air focuses on the three primary forms of mercury The measurement of gaseous elemental mercury is routine and robust Measuring gaseous oxidized mercury and particulate-bound mercury however is challenging Concentrations are typically very low and these forms are chemically unstable leading to high uncertainty in the measurements Nonetheless these forms are critical for defining and modelling the fate and transport of airborne mercury
In the past two decades coordinated mercury monitoring networks and long-term monitoring sites have been established in a number of regions measuring mercury concentrations in the air as well as deposition of mercury in precipitation In Europe and North America high-quality continuous monitoring has been going on for more than 15 years especially in the Arctic High-quality monitoring has started more recently in East Asia and South Africa as part of a global effort to expand the coverage provided by long-term monitoring sites
Measurements and trends in atmospheric mercury Monitoring stations around the world have provided information about trends in atmospheric mercury though the time periods vary depending on how long the site has been active Overall a declining trend in background mercury levels over the past decade has been recorded from monitoring stations
19
UNEP Global Mercury Assessment 2013
in many regions Other regions however show an increase in mercury levels
The sites also provide information about geographical patterns reflecting both background levels of
Trends in atmospheric measurements of mercury
Site(s) Period
Mace Head Ireland 1996-2011
North America rural sites 1995-2005
High Arctic sub-Arctic Up to 20 years of records mid-latitudes
Monitoring networks Mercury monitoring in Europe is carried out under the European Monitoring and Evaluation Programme (EMEP) one of the first international environmental measurement networks Heavy metals such as mercury have been included in the EMEP program since 1999 Mercury measurements are available only from northern and northwestern Europe
Three monitoring networks currently operate in North America providing good coverage of Canada and the United States the Mercury Deposition Network the Canadian Air and Precipitation Monitoring Network and the Atmospheric Mercury Network More recently new sites have been established in Mexico extending coverage on the continent The stations monitor atmospheric mercury and mercury in precipitation which has measured since the mid-1990s Monitoring of mercury in the air and in precipitation has been underway in Asia for nearly a decade
Alert Nord
Point Barrow
Nuuk Stoacuterhoumlfethi
Mace Head
mercury and local and regional influences Mercury concentrations at remote sites in Asia are higher than in other regions of the Northern Hemisphere Coastal cities in China have lower levels than inland sites likely due to the influence of relatively clean
Measurement Trend
Gaseous elemental mercury Decrease of 14-18 per year
Total gaseous mercury Decrease of 22 to 174 in total
Total gaseous mercury Decreasing trend at some stations increasing at others
The monitoring network of the Arctic Monitoring and Assessment Programme (AMAP) includes air and deposition monitoring sites located in Arctic regions of Canada Greenland Iceland Norway Russia and Sweden
Building on existing national and regional monitoring networks the European Union-financed project
ldquoGlobal Mercury Observation Systemrdquo (GMOS) started in November 2010 Its goal is to develop a coordinated global system for monitoring mercury including a large network of ground-based monitoring stations New sites are being installed in regions where few monitoring stations exist especially in the Southern Hemisphere Two sites have been established in Antarctica one on the Antarctic Plateau and one on the coast
Ny-Aringlesund
Amderma Pallas
Raringouml Bredkaumllen
Listvyanka Diabla Gora
Mauna Loa
Mt Bachelor
Celestuacuten Calhau
Longobucco
Iskrba Niembro Monte Cimone Cap
Ferrat Mt Waliguan Ganghwa Island
Lulin
Cape Hedo Ev-K2
Mt Changbai
Minamata Mt Ailao
Nieuw Nickerie
Kodiakanal
Maheacute Island Manaus
Bariloche Cape Point
Amsterdam Island Cape Grim
Dumont drsquoUrville
AMAP CAMnet EMEP GMOS GMOS associated NADPAIRMoN NADPMDN
Air + precipitation Air Precipitation
20
UNEP Global Mercury Assessment 2013
John Munthe
The mercury background air monitoring station at Zeppelin mountain Svalbard
air from over the ocean Sites off the Asian coast however show higher levels of gaseous elemental mercury than the Northern Hemisphere background suggesting an outflow from the Asian mainland
Weather patterns have also been found to have a strong influence on seasonal patterns in mercury levels in the air at monitoring sites At the Mount Waliguan Observatory on the Tibetan Plateau for example northeasterly and easterly winds produced the highest levels of mercury
Measurements at high altitudes Measurements from ground-based stations above 2700 meters suggest that there is an inverse relationship between gaseous elemental mercury and gaseous oxidized mercury at these elevations In other words when there is more elemental mercury there is less oxidized mercury and vice versa These measurements are in good agreement with modelling results which gives additional confidence in current understanding of the behaviour of mercury at high altitude
An inverse relationship between total gaseous mercury and particulate concentration has also been observed in the high stratosphere From the transformation rate of total gaseous mercury to particulate-bound mercury it appears that gaseous mercury lasts about two years in the stratosphere
21
UNEP Global Mercury Assessment 2013
Atmospheric concentrations and deposition 6 Measurements and trends of mercury in precipitation Mercury deposited by precipitation decreased from the 1990s into the 2000s at many but not all sites in North America and Western Europe where such measurements were taken
Regional patterns are also evident including slightly higher levels in southern Europe than northern Europe and higher levels in Asia than in North America Total mercury concentrations in precipitation in China were much higher than those in Japan and South Korea Th is was mostly attributed to higher levels of gaseous oxidized mercury and particulate-bound mercury which are readily deposited by precipitation and thus not transported far
A comparison of data from Canadian and American monitoring sites found that deposition of mercury in precipitation was highest in summer
Dry deposition of mercury which is deposition not associated with precipitation is diffi cult to measure and consequently there is little information on trends in mercury dry deposition Th is lack of information means that it is also diffi cult to validate model results for dry deposition
106 44
474 72 91
5 7 71
05 1 5 10 100 500 1000
Total mercury emission (2005) kgcell
Modelled mercury air concentrations and deposition patterns Atmospheric mercury concentrations are highest in major industrial regions Models examining global patterns show that East and South Asia Europe North America and South Africa have the highest levels of elemental mercury in the air Concentrations are generally lower in the Southern Hemisphere than the Northern Hemisphere because most industrial activity is in northern regions Th ese model results are based on simulations using the 2005 global mercury emission inventory because the 2010 inventory has only recently become available
Intercontinental transport of mercury in the air has been examined to determine its impact on regional mercury levels Four models using diff erent parameters produced consistent results Depending on the region mercury emitted by distant sources contributes between 10 and 30 of annual mercury deposition Where local sources are low mercury transported from distant emission sources can account for more than half of the deposition East Asia is the dominant source region adding 10-14 to the deposition in
Contribution from sources outside receptor region
Model 40
GEOS-Chem GLEMOS GRAHM CMAQ-Hg
30
20
10
0 Arctic Europe North East Asia South Asia
America
Receptor region
(Left ) Global distribution of anthropogenic mercury emissions in 2005 with source regions that were considered in the analysis (North America South America Europe Africa Central Asia South Asia East Asia Australia and Oceania) and (right) the contribution of anthropogenic sources outside a particular receptor region to deposition within the receptor region
22
UNEP Global Mercury Assessment 2013
Modelling atmospheric transport and deposition Global models reproduce the movement of mercury in the atmosphere during which the mercury may move between continents They have been effective in examining sources of mercury to the Arctic and also for examining the outflow of pollution from South and Southeast Asia and its impact on western North America as well as the flow from eastern North America to Europe
Regional models on the scale of a continent or a basin such as the Mediterranean can provide more detail about specific source areas even to the level of individual industrial areas Reliable results however require a detailed understanding of mercury oxidation in the atmosphere about which there is considerably uncertainty
Most atmospheric transport models consider the full chain of mercury processes in the atmosphere Some models also consider how mercury is cycled in other atmospheric compartments such as soil vegetation snow freshwater and seawater
One of the largest sources of uncertainty in mercury models is the chemical mechanism used to determine how mercury changes forms in the air Improved experimental data can help improve model performance by making sure that the correct reactions are simulated The processes that lead from deposition to re-emission also need to be understood better Advances in this area show promise with model results becoming closer to estimates based on experimental data
other regions of the world Natural emissions and re-emissions account for 35-70 of total deposition in most regions Deposition is generally greater in low and mid-latitudes due to stronger sunlight higher concentrations of oxidants and higher precipitation
Regional mercury models show patterns at the scales of continents or individual seas The Mediterranean Sea for example is a net source of mercury as it emits more than is deposited to it In that region dry deposition generally exceeds deposition of mercury in precipitation In Central and Southern Europe total gaseous mercury concentrations and deposition in precipitation were both consistently higher than the European average
Across the United States dry deposition accounts for two-thirds of total annual deposition mainly from gaseous oxidized mercury A study examining sources and deposition of mercury to assess the
benefits of proposed emission control measures found that mercury transport from outside the country accounts for 68 of mercury deposition in the Northeast and up to 91 in the west-central United States Large point sources contribute up to three-quarters of nearby deposition and power plants contributed half of the deposition in the eastern part of the country This suggests that new emissions standards would primarily benefit eastern regions of the US
In Asia studies show high seasonal variation in mercury concentration and deposition Anthropogenic emissions are responsible for about 75 of deposition in East Asia In this region there is a net removal of gaseous oxidized mercury from the atmosphere and a net export of gaseous elemental mercury
In the Arctic gaseous elemental mercury levels in the atmosphere are depleted rapidly in spring when after the long Arctic winters sunlight returns Ozone is depleted at the same time and it is believed that bromine-containing compounds are the cause of the photo-chemical reactions that deplete ozone and mercury During these events gaseous oxidized mercury and particulate-bound mercury levels increase sharply suggesting that the gaseous mercury is oxidized and deposited enhancing mercury deposition in Arctic areas in springtime Recent research however has found that 50-80 of the deposited mercury is re-emitted within a few days Similar springtime mercury depletion events have been seen in Antarctica
23
UNEP Global Mercury Assessment 2013
Anthropogenic releases to the aquatic environment 7 Global assessment Previous UNEP global mercury assessments only considered emissions to the atmosphere The 2013 Report presents the first attempt at compiling a global inventory of mercury releases to aquatic environments Releases directly into the aquatic environment present a completely different chemistry set of pathways and fate to those released to air They are also more directly linked to the risks posed by mercury to global environmental and human health Unlike mercury releases to air which are predominantly in the form of gaseous elemental mercury releases to water are predominantly inorganic mercury and to a lesser extent liquid elemental mercury
At present only some sources of aquatic releases can be quantified with any confidence Thus many sources that may be important are not included in this first assessment of global aquatic releases For example land management practices that expose new geological sources of mercury in rocks and mineral soils or that re-mobilize previously deposited mercury cannot yet be assessed Two broad categories of current anthropogenic sources are considered here point sources of mercury release to water and diffuse releases of mercury as a result of its remobilisation from areas where it was previously deposited or accumulated due to human activity (ie contaminated sites) Artisanal and small-scale gold mining (ASGM) mercury-containing pesticides and fungicides used in agriculture and deforestation are considered separately
Point source releases to water from various sectors in tonnes per year with the range of the estimate and as a percentage of total anthropogenic emissions
Sector Releases (range) tonnes
Non-ferrous metal production 925 (193 - 268)
Consumer product waste 894 (222 - 308)
Chlor-alkali production 28 (10 ndash 55)
Oil refining 06 (03 ndash 1)
Grand Total 185 (426 ndash 582)
The global estimate of mercury release to water from point sources has been derived from the atmospheric emissions assessment and the approach employed in the UNEP Toolkit to partition total mercury releases between air land and water This approach has considerable uncertainty and may omit sectors where releases to water are high but air emissions are unimportant and therefore not addressed in the inventory Global releases from point sources were estimated to be 185 tonnes per year
For diffuse sources evaluating the relative contribution of anthropogenic and natural sources to the aquatic environment requires determining considerations of the various mercury inputs For some sectors data exist that allow a preliminary assessment of the amounts of mercury re-mobilized into aquatic systems
For mercury-contaminated sites the range of average soil concentrations of mercury reported for sites where mercury was mined used or otherwise released by human activity was considered The area of contamination is then used to determine how much mercury is available in soils and when combined with a factor for how much mercury is released from those soils in a year the total release can be estimated Among identified contaminated sites mercury mining is identified as the largest sector followed by mining of precious metals Total releases to aquatic environments from contaminated sites are estimated to be 83-335 tonnes per year
Releases to water from contaminated sites in tonnes per year with the range of the estimate
Sector Releases (range) tonnes
Primary mercury mining sites 67 ndash 266
Precious metal production sites 14 ndash 55
Non-ferrous metal production sites 01 ndash 05
Chlor-alkali production sites 01 ndash 05
Other industrial sites 01 ndash 03
Grand Total 83 ndash 335
24
UNEP Global Mercury Assessment 2013
Much of the mercury released from artisanal and small-scale gold mining goes into rivers lakes soils and sediments and tailings From soils and tailings it may be re-mobilized by leaching and erosion In addition mining may disturb mercury-containing soils and sediments that may then erode more quickly releasing more mercury than would otherwise have become available from natural erosion A key factor in these processes is the local hydrological cycle of precipitation evaporation run-off and river flow To account for this in the assessment countries were designated as dry wet or intermediate to determine the relative importance of erosion The tropical and subtropical countries which have the greatest activity in this sector also tend to experience high precipitation and run-off exacerbating this source of mercury release and re-mobilization Total worldwide releases of mercury to land and water from ASGM were estimated at over 800 tonnes per year How much of this is released to water cannot yet be determined
Mercury continues to be used in pesticides and fungicides 2100 tonnes of mercury were released in the decade of the 1960s through such agrochemical uses Current data are unavailable although the use of mercury in these products has been greatly reduced
Deforestation especially in the Amazon Basin can lead to extensive soil erosion and thus the release of mercury previously accumulated in soils Using 2010 figures for deforestation rates around the world and an estimate of soil concentrations of mercury as much as 260 tonnes of mercury may have been released into rivers in 2010 as a result of deforestation worldwide
Because this is the first attempt to quantify global mercury releases to the aquatic environment there is no previous measurement against which these results can be compared Thus it is not possible at this time to evaluate trends in releases
Uncertainties in release estimates Estimating global releases of mercury to aquatic environments is being done here for the first time Many data are missing and others are imprecise A number of assumptions have been made based on what measurements are available or on other grounds to extrapolate from known quantities or to calculate aquatic releases in relation to atmospheric
or other emissions Thus the results should be treated with great caution It is nonetheless clear that anthropogenic sources and human activity contribute hundreds of tonnes of mercury to aquatic environments each year a substantial amount relative to estimated natural releases 150-960 tonnes per year from terrestrial environments
Lapshin Shutterstockcom
Phil Augustavo istockphotocom
Bureau of Land Managem
ent
Contaminated sites (top) erosion following deforestation (middle) and a flooded store of mercury-contaminated waste (lower) illustrate potential sources of mercury releases to water
25
UNEP Global Mercury Assessment 2013
Aquatic pathways transport and fate 8 Mercury in aquatic environments The pathways and fate of mercury in aquatic environments are important because it is in waters sediments and wetland soils that inorganic mercury is converted into methylmercury which is toxic and concentrates in animals The majority of human exposure to mercury and the health risk that comes with mercury exposure is from consumption of marine foods Thus this section focuses on the worldrsquos oceans Some freshwater systems however are important sources of fish for human consumption especially for subsistence and recreational fisheries often among indigenous peoples Artisanal and small-scale gold mining (ASGM) communities may also be affected through fish consumption and drinking water if those are contaminated by local releases
The major processes of mercury cycling are generally similar for all aquatic systems Inorganic mercury in dissolved or particulate form is the dominant mercury type in most marine and fresh waters Dissolved gaseous elemental mercury accounts for less than 30 of total mercury in water Methylmercury is often present at trace levels but may in some settings reach 30 of total mercury In freshwater and coastal environments inorganic mercury is transformed into methylmercury primarily in sediments In the open ocean this conversion takes place largely at intermediate depths between 200 and 1000 meters in the water column Mercury is lost from aquatic systems in two ways When inorganic mercury is reduced to elemental mercury it can be re-emitted to the atmosphere When inorganic mercury binds to particulates in water it can settle out rapidly and be buried in sediments Deep burial in ocean sediments is one of the major pathways by which mercury is removed from the biologically active environment
The global mercury cycle is chemically and physically complex Thus it is necessary to use models to study describe and predict what happens and will happen to mercury in the aquatic environment Until recently only one model existed that incorporated
air land and water into a unified whole The model has been validated against observations of mercury and represents the current scientific consensus The largest potential errors in this model in terms of the aquatic cycle concern details of the exchange of mercury between air and water
Pathways and fate of mercury in the oceans Model simulations suggest that anthropogenic impacts on mercury levels in the ocean are greatest in the surface waters the top 100 meters or so of the water column While model results vary one recent estimate suggests that anthropogenic emissions over the last 100 years have doubled the concentration of mercury in the surface layer of the ocean and increased it by 25 in intermediate waters and by 10 in deep waters The difference is due to the length of time it takes for surface waters to circulate to the depths
Models and measurements agree that direct deposition from the atmosphere is the dominant pathway by which mercury reaches the oceans The exceptions are smaller semi-enclosed basins such as the Mediterranean Sea or the Arctic Ocean where river runoff coastal erosion and ocean currents
Ugo M
ontaldo Shutterstockcom
26
UNEP Global Mercury Assessment 2013
account for about half of mercury inputs The most recent modelling effort suggests that total deposition input of mercury to the oceans in 2008 was 3700 tonnes
Other mercury pathways appear less important on a global basis Rivers are estimated to carry more than 2800 tonnes of mercury each year but only about 380 tonnes of this is transported offshore The rest is trapped by particles in estuaries Groundwater and re-mobilization from sediments provide 100shy800 tonnes of mercury to the oceans each year Undersea hydrothermal vents add less than 600 tonnes of mercury to the oceans There are high concentrations of mercury in vent fluids but a great deal of the mercury is precipitated as solids once the vent fluids enter seawater
Models suggest that globally about 70 of the mercury deposited into the ocean is re-emitted to the atmosphere Oxidized mercury in surface waters is reduced by biological and photochemical processes to the elemental form that is volatile and readily re-emitted The removal of this mercury ultimately reduces the pool of mercury that could be converted to methylmercury and be accumulated by marine organisms The re-emission process thus simultaneously prolongs the lifetime of mercury cycling through the atmosphere and upper ocean and acts to reduce mercury availability for marine food webs
Any changes in the efficiency of mercury reduction in surface waters or the rate of re-emission is likely to impact mercury concentrations in surface waters and the air One example is the effect of sea ice in the Arctic Ocean which blocks the re-emission
Tony Magdaraog Shutterstockcom
Mercury accumulated in marine food-webs can enter the human diet
of elemental mercury leaving elevated levels in waters under ice Changes in primary productivity could change the rate at which mercury is bound to particles thus affecting re-emission to the atmosphere as well as rates of downward transport in the ocean Changes in oxidant levels in the atmosphere such as ozone and bromine may also influence the rate of oxidation of gaseous elemental mercury and thus deposition rates to the ocean
Methylmercury in the ocean Natural bacterial processes in seawater and in sediments in coastal environments convert inorganic mercury to methylmercury Methylmercury levels are highest in the subsurface waters of many oceans because it is formed at these intermediate depths likely as a result of the decomposition of organic material falling from surface waters Current understanding indicates that about 300 tonnes of methylmercury is produced in the upper ocean by this and related processes By contrast only about 80 tonnes of methylmercury reaches the ocean from other sources such as atmospheric deposition rivers and diffusion from sediments
Current modelling indicates that methylmercury stays in the upper ocean for about 11 years Deshymethylation by photochemical reaction or by microbial activity is the major removal process for methylmercury in the ocean About 240 tonnes of methylmercury is removed by this process from the surface waters of the ocean per year
The other important pathway for methylmercury in seawater is uptake into marine food webs Although only about 40 tonnes per year is taken up in this way it is this fraction that poses risks to marine animals and human consumers of seafood Methylmercury is a problem for several reasons First it is taken up by plankton much more efficiently than is inorganic mercury resulting in concentrations in plankton that are as high as 10000 times the concentration in seawater Second methylmercury is absorbed through the intestine of animals much more easily than is inorganic mercury Third methylmercury biomagnifies as it moves up the food web Thus methylmercury becomes an increasingly greater proportion of the mercury in organisms higher in the food web This explains why some indigenous populations that consume top marine predators such as fish seals and whales have some of the worldrsquos highest concentrations of methylmercury giving rise to health concerns
27
UNEP Global Mercury Assessment 2013
Pathways and fate of mercury in freshwater Observations and modelling both show that there are in general many similarities between mercury chemistry pathways and fate in lakes and in the oceans but with obvious differences in scale and in the relative importance of different processes Modelling of mercury dynamics was done for four lakes with a history of direct mercury inputs from the largest freshwater lake in the world (Lake Superior) to small lakes in Ontario Canada Atmospheric deposition and river inflow were the main sources of inorganic mercury Much of the mercury input from lake and river catchments was associated with dissolved and particulate organic matter The dominant mercury removal mechanisms as in saltwater were burial in sediments and photochemical reduction of oxidized mercury to elemental mercury followed by re-emission to the air In Lake Superior and Lake Michigan there is evidence for methylation of mercury in the water column as is seen in the open ocean
Methylmercury levels in freshwater fish vary with the level of deposition of mercury from the air though other factors such as inputs from the watershed and the number of trophic levels within the lakersquos food web are also important Methylation predominantly occurred in lake sediments and wetlands and floodplain soils where sulphateshyreducing bacteria are believed to be primarily responsible Methylmercury is de-methylated in sediments and also taken away in the outlet river from each lake
Some 400-1400 tonnes of mercury are estimated globally to be trapped behind dams and other man-made impoundments each year This has in many cases led to significant increases in total mercury and methylmercury levels in water and of methylmercury in fish and other aquatic species When artificial lakes are created plant material is submerged leading to decay and anoxia In these conditions microbially driven methylation of inorganic mercury takes place In some cases the elevated mercury levels have also been observed downstream from the artificial lakes and reservoirs
Anthropogenic impacts on aquatic mercury levels Two studies have reported that the Atlantic and Pacific Oceans have shown opposing trends over recent decades While the influence of changing ocean currents and other oceanographic factors may be a factor the trends do make sense in light of patterns of anthropogenic emissions In the North Pacific Ocean mercury concentrations appear to have increased at depths between 200 and 1000 meters over the last few decades This increase coincides with the rapid industrialization of East Asia
In the North Atlantic however results from near Bermuda suggest a substantial decrease in mercury concentration and a change in the mercury profile through the water column The Mediterranean Sea too showed a decrease in mercury concentration between 1990 and 2004 These findings are consistent with atmospheric data from around the North Atlantic The conclusion is that mercury levels in seawater in the North Atlantic were elevated by human activity but may now be declining likely as a result of decreased emissions from North America and Europe
A complementary approach to measuring mercury in seawater is to measure mercury in aquatic animals which accumulate and integrate mercury over time Teeth hair feathers and eggshells are useful long-term archives of mercury concentrations and can provide data from the pre-industrial period (ie before 1800) as well as more recent periods
Among marine animals samples are available from several regions particularly from the Arctic where cold dry conditions help preserve animal tissues Mercury concentrations between the 13th and 16th
centuries were relatively stable From the mid- to late 19th century to the end of the 20th century mercury levels increased by an average of 12 times On average therefore about 92 of the mercury in Arctic marine wildlife today is likely to be of anthropogenic origin
Similar findings were found for a 700-year sequence of seabird eggshells from the South China Sea Mercury levels increased steadily between 1800 and 2000 with a particularly rapid increase after 1970 Concentrations since 2000 are about 10 times higher than pre-industrial levels with 91 of the mercury now likely to be of anthropogenic origin In the Antarctic studies of seal hairs show that pre-industrial mercury levels were only 60 of recent levels The relatively small difference
28
UNEP Global Mercury Assessment 2013
Historical Hg concentration as a proportion of present-day 100
80
60
40
20
0
Beluga teeth Human teeth
Gyrfalcon feathers Perigrine falcon feathers
Polar bear hair Ringed seal teeth
1200 1300 1400 1500 1600 1700 1800 1900 2000
between pre-industrial and modern mercury levels in Antarctic is consistent with lower mercury emissions and atmospheric concentrations in the Southern Hemisphere as compared with the Northern Hemisphere
The timing of long-term increases of mercury in aquatic animals can shed light on the likely sources of mercury emissions that were responsible The industrialization of Europe and North America appear responsible for the large increases in marine mercury levels that began in the 19th century as these increases occurred prior to recent Asian industrialization As with water concentrations in the Pacific Ocean recent rapid increases in mercury in seabird eggs in the South China Sea coincide with industrialization in Asia
The time lag in aquatic ecosystem response One important conclusion from air-ocean modeling is that the oceans have not yet reached equilibrium with current atmospheric levels of mercury This lag is due to several factors First mercury stays in the upper ocean above 200 meters depth for about 30 years and for centuries in intermediate and deep waters This is much longer than the one year residence time in the lower atmosphere Thus removal from the ocean takes much longer than does removal from the air and so concentrations will change more slowly
Second because of the long lifetime of mercury in deeper ocean waters a great deal of natural mercury is present in the ocean already about 100000 tonnes out of a total of 135000 tonnes in intermediate waters and 200000 out of 220000 tonnes in deep waters
Rune Dietz
Analysis of museum samples reflects the increase in mercury emissions and releases since the mid-19th century associated with anthropogenic activities
Third vertical transport of mercury from intermediate depths back to the surface returns a substantial amount of mercury to the biologically active zone each year As a result average mercury concentrations in seawater and marine animals are likely to increase slowly for decades if not centuries even if atmospheric levels stabilize at present levels In short the effects of historical anthropogenic emissions from Europe and North America are still being observed in the oceans at the same time that the effects of the recent rise in emissions from Asia are being seen
Regionally different trends can be expected depending on distance from sources and ocean circulation patterns In the North Atlantic north of 55deg N it will take 50-600 years to achieve equilibrium between atmospheric and seawater mercury levels In the North Pacific this process is estimated to take 500-700 years and in the Antarctic 700-1000 years The Arctic Ocean by contrast is smaller and will only take about 35 years to reflect changes in atmospheric mercury levels Surface waters of the Mediterranean Sea should show also changes within 10-50 years
Time lags in the responses of many freshwaters and their food-webs to changes in atmospheric mercury levels are also expected Although some immediate recovery following reductions in atmospheric mercury deposition rates is likely full recovery may take decades centuries or longer depending on the characteristics of the area Highly polluted freshwaters with catchments and sediments containing large amounts of anthropogenic mercury will recover most slowly as is already observed around point sources such as smelters that have closed down
29
UNEP Global Mercury Assessment 2013
Major gaps in knowledge 9 Large uncertainties remain in global estimates of mercury emissions to the air These stem from various sources including the availability of information on activity levels but mainly from the lack of information concerning the mercury content of some raw materials and the validity of assumptions regarding processes and technologies employed to reduce mercury emissions including their rates of application and effectiveness The accuracy and precision of measurement-based estimates can depend on the validity of extrapolating measurements made at infrequent intervals to longer periods or measurements made at one plant to other facilities with similar operations
Potentially important emissions sectors that are still not quantified in the emissions inventory include the use of mercury in vinyl-chloride monomer production secondary metals production oil and gas extraction transport and processing industrial and hazardous waste incineration and disposal sewage sludge incineration and dental fillings preparation and removal
Current measurements and their evaluation are inadequate for determining spatial and temporal trends Improved more extensive and better coordinated measurements are needed A permanent global integrated monitoring network for atmospheric mercury and mercury deposition is needed to achieve this goal The atmospheric network sites should be closely integrated with water soil and biological monitoring networks The results can be used for model testing and evaluation as well as for more accurately detailing the geographic impact of anthropogenic emissions Monitoring of mercury concentrations in the important marine food species is essential to understanding possible human health impacts and the effects of future emissions changes
Better data on mercury distribution in the troposphere is needed to improve understanding of long-range transport and source-receptor relationships Coordinated studies at high altitudes and by aircraft are needed This information will
also help validate regional and global scale models improving their prediction capabilities with regard to different policy scenarios
Key processes related to global transport and cycling of mercury remain inadequately understood The chemical form of gaseous oxidized mercury is unknown Reduction and oxidation rates for mercury in the presence of atmospheric oxidants need further study including determining which oxidants are important New measurements and modelling studies are needed to examine key chemical and physical processes that affect global transport and cycling
Few data are available for reporting mercury releases to aquatic systems Systematic and consistent monitoring of mercury releases to the air is required especially for contaminated systems Releases of mercury from soils into waters depend greatly on climate and topography and these parameters need to be better accounted for Consistent approaches for measuring and reporting releases from point sources are needed to ensure comparability of data from around the world In particular the actual role of artisanal and small-scale gold mining (ASGM) in emissions to air and releases to water needs to be more accurately estimated
The link between mercury deposition methylation and uptake by living organisms needs further study The parameters that determine the rates of exchange of mercury compounds between air and sea air and soil and air and vegetation are not fully understood Whole-ecosystem studies of mercury are needed to better understand biogeochemical cycling Methylationdemethylation rates and their spatial and temporal variations and relationship to climatic factors need to be determined in most of worldrsquos major ocean basins as well as in representative freshwaters
30
UNEP Global Mercury Assessment 2013
Key findings of the 2013 assessment 10 Atmosphere Total anthropogenic emissions of mercury to the atmosphere in 2010 are estimated at 1960 (1010shy4070) tonnes which is about 30 of the total mercury that was emitted and re-emitted from anthropogenic and natural sources in that year The largest anthropogenic sources are associated with artisanal and small-scale gold mining (ASGM) and coal burning which together account for about 62 of the annual total anthropogenic emissions to air Other major sectors include ferrous and non-ferrous metal production and cement production
East and Southeast Asia are responsible for about 40 of global anthropogenic emissions About 75 of the mercury from this region comes from China which is about one-third of the global total Increased estimates for emissions from ASGM largely a result of newly obtained data and improved information mean that South America and Sub-Saharan Africa are also responsible for a greater proportion of global emissions than was previously assumed
Anthropogenic emissions over time have increased mercury loads present in the environment This leads to higher rates of re-emission and also means that there will be a time lag of years or decades between emissions reductions and lower mercury levels in the food web including pathways of human exposure
Mercury emissions to the atmosphere likely peaked in the 1950s to 1970s and subsequently declined because of reductions in Europe Russia and North America Emission trends are unclear due to changes in methods employed to produce inventories and differences in the sectors that have been accounted at different times There are however some indications that emissions may be rising again with increases from East Asia offsetting continuing reductions in Europe and North America
Aquatic environments Natural processes in aquatic systems convert less toxic elemental and inorganic mercury into much more toxic methylmercury Methylmercury concentrates and accumulates in the food web leading to high concentrations in some species of seafood and fish that many people eat
Anthropogenic releases of mercury to aquatic environments contribute hundreds of tonnes to the amount of mercury cycling in the environment Diffuse releases and point sources appear equally important Atmospheric deposition however remains the most important input of mercury to land and oceans and has increased the amount of mercury in many environmental compartments by a factor of two or three since the start of the industrial age On land mercury that is deposited is largely retained in soils and vegetation increasing the available pool for re-mobilisation to adjacent aquatic systems Re-emission from soils however is a major addition to atmospheric mercury
Hydrology is the most important factor in the transport of mercury from catchments to downstream environments Relatively little of this mercury reaches the open ocean as most is captured in sediments behind dams in estuaries and near the coast Changes in land cover and land use can have a large effect on mercury mobilisation as exposed soils erode and mercury leaches into the water table
Concentrations of mercury in Arctic marine animals today are about 10-12 times higher than in preshyindustrial times (ie prior to about 1800) This means that on average about 92 of the mercury in marine predators such as seabirds seals and whales is anthropogenic in origin The timing of the increase suggest that 19th and early 20th century emissions from Europe North America and Russia were responsible Increases mercury concentrations in seabirds in the South China Sea appear to be more recent than the Arctic increases coinciding with increasing industrialisation in East and Southeast Asia
31
UNEP Global Mercury Assessment 2013
K+S Entsorgung Gm
bH
Recovered mercury is being stockpiled at long-term storage sites above- and as shown here below ground
The upper 100 meters of the oceans have twice the mercury that they did a century ago Intermediate and deeper waters have 10-25 more mercury on average reflecting the slow transport of mercury downwards in the oceans Seawater concentrations will thus be especially slow in responding to changes in mercury inputs from atmospheric deposition and river flow As a result mercury concentrations in marine biota are likely to increase slowly for decades to centuries even without an increase in atmospheric emissions
In freshwater ecosystems atmospheric deposition and re-mobilisation from soils slow the reduction of mercury levels even in regions where atmospheric concentrations have decreased due to emission controls
Further increases in atmospheric emissions will have long-term consequences for commercial fisheries and all consumers of marine and freshwater foods
It is likely to be years or decades before reductions in anthropogenic emissions and releases of mercury have a demonstrable effect on mercury levels throughout the environment and in the fish and marine mammals which are part of the human food-chain This only reinforces the need to act now to continue and strengthen international efforts to reduce current mercury emissions and releases Delays in action now will inevitably lead to slower recovery of the worldrsquos ecosystems in future from mercury contamination leaving an even greater legacy of pollution for future generations
32
Division of Technology Industry and Economics (DTIE) Chemicals Branch Geneva Switzerland January 2013
Job number DTI1636GE
UNEP Global Mercury Assessment 2013
Report and is fully referenced according to standard scientific practice As such it is the single reference for the Summary Report It has again been prepared in co-operation with the Arctic Monitoring and Assessment Programme (AMAP) and uses national data and information submitted by several governments Contributions have also been incorporated from the UNEP Global Mercury Partnership in particular its partnership areas on mercury control from coal combustion reducing mercury in artisanal and small-scale gold mining (ASGM) and mercury air transport and fate AMAP mercury expert group UN Economic Commission for Europe (UN ECE) Long-range Transboundary Air Pollution (LRTAP) Convention groups industry and non-governmental organizations Each section was prepared by a team of experts and then reviewed to ensure its scientific accuracy The evaluation of information of mercury released into the aquatic environment benefits from contributions from the Group of Experts on Scientific Aspects of Marine Environmental Protection (GESAMP)
Scope and coverage This update to the Global Mercury Assessment provides the most recent information available for the worldwide emissions releases and transport of mercury in atmospheric and aquatic environments To the extent possible the information comes from the published scientific literature supplemented where necessary by other sources Since the Global Mercury Assessment is intended as a basis for decision making emphasis is given to anthropogenic emissions (mercury going into the atmosphere) and releases (mercury going into water and land) that is those associated with human activities
The Technical Background Report includes a detailed inventory of global mercury emissions to air based on data for 2010 ldquoInventoryrdquo in this context means a compilation of the estimated emissions and releases from various sectors and sources While it attempts to catalogue all major sources of mercury emissions worldwide it should not be regarded as complete and exhaustive
In addition for the first time this Global Mercury Assessment includes an evaluation of information of mercury released into the aquatic environment and its associated pathways and fate The information available for this evaluation is less complete than
that for emissions to air and is based on data from recent years The inclusion of this new element of the Global Mercury Assessment is as a response to the requests from many governments in the Intergovernmental Negotiating Committee (INC) for more information on releases to land and water The aquatic environment is the main route of exposure to humans and wildlife because it is in water that inorganic mercury is transformed into highly toxic methylmercury
The Technical Background Report includes chapters on
bull Global Emissions of Mercury to the Atmosphere describing sources anthropogenic emissions and trends in emissions bull Atmospheric Pathways Transport and Fate
examining pathways levels and trends in air and deposition and modelling of pathways and deposition bull Global Releases of Mercury to Aquatic Environments
containing global estimates of releases to water and bull Aquatic Pathways Transport and Fate examining
mercury pathways in aquatic systems that result in important routes of human exposure
Technical Background Report chapters were prepared by teams of experts and then reviewed to ensure their scientific validity This Summary Report is based on the content of the Technical Background Report and has been reviewed by the authors of the Technical Background Report It was also circulated for national review
This Summary Report provides in Chapter 2 an overview of natural and anthropogenic sources of mercury outlining the main sectors involved The global inventory of anthropogenic emissions to air is presented in Chapter 3 and Chapter 4 describes trends in mercury emissions to the atmosphere What happens after mercury is released to the atmosphere is covered in Chapter 5 on atmospheric chemistry monitoring and deposition and Chapter 6 on atmospheric concentrations and deposition Chapter 7 provides a first attempt to estimate global releases to water followed in Chapter 8 by a discussion of aquatic pathways transformations and fate A review of gaps in knowledge is given in Chapter 9 Chapter 10 summarizes key findings
2
UNEP Global Mercury Assessment 2013
Whatrsquos new in the Global Mercury Assessment 2013 Global mercury emissions inventories continue to improve as new data and better data become available concerning some sources The method for compiling the inventory of anthropogenic emissions to the atmosphere has also been revised and improved Differences in air pollution control technologies and differences in the mercury content of raw materials and fuels in different countries and regions have been factored into emissions calculations to better reflect actual conditions in each country
In the Global Mercury Assessment 2013 a new updated inventory based on data from 2010 is presented in which some new sources (including emissions from combustion of natural gas and primary aluminium production and emissions associated with oil refining) have been quantified for the first time A more detailed analysis has also been made of some of the major mercury emission sectors including the break-down of emissions from coal burning in power plants industrial and other uses In addition new information acquired through the UNEP Global Mercury Partnership area on Reducing Mercury in Artisanal and Small-scale Gold Mining in particular from the Artisanal Gold Council has resulted in a significant re-evaluation of emissions from the ASGM sector
New observational data and new modelling results provide fresh insight into atmospheric mercury transport and fate
Kevin Telmer
One of the objectives of the updated assessment has been to provide transparent documentation and comprehensive compilations of the data that form the basis for all of the estimates presented This approach will allow a more consistent and replicable method for compiling the global mercury emission inventory so that valid comparisons can be made in the future In addition a wider range of experts from around the world have been involved in preparing the Technical Background Report on which this summary is based
The inclusion of an assessment of releases of mercury to the aquatic environment and its subsequent pathways and fate is a further significant development as these topics were not addressed in the 2008 UNEP Global Atmospheric Mercury Assessment The aquatic environment is critical for three reasons
bull Hundreds of tonnes of mercury is released directly into water so an inventory limited to mercury emissions to air provides an incomplete assessment of anthropogenic impacts on the mercury cycle
bull Mercury in aquatic environments can be transformed into methylmercury which is far more toxic to humans and animals and can enter and biomagnify in food webs more readily than other forms of mercury bull Much human exposure to mercury is through
the consumption of fish and other marine foods making aquatic pathways the critical link to human health
A large open artisanal and small-scale gold mining pit
3
UNEP Global Mercury Assessment 2013
Sources of mercury emissions to air and releases to water 2 Mercury is a naturally occurring element and is found throughout the world There are thus many natural sources of mercury creating background environmental levels that have been present since long before humans appeared
Mercury is contained in many minerals including cinnabar an ore mined to produce mercury Much of the present day demand for mercury is met by supply from mercury recovered from industrial sources and stockpiles rather than from mercury mining Mercury is also present as an impurity in many other economically valuable minerals in particular the non-ferrous metals and in fossil fuels coal in particular
Human activity especially mining and the burning of coal has increased the mobilization of mercury into the environment raising the amounts in the atmosphere soils fresh waters and oceans The majority of these human emissions and releases of mercury have occurred since 1800 associated with the industrial revolution based on coal burning base-metal ore smelting and gold rushes in various parts of the world To some extent the same drivers of mercury emissions and releases are continuing with fossil-fuel-based energy generation powering industrial and economic growth in Asia and South America which in turn helps drive high demand for metals including gold spurring artisanal and small-scale gold mining (ASGM) around the world
In preparing inventories of mercury emissions and releases it is important to distinguish various categories of sources Three main types of emissions and releases can be distinguished each of which is briefly introduced here in qualitative terms with particular emphasis on anthropogenic sources
Natural sources of mercury emissions and releases Mercury in the earthrsquos crust can be emitted and released in several ways to air water and land Natural weathering of mercury-containing rocks
farbled Shutterstockcom
Cinnabar the principal ore of mercury
Year 2000
1950
1900
1850
1800
1750
1700
Mt St Helens (1980)
Industrial period
WWII manufacturing
Krakalau (1883)
Gold rush (circa 1850-84)
Tambora (1815)
Pre-industrial period
1998 core 1991 core Natural background Natural events (volcanic eruptions) Localregional anthropogenic sources Global anthropogenic (industrialization)
0 5 10 15 20 25 30 35 40 Total mercury ngL
Ice core record of deposition from Wyoming USA The elevated levels associated with the 1850-84 US gold rush probably reflect localregional sources rather than a global signature Increasing environmental levels of mercury associated with industrialization however are found in environmental archives like this ice core around the globe
4
UNEP Global Mercury Assessment 2013
Global mercury cycling Mercury is released to the environment from natural sources and processes and as a result of human activities Once it has entered the environment mercury cycles between air land and water until it is eventually removed from the system through burial in deep ocean sediments or lake sediments and
through entrapment in stable mineral compounds Methylmercury the most toxic and bioaccumulative form of mercury which presents the greatest health risk to humans and wildlife is mainly formed in aquatic environments through natural microbial processes
80shy600
3700
2000shy2950
2000 300shy600
1700shy2800
3200
380
lt600
Geogenic Anthropogenic
Anthropogenic Biomass burning
Soil and vegetation
Deposition to oceans
Rivers
Deposition to land
freshwater
Geogenic
Oceans
Anthropogenic
Natural
Re-emissions Re-mobilization
Units tonnes
1 tonne = 1000 kilograms
Global mercury budgets based on models illustrate the main environmental compartments and pathways that are of importance in the global mercury cycle and the ways in which natural and anthropogenic releases to air land and water move between these compartments Emissions to air arise from natural sources and anthropogenic sources as well as re-emissions of mercury previously deposited from air onto soils surface waters and vegetation
is continuous and ubiquitous allowing mercury to escape to air and to be washed into lakes and rivers Volcanoes emit and release mercury when they erupt Geothermal activity can also take mercury from underground and emit it to the atmosphere and release it to the deep oceans Some recent models of the flow of mercury through the environment suggest that natural sources account for about 10 of the estimated 5500-8900 tonnes of mercury currently being emitted and re-emitted to the atmosphere from all sources
onime Shutterstockcom
5
UNEP Global Mercury Assessment 2013
Anthropogenic sources of mercury emissions and releases Anthropogenic sources of mercury emissions account for about 30 of the total amount of mercury entering the atmosphere each year
As found in previous global mercury assessments the main industrial sources of atmospheric mercury are coal burning mining industrial activities that process ores to produce various metals or process other raw materials to produce cement In these activities mercury is emitted because it is present as an impurity in fuels and raw materials In these cases mercury emissions and releases are sometimes referred to as lsquoby-productrsquo or lsquounintentionalrsquo emissions or releases A second category of sources includes sectors where mercury is used intentionally Artisanal and small-scale gold mining (ASGM) is the largest of these in which mercury emissions and releases result from the intentional use of mercury to extract gold from rocks soils and sediments Other intentional-use release sectors include waste from consumer products (including metal recycling) the chlor-alkali industry and the production of vinyl-chloride monomer
Coal burning and to a lesser extent the use of other fossil fuels is one of the most significant anthropogenic source of mercury emissions to the atmosphere Coal does not contain high concentrations of mercury but the combination of the large volume of coal burned and the fact that a significant portion of the mercury present in coal is emitted to the atmosphere yield large overall emissions from this sector The mercury content of coal varies widely introducing a high degree of uncertainty in estimating mercury emissions from coal burning Data on mercury content is now available from many countries including major emitters of mercury
Mining smelting and production of iron and non-ferrous metals are also a large source of global mercury emissions to air and also a very important sector with regard to releases to water In the mining and processing of metals most of the mercury is captured and either stockpiled or sold for use in various products creating anthropogenic sources associated with intentional use discussed below Nonetheless the volume of ores and metals involved result in large total emissions and releases The relatively small volume of primary mercury production makes mercury mining a far smaller source today than it has been in the past
Cement production which typically involves the burning of fossil fuels to heat the materials required to make cement is another major anthropogenic source of mercury emissions Both the raw materials and the fuel may contain mercury and lead to emissions The amount of mercury involved varies greatly with the mercury content of these fuels and especially with the raw materials In some countries cement kilns are burning increasing amounts of alternative fuels including wastes that may contain mercury This may add to the emissions from cement kilns
Oil refining emits and releases mercury as oil deposits are known to contain mercury generally at low concentrations Mercury is removed from most petroleum products and natural gas prior to combustion and therefore combustion-related emissions are low Most of the mercury in crude oil is associated with solid waste that is disposed of in landfills However emissions and releases during refining of crude oil do occur and these have been quantified for the first time in the 2010 inventory The inventory does not quantify other emissions and releases during oil and gas extraction and transport or from flaring
Unintentional mercury emissions from these sectors can be reduced by the application of pollution control measures at power plants and industrial plants Some of the mercury captured is refined and enters the commercial supply chain however large amounts of mercury captured in materials such as fly ash and oil refinery waste need to be disposed of Some of the resulting wastes are themselves used as raw materials for example in construction materials but large amounts are disposed of in landfills which can thus become a potential source of mercury emissions and releases
Among intentional-use sectors Artisanal and small-scale gold mining is a major source for emissions and releases of mercury worldwide In ASGM miners use mercury to create an amalgam separating gold from other materials They then have to separate the mercury from the gold Calculating emissions from this sector presents a particular challenge because it is typically widely dispersed and often unregulated and may be illegal Uncertainties regarding release estimates from the ASGM sector are therefore high Furthermore the miners are typically poor and perhaps have little awareness of the hazards of mercury and pollution control devices may be hard to obtain
Wastes from consumer products containing mercury can end up in landfills or incinerators
6
UNEP Global Mercury Assessment 2013
Mercury is still used in a wide range of products including batteries paints switches electrical and electronic devices thermometers blood-pressure gauges fluorescent and energy-saving lamps pesticides fungicides medicines and cosmetics Once used many of the products and the mercury they contain enter waste streams While mercury in landfills may slowly become re-mobilized to the environment waste that is incinerated can be a major source of atmospheric mercury especially from uncontrolled incineration Incinerators with state-of-the-art controls have low emissions
Another use of mercury is in dental amalgam for filling teeth When bodies are cremated mercury in fillings can be emitted Mercury can also be emitted and released during production and preparation of fillings and from the disposal or removed fillings In addition mercury from removed fillings can be recycled or go into solid waste and wastewater
The amount of mercury released in the recycling of scrap metals for example in secondary steel and nonshyferrous metal production is generally assumed to be much lower than that released during primary metal production which is why the present global inventory only addresses primary metal production However lower emissions from recycling may not be the case in all countries Much of the scrap steel in some countries comes from automobiles that may still have devices that contain mercury and which may not be removed prior to recycling of the steel These devices are largely being phased out so mercury emissions from scrap steel may be expected to decrease However large differences exist between countries in the way they treat their mercury-containing wastes including scrap metals that are recycled in secondary metal production
Mercury is also used in a number of industrial processes A major industrial use is in the chlor-alkali industry where mercury-cell technology may be used in the production of chlorine and caustic soda
Mercury is also used as a catalyst in the production of vinyl chloride monomer (VCM) from acetylene mainly in China
Mercury releases to aquatic systems as a result of current human activities arise from many of the same uses or the presence of mercury in various products and processes that emit mercury to the air As with emissions to the atmosphere aquatic releases come from two main sources First mercury is released with water effluent from the sites where mercury is used Second mercury can leach into water from disposal sites that have mercury in the waste
zhu difeng Shutterstockcom
Tomas Pavelka Shutterstockcom
bikeriderlondon Shutterstockcom
Anthropogenic sources of mercury from industry and intentional use
Gunnar Futsaelig
ter
7
UNEP Global Mercury Assessment 2013
Arnold John Labrentz Shutterstockcom
Re-emission and re-mobilization of mercury Re-emissions constitute the third category of sources presently comprising about 60 of mercury emissions to air Mercury previously deposited from air onto soils surface waters and vegetation from past emissions can be emitted back to the air Re-emission is a result of natural processes that convert inorganic and organic forms of mercury to elemental mercury which is volatile and therefore readily returns to the air Mercury deposited to plant surfaces can be re-emitted during forest fires or biomass burning Mercury may be deposited and re-emitted many times as it cycles through the environment
It is important that re-emitted mercury should not be considered a natural source It may originally have come from natural or anthropogenic sources but by the time it is re-emitted it is difficult or impossible to identify its specific origin Nonetheless human activity has increased the environmental burden of mercury resulting in higher levels of re-emission This is compounded by changes in land use practices as well as increasing temperatures due to climate change
In the aquatic environment re-mobilization of mercury occurs when mercury deposited on and accumulated in soils or sediments is re-mobilized by for example rain or floods that cause the mercury to enter or re-enter the aquatic system Resuspension
of aquatic sediments due to wave action or storm events is an additional way for mercury to re-enter the aquatic ecosystems
Estimating re-emission and re-mobilization rates is difficult It is often done using modelling approaches These models are based on data on atmospheric levels and other observations as well as current understanding of chemical transformations and other processes that determine how mercury moves between air land and water The models aim to balance the amount of mercury in circulation at any given time while remaining consistent with observational data Temperature is a key factor With lower temperatures re-emission rates are generally lower
Re-emission is also a major factor in determining the length of time needed for anthropogenic emission reductions to be reflected in decreasing environmental levels of mercury Mercury emitted in one year may be deposited to and retained in soils and waters for some time before being re-emitted or re-mobilized in subsequent years This cycle can be repeated keeping levels in air and water elevated even after anthropogenic sources have been lowered Conversely continuing to add to the global pool will leave an ever-longer legacy of anthropogenic mercury contamination worldwide It is thus imperative that international efforts to reduce mercury emissions continue and are strengthened as soon as possible
Forest fires re-emit mercury deposited to vegetation
8
UNEP Global Mercury Assessment 2013
Anthropogenic emissions to the atmosphere 3 Global emissions inventory The global emissions inventory for 2010 estimates that 1960 tonnes of mercury was emitted to the atmosphere as a direct result of human activity The leading sectors remain the same as those identified in the 2005 inventory Improved data however have changed the relative contributions of some of these sectors as have some actual changes in emissions All coal burning emissions taken together for example represent a lower percentage of the total emissions than in the 2005 inventory This is due in part to the increased estimates from artisanal and small-scale gold mining (ASGM) and in part to much lower estimates for domestic use of coal When the actual amount of mercury emitted from coal combustions in power generation and industrial uses is considered and the estimates are based on the same 2010 methodology the emissions in 2010 are the same and perhaps slightly higher than in 2005 Even though new coal-fired power plants are being built combustion efficiency and emissions controls are also improving in most parts of the world
Results by selected sector The updated inventory of emissions to air confirms coal burning as a continuing major source of emissions responsible for some 475 tonnes of mercury emissions to air annually compared with around 10 tonnes from combustion of other fossil fuels According to the new inventory more than 85 of these emissions are from coal burning in power generation and industrial uses In the previous assessment emissions from domestic and residential coal burning were highlighted as a possible larger contribution Better information on coal consumption for domestic and residential uses indicates that these activities are a smaller contribution to total emissions from coal burning than previously thought
Emissions from the cement production industry are largely dependent on the raw materials and the fuels used The new inventory avoids double
Emissions from various sectors in tonnes per year with the range of the estimate and as a percentage of total anthropogenic emissions Note These numbers cannot be compared directly with those presented in the 2008 assessment (see Chapter 4 Trends in mercury emissions to the atmosphere)
Sector Emission (range) tonnes
By-product or unintentional emissions
Fossil fuel burning
Coal burning (all uses) 474 (304 - 678) 24
Oil and natural gas burning 99 (45 ndash 163) 1
Mining smelting amp production of metals
Primary production of 455 (205 ndash 241) 2 ferrous metals
Primary production of nonshy 193 (82 ndash 660) 10 ferrous metals (Al Cu Pb Zn)
Large-scale gold production 973 (07 ndash 247) 5
Mine production of mercury 117 (69 ndash 178) lt1
Cement production 173 (655 - 646) 9
Oil refining 16 (73 - 264) 1
Contaminated sites 825 (70 - 95) 4
Intentional uses
Artisanal and small-scale 727 (410 ndash 1040) 37 gold mining
Chlor-alkali industry 284 (102 ndash 547) 1
Consumer product waste 956 (237 ndash 330) 5
Cremation (dental amalgam) 36 (09 - 119) lt1
Grand Total 1960 (1010 ndash 4070) 100
Values rounded to 3 significant figures To nearest percent
Sectors for which emissions are not currently quantified
biofuel production and combustion
vinyl-chloride monomer production emissions during
secondary metals production and ferro-alloys
oil and gas extraction transport and processing other than refinery emissions
industrial some hazardous waste incineration and disposal
sewage sludge incineration
preparation of dental amalgam fillings and disposal of removed fillings containing mercury
9
UNEP Global Mercury Assessment 2013
Disposal of waste from
Mercury-cell chlor-alkali
industry
Relative contributions to estimated emissions to air from anthropogenic sources in 2010
Oil refining
Coal combustion
Oil and natural gas combustion
Primary ferrous metal production
Primary non-ferrous metal (Al Cu Pb Zn)
Large-scale gold production
Hg production Cement production
mercury-containing products
Contaminated sites
Cremation
Artisanal and small-scale gold production
counting of emissions from conventional fuels (such as coal and oil) that are included under the industrial fossil fuel burning emissions However it does attempt to account for emissions from other fuels including alternative fuels (such as old tyres and other wastes) and from raw materials Increasing amounts of waste are being co-incinerated in the cement industry both as fuel but also in some plants as a means of disposing of hazardous wastes some of which may contain mercury In some regions additional measures are being introduced to make sure that mercury emissions associated with waste co-incineration do not increase overall emissions from cement plants
Increased application of air pollution control devices including some mercury-specific technologies together with more stringent regulations in several countries have the effect of reducing mercury emissions from coal burning sectors and thus offset some part of the emissions arising from increased activity
Artisanal and small-scale gold mining emissions are in the 2010 inventory the major source of emissions to air at 727 tonnes per year The reasons for the large increase in the estimate compared to 2005 are discussed below (see page 16) The global estimate for emissions from ASGM includes a significant contribution from China although
recent information on this sector in China is lacking China prohibited ASGM in 1996 and therefore records no emissions from this sector
Mercury-cell technology is becoming less common in the chlor-alkali industry as other more cost-effective processes are adopted No new plants are being constructed though many older plants remain to be converted Old chlor-alkali plants and other decommissioned industrial sites may constitute contaminated sites that continue to release mercury to the environment for many years and emissions from contaminated sites are now part of the inventory
Global emissions from use of mercury in dental amalgam resulting from cremation of human remains are estimated at 36 (09 ndash 119) tonnes in 2010 Some 340 tonnes of mercury is used per year in dentistry of which about 70-100 tonnes (ie 20shy30) likely enters the solid waste stream
In the production of vinyl chloride monomer information is still lacking on the lifecycle and eventual fate of the mercury catalyst Most of this production occurs in China and about 800 tonnes of mercury is thought to have been used by this industry in China in 2012 Used mercury catalyst is recycled and reused by enterprises that hold permits for hazardous waste management The amounts that may be emitted or released are unknown
Ronald de Hom
mel
Artisanal and small-scale gold mining Unlike most small-scale gold miners the green gold miners of Oro Verde shown here employ an environmental way of mining gold that does not use mercury or other chemicals
10
UNEP Global Mercury Assessment 2013
Results by region The greatest proportion of anthropogenic mercury emissions to the atmosphere comes from Asia which contributes about 50 of the global total The majority of Asian emissions come from East and Southeast Asia China accounts for three-quarters of East and Southeast Asian emissions or about one third of the global total
New data on emissions from ASGM have increased the proportion of global emissions attributed to South America and Sub-Saharan Africa largely due to increased estimates associated with improved information about ASGM activities in these areas
Emissions to air from other major source sectors are higher in Europe North America and Oceania
Mercury emission 2010 gkm2
0 2 5 10 100 1000
Global distribution of anthropogenic mercury emissions to air in 2010
Emissions from various regions in tonnes per year with the range of the estimate and as a percentage of total global anthropogenic emissions Note These numbers cannot be compared directly with those presented in the 2008 assessment (see Chapter 4 Trends in mercury emissions to the atmosphere)
See figure on the following Region Emission (range) tonnes page for map with
Australia New Zealand amp Oceania 223 (54 - 527) 11 specification of regions Values rounded to 3 Central America and the Caribbean 472 (197 - 974) 24
significant figures CIS amp other European countries 115 (426 - 289) 59
East and Southeast Asia 777 (395 - 1690) 397
European Union (EU27) 875 (445 - 226) 45
Middle Eastern States 370 (161 - 106) 19
North Africa 136 (48 - 412) 07
North America 607 (343 - 139) 31
South America 245 (128 - 465) 125
South Asia 154 (782 - 358) 79
Sub-Saharan Africa 316 (168 - 514) 161
Undefined (global total for emissions from 825 (700 - 950) 42 contaminated sites)
Grand Total 1960 (1010 ndash 4070) 100
11
UNEP Global Mercury Assessment 2013
North America
Central America and the Caribbean
South America
Unintentional emissions
Stationary combustion (coal)
Stationary combustion (oil and gas) Oil refining
Pig iron and steel
Intentional uses
Artisanal and small-scale gold mining Chlor-alkali
EU27
North Africa
Sub-Saharan Africa
Non-ferrous metals (Cu Pb Zn Al) Mercury
Large-scale gold
Cement
Product waste
Cremation
CIS amp other European countries
500
100
Middle Eastern States East and Southeast Asia
50
10 tonnes
South Asia Australia New Zealand amp Oceania
South America
North America
Central America and the Caribbean
Sub-Saharan Africa
South Asia North Africa
Middle Eastern States
EU
East and Southeast Asia
CIS amp other European countries
Australia New Zealand amp Oceania
Estimates of 2010 anthropogenic mercury emissions to air from different main sectors in different regions ASGM is shown separately to highlight its geographic distribution and better allow regional comparisons to be made for other sectors
12
UNEP Global Mercury Assessment 2013
Compiling the 2010 inventory of anthropogenic mercury emissions to air The inventories used in successive Global Mercury Assessments continue to improve as better data become available The 2013 update presents an inventory of emissions for 2010 that has a number of improvements over the 2008 assessment and its inventory for 2005
bull A more detailed analysis of emissions from some major source sectors For example fossil fuel consumption is now broken down into categories for combustion in power plants industry and other uses The type of coal or oil used is also considered providing a more accurate estimate of mercury emissions
bull A more detailed consideration of the mercury content of fuels and raw materials used in different countries and regions bull New and updated information on ASGM bull The use of different pollution control technologies
in different countries and regions have been factored into the emissions estimate bull Emission estimates for sectors not previously
included such as aluminium production oil refining and contaminated sites bull More and better information on location of major
point sources such as individual power plants smelters and cement kilns bull Better documentation and greater transparency
with respect to the data and information behind the estimates
The methods for estimating emissions from industrial sectors is complemented by other methods used for more dispersed emissions sources For example estimating emissions from some intentional-use sectors requires intensive work with those sectors Relevant and accurate information about ASGM is generally not available through official channels Estimating mercury emissions from its intentional use in lighting batteries and other products requires analysing the entire production use and waste stream to determine where mercury is likely to be released and in what quantities The approach used in the 2013 assessment addresses the emissions from breakages and wastes resulting from use of these mercury-containing products in society the majority of
which are incinerated or end up in landfills It does not however address industrial wastes or sewage sludge incineration
Uncertainties in emission estimates Estimates of mercury emissions are just that estimates To compile a global assessment requires making a number of assumptions and generalizations Uncertainty associated with the 2010 inventory arises from each of the factors used to estimate the emissions the correctness of the activity data the validity of the emission factors applied and the validity of assumptions regarding the effectiveness and use of emission-control technologies
Based on an evaluation of these sources of uncertainty and the relative contributions of sectors with reliable information and those with less reliable data uncertainty in the 2010 inventory assessment of total anthropogenic mercury emissions to air gives a range of emissions from 1010-4070 tonnes This range is greater than that reported in some previous assessments reflecting a greater appreciation of the sources of uncertainty due to the improved estimation methods and perhaps a more realistic appraisal of the state of knowledge concerning some aspects of emissions
The best estimate taking a conservative approach is 1960 tonnes If nationally produced estimates for 2010 available from some countries (Canada Japan Korea Mexico the United States and European countries reporting to LRTAP) are introduced into the global inventory in place of the inventory estimates the corresponding estimated total global anthropogenic emission to air is 1940 tonnes As most national inventories do not include uncertainty ranges it is not possible to assign a range to this number The recognition of uncertainties is an important consideration and presenting single national estimates can convey a misleading picture of what is known and more importantly not known about emissions
The numbers derived using the methods employed to produce the global inventory for 2010 were compared with a number of national inventories and emissions reported under other systems covering the same period In general the level of agreement was good in particular when the significant uncertainties
13
UNEP Global Mercury Assessment 2013
Methods for estimating emissions All global mercury emissions inventories to date have used the same basic approach for the major sectors emitting mercury to the atmosphere For specific emission sectors national emissions estimates are calculated by multiplying the amount of activity (ie amounts of fuels burned raw materials consumed or materials produced) by an emission factor that is an estimate of the mercury emitted per unit of activity For example emissions from coal-fired power generation are estimated by multiplying the tonnes of coal used by the amount of mercury estimated to be released per tonne of coal In most such inventories ldquoabatedrdquo emission factors have been employed to quantify both the emissions of mercury that occur during the processes and the effects of mercury emission controls In the new methodology used to develop the 2013 report these components are split ldquoUnabatedrdquo emission factors are employed to quantify the emissions and ldquotechnology profilesrdquo have been developed to represent the effects of mercury emission controls
Various methods are employed to estimate emissions of mercury at individual sources and at national regional and global levels In general the methods fall under one of two main categories
bull Mass-balancesubstance-flow based estimates which are based on the principle that what goes in must come out Amounts of mercury in fuels and raw materials constitute the inputs and the outputs are the amounts of mercury emitted to air released to water or land retained in products or in wastes or otherwise recovered and stored or disposed of
involved in both global and national estimates are taken into account It is important to note that there are good reasons why estimates of mercury emissions produced in the 2010 inventory may not fully agree with national inventories made by countries using other methodologies These reasons include
bull Reporting schemes may define and distinguish emissions source sectors in very different ways and aligning these sectors may not be possible
bull Industry reporting to national government may be limited to sources with emissions above a certain threshold level so that emissions from smaller sources below the threshold are not reported Where smaller sources make up a significant part of the source category reported inventories
bull Measurement-based estimates which rely on measurements made at appropriate points in the industrial process or in the productwaste output streams These measurements are used to estimate where the mercury goes as in the method above
In principle the two approaches should produce the same results In practice mass-balance based approaches tend to result in higher emission estimates than most measurement-based estimates Since future emissions reporting is likely to involve a combination of these two approaches further work is required to understand why results may differ and to reconcile the two approaches
Since the 2008 UNEP assessment was produced the number of direct measurements of emissions from certain point sources (in particular power plants and some metal and cement production plants and waste incineration facilities) has increased considerably resulting in a much improved knowledge base
A number of countries require regular reporting of emissions Increasing use is being made in these reporting systems of measurement-based estimates and facility-level reporting in particular for major point sources In other countries national mercury emissions are only being quantified for the first time Since 2005 and the start of the UNEP negotiating process in 2010 many countries have initiated work on national emission inventories which in several cases have yielded much improved information on activity data sector characteristics and mercury emissions Such inventories often make use of the UNEP Toolkit for identification and quantification of mercury emissions
may therefore significantly underestimate total mercury emissions bull National inventories in some countries are making
increasing use of actual measurements of mercury emissions at individual facilities At the global scale it is not yet feasible to base an inventory on individual site emissions Furthermore actual measurements of mercury emissions at a source may be taken only a few times during a year and may not be fully representative of normal operations In the 2013 assessment a mass-balance based approach was employed to be consistent transparent and replicable bull National reporting and monitoring schemes
may provide information that is not available to externally produced inventories
14
UNEP Global Mercury Assessment 2013
Despite these considerations most of the discrepancies noted between the 2010 inventory mass-balance-based estimates and national estimates based on measurement- approaches are modest and within the margins of error associated with the different approaches In cases where the differences are larger it is important to recognize that there are sources of error in all methods for estimating mercury emissions
Gunnar Futsaelig
ter
Sampling of mercury emissions at the Kendal coal-fired power plant in South Africa conducted under a UNEP project A probe with mercury traps is inserted into a sampling port in the stack to collect mercury present in the flue gas The mercury traps are subsequently analysed according to the US EPA Mercury Monitoring Toolkit sampling protocol
15
UNEP Global Mercury Assessment 2013
Trends in mercury emissions to the atmosphere 4 Assessing global and sectoral trends A key question in assessing anthropogenic mercury emissions worldwide is whether they are increasing or decreasing While it is tempting simply to compare the 2010 inventory with its 2005 counterpart the results would mean little As inventory methods develop and as additional sources are considered the estimate of total anthropogenic mercury emissions worldwide also changes While some changes reflect real trends others reflect changes in methods or scope Thus comparing the results of previous assessments with the present update requires considerable care and involves an understanding of the way in which these inventories have been produced and the uncertainties associated with them
It is possible however to compare certain sectors over time by attempting to compensate for any methodological changes between the various inventories since 1990
Emissions to air are thought to have peaked in the 1970s From 1990 to 2005 total anthropogenic emissions of mercury to the atmosphere appear to
Emissions to air t
1400
1200
1000
800
600
400
200
0
1990
1995
2000
2005
Africa Asia Europe Russia North Oceania South America America
Estimates of annual anthropogenic mercury emissions from different continentsregions 1990-2005
have been relatively stable with decreases in Europe and North America being offset by increases in Asia A reanalysis of the available inventories since 1990 however indicates that emissions from industrial sectors at least may be starting to increase again
The changes introduced in the 2010 inventory methodology prevent a straight-forward continuation of this analysis However an evaluation of trends for some sectors between 2005 and 2010 has been made by applying the new methodology to activity data for 2005 This comparison suggests a further slight increase in the combined amount of mercury emitted by industrial sectors (coal combustion production of cement pig iron and steel and non-ferrous metals) The following paragraphs describe the trend results for three sectors to illustrate some of the developments between 2005 and 2010 and some of the the difficulties in comparing emissions estimates between different years made with different methods
Coal burning for power generation and for industrial purposes continues to increase especially in Asia However increases in the application of air pollution controls including some mercury specific technologies together with more stringent regulations in a number of countries have reduced mercury emissions from coal burning in power plants in particular and thus offset some part of the emissions arising from increased coal consumption
In the United States for example emissions from coal burning at power plants have reportedly decreased from about 53 tonnes in 2005 to 27 tonnes in 2010 This decrease is largely due to new regulations that have resulted in changes in the sources of the coal that is burned in large power plants and the installation of mercury controls as well as controls on sulphur dioxide and particulates that have the co-benefit of further reducing mercury emissions
In China many of the new coal-fired power plants have state-of-the-art pollution controls installed
Emissions of mercury from artisanal and small-scale gold mining (ASGM) reported for 2010 are more than twice those reported for 2005 While the
16
UNEP Global Mercury Assessment 2013
Unintentional emission sectors Coal burning ferrous- and non-ferrous (Au Cu Hg Pb Zn) metal production cement production Intentional-use sectors Disposal and incineration of product waste cremation emissions chlor-alkali industry
Comparison of emissions in 2005 and 2010 by selected sector and region
Unintentional emission sectors
Emission t
1000
800
600
400
200
0 2005 2010
Australia New Zealand amp Oceania
Central America and the Caribbean
CIS amp other European countries
East and Southeast Asia
rise in the price of gold (from USD 400 per ounce in 2005 to USD 1100 per ounce in 2010) along with increased rural poverty may indeed have caused more activity in this sector the increased estimate for mercury emissions is considered to be due primarily to some more and better data from many countries and regions West Africa for example was regarded as having minimal ASGM in 2005 but is now recognized as a region with considerable activity Thus the baseline has improved without necessarily any change in actual activity or emission levels
Waste from consumer products is affected by the amount of mercury used For most products in which mercury is used mercury-free alternatives exist Consequently many of these uses of mercury are declining at least in some regions as alternative products or processes are adopted Compact fluorescent light bulbs are an exception Even though the mercury content of individual light bulbs has decreased use of this type of light bulb is increasing rapidly
Artisanal and small-scale gold mining Intentional-use sectors
1000 1000
Step change from 2005 to 2010 due to new information 800 800 (under-estimation in 2005)
600 600
400 400
200 200
0 0 2005 2010 2005 2010
European Union (EU27) South America
Middle Eastern States South Asia
North Africa Sub-Saharan Africa
North America
In order to make valid assessments of trends in emissions from global inventories comparable data on activity levels are required together with information on changes in fuel and raw material characteristics and applied air pollution control technology One aim of the 2010 inventory methods is to create a firmer foundation for such future trend analysis
Ralf Siemieniec Shutterstockcom
Use of mercury-containing energy-saving lamps is increasing
17
UNEP Global Mercury Assessment 2013
Emission scenarios and future trends The 2008 Global Atmospheric Mercury Assessment included a first attempt at projecting future emissions inventories These were based on three scenarios continuing with the status quo applying current emissions controls worldwide and achieving maximum feasible technological reductions At the time this effort was regarded as highly provisional Since then additional studies have extended and improved this work but the results are not markedly different from earlier projections of future mercury emissions
Global mercury models have been used to evaluate future scenarios Four global and hemispheric models projected mercury levels around the world in 2020 based on the three emission scenarios described earlier In industrial regions the status quo will cause an increase in mercury levels of 2-25 and in remote areas of 15-5 The two emission control scenarios on the other hand yield a decrease in mercury in industrial areas of 25-35 and in remote areas of 15-20
Another global model was coupled with estimates of surface reservoirs of mercury in order to quantify source-receptor relationships for the present and for 2050 Under the best-case scenario of maximum feasible reductions projected estimates for deposition in 2050 is similar to estimates for today In the other scenarios increasing emissions lead to increasing deposition A greater proportion of mercury emissions is expected to be in the oxidized form so that a greater proportion will be deposited near the source instead of being transported far away
The model results support the conclusion that reducing anthropogenic emissions will slowly reduce the amount of mercury in biologically available reservoirs Over time mercury in the environment will be taken out of circulation by natural processes for example from ocean waters down into sediments and biologically available mercury will decrease Increased emissions on the other hand will continue to build up the amount of mercury in circulation
With new databases and methods it may soon be possible to create scenarios that incorporate activity levels as well as technology use for each country If this were done it would allow countries to assess the effects of different mercury reduction strategies on their national emissions For example a country could determine the relative contributions of emission reduction technology as opposed to for example changes in raw materials
18
UNEP Global Mercury Assessment 2013
Atmospheric chemistry monitoring and trends 5 Forms of mercury in air Mercury in the atmosphere is in three primary forms Gaseous elemental mercury is the most common in anthropogenic and natural emissions to the atmosphere Gaseous oxidized mercury and mercury bound to particulates are less common The transport and deposition of atmospheric mercury depend greatly on whether the mercury is elemental or oxidized Elemental mercury stays in the atmosphere long enough for it to be transported around the world whereas oxidized and particulate mercury are more readily captured in existing pollution control systems or deposited relatively rapidly after their formation As a result most mercury in the air is in the gaseous elemental phase Relatively little elemental mercury is deposited directly but instead must fi rst be oxidized
Although gaseous oxidized mercury is very important in mercury cycling between air and other environmental compartments the process of oxidation in the air is poorly understood with reactions and resulting compounds yet to be verified in observations
When mercury moves from air to water and land it is generally in an oxidized gaseous or particulate form whereas when it is re-emitted to air it has been converted back to gaseous elemental
Particulate associated mercury
Pole
Equator
Gaseous elemental mercury
Global transport
Gaseous elemental mercury can be transported globally Mercury emitted in particulate form tends to deposit closer to sources
mercury Sunlight appears to play a large role in both oxidation and reduction of mercury but temperature and biological interactions are also likely to be involved to some degree Here too much uncertainty remains Nonetheless the reactions are important in determining net deposition and fate of mercury
Monitoring of mercury in air Monitoring of mercury in air focuses on the three primary forms of mercury The measurement of gaseous elemental mercury is routine and robust Measuring gaseous oxidized mercury and particulate-bound mercury however is challenging Concentrations are typically very low and these forms are chemically unstable leading to high uncertainty in the measurements Nonetheless these forms are critical for defining and modelling the fate and transport of airborne mercury
In the past two decades coordinated mercury monitoring networks and long-term monitoring sites have been established in a number of regions measuring mercury concentrations in the air as well as deposition of mercury in precipitation In Europe and North America high-quality continuous monitoring has been going on for more than 15 years especially in the Arctic High-quality monitoring has started more recently in East Asia and South Africa as part of a global effort to expand the coverage provided by long-term monitoring sites
Measurements and trends in atmospheric mercury Monitoring stations around the world have provided information about trends in atmospheric mercury though the time periods vary depending on how long the site has been active Overall a declining trend in background mercury levels over the past decade has been recorded from monitoring stations
19
UNEP Global Mercury Assessment 2013
in many regions Other regions however show an increase in mercury levels
The sites also provide information about geographical patterns reflecting both background levels of
Trends in atmospheric measurements of mercury
Site(s) Period
Mace Head Ireland 1996-2011
North America rural sites 1995-2005
High Arctic sub-Arctic Up to 20 years of records mid-latitudes
Monitoring networks Mercury monitoring in Europe is carried out under the European Monitoring and Evaluation Programme (EMEP) one of the first international environmental measurement networks Heavy metals such as mercury have been included in the EMEP program since 1999 Mercury measurements are available only from northern and northwestern Europe
Three monitoring networks currently operate in North America providing good coverage of Canada and the United States the Mercury Deposition Network the Canadian Air and Precipitation Monitoring Network and the Atmospheric Mercury Network More recently new sites have been established in Mexico extending coverage on the continent The stations monitor atmospheric mercury and mercury in precipitation which has measured since the mid-1990s Monitoring of mercury in the air and in precipitation has been underway in Asia for nearly a decade
Alert Nord
Point Barrow
Nuuk Stoacuterhoumlfethi
Mace Head
mercury and local and regional influences Mercury concentrations at remote sites in Asia are higher than in other regions of the Northern Hemisphere Coastal cities in China have lower levels than inland sites likely due to the influence of relatively clean
Measurement Trend
Gaseous elemental mercury Decrease of 14-18 per year
Total gaseous mercury Decrease of 22 to 174 in total
Total gaseous mercury Decreasing trend at some stations increasing at others
The monitoring network of the Arctic Monitoring and Assessment Programme (AMAP) includes air and deposition monitoring sites located in Arctic regions of Canada Greenland Iceland Norway Russia and Sweden
Building on existing national and regional monitoring networks the European Union-financed project
ldquoGlobal Mercury Observation Systemrdquo (GMOS) started in November 2010 Its goal is to develop a coordinated global system for monitoring mercury including a large network of ground-based monitoring stations New sites are being installed in regions where few monitoring stations exist especially in the Southern Hemisphere Two sites have been established in Antarctica one on the Antarctic Plateau and one on the coast
Ny-Aringlesund
Amderma Pallas
Raringouml Bredkaumllen
Listvyanka Diabla Gora
Mauna Loa
Mt Bachelor
Celestuacuten Calhau
Longobucco
Iskrba Niembro Monte Cimone Cap
Ferrat Mt Waliguan Ganghwa Island
Lulin
Cape Hedo Ev-K2
Mt Changbai
Minamata Mt Ailao
Nieuw Nickerie
Kodiakanal
Maheacute Island Manaus
Bariloche Cape Point
Amsterdam Island Cape Grim
Dumont drsquoUrville
AMAP CAMnet EMEP GMOS GMOS associated NADPAIRMoN NADPMDN
Air + precipitation Air Precipitation
20
UNEP Global Mercury Assessment 2013
John Munthe
The mercury background air monitoring station at Zeppelin mountain Svalbard
air from over the ocean Sites off the Asian coast however show higher levels of gaseous elemental mercury than the Northern Hemisphere background suggesting an outflow from the Asian mainland
Weather patterns have also been found to have a strong influence on seasonal patterns in mercury levels in the air at monitoring sites At the Mount Waliguan Observatory on the Tibetan Plateau for example northeasterly and easterly winds produced the highest levels of mercury
Measurements at high altitudes Measurements from ground-based stations above 2700 meters suggest that there is an inverse relationship between gaseous elemental mercury and gaseous oxidized mercury at these elevations In other words when there is more elemental mercury there is less oxidized mercury and vice versa These measurements are in good agreement with modelling results which gives additional confidence in current understanding of the behaviour of mercury at high altitude
An inverse relationship between total gaseous mercury and particulate concentration has also been observed in the high stratosphere From the transformation rate of total gaseous mercury to particulate-bound mercury it appears that gaseous mercury lasts about two years in the stratosphere
21
UNEP Global Mercury Assessment 2013
Atmospheric concentrations and deposition 6 Measurements and trends of mercury in precipitation Mercury deposited by precipitation decreased from the 1990s into the 2000s at many but not all sites in North America and Western Europe where such measurements were taken
Regional patterns are also evident including slightly higher levels in southern Europe than northern Europe and higher levels in Asia than in North America Total mercury concentrations in precipitation in China were much higher than those in Japan and South Korea Th is was mostly attributed to higher levels of gaseous oxidized mercury and particulate-bound mercury which are readily deposited by precipitation and thus not transported far
A comparison of data from Canadian and American monitoring sites found that deposition of mercury in precipitation was highest in summer
Dry deposition of mercury which is deposition not associated with precipitation is diffi cult to measure and consequently there is little information on trends in mercury dry deposition Th is lack of information means that it is also diffi cult to validate model results for dry deposition
106 44
474 72 91
5 7 71
05 1 5 10 100 500 1000
Total mercury emission (2005) kgcell
Modelled mercury air concentrations and deposition patterns Atmospheric mercury concentrations are highest in major industrial regions Models examining global patterns show that East and South Asia Europe North America and South Africa have the highest levels of elemental mercury in the air Concentrations are generally lower in the Southern Hemisphere than the Northern Hemisphere because most industrial activity is in northern regions Th ese model results are based on simulations using the 2005 global mercury emission inventory because the 2010 inventory has only recently become available
Intercontinental transport of mercury in the air has been examined to determine its impact on regional mercury levels Four models using diff erent parameters produced consistent results Depending on the region mercury emitted by distant sources contributes between 10 and 30 of annual mercury deposition Where local sources are low mercury transported from distant emission sources can account for more than half of the deposition East Asia is the dominant source region adding 10-14 to the deposition in
Contribution from sources outside receptor region
Model 40
GEOS-Chem GLEMOS GRAHM CMAQ-Hg
30
20
10
0 Arctic Europe North East Asia South Asia
America
Receptor region
(Left ) Global distribution of anthropogenic mercury emissions in 2005 with source regions that were considered in the analysis (North America South America Europe Africa Central Asia South Asia East Asia Australia and Oceania) and (right) the contribution of anthropogenic sources outside a particular receptor region to deposition within the receptor region
22
UNEP Global Mercury Assessment 2013
Modelling atmospheric transport and deposition Global models reproduce the movement of mercury in the atmosphere during which the mercury may move between continents They have been effective in examining sources of mercury to the Arctic and also for examining the outflow of pollution from South and Southeast Asia and its impact on western North America as well as the flow from eastern North America to Europe
Regional models on the scale of a continent or a basin such as the Mediterranean can provide more detail about specific source areas even to the level of individual industrial areas Reliable results however require a detailed understanding of mercury oxidation in the atmosphere about which there is considerably uncertainty
Most atmospheric transport models consider the full chain of mercury processes in the atmosphere Some models also consider how mercury is cycled in other atmospheric compartments such as soil vegetation snow freshwater and seawater
One of the largest sources of uncertainty in mercury models is the chemical mechanism used to determine how mercury changes forms in the air Improved experimental data can help improve model performance by making sure that the correct reactions are simulated The processes that lead from deposition to re-emission also need to be understood better Advances in this area show promise with model results becoming closer to estimates based on experimental data
other regions of the world Natural emissions and re-emissions account for 35-70 of total deposition in most regions Deposition is generally greater in low and mid-latitudes due to stronger sunlight higher concentrations of oxidants and higher precipitation
Regional mercury models show patterns at the scales of continents or individual seas The Mediterranean Sea for example is a net source of mercury as it emits more than is deposited to it In that region dry deposition generally exceeds deposition of mercury in precipitation In Central and Southern Europe total gaseous mercury concentrations and deposition in precipitation were both consistently higher than the European average
Across the United States dry deposition accounts for two-thirds of total annual deposition mainly from gaseous oxidized mercury A study examining sources and deposition of mercury to assess the
benefits of proposed emission control measures found that mercury transport from outside the country accounts for 68 of mercury deposition in the Northeast and up to 91 in the west-central United States Large point sources contribute up to three-quarters of nearby deposition and power plants contributed half of the deposition in the eastern part of the country This suggests that new emissions standards would primarily benefit eastern regions of the US
In Asia studies show high seasonal variation in mercury concentration and deposition Anthropogenic emissions are responsible for about 75 of deposition in East Asia In this region there is a net removal of gaseous oxidized mercury from the atmosphere and a net export of gaseous elemental mercury
In the Arctic gaseous elemental mercury levels in the atmosphere are depleted rapidly in spring when after the long Arctic winters sunlight returns Ozone is depleted at the same time and it is believed that bromine-containing compounds are the cause of the photo-chemical reactions that deplete ozone and mercury During these events gaseous oxidized mercury and particulate-bound mercury levels increase sharply suggesting that the gaseous mercury is oxidized and deposited enhancing mercury deposition in Arctic areas in springtime Recent research however has found that 50-80 of the deposited mercury is re-emitted within a few days Similar springtime mercury depletion events have been seen in Antarctica
23
UNEP Global Mercury Assessment 2013
Anthropogenic releases to the aquatic environment 7 Global assessment Previous UNEP global mercury assessments only considered emissions to the atmosphere The 2013 Report presents the first attempt at compiling a global inventory of mercury releases to aquatic environments Releases directly into the aquatic environment present a completely different chemistry set of pathways and fate to those released to air They are also more directly linked to the risks posed by mercury to global environmental and human health Unlike mercury releases to air which are predominantly in the form of gaseous elemental mercury releases to water are predominantly inorganic mercury and to a lesser extent liquid elemental mercury
At present only some sources of aquatic releases can be quantified with any confidence Thus many sources that may be important are not included in this first assessment of global aquatic releases For example land management practices that expose new geological sources of mercury in rocks and mineral soils or that re-mobilize previously deposited mercury cannot yet be assessed Two broad categories of current anthropogenic sources are considered here point sources of mercury release to water and diffuse releases of mercury as a result of its remobilisation from areas where it was previously deposited or accumulated due to human activity (ie contaminated sites) Artisanal and small-scale gold mining (ASGM) mercury-containing pesticides and fungicides used in agriculture and deforestation are considered separately
Point source releases to water from various sectors in tonnes per year with the range of the estimate and as a percentage of total anthropogenic emissions
Sector Releases (range) tonnes
Non-ferrous metal production 925 (193 - 268)
Consumer product waste 894 (222 - 308)
Chlor-alkali production 28 (10 ndash 55)
Oil refining 06 (03 ndash 1)
Grand Total 185 (426 ndash 582)
The global estimate of mercury release to water from point sources has been derived from the atmospheric emissions assessment and the approach employed in the UNEP Toolkit to partition total mercury releases between air land and water This approach has considerable uncertainty and may omit sectors where releases to water are high but air emissions are unimportant and therefore not addressed in the inventory Global releases from point sources were estimated to be 185 tonnes per year
For diffuse sources evaluating the relative contribution of anthropogenic and natural sources to the aquatic environment requires determining considerations of the various mercury inputs For some sectors data exist that allow a preliminary assessment of the amounts of mercury re-mobilized into aquatic systems
For mercury-contaminated sites the range of average soil concentrations of mercury reported for sites where mercury was mined used or otherwise released by human activity was considered The area of contamination is then used to determine how much mercury is available in soils and when combined with a factor for how much mercury is released from those soils in a year the total release can be estimated Among identified contaminated sites mercury mining is identified as the largest sector followed by mining of precious metals Total releases to aquatic environments from contaminated sites are estimated to be 83-335 tonnes per year
Releases to water from contaminated sites in tonnes per year with the range of the estimate
Sector Releases (range) tonnes
Primary mercury mining sites 67 ndash 266
Precious metal production sites 14 ndash 55
Non-ferrous metal production sites 01 ndash 05
Chlor-alkali production sites 01 ndash 05
Other industrial sites 01 ndash 03
Grand Total 83 ndash 335
24
UNEP Global Mercury Assessment 2013
Much of the mercury released from artisanal and small-scale gold mining goes into rivers lakes soils and sediments and tailings From soils and tailings it may be re-mobilized by leaching and erosion In addition mining may disturb mercury-containing soils and sediments that may then erode more quickly releasing more mercury than would otherwise have become available from natural erosion A key factor in these processes is the local hydrological cycle of precipitation evaporation run-off and river flow To account for this in the assessment countries were designated as dry wet or intermediate to determine the relative importance of erosion The tropical and subtropical countries which have the greatest activity in this sector also tend to experience high precipitation and run-off exacerbating this source of mercury release and re-mobilization Total worldwide releases of mercury to land and water from ASGM were estimated at over 800 tonnes per year How much of this is released to water cannot yet be determined
Mercury continues to be used in pesticides and fungicides 2100 tonnes of mercury were released in the decade of the 1960s through such agrochemical uses Current data are unavailable although the use of mercury in these products has been greatly reduced
Deforestation especially in the Amazon Basin can lead to extensive soil erosion and thus the release of mercury previously accumulated in soils Using 2010 figures for deforestation rates around the world and an estimate of soil concentrations of mercury as much as 260 tonnes of mercury may have been released into rivers in 2010 as a result of deforestation worldwide
Because this is the first attempt to quantify global mercury releases to the aquatic environment there is no previous measurement against which these results can be compared Thus it is not possible at this time to evaluate trends in releases
Uncertainties in release estimates Estimating global releases of mercury to aquatic environments is being done here for the first time Many data are missing and others are imprecise A number of assumptions have been made based on what measurements are available or on other grounds to extrapolate from known quantities or to calculate aquatic releases in relation to atmospheric
or other emissions Thus the results should be treated with great caution It is nonetheless clear that anthropogenic sources and human activity contribute hundreds of tonnes of mercury to aquatic environments each year a substantial amount relative to estimated natural releases 150-960 tonnes per year from terrestrial environments
Lapshin Shutterstockcom
Phil Augustavo istockphotocom
Bureau of Land Managem
ent
Contaminated sites (top) erosion following deforestation (middle) and a flooded store of mercury-contaminated waste (lower) illustrate potential sources of mercury releases to water
25
UNEP Global Mercury Assessment 2013
Aquatic pathways transport and fate 8 Mercury in aquatic environments The pathways and fate of mercury in aquatic environments are important because it is in waters sediments and wetland soils that inorganic mercury is converted into methylmercury which is toxic and concentrates in animals The majority of human exposure to mercury and the health risk that comes with mercury exposure is from consumption of marine foods Thus this section focuses on the worldrsquos oceans Some freshwater systems however are important sources of fish for human consumption especially for subsistence and recreational fisheries often among indigenous peoples Artisanal and small-scale gold mining (ASGM) communities may also be affected through fish consumption and drinking water if those are contaminated by local releases
The major processes of mercury cycling are generally similar for all aquatic systems Inorganic mercury in dissolved or particulate form is the dominant mercury type in most marine and fresh waters Dissolved gaseous elemental mercury accounts for less than 30 of total mercury in water Methylmercury is often present at trace levels but may in some settings reach 30 of total mercury In freshwater and coastal environments inorganic mercury is transformed into methylmercury primarily in sediments In the open ocean this conversion takes place largely at intermediate depths between 200 and 1000 meters in the water column Mercury is lost from aquatic systems in two ways When inorganic mercury is reduced to elemental mercury it can be re-emitted to the atmosphere When inorganic mercury binds to particulates in water it can settle out rapidly and be buried in sediments Deep burial in ocean sediments is one of the major pathways by which mercury is removed from the biologically active environment
The global mercury cycle is chemically and physically complex Thus it is necessary to use models to study describe and predict what happens and will happen to mercury in the aquatic environment Until recently only one model existed that incorporated
air land and water into a unified whole The model has been validated against observations of mercury and represents the current scientific consensus The largest potential errors in this model in terms of the aquatic cycle concern details of the exchange of mercury between air and water
Pathways and fate of mercury in the oceans Model simulations suggest that anthropogenic impacts on mercury levels in the ocean are greatest in the surface waters the top 100 meters or so of the water column While model results vary one recent estimate suggests that anthropogenic emissions over the last 100 years have doubled the concentration of mercury in the surface layer of the ocean and increased it by 25 in intermediate waters and by 10 in deep waters The difference is due to the length of time it takes for surface waters to circulate to the depths
Models and measurements agree that direct deposition from the atmosphere is the dominant pathway by which mercury reaches the oceans The exceptions are smaller semi-enclosed basins such as the Mediterranean Sea or the Arctic Ocean where river runoff coastal erosion and ocean currents
Ugo M
ontaldo Shutterstockcom
26
UNEP Global Mercury Assessment 2013
account for about half of mercury inputs The most recent modelling effort suggests that total deposition input of mercury to the oceans in 2008 was 3700 tonnes
Other mercury pathways appear less important on a global basis Rivers are estimated to carry more than 2800 tonnes of mercury each year but only about 380 tonnes of this is transported offshore The rest is trapped by particles in estuaries Groundwater and re-mobilization from sediments provide 100shy800 tonnes of mercury to the oceans each year Undersea hydrothermal vents add less than 600 tonnes of mercury to the oceans There are high concentrations of mercury in vent fluids but a great deal of the mercury is precipitated as solids once the vent fluids enter seawater
Models suggest that globally about 70 of the mercury deposited into the ocean is re-emitted to the atmosphere Oxidized mercury in surface waters is reduced by biological and photochemical processes to the elemental form that is volatile and readily re-emitted The removal of this mercury ultimately reduces the pool of mercury that could be converted to methylmercury and be accumulated by marine organisms The re-emission process thus simultaneously prolongs the lifetime of mercury cycling through the atmosphere and upper ocean and acts to reduce mercury availability for marine food webs
Any changes in the efficiency of mercury reduction in surface waters or the rate of re-emission is likely to impact mercury concentrations in surface waters and the air One example is the effect of sea ice in the Arctic Ocean which blocks the re-emission
Tony Magdaraog Shutterstockcom
Mercury accumulated in marine food-webs can enter the human diet
of elemental mercury leaving elevated levels in waters under ice Changes in primary productivity could change the rate at which mercury is bound to particles thus affecting re-emission to the atmosphere as well as rates of downward transport in the ocean Changes in oxidant levels in the atmosphere such as ozone and bromine may also influence the rate of oxidation of gaseous elemental mercury and thus deposition rates to the ocean
Methylmercury in the ocean Natural bacterial processes in seawater and in sediments in coastal environments convert inorganic mercury to methylmercury Methylmercury levels are highest in the subsurface waters of many oceans because it is formed at these intermediate depths likely as a result of the decomposition of organic material falling from surface waters Current understanding indicates that about 300 tonnes of methylmercury is produced in the upper ocean by this and related processes By contrast only about 80 tonnes of methylmercury reaches the ocean from other sources such as atmospheric deposition rivers and diffusion from sediments
Current modelling indicates that methylmercury stays in the upper ocean for about 11 years Deshymethylation by photochemical reaction or by microbial activity is the major removal process for methylmercury in the ocean About 240 tonnes of methylmercury is removed by this process from the surface waters of the ocean per year
The other important pathway for methylmercury in seawater is uptake into marine food webs Although only about 40 tonnes per year is taken up in this way it is this fraction that poses risks to marine animals and human consumers of seafood Methylmercury is a problem for several reasons First it is taken up by plankton much more efficiently than is inorganic mercury resulting in concentrations in plankton that are as high as 10000 times the concentration in seawater Second methylmercury is absorbed through the intestine of animals much more easily than is inorganic mercury Third methylmercury biomagnifies as it moves up the food web Thus methylmercury becomes an increasingly greater proportion of the mercury in organisms higher in the food web This explains why some indigenous populations that consume top marine predators such as fish seals and whales have some of the worldrsquos highest concentrations of methylmercury giving rise to health concerns
27
UNEP Global Mercury Assessment 2013
Pathways and fate of mercury in freshwater Observations and modelling both show that there are in general many similarities between mercury chemistry pathways and fate in lakes and in the oceans but with obvious differences in scale and in the relative importance of different processes Modelling of mercury dynamics was done for four lakes with a history of direct mercury inputs from the largest freshwater lake in the world (Lake Superior) to small lakes in Ontario Canada Atmospheric deposition and river inflow were the main sources of inorganic mercury Much of the mercury input from lake and river catchments was associated with dissolved and particulate organic matter The dominant mercury removal mechanisms as in saltwater were burial in sediments and photochemical reduction of oxidized mercury to elemental mercury followed by re-emission to the air In Lake Superior and Lake Michigan there is evidence for methylation of mercury in the water column as is seen in the open ocean
Methylmercury levels in freshwater fish vary with the level of deposition of mercury from the air though other factors such as inputs from the watershed and the number of trophic levels within the lakersquos food web are also important Methylation predominantly occurred in lake sediments and wetlands and floodplain soils where sulphateshyreducing bacteria are believed to be primarily responsible Methylmercury is de-methylated in sediments and also taken away in the outlet river from each lake
Some 400-1400 tonnes of mercury are estimated globally to be trapped behind dams and other man-made impoundments each year This has in many cases led to significant increases in total mercury and methylmercury levels in water and of methylmercury in fish and other aquatic species When artificial lakes are created plant material is submerged leading to decay and anoxia In these conditions microbially driven methylation of inorganic mercury takes place In some cases the elevated mercury levels have also been observed downstream from the artificial lakes and reservoirs
Anthropogenic impacts on aquatic mercury levels Two studies have reported that the Atlantic and Pacific Oceans have shown opposing trends over recent decades While the influence of changing ocean currents and other oceanographic factors may be a factor the trends do make sense in light of patterns of anthropogenic emissions In the North Pacific Ocean mercury concentrations appear to have increased at depths between 200 and 1000 meters over the last few decades This increase coincides with the rapid industrialization of East Asia
In the North Atlantic however results from near Bermuda suggest a substantial decrease in mercury concentration and a change in the mercury profile through the water column The Mediterranean Sea too showed a decrease in mercury concentration between 1990 and 2004 These findings are consistent with atmospheric data from around the North Atlantic The conclusion is that mercury levels in seawater in the North Atlantic were elevated by human activity but may now be declining likely as a result of decreased emissions from North America and Europe
A complementary approach to measuring mercury in seawater is to measure mercury in aquatic animals which accumulate and integrate mercury over time Teeth hair feathers and eggshells are useful long-term archives of mercury concentrations and can provide data from the pre-industrial period (ie before 1800) as well as more recent periods
Among marine animals samples are available from several regions particularly from the Arctic where cold dry conditions help preserve animal tissues Mercury concentrations between the 13th and 16th
centuries were relatively stable From the mid- to late 19th century to the end of the 20th century mercury levels increased by an average of 12 times On average therefore about 92 of the mercury in Arctic marine wildlife today is likely to be of anthropogenic origin
Similar findings were found for a 700-year sequence of seabird eggshells from the South China Sea Mercury levels increased steadily between 1800 and 2000 with a particularly rapid increase after 1970 Concentrations since 2000 are about 10 times higher than pre-industrial levels with 91 of the mercury now likely to be of anthropogenic origin In the Antarctic studies of seal hairs show that pre-industrial mercury levels were only 60 of recent levels The relatively small difference
28
UNEP Global Mercury Assessment 2013
Historical Hg concentration as a proportion of present-day 100
80
60
40
20
0
Beluga teeth Human teeth
Gyrfalcon feathers Perigrine falcon feathers
Polar bear hair Ringed seal teeth
1200 1300 1400 1500 1600 1700 1800 1900 2000
between pre-industrial and modern mercury levels in Antarctic is consistent with lower mercury emissions and atmospheric concentrations in the Southern Hemisphere as compared with the Northern Hemisphere
The timing of long-term increases of mercury in aquatic animals can shed light on the likely sources of mercury emissions that were responsible The industrialization of Europe and North America appear responsible for the large increases in marine mercury levels that began in the 19th century as these increases occurred prior to recent Asian industrialization As with water concentrations in the Pacific Ocean recent rapid increases in mercury in seabird eggs in the South China Sea coincide with industrialization in Asia
The time lag in aquatic ecosystem response One important conclusion from air-ocean modeling is that the oceans have not yet reached equilibrium with current atmospheric levels of mercury This lag is due to several factors First mercury stays in the upper ocean above 200 meters depth for about 30 years and for centuries in intermediate and deep waters This is much longer than the one year residence time in the lower atmosphere Thus removal from the ocean takes much longer than does removal from the air and so concentrations will change more slowly
Second because of the long lifetime of mercury in deeper ocean waters a great deal of natural mercury is present in the ocean already about 100000 tonnes out of a total of 135000 tonnes in intermediate waters and 200000 out of 220000 tonnes in deep waters
Rune Dietz
Analysis of museum samples reflects the increase in mercury emissions and releases since the mid-19th century associated with anthropogenic activities
Third vertical transport of mercury from intermediate depths back to the surface returns a substantial amount of mercury to the biologically active zone each year As a result average mercury concentrations in seawater and marine animals are likely to increase slowly for decades if not centuries even if atmospheric levels stabilize at present levels In short the effects of historical anthropogenic emissions from Europe and North America are still being observed in the oceans at the same time that the effects of the recent rise in emissions from Asia are being seen
Regionally different trends can be expected depending on distance from sources and ocean circulation patterns In the North Atlantic north of 55deg N it will take 50-600 years to achieve equilibrium between atmospheric and seawater mercury levels In the North Pacific this process is estimated to take 500-700 years and in the Antarctic 700-1000 years The Arctic Ocean by contrast is smaller and will only take about 35 years to reflect changes in atmospheric mercury levels Surface waters of the Mediterranean Sea should show also changes within 10-50 years
Time lags in the responses of many freshwaters and their food-webs to changes in atmospheric mercury levels are also expected Although some immediate recovery following reductions in atmospheric mercury deposition rates is likely full recovery may take decades centuries or longer depending on the characteristics of the area Highly polluted freshwaters with catchments and sediments containing large amounts of anthropogenic mercury will recover most slowly as is already observed around point sources such as smelters that have closed down
29
UNEP Global Mercury Assessment 2013
Major gaps in knowledge 9 Large uncertainties remain in global estimates of mercury emissions to the air These stem from various sources including the availability of information on activity levels but mainly from the lack of information concerning the mercury content of some raw materials and the validity of assumptions regarding processes and technologies employed to reduce mercury emissions including their rates of application and effectiveness The accuracy and precision of measurement-based estimates can depend on the validity of extrapolating measurements made at infrequent intervals to longer periods or measurements made at one plant to other facilities with similar operations
Potentially important emissions sectors that are still not quantified in the emissions inventory include the use of mercury in vinyl-chloride monomer production secondary metals production oil and gas extraction transport and processing industrial and hazardous waste incineration and disposal sewage sludge incineration and dental fillings preparation and removal
Current measurements and their evaluation are inadequate for determining spatial and temporal trends Improved more extensive and better coordinated measurements are needed A permanent global integrated monitoring network for atmospheric mercury and mercury deposition is needed to achieve this goal The atmospheric network sites should be closely integrated with water soil and biological monitoring networks The results can be used for model testing and evaluation as well as for more accurately detailing the geographic impact of anthropogenic emissions Monitoring of mercury concentrations in the important marine food species is essential to understanding possible human health impacts and the effects of future emissions changes
Better data on mercury distribution in the troposphere is needed to improve understanding of long-range transport and source-receptor relationships Coordinated studies at high altitudes and by aircraft are needed This information will
also help validate regional and global scale models improving their prediction capabilities with regard to different policy scenarios
Key processes related to global transport and cycling of mercury remain inadequately understood The chemical form of gaseous oxidized mercury is unknown Reduction and oxidation rates for mercury in the presence of atmospheric oxidants need further study including determining which oxidants are important New measurements and modelling studies are needed to examine key chemical and physical processes that affect global transport and cycling
Few data are available for reporting mercury releases to aquatic systems Systematic and consistent monitoring of mercury releases to the air is required especially for contaminated systems Releases of mercury from soils into waters depend greatly on climate and topography and these parameters need to be better accounted for Consistent approaches for measuring and reporting releases from point sources are needed to ensure comparability of data from around the world In particular the actual role of artisanal and small-scale gold mining (ASGM) in emissions to air and releases to water needs to be more accurately estimated
The link between mercury deposition methylation and uptake by living organisms needs further study The parameters that determine the rates of exchange of mercury compounds between air and sea air and soil and air and vegetation are not fully understood Whole-ecosystem studies of mercury are needed to better understand biogeochemical cycling Methylationdemethylation rates and their spatial and temporal variations and relationship to climatic factors need to be determined in most of worldrsquos major ocean basins as well as in representative freshwaters
30
UNEP Global Mercury Assessment 2013
Key findings of the 2013 assessment 10 Atmosphere Total anthropogenic emissions of mercury to the atmosphere in 2010 are estimated at 1960 (1010shy4070) tonnes which is about 30 of the total mercury that was emitted and re-emitted from anthropogenic and natural sources in that year The largest anthropogenic sources are associated with artisanal and small-scale gold mining (ASGM) and coal burning which together account for about 62 of the annual total anthropogenic emissions to air Other major sectors include ferrous and non-ferrous metal production and cement production
East and Southeast Asia are responsible for about 40 of global anthropogenic emissions About 75 of the mercury from this region comes from China which is about one-third of the global total Increased estimates for emissions from ASGM largely a result of newly obtained data and improved information mean that South America and Sub-Saharan Africa are also responsible for a greater proportion of global emissions than was previously assumed
Anthropogenic emissions over time have increased mercury loads present in the environment This leads to higher rates of re-emission and also means that there will be a time lag of years or decades between emissions reductions and lower mercury levels in the food web including pathways of human exposure
Mercury emissions to the atmosphere likely peaked in the 1950s to 1970s and subsequently declined because of reductions in Europe Russia and North America Emission trends are unclear due to changes in methods employed to produce inventories and differences in the sectors that have been accounted at different times There are however some indications that emissions may be rising again with increases from East Asia offsetting continuing reductions in Europe and North America
Aquatic environments Natural processes in aquatic systems convert less toxic elemental and inorganic mercury into much more toxic methylmercury Methylmercury concentrates and accumulates in the food web leading to high concentrations in some species of seafood and fish that many people eat
Anthropogenic releases of mercury to aquatic environments contribute hundreds of tonnes to the amount of mercury cycling in the environment Diffuse releases and point sources appear equally important Atmospheric deposition however remains the most important input of mercury to land and oceans and has increased the amount of mercury in many environmental compartments by a factor of two or three since the start of the industrial age On land mercury that is deposited is largely retained in soils and vegetation increasing the available pool for re-mobilisation to adjacent aquatic systems Re-emission from soils however is a major addition to atmospheric mercury
Hydrology is the most important factor in the transport of mercury from catchments to downstream environments Relatively little of this mercury reaches the open ocean as most is captured in sediments behind dams in estuaries and near the coast Changes in land cover and land use can have a large effect on mercury mobilisation as exposed soils erode and mercury leaches into the water table
Concentrations of mercury in Arctic marine animals today are about 10-12 times higher than in preshyindustrial times (ie prior to about 1800) This means that on average about 92 of the mercury in marine predators such as seabirds seals and whales is anthropogenic in origin The timing of the increase suggest that 19th and early 20th century emissions from Europe North America and Russia were responsible Increases mercury concentrations in seabirds in the South China Sea appear to be more recent than the Arctic increases coinciding with increasing industrialisation in East and Southeast Asia
31
UNEP Global Mercury Assessment 2013
K+S Entsorgung Gm
bH
Recovered mercury is being stockpiled at long-term storage sites above- and as shown here below ground
The upper 100 meters of the oceans have twice the mercury that they did a century ago Intermediate and deeper waters have 10-25 more mercury on average reflecting the slow transport of mercury downwards in the oceans Seawater concentrations will thus be especially slow in responding to changes in mercury inputs from atmospheric deposition and river flow As a result mercury concentrations in marine biota are likely to increase slowly for decades to centuries even without an increase in atmospheric emissions
In freshwater ecosystems atmospheric deposition and re-mobilisation from soils slow the reduction of mercury levels even in regions where atmospheric concentrations have decreased due to emission controls
Further increases in atmospheric emissions will have long-term consequences for commercial fisheries and all consumers of marine and freshwater foods
It is likely to be years or decades before reductions in anthropogenic emissions and releases of mercury have a demonstrable effect on mercury levels throughout the environment and in the fish and marine mammals which are part of the human food-chain This only reinforces the need to act now to continue and strengthen international efforts to reduce current mercury emissions and releases Delays in action now will inevitably lead to slower recovery of the worldrsquos ecosystems in future from mercury contamination leaving an even greater legacy of pollution for future generations
32
Division of Technology Industry and Economics (DTIE) Chemicals Branch Geneva Switzerland January 2013
Job number DTI1636GE
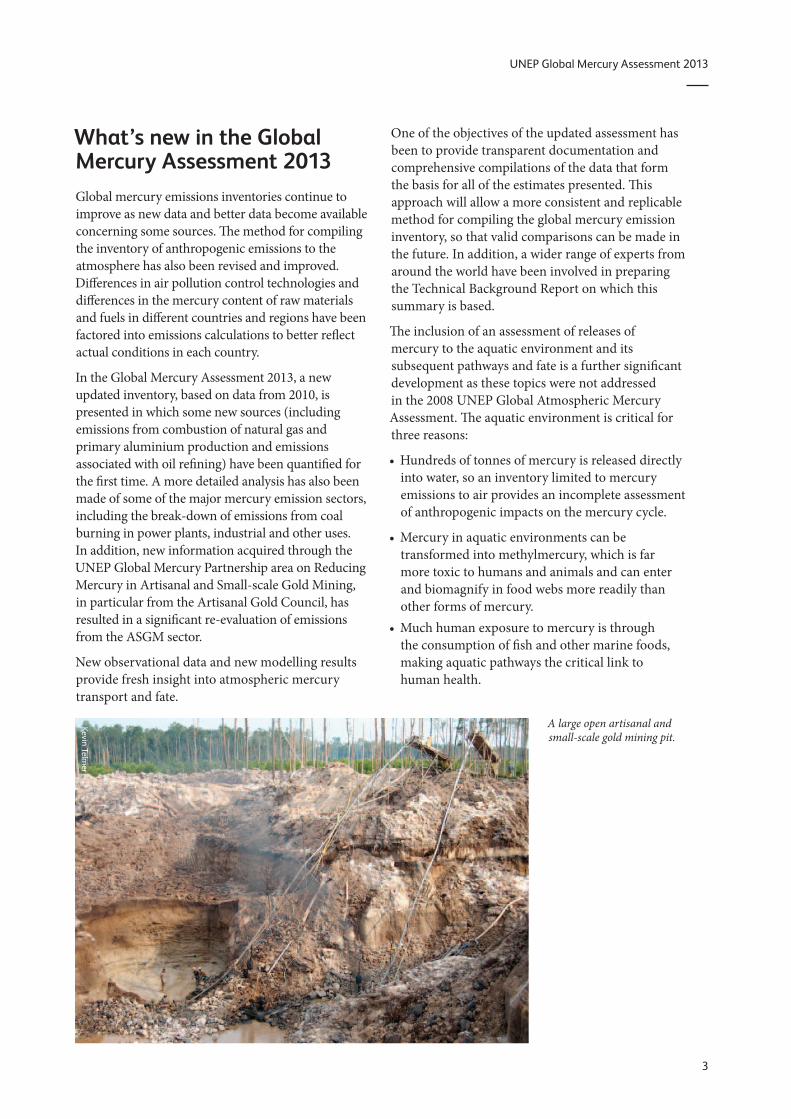
UNEP Global Mercury Assessment 2013
Whatrsquos new in the Global Mercury Assessment 2013 Global mercury emissions inventories continue to improve as new data and better data become available concerning some sources The method for compiling the inventory of anthropogenic emissions to the atmosphere has also been revised and improved Differences in air pollution control technologies and differences in the mercury content of raw materials and fuels in different countries and regions have been factored into emissions calculations to better reflect actual conditions in each country
In the Global Mercury Assessment 2013 a new updated inventory based on data from 2010 is presented in which some new sources (including emissions from combustion of natural gas and primary aluminium production and emissions associated with oil refining) have been quantified for the first time A more detailed analysis has also been made of some of the major mercury emission sectors including the break-down of emissions from coal burning in power plants industrial and other uses In addition new information acquired through the UNEP Global Mercury Partnership area on Reducing Mercury in Artisanal and Small-scale Gold Mining in particular from the Artisanal Gold Council has resulted in a significant re-evaluation of emissions from the ASGM sector
New observational data and new modelling results provide fresh insight into atmospheric mercury transport and fate
Kevin Telmer
One of the objectives of the updated assessment has been to provide transparent documentation and comprehensive compilations of the data that form the basis for all of the estimates presented This approach will allow a more consistent and replicable method for compiling the global mercury emission inventory so that valid comparisons can be made in the future In addition a wider range of experts from around the world have been involved in preparing the Technical Background Report on which this summary is based
The inclusion of an assessment of releases of mercury to the aquatic environment and its subsequent pathways and fate is a further significant development as these topics were not addressed in the 2008 UNEP Global Atmospheric Mercury Assessment The aquatic environment is critical for three reasons
bull Hundreds of tonnes of mercury is released directly into water so an inventory limited to mercury emissions to air provides an incomplete assessment of anthropogenic impacts on the mercury cycle
bull Mercury in aquatic environments can be transformed into methylmercury which is far more toxic to humans and animals and can enter and biomagnify in food webs more readily than other forms of mercury bull Much human exposure to mercury is through
the consumption of fish and other marine foods making aquatic pathways the critical link to human health
A large open artisanal and small-scale gold mining pit
3
UNEP Global Mercury Assessment 2013
Sources of mercury emissions to air and releases to water 2 Mercury is a naturally occurring element and is found throughout the world There are thus many natural sources of mercury creating background environmental levels that have been present since long before humans appeared
Mercury is contained in many minerals including cinnabar an ore mined to produce mercury Much of the present day demand for mercury is met by supply from mercury recovered from industrial sources and stockpiles rather than from mercury mining Mercury is also present as an impurity in many other economically valuable minerals in particular the non-ferrous metals and in fossil fuels coal in particular
Human activity especially mining and the burning of coal has increased the mobilization of mercury into the environment raising the amounts in the atmosphere soils fresh waters and oceans The majority of these human emissions and releases of mercury have occurred since 1800 associated with the industrial revolution based on coal burning base-metal ore smelting and gold rushes in various parts of the world To some extent the same drivers of mercury emissions and releases are continuing with fossil-fuel-based energy generation powering industrial and economic growth in Asia and South America which in turn helps drive high demand for metals including gold spurring artisanal and small-scale gold mining (ASGM) around the world
In preparing inventories of mercury emissions and releases it is important to distinguish various categories of sources Three main types of emissions and releases can be distinguished each of which is briefly introduced here in qualitative terms with particular emphasis on anthropogenic sources
Natural sources of mercury emissions and releases Mercury in the earthrsquos crust can be emitted and released in several ways to air water and land Natural weathering of mercury-containing rocks
farbled Shutterstockcom
Cinnabar the principal ore of mercury
Year 2000
1950
1900
1850
1800
1750
1700
Mt St Helens (1980)
Industrial period
WWII manufacturing
Krakalau (1883)
Gold rush (circa 1850-84)
Tambora (1815)
Pre-industrial period
1998 core 1991 core Natural background Natural events (volcanic eruptions) Localregional anthropogenic sources Global anthropogenic (industrialization)
0 5 10 15 20 25 30 35 40 Total mercury ngL
Ice core record of deposition from Wyoming USA The elevated levels associated with the 1850-84 US gold rush probably reflect localregional sources rather than a global signature Increasing environmental levels of mercury associated with industrialization however are found in environmental archives like this ice core around the globe
4
UNEP Global Mercury Assessment 2013
Global mercury cycling Mercury is released to the environment from natural sources and processes and as a result of human activities Once it has entered the environment mercury cycles between air land and water until it is eventually removed from the system through burial in deep ocean sediments or lake sediments and
through entrapment in stable mineral compounds Methylmercury the most toxic and bioaccumulative form of mercury which presents the greatest health risk to humans and wildlife is mainly formed in aquatic environments through natural microbial processes
80shy600
3700
2000shy2950
2000 300shy600
1700shy2800
3200
380
lt600
Geogenic Anthropogenic
Anthropogenic Biomass burning
Soil and vegetation
Deposition to oceans
Rivers
Deposition to land
freshwater
Geogenic
Oceans
Anthropogenic
Natural
Re-emissions Re-mobilization
Units tonnes
1 tonne = 1000 kilograms
Global mercury budgets based on models illustrate the main environmental compartments and pathways that are of importance in the global mercury cycle and the ways in which natural and anthropogenic releases to air land and water move between these compartments Emissions to air arise from natural sources and anthropogenic sources as well as re-emissions of mercury previously deposited from air onto soils surface waters and vegetation
is continuous and ubiquitous allowing mercury to escape to air and to be washed into lakes and rivers Volcanoes emit and release mercury when they erupt Geothermal activity can also take mercury from underground and emit it to the atmosphere and release it to the deep oceans Some recent models of the flow of mercury through the environment suggest that natural sources account for about 10 of the estimated 5500-8900 tonnes of mercury currently being emitted and re-emitted to the atmosphere from all sources
onime Shutterstockcom
5
UNEP Global Mercury Assessment 2013
Anthropogenic sources of mercury emissions and releases Anthropogenic sources of mercury emissions account for about 30 of the total amount of mercury entering the atmosphere each year
As found in previous global mercury assessments the main industrial sources of atmospheric mercury are coal burning mining industrial activities that process ores to produce various metals or process other raw materials to produce cement In these activities mercury is emitted because it is present as an impurity in fuels and raw materials In these cases mercury emissions and releases are sometimes referred to as lsquoby-productrsquo or lsquounintentionalrsquo emissions or releases A second category of sources includes sectors where mercury is used intentionally Artisanal and small-scale gold mining (ASGM) is the largest of these in which mercury emissions and releases result from the intentional use of mercury to extract gold from rocks soils and sediments Other intentional-use release sectors include waste from consumer products (including metal recycling) the chlor-alkali industry and the production of vinyl-chloride monomer
Coal burning and to a lesser extent the use of other fossil fuels is one of the most significant anthropogenic source of mercury emissions to the atmosphere Coal does not contain high concentrations of mercury but the combination of the large volume of coal burned and the fact that a significant portion of the mercury present in coal is emitted to the atmosphere yield large overall emissions from this sector The mercury content of coal varies widely introducing a high degree of uncertainty in estimating mercury emissions from coal burning Data on mercury content is now available from many countries including major emitters of mercury
Mining smelting and production of iron and non-ferrous metals are also a large source of global mercury emissions to air and also a very important sector with regard to releases to water In the mining and processing of metals most of the mercury is captured and either stockpiled or sold for use in various products creating anthropogenic sources associated with intentional use discussed below Nonetheless the volume of ores and metals involved result in large total emissions and releases The relatively small volume of primary mercury production makes mercury mining a far smaller source today than it has been in the past
Cement production which typically involves the burning of fossil fuels to heat the materials required to make cement is another major anthropogenic source of mercury emissions Both the raw materials and the fuel may contain mercury and lead to emissions The amount of mercury involved varies greatly with the mercury content of these fuels and especially with the raw materials In some countries cement kilns are burning increasing amounts of alternative fuels including wastes that may contain mercury This may add to the emissions from cement kilns
Oil refining emits and releases mercury as oil deposits are known to contain mercury generally at low concentrations Mercury is removed from most petroleum products and natural gas prior to combustion and therefore combustion-related emissions are low Most of the mercury in crude oil is associated with solid waste that is disposed of in landfills However emissions and releases during refining of crude oil do occur and these have been quantified for the first time in the 2010 inventory The inventory does not quantify other emissions and releases during oil and gas extraction and transport or from flaring
Unintentional mercury emissions from these sectors can be reduced by the application of pollution control measures at power plants and industrial plants Some of the mercury captured is refined and enters the commercial supply chain however large amounts of mercury captured in materials such as fly ash and oil refinery waste need to be disposed of Some of the resulting wastes are themselves used as raw materials for example in construction materials but large amounts are disposed of in landfills which can thus become a potential source of mercury emissions and releases
Among intentional-use sectors Artisanal and small-scale gold mining is a major source for emissions and releases of mercury worldwide In ASGM miners use mercury to create an amalgam separating gold from other materials They then have to separate the mercury from the gold Calculating emissions from this sector presents a particular challenge because it is typically widely dispersed and often unregulated and may be illegal Uncertainties regarding release estimates from the ASGM sector are therefore high Furthermore the miners are typically poor and perhaps have little awareness of the hazards of mercury and pollution control devices may be hard to obtain
Wastes from consumer products containing mercury can end up in landfills or incinerators
6
UNEP Global Mercury Assessment 2013
Mercury is still used in a wide range of products including batteries paints switches electrical and electronic devices thermometers blood-pressure gauges fluorescent and energy-saving lamps pesticides fungicides medicines and cosmetics Once used many of the products and the mercury they contain enter waste streams While mercury in landfills may slowly become re-mobilized to the environment waste that is incinerated can be a major source of atmospheric mercury especially from uncontrolled incineration Incinerators with state-of-the-art controls have low emissions
Another use of mercury is in dental amalgam for filling teeth When bodies are cremated mercury in fillings can be emitted Mercury can also be emitted and released during production and preparation of fillings and from the disposal or removed fillings In addition mercury from removed fillings can be recycled or go into solid waste and wastewater
The amount of mercury released in the recycling of scrap metals for example in secondary steel and nonshyferrous metal production is generally assumed to be much lower than that released during primary metal production which is why the present global inventory only addresses primary metal production However lower emissions from recycling may not be the case in all countries Much of the scrap steel in some countries comes from automobiles that may still have devices that contain mercury and which may not be removed prior to recycling of the steel These devices are largely being phased out so mercury emissions from scrap steel may be expected to decrease However large differences exist between countries in the way they treat their mercury-containing wastes including scrap metals that are recycled in secondary metal production
Mercury is also used in a number of industrial processes A major industrial use is in the chlor-alkali industry where mercury-cell technology may be used in the production of chlorine and caustic soda
Mercury is also used as a catalyst in the production of vinyl chloride monomer (VCM) from acetylene mainly in China
Mercury releases to aquatic systems as a result of current human activities arise from many of the same uses or the presence of mercury in various products and processes that emit mercury to the air As with emissions to the atmosphere aquatic releases come from two main sources First mercury is released with water effluent from the sites where mercury is used Second mercury can leach into water from disposal sites that have mercury in the waste
zhu difeng Shutterstockcom
Tomas Pavelka Shutterstockcom
bikeriderlondon Shutterstockcom
Anthropogenic sources of mercury from industry and intentional use
Gunnar Futsaelig
ter
7
UNEP Global Mercury Assessment 2013
Arnold John Labrentz Shutterstockcom
Re-emission and re-mobilization of mercury Re-emissions constitute the third category of sources presently comprising about 60 of mercury emissions to air Mercury previously deposited from air onto soils surface waters and vegetation from past emissions can be emitted back to the air Re-emission is a result of natural processes that convert inorganic and organic forms of mercury to elemental mercury which is volatile and therefore readily returns to the air Mercury deposited to plant surfaces can be re-emitted during forest fires or biomass burning Mercury may be deposited and re-emitted many times as it cycles through the environment
It is important that re-emitted mercury should not be considered a natural source It may originally have come from natural or anthropogenic sources but by the time it is re-emitted it is difficult or impossible to identify its specific origin Nonetheless human activity has increased the environmental burden of mercury resulting in higher levels of re-emission This is compounded by changes in land use practices as well as increasing temperatures due to climate change
In the aquatic environment re-mobilization of mercury occurs when mercury deposited on and accumulated in soils or sediments is re-mobilized by for example rain or floods that cause the mercury to enter or re-enter the aquatic system Resuspension
of aquatic sediments due to wave action or storm events is an additional way for mercury to re-enter the aquatic ecosystems
Estimating re-emission and re-mobilization rates is difficult It is often done using modelling approaches These models are based on data on atmospheric levels and other observations as well as current understanding of chemical transformations and other processes that determine how mercury moves between air land and water The models aim to balance the amount of mercury in circulation at any given time while remaining consistent with observational data Temperature is a key factor With lower temperatures re-emission rates are generally lower
Re-emission is also a major factor in determining the length of time needed for anthropogenic emission reductions to be reflected in decreasing environmental levels of mercury Mercury emitted in one year may be deposited to and retained in soils and waters for some time before being re-emitted or re-mobilized in subsequent years This cycle can be repeated keeping levels in air and water elevated even after anthropogenic sources have been lowered Conversely continuing to add to the global pool will leave an ever-longer legacy of anthropogenic mercury contamination worldwide It is thus imperative that international efforts to reduce mercury emissions continue and are strengthened as soon as possible
Forest fires re-emit mercury deposited to vegetation
8
UNEP Global Mercury Assessment 2013
Anthropogenic emissions to the atmosphere 3 Global emissions inventory The global emissions inventory for 2010 estimates that 1960 tonnes of mercury was emitted to the atmosphere as a direct result of human activity The leading sectors remain the same as those identified in the 2005 inventory Improved data however have changed the relative contributions of some of these sectors as have some actual changes in emissions All coal burning emissions taken together for example represent a lower percentage of the total emissions than in the 2005 inventory This is due in part to the increased estimates from artisanal and small-scale gold mining (ASGM) and in part to much lower estimates for domestic use of coal When the actual amount of mercury emitted from coal combustions in power generation and industrial uses is considered and the estimates are based on the same 2010 methodology the emissions in 2010 are the same and perhaps slightly higher than in 2005 Even though new coal-fired power plants are being built combustion efficiency and emissions controls are also improving in most parts of the world
Results by selected sector The updated inventory of emissions to air confirms coal burning as a continuing major source of emissions responsible for some 475 tonnes of mercury emissions to air annually compared with around 10 tonnes from combustion of other fossil fuels According to the new inventory more than 85 of these emissions are from coal burning in power generation and industrial uses In the previous assessment emissions from domestic and residential coal burning were highlighted as a possible larger contribution Better information on coal consumption for domestic and residential uses indicates that these activities are a smaller contribution to total emissions from coal burning than previously thought
Emissions from the cement production industry are largely dependent on the raw materials and the fuels used The new inventory avoids double
Emissions from various sectors in tonnes per year with the range of the estimate and as a percentage of total anthropogenic emissions Note These numbers cannot be compared directly with those presented in the 2008 assessment (see Chapter 4 Trends in mercury emissions to the atmosphere)
Sector Emission (range) tonnes
By-product or unintentional emissions
Fossil fuel burning
Coal burning (all uses) 474 (304 - 678) 24
Oil and natural gas burning 99 (45 ndash 163) 1
Mining smelting amp production of metals
Primary production of 455 (205 ndash 241) 2 ferrous metals
Primary production of nonshy 193 (82 ndash 660) 10 ferrous metals (Al Cu Pb Zn)
Large-scale gold production 973 (07 ndash 247) 5
Mine production of mercury 117 (69 ndash 178) lt1
Cement production 173 (655 - 646) 9
Oil refining 16 (73 - 264) 1
Contaminated sites 825 (70 - 95) 4
Intentional uses
Artisanal and small-scale 727 (410 ndash 1040) 37 gold mining
Chlor-alkali industry 284 (102 ndash 547) 1
Consumer product waste 956 (237 ndash 330) 5
Cremation (dental amalgam) 36 (09 - 119) lt1
Grand Total 1960 (1010 ndash 4070) 100
Values rounded to 3 significant figures To nearest percent
Sectors for which emissions are not currently quantified
biofuel production and combustion
vinyl-chloride monomer production emissions during
secondary metals production and ferro-alloys
oil and gas extraction transport and processing other than refinery emissions
industrial some hazardous waste incineration and disposal
sewage sludge incineration
preparation of dental amalgam fillings and disposal of removed fillings containing mercury
9
UNEP Global Mercury Assessment 2013
Disposal of waste from
Mercury-cell chlor-alkali
industry
Relative contributions to estimated emissions to air from anthropogenic sources in 2010
Oil refining
Coal combustion
Oil and natural gas combustion
Primary ferrous metal production
Primary non-ferrous metal (Al Cu Pb Zn)
Large-scale gold production
Hg production Cement production
mercury-containing products
Contaminated sites
Cremation
Artisanal and small-scale gold production
counting of emissions from conventional fuels (such as coal and oil) that are included under the industrial fossil fuel burning emissions However it does attempt to account for emissions from other fuels including alternative fuels (such as old tyres and other wastes) and from raw materials Increasing amounts of waste are being co-incinerated in the cement industry both as fuel but also in some plants as a means of disposing of hazardous wastes some of which may contain mercury In some regions additional measures are being introduced to make sure that mercury emissions associated with waste co-incineration do not increase overall emissions from cement plants
Increased application of air pollution control devices including some mercury-specific technologies together with more stringent regulations in several countries have the effect of reducing mercury emissions from coal burning sectors and thus offset some part of the emissions arising from increased activity
Artisanal and small-scale gold mining emissions are in the 2010 inventory the major source of emissions to air at 727 tonnes per year The reasons for the large increase in the estimate compared to 2005 are discussed below (see page 16) The global estimate for emissions from ASGM includes a significant contribution from China although
recent information on this sector in China is lacking China prohibited ASGM in 1996 and therefore records no emissions from this sector
Mercury-cell technology is becoming less common in the chlor-alkali industry as other more cost-effective processes are adopted No new plants are being constructed though many older plants remain to be converted Old chlor-alkali plants and other decommissioned industrial sites may constitute contaminated sites that continue to release mercury to the environment for many years and emissions from contaminated sites are now part of the inventory
Global emissions from use of mercury in dental amalgam resulting from cremation of human remains are estimated at 36 (09 ndash 119) tonnes in 2010 Some 340 tonnes of mercury is used per year in dentistry of which about 70-100 tonnes (ie 20shy30) likely enters the solid waste stream
In the production of vinyl chloride monomer information is still lacking on the lifecycle and eventual fate of the mercury catalyst Most of this production occurs in China and about 800 tonnes of mercury is thought to have been used by this industry in China in 2012 Used mercury catalyst is recycled and reused by enterprises that hold permits for hazardous waste management The amounts that may be emitted or released are unknown
Ronald de Hom
mel
Artisanal and small-scale gold mining Unlike most small-scale gold miners the green gold miners of Oro Verde shown here employ an environmental way of mining gold that does not use mercury or other chemicals
10
UNEP Global Mercury Assessment 2013
Results by region The greatest proportion of anthropogenic mercury emissions to the atmosphere comes from Asia which contributes about 50 of the global total The majority of Asian emissions come from East and Southeast Asia China accounts for three-quarters of East and Southeast Asian emissions or about one third of the global total
New data on emissions from ASGM have increased the proportion of global emissions attributed to South America and Sub-Saharan Africa largely due to increased estimates associated with improved information about ASGM activities in these areas
Emissions to air from other major source sectors are higher in Europe North America and Oceania
Mercury emission 2010 gkm2
0 2 5 10 100 1000
Global distribution of anthropogenic mercury emissions to air in 2010
Emissions from various regions in tonnes per year with the range of the estimate and as a percentage of total global anthropogenic emissions Note These numbers cannot be compared directly with those presented in the 2008 assessment (see Chapter 4 Trends in mercury emissions to the atmosphere)
See figure on the following Region Emission (range) tonnes page for map with
Australia New Zealand amp Oceania 223 (54 - 527) 11 specification of regions Values rounded to 3 Central America and the Caribbean 472 (197 - 974) 24
significant figures CIS amp other European countries 115 (426 - 289) 59
East and Southeast Asia 777 (395 - 1690) 397
European Union (EU27) 875 (445 - 226) 45
Middle Eastern States 370 (161 - 106) 19
North Africa 136 (48 - 412) 07
North America 607 (343 - 139) 31
South America 245 (128 - 465) 125
South Asia 154 (782 - 358) 79
Sub-Saharan Africa 316 (168 - 514) 161
Undefined (global total for emissions from 825 (700 - 950) 42 contaminated sites)
Grand Total 1960 (1010 ndash 4070) 100
11
UNEP Global Mercury Assessment 2013
North America
Central America and the Caribbean
South America
Unintentional emissions
Stationary combustion (coal)
Stationary combustion (oil and gas) Oil refining
Pig iron and steel
Intentional uses
Artisanal and small-scale gold mining Chlor-alkali
EU27
North Africa
Sub-Saharan Africa
Non-ferrous metals (Cu Pb Zn Al) Mercury
Large-scale gold
Cement
Product waste
Cremation
CIS amp other European countries
500
100
Middle Eastern States East and Southeast Asia
50
10 tonnes
South Asia Australia New Zealand amp Oceania
South America
North America
Central America and the Caribbean
Sub-Saharan Africa
South Asia North Africa
Middle Eastern States
EU
East and Southeast Asia
CIS amp other European countries
Australia New Zealand amp Oceania
Estimates of 2010 anthropogenic mercury emissions to air from different main sectors in different regions ASGM is shown separately to highlight its geographic distribution and better allow regional comparisons to be made for other sectors
12
UNEP Global Mercury Assessment 2013
Compiling the 2010 inventory of anthropogenic mercury emissions to air The inventories used in successive Global Mercury Assessments continue to improve as better data become available The 2013 update presents an inventory of emissions for 2010 that has a number of improvements over the 2008 assessment and its inventory for 2005
bull A more detailed analysis of emissions from some major source sectors For example fossil fuel consumption is now broken down into categories for combustion in power plants industry and other uses The type of coal or oil used is also considered providing a more accurate estimate of mercury emissions
bull A more detailed consideration of the mercury content of fuels and raw materials used in different countries and regions bull New and updated information on ASGM bull The use of different pollution control technologies
in different countries and regions have been factored into the emissions estimate bull Emission estimates for sectors not previously
included such as aluminium production oil refining and contaminated sites bull More and better information on location of major
point sources such as individual power plants smelters and cement kilns bull Better documentation and greater transparency
with respect to the data and information behind the estimates
The methods for estimating emissions from industrial sectors is complemented by other methods used for more dispersed emissions sources For example estimating emissions from some intentional-use sectors requires intensive work with those sectors Relevant and accurate information about ASGM is generally not available through official channels Estimating mercury emissions from its intentional use in lighting batteries and other products requires analysing the entire production use and waste stream to determine where mercury is likely to be released and in what quantities The approach used in the 2013 assessment addresses the emissions from breakages and wastes resulting from use of these mercury-containing products in society the majority of
which are incinerated or end up in landfills It does not however address industrial wastes or sewage sludge incineration
Uncertainties in emission estimates Estimates of mercury emissions are just that estimates To compile a global assessment requires making a number of assumptions and generalizations Uncertainty associated with the 2010 inventory arises from each of the factors used to estimate the emissions the correctness of the activity data the validity of the emission factors applied and the validity of assumptions regarding the effectiveness and use of emission-control technologies
Based on an evaluation of these sources of uncertainty and the relative contributions of sectors with reliable information and those with less reliable data uncertainty in the 2010 inventory assessment of total anthropogenic mercury emissions to air gives a range of emissions from 1010-4070 tonnes This range is greater than that reported in some previous assessments reflecting a greater appreciation of the sources of uncertainty due to the improved estimation methods and perhaps a more realistic appraisal of the state of knowledge concerning some aspects of emissions
The best estimate taking a conservative approach is 1960 tonnes If nationally produced estimates for 2010 available from some countries (Canada Japan Korea Mexico the United States and European countries reporting to LRTAP) are introduced into the global inventory in place of the inventory estimates the corresponding estimated total global anthropogenic emission to air is 1940 tonnes As most national inventories do not include uncertainty ranges it is not possible to assign a range to this number The recognition of uncertainties is an important consideration and presenting single national estimates can convey a misleading picture of what is known and more importantly not known about emissions
The numbers derived using the methods employed to produce the global inventory for 2010 were compared with a number of national inventories and emissions reported under other systems covering the same period In general the level of agreement was good in particular when the significant uncertainties
13
UNEP Global Mercury Assessment 2013
Methods for estimating emissions All global mercury emissions inventories to date have used the same basic approach for the major sectors emitting mercury to the atmosphere For specific emission sectors national emissions estimates are calculated by multiplying the amount of activity (ie amounts of fuels burned raw materials consumed or materials produced) by an emission factor that is an estimate of the mercury emitted per unit of activity For example emissions from coal-fired power generation are estimated by multiplying the tonnes of coal used by the amount of mercury estimated to be released per tonne of coal In most such inventories ldquoabatedrdquo emission factors have been employed to quantify both the emissions of mercury that occur during the processes and the effects of mercury emission controls In the new methodology used to develop the 2013 report these components are split ldquoUnabatedrdquo emission factors are employed to quantify the emissions and ldquotechnology profilesrdquo have been developed to represent the effects of mercury emission controls
Various methods are employed to estimate emissions of mercury at individual sources and at national regional and global levels In general the methods fall under one of two main categories
bull Mass-balancesubstance-flow based estimates which are based on the principle that what goes in must come out Amounts of mercury in fuels and raw materials constitute the inputs and the outputs are the amounts of mercury emitted to air released to water or land retained in products or in wastes or otherwise recovered and stored or disposed of
involved in both global and national estimates are taken into account It is important to note that there are good reasons why estimates of mercury emissions produced in the 2010 inventory may not fully agree with national inventories made by countries using other methodologies These reasons include
bull Reporting schemes may define and distinguish emissions source sectors in very different ways and aligning these sectors may not be possible
bull Industry reporting to national government may be limited to sources with emissions above a certain threshold level so that emissions from smaller sources below the threshold are not reported Where smaller sources make up a significant part of the source category reported inventories
bull Measurement-based estimates which rely on measurements made at appropriate points in the industrial process or in the productwaste output streams These measurements are used to estimate where the mercury goes as in the method above
In principle the two approaches should produce the same results In practice mass-balance based approaches tend to result in higher emission estimates than most measurement-based estimates Since future emissions reporting is likely to involve a combination of these two approaches further work is required to understand why results may differ and to reconcile the two approaches
Since the 2008 UNEP assessment was produced the number of direct measurements of emissions from certain point sources (in particular power plants and some metal and cement production plants and waste incineration facilities) has increased considerably resulting in a much improved knowledge base
A number of countries require regular reporting of emissions Increasing use is being made in these reporting systems of measurement-based estimates and facility-level reporting in particular for major point sources In other countries national mercury emissions are only being quantified for the first time Since 2005 and the start of the UNEP negotiating process in 2010 many countries have initiated work on national emission inventories which in several cases have yielded much improved information on activity data sector characteristics and mercury emissions Such inventories often make use of the UNEP Toolkit for identification and quantification of mercury emissions
may therefore significantly underestimate total mercury emissions bull National inventories in some countries are making
increasing use of actual measurements of mercury emissions at individual facilities At the global scale it is not yet feasible to base an inventory on individual site emissions Furthermore actual measurements of mercury emissions at a source may be taken only a few times during a year and may not be fully representative of normal operations In the 2013 assessment a mass-balance based approach was employed to be consistent transparent and replicable bull National reporting and monitoring schemes
may provide information that is not available to externally produced inventories
14
UNEP Global Mercury Assessment 2013
Despite these considerations most of the discrepancies noted between the 2010 inventory mass-balance-based estimates and national estimates based on measurement- approaches are modest and within the margins of error associated with the different approaches In cases where the differences are larger it is important to recognize that there are sources of error in all methods for estimating mercury emissions
Gunnar Futsaelig
ter
Sampling of mercury emissions at the Kendal coal-fired power plant in South Africa conducted under a UNEP project A probe with mercury traps is inserted into a sampling port in the stack to collect mercury present in the flue gas The mercury traps are subsequently analysed according to the US EPA Mercury Monitoring Toolkit sampling protocol
15
UNEP Global Mercury Assessment 2013
Trends in mercury emissions to the atmosphere 4 Assessing global and sectoral trends A key question in assessing anthropogenic mercury emissions worldwide is whether they are increasing or decreasing While it is tempting simply to compare the 2010 inventory with its 2005 counterpart the results would mean little As inventory methods develop and as additional sources are considered the estimate of total anthropogenic mercury emissions worldwide also changes While some changes reflect real trends others reflect changes in methods or scope Thus comparing the results of previous assessments with the present update requires considerable care and involves an understanding of the way in which these inventories have been produced and the uncertainties associated with them
It is possible however to compare certain sectors over time by attempting to compensate for any methodological changes between the various inventories since 1990
Emissions to air are thought to have peaked in the 1970s From 1990 to 2005 total anthropogenic emissions of mercury to the atmosphere appear to
Emissions to air t
1400
1200
1000
800
600
400
200
0
1990
1995
2000
2005
Africa Asia Europe Russia North Oceania South America America
Estimates of annual anthropogenic mercury emissions from different continentsregions 1990-2005
have been relatively stable with decreases in Europe and North America being offset by increases in Asia A reanalysis of the available inventories since 1990 however indicates that emissions from industrial sectors at least may be starting to increase again
The changes introduced in the 2010 inventory methodology prevent a straight-forward continuation of this analysis However an evaluation of trends for some sectors between 2005 and 2010 has been made by applying the new methodology to activity data for 2005 This comparison suggests a further slight increase in the combined amount of mercury emitted by industrial sectors (coal combustion production of cement pig iron and steel and non-ferrous metals) The following paragraphs describe the trend results for three sectors to illustrate some of the developments between 2005 and 2010 and some of the the difficulties in comparing emissions estimates between different years made with different methods
Coal burning for power generation and for industrial purposes continues to increase especially in Asia However increases in the application of air pollution controls including some mercury specific technologies together with more stringent regulations in a number of countries have reduced mercury emissions from coal burning in power plants in particular and thus offset some part of the emissions arising from increased coal consumption
In the United States for example emissions from coal burning at power plants have reportedly decreased from about 53 tonnes in 2005 to 27 tonnes in 2010 This decrease is largely due to new regulations that have resulted in changes in the sources of the coal that is burned in large power plants and the installation of mercury controls as well as controls on sulphur dioxide and particulates that have the co-benefit of further reducing mercury emissions
In China many of the new coal-fired power plants have state-of-the-art pollution controls installed
Emissions of mercury from artisanal and small-scale gold mining (ASGM) reported for 2010 are more than twice those reported for 2005 While the
16
UNEP Global Mercury Assessment 2013
Unintentional emission sectors Coal burning ferrous- and non-ferrous (Au Cu Hg Pb Zn) metal production cement production Intentional-use sectors Disposal and incineration of product waste cremation emissions chlor-alkali industry
Comparison of emissions in 2005 and 2010 by selected sector and region
Unintentional emission sectors
Emission t
1000
800
600
400
200
0 2005 2010
Australia New Zealand amp Oceania
Central America and the Caribbean
CIS amp other European countries
East and Southeast Asia
rise in the price of gold (from USD 400 per ounce in 2005 to USD 1100 per ounce in 2010) along with increased rural poverty may indeed have caused more activity in this sector the increased estimate for mercury emissions is considered to be due primarily to some more and better data from many countries and regions West Africa for example was regarded as having minimal ASGM in 2005 but is now recognized as a region with considerable activity Thus the baseline has improved without necessarily any change in actual activity or emission levels
Waste from consumer products is affected by the amount of mercury used For most products in which mercury is used mercury-free alternatives exist Consequently many of these uses of mercury are declining at least in some regions as alternative products or processes are adopted Compact fluorescent light bulbs are an exception Even though the mercury content of individual light bulbs has decreased use of this type of light bulb is increasing rapidly
Artisanal and small-scale gold mining Intentional-use sectors
1000 1000
Step change from 2005 to 2010 due to new information 800 800 (under-estimation in 2005)
600 600
400 400
200 200
0 0 2005 2010 2005 2010
European Union (EU27) South America
Middle Eastern States South Asia
North Africa Sub-Saharan Africa
North America
In order to make valid assessments of trends in emissions from global inventories comparable data on activity levels are required together with information on changes in fuel and raw material characteristics and applied air pollution control technology One aim of the 2010 inventory methods is to create a firmer foundation for such future trend analysis
Ralf Siemieniec Shutterstockcom
Use of mercury-containing energy-saving lamps is increasing
17
UNEP Global Mercury Assessment 2013
Emission scenarios and future trends The 2008 Global Atmospheric Mercury Assessment included a first attempt at projecting future emissions inventories These were based on three scenarios continuing with the status quo applying current emissions controls worldwide and achieving maximum feasible technological reductions At the time this effort was regarded as highly provisional Since then additional studies have extended and improved this work but the results are not markedly different from earlier projections of future mercury emissions
Global mercury models have been used to evaluate future scenarios Four global and hemispheric models projected mercury levels around the world in 2020 based on the three emission scenarios described earlier In industrial regions the status quo will cause an increase in mercury levels of 2-25 and in remote areas of 15-5 The two emission control scenarios on the other hand yield a decrease in mercury in industrial areas of 25-35 and in remote areas of 15-20
Another global model was coupled with estimates of surface reservoirs of mercury in order to quantify source-receptor relationships for the present and for 2050 Under the best-case scenario of maximum feasible reductions projected estimates for deposition in 2050 is similar to estimates for today In the other scenarios increasing emissions lead to increasing deposition A greater proportion of mercury emissions is expected to be in the oxidized form so that a greater proportion will be deposited near the source instead of being transported far away
The model results support the conclusion that reducing anthropogenic emissions will slowly reduce the amount of mercury in biologically available reservoirs Over time mercury in the environment will be taken out of circulation by natural processes for example from ocean waters down into sediments and biologically available mercury will decrease Increased emissions on the other hand will continue to build up the amount of mercury in circulation
With new databases and methods it may soon be possible to create scenarios that incorporate activity levels as well as technology use for each country If this were done it would allow countries to assess the effects of different mercury reduction strategies on their national emissions For example a country could determine the relative contributions of emission reduction technology as opposed to for example changes in raw materials
18
UNEP Global Mercury Assessment 2013
Atmospheric chemistry monitoring and trends 5 Forms of mercury in air Mercury in the atmosphere is in three primary forms Gaseous elemental mercury is the most common in anthropogenic and natural emissions to the atmosphere Gaseous oxidized mercury and mercury bound to particulates are less common The transport and deposition of atmospheric mercury depend greatly on whether the mercury is elemental or oxidized Elemental mercury stays in the atmosphere long enough for it to be transported around the world whereas oxidized and particulate mercury are more readily captured in existing pollution control systems or deposited relatively rapidly after their formation As a result most mercury in the air is in the gaseous elemental phase Relatively little elemental mercury is deposited directly but instead must fi rst be oxidized
Although gaseous oxidized mercury is very important in mercury cycling between air and other environmental compartments the process of oxidation in the air is poorly understood with reactions and resulting compounds yet to be verified in observations
When mercury moves from air to water and land it is generally in an oxidized gaseous or particulate form whereas when it is re-emitted to air it has been converted back to gaseous elemental
Particulate associated mercury
Pole
Equator
Gaseous elemental mercury
Global transport
Gaseous elemental mercury can be transported globally Mercury emitted in particulate form tends to deposit closer to sources
mercury Sunlight appears to play a large role in both oxidation and reduction of mercury but temperature and biological interactions are also likely to be involved to some degree Here too much uncertainty remains Nonetheless the reactions are important in determining net deposition and fate of mercury
Monitoring of mercury in air Monitoring of mercury in air focuses on the three primary forms of mercury The measurement of gaseous elemental mercury is routine and robust Measuring gaseous oxidized mercury and particulate-bound mercury however is challenging Concentrations are typically very low and these forms are chemically unstable leading to high uncertainty in the measurements Nonetheless these forms are critical for defining and modelling the fate and transport of airborne mercury
In the past two decades coordinated mercury monitoring networks and long-term monitoring sites have been established in a number of regions measuring mercury concentrations in the air as well as deposition of mercury in precipitation In Europe and North America high-quality continuous monitoring has been going on for more than 15 years especially in the Arctic High-quality monitoring has started more recently in East Asia and South Africa as part of a global effort to expand the coverage provided by long-term monitoring sites
Measurements and trends in atmospheric mercury Monitoring stations around the world have provided information about trends in atmospheric mercury though the time periods vary depending on how long the site has been active Overall a declining trend in background mercury levels over the past decade has been recorded from monitoring stations
19
UNEP Global Mercury Assessment 2013
in many regions Other regions however show an increase in mercury levels
The sites also provide information about geographical patterns reflecting both background levels of
Trends in atmospheric measurements of mercury
Site(s) Period
Mace Head Ireland 1996-2011
North America rural sites 1995-2005
High Arctic sub-Arctic Up to 20 years of records mid-latitudes
Monitoring networks Mercury monitoring in Europe is carried out under the European Monitoring and Evaluation Programme (EMEP) one of the first international environmental measurement networks Heavy metals such as mercury have been included in the EMEP program since 1999 Mercury measurements are available only from northern and northwestern Europe
Three monitoring networks currently operate in North America providing good coverage of Canada and the United States the Mercury Deposition Network the Canadian Air and Precipitation Monitoring Network and the Atmospheric Mercury Network More recently new sites have been established in Mexico extending coverage on the continent The stations monitor atmospheric mercury and mercury in precipitation which has measured since the mid-1990s Monitoring of mercury in the air and in precipitation has been underway in Asia for nearly a decade
Alert Nord
Point Barrow
Nuuk Stoacuterhoumlfethi
Mace Head
mercury and local and regional influences Mercury concentrations at remote sites in Asia are higher than in other regions of the Northern Hemisphere Coastal cities in China have lower levels than inland sites likely due to the influence of relatively clean
Measurement Trend
Gaseous elemental mercury Decrease of 14-18 per year
Total gaseous mercury Decrease of 22 to 174 in total
Total gaseous mercury Decreasing trend at some stations increasing at others
The monitoring network of the Arctic Monitoring and Assessment Programme (AMAP) includes air and deposition monitoring sites located in Arctic regions of Canada Greenland Iceland Norway Russia and Sweden
Building on existing national and regional monitoring networks the European Union-financed project
ldquoGlobal Mercury Observation Systemrdquo (GMOS) started in November 2010 Its goal is to develop a coordinated global system for monitoring mercury including a large network of ground-based monitoring stations New sites are being installed in regions where few monitoring stations exist especially in the Southern Hemisphere Two sites have been established in Antarctica one on the Antarctic Plateau and one on the coast
Ny-Aringlesund
Amderma Pallas
Raringouml Bredkaumllen
Listvyanka Diabla Gora
Mauna Loa
Mt Bachelor
Celestuacuten Calhau
Longobucco
Iskrba Niembro Monte Cimone Cap
Ferrat Mt Waliguan Ganghwa Island
Lulin
Cape Hedo Ev-K2
Mt Changbai
Minamata Mt Ailao
Nieuw Nickerie
Kodiakanal
Maheacute Island Manaus
Bariloche Cape Point
Amsterdam Island Cape Grim
Dumont drsquoUrville
AMAP CAMnet EMEP GMOS GMOS associated NADPAIRMoN NADPMDN
Air + precipitation Air Precipitation
20
UNEP Global Mercury Assessment 2013
John Munthe
The mercury background air monitoring station at Zeppelin mountain Svalbard
air from over the ocean Sites off the Asian coast however show higher levels of gaseous elemental mercury than the Northern Hemisphere background suggesting an outflow from the Asian mainland
Weather patterns have also been found to have a strong influence on seasonal patterns in mercury levels in the air at monitoring sites At the Mount Waliguan Observatory on the Tibetan Plateau for example northeasterly and easterly winds produced the highest levels of mercury
Measurements at high altitudes Measurements from ground-based stations above 2700 meters suggest that there is an inverse relationship between gaseous elemental mercury and gaseous oxidized mercury at these elevations In other words when there is more elemental mercury there is less oxidized mercury and vice versa These measurements are in good agreement with modelling results which gives additional confidence in current understanding of the behaviour of mercury at high altitude
An inverse relationship between total gaseous mercury and particulate concentration has also been observed in the high stratosphere From the transformation rate of total gaseous mercury to particulate-bound mercury it appears that gaseous mercury lasts about two years in the stratosphere
21
UNEP Global Mercury Assessment 2013
Atmospheric concentrations and deposition 6 Measurements and trends of mercury in precipitation Mercury deposited by precipitation decreased from the 1990s into the 2000s at many but not all sites in North America and Western Europe where such measurements were taken
Regional patterns are also evident including slightly higher levels in southern Europe than northern Europe and higher levels in Asia than in North America Total mercury concentrations in precipitation in China were much higher than those in Japan and South Korea Th is was mostly attributed to higher levels of gaseous oxidized mercury and particulate-bound mercury which are readily deposited by precipitation and thus not transported far
A comparison of data from Canadian and American monitoring sites found that deposition of mercury in precipitation was highest in summer
Dry deposition of mercury which is deposition not associated with precipitation is diffi cult to measure and consequently there is little information on trends in mercury dry deposition Th is lack of information means that it is also diffi cult to validate model results for dry deposition
106 44
474 72 91
5 7 71
05 1 5 10 100 500 1000
Total mercury emission (2005) kgcell
Modelled mercury air concentrations and deposition patterns Atmospheric mercury concentrations are highest in major industrial regions Models examining global patterns show that East and South Asia Europe North America and South Africa have the highest levels of elemental mercury in the air Concentrations are generally lower in the Southern Hemisphere than the Northern Hemisphere because most industrial activity is in northern regions Th ese model results are based on simulations using the 2005 global mercury emission inventory because the 2010 inventory has only recently become available
Intercontinental transport of mercury in the air has been examined to determine its impact on regional mercury levels Four models using diff erent parameters produced consistent results Depending on the region mercury emitted by distant sources contributes between 10 and 30 of annual mercury deposition Where local sources are low mercury transported from distant emission sources can account for more than half of the deposition East Asia is the dominant source region adding 10-14 to the deposition in
Contribution from sources outside receptor region
Model 40
GEOS-Chem GLEMOS GRAHM CMAQ-Hg
30
20
10
0 Arctic Europe North East Asia South Asia
America
Receptor region
(Left ) Global distribution of anthropogenic mercury emissions in 2005 with source regions that were considered in the analysis (North America South America Europe Africa Central Asia South Asia East Asia Australia and Oceania) and (right) the contribution of anthropogenic sources outside a particular receptor region to deposition within the receptor region
22
UNEP Global Mercury Assessment 2013
Modelling atmospheric transport and deposition Global models reproduce the movement of mercury in the atmosphere during which the mercury may move between continents They have been effective in examining sources of mercury to the Arctic and also for examining the outflow of pollution from South and Southeast Asia and its impact on western North America as well as the flow from eastern North America to Europe
Regional models on the scale of a continent or a basin such as the Mediterranean can provide more detail about specific source areas even to the level of individual industrial areas Reliable results however require a detailed understanding of mercury oxidation in the atmosphere about which there is considerably uncertainty
Most atmospheric transport models consider the full chain of mercury processes in the atmosphere Some models also consider how mercury is cycled in other atmospheric compartments such as soil vegetation snow freshwater and seawater
One of the largest sources of uncertainty in mercury models is the chemical mechanism used to determine how mercury changes forms in the air Improved experimental data can help improve model performance by making sure that the correct reactions are simulated The processes that lead from deposition to re-emission also need to be understood better Advances in this area show promise with model results becoming closer to estimates based on experimental data
other regions of the world Natural emissions and re-emissions account for 35-70 of total deposition in most regions Deposition is generally greater in low and mid-latitudes due to stronger sunlight higher concentrations of oxidants and higher precipitation
Regional mercury models show patterns at the scales of continents or individual seas The Mediterranean Sea for example is a net source of mercury as it emits more than is deposited to it In that region dry deposition generally exceeds deposition of mercury in precipitation In Central and Southern Europe total gaseous mercury concentrations and deposition in precipitation were both consistently higher than the European average
Across the United States dry deposition accounts for two-thirds of total annual deposition mainly from gaseous oxidized mercury A study examining sources and deposition of mercury to assess the
benefits of proposed emission control measures found that mercury transport from outside the country accounts for 68 of mercury deposition in the Northeast and up to 91 in the west-central United States Large point sources contribute up to three-quarters of nearby deposition and power plants contributed half of the deposition in the eastern part of the country This suggests that new emissions standards would primarily benefit eastern regions of the US
In Asia studies show high seasonal variation in mercury concentration and deposition Anthropogenic emissions are responsible for about 75 of deposition in East Asia In this region there is a net removal of gaseous oxidized mercury from the atmosphere and a net export of gaseous elemental mercury
In the Arctic gaseous elemental mercury levels in the atmosphere are depleted rapidly in spring when after the long Arctic winters sunlight returns Ozone is depleted at the same time and it is believed that bromine-containing compounds are the cause of the photo-chemical reactions that deplete ozone and mercury During these events gaseous oxidized mercury and particulate-bound mercury levels increase sharply suggesting that the gaseous mercury is oxidized and deposited enhancing mercury deposition in Arctic areas in springtime Recent research however has found that 50-80 of the deposited mercury is re-emitted within a few days Similar springtime mercury depletion events have been seen in Antarctica
23
UNEP Global Mercury Assessment 2013
Anthropogenic releases to the aquatic environment 7 Global assessment Previous UNEP global mercury assessments only considered emissions to the atmosphere The 2013 Report presents the first attempt at compiling a global inventory of mercury releases to aquatic environments Releases directly into the aquatic environment present a completely different chemistry set of pathways and fate to those released to air They are also more directly linked to the risks posed by mercury to global environmental and human health Unlike mercury releases to air which are predominantly in the form of gaseous elemental mercury releases to water are predominantly inorganic mercury and to a lesser extent liquid elemental mercury
At present only some sources of aquatic releases can be quantified with any confidence Thus many sources that may be important are not included in this first assessment of global aquatic releases For example land management practices that expose new geological sources of mercury in rocks and mineral soils or that re-mobilize previously deposited mercury cannot yet be assessed Two broad categories of current anthropogenic sources are considered here point sources of mercury release to water and diffuse releases of mercury as a result of its remobilisation from areas where it was previously deposited or accumulated due to human activity (ie contaminated sites) Artisanal and small-scale gold mining (ASGM) mercury-containing pesticides and fungicides used in agriculture and deforestation are considered separately
Point source releases to water from various sectors in tonnes per year with the range of the estimate and as a percentage of total anthropogenic emissions
Sector Releases (range) tonnes
Non-ferrous metal production 925 (193 - 268)
Consumer product waste 894 (222 - 308)
Chlor-alkali production 28 (10 ndash 55)
Oil refining 06 (03 ndash 1)
Grand Total 185 (426 ndash 582)
The global estimate of mercury release to water from point sources has been derived from the atmospheric emissions assessment and the approach employed in the UNEP Toolkit to partition total mercury releases between air land and water This approach has considerable uncertainty and may omit sectors where releases to water are high but air emissions are unimportant and therefore not addressed in the inventory Global releases from point sources were estimated to be 185 tonnes per year
For diffuse sources evaluating the relative contribution of anthropogenic and natural sources to the aquatic environment requires determining considerations of the various mercury inputs For some sectors data exist that allow a preliminary assessment of the amounts of mercury re-mobilized into aquatic systems
For mercury-contaminated sites the range of average soil concentrations of mercury reported for sites where mercury was mined used or otherwise released by human activity was considered The area of contamination is then used to determine how much mercury is available in soils and when combined with a factor for how much mercury is released from those soils in a year the total release can be estimated Among identified contaminated sites mercury mining is identified as the largest sector followed by mining of precious metals Total releases to aquatic environments from contaminated sites are estimated to be 83-335 tonnes per year
Releases to water from contaminated sites in tonnes per year with the range of the estimate
Sector Releases (range) tonnes
Primary mercury mining sites 67 ndash 266
Precious metal production sites 14 ndash 55
Non-ferrous metal production sites 01 ndash 05
Chlor-alkali production sites 01 ndash 05
Other industrial sites 01 ndash 03
Grand Total 83 ndash 335
24
UNEP Global Mercury Assessment 2013
Much of the mercury released from artisanal and small-scale gold mining goes into rivers lakes soils and sediments and tailings From soils and tailings it may be re-mobilized by leaching and erosion In addition mining may disturb mercury-containing soils and sediments that may then erode more quickly releasing more mercury than would otherwise have become available from natural erosion A key factor in these processes is the local hydrological cycle of precipitation evaporation run-off and river flow To account for this in the assessment countries were designated as dry wet or intermediate to determine the relative importance of erosion The tropical and subtropical countries which have the greatest activity in this sector also tend to experience high precipitation and run-off exacerbating this source of mercury release and re-mobilization Total worldwide releases of mercury to land and water from ASGM were estimated at over 800 tonnes per year How much of this is released to water cannot yet be determined
Mercury continues to be used in pesticides and fungicides 2100 tonnes of mercury were released in the decade of the 1960s through such agrochemical uses Current data are unavailable although the use of mercury in these products has been greatly reduced
Deforestation especially in the Amazon Basin can lead to extensive soil erosion and thus the release of mercury previously accumulated in soils Using 2010 figures for deforestation rates around the world and an estimate of soil concentrations of mercury as much as 260 tonnes of mercury may have been released into rivers in 2010 as a result of deforestation worldwide
Because this is the first attempt to quantify global mercury releases to the aquatic environment there is no previous measurement against which these results can be compared Thus it is not possible at this time to evaluate trends in releases
Uncertainties in release estimates Estimating global releases of mercury to aquatic environments is being done here for the first time Many data are missing and others are imprecise A number of assumptions have been made based on what measurements are available or on other grounds to extrapolate from known quantities or to calculate aquatic releases in relation to atmospheric
or other emissions Thus the results should be treated with great caution It is nonetheless clear that anthropogenic sources and human activity contribute hundreds of tonnes of mercury to aquatic environments each year a substantial amount relative to estimated natural releases 150-960 tonnes per year from terrestrial environments
Lapshin Shutterstockcom
Phil Augustavo istockphotocom
Bureau of Land Managem
ent
Contaminated sites (top) erosion following deforestation (middle) and a flooded store of mercury-contaminated waste (lower) illustrate potential sources of mercury releases to water
25
UNEP Global Mercury Assessment 2013
Aquatic pathways transport and fate 8 Mercury in aquatic environments The pathways and fate of mercury in aquatic environments are important because it is in waters sediments and wetland soils that inorganic mercury is converted into methylmercury which is toxic and concentrates in animals The majority of human exposure to mercury and the health risk that comes with mercury exposure is from consumption of marine foods Thus this section focuses on the worldrsquos oceans Some freshwater systems however are important sources of fish for human consumption especially for subsistence and recreational fisheries often among indigenous peoples Artisanal and small-scale gold mining (ASGM) communities may also be affected through fish consumption and drinking water if those are contaminated by local releases
The major processes of mercury cycling are generally similar for all aquatic systems Inorganic mercury in dissolved or particulate form is the dominant mercury type in most marine and fresh waters Dissolved gaseous elemental mercury accounts for less than 30 of total mercury in water Methylmercury is often present at trace levels but may in some settings reach 30 of total mercury In freshwater and coastal environments inorganic mercury is transformed into methylmercury primarily in sediments In the open ocean this conversion takes place largely at intermediate depths between 200 and 1000 meters in the water column Mercury is lost from aquatic systems in two ways When inorganic mercury is reduced to elemental mercury it can be re-emitted to the atmosphere When inorganic mercury binds to particulates in water it can settle out rapidly and be buried in sediments Deep burial in ocean sediments is one of the major pathways by which mercury is removed from the biologically active environment
The global mercury cycle is chemically and physically complex Thus it is necessary to use models to study describe and predict what happens and will happen to mercury in the aquatic environment Until recently only one model existed that incorporated
air land and water into a unified whole The model has been validated against observations of mercury and represents the current scientific consensus The largest potential errors in this model in terms of the aquatic cycle concern details of the exchange of mercury between air and water
Pathways and fate of mercury in the oceans Model simulations suggest that anthropogenic impacts on mercury levels in the ocean are greatest in the surface waters the top 100 meters or so of the water column While model results vary one recent estimate suggests that anthropogenic emissions over the last 100 years have doubled the concentration of mercury in the surface layer of the ocean and increased it by 25 in intermediate waters and by 10 in deep waters The difference is due to the length of time it takes for surface waters to circulate to the depths
Models and measurements agree that direct deposition from the atmosphere is the dominant pathway by which mercury reaches the oceans The exceptions are smaller semi-enclosed basins such as the Mediterranean Sea or the Arctic Ocean where river runoff coastal erosion and ocean currents
Ugo M
ontaldo Shutterstockcom
26
UNEP Global Mercury Assessment 2013
account for about half of mercury inputs The most recent modelling effort suggests that total deposition input of mercury to the oceans in 2008 was 3700 tonnes
Other mercury pathways appear less important on a global basis Rivers are estimated to carry more than 2800 tonnes of mercury each year but only about 380 tonnes of this is transported offshore The rest is trapped by particles in estuaries Groundwater and re-mobilization from sediments provide 100shy800 tonnes of mercury to the oceans each year Undersea hydrothermal vents add less than 600 tonnes of mercury to the oceans There are high concentrations of mercury in vent fluids but a great deal of the mercury is precipitated as solids once the vent fluids enter seawater
Models suggest that globally about 70 of the mercury deposited into the ocean is re-emitted to the atmosphere Oxidized mercury in surface waters is reduced by biological and photochemical processes to the elemental form that is volatile and readily re-emitted The removal of this mercury ultimately reduces the pool of mercury that could be converted to methylmercury and be accumulated by marine organisms The re-emission process thus simultaneously prolongs the lifetime of mercury cycling through the atmosphere and upper ocean and acts to reduce mercury availability for marine food webs
Any changes in the efficiency of mercury reduction in surface waters or the rate of re-emission is likely to impact mercury concentrations in surface waters and the air One example is the effect of sea ice in the Arctic Ocean which blocks the re-emission
Tony Magdaraog Shutterstockcom
Mercury accumulated in marine food-webs can enter the human diet
of elemental mercury leaving elevated levels in waters under ice Changes in primary productivity could change the rate at which mercury is bound to particles thus affecting re-emission to the atmosphere as well as rates of downward transport in the ocean Changes in oxidant levels in the atmosphere such as ozone and bromine may also influence the rate of oxidation of gaseous elemental mercury and thus deposition rates to the ocean
Methylmercury in the ocean Natural bacterial processes in seawater and in sediments in coastal environments convert inorganic mercury to methylmercury Methylmercury levels are highest in the subsurface waters of many oceans because it is formed at these intermediate depths likely as a result of the decomposition of organic material falling from surface waters Current understanding indicates that about 300 tonnes of methylmercury is produced in the upper ocean by this and related processes By contrast only about 80 tonnes of methylmercury reaches the ocean from other sources such as atmospheric deposition rivers and diffusion from sediments
Current modelling indicates that methylmercury stays in the upper ocean for about 11 years Deshymethylation by photochemical reaction or by microbial activity is the major removal process for methylmercury in the ocean About 240 tonnes of methylmercury is removed by this process from the surface waters of the ocean per year
The other important pathway for methylmercury in seawater is uptake into marine food webs Although only about 40 tonnes per year is taken up in this way it is this fraction that poses risks to marine animals and human consumers of seafood Methylmercury is a problem for several reasons First it is taken up by plankton much more efficiently than is inorganic mercury resulting in concentrations in plankton that are as high as 10000 times the concentration in seawater Second methylmercury is absorbed through the intestine of animals much more easily than is inorganic mercury Third methylmercury biomagnifies as it moves up the food web Thus methylmercury becomes an increasingly greater proportion of the mercury in organisms higher in the food web This explains why some indigenous populations that consume top marine predators such as fish seals and whales have some of the worldrsquos highest concentrations of methylmercury giving rise to health concerns
27
UNEP Global Mercury Assessment 2013
Pathways and fate of mercury in freshwater Observations and modelling both show that there are in general many similarities between mercury chemistry pathways and fate in lakes and in the oceans but with obvious differences in scale and in the relative importance of different processes Modelling of mercury dynamics was done for four lakes with a history of direct mercury inputs from the largest freshwater lake in the world (Lake Superior) to small lakes in Ontario Canada Atmospheric deposition and river inflow were the main sources of inorganic mercury Much of the mercury input from lake and river catchments was associated with dissolved and particulate organic matter The dominant mercury removal mechanisms as in saltwater were burial in sediments and photochemical reduction of oxidized mercury to elemental mercury followed by re-emission to the air In Lake Superior and Lake Michigan there is evidence for methylation of mercury in the water column as is seen in the open ocean
Methylmercury levels in freshwater fish vary with the level of deposition of mercury from the air though other factors such as inputs from the watershed and the number of trophic levels within the lakersquos food web are also important Methylation predominantly occurred in lake sediments and wetlands and floodplain soils where sulphateshyreducing bacteria are believed to be primarily responsible Methylmercury is de-methylated in sediments and also taken away in the outlet river from each lake
Some 400-1400 tonnes of mercury are estimated globally to be trapped behind dams and other man-made impoundments each year This has in many cases led to significant increases in total mercury and methylmercury levels in water and of methylmercury in fish and other aquatic species When artificial lakes are created plant material is submerged leading to decay and anoxia In these conditions microbially driven methylation of inorganic mercury takes place In some cases the elevated mercury levels have also been observed downstream from the artificial lakes and reservoirs
Anthropogenic impacts on aquatic mercury levels Two studies have reported that the Atlantic and Pacific Oceans have shown opposing trends over recent decades While the influence of changing ocean currents and other oceanographic factors may be a factor the trends do make sense in light of patterns of anthropogenic emissions In the North Pacific Ocean mercury concentrations appear to have increased at depths between 200 and 1000 meters over the last few decades This increase coincides with the rapid industrialization of East Asia
In the North Atlantic however results from near Bermuda suggest a substantial decrease in mercury concentration and a change in the mercury profile through the water column The Mediterranean Sea too showed a decrease in mercury concentration between 1990 and 2004 These findings are consistent with atmospheric data from around the North Atlantic The conclusion is that mercury levels in seawater in the North Atlantic were elevated by human activity but may now be declining likely as a result of decreased emissions from North America and Europe
A complementary approach to measuring mercury in seawater is to measure mercury in aquatic animals which accumulate and integrate mercury over time Teeth hair feathers and eggshells are useful long-term archives of mercury concentrations and can provide data from the pre-industrial period (ie before 1800) as well as more recent periods
Among marine animals samples are available from several regions particularly from the Arctic where cold dry conditions help preserve animal tissues Mercury concentrations between the 13th and 16th
centuries were relatively stable From the mid- to late 19th century to the end of the 20th century mercury levels increased by an average of 12 times On average therefore about 92 of the mercury in Arctic marine wildlife today is likely to be of anthropogenic origin
Similar findings were found for a 700-year sequence of seabird eggshells from the South China Sea Mercury levels increased steadily between 1800 and 2000 with a particularly rapid increase after 1970 Concentrations since 2000 are about 10 times higher than pre-industrial levels with 91 of the mercury now likely to be of anthropogenic origin In the Antarctic studies of seal hairs show that pre-industrial mercury levels were only 60 of recent levels The relatively small difference
28
UNEP Global Mercury Assessment 2013
Historical Hg concentration as a proportion of present-day 100
80
60
40
20
0
Beluga teeth Human teeth
Gyrfalcon feathers Perigrine falcon feathers
Polar bear hair Ringed seal teeth
1200 1300 1400 1500 1600 1700 1800 1900 2000
between pre-industrial and modern mercury levels in Antarctic is consistent with lower mercury emissions and atmospheric concentrations in the Southern Hemisphere as compared with the Northern Hemisphere
The timing of long-term increases of mercury in aquatic animals can shed light on the likely sources of mercury emissions that were responsible The industrialization of Europe and North America appear responsible for the large increases in marine mercury levels that began in the 19th century as these increases occurred prior to recent Asian industrialization As with water concentrations in the Pacific Ocean recent rapid increases in mercury in seabird eggs in the South China Sea coincide with industrialization in Asia
The time lag in aquatic ecosystem response One important conclusion from air-ocean modeling is that the oceans have not yet reached equilibrium with current atmospheric levels of mercury This lag is due to several factors First mercury stays in the upper ocean above 200 meters depth for about 30 years and for centuries in intermediate and deep waters This is much longer than the one year residence time in the lower atmosphere Thus removal from the ocean takes much longer than does removal from the air and so concentrations will change more slowly
Second because of the long lifetime of mercury in deeper ocean waters a great deal of natural mercury is present in the ocean already about 100000 tonnes out of a total of 135000 tonnes in intermediate waters and 200000 out of 220000 tonnes in deep waters
Rune Dietz
Analysis of museum samples reflects the increase in mercury emissions and releases since the mid-19th century associated with anthropogenic activities
Third vertical transport of mercury from intermediate depths back to the surface returns a substantial amount of mercury to the biologically active zone each year As a result average mercury concentrations in seawater and marine animals are likely to increase slowly for decades if not centuries even if atmospheric levels stabilize at present levels In short the effects of historical anthropogenic emissions from Europe and North America are still being observed in the oceans at the same time that the effects of the recent rise in emissions from Asia are being seen
Regionally different trends can be expected depending on distance from sources and ocean circulation patterns In the North Atlantic north of 55deg N it will take 50-600 years to achieve equilibrium between atmospheric and seawater mercury levels In the North Pacific this process is estimated to take 500-700 years and in the Antarctic 700-1000 years The Arctic Ocean by contrast is smaller and will only take about 35 years to reflect changes in atmospheric mercury levels Surface waters of the Mediterranean Sea should show also changes within 10-50 years
Time lags in the responses of many freshwaters and their food-webs to changes in atmospheric mercury levels are also expected Although some immediate recovery following reductions in atmospheric mercury deposition rates is likely full recovery may take decades centuries or longer depending on the characteristics of the area Highly polluted freshwaters with catchments and sediments containing large amounts of anthropogenic mercury will recover most slowly as is already observed around point sources such as smelters that have closed down
29
UNEP Global Mercury Assessment 2013
Major gaps in knowledge 9 Large uncertainties remain in global estimates of mercury emissions to the air These stem from various sources including the availability of information on activity levels but mainly from the lack of information concerning the mercury content of some raw materials and the validity of assumptions regarding processes and technologies employed to reduce mercury emissions including their rates of application and effectiveness The accuracy and precision of measurement-based estimates can depend on the validity of extrapolating measurements made at infrequent intervals to longer periods or measurements made at one plant to other facilities with similar operations
Potentially important emissions sectors that are still not quantified in the emissions inventory include the use of mercury in vinyl-chloride monomer production secondary metals production oil and gas extraction transport and processing industrial and hazardous waste incineration and disposal sewage sludge incineration and dental fillings preparation and removal
Current measurements and their evaluation are inadequate for determining spatial and temporal trends Improved more extensive and better coordinated measurements are needed A permanent global integrated monitoring network for atmospheric mercury and mercury deposition is needed to achieve this goal The atmospheric network sites should be closely integrated with water soil and biological monitoring networks The results can be used for model testing and evaluation as well as for more accurately detailing the geographic impact of anthropogenic emissions Monitoring of mercury concentrations in the important marine food species is essential to understanding possible human health impacts and the effects of future emissions changes
Better data on mercury distribution in the troposphere is needed to improve understanding of long-range transport and source-receptor relationships Coordinated studies at high altitudes and by aircraft are needed This information will
also help validate regional and global scale models improving their prediction capabilities with regard to different policy scenarios
Key processes related to global transport and cycling of mercury remain inadequately understood The chemical form of gaseous oxidized mercury is unknown Reduction and oxidation rates for mercury in the presence of atmospheric oxidants need further study including determining which oxidants are important New measurements and modelling studies are needed to examine key chemical and physical processes that affect global transport and cycling
Few data are available for reporting mercury releases to aquatic systems Systematic and consistent monitoring of mercury releases to the air is required especially for contaminated systems Releases of mercury from soils into waters depend greatly on climate and topography and these parameters need to be better accounted for Consistent approaches for measuring and reporting releases from point sources are needed to ensure comparability of data from around the world In particular the actual role of artisanal and small-scale gold mining (ASGM) in emissions to air and releases to water needs to be more accurately estimated
The link between mercury deposition methylation and uptake by living organisms needs further study The parameters that determine the rates of exchange of mercury compounds between air and sea air and soil and air and vegetation are not fully understood Whole-ecosystem studies of mercury are needed to better understand biogeochemical cycling Methylationdemethylation rates and their spatial and temporal variations and relationship to climatic factors need to be determined in most of worldrsquos major ocean basins as well as in representative freshwaters
30
UNEP Global Mercury Assessment 2013
Key findings of the 2013 assessment 10 Atmosphere Total anthropogenic emissions of mercury to the atmosphere in 2010 are estimated at 1960 (1010shy4070) tonnes which is about 30 of the total mercury that was emitted and re-emitted from anthropogenic and natural sources in that year The largest anthropogenic sources are associated with artisanal and small-scale gold mining (ASGM) and coal burning which together account for about 62 of the annual total anthropogenic emissions to air Other major sectors include ferrous and non-ferrous metal production and cement production
East and Southeast Asia are responsible for about 40 of global anthropogenic emissions About 75 of the mercury from this region comes from China which is about one-third of the global total Increased estimates for emissions from ASGM largely a result of newly obtained data and improved information mean that South America and Sub-Saharan Africa are also responsible for a greater proportion of global emissions than was previously assumed
Anthropogenic emissions over time have increased mercury loads present in the environment This leads to higher rates of re-emission and also means that there will be a time lag of years or decades between emissions reductions and lower mercury levels in the food web including pathways of human exposure
Mercury emissions to the atmosphere likely peaked in the 1950s to 1970s and subsequently declined because of reductions in Europe Russia and North America Emission trends are unclear due to changes in methods employed to produce inventories and differences in the sectors that have been accounted at different times There are however some indications that emissions may be rising again with increases from East Asia offsetting continuing reductions in Europe and North America
Aquatic environments Natural processes in aquatic systems convert less toxic elemental and inorganic mercury into much more toxic methylmercury Methylmercury concentrates and accumulates in the food web leading to high concentrations in some species of seafood and fish that many people eat
Anthropogenic releases of mercury to aquatic environments contribute hundreds of tonnes to the amount of mercury cycling in the environment Diffuse releases and point sources appear equally important Atmospheric deposition however remains the most important input of mercury to land and oceans and has increased the amount of mercury in many environmental compartments by a factor of two or three since the start of the industrial age On land mercury that is deposited is largely retained in soils and vegetation increasing the available pool for re-mobilisation to adjacent aquatic systems Re-emission from soils however is a major addition to atmospheric mercury
Hydrology is the most important factor in the transport of mercury from catchments to downstream environments Relatively little of this mercury reaches the open ocean as most is captured in sediments behind dams in estuaries and near the coast Changes in land cover and land use can have a large effect on mercury mobilisation as exposed soils erode and mercury leaches into the water table
Concentrations of mercury in Arctic marine animals today are about 10-12 times higher than in preshyindustrial times (ie prior to about 1800) This means that on average about 92 of the mercury in marine predators such as seabirds seals and whales is anthropogenic in origin The timing of the increase suggest that 19th and early 20th century emissions from Europe North America and Russia were responsible Increases mercury concentrations in seabirds in the South China Sea appear to be more recent than the Arctic increases coinciding with increasing industrialisation in East and Southeast Asia
31
UNEP Global Mercury Assessment 2013
K+S Entsorgung Gm
bH
Recovered mercury is being stockpiled at long-term storage sites above- and as shown here below ground
The upper 100 meters of the oceans have twice the mercury that they did a century ago Intermediate and deeper waters have 10-25 more mercury on average reflecting the slow transport of mercury downwards in the oceans Seawater concentrations will thus be especially slow in responding to changes in mercury inputs from atmospheric deposition and river flow As a result mercury concentrations in marine biota are likely to increase slowly for decades to centuries even without an increase in atmospheric emissions
In freshwater ecosystems atmospheric deposition and re-mobilisation from soils slow the reduction of mercury levels even in regions where atmospheric concentrations have decreased due to emission controls
Further increases in atmospheric emissions will have long-term consequences for commercial fisheries and all consumers of marine and freshwater foods
It is likely to be years or decades before reductions in anthropogenic emissions and releases of mercury have a demonstrable effect on mercury levels throughout the environment and in the fish and marine mammals which are part of the human food-chain This only reinforces the need to act now to continue and strengthen international efforts to reduce current mercury emissions and releases Delays in action now will inevitably lead to slower recovery of the worldrsquos ecosystems in future from mercury contamination leaving an even greater legacy of pollution for future generations
32
Division of Technology Industry and Economics (DTIE) Chemicals Branch Geneva Switzerland January 2013
Job number DTI1636GE
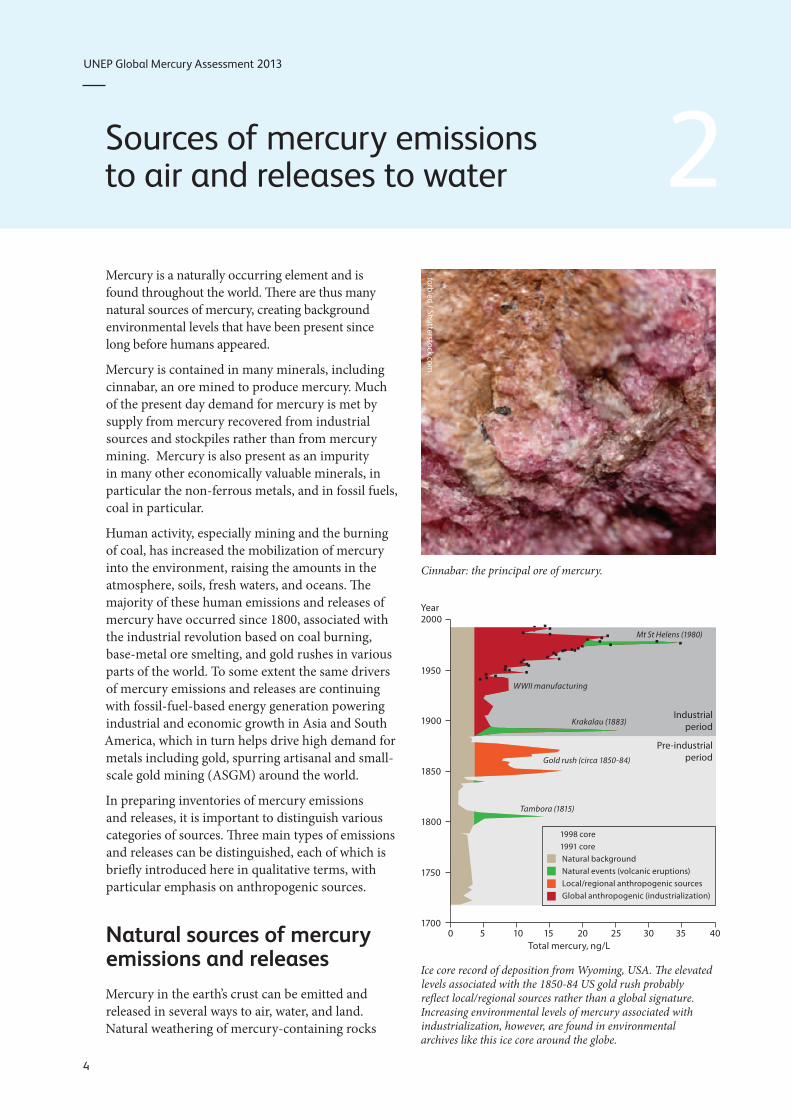
UNEP Global Mercury Assessment 2013
Sources of mercury emissions to air and releases to water 2 Mercury is a naturally occurring element and is found throughout the world There are thus many natural sources of mercury creating background environmental levels that have been present since long before humans appeared
Mercury is contained in many minerals including cinnabar an ore mined to produce mercury Much of the present day demand for mercury is met by supply from mercury recovered from industrial sources and stockpiles rather than from mercury mining Mercury is also present as an impurity in many other economically valuable minerals in particular the non-ferrous metals and in fossil fuels coal in particular
Human activity especially mining and the burning of coal has increased the mobilization of mercury into the environment raising the amounts in the atmosphere soils fresh waters and oceans The majority of these human emissions and releases of mercury have occurred since 1800 associated with the industrial revolution based on coal burning base-metal ore smelting and gold rushes in various parts of the world To some extent the same drivers of mercury emissions and releases are continuing with fossil-fuel-based energy generation powering industrial and economic growth in Asia and South America which in turn helps drive high demand for metals including gold spurring artisanal and small-scale gold mining (ASGM) around the world
In preparing inventories of mercury emissions and releases it is important to distinguish various categories of sources Three main types of emissions and releases can be distinguished each of which is briefly introduced here in qualitative terms with particular emphasis on anthropogenic sources
Natural sources of mercury emissions and releases Mercury in the earthrsquos crust can be emitted and released in several ways to air water and land Natural weathering of mercury-containing rocks
farbled Shutterstockcom
Cinnabar the principal ore of mercury
Year 2000
1950
1900
1850
1800
1750
1700
Mt St Helens (1980)
Industrial period
WWII manufacturing
Krakalau (1883)
Gold rush (circa 1850-84)
Tambora (1815)
Pre-industrial period
1998 core 1991 core Natural background Natural events (volcanic eruptions) Localregional anthropogenic sources Global anthropogenic (industrialization)
0 5 10 15 20 25 30 35 40 Total mercury ngL
Ice core record of deposition from Wyoming USA The elevated levels associated with the 1850-84 US gold rush probably reflect localregional sources rather than a global signature Increasing environmental levels of mercury associated with industrialization however are found in environmental archives like this ice core around the globe
4
UNEP Global Mercury Assessment 2013
Global mercury cycling Mercury is released to the environment from natural sources and processes and as a result of human activities Once it has entered the environment mercury cycles between air land and water until it is eventually removed from the system through burial in deep ocean sediments or lake sediments and
through entrapment in stable mineral compounds Methylmercury the most toxic and bioaccumulative form of mercury which presents the greatest health risk to humans and wildlife is mainly formed in aquatic environments through natural microbial processes
80shy600
3700
2000shy2950
2000 300shy600
1700shy2800
3200
380
lt600
Geogenic Anthropogenic
Anthropogenic Biomass burning
Soil and vegetation
Deposition to oceans
Rivers
Deposition to land
freshwater
Geogenic
Oceans
Anthropogenic
Natural
Re-emissions Re-mobilization
Units tonnes
1 tonne = 1000 kilograms
Global mercury budgets based on models illustrate the main environmental compartments and pathways that are of importance in the global mercury cycle and the ways in which natural and anthropogenic releases to air land and water move between these compartments Emissions to air arise from natural sources and anthropogenic sources as well as re-emissions of mercury previously deposited from air onto soils surface waters and vegetation
is continuous and ubiquitous allowing mercury to escape to air and to be washed into lakes and rivers Volcanoes emit and release mercury when they erupt Geothermal activity can also take mercury from underground and emit it to the atmosphere and release it to the deep oceans Some recent models of the flow of mercury through the environment suggest that natural sources account for about 10 of the estimated 5500-8900 tonnes of mercury currently being emitted and re-emitted to the atmosphere from all sources
onime Shutterstockcom
5
UNEP Global Mercury Assessment 2013
Anthropogenic sources of mercury emissions and releases Anthropogenic sources of mercury emissions account for about 30 of the total amount of mercury entering the atmosphere each year
As found in previous global mercury assessments the main industrial sources of atmospheric mercury are coal burning mining industrial activities that process ores to produce various metals or process other raw materials to produce cement In these activities mercury is emitted because it is present as an impurity in fuels and raw materials In these cases mercury emissions and releases are sometimes referred to as lsquoby-productrsquo or lsquounintentionalrsquo emissions or releases A second category of sources includes sectors where mercury is used intentionally Artisanal and small-scale gold mining (ASGM) is the largest of these in which mercury emissions and releases result from the intentional use of mercury to extract gold from rocks soils and sediments Other intentional-use release sectors include waste from consumer products (including metal recycling) the chlor-alkali industry and the production of vinyl-chloride monomer
Coal burning and to a lesser extent the use of other fossil fuels is one of the most significant anthropogenic source of mercury emissions to the atmosphere Coal does not contain high concentrations of mercury but the combination of the large volume of coal burned and the fact that a significant portion of the mercury present in coal is emitted to the atmosphere yield large overall emissions from this sector The mercury content of coal varies widely introducing a high degree of uncertainty in estimating mercury emissions from coal burning Data on mercury content is now available from many countries including major emitters of mercury
Mining smelting and production of iron and non-ferrous metals are also a large source of global mercury emissions to air and also a very important sector with regard to releases to water In the mining and processing of metals most of the mercury is captured and either stockpiled or sold for use in various products creating anthropogenic sources associated with intentional use discussed below Nonetheless the volume of ores and metals involved result in large total emissions and releases The relatively small volume of primary mercury production makes mercury mining a far smaller source today than it has been in the past
Cement production which typically involves the burning of fossil fuels to heat the materials required to make cement is another major anthropogenic source of mercury emissions Both the raw materials and the fuel may contain mercury and lead to emissions The amount of mercury involved varies greatly with the mercury content of these fuels and especially with the raw materials In some countries cement kilns are burning increasing amounts of alternative fuels including wastes that may contain mercury This may add to the emissions from cement kilns
Oil refining emits and releases mercury as oil deposits are known to contain mercury generally at low concentrations Mercury is removed from most petroleum products and natural gas prior to combustion and therefore combustion-related emissions are low Most of the mercury in crude oil is associated with solid waste that is disposed of in landfills However emissions and releases during refining of crude oil do occur and these have been quantified for the first time in the 2010 inventory The inventory does not quantify other emissions and releases during oil and gas extraction and transport or from flaring
Unintentional mercury emissions from these sectors can be reduced by the application of pollution control measures at power plants and industrial plants Some of the mercury captured is refined and enters the commercial supply chain however large amounts of mercury captured in materials such as fly ash and oil refinery waste need to be disposed of Some of the resulting wastes are themselves used as raw materials for example in construction materials but large amounts are disposed of in landfills which can thus become a potential source of mercury emissions and releases
Among intentional-use sectors Artisanal and small-scale gold mining is a major source for emissions and releases of mercury worldwide In ASGM miners use mercury to create an amalgam separating gold from other materials They then have to separate the mercury from the gold Calculating emissions from this sector presents a particular challenge because it is typically widely dispersed and often unregulated and may be illegal Uncertainties regarding release estimates from the ASGM sector are therefore high Furthermore the miners are typically poor and perhaps have little awareness of the hazards of mercury and pollution control devices may be hard to obtain
Wastes from consumer products containing mercury can end up in landfills or incinerators
6
UNEP Global Mercury Assessment 2013
Mercury is still used in a wide range of products including batteries paints switches electrical and electronic devices thermometers blood-pressure gauges fluorescent and energy-saving lamps pesticides fungicides medicines and cosmetics Once used many of the products and the mercury they contain enter waste streams While mercury in landfills may slowly become re-mobilized to the environment waste that is incinerated can be a major source of atmospheric mercury especially from uncontrolled incineration Incinerators with state-of-the-art controls have low emissions
Another use of mercury is in dental amalgam for filling teeth When bodies are cremated mercury in fillings can be emitted Mercury can also be emitted and released during production and preparation of fillings and from the disposal or removed fillings In addition mercury from removed fillings can be recycled or go into solid waste and wastewater
The amount of mercury released in the recycling of scrap metals for example in secondary steel and nonshyferrous metal production is generally assumed to be much lower than that released during primary metal production which is why the present global inventory only addresses primary metal production However lower emissions from recycling may not be the case in all countries Much of the scrap steel in some countries comes from automobiles that may still have devices that contain mercury and which may not be removed prior to recycling of the steel These devices are largely being phased out so mercury emissions from scrap steel may be expected to decrease However large differences exist between countries in the way they treat their mercury-containing wastes including scrap metals that are recycled in secondary metal production
Mercury is also used in a number of industrial processes A major industrial use is in the chlor-alkali industry where mercury-cell technology may be used in the production of chlorine and caustic soda
Mercury is also used as a catalyst in the production of vinyl chloride monomer (VCM) from acetylene mainly in China
Mercury releases to aquatic systems as a result of current human activities arise from many of the same uses or the presence of mercury in various products and processes that emit mercury to the air As with emissions to the atmosphere aquatic releases come from two main sources First mercury is released with water effluent from the sites where mercury is used Second mercury can leach into water from disposal sites that have mercury in the waste
zhu difeng Shutterstockcom
Tomas Pavelka Shutterstockcom
bikeriderlondon Shutterstockcom
Anthropogenic sources of mercury from industry and intentional use
Gunnar Futsaelig
ter
7
UNEP Global Mercury Assessment 2013
Arnold John Labrentz Shutterstockcom
Re-emission and re-mobilization of mercury Re-emissions constitute the third category of sources presently comprising about 60 of mercury emissions to air Mercury previously deposited from air onto soils surface waters and vegetation from past emissions can be emitted back to the air Re-emission is a result of natural processes that convert inorganic and organic forms of mercury to elemental mercury which is volatile and therefore readily returns to the air Mercury deposited to plant surfaces can be re-emitted during forest fires or biomass burning Mercury may be deposited and re-emitted many times as it cycles through the environment
It is important that re-emitted mercury should not be considered a natural source It may originally have come from natural or anthropogenic sources but by the time it is re-emitted it is difficult or impossible to identify its specific origin Nonetheless human activity has increased the environmental burden of mercury resulting in higher levels of re-emission This is compounded by changes in land use practices as well as increasing temperatures due to climate change
In the aquatic environment re-mobilization of mercury occurs when mercury deposited on and accumulated in soils or sediments is re-mobilized by for example rain or floods that cause the mercury to enter or re-enter the aquatic system Resuspension
of aquatic sediments due to wave action or storm events is an additional way for mercury to re-enter the aquatic ecosystems
Estimating re-emission and re-mobilization rates is difficult It is often done using modelling approaches These models are based on data on atmospheric levels and other observations as well as current understanding of chemical transformations and other processes that determine how mercury moves between air land and water The models aim to balance the amount of mercury in circulation at any given time while remaining consistent with observational data Temperature is a key factor With lower temperatures re-emission rates are generally lower
Re-emission is also a major factor in determining the length of time needed for anthropogenic emission reductions to be reflected in decreasing environmental levels of mercury Mercury emitted in one year may be deposited to and retained in soils and waters for some time before being re-emitted or re-mobilized in subsequent years This cycle can be repeated keeping levels in air and water elevated even after anthropogenic sources have been lowered Conversely continuing to add to the global pool will leave an ever-longer legacy of anthropogenic mercury contamination worldwide It is thus imperative that international efforts to reduce mercury emissions continue and are strengthened as soon as possible
Forest fires re-emit mercury deposited to vegetation
8
UNEP Global Mercury Assessment 2013
Anthropogenic emissions to the atmosphere 3 Global emissions inventory The global emissions inventory for 2010 estimates that 1960 tonnes of mercury was emitted to the atmosphere as a direct result of human activity The leading sectors remain the same as those identified in the 2005 inventory Improved data however have changed the relative contributions of some of these sectors as have some actual changes in emissions All coal burning emissions taken together for example represent a lower percentage of the total emissions than in the 2005 inventory This is due in part to the increased estimates from artisanal and small-scale gold mining (ASGM) and in part to much lower estimates for domestic use of coal When the actual amount of mercury emitted from coal combustions in power generation and industrial uses is considered and the estimates are based on the same 2010 methodology the emissions in 2010 are the same and perhaps slightly higher than in 2005 Even though new coal-fired power plants are being built combustion efficiency and emissions controls are also improving in most parts of the world
Results by selected sector The updated inventory of emissions to air confirms coal burning as a continuing major source of emissions responsible for some 475 tonnes of mercury emissions to air annually compared with around 10 tonnes from combustion of other fossil fuels According to the new inventory more than 85 of these emissions are from coal burning in power generation and industrial uses In the previous assessment emissions from domestic and residential coal burning were highlighted as a possible larger contribution Better information on coal consumption for domestic and residential uses indicates that these activities are a smaller contribution to total emissions from coal burning than previously thought
Emissions from the cement production industry are largely dependent on the raw materials and the fuels used The new inventory avoids double
Emissions from various sectors in tonnes per year with the range of the estimate and as a percentage of total anthropogenic emissions Note These numbers cannot be compared directly with those presented in the 2008 assessment (see Chapter 4 Trends in mercury emissions to the atmosphere)
Sector Emission (range) tonnes
By-product or unintentional emissions
Fossil fuel burning
Coal burning (all uses) 474 (304 - 678) 24
Oil and natural gas burning 99 (45 ndash 163) 1
Mining smelting amp production of metals
Primary production of 455 (205 ndash 241) 2 ferrous metals
Primary production of nonshy 193 (82 ndash 660) 10 ferrous metals (Al Cu Pb Zn)
Large-scale gold production 973 (07 ndash 247) 5
Mine production of mercury 117 (69 ndash 178) lt1
Cement production 173 (655 - 646) 9
Oil refining 16 (73 - 264) 1
Contaminated sites 825 (70 - 95) 4
Intentional uses
Artisanal and small-scale 727 (410 ndash 1040) 37 gold mining
Chlor-alkali industry 284 (102 ndash 547) 1
Consumer product waste 956 (237 ndash 330) 5
Cremation (dental amalgam) 36 (09 - 119) lt1
Grand Total 1960 (1010 ndash 4070) 100
Values rounded to 3 significant figures To nearest percent
Sectors for which emissions are not currently quantified
biofuel production and combustion
vinyl-chloride monomer production emissions during
secondary metals production and ferro-alloys
oil and gas extraction transport and processing other than refinery emissions
industrial some hazardous waste incineration and disposal
sewage sludge incineration
preparation of dental amalgam fillings and disposal of removed fillings containing mercury
9
UNEP Global Mercury Assessment 2013
Disposal of waste from
Mercury-cell chlor-alkali
industry
Relative contributions to estimated emissions to air from anthropogenic sources in 2010
Oil refining
Coal combustion
Oil and natural gas combustion
Primary ferrous metal production
Primary non-ferrous metal (Al Cu Pb Zn)
Large-scale gold production
Hg production Cement production
mercury-containing products
Contaminated sites
Cremation
Artisanal and small-scale gold production
counting of emissions from conventional fuels (such as coal and oil) that are included under the industrial fossil fuel burning emissions However it does attempt to account for emissions from other fuels including alternative fuels (such as old tyres and other wastes) and from raw materials Increasing amounts of waste are being co-incinerated in the cement industry both as fuel but also in some plants as a means of disposing of hazardous wastes some of which may contain mercury In some regions additional measures are being introduced to make sure that mercury emissions associated with waste co-incineration do not increase overall emissions from cement plants
Increased application of air pollution control devices including some mercury-specific technologies together with more stringent regulations in several countries have the effect of reducing mercury emissions from coal burning sectors and thus offset some part of the emissions arising from increased activity
Artisanal and small-scale gold mining emissions are in the 2010 inventory the major source of emissions to air at 727 tonnes per year The reasons for the large increase in the estimate compared to 2005 are discussed below (see page 16) The global estimate for emissions from ASGM includes a significant contribution from China although
recent information on this sector in China is lacking China prohibited ASGM in 1996 and therefore records no emissions from this sector
Mercury-cell technology is becoming less common in the chlor-alkali industry as other more cost-effective processes are adopted No new plants are being constructed though many older plants remain to be converted Old chlor-alkali plants and other decommissioned industrial sites may constitute contaminated sites that continue to release mercury to the environment for many years and emissions from contaminated sites are now part of the inventory
Global emissions from use of mercury in dental amalgam resulting from cremation of human remains are estimated at 36 (09 ndash 119) tonnes in 2010 Some 340 tonnes of mercury is used per year in dentistry of which about 70-100 tonnes (ie 20shy30) likely enters the solid waste stream
In the production of vinyl chloride monomer information is still lacking on the lifecycle and eventual fate of the mercury catalyst Most of this production occurs in China and about 800 tonnes of mercury is thought to have been used by this industry in China in 2012 Used mercury catalyst is recycled and reused by enterprises that hold permits for hazardous waste management The amounts that may be emitted or released are unknown
Ronald de Hom
mel
Artisanal and small-scale gold mining Unlike most small-scale gold miners the green gold miners of Oro Verde shown here employ an environmental way of mining gold that does not use mercury or other chemicals
10
UNEP Global Mercury Assessment 2013
Results by region The greatest proportion of anthropogenic mercury emissions to the atmosphere comes from Asia which contributes about 50 of the global total The majority of Asian emissions come from East and Southeast Asia China accounts for three-quarters of East and Southeast Asian emissions or about one third of the global total
New data on emissions from ASGM have increased the proportion of global emissions attributed to South America and Sub-Saharan Africa largely due to increased estimates associated with improved information about ASGM activities in these areas
Emissions to air from other major source sectors are higher in Europe North America and Oceania
Mercury emission 2010 gkm2
0 2 5 10 100 1000
Global distribution of anthropogenic mercury emissions to air in 2010
Emissions from various regions in tonnes per year with the range of the estimate and as a percentage of total global anthropogenic emissions Note These numbers cannot be compared directly with those presented in the 2008 assessment (see Chapter 4 Trends in mercury emissions to the atmosphere)
See figure on the following Region Emission (range) tonnes page for map with
Australia New Zealand amp Oceania 223 (54 - 527) 11 specification of regions Values rounded to 3 Central America and the Caribbean 472 (197 - 974) 24
significant figures CIS amp other European countries 115 (426 - 289) 59
East and Southeast Asia 777 (395 - 1690) 397
European Union (EU27) 875 (445 - 226) 45
Middle Eastern States 370 (161 - 106) 19
North Africa 136 (48 - 412) 07
North America 607 (343 - 139) 31
South America 245 (128 - 465) 125
South Asia 154 (782 - 358) 79
Sub-Saharan Africa 316 (168 - 514) 161
Undefined (global total for emissions from 825 (700 - 950) 42 contaminated sites)
Grand Total 1960 (1010 ndash 4070) 100
11
UNEP Global Mercury Assessment 2013
North America
Central America and the Caribbean
South America
Unintentional emissions
Stationary combustion (coal)
Stationary combustion (oil and gas) Oil refining
Pig iron and steel
Intentional uses
Artisanal and small-scale gold mining Chlor-alkali
EU27
North Africa
Sub-Saharan Africa
Non-ferrous metals (Cu Pb Zn Al) Mercury
Large-scale gold
Cement
Product waste
Cremation
CIS amp other European countries
500
100
Middle Eastern States East and Southeast Asia
50
10 tonnes
South Asia Australia New Zealand amp Oceania
South America
North America
Central America and the Caribbean
Sub-Saharan Africa
South Asia North Africa
Middle Eastern States
EU
East and Southeast Asia
CIS amp other European countries
Australia New Zealand amp Oceania
Estimates of 2010 anthropogenic mercury emissions to air from different main sectors in different regions ASGM is shown separately to highlight its geographic distribution and better allow regional comparisons to be made for other sectors
12
UNEP Global Mercury Assessment 2013
Compiling the 2010 inventory of anthropogenic mercury emissions to air The inventories used in successive Global Mercury Assessments continue to improve as better data become available The 2013 update presents an inventory of emissions for 2010 that has a number of improvements over the 2008 assessment and its inventory for 2005
bull A more detailed analysis of emissions from some major source sectors For example fossil fuel consumption is now broken down into categories for combustion in power plants industry and other uses The type of coal or oil used is also considered providing a more accurate estimate of mercury emissions
bull A more detailed consideration of the mercury content of fuels and raw materials used in different countries and regions bull New and updated information on ASGM bull The use of different pollution control technologies
in different countries and regions have been factored into the emissions estimate bull Emission estimates for sectors not previously
included such as aluminium production oil refining and contaminated sites bull More and better information on location of major
point sources such as individual power plants smelters and cement kilns bull Better documentation and greater transparency
with respect to the data and information behind the estimates
The methods for estimating emissions from industrial sectors is complemented by other methods used for more dispersed emissions sources For example estimating emissions from some intentional-use sectors requires intensive work with those sectors Relevant and accurate information about ASGM is generally not available through official channels Estimating mercury emissions from its intentional use in lighting batteries and other products requires analysing the entire production use and waste stream to determine where mercury is likely to be released and in what quantities The approach used in the 2013 assessment addresses the emissions from breakages and wastes resulting from use of these mercury-containing products in society the majority of
which are incinerated or end up in landfills It does not however address industrial wastes or sewage sludge incineration
Uncertainties in emission estimates Estimates of mercury emissions are just that estimates To compile a global assessment requires making a number of assumptions and generalizations Uncertainty associated with the 2010 inventory arises from each of the factors used to estimate the emissions the correctness of the activity data the validity of the emission factors applied and the validity of assumptions regarding the effectiveness and use of emission-control technologies
Based on an evaluation of these sources of uncertainty and the relative contributions of sectors with reliable information and those with less reliable data uncertainty in the 2010 inventory assessment of total anthropogenic mercury emissions to air gives a range of emissions from 1010-4070 tonnes This range is greater than that reported in some previous assessments reflecting a greater appreciation of the sources of uncertainty due to the improved estimation methods and perhaps a more realistic appraisal of the state of knowledge concerning some aspects of emissions
The best estimate taking a conservative approach is 1960 tonnes If nationally produced estimates for 2010 available from some countries (Canada Japan Korea Mexico the United States and European countries reporting to LRTAP) are introduced into the global inventory in place of the inventory estimates the corresponding estimated total global anthropogenic emission to air is 1940 tonnes As most national inventories do not include uncertainty ranges it is not possible to assign a range to this number The recognition of uncertainties is an important consideration and presenting single national estimates can convey a misleading picture of what is known and more importantly not known about emissions
The numbers derived using the methods employed to produce the global inventory for 2010 were compared with a number of national inventories and emissions reported under other systems covering the same period In general the level of agreement was good in particular when the significant uncertainties
13
UNEP Global Mercury Assessment 2013
Methods for estimating emissions All global mercury emissions inventories to date have used the same basic approach for the major sectors emitting mercury to the atmosphere For specific emission sectors national emissions estimates are calculated by multiplying the amount of activity (ie amounts of fuels burned raw materials consumed or materials produced) by an emission factor that is an estimate of the mercury emitted per unit of activity For example emissions from coal-fired power generation are estimated by multiplying the tonnes of coal used by the amount of mercury estimated to be released per tonne of coal In most such inventories ldquoabatedrdquo emission factors have been employed to quantify both the emissions of mercury that occur during the processes and the effects of mercury emission controls In the new methodology used to develop the 2013 report these components are split ldquoUnabatedrdquo emission factors are employed to quantify the emissions and ldquotechnology profilesrdquo have been developed to represent the effects of mercury emission controls
Various methods are employed to estimate emissions of mercury at individual sources and at national regional and global levels In general the methods fall under one of two main categories
bull Mass-balancesubstance-flow based estimates which are based on the principle that what goes in must come out Amounts of mercury in fuels and raw materials constitute the inputs and the outputs are the amounts of mercury emitted to air released to water or land retained in products or in wastes or otherwise recovered and stored or disposed of
involved in both global and national estimates are taken into account It is important to note that there are good reasons why estimates of mercury emissions produced in the 2010 inventory may not fully agree with national inventories made by countries using other methodologies These reasons include
bull Reporting schemes may define and distinguish emissions source sectors in very different ways and aligning these sectors may not be possible
bull Industry reporting to national government may be limited to sources with emissions above a certain threshold level so that emissions from smaller sources below the threshold are not reported Where smaller sources make up a significant part of the source category reported inventories
bull Measurement-based estimates which rely on measurements made at appropriate points in the industrial process or in the productwaste output streams These measurements are used to estimate where the mercury goes as in the method above
In principle the two approaches should produce the same results In practice mass-balance based approaches tend to result in higher emission estimates than most measurement-based estimates Since future emissions reporting is likely to involve a combination of these two approaches further work is required to understand why results may differ and to reconcile the two approaches
Since the 2008 UNEP assessment was produced the number of direct measurements of emissions from certain point sources (in particular power plants and some metal and cement production plants and waste incineration facilities) has increased considerably resulting in a much improved knowledge base
A number of countries require regular reporting of emissions Increasing use is being made in these reporting systems of measurement-based estimates and facility-level reporting in particular for major point sources In other countries national mercury emissions are only being quantified for the first time Since 2005 and the start of the UNEP negotiating process in 2010 many countries have initiated work on national emission inventories which in several cases have yielded much improved information on activity data sector characteristics and mercury emissions Such inventories often make use of the UNEP Toolkit for identification and quantification of mercury emissions
may therefore significantly underestimate total mercury emissions bull National inventories in some countries are making
increasing use of actual measurements of mercury emissions at individual facilities At the global scale it is not yet feasible to base an inventory on individual site emissions Furthermore actual measurements of mercury emissions at a source may be taken only a few times during a year and may not be fully representative of normal operations In the 2013 assessment a mass-balance based approach was employed to be consistent transparent and replicable bull National reporting and monitoring schemes
may provide information that is not available to externally produced inventories
14
UNEP Global Mercury Assessment 2013
Despite these considerations most of the discrepancies noted between the 2010 inventory mass-balance-based estimates and national estimates based on measurement- approaches are modest and within the margins of error associated with the different approaches In cases where the differences are larger it is important to recognize that there are sources of error in all methods for estimating mercury emissions
Gunnar Futsaelig
ter
Sampling of mercury emissions at the Kendal coal-fired power plant in South Africa conducted under a UNEP project A probe with mercury traps is inserted into a sampling port in the stack to collect mercury present in the flue gas The mercury traps are subsequently analysed according to the US EPA Mercury Monitoring Toolkit sampling protocol
15
UNEP Global Mercury Assessment 2013
Trends in mercury emissions to the atmosphere 4 Assessing global and sectoral trends A key question in assessing anthropogenic mercury emissions worldwide is whether they are increasing or decreasing While it is tempting simply to compare the 2010 inventory with its 2005 counterpart the results would mean little As inventory methods develop and as additional sources are considered the estimate of total anthropogenic mercury emissions worldwide also changes While some changes reflect real trends others reflect changes in methods or scope Thus comparing the results of previous assessments with the present update requires considerable care and involves an understanding of the way in which these inventories have been produced and the uncertainties associated with them
It is possible however to compare certain sectors over time by attempting to compensate for any methodological changes between the various inventories since 1990
Emissions to air are thought to have peaked in the 1970s From 1990 to 2005 total anthropogenic emissions of mercury to the atmosphere appear to
Emissions to air t
1400
1200
1000
800
600
400
200
0
1990
1995
2000
2005
Africa Asia Europe Russia North Oceania South America America
Estimates of annual anthropogenic mercury emissions from different continentsregions 1990-2005
have been relatively stable with decreases in Europe and North America being offset by increases in Asia A reanalysis of the available inventories since 1990 however indicates that emissions from industrial sectors at least may be starting to increase again
The changes introduced in the 2010 inventory methodology prevent a straight-forward continuation of this analysis However an evaluation of trends for some sectors between 2005 and 2010 has been made by applying the new methodology to activity data for 2005 This comparison suggests a further slight increase in the combined amount of mercury emitted by industrial sectors (coal combustion production of cement pig iron and steel and non-ferrous metals) The following paragraphs describe the trend results for three sectors to illustrate some of the developments between 2005 and 2010 and some of the the difficulties in comparing emissions estimates between different years made with different methods
Coal burning for power generation and for industrial purposes continues to increase especially in Asia However increases in the application of air pollution controls including some mercury specific technologies together with more stringent regulations in a number of countries have reduced mercury emissions from coal burning in power plants in particular and thus offset some part of the emissions arising from increased coal consumption
In the United States for example emissions from coal burning at power plants have reportedly decreased from about 53 tonnes in 2005 to 27 tonnes in 2010 This decrease is largely due to new regulations that have resulted in changes in the sources of the coal that is burned in large power plants and the installation of mercury controls as well as controls on sulphur dioxide and particulates that have the co-benefit of further reducing mercury emissions
In China many of the new coal-fired power plants have state-of-the-art pollution controls installed
Emissions of mercury from artisanal and small-scale gold mining (ASGM) reported for 2010 are more than twice those reported for 2005 While the
16
UNEP Global Mercury Assessment 2013
Unintentional emission sectors Coal burning ferrous- and non-ferrous (Au Cu Hg Pb Zn) metal production cement production Intentional-use sectors Disposal and incineration of product waste cremation emissions chlor-alkali industry
Comparison of emissions in 2005 and 2010 by selected sector and region
Unintentional emission sectors
Emission t
1000
800
600
400
200
0 2005 2010
Australia New Zealand amp Oceania
Central America and the Caribbean
CIS amp other European countries
East and Southeast Asia
rise in the price of gold (from USD 400 per ounce in 2005 to USD 1100 per ounce in 2010) along with increased rural poverty may indeed have caused more activity in this sector the increased estimate for mercury emissions is considered to be due primarily to some more and better data from many countries and regions West Africa for example was regarded as having minimal ASGM in 2005 but is now recognized as a region with considerable activity Thus the baseline has improved without necessarily any change in actual activity or emission levels
Waste from consumer products is affected by the amount of mercury used For most products in which mercury is used mercury-free alternatives exist Consequently many of these uses of mercury are declining at least in some regions as alternative products or processes are adopted Compact fluorescent light bulbs are an exception Even though the mercury content of individual light bulbs has decreased use of this type of light bulb is increasing rapidly
Artisanal and small-scale gold mining Intentional-use sectors
1000 1000
Step change from 2005 to 2010 due to new information 800 800 (under-estimation in 2005)
600 600
400 400
200 200
0 0 2005 2010 2005 2010
European Union (EU27) South America
Middle Eastern States South Asia
North Africa Sub-Saharan Africa
North America
In order to make valid assessments of trends in emissions from global inventories comparable data on activity levels are required together with information on changes in fuel and raw material characteristics and applied air pollution control technology One aim of the 2010 inventory methods is to create a firmer foundation for such future trend analysis
Ralf Siemieniec Shutterstockcom
Use of mercury-containing energy-saving lamps is increasing
17
UNEP Global Mercury Assessment 2013
Emission scenarios and future trends The 2008 Global Atmospheric Mercury Assessment included a first attempt at projecting future emissions inventories These were based on three scenarios continuing with the status quo applying current emissions controls worldwide and achieving maximum feasible technological reductions At the time this effort was regarded as highly provisional Since then additional studies have extended and improved this work but the results are not markedly different from earlier projections of future mercury emissions
Global mercury models have been used to evaluate future scenarios Four global and hemispheric models projected mercury levels around the world in 2020 based on the three emission scenarios described earlier In industrial regions the status quo will cause an increase in mercury levels of 2-25 and in remote areas of 15-5 The two emission control scenarios on the other hand yield a decrease in mercury in industrial areas of 25-35 and in remote areas of 15-20
Another global model was coupled with estimates of surface reservoirs of mercury in order to quantify source-receptor relationships for the present and for 2050 Under the best-case scenario of maximum feasible reductions projected estimates for deposition in 2050 is similar to estimates for today In the other scenarios increasing emissions lead to increasing deposition A greater proportion of mercury emissions is expected to be in the oxidized form so that a greater proportion will be deposited near the source instead of being transported far away
The model results support the conclusion that reducing anthropogenic emissions will slowly reduce the amount of mercury in biologically available reservoirs Over time mercury in the environment will be taken out of circulation by natural processes for example from ocean waters down into sediments and biologically available mercury will decrease Increased emissions on the other hand will continue to build up the amount of mercury in circulation
With new databases and methods it may soon be possible to create scenarios that incorporate activity levels as well as technology use for each country If this were done it would allow countries to assess the effects of different mercury reduction strategies on their national emissions For example a country could determine the relative contributions of emission reduction technology as opposed to for example changes in raw materials
18
UNEP Global Mercury Assessment 2013
Atmospheric chemistry monitoring and trends 5 Forms of mercury in air Mercury in the atmosphere is in three primary forms Gaseous elemental mercury is the most common in anthropogenic and natural emissions to the atmosphere Gaseous oxidized mercury and mercury bound to particulates are less common The transport and deposition of atmospheric mercury depend greatly on whether the mercury is elemental or oxidized Elemental mercury stays in the atmosphere long enough for it to be transported around the world whereas oxidized and particulate mercury are more readily captured in existing pollution control systems or deposited relatively rapidly after their formation As a result most mercury in the air is in the gaseous elemental phase Relatively little elemental mercury is deposited directly but instead must fi rst be oxidized
Although gaseous oxidized mercury is very important in mercury cycling between air and other environmental compartments the process of oxidation in the air is poorly understood with reactions and resulting compounds yet to be verified in observations
When mercury moves from air to water and land it is generally in an oxidized gaseous or particulate form whereas when it is re-emitted to air it has been converted back to gaseous elemental
Particulate associated mercury
Pole
Equator
Gaseous elemental mercury
Global transport
Gaseous elemental mercury can be transported globally Mercury emitted in particulate form tends to deposit closer to sources
mercury Sunlight appears to play a large role in both oxidation and reduction of mercury but temperature and biological interactions are also likely to be involved to some degree Here too much uncertainty remains Nonetheless the reactions are important in determining net deposition and fate of mercury
Monitoring of mercury in air Monitoring of mercury in air focuses on the three primary forms of mercury The measurement of gaseous elemental mercury is routine and robust Measuring gaseous oxidized mercury and particulate-bound mercury however is challenging Concentrations are typically very low and these forms are chemically unstable leading to high uncertainty in the measurements Nonetheless these forms are critical for defining and modelling the fate and transport of airborne mercury
In the past two decades coordinated mercury monitoring networks and long-term monitoring sites have been established in a number of regions measuring mercury concentrations in the air as well as deposition of mercury in precipitation In Europe and North America high-quality continuous monitoring has been going on for more than 15 years especially in the Arctic High-quality monitoring has started more recently in East Asia and South Africa as part of a global effort to expand the coverage provided by long-term monitoring sites
Measurements and trends in atmospheric mercury Monitoring stations around the world have provided information about trends in atmospheric mercury though the time periods vary depending on how long the site has been active Overall a declining trend in background mercury levels over the past decade has been recorded from monitoring stations
19
UNEP Global Mercury Assessment 2013
in many regions Other regions however show an increase in mercury levels
The sites also provide information about geographical patterns reflecting both background levels of
Trends in atmospheric measurements of mercury
Site(s) Period
Mace Head Ireland 1996-2011
North America rural sites 1995-2005
High Arctic sub-Arctic Up to 20 years of records mid-latitudes
Monitoring networks Mercury monitoring in Europe is carried out under the European Monitoring and Evaluation Programme (EMEP) one of the first international environmental measurement networks Heavy metals such as mercury have been included in the EMEP program since 1999 Mercury measurements are available only from northern and northwestern Europe
Three monitoring networks currently operate in North America providing good coverage of Canada and the United States the Mercury Deposition Network the Canadian Air and Precipitation Monitoring Network and the Atmospheric Mercury Network More recently new sites have been established in Mexico extending coverage on the continent The stations monitor atmospheric mercury and mercury in precipitation which has measured since the mid-1990s Monitoring of mercury in the air and in precipitation has been underway in Asia for nearly a decade
Alert Nord
Point Barrow
Nuuk Stoacuterhoumlfethi
Mace Head
mercury and local and regional influences Mercury concentrations at remote sites in Asia are higher than in other regions of the Northern Hemisphere Coastal cities in China have lower levels than inland sites likely due to the influence of relatively clean
Measurement Trend
Gaseous elemental mercury Decrease of 14-18 per year
Total gaseous mercury Decrease of 22 to 174 in total
Total gaseous mercury Decreasing trend at some stations increasing at others
The monitoring network of the Arctic Monitoring and Assessment Programme (AMAP) includes air and deposition monitoring sites located in Arctic regions of Canada Greenland Iceland Norway Russia and Sweden
Building on existing national and regional monitoring networks the European Union-financed project
ldquoGlobal Mercury Observation Systemrdquo (GMOS) started in November 2010 Its goal is to develop a coordinated global system for monitoring mercury including a large network of ground-based monitoring stations New sites are being installed in regions where few monitoring stations exist especially in the Southern Hemisphere Two sites have been established in Antarctica one on the Antarctic Plateau and one on the coast
Ny-Aringlesund
Amderma Pallas
Raringouml Bredkaumllen
Listvyanka Diabla Gora
Mauna Loa
Mt Bachelor
Celestuacuten Calhau
Longobucco
Iskrba Niembro Monte Cimone Cap
Ferrat Mt Waliguan Ganghwa Island
Lulin
Cape Hedo Ev-K2
Mt Changbai
Minamata Mt Ailao
Nieuw Nickerie
Kodiakanal
Maheacute Island Manaus
Bariloche Cape Point
Amsterdam Island Cape Grim
Dumont drsquoUrville
AMAP CAMnet EMEP GMOS GMOS associated NADPAIRMoN NADPMDN
Air + precipitation Air Precipitation
20
UNEP Global Mercury Assessment 2013
John Munthe
The mercury background air monitoring station at Zeppelin mountain Svalbard
air from over the ocean Sites off the Asian coast however show higher levels of gaseous elemental mercury than the Northern Hemisphere background suggesting an outflow from the Asian mainland
Weather patterns have also been found to have a strong influence on seasonal patterns in mercury levels in the air at monitoring sites At the Mount Waliguan Observatory on the Tibetan Plateau for example northeasterly and easterly winds produced the highest levels of mercury
Measurements at high altitudes Measurements from ground-based stations above 2700 meters suggest that there is an inverse relationship between gaseous elemental mercury and gaseous oxidized mercury at these elevations In other words when there is more elemental mercury there is less oxidized mercury and vice versa These measurements are in good agreement with modelling results which gives additional confidence in current understanding of the behaviour of mercury at high altitude
An inverse relationship between total gaseous mercury and particulate concentration has also been observed in the high stratosphere From the transformation rate of total gaseous mercury to particulate-bound mercury it appears that gaseous mercury lasts about two years in the stratosphere
21
UNEP Global Mercury Assessment 2013
Atmospheric concentrations and deposition 6 Measurements and trends of mercury in precipitation Mercury deposited by precipitation decreased from the 1990s into the 2000s at many but not all sites in North America and Western Europe where such measurements were taken
Regional patterns are also evident including slightly higher levels in southern Europe than northern Europe and higher levels in Asia than in North America Total mercury concentrations in precipitation in China were much higher than those in Japan and South Korea Th is was mostly attributed to higher levels of gaseous oxidized mercury and particulate-bound mercury which are readily deposited by precipitation and thus not transported far
A comparison of data from Canadian and American monitoring sites found that deposition of mercury in precipitation was highest in summer
Dry deposition of mercury which is deposition not associated with precipitation is diffi cult to measure and consequently there is little information on trends in mercury dry deposition Th is lack of information means that it is also diffi cult to validate model results for dry deposition
106 44
474 72 91
5 7 71
05 1 5 10 100 500 1000
Total mercury emission (2005) kgcell
Modelled mercury air concentrations and deposition patterns Atmospheric mercury concentrations are highest in major industrial regions Models examining global patterns show that East and South Asia Europe North America and South Africa have the highest levels of elemental mercury in the air Concentrations are generally lower in the Southern Hemisphere than the Northern Hemisphere because most industrial activity is in northern regions Th ese model results are based on simulations using the 2005 global mercury emission inventory because the 2010 inventory has only recently become available
Intercontinental transport of mercury in the air has been examined to determine its impact on regional mercury levels Four models using diff erent parameters produced consistent results Depending on the region mercury emitted by distant sources contributes between 10 and 30 of annual mercury deposition Where local sources are low mercury transported from distant emission sources can account for more than half of the deposition East Asia is the dominant source region adding 10-14 to the deposition in
Contribution from sources outside receptor region
Model 40
GEOS-Chem GLEMOS GRAHM CMAQ-Hg
30
20
10
0 Arctic Europe North East Asia South Asia
America
Receptor region
(Left ) Global distribution of anthropogenic mercury emissions in 2005 with source regions that were considered in the analysis (North America South America Europe Africa Central Asia South Asia East Asia Australia and Oceania) and (right) the contribution of anthropogenic sources outside a particular receptor region to deposition within the receptor region
22
UNEP Global Mercury Assessment 2013
Modelling atmospheric transport and deposition Global models reproduce the movement of mercury in the atmosphere during which the mercury may move between continents They have been effective in examining sources of mercury to the Arctic and also for examining the outflow of pollution from South and Southeast Asia and its impact on western North America as well as the flow from eastern North America to Europe
Regional models on the scale of a continent or a basin such as the Mediterranean can provide more detail about specific source areas even to the level of individual industrial areas Reliable results however require a detailed understanding of mercury oxidation in the atmosphere about which there is considerably uncertainty
Most atmospheric transport models consider the full chain of mercury processes in the atmosphere Some models also consider how mercury is cycled in other atmospheric compartments such as soil vegetation snow freshwater and seawater
One of the largest sources of uncertainty in mercury models is the chemical mechanism used to determine how mercury changes forms in the air Improved experimental data can help improve model performance by making sure that the correct reactions are simulated The processes that lead from deposition to re-emission also need to be understood better Advances in this area show promise with model results becoming closer to estimates based on experimental data
other regions of the world Natural emissions and re-emissions account for 35-70 of total deposition in most regions Deposition is generally greater in low and mid-latitudes due to stronger sunlight higher concentrations of oxidants and higher precipitation
Regional mercury models show patterns at the scales of continents or individual seas The Mediterranean Sea for example is a net source of mercury as it emits more than is deposited to it In that region dry deposition generally exceeds deposition of mercury in precipitation In Central and Southern Europe total gaseous mercury concentrations and deposition in precipitation were both consistently higher than the European average
Across the United States dry deposition accounts for two-thirds of total annual deposition mainly from gaseous oxidized mercury A study examining sources and deposition of mercury to assess the
benefits of proposed emission control measures found that mercury transport from outside the country accounts for 68 of mercury deposition in the Northeast and up to 91 in the west-central United States Large point sources contribute up to three-quarters of nearby deposition and power plants contributed half of the deposition in the eastern part of the country This suggests that new emissions standards would primarily benefit eastern regions of the US
In Asia studies show high seasonal variation in mercury concentration and deposition Anthropogenic emissions are responsible for about 75 of deposition in East Asia In this region there is a net removal of gaseous oxidized mercury from the atmosphere and a net export of gaseous elemental mercury
In the Arctic gaseous elemental mercury levels in the atmosphere are depleted rapidly in spring when after the long Arctic winters sunlight returns Ozone is depleted at the same time and it is believed that bromine-containing compounds are the cause of the photo-chemical reactions that deplete ozone and mercury During these events gaseous oxidized mercury and particulate-bound mercury levels increase sharply suggesting that the gaseous mercury is oxidized and deposited enhancing mercury deposition in Arctic areas in springtime Recent research however has found that 50-80 of the deposited mercury is re-emitted within a few days Similar springtime mercury depletion events have been seen in Antarctica
23
UNEP Global Mercury Assessment 2013
Anthropogenic releases to the aquatic environment 7 Global assessment Previous UNEP global mercury assessments only considered emissions to the atmosphere The 2013 Report presents the first attempt at compiling a global inventory of mercury releases to aquatic environments Releases directly into the aquatic environment present a completely different chemistry set of pathways and fate to those released to air They are also more directly linked to the risks posed by mercury to global environmental and human health Unlike mercury releases to air which are predominantly in the form of gaseous elemental mercury releases to water are predominantly inorganic mercury and to a lesser extent liquid elemental mercury
At present only some sources of aquatic releases can be quantified with any confidence Thus many sources that may be important are not included in this first assessment of global aquatic releases For example land management practices that expose new geological sources of mercury in rocks and mineral soils or that re-mobilize previously deposited mercury cannot yet be assessed Two broad categories of current anthropogenic sources are considered here point sources of mercury release to water and diffuse releases of mercury as a result of its remobilisation from areas where it was previously deposited or accumulated due to human activity (ie contaminated sites) Artisanal and small-scale gold mining (ASGM) mercury-containing pesticides and fungicides used in agriculture and deforestation are considered separately
Point source releases to water from various sectors in tonnes per year with the range of the estimate and as a percentage of total anthropogenic emissions
Sector Releases (range) tonnes
Non-ferrous metal production 925 (193 - 268)
Consumer product waste 894 (222 - 308)
Chlor-alkali production 28 (10 ndash 55)
Oil refining 06 (03 ndash 1)
Grand Total 185 (426 ndash 582)
The global estimate of mercury release to water from point sources has been derived from the atmospheric emissions assessment and the approach employed in the UNEP Toolkit to partition total mercury releases between air land and water This approach has considerable uncertainty and may omit sectors where releases to water are high but air emissions are unimportant and therefore not addressed in the inventory Global releases from point sources were estimated to be 185 tonnes per year
For diffuse sources evaluating the relative contribution of anthropogenic and natural sources to the aquatic environment requires determining considerations of the various mercury inputs For some sectors data exist that allow a preliminary assessment of the amounts of mercury re-mobilized into aquatic systems
For mercury-contaminated sites the range of average soil concentrations of mercury reported for sites where mercury was mined used or otherwise released by human activity was considered The area of contamination is then used to determine how much mercury is available in soils and when combined with a factor for how much mercury is released from those soils in a year the total release can be estimated Among identified contaminated sites mercury mining is identified as the largest sector followed by mining of precious metals Total releases to aquatic environments from contaminated sites are estimated to be 83-335 tonnes per year
Releases to water from contaminated sites in tonnes per year with the range of the estimate
Sector Releases (range) tonnes
Primary mercury mining sites 67 ndash 266
Precious metal production sites 14 ndash 55
Non-ferrous metal production sites 01 ndash 05
Chlor-alkali production sites 01 ndash 05
Other industrial sites 01 ndash 03
Grand Total 83 ndash 335
24
UNEP Global Mercury Assessment 2013
Much of the mercury released from artisanal and small-scale gold mining goes into rivers lakes soils and sediments and tailings From soils and tailings it may be re-mobilized by leaching and erosion In addition mining may disturb mercury-containing soils and sediments that may then erode more quickly releasing more mercury than would otherwise have become available from natural erosion A key factor in these processes is the local hydrological cycle of precipitation evaporation run-off and river flow To account for this in the assessment countries were designated as dry wet or intermediate to determine the relative importance of erosion The tropical and subtropical countries which have the greatest activity in this sector also tend to experience high precipitation and run-off exacerbating this source of mercury release and re-mobilization Total worldwide releases of mercury to land and water from ASGM were estimated at over 800 tonnes per year How much of this is released to water cannot yet be determined
Mercury continues to be used in pesticides and fungicides 2100 tonnes of mercury were released in the decade of the 1960s through such agrochemical uses Current data are unavailable although the use of mercury in these products has been greatly reduced
Deforestation especially in the Amazon Basin can lead to extensive soil erosion and thus the release of mercury previously accumulated in soils Using 2010 figures for deforestation rates around the world and an estimate of soil concentrations of mercury as much as 260 tonnes of mercury may have been released into rivers in 2010 as a result of deforestation worldwide
Because this is the first attempt to quantify global mercury releases to the aquatic environment there is no previous measurement against which these results can be compared Thus it is not possible at this time to evaluate trends in releases
Uncertainties in release estimates Estimating global releases of mercury to aquatic environments is being done here for the first time Many data are missing and others are imprecise A number of assumptions have been made based on what measurements are available or on other grounds to extrapolate from known quantities or to calculate aquatic releases in relation to atmospheric
or other emissions Thus the results should be treated with great caution It is nonetheless clear that anthropogenic sources and human activity contribute hundreds of tonnes of mercury to aquatic environments each year a substantial amount relative to estimated natural releases 150-960 tonnes per year from terrestrial environments
Lapshin Shutterstockcom
Phil Augustavo istockphotocom
Bureau of Land Managem
ent
Contaminated sites (top) erosion following deforestation (middle) and a flooded store of mercury-contaminated waste (lower) illustrate potential sources of mercury releases to water
25
UNEP Global Mercury Assessment 2013
Aquatic pathways transport and fate 8 Mercury in aquatic environments The pathways and fate of mercury in aquatic environments are important because it is in waters sediments and wetland soils that inorganic mercury is converted into methylmercury which is toxic and concentrates in animals The majority of human exposure to mercury and the health risk that comes with mercury exposure is from consumption of marine foods Thus this section focuses on the worldrsquos oceans Some freshwater systems however are important sources of fish for human consumption especially for subsistence and recreational fisheries often among indigenous peoples Artisanal and small-scale gold mining (ASGM) communities may also be affected through fish consumption and drinking water if those are contaminated by local releases
The major processes of mercury cycling are generally similar for all aquatic systems Inorganic mercury in dissolved or particulate form is the dominant mercury type in most marine and fresh waters Dissolved gaseous elemental mercury accounts for less than 30 of total mercury in water Methylmercury is often present at trace levels but may in some settings reach 30 of total mercury In freshwater and coastal environments inorganic mercury is transformed into methylmercury primarily in sediments In the open ocean this conversion takes place largely at intermediate depths between 200 and 1000 meters in the water column Mercury is lost from aquatic systems in two ways When inorganic mercury is reduced to elemental mercury it can be re-emitted to the atmosphere When inorganic mercury binds to particulates in water it can settle out rapidly and be buried in sediments Deep burial in ocean sediments is one of the major pathways by which mercury is removed from the biologically active environment
The global mercury cycle is chemically and physically complex Thus it is necessary to use models to study describe and predict what happens and will happen to mercury in the aquatic environment Until recently only one model existed that incorporated
air land and water into a unified whole The model has been validated against observations of mercury and represents the current scientific consensus The largest potential errors in this model in terms of the aquatic cycle concern details of the exchange of mercury between air and water
Pathways and fate of mercury in the oceans Model simulations suggest that anthropogenic impacts on mercury levels in the ocean are greatest in the surface waters the top 100 meters or so of the water column While model results vary one recent estimate suggests that anthropogenic emissions over the last 100 years have doubled the concentration of mercury in the surface layer of the ocean and increased it by 25 in intermediate waters and by 10 in deep waters The difference is due to the length of time it takes for surface waters to circulate to the depths
Models and measurements agree that direct deposition from the atmosphere is the dominant pathway by which mercury reaches the oceans The exceptions are smaller semi-enclosed basins such as the Mediterranean Sea or the Arctic Ocean where river runoff coastal erosion and ocean currents
Ugo M
ontaldo Shutterstockcom
26
UNEP Global Mercury Assessment 2013
account for about half of mercury inputs The most recent modelling effort suggests that total deposition input of mercury to the oceans in 2008 was 3700 tonnes
Other mercury pathways appear less important on a global basis Rivers are estimated to carry more than 2800 tonnes of mercury each year but only about 380 tonnes of this is transported offshore The rest is trapped by particles in estuaries Groundwater and re-mobilization from sediments provide 100shy800 tonnes of mercury to the oceans each year Undersea hydrothermal vents add less than 600 tonnes of mercury to the oceans There are high concentrations of mercury in vent fluids but a great deal of the mercury is precipitated as solids once the vent fluids enter seawater
Models suggest that globally about 70 of the mercury deposited into the ocean is re-emitted to the atmosphere Oxidized mercury in surface waters is reduced by biological and photochemical processes to the elemental form that is volatile and readily re-emitted The removal of this mercury ultimately reduces the pool of mercury that could be converted to methylmercury and be accumulated by marine organisms The re-emission process thus simultaneously prolongs the lifetime of mercury cycling through the atmosphere and upper ocean and acts to reduce mercury availability for marine food webs
Any changes in the efficiency of mercury reduction in surface waters or the rate of re-emission is likely to impact mercury concentrations in surface waters and the air One example is the effect of sea ice in the Arctic Ocean which blocks the re-emission
Tony Magdaraog Shutterstockcom
Mercury accumulated in marine food-webs can enter the human diet
of elemental mercury leaving elevated levels in waters under ice Changes in primary productivity could change the rate at which mercury is bound to particles thus affecting re-emission to the atmosphere as well as rates of downward transport in the ocean Changes in oxidant levels in the atmosphere such as ozone and bromine may also influence the rate of oxidation of gaseous elemental mercury and thus deposition rates to the ocean
Methylmercury in the ocean Natural bacterial processes in seawater and in sediments in coastal environments convert inorganic mercury to methylmercury Methylmercury levels are highest in the subsurface waters of many oceans because it is formed at these intermediate depths likely as a result of the decomposition of organic material falling from surface waters Current understanding indicates that about 300 tonnes of methylmercury is produced in the upper ocean by this and related processes By contrast only about 80 tonnes of methylmercury reaches the ocean from other sources such as atmospheric deposition rivers and diffusion from sediments
Current modelling indicates that methylmercury stays in the upper ocean for about 11 years Deshymethylation by photochemical reaction or by microbial activity is the major removal process for methylmercury in the ocean About 240 tonnes of methylmercury is removed by this process from the surface waters of the ocean per year
The other important pathway for methylmercury in seawater is uptake into marine food webs Although only about 40 tonnes per year is taken up in this way it is this fraction that poses risks to marine animals and human consumers of seafood Methylmercury is a problem for several reasons First it is taken up by plankton much more efficiently than is inorganic mercury resulting in concentrations in plankton that are as high as 10000 times the concentration in seawater Second methylmercury is absorbed through the intestine of animals much more easily than is inorganic mercury Third methylmercury biomagnifies as it moves up the food web Thus methylmercury becomes an increasingly greater proportion of the mercury in organisms higher in the food web This explains why some indigenous populations that consume top marine predators such as fish seals and whales have some of the worldrsquos highest concentrations of methylmercury giving rise to health concerns
27
UNEP Global Mercury Assessment 2013
Pathways and fate of mercury in freshwater Observations and modelling both show that there are in general many similarities between mercury chemistry pathways and fate in lakes and in the oceans but with obvious differences in scale and in the relative importance of different processes Modelling of mercury dynamics was done for four lakes with a history of direct mercury inputs from the largest freshwater lake in the world (Lake Superior) to small lakes in Ontario Canada Atmospheric deposition and river inflow were the main sources of inorganic mercury Much of the mercury input from lake and river catchments was associated with dissolved and particulate organic matter The dominant mercury removal mechanisms as in saltwater were burial in sediments and photochemical reduction of oxidized mercury to elemental mercury followed by re-emission to the air In Lake Superior and Lake Michigan there is evidence for methylation of mercury in the water column as is seen in the open ocean
Methylmercury levels in freshwater fish vary with the level of deposition of mercury from the air though other factors such as inputs from the watershed and the number of trophic levels within the lakersquos food web are also important Methylation predominantly occurred in lake sediments and wetlands and floodplain soils where sulphateshyreducing bacteria are believed to be primarily responsible Methylmercury is de-methylated in sediments and also taken away in the outlet river from each lake
Some 400-1400 tonnes of mercury are estimated globally to be trapped behind dams and other man-made impoundments each year This has in many cases led to significant increases in total mercury and methylmercury levels in water and of methylmercury in fish and other aquatic species When artificial lakes are created plant material is submerged leading to decay and anoxia In these conditions microbially driven methylation of inorganic mercury takes place In some cases the elevated mercury levels have also been observed downstream from the artificial lakes and reservoirs
Anthropogenic impacts on aquatic mercury levels Two studies have reported that the Atlantic and Pacific Oceans have shown opposing trends over recent decades While the influence of changing ocean currents and other oceanographic factors may be a factor the trends do make sense in light of patterns of anthropogenic emissions In the North Pacific Ocean mercury concentrations appear to have increased at depths between 200 and 1000 meters over the last few decades This increase coincides with the rapid industrialization of East Asia
In the North Atlantic however results from near Bermuda suggest a substantial decrease in mercury concentration and a change in the mercury profile through the water column The Mediterranean Sea too showed a decrease in mercury concentration between 1990 and 2004 These findings are consistent with atmospheric data from around the North Atlantic The conclusion is that mercury levels in seawater in the North Atlantic were elevated by human activity but may now be declining likely as a result of decreased emissions from North America and Europe
A complementary approach to measuring mercury in seawater is to measure mercury in aquatic animals which accumulate and integrate mercury over time Teeth hair feathers and eggshells are useful long-term archives of mercury concentrations and can provide data from the pre-industrial period (ie before 1800) as well as more recent periods
Among marine animals samples are available from several regions particularly from the Arctic where cold dry conditions help preserve animal tissues Mercury concentrations between the 13th and 16th
centuries were relatively stable From the mid- to late 19th century to the end of the 20th century mercury levels increased by an average of 12 times On average therefore about 92 of the mercury in Arctic marine wildlife today is likely to be of anthropogenic origin
Similar findings were found for a 700-year sequence of seabird eggshells from the South China Sea Mercury levels increased steadily between 1800 and 2000 with a particularly rapid increase after 1970 Concentrations since 2000 are about 10 times higher than pre-industrial levels with 91 of the mercury now likely to be of anthropogenic origin In the Antarctic studies of seal hairs show that pre-industrial mercury levels were only 60 of recent levels The relatively small difference
28
UNEP Global Mercury Assessment 2013
Historical Hg concentration as a proportion of present-day 100
80
60
40
20
0
Beluga teeth Human teeth
Gyrfalcon feathers Perigrine falcon feathers
Polar bear hair Ringed seal teeth
1200 1300 1400 1500 1600 1700 1800 1900 2000
between pre-industrial and modern mercury levels in Antarctic is consistent with lower mercury emissions and atmospheric concentrations in the Southern Hemisphere as compared with the Northern Hemisphere
The timing of long-term increases of mercury in aquatic animals can shed light on the likely sources of mercury emissions that were responsible The industrialization of Europe and North America appear responsible for the large increases in marine mercury levels that began in the 19th century as these increases occurred prior to recent Asian industrialization As with water concentrations in the Pacific Ocean recent rapid increases in mercury in seabird eggs in the South China Sea coincide with industrialization in Asia
The time lag in aquatic ecosystem response One important conclusion from air-ocean modeling is that the oceans have not yet reached equilibrium with current atmospheric levels of mercury This lag is due to several factors First mercury stays in the upper ocean above 200 meters depth for about 30 years and for centuries in intermediate and deep waters This is much longer than the one year residence time in the lower atmosphere Thus removal from the ocean takes much longer than does removal from the air and so concentrations will change more slowly
Second because of the long lifetime of mercury in deeper ocean waters a great deal of natural mercury is present in the ocean already about 100000 tonnes out of a total of 135000 tonnes in intermediate waters and 200000 out of 220000 tonnes in deep waters
Rune Dietz
Analysis of museum samples reflects the increase in mercury emissions and releases since the mid-19th century associated with anthropogenic activities
Third vertical transport of mercury from intermediate depths back to the surface returns a substantial amount of mercury to the biologically active zone each year As a result average mercury concentrations in seawater and marine animals are likely to increase slowly for decades if not centuries even if atmospheric levels stabilize at present levels In short the effects of historical anthropogenic emissions from Europe and North America are still being observed in the oceans at the same time that the effects of the recent rise in emissions from Asia are being seen
Regionally different trends can be expected depending on distance from sources and ocean circulation patterns In the North Atlantic north of 55deg N it will take 50-600 years to achieve equilibrium between atmospheric and seawater mercury levels In the North Pacific this process is estimated to take 500-700 years and in the Antarctic 700-1000 years The Arctic Ocean by contrast is smaller and will only take about 35 years to reflect changes in atmospheric mercury levels Surface waters of the Mediterranean Sea should show also changes within 10-50 years
Time lags in the responses of many freshwaters and their food-webs to changes in atmospheric mercury levels are also expected Although some immediate recovery following reductions in atmospheric mercury deposition rates is likely full recovery may take decades centuries or longer depending on the characteristics of the area Highly polluted freshwaters with catchments and sediments containing large amounts of anthropogenic mercury will recover most slowly as is already observed around point sources such as smelters that have closed down
29
UNEP Global Mercury Assessment 2013
Major gaps in knowledge 9 Large uncertainties remain in global estimates of mercury emissions to the air These stem from various sources including the availability of information on activity levels but mainly from the lack of information concerning the mercury content of some raw materials and the validity of assumptions regarding processes and technologies employed to reduce mercury emissions including their rates of application and effectiveness The accuracy and precision of measurement-based estimates can depend on the validity of extrapolating measurements made at infrequent intervals to longer periods or measurements made at one plant to other facilities with similar operations
Potentially important emissions sectors that are still not quantified in the emissions inventory include the use of mercury in vinyl-chloride monomer production secondary metals production oil and gas extraction transport and processing industrial and hazardous waste incineration and disposal sewage sludge incineration and dental fillings preparation and removal
Current measurements and their evaluation are inadequate for determining spatial and temporal trends Improved more extensive and better coordinated measurements are needed A permanent global integrated monitoring network for atmospheric mercury and mercury deposition is needed to achieve this goal The atmospheric network sites should be closely integrated with water soil and biological monitoring networks The results can be used for model testing and evaluation as well as for more accurately detailing the geographic impact of anthropogenic emissions Monitoring of mercury concentrations in the important marine food species is essential to understanding possible human health impacts and the effects of future emissions changes
Better data on mercury distribution in the troposphere is needed to improve understanding of long-range transport and source-receptor relationships Coordinated studies at high altitudes and by aircraft are needed This information will
also help validate regional and global scale models improving their prediction capabilities with regard to different policy scenarios
Key processes related to global transport and cycling of mercury remain inadequately understood The chemical form of gaseous oxidized mercury is unknown Reduction and oxidation rates for mercury in the presence of atmospheric oxidants need further study including determining which oxidants are important New measurements and modelling studies are needed to examine key chemical and physical processes that affect global transport and cycling
Few data are available for reporting mercury releases to aquatic systems Systematic and consistent monitoring of mercury releases to the air is required especially for contaminated systems Releases of mercury from soils into waters depend greatly on climate and topography and these parameters need to be better accounted for Consistent approaches for measuring and reporting releases from point sources are needed to ensure comparability of data from around the world In particular the actual role of artisanal and small-scale gold mining (ASGM) in emissions to air and releases to water needs to be more accurately estimated
The link between mercury deposition methylation and uptake by living organisms needs further study The parameters that determine the rates of exchange of mercury compounds between air and sea air and soil and air and vegetation are not fully understood Whole-ecosystem studies of mercury are needed to better understand biogeochemical cycling Methylationdemethylation rates and their spatial and temporal variations and relationship to climatic factors need to be determined in most of worldrsquos major ocean basins as well as in representative freshwaters
30
UNEP Global Mercury Assessment 2013
Key findings of the 2013 assessment 10 Atmosphere Total anthropogenic emissions of mercury to the atmosphere in 2010 are estimated at 1960 (1010shy4070) tonnes which is about 30 of the total mercury that was emitted and re-emitted from anthropogenic and natural sources in that year The largest anthropogenic sources are associated with artisanal and small-scale gold mining (ASGM) and coal burning which together account for about 62 of the annual total anthropogenic emissions to air Other major sectors include ferrous and non-ferrous metal production and cement production
East and Southeast Asia are responsible for about 40 of global anthropogenic emissions About 75 of the mercury from this region comes from China which is about one-third of the global total Increased estimates for emissions from ASGM largely a result of newly obtained data and improved information mean that South America and Sub-Saharan Africa are also responsible for a greater proportion of global emissions than was previously assumed
Anthropogenic emissions over time have increased mercury loads present in the environment This leads to higher rates of re-emission and also means that there will be a time lag of years or decades between emissions reductions and lower mercury levels in the food web including pathways of human exposure
Mercury emissions to the atmosphere likely peaked in the 1950s to 1970s and subsequently declined because of reductions in Europe Russia and North America Emission trends are unclear due to changes in methods employed to produce inventories and differences in the sectors that have been accounted at different times There are however some indications that emissions may be rising again with increases from East Asia offsetting continuing reductions in Europe and North America
Aquatic environments Natural processes in aquatic systems convert less toxic elemental and inorganic mercury into much more toxic methylmercury Methylmercury concentrates and accumulates in the food web leading to high concentrations in some species of seafood and fish that many people eat
Anthropogenic releases of mercury to aquatic environments contribute hundreds of tonnes to the amount of mercury cycling in the environment Diffuse releases and point sources appear equally important Atmospheric deposition however remains the most important input of mercury to land and oceans and has increased the amount of mercury in many environmental compartments by a factor of two or three since the start of the industrial age On land mercury that is deposited is largely retained in soils and vegetation increasing the available pool for re-mobilisation to adjacent aquatic systems Re-emission from soils however is a major addition to atmospheric mercury
Hydrology is the most important factor in the transport of mercury from catchments to downstream environments Relatively little of this mercury reaches the open ocean as most is captured in sediments behind dams in estuaries and near the coast Changes in land cover and land use can have a large effect on mercury mobilisation as exposed soils erode and mercury leaches into the water table
Concentrations of mercury in Arctic marine animals today are about 10-12 times higher than in preshyindustrial times (ie prior to about 1800) This means that on average about 92 of the mercury in marine predators such as seabirds seals and whales is anthropogenic in origin The timing of the increase suggest that 19th and early 20th century emissions from Europe North America and Russia were responsible Increases mercury concentrations in seabirds in the South China Sea appear to be more recent than the Arctic increases coinciding with increasing industrialisation in East and Southeast Asia
31
UNEP Global Mercury Assessment 2013
K+S Entsorgung Gm
bH
Recovered mercury is being stockpiled at long-term storage sites above- and as shown here below ground
The upper 100 meters of the oceans have twice the mercury that they did a century ago Intermediate and deeper waters have 10-25 more mercury on average reflecting the slow transport of mercury downwards in the oceans Seawater concentrations will thus be especially slow in responding to changes in mercury inputs from atmospheric deposition and river flow As a result mercury concentrations in marine biota are likely to increase slowly for decades to centuries even without an increase in atmospheric emissions
In freshwater ecosystems atmospheric deposition and re-mobilisation from soils slow the reduction of mercury levels even in regions where atmospheric concentrations have decreased due to emission controls
Further increases in atmospheric emissions will have long-term consequences for commercial fisheries and all consumers of marine and freshwater foods
It is likely to be years or decades before reductions in anthropogenic emissions and releases of mercury have a demonstrable effect on mercury levels throughout the environment and in the fish and marine mammals which are part of the human food-chain This only reinforces the need to act now to continue and strengthen international efforts to reduce current mercury emissions and releases Delays in action now will inevitably lead to slower recovery of the worldrsquos ecosystems in future from mercury contamination leaving an even greater legacy of pollution for future generations
32
Division of Technology Industry and Economics (DTIE) Chemicals Branch Geneva Switzerland January 2013
Job number DTI1636GE
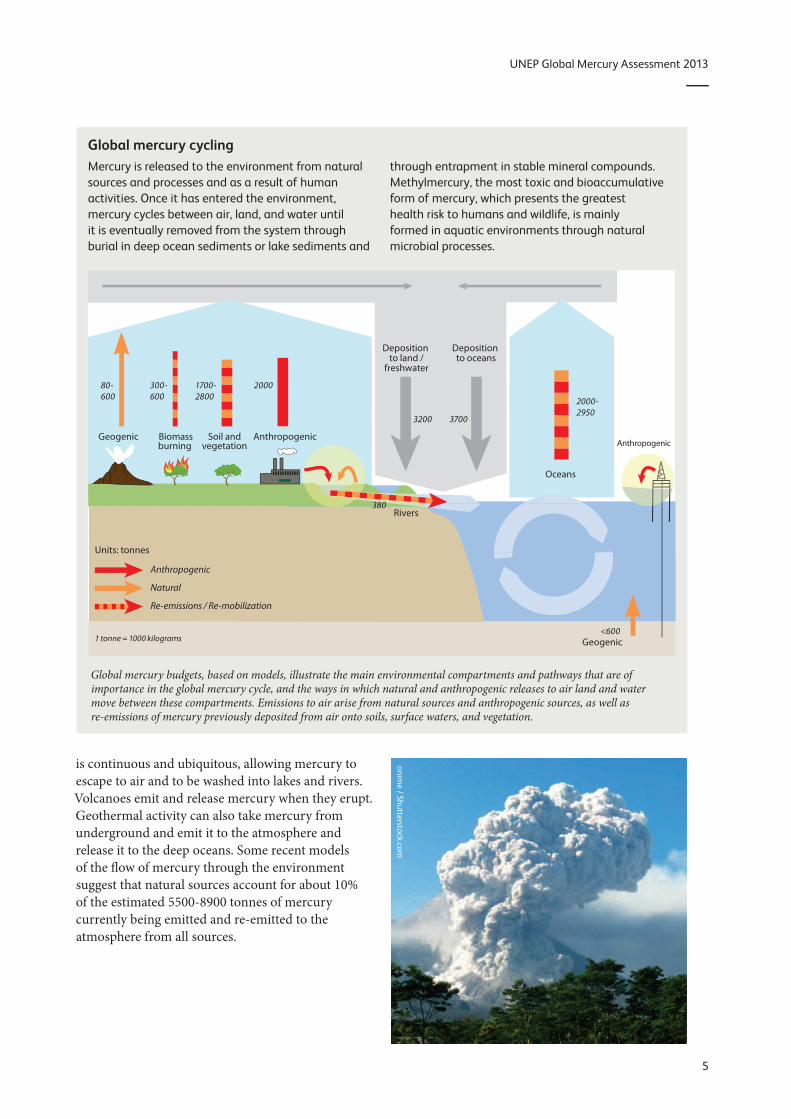
UNEP Global Mercury Assessment 2013
Global mercury cycling Mercury is released to the environment from natural sources and processes and as a result of human activities Once it has entered the environment mercury cycles between air land and water until it is eventually removed from the system through burial in deep ocean sediments or lake sediments and
through entrapment in stable mineral compounds Methylmercury the most toxic and bioaccumulative form of mercury which presents the greatest health risk to humans and wildlife is mainly formed in aquatic environments through natural microbial processes
80shy600
3700
2000shy2950
2000 300shy600
1700shy2800
3200
380
lt600
Geogenic Anthropogenic
Anthropogenic Biomass burning
Soil and vegetation
Deposition to oceans
Rivers
Deposition to land
freshwater
Geogenic
Oceans
Anthropogenic
Natural
Re-emissions Re-mobilization
Units tonnes
1 tonne = 1000 kilograms
Global mercury budgets based on models illustrate the main environmental compartments and pathways that are of importance in the global mercury cycle and the ways in which natural and anthropogenic releases to air land and water move between these compartments Emissions to air arise from natural sources and anthropogenic sources as well as re-emissions of mercury previously deposited from air onto soils surface waters and vegetation
is continuous and ubiquitous allowing mercury to escape to air and to be washed into lakes and rivers Volcanoes emit and release mercury when they erupt Geothermal activity can also take mercury from underground and emit it to the atmosphere and release it to the deep oceans Some recent models of the flow of mercury through the environment suggest that natural sources account for about 10 of the estimated 5500-8900 tonnes of mercury currently being emitted and re-emitted to the atmosphere from all sources
onime Shutterstockcom
5
UNEP Global Mercury Assessment 2013
Anthropogenic sources of mercury emissions and releases Anthropogenic sources of mercury emissions account for about 30 of the total amount of mercury entering the atmosphere each year
As found in previous global mercury assessments the main industrial sources of atmospheric mercury are coal burning mining industrial activities that process ores to produce various metals or process other raw materials to produce cement In these activities mercury is emitted because it is present as an impurity in fuels and raw materials In these cases mercury emissions and releases are sometimes referred to as lsquoby-productrsquo or lsquounintentionalrsquo emissions or releases A second category of sources includes sectors where mercury is used intentionally Artisanal and small-scale gold mining (ASGM) is the largest of these in which mercury emissions and releases result from the intentional use of mercury to extract gold from rocks soils and sediments Other intentional-use release sectors include waste from consumer products (including metal recycling) the chlor-alkali industry and the production of vinyl-chloride monomer
Coal burning and to a lesser extent the use of other fossil fuels is one of the most significant anthropogenic source of mercury emissions to the atmosphere Coal does not contain high concentrations of mercury but the combination of the large volume of coal burned and the fact that a significant portion of the mercury present in coal is emitted to the atmosphere yield large overall emissions from this sector The mercury content of coal varies widely introducing a high degree of uncertainty in estimating mercury emissions from coal burning Data on mercury content is now available from many countries including major emitters of mercury
Mining smelting and production of iron and non-ferrous metals are also a large source of global mercury emissions to air and also a very important sector with regard to releases to water In the mining and processing of metals most of the mercury is captured and either stockpiled or sold for use in various products creating anthropogenic sources associated with intentional use discussed below Nonetheless the volume of ores and metals involved result in large total emissions and releases The relatively small volume of primary mercury production makes mercury mining a far smaller source today than it has been in the past
Cement production which typically involves the burning of fossil fuels to heat the materials required to make cement is another major anthropogenic source of mercury emissions Both the raw materials and the fuel may contain mercury and lead to emissions The amount of mercury involved varies greatly with the mercury content of these fuels and especially with the raw materials In some countries cement kilns are burning increasing amounts of alternative fuels including wastes that may contain mercury This may add to the emissions from cement kilns
Oil refining emits and releases mercury as oil deposits are known to contain mercury generally at low concentrations Mercury is removed from most petroleum products and natural gas prior to combustion and therefore combustion-related emissions are low Most of the mercury in crude oil is associated with solid waste that is disposed of in landfills However emissions and releases during refining of crude oil do occur and these have been quantified for the first time in the 2010 inventory The inventory does not quantify other emissions and releases during oil and gas extraction and transport or from flaring
Unintentional mercury emissions from these sectors can be reduced by the application of pollution control measures at power plants and industrial plants Some of the mercury captured is refined and enters the commercial supply chain however large amounts of mercury captured in materials such as fly ash and oil refinery waste need to be disposed of Some of the resulting wastes are themselves used as raw materials for example in construction materials but large amounts are disposed of in landfills which can thus become a potential source of mercury emissions and releases
Among intentional-use sectors Artisanal and small-scale gold mining is a major source for emissions and releases of mercury worldwide In ASGM miners use mercury to create an amalgam separating gold from other materials They then have to separate the mercury from the gold Calculating emissions from this sector presents a particular challenge because it is typically widely dispersed and often unregulated and may be illegal Uncertainties regarding release estimates from the ASGM sector are therefore high Furthermore the miners are typically poor and perhaps have little awareness of the hazards of mercury and pollution control devices may be hard to obtain
Wastes from consumer products containing mercury can end up in landfills or incinerators
6
UNEP Global Mercury Assessment 2013
Mercury is still used in a wide range of products including batteries paints switches electrical and electronic devices thermometers blood-pressure gauges fluorescent and energy-saving lamps pesticides fungicides medicines and cosmetics Once used many of the products and the mercury they contain enter waste streams While mercury in landfills may slowly become re-mobilized to the environment waste that is incinerated can be a major source of atmospheric mercury especially from uncontrolled incineration Incinerators with state-of-the-art controls have low emissions
Another use of mercury is in dental amalgam for filling teeth When bodies are cremated mercury in fillings can be emitted Mercury can also be emitted and released during production and preparation of fillings and from the disposal or removed fillings In addition mercury from removed fillings can be recycled or go into solid waste and wastewater
The amount of mercury released in the recycling of scrap metals for example in secondary steel and nonshyferrous metal production is generally assumed to be much lower than that released during primary metal production which is why the present global inventory only addresses primary metal production However lower emissions from recycling may not be the case in all countries Much of the scrap steel in some countries comes from automobiles that may still have devices that contain mercury and which may not be removed prior to recycling of the steel These devices are largely being phased out so mercury emissions from scrap steel may be expected to decrease However large differences exist between countries in the way they treat their mercury-containing wastes including scrap metals that are recycled in secondary metal production
Mercury is also used in a number of industrial processes A major industrial use is in the chlor-alkali industry where mercury-cell technology may be used in the production of chlorine and caustic soda
Mercury is also used as a catalyst in the production of vinyl chloride monomer (VCM) from acetylene mainly in China
Mercury releases to aquatic systems as a result of current human activities arise from many of the same uses or the presence of mercury in various products and processes that emit mercury to the air As with emissions to the atmosphere aquatic releases come from two main sources First mercury is released with water effluent from the sites where mercury is used Second mercury can leach into water from disposal sites that have mercury in the waste
zhu difeng Shutterstockcom
Tomas Pavelka Shutterstockcom
bikeriderlondon Shutterstockcom
Anthropogenic sources of mercury from industry and intentional use
Gunnar Futsaelig
ter
7
UNEP Global Mercury Assessment 2013
Arnold John Labrentz Shutterstockcom
Re-emission and re-mobilization of mercury Re-emissions constitute the third category of sources presently comprising about 60 of mercury emissions to air Mercury previously deposited from air onto soils surface waters and vegetation from past emissions can be emitted back to the air Re-emission is a result of natural processes that convert inorganic and organic forms of mercury to elemental mercury which is volatile and therefore readily returns to the air Mercury deposited to plant surfaces can be re-emitted during forest fires or biomass burning Mercury may be deposited and re-emitted many times as it cycles through the environment
It is important that re-emitted mercury should not be considered a natural source It may originally have come from natural or anthropogenic sources but by the time it is re-emitted it is difficult or impossible to identify its specific origin Nonetheless human activity has increased the environmental burden of mercury resulting in higher levels of re-emission This is compounded by changes in land use practices as well as increasing temperatures due to climate change
In the aquatic environment re-mobilization of mercury occurs when mercury deposited on and accumulated in soils or sediments is re-mobilized by for example rain or floods that cause the mercury to enter or re-enter the aquatic system Resuspension
of aquatic sediments due to wave action or storm events is an additional way for mercury to re-enter the aquatic ecosystems
Estimating re-emission and re-mobilization rates is difficult It is often done using modelling approaches These models are based on data on atmospheric levels and other observations as well as current understanding of chemical transformations and other processes that determine how mercury moves between air land and water The models aim to balance the amount of mercury in circulation at any given time while remaining consistent with observational data Temperature is a key factor With lower temperatures re-emission rates are generally lower
Re-emission is also a major factor in determining the length of time needed for anthropogenic emission reductions to be reflected in decreasing environmental levels of mercury Mercury emitted in one year may be deposited to and retained in soils and waters for some time before being re-emitted or re-mobilized in subsequent years This cycle can be repeated keeping levels in air and water elevated even after anthropogenic sources have been lowered Conversely continuing to add to the global pool will leave an ever-longer legacy of anthropogenic mercury contamination worldwide It is thus imperative that international efforts to reduce mercury emissions continue and are strengthened as soon as possible
Forest fires re-emit mercury deposited to vegetation
8
UNEP Global Mercury Assessment 2013
Anthropogenic emissions to the atmosphere 3 Global emissions inventory The global emissions inventory for 2010 estimates that 1960 tonnes of mercury was emitted to the atmosphere as a direct result of human activity The leading sectors remain the same as those identified in the 2005 inventory Improved data however have changed the relative contributions of some of these sectors as have some actual changes in emissions All coal burning emissions taken together for example represent a lower percentage of the total emissions than in the 2005 inventory This is due in part to the increased estimates from artisanal and small-scale gold mining (ASGM) and in part to much lower estimates for domestic use of coal When the actual amount of mercury emitted from coal combustions in power generation and industrial uses is considered and the estimates are based on the same 2010 methodology the emissions in 2010 are the same and perhaps slightly higher than in 2005 Even though new coal-fired power plants are being built combustion efficiency and emissions controls are also improving in most parts of the world
Results by selected sector The updated inventory of emissions to air confirms coal burning as a continuing major source of emissions responsible for some 475 tonnes of mercury emissions to air annually compared with around 10 tonnes from combustion of other fossil fuels According to the new inventory more than 85 of these emissions are from coal burning in power generation and industrial uses In the previous assessment emissions from domestic and residential coal burning were highlighted as a possible larger contribution Better information on coal consumption for domestic and residential uses indicates that these activities are a smaller contribution to total emissions from coal burning than previously thought
Emissions from the cement production industry are largely dependent on the raw materials and the fuels used The new inventory avoids double
Emissions from various sectors in tonnes per year with the range of the estimate and as a percentage of total anthropogenic emissions Note These numbers cannot be compared directly with those presented in the 2008 assessment (see Chapter 4 Trends in mercury emissions to the atmosphere)
Sector Emission (range) tonnes
By-product or unintentional emissions
Fossil fuel burning
Coal burning (all uses) 474 (304 - 678) 24
Oil and natural gas burning 99 (45 ndash 163) 1
Mining smelting amp production of metals
Primary production of 455 (205 ndash 241) 2 ferrous metals
Primary production of nonshy 193 (82 ndash 660) 10 ferrous metals (Al Cu Pb Zn)
Large-scale gold production 973 (07 ndash 247) 5
Mine production of mercury 117 (69 ndash 178) lt1
Cement production 173 (655 - 646) 9
Oil refining 16 (73 - 264) 1
Contaminated sites 825 (70 - 95) 4
Intentional uses
Artisanal and small-scale 727 (410 ndash 1040) 37 gold mining
Chlor-alkali industry 284 (102 ndash 547) 1
Consumer product waste 956 (237 ndash 330) 5
Cremation (dental amalgam) 36 (09 - 119) lt1
Grand Total 1960 (1010 ndash 4070) 100
Values rounded to 3 significant figures To nearest percent
Sectors for which emissions are not currently quantified
biofuel production and combustion
vinyl-chloride monomer production emissions during
secondary metals production and ferro-alloys
oil and gas extraction transport and processing other than refinery emissions
industrial some hazardous waste incineration and disposal
sewage sludge incineration
preparation of dental amalgam fillings and disposal of removed fillings containing mercury
9
UNEP Global Mercury Assessment 2013
Disposal of waste from
Mercury-cell chlor-alkali
industry
Relative contributions to estimated emissions to air from anthropogenic sources in 2010
Oil refining
Coal combustion
Oil and natural gas combustion
Primary ferrous metal production
Primary non-ferrous metal (Al Cu Pb Zn)
Large-scale gold production
Hg production Cement production
mercury-containing products
Contaminated sites
Cremation
Artisanal and small-scale gold production
counting of emissions from conventional fuels (such as coal and oil) that are included under the industrial fossil fuel burning emissions However it does attempt to account for emissions from other fuels including alternative fuels (such as old tyres and other wastes) and from raw materials Increasing amounts of waste are being co-incinerated in the cement industry both as fuel but also in some plants as a means of disposing of hazardous wastes some of which may contain mercury In some regions additional measures are being introduced to make sure that mercury emissions associated with waste co-incineration do not increase overall emissions from cement plants
Increased application of air pollution control devices including some mercury-specific technologies together with more stringent regulations in several countries have the effect of reducing mercury emissions from coal burning sectors and thus offset some part of the emissions arising from increased activity
Artisanal and small-scale gold mining emissions are in the 2010 inventory the major source of emissions to air at 727 tonnes per year The reasons for the large increase in the estimate compared to 2005 are discussed below (see page 16) The global estimate for emissions from ASGM includes a significant contribution from China although
recent information on this sector in China is lacking China prohibited ASGM in 1996 and therefore records no emissions from this sector
Mercury-cell technology is becoming less common in the chlor-alkali industry as other more cost-effective processes are adopted No new plants are being constructed though many older plants remain to be converted Old chlor-alkali plants and other decommissioned industrial sites may constitute contaminated sites that continue to release mercury to the environment for many years and emissions from contaminated sites are now part of the inventory
Global emissions from use of mercury in dental amalgam resulting from cremation of human remains are estimated at 36 (09 ndash 119) tonnes in 2010 Some 340 tonnes of mercury is used per year in dentistry of which about 70-100 tonnes (ie 20shy30) likely enters the solid waste stream
In the production of vinyl chloride monomer information is still lacking on the lifecycle and eventual fate of the mercury catalyst Most of this production occurs in China and about 800 tonnes of mercury is thought to have been used by this industry in China in 2012 Used mercury catalyst is recycled and reused by enterprises that hold permits for hazardous waste management The amounts that may be emitted or released are unknown
Ronald de Hom
mel
Artisanal and small-scale gold mining Unlike most small-scale gold miners the green gold miners of Oro Verde shown here employ an environmental way of mining gold that does not use mercury or other chemicals
10
UNEP Global Mercury Assessment 2013
Results by region The greatest proportion of anthropogenic mercury emissions to the atmosphere comes from Asia which contributes about 50 of the global total The majority of Asian emissions come from East and Southeast Asia China accounts for three-quarters of East and Southeast Asian emissions or about one third of the global total
New data on emissions from ASGM have increased the proportion of global emissions attributed to South America and Sub-Saharan Africa largely due to increased estimates associated with improved information about ASGM activities in these areas
Emissions to air from other major source sectors are higher in Europe North America and Oceania
Mercury emission 2010 gkm2
0 2 5 10 100 1000
Global distribution of anthropogenic mercury emissions to air in 2010
Emissions from various regions in tonnes per year with the range of the estimate and as a percentage of total global anthropogenic emissions Note These numbers cannot be compared directly with those presented in the 2008 assessment (see Chapter 4 Trends in mercury emissions to the atmosphere)
See figure on the following Region Emission (range) tonnes page for map with
Australia New Zealand amp Oceania 223 (54 - 527) 11 specification of regions Values rounded to 3 Central America and the Caribbean 472 (197 - 974) 24
significant figures CIS amp other European countries 115 (426 - 289) 59
East and Southeast Asia 777 (395 - 1690) 397
European Union (EU27) 875 (445 - 226) 45
Middle Eastern States 370 (161 - 106) 19
North Africa 136 (48 - 412) 07
North America 607 (343 - 139) 31
South America 245 (128 - 465) 125
South Asia 154 (782 - 358) 79
Sub-Saharan Africa 316 (168 - 514) 161
Undefined (global total for emissions from 825 (700 - 950) 42 contaminated sites)
Grand Total 1960 (1010 ndash 4070) 100
11
UNEP Global Mercury Assessment 2013
North America
Central America and the Caribbean
South America
Unintentional emissions
Stationary combustion (coal)
Stationary combustion (oil and gas) Oil refining
Pig iron and steel
Intentional uses
Artisanal and small-scale gold mining Chlor-alkali
EU27
North Africa
Sub-Saharan Africa
Non-ferrous metals (Cu Pb Zn Al) Mercury
Large-scale gold
Cement
Product waste
Cremation
CIS amp other European countries
500
100
Middle Eastern States East and Southeast Asia
50
10 tonnes
South Asia Australia New Zealand amp Oceania
South America
North America
Central America and the Caribbean
Sub-Saharan Africa
South Asia North Africa
Middle Eastern States
EU
East and Southeast Asia
CIS amp other European countries
Australia New Zealand amp Oceania
Estimates of 2010 anthropogenic mercury emissions to air from different main sectors in different regions ASGM is shown separately to highlight its geographic distribution and better allow regional comparisons to be made for other sectors
12
UNEP Global Mercury Assessment 2013
Compiling the 2010 inventory of anthropogenic mercury emissions to air The inventories used in successive Global Mercury Assessments continue to improve as better data become available The 2013 update presents an inventory of emissions for 2010 that has a number of improvements over the 2008 assessment and its inventory for 2005
bull A more detailed analysis of emissions from some major source sectors For example fossil fuel consumption is now broken down into categories for combustion in power plants industry and other uses The type of coal or oil used is also considered providing a more accurate estimate of mercury emissions
bull A more detailed consideration of the mercury content of fuels and raw materials used in different countries and regions bull New and updated information on ASGM bull The use of different pollution control technologies
in different countries and regions have been factored into the emissions estimate bull Emission estimates for sectors not previously
included such as aluminium production oil refining and contaminated sites bull More and better information on location of major
point sources such as individual power plants smelters and cement kilns bull Better documentation and greater transparency
with respect to the data and information behind the estimates
The methods for estimating emissions from industrial sectors is complemented by other methods used for more dispersed emissions sources For example estimating emissions from some intentional-use sectors requires intensive work with those sectors Relevant and accurate information about ASGM is generally not available through official channels Estimating mercury emissions from its intentional use in lighting batteries and other products requires analysing the entire production use and waste stream to determine where mercury is likely to be released and in what quantities The approach used in the 2013 assessment addresses the emissions from breakages and wastes resulting from use of these mercury-containing products in society the majority of
which are incinerated or end up in landfills It does not however address industrial wastes or sewage sludge incineration
Uncertainties in emission estimates Estimates of mercury emissions are just that estimates To compile a global assessment requires making a number of assumptions and generalizations Uncertainty associated with the 2010 inventory arises from each of the factors used to estimate the emissions the correctness of the activity data the validity of the emission factors applied and the validity of assumptions regarding the effectiveness and use of emission-control technologies
Based on an evaluation of these sources of uncertainty and the relative contributions of sectors with reliable information and those with less reliable data uncertainty in the 2010 inventory assessment of total anthropogenic mercury emissions to air gives a range of emissions from 1010-4070 tonnes This range is greater than that reported in some previous assessments reflecting a greater appreciation of the sources of uncertainty due to the improved estimation methods and perhaps a more realistic appraisal of the state of knowledge concerning some aspects of emissions
The best estimate taking a conservative approach is 1960 tonnes If nationally produced estimates for 2010 available from some countries (Canada Japan Korea Mexico the United States and European countries reporting to LRTAP) are introduced into the global inventory in place of the inventory estimates the corresponding estimated total global anthropogenic emission to air is 1940 tonnes As most national inventories do not include uncertainty ranges it is not possible to assign a range to this number The recognition of uncertainties is an important consideration and presenting single national estimates can convey a misleading picture of what is known and more importantly not known about emissions
The numbers derived using the methods employed to produce the global inventory for 2010 were compared with a number of national inventories and emissions reported under other systems covering the same period In general the level of agreement was good in particular when the significant uncertainties
13
UNEP Global Mercury Assessment 2013
Methods for estimating emissions All global mercury emissions inventories to date have used the same basic approach for the major sectors emitting mercury to the atmosphere For specific emission sectors national emissions estimates are calculated by multiplying the amount of activity (ie amounts of fuels burned raw materials consumed or materials produced) by an emission factor that is an estimate of the mercury emitted per unit of activity For example emissions from coal-fired power generation are estimated by multiplying the tonnes of coal used by the amount of mercury estimated to be released per tonne of coal In most such inventories ldquoabatedrdquo emission factors have been employed to quantify both the emissions of mercury that occur during the processes and the effects of mercury emission controls In the new methodology used to develop the 2013 report these components are split ldquoUnabatedrdquo emission factors are employed to quantify the emissions and ldquotechnology profilesrdquo have been developed to represent the effects of mercury emission controls
Various methods are employed to estimate emissions of mercury at individual sources and at national regional and global levels In general the methods fall under one of two main categories
bull Mass-balancesubstance-flow based estimates which are based on the principle that what goes in must come out Amounts of mercury in fuels and raw materials constitute the inputs and the outputs are the amounts of mercury emitted to air released to water or land retained in products or in wastes or otherwise recovered and stored or disposed of
involved in both global and national estimates are taken into account It is important to note that there are good reasons why estimates of mercury emissions produced in the 2010 inventory may not fully agree with national inventories made by countries using other methodologies These reasons include
bull Reporting schemes may define and distinguish emissions source sectors in very different ways and aligning these sectors may not be possible
bull Industry reporting to national government may be limited to sources with emissions above a certain threshold level so that emissions from smaller sources below the threshold are not reported Where smaller sources make up a significant part of the source category reported inventories
bull Measurement-based estimates which rely on measurements made at appropriate points in the industrial process or in the productwaste output streams These measurements are used to estimate where the mercury goes as in the method above
In principle the two approaches should produce the same results In practice mass-balance based approaches tend to result in higher emission estimates than most measurement-based estimates Since future emissions reporting is likely to involve a combination of these two approaches further work is required to understand why results may differ and to reconcile the two approaches
Since the 2008 UNEP assessment was produced the number of direct measurements of emissions from certain point sources (in particular power plants and some metal and cement production plants and waste incineration facilities) has increased considerably resulting in a much improved knowledge base
A number of countries require regular reporting of emissions Increasing use is being made in these reporting systems of measurement-based estimates and facility-level reporting in particular for major point sources In other countries national mercury emissions are only being quantified for the first time Since 2005 and the start of the UNEP negotiating process in 2010 many countries have initiated work on national emission inventories which in several cases have yielded much improved information on activity data sector characteristics and mercury emissions Such inventories often make use of the UNEP Toolkit for identification and quantification of mercury emissions
may therefore significantly underestimate total mercury emissions bull National inventories in some countries are making
increasing use of actual measurements of mercury emissions at individual facilities At the global scale it is not yet feasible to base an inventory on individual site emissions Furthermore actual measurements of mercury emissions at a source may be taken only a few times during a year and may not be fully representative of normal operations In the 2013 assessment a mass-balance based approach was employed to be consistent transparent and replicable bull National reporting and monitoring schemes
may provide information that is not available to externally produced inventories
14
UNEP Global Mercury Assessment 2013
Despite these considerations most of the discrepancies noted between the 2010 inventory mass-balance-based estimates and national estimates based on measurement- approaches are modest and within the margins of error associated with the different approaches In cases where the differences are larger it is important to recognize that there are sources of error in all methods for estimating mercury emissions
Gunnar Futsaelig
ter
Sampling of mercury emissions at the Kendal coal-fired power plant in South Africa conducted under a UNEP project A probe with mercury traps is inserted into a sampling port in the stack to collect mercury present in the flue gas The mercury traps are subsequently analysed according to the US EPA Mercury Monitoring Toolkit sampling protocol
15
UNEP Global Mercury Assessment 2013
Trends in mercury emissions to the atmosphere 4 Assessing global and sectoral trends A key question in assessing anthropogenic mercury emissions worldwide is whether they are increasing or decreasing While it is tempting simply to compare the 2010 inventory with its 2005 counterpart the results would mean little As inventory methods develop and as additional sources are considered the estimate of total anthropogenic mercury emissions worldwide also changes While some changes reflect real trends others reflect changes in methods or scope Thus comparing the results of previous assessments with the present update requires considerable care and involves an understanding of the way in which these inventories have been produced and the uncertainties associated with them
It is possible however to compare certain sectors over time by attempting to compensate for any methodological changes between the various inventories since 1990
Emissions to air are thought to have peaked in the 1970s From 1990 to 2005 total anthropogenic emissions of mercury to the atmosphere appear to
Emissions to air t
1400
1200
1000
800
600
400
200
0
1990
1995
2000
2005
Africa Asia Europe Russia North Oceania South America America
Estimates of annual anthropogenic mercury emissions from different continentsregions 1990-2005
have been relatively stable with decreases in Europe and North America being offset by increases in Asia A reanalysis of the available inventories since 1990 however indicates that emissions from industrial sectors at least may be starting to increase again
The changes introduced in the 2010 inventory methodology prevent a straight-forward continuation of this analysis However an evaluation of trends for some sectors between 2005 and 2010 has been made by applying the new methodology to activity data for 2005 This comparison suggests a further slight increase in the combined amount of mercury emitted by industrial sectors (coal combustion production of cement pig iron and steel and non-ferrous metals) The following paragraphs describe the trend results for three sectors to illustrate some of the developments between 2005 and 2010 and some of the the difficulties in comparing emissions estimates between different years made with different methods
Coal burning for power generation and for industrial purposes continues to increase especially in Asia However increases in the application of air pollution controls including some mercury specific technologies together with more stringent regulations in a number of countries have reduced mercury emissions from coal burning in power plants in particular and thus offset some part of the emissions arising from increased coal consumption
In the United States for example emissions from coal burning at power plants have reportedly decreased from about 53 tonnes in 2005 to 27 tonnes in 2010 This decrease is largely due to new regulations that have resulted in changes in the sources of the coal that is burned in large power plants and the installation of mercury controls as well as controls on sulphur dioxide and particulates that have the co-benefit of further reducing mercury emissions
In China many of the new coal-fired power plants have state-of-the-art pollution controls installed
Emissions of mercury from artisanal and small-scale gold mining (ASGM) reported for 2010 are more than twice those reported for 2005 While the
16
UNEP Global Mercury Assessment 2013
Unintentional emission sectors Coal burning ferrous- and non-ferrous (Au Cu Hg Pb Zn) metal production cement production Intentional-use sectors Disposal and incineration of product waste cremation emissions chlor-alkali industry
Comparison of emissions in 2005 and 2010 by selected sector and region
Unintentional emission sectors
Emission t
1000
800
600
400
200
0 2005 2010
Australia New Zealand amp Oceania
Central America and the Caribbean
CIS amp other European countries
East and Southeast Asia
rise in the price of gold (from USD 400 per ounce in 2005 to USD 1100 per ounce in 2010) along with increased rural poverty may indeed have caused more activity in this sector the increased estimate for mercury emissions is considered to be due primarily to some more and better data from many countries and regions West Africa for example was regarded as having minimal ASGM in 2005 but is now recognized as a region with considerable activity Thus the baseline has improved without necessarily any change in actual activity or emission levels
Waste from consumer products is affected by the amount of mercury used For most products in which mercury is used mercury-free alternatives exist Consequently many of these uses of mercury are declining at least in some regions as alternative products or processes are adopted Compact fluorescent light bulbs are an exception Even though the mercury content of individual light bulbs has decreased use of this type of light bulb is increasing rapidly
Artisanal and small-scale gold mining Intentional-use sectors
1000 1000
Step change from 2005 to 2010 due to new information 800 800 (under-estimation in 2005)
600 600
400 400
200 200
0 0 2005 2010 2005 2010
European Union (EU27) South America
Middle Eastern States South Asia
North Africa Sub-Saharan Africa
North America
In order to make valid assessments of trends in emissions from global inventories comparable data on activity levels are required together with information on changes in fuel and raw material characteristics and applied air pollution control technology One aim of the 2010 inventory methods is to create a firmer foundation for such future trend analysis
Ralf Siemieniec Shutterstockcom
Use of mercury-containing energy-saving lamps is increasing
17
UNEP Global Mercury Assessment 2013
Emission scenarios and future trends The 2008 Global Atmospheric Mercury Assessment included a first attempt at projecting future emissions inventories These were based on three scenarios continuing with the status quo applying current emissions controls worldwide and achieving maximum feasible technological reductions At the time this effort was regarded as highly provisional Since then additional studies have extended and improved this work but the results are not markedly different from earlier projections of future mercury emissions
Global mercury models have been used to evaluate future scenarios Four global and hemispheric models projected mercury levels around the world in 2020 based on the three emission scenarios described earlier In industrial regions the status quo will cause an increase in mercury levels of 2-25 and in remote areas of 15-5 The two emission control scenarios on the other hand yield a decrease in mercury in industrial areas of 25-35 and in remote areas of 15-20
Another global model was coupled with estimates of surface reservoirs of mercury in order to quantify source-receptor relationships for the present and for 2050 Under the best-case scenario of maximum feasible reductions projected estimates for deposition in 2050 is similar to estimates for today In the other scenarios increasing emissions lead to increasing deposition A greater proportion of mercury emissions is expected to be in the oxidized form so that a greater proportion will be deposited near the source instead of being transported far away
The model results support the conclusion that reducing anthropogenic emissions will slowly reduce the amount of mercury in biologically available reservoirs Over time mercury in the environment will be taken out of circulation by natural processes for example from ocean waters down into sediments and biologically available mercury will decrease Increased emissions on the other hand will continue to build up the amount of mercury in circulation
With new databases and methods it may soon be possible to create scenarios that incorporate activity levels as well as technology use for each country If this were done it would allow countries to assess the effects of different mercury reduction strategies on their national emissions For example a country could determine the relative contributions of emission reduction technology as opposed to for example changes in raw materials
18
UNEP Global Mercury Assessment 2013
Atmospheric chemistry monitoring and trends 5 Forms of mercury in air Mercury in the atmosphere is in three primary forms Gaseous elemental mercury is the most common in anthropogenic and natural emissions to the atmosphere Gaseous oxidized mercury and mercury bound to particulates are less common The transport and deposition of atmospheric mercury depend greatly on whether the mercury is elemental or oxidized Elemental mercury stays in the atmosphere long enough for it to be transported around the world whereas oxidized and particulate mercury are more readily captured in existing pollution control systems or deposited relatively rapidly after their formation As a result most mercury in the air is in the gaseous elemental phase Relatively little elemental mercury is deposited directly but instead must fi rst be oxidized
Although gaseous oxidized mercury is very important in mercury cycling between air and other environmental compartments the process of oxidation in the air is poorly understood with reactions and resulting compounds yet to be verified in observations
When mercury moves from air to water and land it is generally in an oxidized gaseous or particulate form whereas when it is re-emitted to air it has been converted back to gaseous elemental
Particulate associated mercury
Pole
Equator
Gaseous elemental mercury
Global transport
Gaseous elemental mercury can be transported globally Mercury emitted in particulate form tends to deposit closer to sources
mercury Sunlight appears to play a large role in both oxidation and reduction of mercury but temperature and biological interactions are also likely to be involved to some degree Here too much uncertainty remains Nonetheless the reactions are important in determining net deposition and fate of mercury
Monitoring of mercury in air Monitoring of mercury in air focuses on the three primary forms of mercury The measurement of gaseous elemental mercury is routine and robust Measuring gaseous oxidized mercury and particulate-bound mercury however is challenging Concentrations are typically very low and these forms are chemically unstable leading to high uncertainty in the measurements Nonetheless these forms are critical for defining and modelling the fate and transport of airborne mercury
In the past two decades coordinated mercury monitoring networks and long-term monitoring sites have been established in a number of regions measuring mercury concentrations in the air as well as deposition of mercury in precipitation In Europe and North America high-quality continuous monitoring has been going on for more than 15 years especially in the Arctic High-quality monitoring has started more recently in East Asia and South Africa as part of a global effort to expand the coverage provided by long-term monitoring sites
Measurements and trends in atmospheric mercury Monitoring stations around the world have provided information about trends in atmospheric mercury though the time periods vary depending on how long the site has been active Overall a declining trend in background mercury levels over the past decade has been recorded from monitoring stations
19
UNEP Global Mercury Assessment 2013
in many regions Other regions however show an increase in mercury levels
The sites also provide information about geographical patterns reflecting both background levels of
Trends in atmospheric measurements of mercury
Site(s) Period
Mace Head Ireland 1996-2011
North America rural sites 1995-2005
High Arctic sub-Arctic Up to 20 years of records mid-latitudes
Monitoring networks Mercury monitoring in Europe is carried out under the European Monitoring and Evaluation Programme (EMEP) one of the first international environmental measurement networks Heavy metals such as mercury have been included in the EMEP program since 1999 Mercury measurements are available only from northern and northwestern Europe
Three monitoring networks currently operate in North America providing good coverage of Canada and the United States the Mercury Deposition Network the Canadian Air and Precipitation Monitoring Network and the Atmospheric Mercury Network More recently new sites have been established in Mexico extending coverage on the continent The stations monitor atmospheric mercury and mercury in precipitation which has measured since the mid-1990s Monitoring of mercury in the air and in precipitation has been underway in Asia for nearly a decade
Alert Nord
Point Barrow
Nuuk Stoacuterhoumlfethi
Mace Head
mercury and local and regional influences Mercury concentrations at remote sites in Asia are higher than in other regions of the Northern Hemisphere Coastal cities in China have lower levels than inland sites likely due to the influence of relatively clean
Measurement Trend
Gaseous elemental mercury Decrease of 14-18 per year
Total gaseous mercury Decrease of 22 to 174 in total
Total gaseous mercury Decreasing trend at some stations increasing at others
The monitoring network of the Arctic Monitoring and Assessment Programme (AMAP) includes air and deposition monitoring sites located in Arctic regions of Canada Greenland Iceland Norway Russia and Sweden
Building on existing national and regional monitoring networks the European Union-financed project
ldquoGlobal Mercury Observation Systemrdquo (GMOS) started in November 2010 Its goal is to develop a coordinated global system for monitoring mercury including a large network of ground-based monitoring stations New sites are being installed in regions where few monitoring stations exist especially in the Southern Hemisphere Two sites have been established in Antarctica one on the Antarctic Plateau and one on the coast
Ny-Aringlesund
Amderma Pallas
Raringouml Bredkaumllen
Listvyanka Diabla Gora
Mauna Loa
Mt Bachelor
Celestuacuten Calhau
Longobucco
Iskrba Niembro Monte Cimone Cap
Ferrat Mt Waliguan Ganghwa Island
Lulin
Cape Hedo Ev-K2
Mt Changbai
Minamata Mt Ailao
Nieuw Nickerie
Kodiakanal
Maheacute Island Manaus
Bariloche Cape Point
Amsterdam Island Cape Grim
Dumont drsquoUrville
AMAP CAMnet EMEP GMOS GMOS associated NADPAIRMoN NADPMDN
Air + precipitation Air Precipitation
20
UNEP Global Mercury Assessment 2013
John Munthe
The mercury background air monitoring station at Zeppelin mountain Svalbard
air from over the ocean Sites off the Asian coast however show higher levels of gaseous elemental mercury than the Northern Hemisphere background suggesting an outflow from the Asian mainland
Weather patterns have also been found to have a strong influence on seasonal patterns in mercury levels in the air at monitoring sites At the Mount Waliguan Observatory on the Tibetan Plateau for example northeasterly and easterly winds produced the highest levels of mercury
Measurements at high altitudes Measurements from ground-based stations above 2700 meters suggest that there is an inverse relationship between gaseous elemental mercury and gaseous oxidized mercury at these elevations In other words when there is more elemental mercury there is less oxidized mercury and vice versa These measurements are in good agreement with modelling results which gives additional confidence in current understanding of the behaviour of mercury at high altitude
An inverse relationship between total gaseous mercury and particulate concentration has also been observed in the high stratosphere From the transformation rate of total gaseous mercury to particulate-bound mercury it appears that gaseous mercury lasts about two years in the stratosphere
21
UNEP Global Mercury Assessment 2013
Atmospheric concentrations and deposition 6 Measurements and trends of mercury in precipitation Mercury deposited by precipitation decreased from the 1990s into the 2000s at many but not all sites in North America and Western Europe where such measurements were taken
Regional patterns are also evident including slightly higher levels in southern Europe than northern Europe and higher levels in Asia than in North America Total mercury concentrations in precipitation in China were much higher than those in Japan and South Korea Th is was mostly attributed to higher levels of gaseous oxidized mercury and particulate-bound mercury which are readily deposited by precipitation and thus not transported far
A comparison of data from Canadian and American monitoring sites found that deposition of mercury in precipitation was highest in summer
Dry deposition of mercury which is deposition not associated with precipitation is diffi cult to measure and consequently there is little information on trends in mercury dry deposition Th is lack of information means that it is also diffi cult to validate model results for dry deposition
106 44
474 72 91
5 7 71
05 1 5 10 100 500 1000
Total mercury emission (2005) kgcell
Modelled mercury air concentrations and deposition patterns Atmospheric mercury concentrations are highest in major industrial regions Models examining global patterns show that East and South Asia Europe North America and South Africa have the highest levels of elemental mercury in the air Concentrations are generally lower in the Southern Hemisphere than the Northern Hemisphere because most industrial activity is in northern regions Th ese model results are based on simulations using the 2005 global mercury emission inventory because the 2010 inventory has only recently become available
Intercontinental transport of mercury in the air has been examined to determine its impact on regional mercury levels Four models using diff erent parameters produced consistent results Depending on the region mercury emitted by distant sources contributes between 10 and 30 of annual mercury deposition Where local sources are low mercury transported from distant emission sources can account for more than half of the deposition East Asia is the dominant source region adding 10-14 to the deposition in
Contribution from sources outside receptor region
Model 40
GEOS-Chem GLEMOS GRAHM CMAQ-Hg
30
20
10
0 Arctic Europe North East Asia South Asia
America
Receptor region
(Left ) Global distribution of anthropogenic mercury emissions in 2005 with source regions that were considered in the analysis (North America South America Europe Africa Central Asia South Asia East Asia Australia and Oceania) and (right) the contribution of anthropogenic sources outside a particular receptor region to deposition within the receptor region
22
UNEP Global Mercury Assessment 2013
Modelling atmospheric transport and deposition Global models reproduce the movement of mercury in the atmosphere during which the mercury may move between continents They have been effective in examining sources of mercury to the Arctic and also for examining the outflow of pollution from South and Southeast Asia and its impact on western North America as well as the flow from eastern North America to Europe
Regional models on the scale of a continent or a basin such as the Mediterranean can provide more detail about specific source areas even to the level of individual industrial areas Reliable results however require a detailed understanding of mercury oxidation in the atmosphere about which there is considerably uncertainty
Most atmospheric transport models consider the full chain of mercury processes in the atmosphere Some models also consider how mercury is cycled in other atmospheric compartments such as soil vegetation snow freshwater and seawater
One of the largest sources of uncertainty in mercury models is the chemical mechanism used to determine how mercury changes forms in the air Improved experimental data can help improve model performance by making sure that the correct reactions are simulated The processes that lead from deposition to re-emission also need to be understood better Advances in this area show promise with model results becoming closer to estimates based on experimental data
other regions of the world Natural emissions and re-emissions account for 35-70 of total deposition in most regions Deposition is generally greater in low and mid-latitudes due to stronger sunlight higher concentrations of oxidants and higher precipitation
Regional mercury models show patterns at the scales of continents or individual seas The Mediterranean Sea for example is a net source of mercury as it emits more than is deposited to it In that region dry deposition generally exceeds deposition of mercury in precipitation In Central and Southern Europe total gaseous mercury concentrations and deposition in precipitation were both consistently higher than the European average
Across the United States dry deposition accounts for two-thirds of total annual deposition mainly from gaseous oxidized mercury A study examining sources and deposition of mercury to assess the
benefits of proposed emission control measures found that mercury transport from outside the country accounts for 68 of mercury deposition in the Northeast and up to 91 in the west-central United States Large point sources contribute up to three-quarters of nearby deposition and power plants contributed half of the deposition in the eastern part of the country This suggests that new emissions standards would primarily benefit eastern regions of the US
In Asia studies show high seasonal variation in mercury concentration and deposition Anthropogenic emissions are responsible for about 75 of deposition in East Asia In this region there is a net removal of gaseous oxidized mercury from the atmosphere and a net export of gaseous elemental mercury
In the Arctic gaseous elemental mercury levels in the atmosphere are depleted rapidly in spring when after the long Arctic winters sunlight returns Ozone is depleted at the same time and it is believed that bromine-containing compounds are the cause of the photo-chemical reactions that deplete ozone and mercury During these events gaseous oxidized mercury and particulate-bound mercury levels increase sharply suggesting that the gaseous mercury is oxidized and deposited enhancing mercury deposition in Arctic areas in springtime Recent research however has found that 50-80 of the deposited mercury is re-emitted within a few days Similar springtime mercury depletion events have been seen in Antarctica
23
UNEP Global Mercury Assessment 2013
Anthropogenic releases to the aquatic environment 7 Global assessment Previous UNEP global mercury assessments only considered emissions to the atmosphere The 2013 Report presents the first attempt at compiling a global inventory of mercury releases to aquatic environments Releases directly into the aquatic environment present a completely different chemistry set of pathways and fate to those released to air They are also more directly linked to the risks posed by mercury to global environmental and human health Unlike mercury releases to air which are predominantly in the form of gaseous elemental mercury releases to water are predominantly inorganic mercury and to a lesser extent liquid elemental mercury
At present only some sources of aquatic releases can be quantified with any confidence Thus many sources that may be important are not included in this first assessment of global aquatic releases For example land management practices that expose new geological sources of mercury in rocks and mineral soils or that re-mobilize previously deposited mercury cannot yet be assessed Two broad categories of current anthropogenic sources are considered here point sources of mercury release to water and diffuse releases of mercury as a result of its remobilisation from areas where it was previously deposited or accumulated due to human activity (ie contaminated sites) Artisanal and small-scale gold mining (ASGM) mercury-containing pesticides and fungicides used in agriculture and deforestation are considered separately
Point source releases to water from various sectors in tonnes per year with the range of the estimate and as a percentage of total anthropogenic emissions
Sector Releases (range) tonnes
Non-ferrous metal production 925 (193 - 268)
Consumer product waste 894 (222 - 308)
Chlor-alkali production 28 (10 ndash 55)
Oil refining 06 (03 ndash 1)
Grand Total 185 (426 ndash 582)
The global estimate of mercury release to water from point sources has been derived from the atmospheric emissions assessment and the approach employed in the UNEP Toolkit to partition total mercury releases between air land and water This approach has considerable uncertainty and may omit sectors where releases to water are high but air emissions are unimportant and therefore not addressed in the inventory Global releases from point sources were estimated to be 185 tonnes per year
For diffuse sources evaluating the relative contribution of anthropogenic and natural sources to the aquatic environment requires determining considerations of the various mercury inputs For some sectors data exist that allow a preliminary assessment of the amounts of mercury re-mobilized into aquatic systems
For mercury-contaminated sites the range of average soil concentrations of mercury reported for sites where mercury was mined used or otherwise released by human activity was considered The area of contamination is then used to determine how much mercury is available in soils and when combined with a factor for how much mercury is released from those soils in a year the total release can be estimated Among identified contaminated sites mercury mining is identified as the largest sector followed by mining of precious metals Total releases to aquatic environments from contaminated sites are estimated to be 83-335 tonnes per year
Releases to water from contaminated sites in tonnes per year with the range of the estimate
Sector Releases (range) tonnes
Primary mercury mining sites 67 ndash 266
Precious metal production sites 14 ndash 55
Non-ferrous metal production sites 01 ndash 05
Chlor-alkali production sites 01 ndash 05
Other industrial sites 01 ndash 03
Grand Total 83 ndash 335
24
UNEP Global Mercury Assessment 2013
Much of the mercury released from artisanal and small-scale gold mining goes into rivers lakes soils and sediments and tailings From soils and tailings it may be re-mobilized by leaching and erosion In addition mining may disturb mercury-containing soils and sediments that may then erode more quickly releasing more mercury than would otherwise have become available from natural erosion A key factor in these processes is the local hydrological cycle of precipitation evaporation run-off and river flow To account for this in the assessment countries were designated as dry wet or intermediate to determine the relative importance of erosion The tropical and subtropical countries which have the greatest activity in this sector also tend to experience high precipitation and run-off exacerbating this source of mercury release and re-mobilization Total worldwide releases of mercury to land and water from ASGM were estimated at over 800 tonnes per year How much of this is released to water cannot yet be determined
Mercury continues to be used in pesticides and fungicides 2100 tonnes of mercury were released in the decade of the 1960s through such agrochemical uses Current data are unavailable although the use of mercury in these products has been greatly reduced
Deforestation especially in the Amazon Basin can lead to extensive soil erosion and thus the release of mercury previously accumulated in soils Using 2010 figures for deforestation rates around the world and an estimate of soil concentrations of mercury as much as 260 tonnes of mercury may have been released into rivers in 2010 as a result of deforestation worldwide
Because this is the first attempt to quantify global mercury releases to the aquatic environment there is no previous measurement against which these results can be compared Thus it is not possible at this time to evaluate trends in releases
Uncertainties in release estimates Estimating global releases of mercury to aquatic environments is being done here for the first time Many data are missing and others are imprecise A number of assumptions have been made based on what measurements are available or on other grounds to extrapolate from known quantities or to calculate aquatic releases in relation to atmospheric
or other emissions Thus the results should be treated with great caution It is nonetheless clear that anthropogenic sources and human activity contribute hundreds of tonnes of mercury to aquatic environments each year a substantial amount relative to estimated natural releases 150-960 tonnes per year from terrestrial environments
Lapshin Shutterstockcom
Phil Augustavo istockphotocom
Bureau of Land Managem
ent
Contaminated sites (top) erosion following deforestation (middle) and a flooded store of mercury-contaminated waste (lower) illustrate potential sources of mercury releases to water
25
UNEP Global Mercury Assessment 2013
Aquatic pathways transport and fate 8 Mercury in aquatic environments The pathways and fate of mercury in aquatic environments are important because it is in waters sediments and wetland soils that inorganic mercury is converted into methylmercury which is toxic and concentrates in animals The majority of human exposure to mercury and the health risk that comes with mercury exposure is from consumption of marine foods Thus this section focuses on the worldrsquos oceans Some freshwater systems however are important sources of fish for human consumption especially for subsistence and recreational fisheries often among indigenous peoples Artisanal and small-scale gold mining (ASGM) communities may also be affected through fish consumption and drinking water if those are contaminated by local releases
The major processes of mercury cycling are generally similar for all aquatic systems Inorganic mercury in dissolved or particulate form is the dominant mercury type in most marine and fresh waters Dissolved gaseous elemental mercury accounts for less than 30 of total mercury in water Methylmercury is often present at trace levels but may in some settings reach 30 of total mercury In freshwater and coastal environments inorganic mercury is transformed into methylmercury primarily in sediments In the open ocean this conversion takes place largely at intermediate depths between 200 and 1000 meters in the water column Mercury is lost from aquatic systems in two ways When inorganic mercury is reduced to elemental mercury it can be re-emitted to the atmosphere When inorganic mercury binds to particulates in water it can settle out rapidly and be buried in sediments Deep burial in ocean sediments is one of the major pathways by which mercury is removed from the biologically active environment
The global mercury cycle is chemically and physically complex Thus it is necessary to use models to study describe and predict what happens and will happen to mercury in the aquatic environment Until recently only one model existed that incorporated
air land and water into a unified whole The model has been validated against observations of mercury and represents the current scientific consensus The largest potential errors in this model in terms of the aquatic cycle concern details of the exchange of mercury between air and water
Pathways and fate of mercury in the oceans Model simulations suggest that anthropogenic impacts on mercury levels in the ocean are greatest in the surface waters the top 100 meters or so of the water column While model results vary one recent estimate suggests that anthropogenic emissions over the last 100 years have doubled the concentration of mercury in the surface layer of the ocean and increased it by 25 in intermediate waters and by 10 in deep waters The difference is due to the length of time it takes for surface waters to circulate to the depths
Models and measurements agree that direct deposition from the atmosphere is the dominant pathway by which mercury reaches the oceans The exceptions are smaller semi-enclosed basins such as the Mediterranean Sea or the Arctic Ocean where river runoff coastal erosion and ocean currents
Ugo M
ontaldo Shutterstockcom
26
UNEP Global Mercury Assessment 2013
account for about half of mercury inputs The most recent modelling effort suggests that total deposition input of mercury to the oceans in 2008 was 3700 tonnes
Other mercury pathways appear less important on a global basis Rivers are estimated to carry more than 2800 tonnes of mercury each year but only about 380 tonnes of this is transported offshore The rest is trapped by particles in estuaries Groundwater and re-mobilization from sediments provide 100shy800 tonnes of mercury to the oceans each year Undersea hydrothermal vents add less than 600 tonnes of mercury to the oceans There are high concentrations of mercury in vent fluids but a great deal of the mercury is precipitated as solids once the vent fluids enter seawater
Models suggest that globally about 70 of the mercury deposited into the ocean is re-emitted to the atmosphere Oxidized mercury in surface waters is reduced by biological and photochemical processes to the elemental form that is volatile and readily re-emitted The removal of this mercury ultimately reduces the pool of mercury that could be converted to methylmercury and be accumulated by marine organisms The re-emission process thus simultaneously prolongs the lifetime of mercury cycling through the atmosphere and upper ocean and acts to reduce mercury availability for marine food webs
Any changes in the efficiency of mercury reduction in surface waters or the rate of re-emission is likely to impact mercury concentrations in surface waters and the air One example is the effect of sea ice in the Arctic Ocean which blocks the re-emission
Tony Magdaraog Shutterstockcom
Mercury accumulated in marine food-webs can enter the human diet
of elemental mercury leaving elevated levels in waters under ice Changes in primary productivity could change the rate at which mercury is bound to particles thus affecting re-emission to the atmosphere as well as rates of downward transport in the ocean Changes in oxidant levels in the atmosphere such as ozone and bromine may also influence the rate of oxidation of gaseous elemental mercury and thus deposition rates to the ocean
Methylmercury in the ocean Natural bacterial processes in seawater and in sediments in coastal environments convert inorganic mercury to methylmercury Methylmercury levels are highest in the subsurface waters of many oceans because it is formed at these intermediate depths likely as a result of the decomposition of organic material falling from surface waters Current understanding indicates that about 300 tonnes of methylmercury is produced in the upper ocean by this and related processes By contrast only about 80 tonnes of methylmercury reaches the ocean from other sources such as atmospheric deposition rivers and diffusion from sediments
Current modelling indicates that methylmercury stays in the upper ocean for about 11 years Deshymethylation by photochemical reaction or by microbial activity is the major removal process for methylmercury in the ocean About 240 tonnes of methylmercury is removed by this process from the surface waters of the ocean per year
The other important pathway for methylmercury in seawater is uptake into marine food webs Although only about 40 tonnes per year is taken up in this way it is this fraction that poses risks to marine animals and human consumers of seafood Methylmercury is a problem for several reasons First it is taken up by plankton much more efficiently than is inorganic mercury resulting in concentrations in plankton that are as high as 10000 times the concentration in seawater Second methylmercury is absorbed through the intestine of animals much more easily than is inorganic mercury Third methylmercury biomagnifies as it moves up the food web Thus methylmercury becomes an increasingly greater proportion of the mercury in organisms higher in the food web This explains why some indigenous populations that consume top marine predators such as fish seals and whales have some of the worldrsquos highest concentrations of methylmercury giving rise to health concerns
27
UNEP Global Mercury Assessment 2013
Pathways and fate of mercury in freshwater Observations and modelling both show that there are in general many similarities between mercury chemistry pathways and fate in lakes and in the oceans but with obvious differences in scale and in the relative importance of different processes Modelling of mercury dynamics was done for four lakes with a history of direct mercury inputs from the largest freshwater lake in the world (Lake Superior) to small lakes in Ontario Canada Atmospheric deposition and river inflow were the main sources of inorganic mercury Much of the mercury input from lake and river catchments was associated with dissolved and particulate organic matter The dominant mercury removal mechanisms as in saltwater were burial in sediments and photochemical reduction of oxidized mercury to elemental mercury followed by re-emission to the air In Lake Superior and Lake Michigan there is evidence for methylation of mercury in the water column as is seen in the open ocean
Methylmercury levels in freshwater fish vary with the level of deposition of mercury from the air though other factors such as inputs from the watershed and the number of trophic levels within the lakersquos food web are also important Methylation predominantly occurred in lake sediments and wetlands and floodplain soils where sulphateshyreducing bacteria are believed to be primarily responsible Methylmercury is de-methylated in sediments and also taken away in the outlet river from each lake
Some 400-1400 tonnes of mercury are estimated globally to be trapped behind dams and other man-made impoundments each year This has in many cases led to significant increases in total mercury and methylmercury levels in water and of methylmercury in fish and other aquatic species When artificial lakes are created plant material is submerged leading to decay and anoxia In these conditions microbially driven methylation of inorganic mercury takes place In some cases the elevated mercury levels have also been observed downstream from the artificial lakes and reservoirs
Anthropogenic impacts on aquatic mercury levels Two studies have reported that the Atlantic and Pacific Oceans have shown opposing trends over recent decades While the influence of changing ocean currents and other oceanographic factors may be a factor the trends do make sense in light of patterns of anthropogenic emissions In the North Pacific Ocean mercury concentrations appear to have increased at depths between 200 and 1000 meters over the last few decades This increase coincides with the rapid industrialization of East Asia
In the North Atlantic however results from near Bermuda suggest a substantial decrease in mercury concentration and a change in the mercury profile through the water column The Mediterranean Sea too showed a decrease in mercury concentration between 1990 and 2004 These findings are consistent with atmospheric data from around the North Atlantic The conclusion is that mercury levels in seawater in the North Atlantic were elevated by human activity but may now be declining likely as a result of decreased emissions from North America and Europe
A complementary approach to measuring mercury in seawater is to measure mercury in aquatic animals which accumulate and integrate mercury over time Teeth hair feathers and eggshells are useful long-term archives of mercury concentrations and can provide data from the pre-industrial period (ie before 1800) as well as more recent periods
Among marine animals samples are available from several regions particularly from the Arctic where cold dry conditions help preserve animal tissues Mercury concentrations between the 13th and 16th
centuries were relatively stable From the mid- to late 19th century to the end of the 20th century mercury levels increased by an average of 12 times On average therefore about 92 of the mercury in Arctic marine wildlife today is likely to be of anthropogenic origin
Similar findings were found for a 700-year sequence of seabird eggshells from the South China Sea Mercury levels increased steadily between 1800 and 2000 with a particularly rapid increase after 1970 Concentrations since 2000 are about 10 times higher than pre-industrial levels with 91 of the mercury now likely to be of anthropogenic origin In the Antarctic studies of seal hairs show that pre-industrial mercury levels were only 60 of recent levels The relatively small difference
28
UNEP Global Mercury Assessment 2013
Historical Hg concentration as a proportion of present-day 100
80
60
40
20
0
Beluga teeth Human teeth
Gyrfalcon feathers Perigrine falcon feathers
Polar bear hair Ringed seal teeth
1200 1300 1400 1500 1600 1700 1800 1900 2000
between pre-industrial and modern mercury levels in Antarctic is consistent with lower mercury emissions and atmospheric concentrations in the Southern Hemisphere as compared with the Northern Hemisphere
The timing of long-term increases of mercury in aquatic animals can shed light on the likely sources of mercury emissions that were responsible The industrialization of Europe and North America appear responsible for the large increases in marine mercury levels that began in the 19th century as these increases occurred prior to recent Asian industrialization As with water concentrations in the Pacific Ocean recent rapid increases in mercury in seabird eggs in the South China Sea coincide with industrialization in Asia
The time lag in aquatic ecosystem response One important conclusion from air-ocean modeling is that the oceans have not yet reached equilibrium with current atmospheric levels of mercury This lag is due to several factors First mercury stays in the upper ocean above 200 meters depth for about 30 years and for centuries in intermediate and deep waters This is much longer than the one year residence time in the lower atmosphere Thus removal from the ocean takes much longer than does removal from the air and so concentrations will change more slowly
Second because of the long lifetime of mercury in deeper ocean waters a great deal of natural mercury is present in the ocean already about 100000 tonnes out of a total of 135000 tonnes in intermediate waters and 200000 out of 220000 tonnes in deep waters
Rune Dietz
Analysis of museum samples reflects the increase in mercury emissions and releases since the mid-19th century associated with anthropogenic activities
Third vertical transport of mercury from intermediate depths back to the surface returns a substantial amount of mercury to the biologically active zone each year As a result average mercury concentrations in seawater and marine animals are likely to increase slowly for decades if not centuries even if atmospheric levels stabilize at present levels In short the effects of historical anthropogenic emissions from Europe and North America are still being observed in the oceans at the same time that the effects of the recent rise in emissions from Asia are being seen
Regionally different trends can be expected depending on distance from sources and ocean circulation patterns In the North Atlantic north of 55deg N it will take 50-600 years to achieve equilibrium between atmospheric and seawater mercury levels In the North Pacific this process is estimated to take 500-700 years and in the Antarctic 700-1000 years The Arctic Ocean by contrast is smaller and will only take about 35 years to reflect changes in atmospheric mercury levels Surface waters of the Mediterranean Sea should show also changes within 10-50 years
Time lags in the responses of many freshwaters and their food-webs to changes in atmospheric mercury levels are also expected Although some immediate recovery following reductions in atmospheric mercury deposition rates is likely full recovery may take decades centuries or longer depending on the characteristics of the area Highly polluted freshwaters with catchments and sediments containing large amounts of anthropogenic mercury will recover most slowly as is already observed around point sources such as smelters that have closed down
29
UNEP Global Mercury Assessment 2013
Major gaps in knowledge 9 Large uncertainties remain in global estimates of mercury emissions to the air These stem from various sources including the availability of information on activity levels but mainly from the lack of information concerning the mercury content of some raw materials and the validity of assumptions regarding processes and technologies employed to reduce mercury emissions including their rates of application and effectiveness The accuracy and precision of measurement-based estimates can depend on the validity of extrapolating measurements made at infrequent intervals to longer periods or measurements made at one plant to other facilities with similar operations
Potentially important emissions sectors that are still not quantified in the emissions inventory include the use of mercury in vinyl-chloride monomer production secondary metals production oil and gas extraction transport and processing industrial and hazardous waste incineration and disposal sewage sludge incineration and dental fillings preparation and removal
Current measurements and their evaluation are inadequate for determining spatial and temporal trends Improved more extensive and better coordinated measurements are needed A permanent global integrated monitoring network for atmospheric mercury and mercury deposition is needed to achieve this goal The atmospheric network sites should be closely integrated with water soil and biological monitoring networks The results can be used for model testing and evaluation as well as for more accurately detailing the geographic impact of anthropogenic emissions Monitoring of mercury concentrations in the important marine food species is essential to understanding possible human health impacts and the effects of future emissions changes
Better data on mercury distribution in the troposphere is needed to improve understanding of long-range transport and source-receptor relationships Coordinated studies at high altitudes and by aircraft are needed This information will
also help validate regional and global scale models improving their prediction capabilities with regard to different policy scenarios
Key processes related to global transport and cycling of mercury remain inadequately understood The chemical form of gaseous oxidized mercury is unknown Reduction and oxidation rates for mercury in the presence of atmospheric oxidants need further study including determining which oxidants are important New measurements and modelling studies are needed to examine key chemical and physical processes that affect global transport and cycling
Few data are available for reporting mercury releases to aquatic systems Systematic and consistent monitoring of mercury releases to the air is required especially for contaminated systems Releases of mercury from soils into waters depend greatly on climate and topography and these parameters need to be better accounted for Consistent approaches for measuring and reporting releases from point sources are needed to ensure comparability of data from around the world In particular the actual role of artisanal and small-scale gold mining (ASGM) in emissions to air and releases to water needs to be more accurately estimated
The link between mercury deposition methylation and uptake by living organisms needs further study The parameters that determine the rates of exchange of mercury compounds between air and sea air and soil and air and vegetation are not fully understood Whole-ecosystem studies of mercury are needed to better understand biogeochemical cycling Methylationdemethylation rates and their spatial and temporal variations and relationship to climatic factors need to be determined in most of worldrsquos major ocean basins as well as in representative freshwaters
30
UNEP Global Mercury Assessment 2013
Key findings of the 2013 assessment 10 Atmosphere Total anthropogenic emissions of mercury to the atmosphere in 2010 are estimated at 1960 (1010shy4070) tonnes which is about 30 of the total mercury that was emitted and re-emitted from anthropogenic and natural sources in that year The largest anthropogenic sources are associated with artisanal and small-scale gold mining (ASGM) and coal burning which together account for about 62 of the annual total anthropogenic emissions to air Other major sectors include ferrous and non-ferrous metal production and cement production
East and Southeast Asia are responsible for about 40 of global anthropogenic emissions About 75 of the mercury from this region comes from China which is about one-third of the global total Increased estimates for emissions from ASGM largely a result of newly obtained data and improved information mean that South America and Sub-Saharan Africa are also responsible for a greater proportion of global emissions than was previously assumed
Anthropogenic emissions over time have increased mercury loads present in the environment This leads to higher rates of re-emission and also means that there will be a time lag of years or decades between emissions reductions and lower mercury levels in the food web including pathways of human exposure
Mercury emissions to the atmosphere likely peaked in the 1950s to 1970s and subsequently declined because of reductions in Europe Russia and North America Emission trends are unclear due to changes in methods employed to produce inventories and differences in the sectors that have been accounted at different times There are however some indications that emissions may be rising again with increases from East Asia offsetting continuing reductions in Europe and North America
Aquatic environments Natural processes in aquatic systems convert less toxic elemental and inorganic mercury into much more toxic methylmercury Methylmercury concentrates and accumulates in the food web leading to high concentrations in some species of seafood and fish that many people eat
Anthropogenic releases of mercury to aquatic environments contribute hundreds of tonnes to the amount of mercury cycling in the environment Diffuse releases and point sources appear equally important Atmospheric deposition however remains the most important input of mercury to land and oceans and has increased the amount of mercury in many environmental compartments by a factor of two or three since the start of the industrial age On land mercury that is deposited is largely retained in soils and vegetation increasing the available pool for re-mobilisation to adjacent aquatic systems Re-emission from soils however is a major addition to atmospheric mercury
Hydrology is the most important factor in the transport of mercury from catchments to downstream environments Relatively little of this mercury reaches the open ocean as most is captured in sediments behind dams in estuaries and near the coast Changes in land cover and land use can have a large effect on mercury mobilisation as exposed soils erode and mercury leaches into the water table
Concentrations of mercury in Arctic marine animals today are about 10-12 times higher than in preshyindustrial times (ie prior to about 1800) This means that on average about 92 of the mercury in marine predators such as seabirds seals and whales is anthropogenic in origin The timing of the increase suggest that 19th and early 20th century emissions from Europe North America and Russia were responsible Increases mercury concentrations in seabirds in the South China Sea appear to be more recent than the Arctic increases coinciding with increasing industrialisation in East and Southeast Asia
31
UNEP Global Mercury Assessment 2013
K+S Entsorgung Gm
bH
Recovered mercury is being stockpiled at long-term storage sites above- and as shown here below ground
The upper 100 meters of the oceans have twice the mercury that they did a century ago Intermediate and deeper waters have 10-25 more mercury on average reflecting the slow transport of mercury downwards in the oceans Seawater concentrations will thus be especially slow in responding to changes in mercury inputs from atmospheric deposition and river flow As a result mercury concentrations in marine biota are likely to increase slowly for decades to centuries even without an increase in atmospheric emissions
In freshwater ecosystems atmospheric deposition and re-mobilisation from soils slow the reduction of mercury levels even in regions where atmospheric concentrations have decreased due to emission controls
Further increases in atmospheric emissions will have long-term consequences for commercial fisheries and all consumers of marine and freshwater foods
It is likely to be years or decades before reductions in anthropogenic emissions and releases of mercury have a demonstrable effect on mercury levels throughout the environment and in the fish and marine mammals which are part of the human food-chain This only reinforces the need to act now to continue and strengthen international efforts to reduce current mercury emissions and releases Delays in action now will inevitably lead to slower recovery of the worldrsquos ecosystems in future from mercury contamination leaving an even greater legacy of pollution for future generations
32
Division of Technology Industry and Economics (DTIE) Chemicals Branch Geneva Switzerland January 2013
Job number DTI1636GE
UNEP Global Mercury Assessment 2013
Anthropogenic sources of mercury emissions and releases Anthropogenic sources of mercury emissions account for about 30 of the total amount of mercury entering the atmosphere each year
As found in previous global mercury assessments the main industrial sources of atmospheric mercury are coal burning mining industrial activities that process ores to produce various metals or process other raw materials to produce cement In these activities mercury is emitted because it is present as an impurity in fuels and raw materials In these cases mercury emissions and releases are sometimes referred to as lsquoby-productrsquo or lsquounintentionalrsquo emissions or releases A second category of sources includes sectors where mercury is used intentionally Artisanal and small-scale gold mining (ASGM) is the largest of these in which mercury emissions and releases result from the intentional use of mercury to extract gold from rocks soils and sediments Other intentional-use release sectors include waste from consumer products (including metal recycling) the chlor-alkali industry and the production of vinyl-chloride monomer
Coal burning and to a lesser extent the use of other fossil fuels is one of the most significant anthropogenic source of mercury emissions to the atmosphere Coal does not contain high concentrations of mercury but the combination of the large volume of coal burned and the fact that a significant portion of the mercury present in coal is emitted to the atmosphere yield large overall emissions from this sector The mercury content of coal varies widely introducing a high degree of uncertainty in estimating mercury emissions from coal burning Data on mercury content is now available from many countries including major emitters of mercury
Mining smelting and production of iron and non-ferrous metals are also a large source of global mercury emissions to air and also a very important sector with regard to releases to water In the mining and processing of metals most of the mercury is captured and either stockpiled or sold for use in various products creating anthropogenic sources associated with intentional use discussed below Nonetheless the volume of ores and metals involved result in large total emissions and releases The relatively small volume of primary mercury production makes mercury mining a far smaller source today than it has been in the past
Cement production which typically involves the burning of fossil fuels to heat the materials required to make cement is another major anthropogenic source of mercury emissions Both the raw materials and the fuel may contain mercury and lead to emissions The amount of mercury involved varies greatly with the mercury content of these fuels and especially with the raw materials In some countries cement kilns are burning increasing amounts of alternative fuels including wastes that may contain mercury This may add to the emissions from cement kilns
Oil refining emits and releases mercury as oil deposits are known to contain mercury generally at low concentrations Mercury is removed from most petroleum products and natural gas prior to combustion and therefore combustion-related emissions are low Most of the mercury in crude oil is associated with solid waste that is disposed of in landfills However emissions and releases during refining of crude oil do occur and these have been quantified for the first time in the 2010 inventory The inventory does not quantify other emissions and releases during oil and gas extraction and transport or from flaring
Unintentional mercury emissions from these sectors can be reduced by the application of pollution control measures at power plants and industrial plants Some of the mercury captured is refined and enters the commercial supply chain however large amounts of mercury captured in materials such as fly ash and oil refinery waste need to be disposed of Some of the resulting wastes are themselves used as raw materials for example in construction materials but large amounts are disposed of in landfills which can thus become a potential source of mercury emissions and releases
Among intentional-use sectors Artisanal and small-scale gold mining is a major source for emissions and releases of mercury worldwide In ASGM miners use mercury to create an amalgam separating gold from other materials They then have to separate the mercury from the gold Calculating emissions from this sector presents a particular challenge because it is typically widely dispersed and often unregulated and may be illegal Uncertainties regarding release estimates from the ASGM sector are therefore high Furthermore the miners are typically poor and perhaps have little awareness of the hazards of mercury and pollution control devices may be hard to obtain
Wastes from consumer products containing mercury can end up in landfills or incinerators
6
UNEP Global Mercury Assessment 2013
Mercury is still used in a wide range of products including batteries paints switches electrical and electronic devices thermometers blood-pressure gauges fluorescent and energy-saving lamps pesticides fungicides medicines and cosmetics Once used many of the products and the mercury they contain enter waste streams While mercury in landfills may slowly become re-mobilized to the environment waste that is incinerated can be a major source of atmospheric mercury especially from uncontrolled incineration Incinerators with state-of-the-art controls have low emissions
Another use of mercury is in dental amalgam for filling teeth When bodies are cremated mercury in fillings can be emitted Mercury can also be emitted and released during production and preparation of fillings and from the disposal or removed fillings In addition mercury from removed fillings can be recycled or go into solid waste and wastewater
The amount of mercury released in the recycling of scrap metals for example in secondary steel and nonshyferrous metal production is generally assumed to be much lower than that released during primary metal production which is why the present global inventory only addresses primary metal production However lower emissions from recycling may not be the case in all countries Much of the scrap steel in some countries comes from automobiles that may still have devices that contain mercury and which may not be removed prior to recycling of the steel These devices are largely being phased out so mercury emissions from scrap steel may be expected to decrease However large differences exist between countries in the way they treat their mercury-containing wastes including scrap metals that are recycled in secondary metal production
Mercury is also used in a number of industrial processes A major industrial use is in the chlor-alkali industry where mercury-cell technology may be used in the production of chlorine and caustic soda
Mercury is also used as a catalyst in the production of vinyl chloride monomer (VCM) from acetylene mainly in China
Mercury releases to aquatic systems as a result of current human activities arise from many of the same uses or the presence of mercury in various products and processes that emit mercury to the air As with emissions to the atmosphere aquatic releases come from two main sources First mercury is released with water effluent from the sites where mercury is used Second mercury can leach into water from disposal sites that have mercury in the waste
zhu difeng Shutterstockcom
Tomas Pavelka Shutterstockcom
bikeriderlondon Shutterstockcom
Anthropogenic sources of mercury from industry and intentional use
Gunnar Futsaelig
ter
7
UNEP Global Mercury Assessment 2013
Arnold John Labrentz Shutterstockcom
Re-emission and re-mobilization of mercury Re-emissions constitute the third category of sources presently comprising about 60 of mercury emissions to air Mercury previously deposited from air onto soils surface waters and vegetation from past emissions can be emitted back to the air Re-emission is a result of natural processes that convert inorganic and organic forms of mercury to elemental mercury which is volatile and therefore readily returns to the air Mercury deposited to plant surfaces can be re-emitted during forest fires or biomass burning Mercury may be deposited and re-emitted many times as it cycles through the environment
It is important that re-emitted mercury should not be considered a natural source It may originally have come from natural or anthropogenic sources but by the time it is re-emitted it is difficult or impossible to identify its specific origin Nonetheless human activity has increased the environmental burden of mercury resulting in higher levels of re-emission This is compounded by changes in land use practices as well as increasing temperatures due to climate change
In the aquatic environment re-mobilization of mercury occurs when mercury deposited on and accumulated in soils or sediments is re-mobilized by for example rain or floods that cause the mercury to enter or re-enter the aquatic system Resuspension
of aquatic sediments due to wave action or storm events is an additional way for mercury to re-enter the aquatic ecosystems
Estimating re-emission and re-mobilization rates is difficult It is often done using modelling approaches These models are based on data on atmospheric levels and other observations as well as current understanding of chemical transformations and other processes that determine how mercury moves between air land and water The models aim to balance the amount of mercury in circulation at any given time while remaining consistent with observational data Temperature is a key factor With lower temperatures re-emission rates are generally lower
Re-emission is also a major factor in determining the length of time needed for anthropogenic emission reductions to be reflected in decreasing environmental levels of mercury Mercury emitted in one year may be deposited to and retained in soils and waters for some time before being re-emitted or re-mobilized in subsequent years This cycle can be repeated keeping levels in air and water elevated even after anthropogenic sources have been lowered Conversely continuing to add to the global pool will leave an ever-longer legacy of anthropogenic mercury contamination worldwide It is thus imperative that international efforts to reduce mercury emissions continue and are strengthened as soon as possible
Forest fires re-emit mercury deposited to vegetation
8
UNEP Global Mercury Assessment 2013
Anthropogenic emissions to the atmosphere 3 Global emissions inventory The global emissions inventory for 2010 estimates that 1960 tonnes of mercury was emitted to the atmosphere as a direct result of human activity The leading sectors remain the same as those identified in the 2005 inventory Improved data however have changed the relative contributions of some of these sectors as have some actual changes in emissions All coal burning emissions taken together for example represent a lower percentage of the total emissions than in the 2005 inventory This is due in part to the increased estimates from artisanal and small-scale gold mining (ASGM) and in part to much lower estimates for domestic use of coal When the actual amount of mercury emitted from coal combustions in power generation and industrial uses is considered and the estimates are based on the same 2010 methodology the emissions in 2010 are the same and perhaps slightly higher than in 2005 Even though new coal-fired power plants are being built combustion efficiency and emissions controls are also improving in most parts of the world
Results by selected sector The updated inventory of emissions to air confirms coal burning as a continuing major source of emissions responsible for some 475 tonnes of mercury emissions to air annually compared with around 10 tonnes from combustion of other fossil fuels According to the new inventory more than 85 of these emissions are from coal burning in power generation and industrial uses In the previous assessment emissions from domestic and residential coal burning were highlighted as a possible larger contribution Better information on coal consumption for domestic and residential uses indicates that these activities are a smaller contribution to total emissions from coal burning than previously thought
Emissions from the cement production industry are largely dependent on the raw materials and the fuels used The new inventory avoids double
Emissions from various sectors in tonnes per year with the range of the estimate and as a percentage of total anthropogenic emissions Note These numbers cannot be compared directly with those presented in the 2008 assessment (see Chapter 4 Trends in mercury emissions to the atmosphere)
Sector Emission (range) tonnes
By-product or unintentional emissions
Fossil fuel burning
Coal burning (all uses) 474 (304 - 678) 24
Oil and natural gas burning 99 (45 ndash 163) 1
Mining smelting amp production of metals
Primary production of 455 (205 ndash 241) 2 ferrous metals
Primary production of nonshy 193 (82 ndash 660) 10 ferrous metals (Al Cu Pb Zn)
Large-scale gold production 973 (07 ndash 247) 5
Mine production of mercury 117 (69 ndash 178) lt1
Cement production 173 (655 - 646) 9
Oil refining 16 (73 - 264) 1
Contaminated sites 825 (70 - 95) 4
Intentional uses
Artisanal and small-scale 727 (410 ndash 1040) 37 gold mining
Chlor-alkali industry 284 (102 ndash 547) 1
Consumer product waste 956 (237 ndash 330) 5
Cremation (dental amalgam) 36 (09 - 119) lt1
Grand Total 1960 (1010 ndash 4070) 100
Values rounded to 3 significant figures To nearest percent
Sectors for which emissions are not currently quantified
biofuel production and combustion
vinyl-chloride monomer production emissions during
secondary metals production and ferro-alloys
oil and gas extraction transport and processing other than refinery emissions
industrial some hazardous waste incineration and disposal
sewage sludge incineration
preparation of dental amalgam fillings and disposal of removed fillings containing mercury
9
UNEP Global Mercury Assessment 2013
Disposal of waste from
Mercury-cell chlor-alkali
industry
Relative contributions to estimated emissions to air from anthropogenic sources in 2010
Oil refining
Coal combustion
Oil and natural gas combustion
Primary ferrous metal production
Primary non-ferrous metal (Al Cu Pb Zn)
Large-scale gold production
Hg production Cement production
mercury-containing products
Contaminated sites
Cremation
Artisanal and small-scale gold production
counting of emissions from conventional fuels (such as coal and oil) that are included under the industrial fossil fuel burning emissions However it does attempt to account for emissions from other fuels including alternative fuels (such as old tyres and other wastes) and from raw materials Increasing amounts of waste are being co-incinerated in the cement industry both as fuel but also in some plants as a means of disposing of hazardous wastes some of which may contain mercury In some regions additional measures are being introduced to make sure that mercury emissions associated with waste co-incineration do not increase overall emissions from cement plants
Increased application of air pollution control devices including some mercury-specific technologies together with more stringent regulations in several countries have the effect of reducing mercury emissions from coal burning sectors and thus offset some part of the emissions arising from increased activity
Artisanal and small-scale gold mining emissions are in the 2010 inventory the major source of emissions to air at 727 tonnes per year The reasons for the large increase in the estimate compared to 2005 are discussed below (see page 16) The global estimate for emissions from ASGM includes a significant contribution from China although
recent information on this sector in China is lacking China prohibited ASGM in 1996 and therefore records no emissions from this sector
Mercury-cell technology is becoming less common in the chlor-alkali industry as other more cost-effective processes are adopted No new plants are being constructed though many older plants remain to be converted Old chlor-alkali plants and other decommissioned industrial sites may constitute contaminated sites that continue to release mercury to the environment for many years and emissions from contaminated sites are now part of the inventory
Global emissions from use of mercury in dental amalgam resulting from cremation of human remains are estimated at 36 (09 ndash 119) tonnes in 2010 Some 340 tonnes of mercury is used per year in dentistry of which about 70-100 tonnes (ie 20shy30) likely enters the solid waste stream
In the production of vinyl chloride monomer information is still lacking on the lifecycle and eventual fate of the mercury catalyst Most of this production occurs in China and about 800 tonnes of mercury is thought to have been used by this industry in China in 2012 Used mercury catalyst is recycled and reused by enterprises that hold permits for hazardous waste management The amounts that may be emitted or released are unknown
Ronald de Hom
mel
Artisanal and small-scale gold mining Unlike most small-scale gold miners the green gold miners of Oro Verde shown here employ an environmental way of mining gold that does not use mercury or other chemicals
10
UNEP Global Mercury Assessment 2013
Results by region The greatest proportion of anthropogenic mercury emissions to the atmosphere comes from Asia which contributes about 50 of the global total The majority of Asian emissions come from East and Southeast Asia China accounts for three-quarters of East and Southeast Asian emissions or about one third of the global total
New data on emissions from ASGM have increased the proportion of global emissions attributed to South America and Sub-Saharan Africa largely due to increased estimates associated with improved information about ASGM activities in these areas
Emissions to air from other major source sectors are higher in Europe North America and Oceania
Mercury emission 2010 gkm2
0 2 5 10 100 1000
Global distribution of anthropogenic mercury emissions to air in 2010
Emissions from various regions in tonnes per year with the range of the estimate and as a percentage of total global anthropogenic emissions Note These numbers cannot be compared directly with those presented in the 2008 assessment (see Chapter 4 Trends in mercury emissions to the atmosphere)
See figure on the following Region Emission (range) tonnes page for map with
Australia New Zealand amp Oceania 223 (54 - 527) 11 specification of regions Values rounded to 3 Central America and the Caribbean 472 (197 - 974) 24
significant figures CIS amp other European countries 115 (426 - 289) 59
East and Southeast Asia 777 (395 - 1690) 397
European Union (EU27) 875 (445 - 226) 45
Middle Eastern States 370 (161 - 106) 19
North Africa 136 (48 - 412) 07
North America 607 (343 - 139) 31
South America 245 (128 - 465) 125
South Asia 154 (782 - 358) 79
Sub-Saharan Africa 316 (168 - 514) 161
Undefined (global total for emissions from 825 (700 - 950) 42 contaminated sites)
Grand Total 1960 (1010 ndash 4070) 100
11
UNEP Global Mercury Assessment 2013
North America
Central America and the Caribbean
South America
Unintentional emissions
Stationary combustion (coal)
Stationary combustion (oil and gas) Oil refining
Pig iron and steel
Intentional uses
Artisanal and small-scale gold mining Chlor-alkali
EU27
North Africa
Sub-Saharan Africa
Non-ferrous metals (Cu Pb Zn Al) Mercury
Large-scale gold
Cement
Product waste
Cremation
CIS amp other European countries
500
100
Middle Eastern States East and Southeast Asia
50
10 tonnes
South Asia Australia New Zealand amp Oceania
South America
North America
Central America and the Caribbean
Sub-Saharan Africa
South Asia North Africa
Middle Eastern States
EU
East and Southeast Asia
CIS amp other European countries
Australia New Zealand amp Oceania
Estimates of 2010 anthropogenic mercury emissions to air from different main sectors in different regions ASGM is shown separately to highlight its geographic distribution and better allow regional comparisons to be made for other sectors
12
UNEP Global Mercury Assessment 2013
Compiling the 2010 inventory of anthropogenic mercury emissions to air The inventories used in successive Global Mercury Assessments continue to improve as better data become available The 2013 update presents an inventory of emissions for 2010 that has a number of improvements over the 2008 assessment and its inventory for 2005
bull A more detailed analysis of emissions from some major source sectors For example fossil fuel consumption is now broken down into categories for combustion in power plants industry and other uses The type of coal or oil used is also considered providing a more accurate estimate of mercury emissions
bull A more detailed consideration of the mercury content of fuels and raw materials used in different countries and regions bull New and updated information on ASGM bull The use of different pollution control technologies
in different countries and regions have been factored into the emissions estimate bull Emission estimates for sectors not previously
included such as aluminium production oil refining and contaminated sites bull More and better information on location of major
point sources such as individual power plants smelters and cement kilns bull Better documentation and greater transparency
with respect to the data and information behind the estimates
The methods for estimating emissions from industrial sectors is complemented by other methods used for more dispersed emissions sources For example estimating emissions from some intentional-use sectors requires intensive work with those sectors Relevant and accurate information about ASGM is generally not available through official channels Estimating mercury emissions from its intentional use in lighting batteries and other products requires analysing the entire production use and waste stream to determine where mercury is likely to be released and in what quantities The approach used in the 2013 assessment addresses the emissions from breakages and wastes resulting from use of these mercury-containing products in society the majority of
which are incinerated or end up in landfills It does not however address industrial wastes or sewage sludge incineration
Uncertainties in emission estimates Estimates of mercury emissions are just that estimates To compile a global assessment requires making a number of assumptions and generalizations Uncertainty associated with the 2010 inventory arises from each of the factors used to estimate the emissions the correctness of the activity data the validity of the emission factors applied and the validity of assumptions regarding the effectiveness and use of emission-control technologies
Based on an evaluation of these sources of uncertainty and the relative contributions of sectors with reliable information and those with less reliable data uncertainty in the 2010 inventory assessment of total anthropogenic mercury emissions to air gives a range of emissions from 1010-4070 tonnes This range is greater than that reported in some previous assessments reflecting a greater appreciation of the sources of uncertainty due to the improved estimation methods and perhaps a more realistic appraisal of the state of knowledge concerning some aspects of emissions
The best estimate taking a conservative approach is 1960 tonnes If nationally produced estimates for 2010 available from some countries (Canada Japan Korea Mexico the United States and European countries reporting to LRTAP) are introduced into the global inventory in place of the inventory estimates the corresponding estimated total global anthropogenic emission to air is 1940 tonnes As most national inventories do not include uncertainty ranges it is not possible to assign a range to this number The recognition of uncertainties is an important consideration and presenting single national estimates can convey a misleading picture of what is known and more importantly not known about emissions
The numbers derived using the methods employed to produce the global inventory for 2010 were compared with a number of national inventories and emissions reported under other systems covering the same period In general the level of agreement was good in particular when the significant uncertainties
13
UNEP Global Mercury Assessment 2013
Methods for estimating emissions All global mercury emissions inventories to date have used the same basic approach for the major sectors emitting mercury to the atmosphere For specific emission sectors national emissions estimates are calculated by multiplying the amount of activity (ie amounts of fuels burned raw materials consumed or materials produced) by an emission factor that is an estimate of the mercury emitted per unit of activity For example emissions from coal-fired power generation are estimated by multiplying the tonnes of coal used by the amount of mercury estimated to be released per tonne of coal In most such inventories ldquoabatedrdquo emission factors have been employed to quantify both the emissions of mercury that occur during the processes and the effects of mercury emission controls In the new methodology used to develop the 2013 report these components are split ldquoUnabatedrdquo emission factors are employed to quantify the emissions and ldquotechnology profilesrdquo have been developed to represent the effects of mercury emission controls
Various methods are employed to estimate emissions of mercury at individual sources and at national regional and global levels In general the methods fall under one of two main categories
bull Mass-balancesubstance-flow based estimates which are based on the principle that what goes in must come out Amounts of mercury in fuels and raw materials constitute the inputs and the outputs are the amounts of mercury emitted to air released to water or land retained in products or in wastes or otherwise recovered and stored or disposed of
involved in both global and national estimates are taken into account It is important to note that there are good reasons why estimates of mercury emissions produced in the 2010 inventory may not fully agree with national inventories made by countries using other methodologies These reasons include
bull Reporting schemes may define and distinguish emissions source sectors in very different ways and aligning these sectors may not be possible
bull Industry reporting to national government may be limited to sources with emissions above a certain threshold level so that emissions from smaller sources below the threshold are not reported Where smaller sources make up a significant part of the source category reported inventories
bull Measurement-based estimates which rely on measurements made at appropriate points in the industrial process or in the productwaste output streams These measurements are used to estimate where the mercury goes as in the method above
In principle the two approaches should produce the same results In practice mass-balance based approaches tend to result in higher emission estimates than most measurement-based estimates Since future emissions reporting is likely to involve a combination of these two approaches further work is required to understand why results may differ and to reconcile the two approaches
Since the 2008 UNEP assessment was produced the number of direct measurements of emissions from certain point sources (in particular power plants and some metal and cement production plants and waste incineration facilities) has increased considerably resulting in a much improved knowledge base
A number of countries require regular reporting of emissions Increasing use is being made in these reporting systems of measurement-based estimates and facility-level reporting in particular for major point sources In other countries national mercury emissions are only being quantified for the first time Since 2005 and the start of the UNEP negotiating process in 2010 many countries have initiated work on national emission inventories which in several cases have yielded much improved information on activity data sector characteristics and mercury emissions Such inventories often make use of the UNEP Toolkit for identification and quantification of mercury emissions
may therefore significantly underestimate total mercury emissions bull National inventories in some countries are making
increasing use of actual measurements of mercury emissions at individual facilities At the global scale it is not yet feasible to base an inventory on individual site emissions Furthermore actual measurements of mercury emissions at a source may be taken only a few times during a year and may not be fully representative of normal operations In the 2013 assessment a mass-balance based approach was employed to be consistent transparent and replicable bull National reporting and monitoring schemes
may provide information that is not available to externally produced inventories
14
UNEP Global Mercury Assessment 2013
Despite these considerations most of the discrepancies noted between the 2010 inventory mass-balance-based estimates and national estimates based on measurement- approaches are modest and within the margins of error associated with the different approaches In cases where the differences are larger it is important to recognize that there are sources of error in all methods for estimating mercury emissions
Gunnar Futsaelig
ter
Sampling of mercury emissions at the Kendal coal-fired power plant in South Africa conducted under a UNEP project A probe with mercury traps is inserted into a sampling port in the stack to collect mercury present in the flue gas The mercury traps are subsequently analysed according to the US EPA Mercury Monitoring Toolkit sampling protocol
15
UNEP Global Mercury Assessment 2013
Trends in mercury emissions to the atmosphere 4 Assessing global and sectoral trends A key question in assessing anthropogenic mercury emissions worldwide is whether they are increasing or decreasing While it is tempting simply to compare the 2010 inventory with its 2005 counterpart the results would mean little As inventory methods develop and as additional sources are considered the estimate of total anthropogenic mercury emissions worldwide also changes While some changes reflect real trends others reflect changes in methods or scope Thus comparing the results of previous assessments with the present update requires considerable care and involves an understanding of the way in which these inventories have been produced and the uncertainties associated with them
It is possible however to compare certain sectors over time by attempting to compensate for any methodological changes between the various inventories since 1990
Emissions to air are thought to have peaked in the 1970s From 1990 to 2005 total anthropogenic emissions of mercury to the atmosphere appear to
Emissions to air t
1400
1200
1000
800
600
400
200
0
1990
1995
2000
2005
Africa Asia Europe Russia North Oceania South America America
Estimates of annual anthropogenic mercury emissions from different continentsregions 1990-2005
have been relatively stable with decreases in Europe and North America being offset by increases in Asia A reanalysis of the available inventories since 1990 however indicates that emissions from industrial sectors at least may be starting to increase again
The changes introduced in the 2010 inventory methodology prevent a straight-forward continuation of this analysis However an evaluation of trends for some sectors between 2005 and 2010 has been made by applying the new methodology to activity data for 2005 This comparison suggests a further slight increase in the combined amount of mercury emitted by industrial sectors (coal combustion production of cement pig iron and steel and non-ferrous metals) The following paragraphs describe the trend results for three sectors to illustrate some of the developments between 2005 and 2010 and some of the the difficulties in comparing emissions estimates between different years made with different methods
Coal burning for power generation and for industrial purposes continues to increase especially in Asia However increases in the application of air pollution controls including some mercury specific technologies together with more stringent regulations in a number of countries have reduced mercury emissions from coal burning in power plants in particular and thus offset some part of the emissions arising from increased coal consumption
In the United States for example emissions from coal burning at power plants have reportedly decreased from about 53 tonnes in 2005 to 27 tonnes in 2010 This decrease is largely due to new regulations that have resulted in changes in the sources of the coal that is burned in large power plants and the installation of mercury controls as well as controls on sulphur dioxide and particulates that have the co-benefit of further reducing mercury emissions
In China many of the new coal-fired power plants have state-of-the-art pollution controls installed
Emissions of mercury from artisanal and small-scale gold mining (ASGM) reported for 2010 are more than twice those reported for 2005 While the
16
UNEP Global Mercury Assessment 2013
Unintentional emission sectors Coal burning ferrous- and non-ferrous (Au Cu Hg Pb Zn) metal production cement production Intentional-use sectors Disposal and incineration of product waste cremation emissions chlor-alkali industry
Comparison of emissions in 2005 and 2010 by selected sector and region
Unintentional emission sectors
Emission t
1000
800
600
400
200
0 2005 2010
Australia New Zealand amp Oceania
Central America and the Caribbean
CIS amp other European countries
East and Southeast Asia
rise in the price of gold (from USD 400 per ounce in 2005 to USD 1100 per ounce in 2010) along with increased rural poverty may indeed have caused more activity in this sector the increased estimate for mercury emissions is considered to be due primarily to some more and better data from many countries and regions West Africa for example was regarded as having minimal ASGM in 2005 but is now recognized as a region with considerable activity Thus the baseline has improved without necessarily any change in actual activity or emission levels
Waste from consumer products is affected by the amount of mercury used For most products in which mercury is used mercury-free alternatives exist Consequently many of these uses of mercury are declining at least in some regions as alternative products or processes are adopted Compact fluorescent light bulbs are an exception Even though the mercury content of individual light bulbs has decreased use of this type of light bulb is increasing rapidly
Artisanal and small-scale gold mining Intentional-use sectors
1000 1000
Step change from 2005 to 2010 due to new information 800 800 (under-estimation in 2005)
600 600
400 400
200 200
0 0 2005 2010 2005 2010
European Union (EU27) South America
Middle Eastern States South Asia
North Africa Sub-Saharan Africa
North America
In order to make valid assessments of trends in emissions from global inventories comparable data on activity levels are required together with information on changes in fuel and raw material characteristics and applied air pollution control technology One aim of the 2010 inventory methods is to create a firmer foundation for such future trend analysis
Ralf Siemieniec Shutterstockcom
Use of mercury-containing energy-saving lamps is increasing
17
UNEP Global Mercury Assessment 2013
Emission scenarios and future trends The 2008 Global Atmospheric Mercury Assessment included a first attempt at projecting future emissions inventories These were based on three scenarios continuing with the status quo applying current emissions controls worldwide and achieving maximum feasible technological reductions At the time this effort was regarded as highly provisional Since then additional studies have extended and improved this work but the results are not markedly different from earlier projections of future mercury emissions
Global mercury models have been used to evaluate future scenarios Four global and hemispheric models projected mercury levels around the world in 2020 based on the three emission scenarios described earlier In industrial regions the status quo will cause an increase in mercury levels of 2-25 and in remote areas of 15-5 The two emission control scenarios on the other hand yield a decrease in mercury in industrial areas of 25-35 and in remote areas of 15-20
Another global model was coupled with estimates of surface reservoirs of mercury in order to quantify source-receptor relationships for the present and for 2050 Under the best-case scenario of maximum feasible reductions projected estimates for deposition in 2050 is similar to estimates for today In the other scenarios increasing emissions lead to increasing deposition A greater proportion of mercury emissions is expected to be in the oxidized form so that a greater proportion will be deposited near the source instead of being transported far away
The model results support the conclusion that reducing anthropogenic emissions will slowly reduce the amount of mercury in biologically available reservoirs Over time mercury in the environment will be taken out of circulation by natural processes for example from ocean waters down into sediments and biologically available mercury will decrease Increased emissions on the other hand will continue to build up the amount of mercury in circulation
With new databases and methods it may soon be possible to create scenarios that incorporate activity levels as well as technology use for each country If this were done it would allow countries to assess the effects of different mercury reduction strategies on their national emissions For example a country could determine the relative contributions of emission reduction technology as opposed to for example changes in raw materials
18
UNEP Global Mercury Assessment 2013
Atmospheric chemistry monitoring and trends 5 Forms of mercury in air Mercury in the atmosphere is in three primary forms Gaseous elemental mercury is the most common in anthropogenic and natural emissions to the atmosphere Gaseous oxidized mercury and mercury bound to particulates are less common The transport and deposition of atmospheric mercury depend greatly on whether the mercury is elemental or oxidized Elemental mercury stays in the atmosphere long enough for it to be transported around the world whereas oxidized and particulate mercury are more readily captured in existing pollution control systems or deposited relatively rapidly after their formation As a result most mercury in the air is in the gaseous elemental phase Relatively little elemental mercury is deposited directly but instead must fi rst be oxidized
Although gaseous oxidized mercury is very important in mercury cycling between air and other environmental compartments the process of oxidation in the air is poorly understood with reactions and resulting compounds yet to be verified in observations
When mercury moves from air to water and land it is generally in an oxidized gaseous or particulate form whereas when it is re-emitted to air it has been converted back to gaseous elemental
Particulate associated mercury
Pole
Equator
Gaseous elemental mercury
Global transport
Gaseous elemental mercury can be transported globally Mercury emitted in particulate form tends to deposit closer to sources
mercury Sunlight appears to play a large role in both oxidation and reduction of mercury but temperature and biological interactions are also likely to be involved to some degree Here too much uncertainty remains Nonetheless the reactions are important in determining net deposition and fate of mercury
Monitoring of mercury in air Monitoring of mercury in air focuses on the three primary forms of mercury The measurement of gaseous elemental mercury is routine and robust Measuring gaseous oxidized mercury and particulate-bound mercury however is challenging Concentrations are typically very low and these forms are chemically unstable leading to high uncertainty in the measurements Nonetheless these forms are critical for defining and modelling the fate and transport of airborne mercury
In the past two decades coordinated mercury monitoring networks and long-term monitoring sites have been established in a number of regions measuring mercury concentrations in the air as well as deposition of mercury in precipitation In Europe and North America high-quality continuous monitoring has been going on for more than 15 years especially in the Arctic High-quality monitoring has started more recently in East Asia and South Africa as part of a global effort to expand the coverage provided by long-term monitoring sites
Measurements and trends in atmospheric mercury Monitoring stations around the world have provided information about trends in atmospheric mercury though the time periods vary depending on how long the site has been active Overall a declining trend in background mercury levels over the past decade has been recorded from monitoring stations
19
UNEP Global Mercury Assessment 2013
in many regions Other regions however show an increase in mercury levels
The sites also provide information about geographical patterns reflecting both background levels of
Trends in atmospheric measurements of mercury
Site(s) Period
Mace Head Ireland 1996-2011
North America rural sites 1995-2005
High Arctic sub-Arctic Up to 20 years of records mid-latitudes
Monitoring networks Mercury monitoring in Europe is carried out under the European Monitoring and Evaluation Programme (EMEP) one of the first international environmental measurement networks Heavy metals such as mercury have been included in the EMEP program since 1999 Mercury measurements are available only from northern and northwestern Europe
Three monitoring networks currently operate in North America providing good coverage of Canada and the United States the Mercury Deposition Network the Canadian Air and Precipitation Monitoring Network and the Atmospheric Mercury Network More recently new sites have been established in Mexico extending coverage on the continent The stations monitor atmospheric mercury and mercury in precipitation which has measured since the mid-1990s Monitoring of mercury in the air and in precipitation has been underway in Asia for nearly a decade
Alert Nord
Point Barrow
Nuuk Stoacuterhoumlfethi
Mace Head
mercury and local and regional influences Mercury concentrations at remote sites in Asia are higher than in other regions of the Northern Hemisphere Coastal cities in China have lower levels than inland sites likely due to the influence of relatively clean
Measurement Trend
Gaseous elemental mercury Decrease of 14-18 per year
Total gaseous mercury Decrease of 22 to 174 in total
Total gaseous mercury Decreasing trend at some stations increasing at others
The monitoring network of the Arctic Monitoring and Assessment Programme (AMAP) includes air and deposition monitoring sites located in Arctic regions of Canada Greenland Iceland Norway Russia and Sweden
Building on existing national and regional monitoring networks the European Union-financed project
ldquoGlobal Mercury Observation Systemrdquo (GMOS) started in November 2010 Its goal is to develop a coordinated global system for monitoring mercury including a large network of ground-based monitoring stations New sites are being installed in regions where few monitoring stations exist especially in the Southern Hemisphere Two sites have been established in Antarctica one on the Antarctic Plateau and one on the coast
Ny-Aringlesund
Amderma Pallas
Raringouml Bredkaumllen
Listvyanka Diabla Gora
Mauna Loa
Mt Bachelor
Celestuacuten Calhau
Longobucco
Iskrba Niembro Monte Cimone Cap
Ferrat Mt Waliguan Ganghwa Island
Lulin
Cape Hedo Ev-K2
Mt Changbai
Minamata Mt Ailao
Nieuw Nickerie
Kodiakanal
Maheacute Island Manaus
Bariloche Cape Point
Amsterdam Island Cape Grim
Dumont drsquoUrville
AMAP CAMnet EMEP GMOS GMOS associated NADPAIRMoN NADPMDN
Air + precipitation Air Precipitation
20
UNEP Global Mercury Assessment 2013
John Munthe
The mercury background air monitoring station at Zeppelin mountain Svalbard
air from over the ocean Sites off the Asian coast however show higher levels of gaseous elemental mercury than the Northern Hemisphere background suggesting an outflow from the Asian mainland
Weather patterns have also been found to have a strong influence on seasonal patterns in mercury levels in the air at monitoring sites At the Mount Waliguan Observatory on the Tibetan Plateau for example northeasterly and easterly winds produced the highest levels of mercury
Measurements at high altitudes Measurements from ground-based stations above 2700 meters suggest that there is an inverse relationship between gaseous elemental mercury and gaseous oxidized mercury at these elevations In other words when there is more elemental mercury there is less oxidized mercury and vice versa These measurements are in good agreement with modelling results which gives additional confidence in current understanding of the behaviour of mercury at high altitude
An inverse relationship between total gaseous mercury and particulate concentration has also been observed in the high stratosphere From the transformation rate of total gaseous mercury to particulate-bound mercury it appears that gaseous mercury lasts about two years in the stratosphere
21
UNEP Global Mercury Assessment 2013
Atmospheric concentrations and deposition 6 Measurements and trends of mercury in precipitation Mercury deposited by precipitation decreased from the 1990s into the 2000s at many but not all sites in North America and Western Europe where such measurements were taken
Regional patterns are also evident including slightly higher levels in southern Europe than northern Europe and higher levels in Asia than in North America Total mercury concentrations in precipitation in China were much higher than those in Japan and South Korea Th is was mostly attributed to higher levels of gaseous oxidized mercury and particulate-bound mercury which are readily deposited by precipitation and thus not transported far
A comparison of data from Canadian and American monitoring sites found that deposition of mercury in precipitation was highest in summer
Dry deposition of mercury which is deposition not associated with precipitation is diffi cult to measure and consequently there is little information on trends in mercury dry deposition Th is lack of information means that it is also diffi cult to validate model results for dry deposition
106 44
474 72 91
5 7 71
05 1 5 10 100 500 1000
Total mercury emission (2005) kgcell
Modelled mercury air concentrations and deposition patterns Atmospheric mercury concentrations are highest in major industrial regions Models examining global patterns show that East and South Asia Europe North America and South Africa have the highest levels of elemental mercury in the air Concentrations are generally lower in the Southern Hemisphere than the Northern Hemisphere because most industrial activity is in northern regions Th ese model results are based on simulations using the 2005 global mercury emission inventory because the 2010 inventory has only recently become available
Intercontinental transport of mercury in the air has been examined to determine its impact on regional mercury levels Four models using diff erent parameters produced consistent results Depending on the region mercury emitted by distant sources contributes between 10 and 30 of annual mercury deposition Where local sources are low mercury transported from distant emission sources can account for more than half of the deposition East Asia is the dominant source region adding 10-14 to the deposition in
Contribution from sources outside receptor region
Model 40
GEOS-Chem GLEMOS GRAHM CMAQ-Hg
30
20
10
0 Arctic Europe North East Asia South Asia
America
Receptor region
(Left ) Global distribution of anthropogenic mercury emissions in 2005 with source regions that were considered in the analysis (North America South America Europe Africa Central Asia South Asia East Asia Australia and Oceania) and (right) the contribution of anthropogenic sources outside a particular receptor region to deposition within the receptor region
22
UNEP Global Mercury Assessment 2013
Modelling atmospheric transport and deposition Global models reproduce the movement of mercury in the atmosphere during which the mercury may move between continents They have been effective in examining sources of mercury to the Arctic and also for examining the outflow of pollution from South and Southeast Asia and its impact on western North America as well as the flow from eastern North America to Europe
Regional models on the scale of a continent or a basin such as the Mediterranean can provide more detail about specific source areas even to the level of individual industrial areas Reliable results however require a detailed understanding of mercury oxidation in the atmosphere about which there is considerably uncertainty
Most atmospheric transport models consider the full chain of mercury processes in the atmosphere Some models also consider how mercury is cycled in other atmospheric compartments such as soil vegetation snow freshwater and seawater
One of the largest sources of uncertainty in mercury models is the chemical mechanism used to determine how mercury changes forms in the air Improved experimental data can help improve model performance by making sure that the correct reactions are simulated The processes that lead from deposition to re-emission also need to be understood better Advances in this area show promise with model results becoming closer to estimates based on experimental data
other regions of the world Natural emissions and re-emissions account for 35-70 of total deposition in most regions Deposition is generally greater in low and mid-latitudes due to stronger sunlight higher concentrations of oxidants and higher precipitation
Regional mercury models show patterns at the scales of continents or individual seas The Mediterranean Sea for example is a net source of mercury as it emits more than is deposited to it In that region dry deposition generally exceeds deposition of mercury in precipitation In Central and Southern Europe total gaseous mercury concentrations and deposition in precipitation were both consistently higher than the European average
Across the United States dry deposition accounts for two-thirds of total annual deposition mainly from gaseous oxidized mercury A study examining sources and deposition of mercury to assess the
benefits of proposed emission control measures found that mercury transport from outside the country accounts for 68 of mercury deposition in the Northeast and up to 91 in the west-central United States Large point sources contribute up to three-quarters of nearby deposition and power plants contributed half of the deposition in the eastern part of the country This suggests that new emissions standards would primarily benefit eastern regions of the US
In Asia studies show high seasonal variation in mercury concentration and deposition Anthropogenic emissions are responsible for about 75 of deposition in East Asia In this region there is a net removal of gaseous oxidized mercury from the atmosphere and a net export of gaseous elemental mercury
In the Arctic gaseous elemental mercury levels in the atmosphere are depleted rapidly in spring when after the long Arctic winters sunlight returns Ozone is depleted at the same time and it is believed that bromine-containing compounds are the cause of the photo-chemical reactions that deplete ozone and mercury During these events gaseous oxidized mercury and particulate-bound mercury levels increase sharply suggesting that the gaseous mercury is oxidized and deposited enhancing mercury deposition in Arctic areas in springtime Recent research however has found that 50-80 of the deposited mercury is re-emitted within a few days Similar springtime mercury depletion events have been seen in Antarctica
23
UNEP Global Mercury Assessment 2013
Anthropogenic releases to the aquatic environment 7 Global assessment Previous UNEP global mercury assessments only considered emissions to the atmosphere The 2013 Report presents the first attempt at compiling a global inventory of mercury releases to aquatic environments Releases directly into the aquatic environment present a completely different chemistry set of pathways and fate to those released to air They are also more directly linked to the risks posed by mercury to global environmental and human health Unlike mercury releases to air which are predominantly in the form of gaseous elemental mercury releases to water are predominantly inorganic mercury and to a lesser extent liquid elemental mercury
At present only some sources of aquatic releases can be quantified with any confidence Thus many sources that may be important are not included in this first assessment of global aquatic releases For example land management practices that expose new geological sources of mercury in rocks and mineral soils or that re-mobilize previously deposited mercury cannot yet be assessed Two broad categories of current anthropogenic sources are considered here point sources of mercury release to water and diffuse releases of mercury as a result of its remobilisation from areas where it was previously deposited or accumulated due to human activity (ie contaminated sites) Artisanal and small-scale gold mining (ASGM) mercury-containing pesticides and fungicides used in agriculture and deforestation are considered separately
Point source releases to water from various sectors in tonnes per year with the range of the estimate and as a percentage of total anthropogenic emissions
Sector Releases (range) tonnes
Non-ferrous metal production 925 (193 - 268)
Consumer product waste 894 (222 - 308)
Chlor-alkali production 28 (10 ndash 55)
Oil refining 06 (03 ndash 1)
Grand Total 185 (426 ndash 582)
The global estimate of mercury release to water from point sources has been derived from the atmospheric emissions assessment and the approach employed in the UNEP Toolkit to partition total mercury releases between air land and water This approach has considerable uncertainty and may omit sectors where releases to water are high but air emissions are unimportant and therefore not addressed in the inventory Global releases from point sources were estimated to be 185 tonnes per year
For diffuse sources evaluating the relative contribution of anthropogenic and natural sources to the aquatic environment requires determining considerations of the various mercury inputs For some sectors data exist that allow a preliminary assessment of the amounts of mercury re-mobilized into aquatic systems
For mercury-contaminated sites the range of average soil concentrations of mercury reported for sites where mercury was mined used or otherwise released by human activity was considered The area of contamination is then used to determine how much mercury is available in soils and when combined with a factor for how much mercury is released from those soils in a year the total release can be estimated Among identified contaminated sites mercury mining is identified as the largest sector followed by mining of precious metals Total releases to aquatic environments from contaminated sites are estimated to be 83-335 tonnes per year
Releases to water from contaminated sites in tonnes per year with the range of the estimate
Sector Releases (range) tonnes
Primary mercury mining sites 67 ndash 266
Precious metal production sites 14 ndash 55
Non-ferrous metal production sites 01 ndash 05
Chlor-alkali production sites 01 ndash 05
Other industrial sites 01 ndash 03
Grand Total 83 ndash 335
24
UNEP Global Mercury Assessment 2013
Much of the mercury released from artisanal and small-scale gold mining goes into rivers lakes soils and sediments and tailings From soils and tailings it may be re-mobilized by leaching and erosion In addition mining may disturb mercury-containing soils and sediments that may then erode more quickly releasing more mercury than would otherwise have become available from natural erosion A key factor in these processes is the local hydrological cycle of precipitation evaporation run-off and river flow To account for this in the assessment countries were designated as dry wet or intermediate to determine the relative importance of erosion The tropical and subtropical countries which have the greatest activity in this sector also tend to experience high precipitation and run-off exacerbating this source of mercury release and re-mobilization Total worldwide releases of mercury to land and water from ASGM were estimated at over 800 tonnes per year How much of this is released to water cannot yet be determined
Mercury continues to be used in pesticides and fungicides 2100 tonnes of mercury were released in the decade of the 1960s through such agrochemical uses Current data are unavailable although the use of mercury in these products has been greatly reduced
Deforestation especially in the Amazon Basin can lead to extensive soil erosion and thus the release of mercury previously accumulated in soils Using 2010 figures for deforestation rates around the world and an estimate of soil concentrations of mercury as much as 260 tonnes of mercury may have been released into rivers in 2010 as a result of deforestation worldwide
Because this is the first attempt to quantify global mercury releases to the aquatic environment there is no previous measurement against which these results can be compared Thus it is not possible at this time to evaluate trends in releases
Uncertainties in release estimates Estimating global releases of mercury to aquatic environments is being done here for the first time Many data are missing and others are imprecise A number of assumptions have been made based on what measurements are available or on other grounds to extrapolate from known quantities or to calculate aquatic releases in relation to atmospheric
or other emissions Thus the results should be treated with great caution It is nonetheless clear that anthropogenic sources and human activity contribute hundreds of tonnes of mercury to aquatic environments each year a substantial amount relative to estimated natural releases 150-960 tonnes per year from terrestrial environments
Lapshin Shutterstockcom
Phil Augustavo istockphotocom
Bureau of Land Managem
ent
Contaminated sites (top) erosion following deforestation (middle) and a flooded store of mercury-contaminated waste (lower) illustrate potential sources of mercury releases to water
25
UNEP Global Mercury Assessment 2013
Aquatic pathways transport and fate 8 Mercury in aquatic environments The pathways and fate of mercury in aquatic environments are important because it is in waters sediments and wetland soils that inorganic mercury is converted into methylmercury which is toxic and concentrates in animals The majority of human exposure to mercury and the health risk that comes with mercury exposure is from consumption of marine foods Thus this section focuses on the worldrsquos oceans Some freshwater systems however are important sources of fish for human consumption especially for subsistence and recreational fisheries often among indigenous peoples Artisanal and small-scale gold mining (ASGM) communities may also be affected through fish consumption and drinking water if those are contaminated by local releases
The major processes of mercury cycling are generally similar for all aquatic systems Inorganic mercury in dissolved or particulate form is the dominant mercury type in most marine and fresh waters Dissolved gaseous elemental mercury accounts for less than 30 of total mercury in water Methylmercury is often present at trace levels but may in some settings reach 30 of total mercury In freshwater and coastal environments inorganic mercury is transformed into methylmercury primarily in sediments In the open ocean this conversion takes place largely at intermediate depths between 200 and 1000 meters in the water column Mercury is lost from aquatic systems in two ways When inorganic mercury is reduced to elemental mercury it can be re-emitted to the atmosphere When inorganic mercury binds to particulates in water it can settle out rapidly and be buried in sediments Deep burial in ocean sediments is one of the major pathways by which mercury is removed from the biologically active environment
The global mercury cycle is chemically and physically complex Thus it is necessary to use models to study describe and predict what happens and will happen to mercury in the aquatic environment Until recently only one model existed that incorporated
air land and water into a unified whole The model has been validated against observations of mercury and represents the current scientific consensus The largest potential errors in this model in terms of the aquatic cycle concern details of the exchange of mercury between air and water
Pathways and fate of mercury in the oceans Model simulations suggest that anthropogenic impacts on mercury levels in the ocean are greatest in the surface waters the top 100 meters or so of the water column While model results vary one recent estimate suggests that anthropogenic emissions over the last 100 years have doubled the concentration of mercury in the surface layer of the ocean and increased it by 25 in intermediate waters and by 10 in deep waters The difference is due to the length of time it takes for surface waters to circulate to the depths
Models and measurements agree that direct deposition from the atmosphere is the dominant pathway by which mercury reaches the oceans The exceptions are smaller semi-enclosed basins such as the Mediterranean Sea or the Arctic Ocean where river runoff coastal erosion and ocean currents
Ugo M
ontaldo Shutterstockcom
26
UNEP Global Mercury Assessment 2013
account for about half of mercury inputs The most recent modelling effort suggests that total deposition input of mercury to the oceans in 2008 was 3700 tonnes
Other mercury pathways appear less important on a global basis Rivers are estimated to carry more than 2800 tonnes of mercury each year but only about 380 tonnes of this is transported offshore The rest is trapped by particles in estuaries Groundwater and re-mobilization from sediments provide 100shy800 tonnes of mercury to the oceans each year Undersea hydrothermal vents add less than 600 tonnes of mercury to the oceans There are high concentrations of mercury in vent fluids but a great deal of the mercury is precipitated as solids once the vent fluids enter seawater
Models suggest that globally about 70 of the mercury deposited into the ocean is re-emitted to the atmosphere Oxidized mercury in surface waters is reduced by biological and photochemical processes to the elemental form that is volatile and readily re-emitted The removal of this mercury ultimately reduces the pool of mercury that could be converted to methylmercury and be accumulated by marine organisms The re-emission process thus simultaneously prolongs the lifetime of mercury cycling through the atmosphere and upper ocean and acts to reduce mercury availability for marine food webs
Any changes in the efficiency of mercury reduction in surface waters or the rate of re-emission is likely to impact mercury concentrations in surface waters and the air One example is the effect of sea ice in the Arctic Ocean which blocks the re-emission
Tony Magdaraog Shutterstockcom
Mercury accumulated in marine food-webs can enter the human diet
of elemental mercury leaving elevated levels in waters under ice Changes in primary productivity could change the rate at which mercury is bound to particles thus affecting re-emission to the atmosphere as well as rates of downward transport in the ocean Changes in oxidant levels in the atmosphere such as ozone and bromine may also influence the rate of oxidation of gaseous elemental mercury and thus deposition rates to the ocean
Methylmercury in the ocean Natural bacterial processes in seawater and in sediments in coastal environments convert inorganic mercury to methylmercury Methylmercury levels are highest in the subsurface waters of many oceans because it is formed at these intermediate depths likely as a result of the decomposition of organic material falling from surface waters Current understanding indicates that about 300 tonnes of methylmercury is produced in the upper ocean by this and related processes By contrast only about 80 tonnes of methylmercury reaches the ocean from other sources such as atmospheric deposition rivers and diffusion from sediments
Current modelling indicates that methylmercury stays in the upper ocean for about 11 years Deshymethylation by photochemical reaction or by microbial activity is the major removal process for methylmercury in the ocean About 240 tonnes of methylmercury is removed by this process from the surface waters of the ocean per year
The other important pathway for methylmercury in seawater is uptake into marine food webs Although only about 40 tonnes per year is taken up in this way it is this fraction that poses risks to marine animals and human consumers of seafood Methylmercury is a problem for several reasons First it is taken up by plankton much more efficiently than is inorganic mercury resulting in concentrations in plankton that are as high as 10000 times the concentration in seawater Second methylmercury is absorbed through the intestine of animals much more easily than is inorganic mercury Third methylmercury biomagnifies as it moves up the food web Thus methylmercury becomes an increasingly greater proportion of the mercury in organisms higher in the food web This explains why some indigenous populations that consume top marine predators such as fish seals and whales have some of the worldrsquos highest concentrations of methylmercury giving rise to health concerns
27
UNEP Global Mercury Assessment 2013
Pathways and fate of mercury in freshwater Observations and modelling both show that there are in general many similarities between mercury chemistry pathways and fate in lakes and in the oceans but with obvious differences in scale and in the relative importance of different processes Modelling of mercury dynamics was done for four lakes with a history of direct mercury inputs from the largest freshwater lake in the world (Lake Superior) to small lakes in Ontario Canada Atmospheric deposition and river inflow were the main sources of inorganic mercury Much of the mercury input from lake and river catchments was associated with dissolved and particulate organic matter The dominant mercury removal mechanisms as in saltwater were burial in sediments and photochemical reduction of oxidized mercury to elemental mercury followed by re-emission to the air In Lake Superior and Lake Michigan there is evidence for methylation of mercury in the water column as is seen in the open ocean
Methylmercury levels in freshwater fish vary with the level of deposition of mercury from the air though other factors such as inputs from the watershed and the number of trophic levels within the lakersquos food web are also important Methylation predominantly occurred in lake sediments and wetlands and floodplain soils where sulphateshyreducing bacteria are believed to be primarily responsible Methylmercury is de-methylated in sediments and also taken away in the outlet river from each lake
Some 400-1400 tonnes of mercury are estimated globally to be trapped behind dams and other man-made impoundments each year This has in many cases led to significant increases in total mercury and methylmercury levels in water and of methylmercury in fish and other aquatic species When artificial lakes are created plant material is submerged leading to decay and anoxia In these conditions microbially driven methylation of inorganic mercury takes place In some cases the elevated mercury levels have also been observed downstream from the artificial lakes and reservoirs
Anthropogenic impacts on aquatic mercury levels Two studies have reported that the Atlantic and Pacific Oceans have shown opposing trends over recent decades While the influence of changing ocean currents and other oceanographic factors may be a factor the trends do make sense in light of patterns of anthropogenic emissions In the North Pacific Ocean mercury concentrations appear to have increased at depths between 200 and 1000 meters over the last few decades This increase coincides with the rapid industrialization of East Asia
In the North Atlantic however results from near Bermuda suggest a substantial decrease in mercury concentration and a change in the mercury profile through the water column The Mediterranean Sea too showed a decrease in mercury concentration between 1990 and 2004 These findings are consistent with atmospheric data from around the North Atlantic The conclusion is that mercury levels in seawater in the North Atlantic were elevated by human activity but may now be declining likely as a result of decreased emissions from North America and Europe
A complementary approach to measuring mercury in seawater is to measure mercury in aquatic animals which accumulate and integrate mercury over time Teeth hair feathers and eggshells are useful long-term archives of mercury concentrations and can provide data from the pre-industrial period (ie before 1800) as well as more recent periods
Among marine animals samples are available from several regions particularly from the Arctic where cold dry conditions help preserve animal tissues Mercury concentrations between the 13th and 16th
centuries were relatively stable From the mid- to late 19th century to the end of the 20th century mercury levels increased by an average of 12 times On average therefore about 92 of the mercury in Arctic marine wildlife today is likely to be of anthropogenic origin
Similar findings were found for a 700-year sequence of seabird eggshells from the South China Sea Mercury levels increased steadily between 1800 and 2000 with a particularly rapid increase after 1970 Concentrations since 2000 are about 10 times higher than pre-industrial levels with 91 of the mercury now likely to be of anthropogenic origin In the Antarctic studies of seal hairs show that pre-industrial mercury levels were only 60 of recent levels The relatively small difference
28
UNEP Global Mercury Assessment 2013
Historical Hg concentration as a proportion of present-day 100
80
60
40
20
0
Beluga teeth Human teeth
Gyrfalcon feathers Perigrine falcon feathers
Polar bear hair Ringed seal teeth
1200 1300 1400 1500 1600 1700 1800 1900 2000
between pre-industrial and modern mercury levels in Antarctic is consistent with lower mercury emissions and atmospheric concentrations in the Southern Hemisphere as compared with the Northern Hemisphere
The timing of long-term increases of mercury in aquatic animals can shed light on the likely sources of mercury emissions that were responsible The industrialization of Europe and North America appear responsible for the large increases in marine mercury levels that began in the 19th century as these increases occurred prior to recent Asian industrialization As with water concentrations in the Pacific Ocean recent rapid increases in mercury in seabird eggs in the South China Sea coincide with industrialization in Asia
The time lag in aquatic ecosystem response One important conclusion from air-ocean modeling is that the oceans have not yet reached equilibrium with current atmospheric levels of mercury This lag is due to several factors First mercury stays in the upper ocean above 200 meters depth for about 30 years and for centuries in intermediate and deep waters This is much longer than the one year residence time in the lower atmosphere Thus removal from the ocean takes much longer than does removal from the air and so concentrations will change more slowly
Second because of the long lifetime of mercury in deeper ocean waters a great deal of natural mercury is present in the ocean already about 100000 tonnes out of a total of 135000 tonnes in intermediate waters and 200000 out of 220000 tonnes in deep waters
Rune Dietz
Analysis of museum samples reflects the increase in mercury emissions and releases since the mid-19th century associated with anthropogenic activities
Third vertical transport of mercury from intermediate depths back to the surface returns a substantial amount of mercury to the biologically active zone each year As a result average mercury concentrations in seawater and marine animals are likely to increase slowly for decades if not centuries even if atmospheric levels stabilize at present levels In short the effects of historical anthropogenic emissions from Europe and North America are still being observed in the oceans at the same time that the effects of the recent rise in emissions from Asia are being seen
Regionally different trends can be expected depending on distance from sources and ocean circulation patterns In the North Atlantic north of 55deg N it will take 50-600 years to achieve equilibrium between atmospheric and seawater mercury levels In the North Pacific this process is estimated to take 500-700 years and in the Antarctic 700-1000 years The Arctic Ocean by contrast is smaller and will only take about 35 years to reflect changes in atmospheric mercury levels Surface waters of the Mediterranean Sea should show also changes within 10-50 years
Time lags in the responses of many freshwaters and their food-webs to changes in atmospheric mercury levels are also expected Although some immediate recovery following reductions in atmospheric mercury deposition rates is likely full recovery may take decades centuries or longer depending on the characteristics of the area Highly polluted freshwaters with catchments and sediments containing large amounts of anthropogenic mercury will recover most slowly as is already observed around point sources such as smelters that have closed down
29
UNEP Global Mercury Assessment 2013
Major gaps in knowledge 9 Large uncertainties remain in global estimates of mercury emissions to the air These stem from various sources including the availability of information on activity levels but mainly from the lack of information concerning the mercury content of some raw materials and the validity of assumptions regarding processes and technologies employed to reduce mercury emissions including their rates of application and effectiveness The accuracy and precision of measurement-based estimates can depend on the validity of extrapolating measurements made at infrequent intervals to longer periods or measurements made at one plant to other facilities with similar operations
Potentially important emissions sectors that are still not quantified in the emissions inventory include the use of mercury in vinyl-chloride monomer production secondary metals production oil and gas extraction transport and processing industrial and hazardous waste incineration and disposal sewage sludge incineration and dental fillings preparation and removal
Current measurements and their evaluation are inadequate for determining spatial and temporal trends Improved more extensive and better coordinated measurements are needed A permanent global integrated monitoring network for atmospheric mercury and mercury deposition is needed to achieve this goal The atmospheric network sites should be closely integrated with water soil and biological monitoring networks The results can be used for model testing and evaluation as well as for more accurately detailing the geographic impact of anthropogenic emissions Monitoring of mercury concentrations in the important marine food species is essential to understanding possible human health impacts and the effects of future emissions changes
Better data on mercury distribution in the troposphere is needed to improve understanding of long-range transport and source-receptor relationships Coordinated studies at high altitudes and by aircraft are needed This information will
also help validate regional and global scale models improving their prediction capabilities with regard to different policy scenarios
Key processes related to global transport and cycling of mercury remain inadequately understood The chemical form of gaseous oxidized mercury is unknown Reduction and oxidation rates for mercury in the presence of atmospheric oxidants need further study including determining which oxidants are important New measurements and modelling studies are needed to examine key chemical and physical processes that affect global transport and cycling
Few data are available for reporting mercury releases to aquatic systems Systematic and consistent monitoring of mercury releases to the air is required especially for contaminated systems Releases of mercury from soils into waters depend greatly on climate and topography and these parameters need to be better accounted for Consistent approaches for measuring and reporting releases from point sources are needed to ensure comparability of data from around the world In particular the actual role of artisanal and small-scale gold mining (ASGM) in emissions to air and releases to water needs to be more accurately estimated
The link between mercury deposition methylation and uptake by living organisms needs further study The parameters that determine the rates of exchange of mercury compounds between air and sea air and soil and air and vegetation are not fully understood Whole-ecosystem studies of mercury are needed to better understand biogeochemical cycling Methylationdemethylation rates and their spatial and temporal variations and relationship to climatic factors need to be determined in most of worldrsquos major ocean basins as well as in representative freshwaters
30
UNEP Global Mercury Assessment 2013
Key findings of the 2013 assessment 10 Atmosphere Total anthropogenic emissions of mercury to the atmosphere in 2010 are estimated at 1960 (1010shy4070) tonnes which is about 30 of the total mercury that was emitted and re-emitted from anthropogenic and natural sources in that year The largest anthropogenic sources are associated with artisanal and small-scale gold mining (ASGM) and coal burning which together account for about 62 of the annual total anthropogenic emissions to air Other major sectors include ferrous and non-ferrous metal production and cement production
East and Southeast Asia are responsible for about 40 of global anthropogenic emissions About 75 of the mercury from this region comes from China which is about one-third of the global total Increased estimates for emissions from ASGM largely a result of newly obtained data and improved information mean that South America and Sub-Saharan Africa are also responsible for a greater proportion of global emissions than was previously assumed
Anthropogenic emissions over time have increased mercury loads present in the environment This leads to higher rates of re-emission and also means that there will be a time lag of years or decades between emissions reductions and lower mercury levels in the food web including pathways of human exposure
Mercury emissions to the atmosphere likely peaked in the 1950s to 1970s and subsequently declined because of reductions in Europe Russia and North America Emission trends are unclear due to changes in methods employed to produce inventories and differences in the sectors that have been accounted at different times There are however some indications that emissions may be rising again with increases from East Asia offsetting continuing reductions in Europe and North America
Aquatic environments Natural processes in aquatic systems convert less toxic elemental and inorganic mercury into much more toxic methylmercury Methylmercury concentrates and accumulates in the food web leading to high concentrations in some species of seafood and fish that many people eat
Anthropogenic releases of mercury to aquatic environments contribute hundreds of tonnes to the amount of mercury cycling in the environment Diffuse releases and point sources appear equally important Atmospheric deposition however remains the most important input of mercury to land and oceans and has increased the amount of mercury in many environmental compartments by a factor of two or three since the start of the industrial age On land mercury that is deposited is largely retained in soils and vegetation increasing the available pool for re-mobilisation to adjacent aquatic systems Re-emission from soils however is a major addition to atmospheric mercury
Hydrology is the most important factor in the transport of mercury from catchments to downstream environments Relatively little of this mercury reaches the open ocean as most is captured in sediments behind dams in estuaries and near the coast Changes in land cover and land use can have a large effect on mercury mobilisation as exposed soils erode and mercury leaches into the water table
Concentrations of mercury in Arctic marine animals today are about 10-12 times higher than in preshyindustrial times (ie prior to about 1800) This means that on average about 92 of the mercury in marine predators such as seabirds seals and whales is anthropogenic in origin The timing of the increase suggest that 19th and early 20th century emissions from Europe North America and Russia were responsible Increases mercury concentrations in seabirds in the South China Sea appear to be more recent than the Arctic increases coinciding with increasing industrialisation in East and Southeast Asia
31
UNEP Global Mercury Assessment 2013
K+S Entsorgung Gm
bH
Recovered mercury is being stockpiled at long-term storage sites above- and as shown here below ground
The upper 100 meters of the oceans have twice the mercury that they did a century ago Intermediate and deeper waters have 10-25 more mercury on average reflecting the slow transport of mercury downwards in the oceans Seawater concentrations will thus be especially slow in responding to changes in mercury inputs from atmospheric deposition and river flow As a result mercury concentrations in marine biota are likely to increase slowly for decades to centuries even without an increase in atmospheric emissions
In freshwater ecosystems atmospheric deposition and re-mobilisation from soils slow the reduction of mercury levels even in regions where atmospheric concentrations have decreased due to emission controls
Further increases in atmospheric emissions will have long-term consequences for commercial fisheries and all consumers of marine and freshwater foods
It is likely to be years or decades before reductions in anthropogenic emissions and releases of mercury have a demonstrable effect on mercury levels throughout the environment and in the fish and marine mammals which are part of the human food-chain This only reinforces the need to act now to continue and strengthen international efforts to reduce current mercury emissions and releases Delays in action now will inevitably lead to slower recovery of the worldrsquos ecosystems in future from mercury contamination leaving an even greater legacy of pollution for future generations
32
Division of Technology Industry and Economics (DTIE) Chemicals Branch Geneva Switzerland January 2013
Job number DTI1636GE
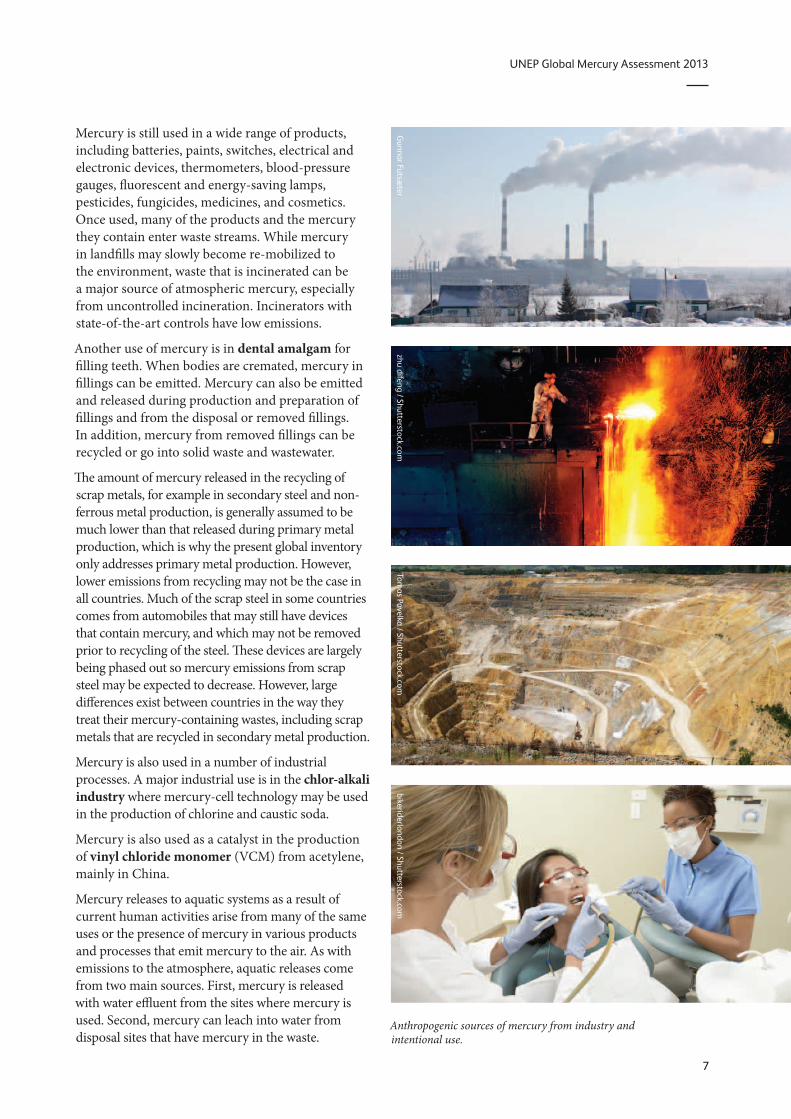
UNEP Global Mercury Assessment 2013
Mercury is still used in a wide range of products including batteries paints switches electrical and electronic devices thermometers blood-pressure gauges fluorescent and energy-saving lamps pesticides fungicides medicines and cosmetics Once used many of the products and the mercury they contain enter waste streams While mercury in landfills may slowly become re-mobilized to the environment waste that is incinerated can be a major source of atmospheric mercury especially from uncontrolled incineration Incinerators with state-of-the-art controls have low emissions
Another use of mercury is in dental amalgam for filling teeth When bodies are cremated mercury in fillings can be emitted Mercury can also be emitted and released during production and preparation of fillings and from the disposal or removed fillings In addition mercury from removed fillings can be recycled or go into solid waste and wastewater
The amount of mercury released in the recycling of scrap metals for example in secondary steel and nonshyferrous metal production is generally assumed to be much lower than that released during primary metal production which is why the present global inventory only addresses primary metal production However lower emissions from recycling may not be the case in all countries Much of the scrap steel in some countries comes from automobiles that may still have devices that contain mercury and which may not be removed prior to recycling of the steel These devices are largely being phased out so mercury emissions from scrap steel may be expected to decrease However large differences exist between countries in the way they treat their mercury-containing wastes including scrap metals that are recycled in secondary metal production
Mercury is also used in a number of industrial processes A major industrial use is in the chlor-alkali industry where mercury-cell technology may be used in the production of chlorine and caustic soda
Mercury is also used as a catalyst in the production of vinyl chloride monomer (VCM) from acetylene mainly in China
Mercury releases to aquatic systems as a result of current human activities arise from many of the same uses or the presence of mercury in various products and processes that emit mercury to the air As with emissions to the atmosphere aquatic releases come from two main sources First mercury is released with water effluent from the sites where mercury is used Second mercury can leach into water from disposal sites that have mercury in the waste
zhu difeng Shutterstockcom
Tomas Pavelka Shutterstockcom
bikeriderlondon Shutterstockcom
Anthropogenic sources of mercury from industry and intentional use
Gunnar Futsaelig
ter
7
UNEP Global Mercury Assessment 2013
Arnold John Labrentz Shutterstockcom
Re-emission and re-mobilization of mercury Re-emissions constitute the third category of sources presently comprising about 60 of mercury emissions to air Mercury previously deposited from air onto soils surface waters and vegetation from past emissions can be emitted back to the air Re-emission is a result of natural processes that convert inorganic and organic forms of mercury to elemental mercury which is volatile and therefore readily returns to the air Mercury deposited to plant surfaces can be re-emitted during forest fires or biomass burning Mercury may be deposited and re-emitted many times as it cycles through the environment
It is important that re-emitted mercury should not be considered a natural source It may originally have come from natural or anthropogenic sources but by the time it is re-emitted it is difficult or impossible to identify its specific origin Nonetheless human activity has increased the environmental burden of mercury resulting in higher levels of re-emission This is compounded by changes in land use practices as well as increasing temperatures due to climate change
In the aquatic environment re-mobilization of mercury occurs when mercury deposited on and accumulated in soils or sediments is re-mobilized by for example rain or floods that cause the mercury to enter or re-enter the aquatic system Resuspension
of aquatic sediments due to wave action or storm events is an additional way for mercury to re-enter the aquatic ecosystems
Estimating re-emission and re-mobilization rates is difficult It is often done using modelling approaches These models are based on data on atmospheric levels and other observations as well as current understanding of chemical transformations and other processes that determine how mercury moves between air land and water The models aim to balance the amount of mercury in circulation at any given time while remaining consistent with observational data Temperature is a key factor With lower temperatures re-emission rates are generally lower
Re-emission is also a major factor in determining the length of time needed for anthropogenic emission reductions to be reflected in decreasing environmental levels of mercury Mercury emitted in one year may be deposited to and retained in soils and waters for some time before being re-emitted or re-mobilized in subsequent years This cycle can be repeated keeping levels in air and water elevated even after anthropogenic sources have been lowered Conversely continuing to add to the global pool will leave an ever-longer legacy of anthropogenic mercury contamination worldwide It is thus imperative that international efforts to reduce mercury emissions continue and are strengthened as soon as possible
Forest fires re-emit mercury deposited to vegetation
8
UNEP Global Mercury Assessment 2013
Anthropogenic emissions to the atmosphere 3 Global emissions inventory The global emissions inventory for 2010 estimates that 1960 tonnes of mercury was emitted to the atmosphere as a direct result of human activity The leading sectors remain the same as those identified in the 2005 inventory Improved data however have changed the relative contributions of some of these sectors as have some actual changes in emissions All coal burning emissions taken together for example represent a lower percentage of the total emissions than in the 2005 inventory This is due in part to the increased estimates from artisanal and small-scale gold mining (ASGM) and in part to much lower estimates for domestic use of coal When the actual amount of mercury emitted from coal combustions in power generation and industrial uses is considered and the estimates are based on the same 2010 methodology the emissions in 2010 are the same and perhaps slightly higher than in 2005 Even though new coal-fired power plants are being built combustion efficiency and emissions controls are also improving in most parts of the world
Results by selected sector The updated inventory of emissions to air confirms coal burning as a continuing major source of emissions responsible for some 475 tonnes of mercury emissions to air annually compared with around 10 tonnes from combustion of other fossil fuels According to the new inventory more than 85 of these emissions are from coal burning in power generation and industrial uses In the previous assessment emissions from domestic and residential coal burning were highlighted as a possible larger contribution Better information on coal consumption for domestic and residential uses indicates that these activities are a smaller contribution to total emissions from coal burning than previously thought
Emissions from the cement production industry are largely dependent on the raw materials and the fuels used The new inventory avoids double
Emissions from various sectors in tonnes per year with the range of the estimate and as a percentage of total anthropogenic emissions Note These numbers cannot be compared directly with those presented in the 2008 assessment (see Chapter 4 Trends in mercury emissions to the atmosphere)
Sector Emission (range) tonnes
By-product or unintentional emissions
Fossil fuel burning
Coal burning (all uses) 474 (304 - 678) 24
Oil and natural gas burning 99 (45 ndash 163) 1
Mining smelting amp production of metals
Primary production of 455 (205 ndash 241) 2 ferrous metals
Primary production of nonshy 193 (82 ndash 660) 10 ferrous metals (Al Cu Pb Zn)
Large-scale gold production 973 (07 ndash 247) 5
Mine production of mercury 117 (69 ndash 178) lt1
Cement production 173 (655 - 646) 9
Oil refining 16 (73 - 264) 1
Contaminated sites 825 (70 - 95) 4
Intentional uses
Artisanal and small-scale 727 (410 ndash 1040) 37 gold mining
Chlor-alkali industry 284 (102 ndash 547) 1
Consumer product waste 956 (237 ndash 330) 5
Cremation (dental amalgam) 36 (09 - 119) lt1
Grand Total 1960 (1010 ndash 4070) 100
Values rounded to 3 significant figures To nearest percent
Sectors for which emissions are not currently quantified
biofuel production and combustion
vinyl-chloride monomer production emissions during
secondary metals production and ferro-alloys
oil and gas extraction transport and processing other than refinery emissions
industrial some hazardous waste incineration and disposal
sewage sludge incineration
preparation of dental amalgam fillings and disposal of removed fillings containing mercury
9
UNEP Global Mercury Assessment 2013
Disposal of waste from
Mercury-cell chlor-alkali
industry
Relative contributions to estimated emissions to air from anthropogenic sources in 2010
Oil refining
Coal combustion
Oil and natural gas combustion
Primary ferrous metal production
Primary non-ferrous metal (Al Cu Pb Zn)
Large-scale gold production
Hg production Cement production
mercury-containing products
Contaminated sites
Cremation
Artisanal and small-scale gold production
counting of emissions from conventional fuels (such as coal and oil) that are included under the industrial fossil fuel burning emissions However it does attempt to account for emissions from other fuels including alternative fuels (such as old tyres and other wastes) and from raw materials Increasing amounts of waste are being co-incinerated in the cement industry both as fuel but also in some plants as a means of disposing of hazardous wastes some of which may contain mercury In some regions additional measures are being introduced to make sure that mercury emissions associated with waste co-incineration do not increase overall emissions from cement plants
Increased application of air pollution control devices including some mercury-specific technologies together with more stringent regulations in several countries have the effect of reducing mercury emissions from coal burning sectors and thus offset some part of the emissions arising from increased activity
Artisanal and small-scale gold mining emissions are in the 2010 inventory the major source of emissions to air at 727 tonnes per year The reasons for the large increase in the estimate compared to 2005 are discussed below (see page 16) The global estimate for emissions from ASGM includes a significant contribution from China although
recent information on this sector in China is lacking China prohibited ASGM in 1996 and therefore records no emissions from this sector
Mercury-cell technology is becoming less common in the chlor-alkali industry as other more cost-effective processes are adopted No new plants are being constructed though many older plants remain to be converted Old chlor-alkali plants and other decommissioned industrial sites may constitute contaminated sites that continue to release mercury to the environment for many years and emissions from contaminated sites are now part of the inventory
Global emissions from use of mercury in dental amalgam resulting from cremation of human remains are estimated at 36 (09 ndash 119) tonnes in 2010 Some 340 tonnes of mercury is used per year in dentistry of which about 70-100 tonnes (ie 20shy30) likely enters the solid waste stream
In the production of vinyl chloride monomer information is still lacking on the lifecycle and eventual fate of the mercury catalyst Most of this production occurs in China and about 800 tonnes of mercury is thought to have been used by this industry in China in 2012 Used mercury catalyst is recycled and reused by enterprises that hold permits for hazardous waste management The amounts that may be emitted or released are unknown
Ronald de Hom
mel
Artisanal and small-scale gold mining Unlike most small-scale gold miners the green gold miners of Oro Verde shown here employ an environmental way of mining gold that does not use mercury or other chemicals
10
UNEP Global Mercury Assessment 2013
Results by region The greatest proportion of anthropogenic mercury emissions to the atmosphere comes from Asia which contributes about 50 of the global total The majority of Asian emissions come from East and Southeast Asia China accounts for three-quarters of East and Southeast Asian emissions or about one third of the global total
New data on emissions from ASGM have increased the proportion of global emissions attributed to South America and Sub-Saharan Africa largely due to increased estimates associated with improved information about ASGM activities in these areas
Emissions to air from other major source sectors are higher in Europe North America and Oceania
Mercury emission 2010 gkm2
0 2 5 10 100 1000
Global distribution of anthropogenic mercury emissions to air in 2010
Emissions from various regions in tonnes per year with the range of the estimate and as a percentage of total global anthropogenic emissions Note These numbers cannot be compared directly with those presented in the 2008 assessment (see Chapter 4 Trends in mercury emissions to the atmosphere)
See figure on the following Region Emission (range) tonnes page for map with
Australia New Zealand amp Oceania 223 (54 - 527) 11 specification of regions Values rounded to 3 Central America and the Caribbean 472 (197 - 974) 24
significant figures CIS amp other European countries 115 (426 - 289) 59
East and Southeast Asia 777 (395 - 1690) 397
European Union (EU27) 875 (445 - 226) 45
Middle Eastern States 370 (161 - 106) 19
North Africa 136 (48 - 412) 07
North America 607 (343 - 139) 31
South America 245 (128 - 465) 125
South Asia 154 (782 - 358) 79
Sub-Saharan Africa 316 (168 - 514) 161
Undefined (global total for emissions from 825 (700 - 950) 42 contaminated sites)
Grand Total 1960 (1010 ndash 4070) 100
11
UNEP Global Mercury Assessment 2013
North America
Central America and the Caribbean
South America
Unintentional emissions
Stationary combustion (coal)
Stationary combustion (oil and gas) Oil refining
Pig iron and steel
Intentional uses
Artisanal and small-scale gold mining Chlor-alkali
EU27
North Africa
Sub-Saharan Africa
Non-ferrous metals (Cu Pb Zn Al) Mercury
Large-scale gold
Cement
Product waste
Cremation
CIS amp other European countries
500
100
Middle Eastern States East and Southeast Asia
50
10 tonnes
South Asia Australia New Zealand amp Oceania
South America
North America
Central America and the Caribbean
Sub-Saharan Africa
South Asia North Africa
Middle Eastern States
EU
East and Southeast Asia
CIS amp other European countries
Australia New Zealand amp Oceania
Estimates of 2010 anthropogenic mercury emissions to air from different main sectors in different regions ASGM is shown separately to highlight its geographic distribution and better allow regional comparisons to be made for other sectors
12
UNEP Global Mercury Assessment 2013
Compiling the 2010 inventory of anthropogenic mercury emissions to air The inventories used in successive Global Mercury Assessments continue to improve as better data become available The 2013 update presents an inventory of emissions for 2010 that has a number of improvements over the 2008 assessment and its inventory for 2005
bull A more detailed analysis of emissions from some major source sectors For example fossil fuel consumption is now broken down into categories for combustion in power plants industry and other uses The type of coal or oil used is also considered providing a more accurate estimate of mercury emissions
bull A more detailed consideration of the mercury content of fuels and raw materials used in different countries and regions bull New and updated information on ASGM bull The use of different pollution control technologies
in different countries and regions have been factored into the emissions estimate bull Emission estimates for sectors not previously
included such as aluminium production oil refining and contaminated sites bull More and better information on location of major
point sources such as individual power plants smelters and cement kilns bull Better documentation and greater transparency
with respect to the data and information behind the estimates
The methods for estimating emissions from industrial sectors is complemented by other methods used for more dispersed emissions sources For example estimating emissions from some intentional-use sectors requires intensive work with those sectors Relevant and accurate information about ASGM is generally not available through official channels Estimating mercury emissions from its intentional use in lighting batteries and other products requires analysing the entire production use and waste stream to determine where mercury is likely to be released and in what quantities The approach used in the 2013 assessment addresses the emissions from breakages and wastes resulting from use of these mercury-containing products in society the majority of
which are incinerated or end up in landfills It does not however address industrial wastes or sewage sludge incineration
Uncertainties in emission estimates Estimates of mercury emissions are just that estimates To compile a global assessment requires making a number of assumptions and generalizations Uncertainty associated with the 2010 inventory arises from each of the factors used to estimate the emissions the correctness of the activity data the validity of the emission factors applied and the validity of assumptions regarding the effectiveness and use of emission-control technologies
Based on an evaluation of these sources of uncertainty and the relative contributions of sectors with reliable information and those with less reliable data uncertainty in the 2010 inventory assessment of total anthropogenic mercury emissions to air gives a range of emissions from 1010-4070 tonnes This range is greater than that reported in some previous assessments reflecting a greater appreciation of the sources of uncertainty due to the improved estimation methods and perhaps a more realistic appraisal of the state of knowledge concerning some aspects of emissions
The best estimate taking a conservative approach is 1960 tonnes If nationally produced estimates for 2010 available from some countries (Canada Japan Korea Mexico the United States and European countries reporting to LRTAP) are introduced into the global inventory in place of the inventory estimates the corresponding estimated total global anthropogenic emission to air is 1940 tonnes As most national inventories do not include uncertainty ranges it is not possible to assign a range to this number The recognition of uncertainties is an important consideration and presenting single national estimates can convey a misleading picture of what is known and more importantly not known about emissions
The numbers derived using the methods employed to produce the global inventory for 2010 were compared with a number of national inventories and emissions reported under other systems covering the same period In general the level of agreement was good in particular when the significant uncertainties
13
UNEP Global Mercury Assessment 2013
Methods for estimating emissions All global mercury emissions inventories to date have used the same basic approach for the major sectors emitting mercury to the atmosphere For specific emission sectors national emissions estimates are calculated by multiplying the amount of activity (ie amounts of fuels burned raw materials consumed or materials produced) by an emission factor that is an estimate of the mercury emitted per unit of activity For example emissions from coal-fired power generation are estimated by multiplying the tonnes of coal used by the amount of mercury estimated to be released per tonne of coal In most such inventories ldquoabatedrdquo emission factors have been employed to quantify both the emissions of mercury that occur during the processes and the effects of mercury emission controls In the new methodology used to develop the 2013 report these components are split ldquoUnabatedrdquo emission factors are employed to quantify the emissions and ldquotechnology profilesrdquo have been developed to represent the effects of mercury emission controls
Various methods are employed to estimate emissions of mercury at individual sources and at national regional and global levels In general the methods fall under one of two main categories
bull Mass-balancesubstance-flow based estimates which are based on the principle that what goes in must come out Amounts of mercury in fuels and raw materials constitute the inputs and the outputs are the amounts of mercury emitted to air released to water or land retained in products or in wastes or otherwise recovered and stored or disposed of
involved in both global and national estimates are taken into account It is important to note that there are good reasons why estimates of mercury emissions produced in the 2010 inventory may not fully agree with national inventories made by countries using other methodologies These reasons include
bull Reporting schemes may define and distinguish emissions source sectors in very different ways and aligning these sectors may not be possible
bull Industry reporting to national government may be limited to sources with emissions above a certain threshold level so that emissions from smaller sources below the threshold are not reported Where smaller sources make up a significant part of the source category reported inventories
bull Measurement-based estimates which rely on measurements made at appropriate points in the industrial process or in the productwaste output streams These measurements are used to estimate where the mercury goes as in the method above
In principle the two approaches should produce the same results In practice mass-balance based approaches tend to result in higher emission estimates than most measurement-based estimates Since future emissions reporting is likely to involve a combination of these two approaches further work is required to understand why results may differ and to reconcile the two approaches
Since the 2008 UNEP assessment was produced the number of direct measurements of emissions from certain point sources (in particular power plants and some metal and cement production plants and waste incineration facilities) has increased considerably resulting in a much improved knowledge base
A number of countries require regular reporting of emissions Increasing use is being made in these reporting systems of measurement-based estimates and facility-level reporting in particular for major point sources In other countries national mercury emissions are only being quantified for the first time Since 2005 and the start of the UNEP negotiating process in 2010 many countries have initiated work on national emission inventories which in several cases have yielded much improved information on activity data sector characteristics and mercury emissions Such inventories often make use of the UNEP Toolkit for identification and quantification of mercury emissions
may therefore significantly underestimate total mercury emissions bull National inventories in some countries are making
increasing use of actual measurements of mercury emissions at individual facilities At the global scale it is not yet feasible to base an inventory on individual site emissions Furthermore actual measurements of mercury emissions at a source may be taken only a few times during a year and may not be fully representative of normal operations In the 2013 assessment a mass-balance based approach was employed to be consistent transparent and replicable bull National reporting and monitoring schemes
may provide information that is not available to externally produced inventories
14
UNEP Global Mercury Assessment 2013
Despite these considerations most of the discrepancies noted between the 2010 inventory mass-balance-based estimates and national estimates based on measurement- approaches are modest and within the margins of error associated with the different approaches In cases where the differences are larger it is important to recognize that there are sources of error in all methods for estimating mercury emissions
Gunnar Futsaelig
ter
Sampling of mercury emissions at the Kendal coal-fired power plant in South Africa conducted under a UNEP project A probe with mercury traps is inserted into a sampling port in the stack to collect mercury present in the flue gas The mercury traps are subsequently analysed according to the US EPA Mercury Monitoring Toolkit sampling protocol
15
UNEP Global Mercury Assessment 2013
Trends in mercury emissions to the atmosphere 4 Assessing global and sectoral trends A key question in assessing anthropogenic mercury emissions worldwide is whether they are increasing or decreasing While it is tempting simply to compare the 2010 inventory with its 2005 counterpart the results would mean little As inventory methods develop and as additional sources are considered the estimate of total anthropogenic mercury emissions worldwide also changes While some changes reflect real trends others reflect changes in methods or scope Thus comparing the results of previous assessments with the present update requires considerable care and involves an understanding of the way in which these inventories have been produced and the uncertainties associated with them
It is possible however to compare certain sectors over time by attempting to compensate for any methodological changes between the various inventories since 1990
Emissions to air are thought to have peaked in the 1970s From 1990 to 2005 total anthropogenic emissions of mercury to the atmosphere appear to
Emissions to air t
1400
1200
1000
800
600
400
200
0
1990
1995
2000
2005
Africa Asia Europe Russia North Oceania South America America
Estimates of annual anthropogenic mercury emissions from different continentsregions 1990-2005
have been relatively stable with decreases in Europe and North America being offset by increases in Asia A reanalysis of the available inventories since 1990 however indicates that emissions from industrial sectors at least may be starting to increase again
The changes introduced in the 2010 inventory methodology prevent a straight-forward continuation of this analysis However an evaluation of trends for some sectors between 2005 and 2010 has been made by applying the new methodology to activity data for 2005 This comparison suggests a further slight increase in the combined amount of mercury emitted by industrial sectors (coal combustion production of cement pig iron and steel and non-ferrous metals) The following paragraphs describe the trend results for three sectors to illustrate some of the developments between 2005 and 2010 and some of the the difficulties in comparing emissions estimates between different years made with different methods
Coal burning for power generation and for industrial purposes continues to increase especially in Asia However increases in the application of air pollution controls including some mercury specific technologies together with more stringent regulations in a number of countries have reduced mercury emissions from coal burning in power plants in particular and thus offset some part of the emissions arising from increased coal consumption
In the United States for example emissions from coal burning at power plants have reportedly decreased from about 53 tonnes in 2005 to 27 tonnes in 2010 This decrease is largely due to new regulations that have resulted in changes in the sources of the coal that is burned in large power plants and the installation of mercury controls as well as controls on sulphur dioxide and particulates that have the co-benefit of further reducing mercury emissions
In China many of the new coal-fired power plants have state-of-the-art pollution controls installed
Emissions of mercury from artisanal and small-scale gold mining (ASGM) reported for 2010 are more than twice those reported for 2005 While the
16
UNEP Global Mercury Assessment 2013
Unintentional emission sectors Coal burning ferrous- and non-ferrous (Au Cu Hg Pb Zn) metal production cement production Intentional-use sectors Disposal and incineration of product waste cremation emissions chlor-alkali industry
Comparison of emissions in 2005 and 2010 by selected sector and region
Unintentional emission sectors
Emission t
1000
800
600
400
200
0 2005 2010
Australia New Zealand amp Oceania
Central America and the Caribbean
CIS amp other European countries
East and Southeast Asia
rise in the price of gold (from USD 400 per ounce in 2005 to USD 1100 per ounce in 2010) along with increased rural poverty may indeed have caused more activity in this sector the increased estimate for mercury emissions is considered to be due primarily to some more and better data from many countries and regions West Africa for example was regarded as having minimal ASGM in 2005 but is now recognized as a region with considerable activity Thus the baseline has improved without necessarily any change in actual activity or emission levels
Waste from consumer products is affected by the amount of mercury used For most products in which mercury is used mercury-free alternatives exist Consequently many of these uses of mercury are declining at least in some regions as alternative products or processes are adopted Compact fluorescent light bulbs are an exception Even though the mercury content of individual light bulbs has decreased use of this type of light bulb is increasing rapidly
Artisanal and small-scale gold mining Intentional-use sectors
1000 1000
Step change from 2005 to 2010 due to new information 800 800 (under-estimation in 2005)
600 600
400 400
200 200
0 0 2005 2010 2005 2010
European Union (EU27) South America
Middle Eastern States South Asia
North Africa Sub-Saharan Africa
North America
In order to make valid assessments of trends in emissions from global inventories comparable data on activity levels are required together with information on changes in fuel and raw material characteristics and applied air pollution control technology One aim of the 2010 inventory methods is to create a firmer foundation for such future trend analysis
Ralf Siemieniec Shutterstockcom
Use of mercury-containing energy-saving lamps is increasing
17
UNEP Global Mercury Assessment 2013
Emission scenarios and future trends The 2008 Global Atmospheric Mercury Assessment included a first attempt at projecting future emissions inventories These were based on three scenarios continuing with the status quo applying current emissions controls worldwide and achieving maximum feasible technological reductions At the time this effort was regarded as highly provisional Since then additional studies have extended and improved this work but the results are not markedly different from earlier projections of future mercury emissions
Global mercury models have been used to evaluate future scenarios Four global and hemispheric models projected mercury levels around the world in 2020 based on the three emission scenarios described earlier In industrial regions the status quo will cause an increase in mercury levels of 2-25 and in remote areas of 15-5 The two emission control scenarios on the other hand yield a decrease in mercury in industrial areas of 25-35 and in remote areas of 15-20
Another global model was coupled with estimates of surface reservoirs of mercury in order to quantify source-receptor relationships for the present and for 2050 Under the best-case scenario of maximum feasible reductions projected estimates for deposition in 2050 is similar to estimates for today In the other scenarios increasing emissions lead to increasing deposition A greater proportion of mercury emissions is expected to be in the oxidized form so that a greater proportion will be deposited near the source instead of being transported far away
The model results support the conclusion that reducing anthropogenic emissions will slowly reduce the amount of mercury in biologically available reservoirs Over time mercury in the environment will be taken out of circulation by natural processes for example from ocean waters down into sediments and biologically available mercury will decrease Increased emissions on the other hand will continue to build up the amount of mercury in circulation
With new databases and methods it may soon be possible to create scenarios that incorporate activity levels as well as technology use for each country If this were done it would allow countries to assess the effects of different mercury reduction strategies on their national emissions For example a country could determine the relative contributions of emission reduction technology as opposed to for example changes in raw materials
18
UNEP Global Mercury Assessment 2013
Atmospheric chemistry monitoring and trends 5 Forms of mercury in air Mercury in the atmosphere is in three primary forms Gaseous elemental mercury is the most common in anthropogenic and natural emissions to the atmosphere Gaseous oxidized mercury and mercury bound to particulates are less common The transport and deposition of atmospheric mercury depend greatly on whether the mercury is elemental or oxidized Elemental mercury stays in the atmosphere long enough for it to be transported around the world whereas oxidized and particulate mercury are more readily captured in existing pollution control systems or deposited relatively rapidly after their formation As a result most mercury in the air is in the gaseous elemental phase Relatively little elemental mercury is deposited directly but instead must fi rst be oxidized
Although gaseous oxidized mercury is very important in mercury cycling between air and other environmental compartments the process of oxidation in the air is poorly understood with reactions and resulting compounds yet to be verified in observations
When mercury moves from air to water and land it is generally in an oxidized gaseous or particulate form whereas when it is re-emitted to air it has been converted back to gaseous elemental
Particulate associated mercury
Pole
Equator
Gaseous elemental mercury
Global transport
Gaseous elemental mercury can be transported globally Mercury emitted in particulate form tends to deposit closer to sources
mercury Sunlight appears to play a large role in both oxidation and reduction of mercury but temperature and biological interactions are also likely to be involved to some degree Here too much uncertainty remains Nonetheless the reactions are important in determining net deposition and fate of mercury
Monitoring of mercury in air Monitoring of mercury in air focuses on the three primary forms of mercury The measurement of gaseous elemental mercury is routine and robust Measuring gaseous oxidized mercury and particulate-bound mercury however is challenging Concentrations are typically very low and these forms are chemically unstable leading to high uncertainty in the measurements Nonetheless these forms are critical for defining and modelling the fate and transport of airborne mercury
In the past two decades coordinated mercury monitoring networks and long-term monitoring sites have been established in a number of regions measuring mercury concentrations in the air as well as deposition of mercury in precipitation In Europe and North America high-quality continuous monitoring has been going on for more than 15 years especially in the Arctic High-quality monitoring has started more recently in East Asia and South Africa as part of a global effort to expand the coverage provided by long-term monitoring sites
Measurements and trends in atmospheric mercury Monitoring stations around the world have provided information about trends in atmospheric mercury though the time periods vary depending on how long the site has been active Overall a declining trend in background mercury levels over the past decade has been recorded from monitoring stations
19
UNEP Global Mercury Assessment 2013
in many regions Other regions however show an increase in mercury levels
The sites also provide information about geographical patterns reflecting both background levels of
Trends in atmospheric measurements of mercury
Site(s) Period
Mace Head Ireland 1996-2011
North America rural sites 1995-2005
High Arctic sub-Arctic Up to 20 years of records mid-latitudes
Monitoring networks Mercury monitoring in Europe is carried out under the European Monitoring and Evaluation Programme (EMEP) one of the first international environmental measurement networks Heavy metals such as mercury have been included in the EMEP program since 1999 Mercury measurements are available only from northern and northwestern Europe
Three monitoring networks currently operate in North America providing good coverage of Canada and the United States the Mercury Deposition Network the Canadian Air and Precipitation Monitoring Network and the Atmospheric Mercury Network More recently new sites have been established in Mexico extending coverage on the continent The stations monitor atmospheric mercury and mercury in precipitation which has measured since the mid-1990s Monitoring of mercury in the air and in precipitation has been underway in Asia for nearly a decade
Alert Nord
Point Barrow
Nuuk Stoacuterhoumlfethi
Mace Head
mercury and local and regional influences Mercury concentrations at remote sites in Asia are higher than in other regions of the Northern Hemisphere Coastal cities in China have lower levels than inland sites likely due to the influence of relatively clean
Measurement Trend
Gaseous elemental mercury Decrease of 14-18 per year
Total gaseous mercury Decrease of 22 to 174 in total
Total gaseous mercury Decreasing trend at some stations increasing at others
The monitoring network of the Arctic Monitoring and Assessment Programme (AMAP) includes air and deposition monitoring sites located in Arctic regions of Canada Greenland Iceland Norway Russia and Sweden
Building on existing national and regional monitoring networks the European Union-financed project
ldquoGlobal Mercury Observation Systemrdquo (GMOS) started in November 2010 Its goal is to develop a coordinated global system for monitoring mercury including a large network of ground-based monitoring stations New sites are being installed in regions where few monitoring stations exist especially in the Southern Hemisphere Two sites have been established in Antarctica one on the Antarctic Plateau and one on the coast
Ny-Aringlesund
Amderma Pallas
Raringouml Bredkaumllen
Listvyanka Diabla Gora
Mauna Loa
Mt Bachelor
Celestuacuten Calhau
Longobucco
Iskrba Niembro Monte Cimone Cap
Ferrat Mt Waliguan Ganghwa Island
Lulin
Cape Hedo Ev-K2
Mt Changbai
Minamata Mt Ailao
Nieuw Nickerie
Kodiakanal
Maheacute Island Manaus
Bariloche Cape Point
Amsterdam Island Cape Grim
Dumont drsquoUrville
AMAP CAMnet EMEP GMOS GMOS associated NADPAIRMoN NADPMDN
Air + precipitation Air Precipitation
20
UNEP Global Mercury Assessment 2013
John Munthe
The mercury background air monitoring station at Zeppelin mountain Svalbard
air from over the ocean Sites off the Asian coast however show higher levels of gaseous elemental mercury than the Northern Hemisphere background suggesting an outflow from the Asian mainland
Weather patterns have also been found to have a strong influence on seasonal patterns in mercury levels in the air at monitoring sites At the Mount Waliguan Observatory on the Tibetan Plateau for example northeasterly and easterly winds produced the highest levels of mercury
Measurements at high altitudes Measurements from ground-based stations above 2700 meters suggest that there is an inverse relationship between gaseous elemental mercury and gaseous oxidized mercury at these elevations In other words when there is more elemental mercury there is less oxidized mercury and vice versa These measurements are in good agreement with modelling results which gives additional confidence in current understanding of the behaviour of mercury at high altitude
An inverse relationship between total gaseous mercury and particulate concentration has also been observed in the high stratosphere From the transformation rate of total gaseous mercury to particulate-bound mercury it appears that gaseous mercury lasts about two years in the stratosphere
21
UNEP Global Mercury Assessment 2013
Atmospheric concentrations and deposition 6 Measurements and trends of mercury in precipitation Mercury deposited by precipitation decreased from the 1990s into the 2000s at many but not all sites in North America and Western Europe where such measurements were taken
Regional patterns are also evident including slightly higher levels in southern Europe than northern Europe and higher levels in Asia than in North America Total mercury concentrations in precipitation in China were much higher than those in Japan and South Korea Th is was mostly attributed to higher levels of gaseous oxidized mercury and particulate-bound mercury which are readily deposited by precipitation and thus not transported far
A comparison of data from Canadian and American monitoring sites found that deposition of mercury in precipitation was highest in summer
Dry deposition of mercury which is deposition not associated with precipitation is diffi cult to measure and consequently there is little information on trends in mercury dry deposition Th is lack of information means that it is also diffi cult to validate model results for dry deposition
106 44
474 72 91
5 7 71
05 1 5 10 100 500 1000
Total mercury emission (2005) kgcell
Modelled mercury air concentrations and deposition patterns Atmospheric mercury concentrations are highest in major industrial regions Models examining global patterns show that East and South Asia Europe North America and South Africa have the highest levels of elemental mercury in the air Concentrations are generally lower in the Southern Hemisphere than the Northern Hemisphere because most industrial activity is in northern regions Th ese model results are based on simulations using the 2005 global mercury emission inventory because the 2010 inventory has only recently become available
Intercontinental transport of mercury in the air has been examined to determine its impact on regional mercury levels Four models using diff erent parameters produced consistent results Depending on the region mercury emitted by distant sources contributes between 10 and 30 of annual mercury deposition Where local sources are low mercury transported from distant emission sources can account for more than half of the deposition East Asia is the dominant source region adding 10-14 to the deposition in
Contribution from sources outside receptor region
Model 40
GEOS-Chem GLEMOS GRAHM CMAQ-Hg
30
20
10
0 Arctic Europe North East Asia South Asia
America
Receptor region
(Left ) Global distribution of anthropogenic mercury emissions in 2005 with source regions that were considered in the analysis (North America South America Europe Africa Central Asia South Asia East Asia Australia and Oceania) and (right) the contribution of anthropogenic sources outside a particular receptor region to deposition within the receptor region
22
UNEP Global Mercury Assessment 2013
Modelling atmospheric transport and deposition Global models reproduce the movement of mercury in the atmosphere during which the mercury may move between continents They have been effective in examining sources of mercury to the Arctic and also for examining the outflow of pollution from South and Southeast Asia and its impact on western North America as well as the flow from eastern North America to Europe
Regional models on the scale of a continent or a basin such as the Mediterranean can provide more detail about specific source areas even to the level of individual industrial areas Reliable results however require a detailed understanding of mercury oxidation in the atmosphere about which there is considerably uncertainty
Most atmospheric transport models consider the full chain of mercury processes in the atmosphere Some models also consider how mercury is cycled in other atmospheric compartments such as soil vegetation snow freshwater and seawater
One of the largest sources of uncertainty in mercury models is the chemical mechanism used to determine how mercury changes forms in the air Improved experimental data can help improve model performance by making sure that the correct reactions are simulated The processes that lead from deposition to re-emission also need to be understood better Advances in this area show promise with model results becoming closer to estimates based on experimental data
other regions of the world Natural emissions and re-emissions account for 35-70 of total deposition in most regions Deposition is generally greater in low and mid-latitudes due to stronger sunlight higher concentrations of oxidants and higher precipitation
Regional mercury models show patterns at the scales of continents or individual seas The Mediterranean Sea for example is a net source of mercury as it emits more than is deposited to it In that region dry deposition generally exceeds deposition of mercury in precipitation In Central and Southern Europe total gaseous mercury concentrations and deposition in precipitation were both consistently higher than the European average
Across the United States dry deposition accounts for two-thirds of total annual deposition mainly from gaseous oxidized mercury A study examining sources and deposition of mercury to assess the
benefits of proposed emission control measures found that mercury transport from outside the country accounts for 68 of mercury deposition in the Northeast and up to 91 in the west-central United States Large point sources contribute up to three-quarters of nearby deposition and power plants contributed half of the deposition in the eastern part of the country This suggests that new emissions standards would primarily benefit eastern regions of the US
In Asia studies show high seasonal variation in mercury concentration and deposition Anthropogenic emissions are responsible for about 75 of deposition in East Asia In this region there is a net removal of gaseous oxidized mercury from the atmosphere and a net export of gaseous elemental mercury
In the Arctic gaseous elemental mercury levels in the atmosphere are depleted rapidly in spring when after the long Arctic winters sunlight returns Ozone is depleted at the same time and it is believed that bromine-containing compounds are the cause of the photo-chemical reactions that deplete ozone and mercury During these events gaseous oxidized mercury and particulate-bound mercury levels increase sharply suggesting that the gaseous mercury is oxidized and deposited enhancing mercury deposition in Arctic areas in springtime Recent research however has found that 50-80 of the deposited mercury is re-emitted within a few days Similar springtime mercury depletion events have been seen in Antarctica
23
UNEP Global Mercury Assessment 2013
Anthropogenic releases to the aquatic environment 7 Global assessment Previous UNEP global mercury assessments only considered emissions to the atmosphere The 2013 Report presents the first attempt at compiling a global inventory of mercury releases to aquatic environments Releases directly into the aquatic environment present a completely different chemistry set of pathways and fate to those released to air They are also more directly linked to the risks posed by mercury to global environmental and human health Unlike mercury releases to air which are predominantly in the form of gaseous elemental mercury releases to water are predominantly inorganic mercury and to a lesser extent liquid elemental mercury
At present only some sources of aquatic releases can be quantified with any confidence Thus many sources that may be important are not included in this first assessment of global aquatic releases For example land management practices that expose new geological sources of mercury in rocks and mineral soils or that re-mobilize previously deposited mercury cannot yet be assessed Two broad categories of current anthropogenic sources are considered here point sources of mercury release to water and diffuse releases of mercury as a result of its remobilisation from areas where it was previously deposited or accumulated due to human activity (ie contaminated sites) Artisanal and small-scale gold mining (ASGM) mercury-containing pesticides and fungicides used in agriculture and deforestation are considered separately
Point source releases to water from various sectors in tonnes per year with the range of the estimate and as a percentage of total anthropogenic emissions
Sector Releases (range) tonnes
Non-ferrous metal production 925 (193 - 268)
Consumer product waste 894 (222 - 308)
Chlor-alkali production 28 (10 ndash 55)
Oil refining 06 (03 ndash 1)
Grand Total 185 (426 ndash 582)
The global estimate of mercury release to water from point sources has been derived from the atmospheric emissions assessment and the approach employed in the UNEP Toolkit to partition total mercury releases between air land and water This approach has considerable uncertainty and may omit sectors where releases to water are high but air emissions are unimportant and therefore not addressed in the inventory Global releases from point sources were estimated to be 185 tonnes per year
For diffuse sources evaluating the relative contribution of anthropogenic and natural sources to the aquatic environment requires determining considerations of the various mercury inputs For some sectors data exist that allow a preliminary assessment of the amounts of mercury re-mobilized into aquatic systems
For mercury-contaminated sites the range of average soil concentrations of mercury reported for sites where mercury was mined used or otherwise released by human activity was considered The area of contamination is then used to determine how much mercury is available in soils and when combined with a factor for how much mercury is released from those soils in a year the total release can be estimated Among identified contaminated sites mercury mining is identified as the largest sector followed by mining of precious metals Total releases to aquatic environments from contaminated sites are estimated to be 83-335 tonnes per year
Releases to water from contaminated sites in tonnes per year with the range of the estimate
Sector Releases (range) tonnes
Primary mercury mining sites 67 ndash 266
Precious metal production sites 14 ndash 55
Non-ferrous metal production sites 01 ndash 05
Chlor-alkali production sites 01 ndash 05
Other industrial sites 01 ndash 03
Grand Total 83 ndash 335
24
UNEP Global Mercury Assessment 2013
Much of the mercury released from artisanal and small-scale gold mining goes into rivers lakes soils and sediments and tailings From soils and tailings it may be re-mobilized by leaching and erosion In addition mining may disturb mercury-containing soils and sediments that may then erode more quickly releasing more mercury than would otherwise have become available from natural erosion A key factor in these processes is the local hydrological cycle of precipitation evaporation run-off and river flow To account for this in the assessment countries were designated as dry wet or intermediate to determine the relative importance of erosion The tropical and subtropical countries which have the greatest activity in this sector also tend to experience high precipitation and run-off exacerbating this source of mercury release and re-mobilization Total worldwide releases of mercury to land and water from ASGM were estimated at over 800 tonnes per year How much of this is released to water cannot yet be determined
Mercury continues to be used in pesticides and fungicides 2100 tonnes of mercury were released in the decade of the 1960s through such agrochemical uses Current data are unavailable although the use of mercury in these products has been greatly reduced
Deforestation especially in the Amazon Basin can lead to extensive soil erosion and thus the release of mercury previously accumulated in soils Using 2010 figures for deforestation rates around the world and an estimate of soil concentrations of mercury as much as 260 tonnes of mercury may have been released into rivers in 2010 as a result of deforestation worldwide
Because this is the first attempt to quantify global mercury releases to the aquatic environment there is no previous measurement against which these results can be compared Thus it is not possible at this time to evaluate trends in releases
Uncertainties in release estimates Estimating global releases of mercury to aquatic environments is being done here for the first time Many data are missing and others are imprecise A number of assumptions have been made based on what measurements are available or on other grounds to extrapolate from known quantities or to calculate aquatic releases in relation to atmospheric
or other emissions Thus the results should be treated with great caution It is nonetheless clear that anthropogenic sources and human activity contribute hundreds of tonnes of mercury to aquatic environments each year a substantial amount relative to estimated natural releases 150-960 tonnes per year from terrestrial environments
Lapshin Shutterstockcom
Phil Augustavo istockphotocom
Bureau of Land Managem
ent
Contaminated sites (top) erosion following deforestation (middle) and a flooded store of mercury-contaminated waste (lower) illustrate potential sources of mercury releases to water
25
UNEP Global Mercury Assessment 2013
Aquatic pathways transport and fate 8 Mercury in aquatic environments The pathways and fate of mercury in aquatic environments are important because it is in waters sediments and wetland soils that inorganic mercury is converted into methylmercury which is toxic and concentrates in animals The majority of human exposure to mercury and the health risk that comes with mercury exposure is from consumption of marine foods Thus this section focuses on the worldrsquos oceans Some freshwater systems however are important sources of fish for human consumption especially for subsistence and recreational fisheries often among indigenous peoples Artisanal and small-scale gold mining (ASGM) communities may also be affected through fish consumption and drinking water if those are contaminated by local releases
The major processes of mercury cycling are generally similar for all aquatic systems Inorganic mercury in dissolved or particulate form is the dominant mercury type in most marine and fresh waters Dissolved gaseous elemental mercury accounts for less than 30 of total mercury in water Methylmercury is often present at trace levels but may in some settings reach 30 of total mercury In freshwater and coastal environments inorganic mercury is transformed into methylmercury primarily in sediments In the open ocean this conversion takes place largely at intermediate depths between 200 and 1000 meters in the water column Mercury is lost from aquatic systems in two ways When inorganic mercury is reduced to elemental mercury it can be re-emitted to the atmosphere When inorganic mercury binds to particulates in water it can settle out rapidly and be buried in sediments Deep burial in ocean sediments is one of the major pathways by which mercury is removed from the biologically active environment
The global mercury cycle is chemically and physically complex Thus it is necessary to use models to study describe and predict what happens and will happen to mercury in the aquatic environment Until recently only one model existed that incorporated
air land and water into a unified whole The model has been validated against observations of mercury and represents the current scientific consensus The largest potential errors in this model in terms of the aquatic cycle concern details of the exchange of mercury between air and water
Pathways and fate of mercury in the oceans Model simulations suggest that anthropogenic impacts on mercury levels in the ocean are greatest in the surface waters the top 100 meters or so of the water column While model results vary one recent estimate suggests that anthropogenic emissions over the last 100 years have doubled the concentration of mercury in the surface layer of the ocean and increased it by 25 in intermediate waters and by 10 in deep waters The difference is due to the length of time it takes for surface waters to circulate to the depths
Models and measurements agree that direct deposition from the atmosphere is the dominant pathway by which mercury reaches the oceans The exceptions are smaller semi-enclosed basins such as the Mediterranean Sea or the Arctic Ocean where river runoff coastal erosion and ocean currents
Ugo M
ontaldo Shutterstockcom
26
UNEP Global Mercury Assessment 2013
account for about half of mercury inputs The most recent modelling effort suggests that total deposition input of mercury to the oceans in 2008 was 3700 tonnes
Other mercury pathways appear less important on a global basis Rivers are estimated to carry more than 2800 tonnes of mercury each year but only about 380 tonnes of this is transported offshore The rest is trapped by particles in estuaries Groundwater and re-mobilization from sediments provide 100shy800 tonnes of mercury to the oceans each year Undersea hydrothermal vents add less than 600 tonnes of mercury to the oceans There are high concentrations of mercury in vent fluids but a great deal of the mercury is precipitated as solids once the vent fluids enter seawater
Models suggest that globally about 70 of the mercury deposited into the ocean is re-emitted to the atmosphere Oxidized mercury in surface waters is reduced by biological and photochemical processes to the elemental form that is volatile and readily re-emitted The removal of this mercury ultimately reduces the pool of mercury that could be converted to methylmercury and be accumulated by marine organisms The re-emission process thus simultaneously prolongs the lifetime of mercury cycling through the atmosphere and upper ocean and acts to reduce mercury availability for marine food webs
Any changes in the efficiency of mercury reduction in surface waters or the rate of re-emission is likely to impact mercury concentrations in surface waters and the air One example is the effect of sea ice in the Arctic Ocean which blocks the re-emission
Tony Magdaraog Shutterstockcom
Mercury accumulated in marine food-webs can enter the human diet
of elemental mercury leaving elevated levels in waters under ice Changes in primary productivity could change the rate at which mercury is bound to particles thus affecting re-emission to the atmosphere as well as rates of downward transport in the ocean Changes in oxidant levels in the atmosphere such as ozone and bromine may also influence the rate of oxidation of gaseous elemental mercury and thus deposition rates to the ocean
Methylmercury in the ocean Natural bacterial processes in seawater and in sediments in coastal environments convert inorganic mercury to methylmercury Methylmercury levels are highest in the subsurface waters of many oceans because it is formed at these intermediate depths likely as a result of the decomposition of organic material falling from surface waters Current understanding indicates that about 300 tonnes of methylmercury is produced in the upper ocean by this and related processes By contrast only about 80 tonnes of methylmercury reaches the ocean from other sources such as atmospheric deposition rivers and diffusion from sediments
Current modelling indicates that methylmercury stays in the upper ocean for about 11 years Deshymethylation by photochemical reaction or by microbial activity is the major removal process for methylmercury in the ocean About 240 tonnes of methylmercury is removed by this process from the surface waters of the ocean per year
The other important pathway for methylmercury in seawater is uptake into marine food webs Although only about 40 tonnes per year is taken up in this way it is this fraction that poses risks to marine animals and human consumers of seafood Methylmercury is a problem for several reasons First it is taken up by plankton much more efficiently than is inorganic mercury resulting in concentrations in plankton that are as high as 10000 times the concentration in seawater Second methylmercury is absorbed through the intestine of animals much more easily than is inorganic mercury Third methylmercury biomagnifies as it moves up the food web Thus methylmercury becomes an increasingly greater proportion of the mercury in organisms higher in the food web This explains why some indigenous populations that consume top marine predators such as fish seals and whales have some of the worldrsquos highest concentrations of methylmercury giving rise to health concerns
27
UNEP Global Mercury Assessment 2013
Pathways and fate of mercury in freshwater Observations and modelling both show that there are in general many similarities between mercury chemistry pathways and fate in lakes and in the oceans but with obvious differences in scale and in the relative importance of different processes Modelling of mercury dynamics was done for four lakes with a history of direct mercury inputs from the largest freshwater lake in the world (Lake Superior) to small lakes in Ontario Canada Atmospheric deposition and river inflow were the main sources of inorganic mercury Much of the mercury input from lake and river catchments was associated with dissolved and particulate organic matter The dominant mercury removal mechanisms as in saltwater were burial in sediments and photochemical reduction of oxidized mercury to elemental mercury followed by re-emission to the air In Lake Superior and Lake Michigan there is evidence for methylation of mercury in the water column as is seen in the open ocean
Methylmercury levels in freshwater fish vary with the level of deposition of mercury from the air though other factors such as inputs from the watershed and the number of trophic levels within the lakersquos food web are also important Methylation predominantly occurred in lake sediments and wetlands and floodplain soils where sulphateshyreducing bacteria are believed to be primarily responsible Methylmercury is de-methylated in sediments and also taken away in the outlet river from each lake
Some 400-1400 tonnes of mercury are estimated globally to be trapped behind dams and other man-made impoundments each year This has in many cases led to significant increases in total mercury and methylmercury levels in water and of methylmercury in fish and other aquatic species When artificial lakes are created plant material is submerged leading to decay and anoxia In these conditions microbially driven methylation of inorganic mercury takes place In some cases the elevated mercury levels have also been observed downstream from the artificial lakes and reservoirs
Anthropogenic impacts on aquatic mercury levels Two studies have reported that the Atlantic and Pacific Oceans have shown opposing trends over recent decades While the influence of changing ocean currents and other oceanographic factors may be a factor the trends do make sense in light of patterns of anthropogenic emissions In the North Pacific Ocean mercury concentrations appear to have increased at depths between 200 and 1000 meters over the last few decades This increase coincides with the rapid industrialization of East Asia
In the North Atlantic however results from near Bermuda suggest a substantial decrease in mercury concentration and a change in the mercury profile through the water column The Mediterranean Sea too showed a decrease in mercury concentration between 1990 and 2004 These findings are consistent with atmospheric data from around the North Atlantic The conclusion is that mercury levels in seawater in the North Atlantic were elevated by human activity but may now be declining likely as a result of decreased emissions from North America and Europe
A complementary approach to measuring mercury in seawater is to measure mercury in aquatic animals which accumulate and integrate mercury over time Teeth hair feathers and eggshells are useful long-term archives of mercury concentrations and can provide data from the pre-industrial period (ie before 1800) as well as more recent periods
Among marine animals samples are available from several regions particularly from the Arctic where cold dry conditions help preserve animal tissues Mercury concentrations between the 13th and 16th
centuries were relatively stable From the mid- to late 19th century to the end of the 20th century mercury levels increased by an average of 12 times On average therefore about 92 of the mercury in Arctic marine wildlife today is likely to be of anthropogenic origin
Similar findings were found for a 700-year sequence of seabird eggshells from the South China Sea Mercury levels increased steadily between 1800 and 2000 with a particularly rapid increase after 1970 Concentrations since 2000 are about 10 times higher than pre-industrial levels with 91 of the mercury now likely to be of anthropogenic origin In the Antarctic studies of seal hairs show that pre-industrial mercury levels were only 60 of recent levels The relatively small difference
28
UNEP Global Mercury Assessment 2013
Historical Hg concentration as a proportion of present-day 100
80
60
40
20
0
Beluga teeth Human teeth
Gyrfalcon feathers Perigrine falcon feathers
Polar bear hair Ringed seal teeth
1200 1300 1400 1500 1600 1700 1800 1900 2000
between pre-industrial and modern mercury levels in Antarctic is consistent with lower mercury emissions and atmospheric concentrations in the Southern Hemisphere as compared with the Northern Hemisphere
The timing of long-term increases of mercury in aquatic animals can shed light on the likely sources of mercury emissions that were responsible The industrialization of Europe and North America appear responsible for the large increases in marine mercury levels that began in the 19th century as these increases occurred prior to recent Asian industrialization As with water concentrations in the Pacific Ocean recent rapid increases in mercury in seabird eggs in the South China Sea coincide with industrialization in Asia
The time lag in aquatic ecosystem response One important conclusion from air-ocean modeling is that the oceans have not yet reached equilibrium with current atmospheric levels of mercury This lag is due to several factors First mercury stays in the upper ocean above 200 meters depth for about 30 years and for centuries in intermediate and deep waters This is much longer than the one year residence time in the lower atmosphere Thus removal from the ocean takes much longer than does removal from the air and so concentrations will change more slowly
Second because of the long lifetime of mercury in deeper ocean waters a great deal of natural mercury is present in the ocean already about 100000 tonnes out of a total of 135000 tonnes in intermediate waters and 200000 out of 220000 tonnes in deep waters
Rune Dietz
Analysis of museum samples reflects the increase in mercury emissions and releases since the mid-19th century associated with anthropogenic activities
Third vertical transport of mercury from intermediate depths back to the surface returns a substantial amount of mercury to the biologically active zone each year As a result average mercury concentrations in seawater and marine animals are likely to increase slowly for decades if not centuries even if atmospheric levels stabilize at present levels In short the effects of historical anthropogenic emissions from Europe and North America are still being observed in the oceans at the same time that the effects of the recent rise in emissions from Asia are being seen
Regionally different trends can be expected depending on distance from sources and ocean circulation patterns In the North Atlantic north of 55deg N it will take 50-600 years to achieve equilibrium between atmospheric and seawater mercury levels In the North Pacific this process is estimated to take 500-700 years and in the Antarctic 700-1000 years The Arctic Ocean by contrast is smaller and will only take about 35 years to reflect changes in atmospheric mercury levels Surface waters of the Mediterranean Sea should show also changes within 10-50 years
Time lags in the responses of many freshwaters and their food-webs to changes in atmospheric mercury levels are also expected Although some immediate recovery following reductions in atmospheric mercury deposition rates is likely full recovery may take decades centuries or longer depending on the characteristics of the area Highly polluted freshwaters with catchments and sediments containing large amounts of anthropogenic mercury will recover most slowly as is already observed around point sources such as smelters that have closed down
29
UNEP Global Mercury Assessment 2013
Major gaps in knowledge 9 Large uncertainties remain in global estimates of mercury emissions to the air These stem from various sources including the availability of information on activity levels but mainly from the lack of information concerning the mercury content of some raw materials and the validity of assumptions regarding processes and technologies employed to reduce mercury emissions including their rates of application and effectiveness The accuracy and precision of measurement-based estimates can depend on the validity of extrapolating measurements made at infrequent intervals to longer periods or measurements made at one plant to other facilities with similar operations
Potentially important emissions sectors that are still not quantified in the emissions inventory include the use of mercury in vinyl-chloride monomer production secondary metals production oil and gas extraction transport and processing industrial and hazardous waste incineration and disposal sewage sludge incineration and dental fillings preparation and removal
Current measurements and their evaluation are inadequate for determining spatial and temporal trends Improved more extensive and better coordinated measurements are needed A permanent global integrated monitoring network for atmospheric mercury and mercury deposition is needed to achieve this goal The atmospheric network sites should be closely integrated with water soil and biological monitoring networks The results can be used for model testing and evaluation as well as for more accurately detailing the geographic impact of anthropogenic emissions Monitoring of mercury concentrations in the important marine food species is essential to understanding possible human health impacts and the effects of future emissions changes
Better data on mercury distribution in the troposphere is needed to improve understanding of long-range transport and source-receptor relationships Coordinated studies at high altitudes and by aircraft are needed This information will
also help validate regional and global scale models improving their prediction capabilities with regard to different policy scenarios
Key processes related to global transport and cycling of mercury remain inadequately understood The chemical form of gaseous oxidized mercury is unknown Reduction and oxidation rates for mercury in the presence of atmospheric oxidants need further study including determining which oxidants are important New measurements and modelling studies are needed to examine key chemical and physical processes that affect global transport and cycling
Few data are available for reporting mercury releases to aquatic systems Systematic and consistent monitoring of mercury releases to the air is required especially for contaminated systems Releases of mercury from soils into waters depend greatly on climate and topography and these parameters need to be better accounted for Consistent approaches for measuring and reporting releases from point sources are needed to ensure comparability of data from around the world In particular the actual role of artisanal and small-scale gold mining (ASGM) in emissions to air and releases to water needs to be more accurately estimated
The link between mercury deposition methylation and uptake by living organisms needs further study The parameters that determine the rates of exchange of mercury compounds between air and sea air and soil and air and vegetation are not fully understood Whole-ecosystem studies of mercury are needed to better understand biogeochemical cycling Methylationdemethylation rates and their spatial and temporal variations and relationship to climatic factors need to be determined in most of worldrsquos major ocean basins as well as in representative freshwaters
30
UNEP Global Mercury Assessment 2013
Key findings of the 2013 assessment 10 Atmosphere Total anthropogenic emissions of mercury to the atmosphere in 2010 are estimated at 1960 (1010shy4070) tonnes which is about 30 of the total mercury that was emitted and re-emitted from anthropogenic and natural sources in that year The largest anthropogenic sources are associated with artisanal and small-scale gold mining (ASGM) and coal burning which together account for about 62 of the annual total anthropogenic emissions to air Other major sectors include ferrous and non-ferrous metal production and cement production
East and Southeast Asia are responsible for about 40 of global anthropogenic emissions About 75 of the mercury from this region comes from China which is about one-third of the global total Increased estimates for emissions from ASGM largely a result of newly obtained data and improved information mean that South America and Sub-Saharan Africa are also responsible for a greater proportion of global emissions than was previously assumed
Anthropogenic emissions over time have increased mercury loads present in the environment This leads to higher rates of re-emission and also means that there will be a time lag of years or decades between emissions reductions and lower mercury levels in the food web including pathways of human exposure
Mercury emissions to the atmosphere likely peaked in the 1950s to 1970s and subsequently declined because of reductions in Europe Russia and North America Emission trends are unclear due to changes in methods employed to produce inventories and differences in the sectors that have been accounted at different times There are however some indications that emissions may be rising again with increases from East Asia offsetting continuing reductions in Europe and North America
Aquatic environments Natural processes in aquatic systems convert less toxic elemental and inorganic mercury into much more toxic methylmercury Methylmercury concentrates and accumulates in the food web leading to high concentrations in some species of seafood and fish that many people eat
Anthropogenic releases of mercury to aquatic environments contribute hundreds of tonnes to the amount of mercury cycling in the environment Diffuse releases and point sources appear equally important Atmospheric deposition however remains the most important input of mercury to land and oceans and has increased the amount of mercury in many environmental compartments by a factor of two or three since the start of the industrial age On land mercury that is deposited is largely retained in soils and vegetation increasing the available pool for re-mobilisation to adjacent aquatic systems Re-emission from soils however is a major addition to atmospheric mercury
Hydrology is the most important factor in the transport of mercury from catchments to downstream environments Relatively little of this mercury reaches the open ocean as most is captured in sediments behind dams in estuaries and near the coast Changes in land cover and land use can have a large effect on mercury mobilisation as exposed soils erode and mercury leaches into the water table
Concentrations of mercury in Arctic marine animals today are about 10-12 times higher than in preshyindustrial times (ie prior to about 1800) This means that on average about 92 of the mercury in marine predators such as seabirds seals and whales is anthropogenic in origin The timing of the increase suggest that 19th and early 20th century emissions from Europe North America and Russia were responsible Increases mercury concentrations in seabirds in the South China Sea appear to be more recent than the Arctic increases coinciding with increasing industrialisation in East and Southeast Asia
31
UNEP Global Mercury Assessment 2013
K+S Entsorgung Gm
bH
Recovered mercury is being stockpiled at long-term storage sites above- and as shown here below ground
The upper 100 meters of the oceans have twice the mercury that they did a century ago Intermediate and deeper waters have 10-25 more mercury on average reflecting the slow transport of mercury downwards in the oceans Seawater concentrations will thus be especially slow in responding to changes in mercury inputs from atmospheric deposition and river flow As a result mercury concentrations in marine biota are likely to increase slowly for decades to centuries even without an increase in atmospheric emissions
In freshwater ecosystems atmospheric deposition and re-mobilisation from soils slow the reduction of mercury levels even in regions where atmospheric concentrations have decreased due to emission controls
Further increases in atmospheric emissions will have long-term consequences for commercial fisheries and all consumers of marine and freshwater foods
It is likely to be years or decades before reductions in anthropogenic emissions and releases of mercury have a demonstrable effect on mercury levels throughout the environment and in the fish and marine mammals which are part of the human food-chain This only reinforces the need to act now to continue and strengthen international efforts to reduce current mercury emissions and releases Delays in action now will inevitably lead to slower recovery of the worldrsquos ecosystems in future from mercury contamination leaving an even greater legacy of pollution for future generations
32
Division of Technology Industry and Economics (DTIE) Chemicals Branch Geneva Switzerland January 2013
Job number DTI1636GE
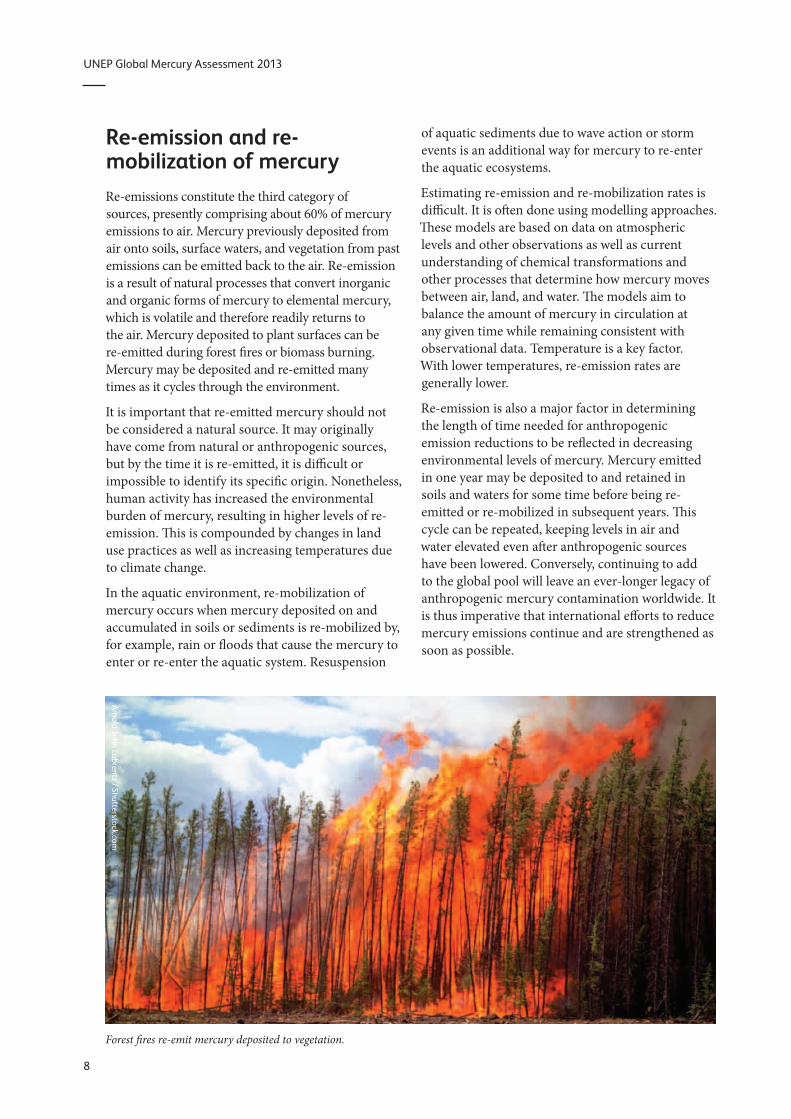
UNEP Global Mercury Assessment 2013
Arnold John Labrentz Shutterstockcom
Re-emission and re-mobilization of mercury Re-emissions constitute the third category of sources presently comprising about 60 of mercury emissions to air Mercury previously deposited from air onto soils surface waters and vegetation from past emissions can be emitted back to the air Re-emission is a result of natural processes that convert inorganic and organic forms of mercury to elemental mercury which is volatile and therefore readily returns to the air Mercury deposited to plant surfaces can be re-emitted during forest fires or biomass burning Mercury may be deposited and re-emitted many times as it cycles through the environment
It is important that re-emitted mercury should not be considered a natural source It may originally have come from natural or anthropogenic sources but by the time it is re-emitted it is difficult or impossible to identify its specific origin Nonetheless human activity has increased the environmental burden of mercury resulting in higher levels of re-emission This is compounded by changes in land use practices as well as increasing temperatures due to climate change
In the aquatic environment re-mobilization of mercury occurs when mercury deposited on and accumulated in soils or sediments is re-mobilized by for example rain or floods that cause the mercury to enter or re-enter the aquatic system Resuspension
of aquatic sediments due to wave action or storm events is an additional way for mercury to re-enter the aquatic ecosystems
Estimating re-emission and re-mobilization rates is difficult It is often done using modelling approaches These models are based on data on atmospheric levels and other observations as well as current understanding of chemical transformations and other processes that determine how mercury moves between air land and water The models aim to balance the amount of mercury in circulation at any given time while remaining consistent with observational data Temperature is a key factor With lower temperatures re-emission rates are generally lower
Re-emission is also a major factor in determining the length of time needed for anthropogenic emission reductions to be reflected in decreasing environmental levels of mercury Mercury emitted in one year may be deposited to and retained in soils and waters for some time before being re-emitted or re-mobilized in subsequent years This cycle can be repeated keeping levels in air and water elevated even after anthropogenic sources have been lowered Conversely continuing to add to the global pool will leave an ever-longer legacy of anthropogenic mercury contamination worldwide It is thus imperative that international efforts to reduce mercury emissions continue and are strengthened as soon as possible
Forest fires re-emit mercury deposited to vegetation
8
UNEP Global Mercury Assessment 2013
Anthropogenic emissions to the atmosphere 3 Global emissions inventory The global emissions inventory for 2010 estimates that 1960 tonnes of mercury was emitted to the atmosphere as a direct result of human activity The leading sectors remain the same as those identified in the 2005 inventory Improved data however have changed the relative contributions of some of these sectors as have some actual changes in emissions All coal burning emissions taken together for example represent a lower percentage of the total emissions than in the 2005 inventory This is due in part to the increased estimates from artisanal and small-scale gold mining (ASGM) and in part to much lower estimates for domestic use of coal When the actual amount of mercury emitted from coal combustions in power generation and industrial uses is considered and the estimates are based on the same 2010 methodology the emissions in 2010 are the same and perhaps slightly higher than in 2005 Even though new coal-fired power plants are being built combustion efficiency and emissions controls are also improving in most parts of the world
Results by selected sector The updated inventory of emissions to air confirms coal burning as a continuing major source of emissions responsible for some 475 tonnes of mercury emissions to air annually compared with around 10 tonnes from combustion of other fossil fuels According to the new inventory more than 85 of these emissions are from coal burning in power generation and industrial uses In the previous assessment emissions from domestic and residential coal burning were highlighted as a possible larger contribution Better information on coal consumption for domestic and residential uses indicates that these activities are a smaller contribution to total emissions from coal burning than previously thought
Emissions from the cement production industry are largely dependent on the raw materials and the fuels used The new inventory avoids double
Emissions from various sectors in tonnes per year with the range of the estimate and as a percentage of total anthropogenic emissions Note These numbers cannot be compared directly with those presented in the 2008 assessment (see Chapter 4 Trends in mercury emissions to the atmosphere)
Sector Emission (range) tonnes
By-product or unintentional emissions
Fossil fuel burning
Coal burning (all uses) 474 (304 - 678) 24
Oil and natural gas burning 99 (45 ndash 163) 1
Mining smelting amp production of metals
Primary production of 455 (205 ndash 241) 2 ferrous metals
Primary production of nonshy 193 (82 ndash 660) 10 ferrous metals (Al Cu Pb Zn)
Large-scale gold production 973 (07 ndash 247) 5
Mine production of mercury 117 (69 ndash 178) lt1
Cement production 173 (655 - 646) 9
Oil refining 16 (73 - 264) 1
Contaminated sites 825 (70 - 95) 4
Intentional uses
Artisanal and small-scale 727 (410 ndash 1040) 37 gold mining
Chlor-alkali industry 284 (102 ndash 547) 1
Consumer product waste 956 (237 ndash 330) 5
Cremation (dental amalgam) 36 (09 - 119) lt1
Grand Total 1960 (1010 ndash 4070) 100
Values rounded to 3 significant figures To nearest percent
Sectors for which emissions are not currently quantified
biofuel production and combustion
vinyl-chloride monomer production emissions during
secondary metals production and ferro-alloys
oil and gas extraction transport and processing other than refinery emissions
industrial some hazardous waste incineration and disposal
sewage sludge incineration
preparation of dental amalgam fillings and disposal of removed fillings containing mercury
9
UNEP Global Mercury Assessment 2013
Disposal of waste from
Mercury-cell chlor-alkali
industry
Relative contributions to estimated emissions to air from anthropogenic sources in 2010
Oil refining
Coal combustion
Oil and natural gas combustion
Primary ferrous metal production
Primary non-ferrous metal (Al Cu Pb Zn)
Large-scale gold production
Hg production Cement production
mercury-containing products
Contaminated sites
Cremation
Artisanal and small-scale gold production
counting of emissions from conventional fuels (such as coal and oil) that are included under the industrial fossil fuel burning emissions However it does attempt to account for emissions from other fuels including alternative fuels (such as old tyres and other wastes) and from raw materials Increasing amounts of waste are being co-incinerated in the cement industry both as fuel but also in some plants as a means of disposing of hazardous wastes some of which may contain mercury In some regions additional measures are being introduced to make sure that mercury emissions associated with waste co-incineration do not increase overall emissions from cement plants
Increased application of air pollution control devices including some mercury-specific technologies together with more stringent regulations in several countries have the effect of reducing mercury emissions from coal burning sectors and thus offset some part of the emissions arising from increased activity
Artisanal and small-scale gold mining emissions are in the 2010 inventory the major source of emissions to air at 727 tonnes per year The reasons for the large increase in the estimate compared to 2005 are discussed below (see page 16) The global estimate for emissions from ASGM includes a significant contribution from China although
recent information on this sector in China is lacking China prohibited ASGM in 1996 and therefore records no emissions from this sector
Mercury-cell technology is becoming less common in the chlor-alkali industry as other more cost-effective processes are adopted No new plants are being constructed though many older plants remain to be converted Old chlor-alkali plants and other decommissioned industrial sites may constitute contaminated sites that continue to release mercury to the environment for many years and emissions from contaminated sites are now part of the inventory
Global emissions from use of mercury in dental amalgam resulting from cremation of human remains are estimated at 36 (09 ndash 119) tonnes in 2010 Some 340 tonnes of mercury is used per year in dentistry of which about 70-100 tonnes (ie 20shy30) likely enters the solid waste stream
In the production of vinyl chloride monomer information is still lacking on the lifecycle and eventual fate of the mercury catalyst Most of this production occurs in China and about 800 tonnes of mercury is thought to have been used by this industry in China in 2012 Used mercury catalyst is recycled and reused by enterprises that hold permits for hazardous waste management The amounts that may be emitted or released are unknown
Ronald de Hom
mel
Artisanal and small-scale gold mining Unlike most small-scale gold miners the green gold miners of Oro Verde shown here employ an environmental way of mining gold that does not use mercury or other chemicals
10
UNEP Global Mercury Assessment 2013
Results by region The greatest proportion of anthropogenic mercury emissions to the atmosphere comes from Asia which contributes about 50 of the global total The majority of Asian emissions come from East and Southeast Asia China accounts for three-quarters of East and Southeast Asian emissions or about one third of the global total
New data on emissions from ASGM have increased the proportion of global emissions attributed to South America and Sub-Saharan Africa largely due to increased estimates associated with improved information about ASGM activities in these areas
Emissions to air from other major source sectors are higher in Europe North America and Oceania
Mercury emission 2010 gkm2
0 2 5 10 100 1000
Global distribution of anthropogenic mercury emissions to air in 2010
Emissions from various regions in tonnes per year with the range of the estimate and as a percentage of total global anthropogenic emissions Note These numbers cannot be compared directly with those presented in the 2008 assessment (see Chapter 4 Trends in mercury emissions to the atmosphere)
See figure on the following Region Emission (range) tonnes page for map with
Australia New Zealand amp Oceania 223 (54 - 527) 11 specification of regions Values rounded to 3 Central America and the Caribbean 472 (197 - 974) 24
significant figures CIS amp other European countries 115 (426 - 289) 59
East and Southeast Asia 777 (395 - 1690) 397
European Union (EU27) 875 (445 - 226) 45
Middle Eastern States 370 (161 - 106) 19
North Africa 136 (48 - 412) 07
North America 607 (343 - 139) 31
South America 245 (128 - 465) 125
South Asia 154 (782 - 358) 79
Sub-Saharan Africa 316 (168 - 514) 161
Undefined (global total for emissions from 825 (700 - 950) 42 contaminated sites)
Grand Total 1960 (1010 ndash 4070) 100
11
UNEP Global Mercury Assessment 2013
North America
Central America and the Caribbean
South America
Unintentional emissions
Stationary combustion (coal)
Stationary combustion (oil and gas) Oil refining
Pig iron and steel
Intentional uses
Artisanal and small-scale gold mining Chlor-alkali
EU27
North Africa
Sub-Saharan Africa
Non-ferrous metals (Cu Pb Zn Al) Mercury
Large-scale gold
Cement
Product waste
Cremation
CIS amp other European countries
500
100
Middle Eastern States East and Southeast Asia
50
10 tonnes
South Asia Australia New Zealand amp Oceania
South America
North America
Central America and the Caribbean
Sub-Saharan Africa
South Asia North Africa
Middle Eastern States
EU
East and Southeast Asia
CIS amp other European countries
Australia New Zealand amp Oceania
Estimates of 2010 anthropogenic mercury emissions to air from different main sectors in different regions ASGM is shown separately to highlight its geographic distribution and better allow regional comparisons to be made for other sectors
12
UNEP Global Mercury Assessment 2013
Compiling the 2010 inventory of anthropogenic mercury emissions to air The inventories used in successive Global Mercury Assessments continue to improve as better data become available The 2013 update presents an inventory of emissions for 2010 that has a number of improvements over the 2008 assessment and its inventory for 2005
bull A more detailed analysis of emissions from some major source sectors For example fossil fuel consumption is now broken down into categories for combustion in power plants industry and other uses The type of coal or oil used is also considered providing a more accurate estimate of mercury emissions
bull A more detailed consideration of the mercury content of fuels and raw materials used in different countries and regions bull New and updated information on ASGM bull The use of different pollution control technologies
in different countries and regions have been factored into the emissions estimate bull Emission estimates for sectors not previously
included such as aluminium production oil refining and contaminated sites bull More and better information on location of major
point sources such as individual power plants smelters and cement kilns bull Better documentation and greater transparency
with respect to the data and information behind the estimates
The methods for estimating emissions from industrial sectors is complemented by other methods used for more dispersed emissions sources For example estimating emissions from some intentional-use sectors requires intensive work with those sectors Relevant and accurate information about ASGM is generally not available through official channels Estimating mercury emissions from its intentional use in lighting batteries and other products requires analysing the entire production use and waste stream to determine where mercury is likely to be released and in what quantities The approach used in the 2013 assessment addresses the emissions from breakages and wastes resulting from use of these mercury-containing products in society the majority of
which are incinerated or end up in landfills It does not however address industrial wastes or sewage sludge incineration
Uncertainties in emission estimates Estimates of mercury emissions are just that estimates To compile a global assessment requires making a number of assumptions and generalizations Uncertainty associated with the 2010 inventory arises from each of the factors used to estimate the emissions the correctness of the activity data the validity of the emission factors applied and the validity of assumptions regarding the effectiveness and use of emission-control technologies
Based on an evaluation of these sources of uncertainty and the relative contributions of sectors with reliable information and those with less reliable data uncertainty in the 2010 inventory assessment of total anthropogenic mercury emissions to air gives a range of emissions from 1010-4070 tonnes This range is greater than that reported in some previous assessments reflecting a greater appreciation of the sources of uncertainty due to the improved estimation methods and perhaps a more realistic appraisal of the state of knowledge concerning some aspects of emissions
The best estimate taking a conservative approach is 1960 tonnes If nationally produced estimates for 2010 available from some countries (Canada Japan Korea Mexico the United States and European countries reporting to LRTAP) are introduced into the global inventory in place of the inventory estimates the corresponding estimated total global anthropogenic emission to air is 1940 tonnes As most national inventories do not include uncertainty ranges it is not possible to assign a range to this number The recognition of uncertainties is an important consideration and presenting single national estimates can convey a misleading picture of what is known and more importantly not known about emissions
The numbers derived using the methods employed to produce the global inventory for 2010 were compared with a number of national inventories and emissions reported under other systems covering the same period In general the level of agreement was good in particular when the significant uncertainties
13
UNEP Global Mercury Assessment 2013
Methods for estimating emissions All global mercury emissions inventories to date have used the same basic approach for the major sectors emitting mercury to the atmosphere For specific emission sectors national emissions estimates are calculated by multiplying the amount of activity (ie amounts of fuels burned raw materials consumed or materials produced) by an emission factor that is an estimate of the mercury emitted per unit of activity For example emissions from coal-fired power generation are estimated by multiplying the tonnes of coal used by the amount of mercury estimated to be released per tonne of coal In most such inventories ldquoabatedrdquo emission factors have been employed to quantify both the emissions of mercury that occur during the processes and the effects of mercury emission controls In the new methodology used to develop the 2013 report these components are split ldquoUnabatedrdquo emission factors are employed to quantify the emissions and ldquotechnology profilesrdquo have been developed to represent the effects of mercury emission controls
Various methods are employed to estimate emissions of mercury at individual sources and at national regional and global levels In general the methods fall under one of two main categories
bull Mass-balancesubstance-flow based estimates which are based on the principle that what goes in must come out Amounts of mercury in fuels and raw materials constitute the inputs and the outputs are the amounts of mercury emitted to air released to water or land retained in products or in wastes or otherwise recovered and stored or disposed of
involved in both global and national estimates are taken into account It is important to note that there are good reasons why estimates of mercury emissions produced in the 2010 inventory may not fully agree with national inventories made by countries using other methodologies These reasons include
bull Reporting schemes may define and distinguish emissions source sectors in very different ways and aligning these sectors may not be possible
bull Industry reporting to national government may be limited to sources with emissions above a certain threshold level so that emissions from smaller sources below the threshold are not reported Where smaller sources make up a significant part of the source category reported inventories
bull Measurement-based estimates which rely on measurements made at appropriate points in the industrial process or in the productwaste output streams These measurements are used to estimate where the mercury goes as in the method above
In principle the two approaches should produce the same results In practice mass-balance based approaches tend to result in higher emission estimates than most measurement-based estimates Since future emissions reporting is likely to involve a combination of these two approaches further work is required to understand why results may differ and to reconcile the two approaches
Since the 2008 UNEP assessment was produced the number of direct measurements of emissions from certain point sources (in particular power plants and some metal and cement production plants and waste incineration facilities) has increased considerably resulting in a much improved knowledge base
A number of countries require regular reporting of emissions Increasing use is being made in these reporting systems of measurement-based estimates and facility-level reporting in particular for major point sources In other countries national mercury emissions are only being quantified for the first time Since 2005 and the start of the UNEP negotiating process in 2010 many countries have initiated work on national emission inventories which in several cases have yielded much improved information on activity data sector characteristics and mercury emissions Such inventories often make use of the UNEP Toolkit for identification and quantification of mercury emissions
may therefore significantly underestimate total mercury emissions bull National inventories in some countries are making
increasing use of actual measurements of mercury emissions at individual facilities At the global scale it is not yet feasible to base an inventory on individual site emissions Furthermore actual measurements of mercury emissions at a source may be taken only a few times during a year and may not be fully representative of normal operations In the 2013 assessment a mass-balance based approach was employed to be consistent transparent and replicable bull National reporting and monitoring schemes
may provide information that is not available to externally produced inventories
14
UNEP Global Mercury Assessment 2013
Despite these considerations most of the discrepancies noted between the 2010 inventory mass-balance-based estimates and national estimates based on measurement- approaches are modest and within the margins of error associated with the different approaches In cases where the differences are larger it is important to recognize that there are sources of error in all methods for estimating mercury emissions
Gunnar Futsaelig
ter
Sampling of mercury emissions at the Kendal coal-fired power plant in South Africa conducted under a UNEP project A probe with mercury traps is inserted into a sampling port in the stack to collect mercury present in the flue gas The mercury traps are subsequently analysed according to the US EPA Mercury Monitoring Toolkit sampling protocol
15
UNEP Global Mercury Assessment 2013
Trends in mercury emissions to the atmosphere 4 Assessing global and sectoral trends A key question in assessing anthropogenic mercury emissions worldwide is whether they are increasing or decreasing While it is tempting simply to compare the 2010 inventory with its 2005 counterpart the results would mean little As inventory methods develop and as additional sources are considered the estimate of total anthropogenic mercury emissions worldwide also changes While some changes reflect real trends others reflect changes in methods or scope Thus comparing the results of previous assessments with the present update requires considerable care and involves an understanding of the way in which these inventories have been produced and the uncertainties associated with them
It is possible however to compare certain sectors over time by attempting to compensate for any methodological changes between the various inventories since 1990
Emissions to air are thought to have peaked in the 1970s From 1990 to 2005 total anthropogenic emissions of mercury to the atmosphere appear to
Emissions to air t
1400
1200
1000
800
600
400
200
0
1990
1995
2000
2005
Africa Asia Europe Russia North Oceania South America America
Estimates of annual anthropogenic mercury emissions from different continentsregions 1990-2005
have been relatively stable with decreases in Europe and North America being offset by increases in Asia A reanalysis of the available inventories since 1990 however indicates that emissions from industrial sectors at least may be starting to increase again
The changes introduced in the 2010 inventory methodology prevent a straight-forward continuation of this analysis However an evaluation of trends for some sectors between 2005 and 2010 has been made by applying the new methodology to activity data for 2005 This comparison suggests a further slight increase in the combined amount of mercury emitted by industrial sectors (coal combustion production of cement pig iron and steel and non-ferrous metals) The following paragraphs describe the trend results for three sectors to illustrate some of the developments between 2005 and 2010 and some of the the difficulties in comparing emissions estimates between different years made with different methods
Coal burning for power generation and for industrial purposes continues to increase especially in Asia However increases in the application of air pollution controls including some mercury specific technologies together with more stringent regulations in a number of countries have reduced mercury emissions from coal burning in power plants in particular and thus offset some part of the emissions arising from increased coal consumption
In the United States for example emissions from coal burning at power plants have reportedly decreased from about 53 tonnes in 2005 to 27 tonnes in 2010 This decrease is largely due to new regulations that have resulted in changes in the sources of the coal that is burned in large power plants and the installation of mercury controls as well as controls on sulphur dioxide and particulates that have the co-benefit of further reducing mercury emissions
In China many of the new coal-fired power plants have state-of-the-art pollution controls installed
Emissions of mercury from artisanal and small-scale gold mining (ASGM) reported for 2010 are more than twice those reported for 2005 While the
16
UNEP Global Mercury Assessment 2013
Unintentional emission sectors Coal burning ferrous- and non-ferrous (Au Cu Hg Pb Zn) metal production cement production Intentional-use sectors Disposal and incineration of product waste cremation emissions chlor-alkali industry
Comparison of emissions in 2005 and 2010 by selected sector and region
Unintentional emission sectors
Emission t
1000
800
600
400
200
0 2005 2010
Australia New Zealand amp Oceania
Central America and the Caribbean
CIS amp other European countries
East and Southeast Asia
rise in the price of gold (from USD 400 per ounce in 2005 to USD 1100 per ounce in 2010) along with increased rural poverty may indeed have caused more activity in this sector the increased estimate for mercury emissions is considered to be due primarily to some more and better data from many countries and regions West Africa for example was regarded as having minimal ASGM in 2005 but is now recognized as a region with considerable activity Thus the baseline has improved without necessarily any change in actual activity or emission levels
Waste from consumer products is affected by the amount of mercury used For most products in which mercury is used mercury-free alternatives exist Consequently many of these uses of mercury are declining at least in some regions as alternative products or processes are adopted Compact fluorescent light bulbs are an exception Even though the mercury content of individual light bulbs has decreased use of this type of light bulb is increasing rapidly
Artisanal and small-scale gold mining Intentional-use sectors
1000 1000
Step change from 2005 to 2010 due to new information 800 800 (under-estimation in 2005)
600 600
400 400
200 200
0 0 2005 2010 2005 2010
European Union (EU27) South America
Middle Eastern States South Asia
North Africa Sub-Saharan Africa
North America
In order to make valid assessments of trends in emissions from global inventories comparable data on activity levels are required together with information on changes in fuel and raw material characteristics and applied air pollution control technology One aim of the 2010 inventory methods is to create a firmer foundation for such future trend analysis
Ralf Siemieniec Shutterstockcom
Use of mercury-containing energy-saving lamps is increasing
17
UNEP Global Mercury Assessment 2013
Emission scenarios and future trends The 2008 Global Atmospheric Mercury Assessment included a first attempt at projecting future emissions inventories These were based on three scenarios continuing with the status quo applying current emissions controls worldwide and achieving maximum feasible technological reductions At the time this effort was regarded as highly provisional Since then additional studies have extended and improved this work but the results are not markedly different from earlier projections of future mercury emissions
Global mercury models have been used to evaluate future scenarios Four global and hemispheric models projected mercury levels around the world in 2020 based on the three emission scenarios described earlier In industrial regions the status quo will cause an increase in mercury levels of 2-25 and in remote areas of 15-5 The two emission control scenarios on the other hand yield a decrease in mercury in industrial areas of 25-35 and in remote areas of 15-20
Another global model was coupled with estimates of surface reservoirs of mercury in order to quantify source-receptor relationships for the present and for 2050 Under the best-case scenario of maximum feasible reductions projected estimates for deposition in 2050 is similar to estimates for today In the other scenarios increasing emissions lead to increasing deposition A greater proportion of mercury emissions is expected to be in the oxidized form so that a greater proportion will be deposited near the source instead of being transported far away
The model results support the conclusion that reducing anthropogenic emissions will slowly reduce the amount of mercury in biologically available reservoirs Over time mercury in the environment will be taken out of circulation by natural processes for example from ocean waters down into sediments and biologically available mercury will decrease Increased emissions on the other hand will continue to build up the amount of mercury in circulation
With new databases and methods it may soon be possible to create scenarios that incorporate activity levels as well as technology use for each country If this were done it would allow countries to assess the effects of different mercury reduction strategies on their national emissions For example a country could determine the relative contributions of emission reduction technology as opposed to for example changes in raw materials
18
UNEP Global Mercury Assessment 2013
Atmospheric chemistry monitoring and trends 5 Forms of mercury in air Mercury in the atmosphere is in three primary forms Gaseous elemental mercury is the most common in anthropogenic and natural emissions to the atmosphere Gaseous oxidized mercury and mercury bound to particulates are less common The transport and deposition of atmospheric mercury depend greatly on whether the mercury is elemental or oxidized Elemental mercury stays in the atmosphere long enough for it to be transported around the world whereas oxidized and particulate mercury are more readily captured in existing pollution control systems or deposited relatively rapidly after their formation As a result most mercury in the air is in the gaseous elemental phase Relatively little elemental mercury is deposited directly but instead must fi rst be oxidized
Although gaseous oxidized mercury is very important in mercury cycling between air and other environmental compartments the process of oxidation in the air is poorly understood with reactions and resulting compounds yet to be verified in observations
When mercury moves from air to water and land it is generally in an oxidized gaseous or particulate form whereas when it is re-emitted to air it has been converted back to gaseous elemental
Particulate associated mercury
Pole
Equator
Gaseous elemental mercury
Global transport
Gaseous elemental mercury can be transported globally Mercury emitted in particulate form tends to deposit closer to sources
mercury Sunlight appears to play a large role in both oxidation and reduction of mercury but temperature and biological interactions are also likely to be involved to some degree Here too much uncertainty remains Nonetheless the reactions are important in determining net deposition and fate of mercury
Monitoring of mercury in air Monitoring of mercury in air focuses on the three primary forms of mercury The measurement of gaseous elemental mercury is routine and robust Measuring gaseous oxidized mercury and particulate-bound mercury however is challenging Concentrations are typically very low and these forms are chemically unstable leading to high uncertainty in the measurements Nonetheless these forms are critical for defining and modelling the fate and transport of airborne mercury
In the past two decades coordinated mercury monitoring networks and long-term monitoring sites have been established in a number of regions measuring mercury concentrations in the air as well as deposition of mercury in precipitation In Europe and North America high-quality continuous monitoring has been going on for more than 15 years especially in the Arctic High-quality monitoring has started more recently in East Asia and South Africa as part of a global effort to expand the coverage provided by long-term monitoring sites
Measurements and trends in atmospheric mercury Monitoring stations around the world have provided information about trends in atmospheric mercury though the time periods vary depending on how long the site has been active Overall a declining trend in background mercury levels over the past decade has been recorded from monitoring stations
19
UNEP Global Mercury Assessment 2013
in many regions Other regions however show an increase in mercury levels
The sites also provide information about geographical patterns reflecting both background levels of
Trends in atmospheric measurements of mercury
Site(s) Period
Mace Head Ireland 1996-2011
North America rural sites 1995-2005
High Arctic sub-Arctic Up to 20 years of records mid-latitudes
Monitoring networks Mercury monitoring in Europe is carried out under the European Monitoring and Evaluation Programme (EMEP) one of the first international environmental measurement networks Heavy metals such as mercury have been included in the EMEP program since 1999 Mercury measurements are available only from northern and northwestern Europe
Three monitoring networks currently operate in North America providing good coverage of Canada and the United States the Mercury Deposition Network the Canadian Air and Precipitation Monitoring Network and the Atmospheric Mercury Network More recently new sites have been established in Mexico extending coverage on the continent The stations monitor atmospheric mercury and mercury in precipitation which has measured since the mid-1990s Monitoring of mercury in the air and in precipitation has been underway in Asia for nearly a decade
Alert Nord
Point Barrow
Nuuk Stoacuterhoumlfethi
Mace Head
mercury and local and regional influences Mercury concentrations at remote sites in Asia are higher than in other regions of the Northern Hemisphere Coastal cities in China have lower levels than inland sites likely due to the influence of relatively clean
Measurement Trend
Gaseous elemental mercury Decrease of 14-18 per year
Total gaseous mercury Decrease of 22 to 174 in total
Total gaseous mercury Decreasing trend at some stations increasing at others
The monitoring network of the Arctic Monitoring and Assessment Programme (AMAP) includes air and deposition monitoring sites located in Arctic regions of Canada Greenland Iceland Norway Russia and Sweden
Building on existing national and regional monitoring networks the European Union-financed project
ldquoGlobal Mercury Observation Systemrdquo (GMOS) started in November 2010 Its goal is to develop a coordinated global system for monitoring mercury including a large network of ground-based monitoring stations New sites are being installed in regions where few monitoring stations exist especially in the Southern Hemisphere Two sites have been established in Antarctica one on the Antarctic Plateau and one on the coast
Ny-Aringlesund
Amderma Pallas
Raringouml Bredkaumllen
Listvyanka Diabla Gora
Mauna Loa
Mt Bachelor
Celestuacuten Calhau
Longobucco
Iskrba Niembro Monte Cimone Cap
Ferrat Mt Waliguan Ganghwa Island
Lulin
Cape Hedo Ev-K2
Mt Changbai
Minamata Mt Ailao
Nieuw Nickerie
Kodiakanal
Maheacute Island Manaus
Bariloche Cape Point
Amsterdam Island Cape Grim
Dumont drsquoUrville
AMAP CAMnet EMEP GMOS GMOS associated NADPAIRMoN NADPMDN
Air + precipitation Air Precipitation
20
UNEP Global Mercury Assessment 2013
John Munthe
The mercury background air monitoring station at Zeppelin mountain Svalbard
air from over the ocean Sites off the Asian coast however show higher levels of gaseous elemental mercury than the Northern Hemisphere background suggesting an outflow from the Asian mainland
Weather patterns have also been found to have a strong influence on seasonal patterns in mercury levels in the air at monitoring sites At the Mount Waliguan Observatory on the Tibetan Plateau for example northeasterly and easterly winds produced the highest levels of mercury
Measurements at high altitudes Measurements from ground-based stations above 2700 meters suggest that there is an inverse relationship between gaseous elemental mercury and gaseous oxidized mercury at these elevations In other words when there is more elemental mercury there is less oxidized mercury and vice versa These measurements are in good agreement with modelling results which gives additional confidence in current understanding of the behaviour of mercury at high altitude
An inverse relationship between total gaseous mercury and particulate concentration has also been observed in the high stratosphere From the transformation rate of total gaseous mercury to particulate-bound mercury it appears that gaseous mercury lasts about two years in the stratosphere
21
UNEP Global Mercury Assessment 2013
Atmospheric concentrations and deposition 6 Measurements and trends of mercury in precipitation Mercury deposited by precipitation decreased from the 1990s into the 2000s at many but not all sites in North America and Western Europe where such measurements were taken
Regional patterns are also evident including slightly higher levels in southern Europe than northern Europe and higher levels in Asia than in North America Total mercury concentrations in precipitation in China were much higher than those in Japan and South Korea Th is was mostly attributed to higher levels of gaseous oxidized mercury and particulate-bound mercury which are readily deposited by precipitation and thus not transported far
A comparison of data from Canadian and American monitoring sites found that deposition of mercury in precipitation was highest in summer
Dry deposition of mercury which is deposition not associated with precipitation is diffi cult to measure and consequently there is little information on trends in mercury dry deposition Th is lack of information means that it is also diffi cult to validate model results for dry deposition
106 44
474 72 91
5 7 71
05 1 5 10 100 500 1000
Total mercury emission (2005) kgcell
Modelled mercury air concentrations and deposition patterns Atmospheric mercury concentrations are highest in major industrial regions Models examining global patterns show that East and South Asia Europe North America and South Africa have the highest levels of elemental mercury in the air Concentrations are generally lower in the Southern Hemisphere than the Northern Hemisphere because most industrial activity is in northern regions Th ese model results are based on simulations using the 2005 global mercury emission inventory because the 2010 inventory has only recently become available
Intercontinental transport of mercury in the air has been examined to determine its impact on regional mercury levels Four models using diff erent parameters produced consistent results Depending on the region mercury emitted by distant sources contributes between 10 and 30 of annual mercury deposition Where local sources are low mercury transported from distant emission sources can account for more than half of the deposition East Asia is the dominant source region adding 10-14 to the deposition in
Contribution from sources outside receptor region
Model 40
GEOS-Chem GLEMOS GRAHM CMAQ-Hg
30
20
10
0 Arctic Europe North East Asia South Asia
America
Receptor region
(Left ) Global distribution of anthropogenic mercury emissions in 2005 with source regions that were considered in the analysis (North America South America Europe Africa Central Asia South Asia East Asia Australia and Oceania) and (right) the contribution of anthropogenic sources outside a particular receptor region to deposition within the receptor region
22
UNEP Global Mercury Assessment 2013
Modelling atmospheric transport and deposition Global models reproduce the movement of mercury in the atmosphere during which the mercury may move between continents They have been effective in examining sources of mercury to the Arctic and also for examining the outflow of pollution from South and Southeast Asia and its impact on western North America as well as the flow from eastern North America to Europe
Regional models on the scale of a continent or a basin such as the Mediterranean can provide more detail about specific source areas even to the level of individual industrial areas Reliable results however require a detailed understanding of mercury oxidation in the atmosphere about which there is considerably uncertainty
Most atmospheric transport models consider the full chain of mercury processes in the atmosphere Some models also consider how mercury is cycled in other atmospheric compartments such as soil vegetation snow freshwater and seawater
One of the largest sources of uncertainty in mercury models is the chemical mechanism used to determine how mercury changes forms in the air Improved experimental data can help improve model performance by making sure that the correct reactions are simulated The processes that lead from deposition to re-emission also need to be understood better Advances in this area show promise with model results becoming closer to estimates based on experimental data
other regions of the world Natural emissions and re-emissions account for 35-70 of total deposition in most regions Deposition is generally greater in low and mid-latitudes due to stronger sunlight higher concentrations of oxidants and higher precipitation
Regional mercury models show patterns at the scales of continents or individual seas The Mediterranean Sea for example is a net source of mercury as it emits more than is deposited to it In that region dry deposition generally exceeds deposition of mercury in precipitation In Central and Southern Europe total gaseous mercury concentrations and deposition in precipitation were both consistently higher than the European average
Across the United States dry deposition accounts for two-thirds of total annual deposition mainly from gaseous oxidized mercury A study examining sources and deposition of mercury to assess the
benefits of proposed emission control measures found that mercury transport from outside the country accounts for 68 of mercury deposition in the Northeast and up to 91 in the west-central United States Large point sources contribute up to three-quarters of nearby deposition and power plants contributed half of the deposition in the eastern part of the country This suggests that new emissions standards would primarily benefit eastern regions of the US
In Asia studies show high seasonal variation in mercury concentration and deposition Anthropogenic emissions are responsible for about 75 of deposition in East Asia In this region there is a net removal of gaseous oxidized mercury from the atmosphere and a net export of gaseous elemental mercury
In the Arctic gaseous elemental mercury levels in the atmosphere are depleted rapidly in spring when after the long Arctic winters sunlight returns Ozone is depleted at the same time and it is believed that bromine-containing compounds are the cause of the photo-chemical reactions that deplete ozone and mercury During these events gaseous oxidized mercury and particulate-bound mercury levels increase sharply suggesting that the gaseous mercury is oxidized and deposited enhancing mercury deposition in Arctic areas in springtime Recent research however has found that 50-80 of the deposited mercury is re-emitted within a few days Similar springtime mercury depletion events have been seen in Antarctica
23
UNEP Global Mercury Assessment 2013
Anthropogenic releases to the aquatic environment 7 Global assessment Previous UNEP global mercury assessments only considered emissions to the atmosphere The 2013 Report presents the first attempt at compiling a global inventory of mercury releases to aquatic environments Releases directly into the aquatic environment present a completely different chemistry set of pathways and fate to those released to air They are also more directly linked to the risks posed by mercury to global environmental and human health Unlike mercury releases to air which are predominantly in the form of gaseous elemental mercury releases to water are predominantly inorganic mercury and to a lesser extent liquid elemental mercury
At present only some sources of aquatic releases can be quantified with any confidence Thus many sources that may be important are not included in this first assessment of global aquatic releases For example land management practices that expose new geological sources of mercury in rocks and mineral soils or that re-mobilize previously deposited mercury cannot yet be assessed Two broad categories of current anthropogenic sources are considered here point sources of mercury release to water and diffuse releases of mercury as a result of its remobilisation from areas where it was previously deposited or accumulated due to human activity (ie contaminated sites) Artisanal and small-scale gold mining (ASGM) mercury-containing pesticides and fungicides used in agriculture and deforestation are considered separately
Point source releases to water from various sectors in tonnes per year with the range of the estimate and as a percentage of total anthropogenic emissions
Sector Releases (range) tonnes
Non-ferrous metal production 925 (193 - 268)
Consumer product waste 894 (222 - 308)
Chlor-alkali production 28 (10 ndash 55)
Oil refining 06 (03 ndash 1)
Grand Total 185 (426 ndash 582)
The global estimate of mercury release to water from point sources has been derived from the atmospheric emissions assessment and the approach employed in the UNEP Toolkit to partition total mercury releases between air land and water This approach has considerable uncertainty and may omit sectors where releases to water are high but air emissions are unimportant and therefore not addressed in the inventory Global releases from point sources were estimated to be 185 tonnes per year
For diffuse sources evaluating the relative contribution of anthropogenic and natural sources to the aquatic environment requires determining considerations of the various mercury inputs For some sectors data exist that allow a preliminary assessment of the amounts of mercury re-mobilized into aquatic systems
For mercury-contaminated sites the range of average soil concentrations of mercury reported for sites where mercury was mined used or otherwise released by human activity was considered The area of contamination is then used to determine how much mercury is available in soils and when combined with a factor for how much mercury is released from those soils in a year the total release can be estimated Among identified contaminated sites mercury mining is identified as the largest sector followed by mining of precious metals Total releases to aquatic environments from contaminated sites are estimated to be 83-335 tonnes per year
Releases to water from contaminated sites in tonnes per year with the range of the estimate
Sector Releases (range) tonnes
Primary mercury mining sites 67 ndash 266
Precious metal production sites 14 ndash 55
Non-ferrous metal production sites 01 ndash 05
Chlor-alkali production sites 01 ndash 05
Other industrial sites 01 ndash 03
Grand Total 83 ndash 335
24
UNEP Global Mercury Assessment 2013
Much of the mercury released from artisanal and small-scale gold mining goes into rivers lakes soils and sediments and tailings From soils and tailings it may be re-mobilized by leaching and erosion In addition mining may disturb mercury-containing soils and sediments that may then erode more quickly releasing more mercury than would otherwise have become available from natural erosion A key factor in these processes is the local hydrological cycle of precipitation evaporation run-off and river flow To account for this in the assessment countries were designated as dry wet or intermediate to determine the relative importance of erosion The tropical and subtropical countries which have the greatest activity in this sector also tend to experience high precipitation and run-off exacerbating this source of mercury release and re-mobilization Total worldwide releases of mercury to land and water from ASGM were estimated at over 800 tonnes per year How much of this is released to water cannot yet be determined
Mercury continues to be used in pesticides and fungicides 2100 tonnes of mercury were released in the decade of the 1960s through such agrochemical uses Current data are unavailable although the use of mercury in these products has been greatly reduced
Deforestation especially in the Amazon Basin can lead to extensive soil erosion and thus the release of mercury previously accumulated in soils Using 2010 figures for deforestation rates around the world and an estimate of soil concentrations of mercury as much as 260 tonnes of mercury may have been released into rivers in 2010 as a result of deforestation worldwide
Because this is the first attempt to quantify global mercury releases to the aquatic environment there is no previous measurement against which these results can be compared Thus it is not possible at this time to evaluate trends in releases
Uncertainties in release estimates Estimating global releases of mercury to aquatic environments is being done here for the first time Many data are missing and others are imprecise A number of assumptions have been made based on what measurements are available or on other grounds to extrapolate from known quantities or to calculate aquatic releases in relation to atmospheric
or other emissions Thus the results should be treated with great caution It is nonetheless clear that anthropogenic sources and human activity contribute hundreds of tonnes of mercury to aquatic environments each year a substantial amount relative to estimated natural releases 150-960 tonnes per year from terrestrial environments
Lapshin Shutterstockcom
Phil Augustavo istockphotocom
Bureau of Land Managem
ent
Contaminated sites (top) erosion following deforestation (middle) and a flooded store of mercury-contaminated waste (lower) illustrate potential sources of mercury releases to water
25
UNEP Global Mercury Assessment 2013
Aquatic pathways transport and fate 8 Mercury in aquatic environments The pathways and fate of mercury in aquatic environments are important because it is in waters sediments and wetland soils that inorganic mercury is converted into methylmercury which is toxic and concentrates in animals The majority of human exposure to mercury and the health risk that comes with mercury exposure is from consumption of marine foods Thus this section focuses on the worldrsquos oceans Some freshwater systems however are important sources of fish for human consumption especially for subsistence and recreational fisheries often among indigenous peoples Artisanal and small-scale gold mining (ASGM) communities may also be affected through fish consumption and drinking water if those are contaminated by local releases
The major processes of mercury cycling are generally similar for all aquatic systems Inorganic mercury in dissolved or particulate form is the dominant mercury type in most marine and fresh waters Dissolved gaseous elemental mercury accounts for less than 30 of total mercury in water Methylmercury is often present at trace levels but may in some settings reach 30 of total mercury In freshwater and coastal environments inorganic mercury is transformed into methylmercury primarily in sediments In the open ocean this conversion takes place largely at intermediate depths between 200 and 1000 meters in the water column Mercury is lost from aquatic systems in two ways When inorganic mercury is reduced to elemental mercury it can be re-emitted to the atmosphere When inorganic mercury binds to particulates in water it can settle out rapidly and be buried in sediments Deep burial in ocean sediments is one of the major pathways by which mercury is removed from the biologically active environment
The global mercury cycle is chemically and physically complex Thus it is necessary to use models to study describe and predict what happens and will happen to mercury in the aquatic environment Until recently only one model existed that incorporated
air land and water into a unified whole The model has been validated against observations of mercury and represents the current scientific consensus The largest potential errors in this model in terms of the aquatic cycle concern details of the exchange of mercury between air and water
Pathways and fate of mercury in the oceans Model simulations suggest that anthropogenic impacts on mercury levels in the ocean are greatest in the surface waters the top 100 meters or so of the water column While model results vary one recent estimate suggests that anthropogenic emissions over the last 100 years have doubled the concentration of mercury in the surface layer of the ocean and increased it by 25 in intermediate waters and by 10 in deep waters The difference is due to the length of time it takes for surface waters to circulate to the depths
Models and measurements agree that direct deposition from the atmosphere is the dominant pathway by which mercury reaches the oceans The exceptions are smaller semi-enclosed basins such as the Mediterranean Sea or the Arctic Ocean where river runoff coastal erosion and ocean currents
Ugo M
ontaldo Shutterstockcom
26
UNEP Global Mercury Assessment 2013
account for about half of mercury inputs The most recent modelling effort suggests that total deposition input of mercury to the oceans in 2008 was 3700 tonnes
Other mercury pathways appear less important on a global basis Rivers are estimated to carry more than 2800 tonnes of mercury each year but only about 380 tonnes of this is transported offshore The rest is trapped by particles in estuaries Groundwater and re-mobilization from sediments provide 100shy800 tonnes of mercury to the oceans each year Undersea hydrothermal vents add less than 600 tonnes of mercury to the oceans There are high concentrations of mercury in vent fluids but a great deal of the mercury is precipitated as solids once the vent fluids enter seawater
Models suggest that globally about 70 of the mercury deposited into the ocean is re-emitted to the atmosphere Oxidized mercury in surface waters is reduced by biological and photochemical processes to the elemental form that is volatile and readily re-emitted The removal of this mercury ultimately reduces the pool of mercury that could be converted to methylmercury and be accumulated by marine organisms The re-emission process thus simultaneously prolongs the lifetime of mercury cycling through the atmosphere and upper ocean and acts to reduce mercury availability for marine food webs
Any changes in the efficiency of mercury reduction in surface waters or the rate of re-emission is likely to impact mercury concentrations in surface waters and the air One example is the effect of sea ice in the Arctic Ocean which blocks the re-emission
Tony Magdaraog Shutterstockcom
Mercury accumulated in marine food-webs can enter the human diet
of elemental mercury leaving elevated levels in waters under ice Changes in primary productivity could change the rate at which mercury is bound to particles thus affecting re-emission to the atmosphere as well as rates of downward transport in the ocean Changes in oxidant levels in the atmosphere such as ozone and bromine may also influence the rate of oxidation of gaseous elemental mercury and thus deposition rates to the ocean
Methylmercury in the ocean Natural bacterial processes in seawater and in sediments in coastal environments convert inorganic mercury to methylmercury Methylmercury levels are highest in the subsurface waters of many oceans because it is formed at these intermediate depths likely as a result of the decomposition of organic material falling from surface waters Current understanding indicates that about 300 tonnes of methylmercury is produced in the upper ocean by this and related processes By contrast only about 80 tonnes of methylmercury reaches the ocean from other sources such as atmospheric deposition rivers and diffusion from sediments
Current modelling indicates that methylmercury stays in the upper ocean for about 11 years Deshymethylation by photochemical reaction or by microbial activity is the major removal process for methylmercury in the ocean About 240 tonnes of methylmercury is removed by this process from the surface waters of the ocean per year
The other important pathway for methylmercury in seawater is uptake into marine food webs Although only about 40 tonnes per year is taken up in this way it is this fraction that poses risks to marine animals and human consumers of seafood Methylmercury is a problem for several reasons First it is taken up by plankton much more efficiently than is inorganic mercury resulting in concentrations in plankton that are as high as 10000 times the concentration in seawater Second methylmercury is absorbed through the intestine of animals much more easily than is inorganic mercury Third methylmercury biomagnifies as it moves up the food web Thus methylmercury becomes an increasingly greater proportion of the mercury in organisms higher in the food web This explains why some indigenous populations that consume top marine predators such as fish seals and whales have some of the worldrsquos highest concentrations of methylmercury giving rise to health concerns
27
UNEP Global Mercury Assessment 2013
Pathways and fate of mercury in freshwater Observations and modelling both show that there are in general many similarities between mercury chemistry pathways and fate in lakes and in the oceans but with obvious differences in scale and in the relative importance of different processes Modelling of mercury dynamics was done for four lakes with a history of direct mercury inputs from the largest freshwater lake in the world (Lake Superior) to small lakes in Ontario Canada Atmospheric deposition and river inflow were the main sources of inorganic mercury Much of the mercury input from lake and river catchments was associated with dissolved and particulate organic matter The dominant mercury removal mechanisms as in saltwater were burial in sediments and photochemical reduction of oxidized mercury to elemental mercury followed by re-emission to the air In Lake Superior and Lake Michigan there is evidence for methylation of mercury in the water column as is seen in the open ocean
Methylmercury levels in freshwater fish vary with the level of deposition of mercury from the air though other factors such as inputs from the watershed and the number of trophic levels within the lakersquos food web are also important Methylation predominantly occurred in lake sediments and wetlands and floodplain soils where sulphateshyreducing bacteria are believed to be primarily responsible Methylmercury is de-methylated in sediments and also taken away in the outlet river from each lake
Some 400-1400 tonnes of mercury are estimated globally to be trapped behind dams and other man-made impoundments each year This has in many cases led to significant increases in total mercury and methylmercury levels in water and of methylmercury in fish and other aquatic species When artificial lakes are created plant material is submerged leading to decay and anoxia In these conditions microbially driven methylation of inorganic mercury takes place In some cases the elevated mercury levels have also been observed downstream from the artificial lakes and reservoirs
Anthropogenic impacts on aquatic mercury levels Two studies have reported that the Atlantic and Pacific Oceans have shown opposing trends over recent decades While the influence of changing ocean currents and other oceanographic factors may be a factor the trends do make sense in light of patterns of anthropogenic emissions In the North Pacific Ocean mercury concentrations appear to have increased at depths between 200 and 1000 meters over the last few decades This increase coincides with the rapid industrialization of East Asia
In the North Atlantic however results from near Bermuda suggest a substantial decrease in mercury concentration and a change in the mercury profile through the water column The Mediterranean Sea too showed a decrease in mercury concentration between 1990 and 2004 These findings are consistent with atmospheric data from around the North Atlantic The conclusion is that mercury levels in seawater in the North Atlantic were elevated by human activity but may now be declining likely as a result of decreased emissions from North America and Europe
A complementary approach to measuring mercury in seawater is to measure mercury in aquatic animals which accumulate and integrate mercury over time Teeth hair feathers and eggshells are useful long-term archives of mercury concentrations and can provide data from the pre-industrial period (ie before 1800) as well as more recent periods
Among marine animals samples are available from several regions particularly from the Arctic where cold dry conditions help preserve animal tissues Mercury concentrations between the 13th and 16th
centuries were relatively stable From the mid- to late 19th century to the end of the 20th century mercury levels increased by an average of 12 times On average therefore about 92 of the mercury in Arctic marine wildlife today is likely to be of anthropogenic origin
Similar findings were found for a 700-year sequence of seabird eggshells from the South China Sea Mercury levels increased steadily between 1800 and 2000 with a particularly rapid increase after 1970 Concentrations since 2000 are about 10 times higher than pre-industrial levels with 91 of the mercury now likely to be of anthropogenic origin In the Antarctic studies of seal hairs show that pre-industrial mercury levels were only 60 of recent levels The relatively small difference
28
UNEP Global Mercury Assessment 2013
Historical Hg concentration as a proportion of present-day 100
80
60
40
20
0
Beluga teeth Human teeth
Gyrfalcon feathers Perigrine falcon feathers
Polar bear hair Ringed seal teeth
1200 1300 1400 1500 1600 1700 1800 1900 2000
between pre-industrial and modern mercury levels in Antarctic is consistent with lower mercury emissions and atmospheric concentrations in the Southern Hemisphere as compared with the Northern Hemisphere
The timing of long-term increases of mercury in aquatic animals can shed light on the likely sources of mercury emissions that were responsible The industrialization of Europe and North America appear responsible for the large increases in marine mercury levels that began in the 19th century as these increases occurred prior to recent Asian industrialization As with water concentrations in the Pacific Ocean recent rapid increases in mercury in seabird eggs in the South China Sea coincide with industrialization in Asia
The time lag in aquatic ecosystem response One important conclusion from air-ocean modeling is that the oceans have not yet reached equilibrium with current atmospheric levels of mercury This lag is due to several factors First mercury stays in the upper ocean above 200 meters depth for about 30 years and for centuries in intermediate and deep waters This is much longer than the one year residence time in the lower atmosphere Thus removal from the ocean takes much longer than does removal from the air and so concentrations will change more slowly
Second because of the long lifetime of mercury in deeper ocean waters a great deal of natural mercury is present in the ocean already about 100000 tonnes out of a total of 135000 tonnes in intermediate waters and 200000 out of 220000 tonnes in deep waters
Rune Dietz
Analysis of museum samples reflects the increase in mercury emissions and releases since the mid-19th century associated with anthropogenic activities
Third vertical transport of mercury from intermediate depths back to the surface returns a substantial amount of mercury to the biologically active zone each year As a result average mercury concentrations in seawater and marine animals are likely to increase slowly for decades if not centuries even if atmospheric levels stabilize at present levels In short the effects of historical anthropogenic emissions from Europe and North America are still being observed in the oceans at the same time that the effects of the recent rise in emissions from Asia are being seen
Regionally different trends can be expected depending on distance from sources and ocean circulation patterns In the North Atlantic north of 55deg N it will take 50-600 years to achieve equilibrium between atmospheric and seawater mercury levels In the North Pacific this process is estimated to take 500-700 years and in the Antarctic 700-1000 years The Arctic Ocean by contrast is smaller and will only take about 35 years to reflect changes in atmospheric mercury levels Surface waters of the Mediterranean Sea should show also changes within 10-50 years
Time lags in the responses of many freshwaters and their food-webs to changes in atmospheric mercury levels are also expected Although some immediate recovery following reductions in atmospheric mercury deposition rates is likely full recovery may take decades centuries or longer depending on the characteristics of the area Highly polluted freshwaters with catchments and sediments containing large amounts of anthropogenic mercury will recover most slowly as is already observed around point sources such as smelters that have closed down
29
UNEP Global Mercury Assessment 2013
Major gaps in knowledge 9 Large uncertainties remain in global estimates of mercury emissions to the air These stem from various sources including the availability of information on activity levels but mainly from the lack of information concerning the mercury content of some raw materials and the validity of assumptions regarding processes and technologies employed to reduce mercury emissions including their rates of application and effectiveness The accuracy and precision of measurement-based estimates can depend on the validity of extrapolating measurements made at infrequent intervals to longer periods or measurements made at one plant to other facilities with similar operations
Potentially important emissions sectors that are still not quantified in the emissions inventory include the use of mercury in vinyl-chloride monomer production secondary metals production oil and gas extraction transport and processing industrial and hazardous waste incineration and disposal sewage sludge incineration and dental fillings preparation and removal
Current measurements and their evaluation are inadequate for determining spatial and temporal trends Improved more extensive and better coordinated measurements are needed A permanent global integrated monitoring network for atmospheric mercury and mercury deposition is needed to achieve this goal The atmospheric network sites should be closely integrated with water soil and biological monitoring networks The results can be used for model testing and evaluation as well as for more accurately detailing the geographic impact of anthropogenic emissions Monitoring of mercury concentrations in the important marine food species is essential to understanding possible human health impacts and the effects of future emissions changes
Better data on mercury distribution in the troposphere is needed to improve understanding of long-range transport and source-receptor relationships Coordinated studies at high altitudes and by aircraft are needed This information will
also help validate regional and global scale models improving their prediction capabilities with regard to different policy scenarios
Key processes related to global transport and cycling of mercury remain inadequately understood The chemical form of gaseous oxidized mercury is unknown Reduction and oxidation rates for mercury in the presence of atmospheric oxidants need further study including determining which oxidants are important New measurements and modelling studies are needed to examine key chemical and physical processes that affect global transport and cycling
Few data are available for reporting mercury releases to aquatic systems Systematic and consistent monitoring of mercury releases to the air is required especially for contaminated systems Releases of mercury from soils into waters depend greatly on climate and topography and these parameters need to be better accounted for Consistent approaches for measuring and reporting releases from point sources are needed to ensure comparability of data from around the world In particular the actual role of artisanal and small-scale gold mining (ASGM) in emissions to air and releases to water needs to be more accurately estimated
The link between mercury deposition methylation and uptake by living organisms needs further study The parameters that determine the rates of exchange of mercury compounds between air and sea air and soil and air and vegetation are not fully understood Whole-ecosystem studies of mercury are needed to better understand biogeochemical cycling Methylationdemethylation rates and their spatial and temporal variations and relationship to climatic factors need to be determined in most of worldrsquos major ocean basins as well as in representative freshwaters
30
UNEP Global Mercury Assessment 2013
Key findings of the 2013 assessment 10 Atmosphere Total anthropogenic emissions of mercury to the atmosphere in 2010 are estimated at 1960 (1010shy4070) tonnes which is about 30 of the total mercury that was emitted and re-emitted from anthropogenic and natural sources in that year The largest anthropogenic sources are associated with artisanal and small-scale gold mining (ASGM) and coal burning which together account for about 62 of the annual total anthropogenic emissions to air Other major sectors include ferrous and non-ferrous metal production and cement production
East and Southeast Asia are responsible for about 40 of global anthropogenic emissions About 75 of the mercury from this region comes from China which is about one-third of the global total Increased estimates for emissions from ASGM largely a result of newly obtained data and improved information mean that South America and Sub-Saharan Africa are also responsible for a greater proportion of global emissions than was previously assumed
Anthropogenic emissions over time have increased mercury loads present in the environment This leads to higher rates of re-emission and also means that there will be a time lag of years or decades between emissions reductions and lower mercury levels in the food web including pathways of human exposure
Mercury emissions to the atmosphere likely peaked in the 1950s to 1970s and subsequently declined because of reductions in Europe Russia and North America Emission trends are unclear due to changes in methods employed to produce inventories and differences in the sectors that have been accounted at different times There are however some indications that emissions may be rising again with increases from East Asia offsetting continuing reductions in Europe and North America
Aquatic environments Natural processes in aquatic systems convert less toxic elemental and inorganic mercury into much more toxic methylmercury Methylmercury concentrates and accumulates in the food web leading to high concentrations in some species of seafood and fish that many people eat
Anthropogenic releases of mercury to aquatic environments contribute hundreds of tonnes to the amount of mercury cycling in the environment Diffuse releases and point sources appear equally important Atmospheric deposition however remains the most important input of mercury to land and oceans and has increased the amount of mercury in many environmental compartments by a factor of two or three since the start of the industrial age On land mercury that is deposited is largely retained in soils and vegetation increasing the available pool for re-mobilisation to adjacent aquatic systems Re-emission from soils however is a major addition to atmospheric mercury
Hydrology is the most important factor in the transport of mercury from catchments to downstream environments Relatively little of this mercury reaches the open ocean as most is captured in sediments behind dams in estuaries and near the coast Changes in land cover and land use can have a large effect on mercury mobilisation as exposed soils erode and mercury leaches into the water table
Concentrations of mercury in Arctic marine animals today are about 10-12 times higher than in preshyindustrial times (ie prior to about 1800) This means that on average about 92 of the mercury in marine predators such as seabirds seals and whales is anthropogenic in origin The timing of the increase suggest that 19th and early 20th century emissions from Europe North America and Russia were responsible Increases mercury concentrations in seabirds in the South China Sea appear to be more recent than the Arctic increases coinciding with increasing industrialisation in East and Southeast Asia
31
UNEP Global Mercury Assessment 2013
K+S Entsorgung Gm
bH
Recovered mercury is being stockpiled at long-term storage sites above- and as shown here below ground
The upper 100 meters of the oceans have twice the mercury that they did a century ago Intermediate and deeper waters have 10-25 more mercury on average reflecting the slow transport of mercury downwards in the oceans Seawater concentrations will thus be especially slow in responding to changes in mercury inputs from atmospheric deposition and river flow As a result mercury concentrations in marine biota are likely to increase slowly for decades to centuries even without an increase in atmospheric emissions
In freshwater ecosystems atmospheric deposition and re-mobilisation from soils slow the reduction of mercury levels even in regions where atmospheric concentrations have decreased due to emission controls
Further increases in atmospheric emissions will have long-term consequences for commercial fisheries and all consumers of marine and freshwater foods
It is likely to be years or decades before reductions in anthropogenic emissions and releases of mercury have a demonstrable effect on mercury levels throughout the environment and in the fish and marine mammals which are part of the human food-chain This only reinforces the need to act now to continue and strengthen international efforts to reduce current mercury emissions and releases Delays in action now will inevitably lead to slower recovery of the worldrsquos ecosystems in future from mercury contamination leaving an even greater legacy of pollution for future generations
32
Division of Technology Industry and Economics (DTIE) Chemicals Branch Geneva Switzerland January 2013
Job number DTI1636GE
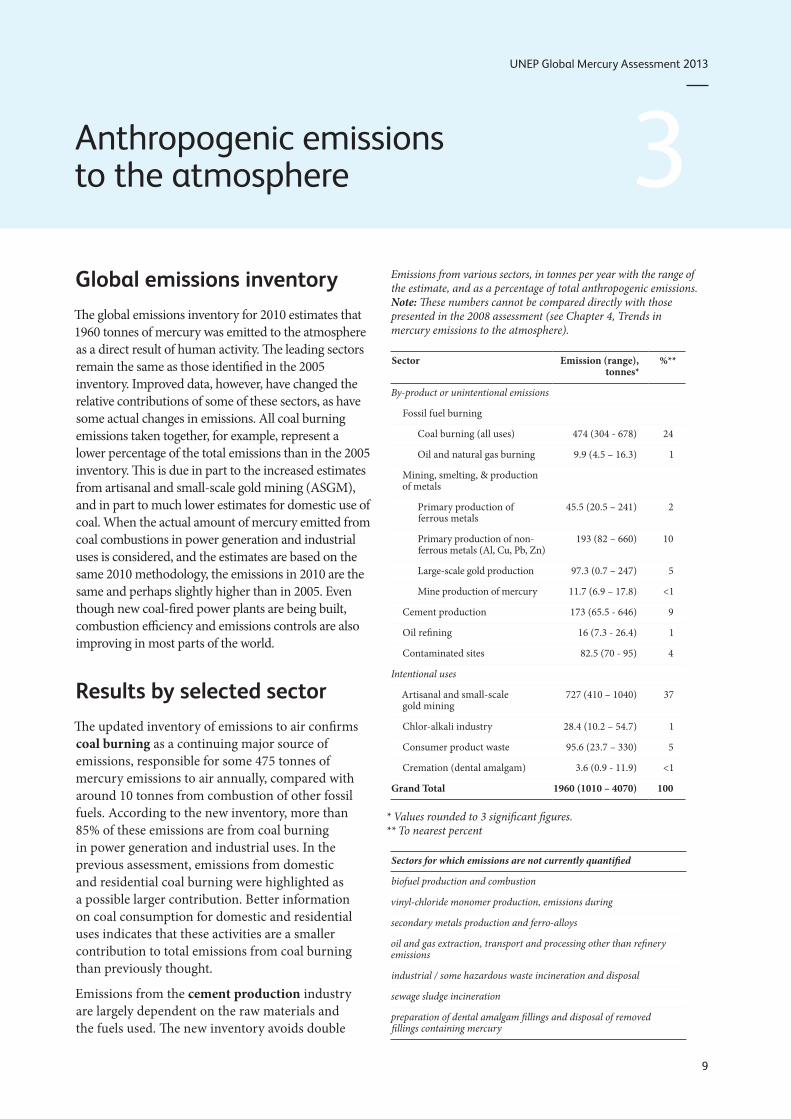
UNEP Global Mercury Assessment 2013
Anthropogenic emissions to the atmosphere 3 Global emissions inventory The global emissions inventory for 2010 estimates that 1960 tonnes of mercury was emitted to the atmosphere as a direct result of human activity The leading sectors remain the same as those identified in the 2005 inventory Improved data however have changed the relative contributions of some of these sectors as have some actual changes in emissions All coal burning emissions taken together for example represent a lower percentage of the total emissions than in the 2005 inventory This is due in part to the increased estimates from artisanal and small-scale gold mining (ASGM) and in part to much lower estimates for domestic use of coal When the actual amount of mercury emitted from coal combustions in power generation and industrial uses is considered and the estimates are based on the same 2010 methodology the emissions in 2010 are the same and perhaps slightly higher than in 2005 Even though new coal-fired power plants are being built combustion efficiency and emissions controls are also improving in most parts of the world
Results by selected sector The updated inventory of emissions to air confirms coal burning as a continuing major source of emissions responsible for some 475 tonnes of mercury emissions to air annually compared with around 10 tonnes from combustion of other fossil fuels According to the new inventory more than 85 of these emissions are from coal burning in power generation and industrial uses In the previous assessment emissions from domestic and residential coal burning were highlighted as a possible larger contribution Better information on coal consumption for domestic and residential uses indicates that these activities are a smaller contribution to total emissions from coal burning than previously thought
Emissions from the cement production industry are largely dependent on the raw materials and the fuels used The new inventory avoids double
Emissions from various sectors in tonnes per year with the range of the estimate and as a percentage of total anthropogenic emissions Note These numbers cannot be compared directly with those presented in the 2008 assessment (see Chapter 4 Trends in mercury emissions to the atmosphere)
Sector Emission (range) tonnes
By-product or unintentional emissions
Fossil fuel burning
Coal burning (all uses) 474 (304 - 678) 24
Oil and natural gas burning 99 (45 ndash 163) 1
Mining smelting amp production of metals
Primary production of 455 (205 ndash 241) 2 ferrous metals
Primary production of nonshy 193 (82 ndash 660) 10 ferrous metals (Al Cu Pb Zn)
Large-scale gold production 973 (07 ndash 247) 5
Mine production of mercury 117 (69 ndash 178) lt1
Cement production 173 (655 - 646) 9
Oil refining 16 (73 - 264) 1
Contaminated sites 825 (70 - 95) 4
Intentional uses
Artisanal and small-scale 727 (410 ndash 1040) 37 gold mining
Chlor-alkali industry 284 (102 ndash 547) 1
Consumer product waste 956 (237 ndash 330) 5
Cremation (dental amalgam) 36 (09 - 119) lt1
Grand Total 1960 (1010 ndash 4070) 100
Values rounded to 3 significant figures To nearest percent
Sectors for which emissions are not currently quantified
biofuel production and combustion
vinyl-chloride monomer production emissions during
secondary metals production and ferro-alloys
oil and gas extraction transport and processing other than refinery emissions
industrial some hazardous waste incineration and disposal
sewage sludge incineration
preparation of dental amalgam fillings and disposal of removed fillings containing mercury
9
UNEP Global Mercury Assessment 2013
Disposal of waste from
Mercury-cell chlor-alkali
industry
Relative contributions to estimated emissions to air from anthropogenic sources in 2010
Oil refining
Coal combustion
Oil and natural gas combustion
Primary ferrous metal production
Primary non-ferrous metal (Al Cu Pb Zn)
Large-scale gold production
Hg production Cement production
mercury-containing products
Contaminated sites
Cremation
Artisanal and small-scale gold production
counting of emissions from conventional fuels (such as coal and oil) that are included under the industrial fossil fuel burning emissions However it does attempt to account for emissions from other fuels including alternative fuels (such as old tyres and other wastes) and from raw materials Increasing amounts of waste are being co-incinerated in the cement industry both as fuel but also in some plants as a means of disposing of hazardous wastes some of which may contain mercury In some regions additional measures are being introduced to make sure that mercury emissions associated with waste co-incineration do not increase overall emissions from cement plants
Increased application of air pollution control devices including some mercury-specific technologies together with more stringent regulations in several countries have the effect of reducing mercury emissions from coal burning sectors and thus offset some part of the emissions arising from increased activity
Artisanal and small-scale gold mining emissions are in the 2010 inventory the major source of emissions to air at 727 tonnes per year The reasons for the large increase in the estimate compared to 2005 are discussed below (see page 16) The global estimate for emissions from ASGM includes a significant contribution from China although
recent information on this sector in China is lacking China prohibited ASGM in 1996 and therefore records no emissions from this sector
Mercury-cell technology is becoming less common in the chlor-alkali industry as other more cost-effective processes are adopted No new plants are being constructed though many older plants remain to be converted Old chlor-alkali plants and other decommissioned industrial sites may constitute contaminated sites that continue to release mercury to the environment for many years and emissions from contaminated sites are now part of the inventory
Global emissions from use of mercury in dental amalgam resulting from cremation of human remains are estimated at 36 (09 ndash 119) tonnes in 2010 Some 340 tonnes of mercury is used per year in dentistry of which about 70-100 tonnes (ie 20shy30) likely enters the solid waste stream
In the production of vinyl chloride monomer information is still lacking on the lifecycle and eventual fate of the mercury catalyst Most of this production occurs in China and about 800 tonnes of mercury is thought to have been used by this industry in China in 2012 Used mercury catalyst is recycled and reused by enterprises that hold permits for hazardous waste management The amounts that may be emitted or released are unknown
Ronald de Hom
mel
Artisanal and small-scale gold mining Unlike most small-scale gold miners the green gold miners of Oro Verde shown here employ an environmental way of mining gold that does not use mercury or other chemicals
10
UNEP Global Mercury Assessment 2013
Results by region The greatest proportion of anthropogenic mercury emissions to the atmosphere comes from Asia which contributes about 50 of the global total The majority of Asian emissions come from East and Southeast Asia China accounts for three-quarters of East and Southeast Asian emissions or about one third of the global total
New data on emissions from ASGM have increased the proportion of global emissions attributed to South America and Sub-Saharan Africa largely due to increased estimates associated with improved information about ASGM activities in these areas
Emissions to air from other major source sectors are higher in Europe North America and Oceania
Mercury emission 2010 gkm2
0 2 5 10 100 1000
Global distribution of anthropogenic mercury emissions to air in 2010
Emissions from various regions in tonnes per year with the range of the estimate and as a percentage of total global anthropogenic emissions Note These numbers cannot be compared directly with those presented in the 2008 assessment (see Chapter 4 Trends in mercury emissions to the atmosphere)
See figure on the following Region Emission (range) tonnes page for map with
Australia New Zealand amp Oceania 223 (54 - 527) 11 specification of regions Values rounded to 3 Central America and the Caribbean 472 (197 - 974) 24
significant figures CIS amp other European countries 115 (426 - 289) 59
East and Southeast Asia 777 (395 - 1690) 397
European Union (EU27) 875 (445 - 226) 45
Middle Eastern States 370 (161 - 106) 19
North Africa 136 (48 - 412) 07
North America 607 (343 - 139) 31
South America 245 (128 - 465) 125
South Asia 154 (782 - 358) 79
Sub-Saharan Africa 316 (168 - 514) 161
Undefined (global total for emissions from 825 (700 - 950) 42 contaminated sites)
Grand Total 1960 (1010 ndash 4070) 100
11
UNEP Global Mercury Assessment 2013
North America
Central America and the Caribbean
South America
Unintentional emissions
Stationary combustion (coal)
Stationary combustion (oil and gas) Oil refining
Pig iron and steel
Intentional uses
Artisanal and small-scale gold mining Chlor-alkali
EU27
North Africa
Sub-Saharan Africa
Non-ferrous metals (Cu Pb Zn Al) Mercury
Large-scale gold
Cement
Product waste
Cremation
CIS amp other European countries
500
100
Middle Eastern States East and Southeast Asia
50
10 tonnes
South Asia Australia New Zealand amp Oceania
South America
North America
Central America and the Caribbean
Sub-Saharan Africa
South Asia North Africa
Middle Eastern States
EU
East and Southeast Asia
CIS amp other European countries
Australia New Zealand amp Oceania
Estimates of 2010 anthropogenic mercury emissions to air from different main sectors in different regions ASGM is shown separately to highlight its geographic distribution and better allow regional comparisons to be made for other sectors
12
UNEP Global Mercury Assessment 2013
Compiling the 2010 inventory of anthropogenic mercury emissions to air The inventories used in successive Global Mercury Assessments continue to improve as better data become available The 2013 update presents an inventory of emissions for 2010 that has a number of improvements over the 2008 assessment and its inventory for 2005
bull A more detailed analysis of emissions from some major source sectors For example fossil fuel consumption is now broken down into categories for combustion in power plants industry and other uses The type of coal or oil used is also considered providing a more accurate estimate of mercury emissions
bull A more detailed consideration of the mercury content of fuels and raw materials used in different countries and regions bull New and updated information on ASGM bull The use of different pollution control technologies
in different countries and regions have been factored into the emissions estimate bull Emission estimates for sectors not previously
included such as aluminium production oil refining and contaminated sites bull More and better information on location of major
point sources such as individual power plants smelters and cement kilns bull Better documentation and greater transparency
with respect to the data and information behind the estimates
The methods for estimating emissions from industrial sectors is complemented by other methods used for more dispersed emissions sources For example estimating emissions from some intentional-use sectors requires intensive work with those sectors Relevant and accurate information about ASGM is generally not available through official channels Estimating mercury emissions from its intentional use in lighting batteries and other products requires analysing the entire production use and waste stream to determine where mercury is likely to be released and in what quantities The approach used in the 2013 assessment addresses the emissions from breakages and wastes resulting from use of these mercury-containing products in society the majority of
which are incinerated or end up in landfills It does not however address industrial wastes or sewage sludge incineration
Uncertainties in emission estimates Estimates of mercury emissions are just that estimates To compile a global assessment requires making a number of assumptions and generalizations Uncertainty associated with the 2010 inventory arises from each of the factors used to estimate the emissions the correctness of the activity data the validity of the emission factors applied and the validity of assumptions regarding the effectiveness and use of emission-control technologies
Based on an evaluation of these sources of uncertainty and the relative contributions of sectors with reliable information and those with less reliable data uncertainty in the 2010 inventory assessment of total anthropogenic mercury emissions to air gives a range of emissions from 1010-4070 tonnes This range is greater than that reported in some previous assessments reflecting a greater appreciation of the sources of uncertainty due to the improved estimation methods and perhaps a more realistic appraisal of the state of knowledge concerning some aspects of emissions
The best estimate taking a conservative approach is 1960 tonnes If nationally produced estimates for 2010 available from some countries (Canada Japan Korea Mexico the United States and European countries reporting to LRTAP) are introduced into the global inventory in place of the inventory estimates the corresponding estimated total global anthropogenic emission to air is 1940 tonnes As most national inventories do not include uncertainty ranges it is not possible to assign a range to this number The recognition of uncertainties is an important consideration and presenting single national estimates can convey a misleading picture of what is known and more importantly not known about emissions
The numbers derived using the methods employed to produce the global inventory for 2010 were compared with a number of national inventories and emissions reported under other systems covering the same period In general the level of agreement was good in particular when the significant uncertainties
13
UNEP Global Mercury Assessment 2013
Methods for estimating emissions All global mercury emissions inventories to date have used the same basic approach for the major sectors emitting mercury to the atmosphere For specific emission sectors national emissions estimates are calculated by multiplying the amount of activity (ie amounts of fuels burned raw materials consumed or materials produced) by an emission factor that is an estimate of the mercury emitted per unit of activity For example emissions from coal-fired power generation are estimated by multiplying the tonnes of coal used by the amount of mercury estimated to be released per tonne of coal In most such inventories ldquoabatedrdquo emission factors have been employed to quantify both the emissions of mercury that occur during the processes and the effects of mercury emission controls In the new methodology used to develop the 2013 report these components are split ldquoUnabatedrdquo emission factors are employed to quantify the emissions and ldquotechnology profilesrdquo have been developed to represent the effects of mercury emission controls
Various methods are employed to estimate emissions of mercury at individual sources and at national regional and global levels In general the methods fall under one of two main categories
bull Mass-balancesubstance-flow based estimates which are based on the principle that what goes in must come out Amounts of mercury in fuels and raw materials constitute the inputs and the outputs are the amounts of mercury emitted to air released to water or land retained in products or in wastes or otherwise recovered and stored or disposed of
involved in both global and national estimates are taken into account It is important to note that there are good reasons why estimates of mercury emissions produced in the 2010 inventory may not fully agree with national inventories made by countries using other methodologies These reasons include
bull Reporting schemes may define and distinguish emissions source sectors in very different ways and aligning these sectors may not be possible
bull Industry reporting to national government may be limited to sources with emissions above a certain threshold level so that emissions from smaller sources below the threshold are not reported Where smaller sources make up a significant part of the source category reported inventories
bull Measurement-based estimates which rely on measurements made at appropriate points in the industrial process or in the productwaste output streams These measurements are used to estimate where the mercury goes as in the method above
In principle the two approaches should produce the same results In practice mass-balance based approaches tend to result in higher emission estimates than most measurement-based estimates Since future emissions reporting is likely to involve a combination of these two approaches further work is required to understand why results may differ and to reconcile the two approaches
Since the 2008 UNEP assessment was produced the number of direct measurements of emissions from certain point sources (in particular power plants and some metal and cement production plants and waste incineration facilities) has increased considerably resulting in a much improved knowledge base
A number of countries require regular reporting of emissions Increasing use is being made in these reporting systems of measurement-based estimates and facility-level reporting in particular for major point sources In other countries national mercury emissions are only being quantified for the first time Since 2005 and the start of the UNEP negotiating process in 2010 many countries have initiated work on national emission inventories which in several cases have yielded much improved information on activity data sector characteristics and mercury emissions Such inventories often make use of the UNEP Toolkit for identification and quantification of mercury emissions
may therefore significantly underestimate total mercury emissions bull National inventories in some countries are making
increasing use of actual measurements of mercury emissions at individual facilities At the global scale it is not yet feasible to base an inventory on individual site emissions Furthermore actual measurements of mercury emissions at a source may be taken only a few times during a year and may not be fully representative of normal operations In the 2013 assessment a mass-balance based approach was employed to be consistent transparent and replicable bull National reporting and monitoring schemes
may provide information that is not available to externally produced inventories
14
UNEP Global Mercury Assessment 2013
Despite these considerations most of the discrepancies noted between the 2010 inventory mass-balance-based estimates and national estimates based on measurement- approaches are modest and within the margins of error associated with the different approaches In cases where the differences are larger it is important to recognize that there are sources of error in all methods for estimating mercury emissions
Gunnar Futsaelig
ter
Sampling of mercury emissions at the Kendal coal-fired power plant in South Africa conducted under a UNEP project A probe with mercury traps is inserted into a sampling port in the stack to collect mercury present in the flue gas The mercury traps are subsequently analysed according to the US EPA Mercury Monitoring Toolkit sampling protocol
15
UNEP Global Mercury Assessment 2013
Trends in mercury emissions to the atmosphere 4 Assessing global and sectoral trends A key question in assessing anthropogenic mercury emissions worldwide is whether they are increasing or decreasing While it is tempting simply to compare the 2010 inventory with its 2005 counterpart the results would mean little As inventory methods develop and as additional sources are considered the estimate of total anthropogenic mercury emissions worldwide also changes While some changes reflect real trends others reflect changes in methods or scope Thus comparing the results of previous assessments with the present update requires considerable care and involves an understanding of the way in which these inventories have been produced and the uncertainties associated with them
It is possible however to compare certain sectors over time by attempting to compensate for any methodological changes between the various inventories since 1990
Emissions to air are thought to have peaked in the 1970s From 1990 to 2005 total anthropogenic emissions of mercury to the atmosphere appear to
Emissions to air t
1400
1200
1000
800
600
400
200
0
1990
1995
2000
2005
Africa Asia Europe Russia North Oceania South America America
Estimates of annual anthropogenic mercury emissions from different continentsregions 1990-2005
have been relatively stable with decreases in Europe and North America being offset by increases in Asia A reanalysis of the available inventories since 1990 however indicates that emissions from industrial sectors at least may be starting to increase again
The changes introduced in the 2010 inventory methodology prevent a straight-forward continuation of this analysis However an evaluation of trends for some sectors between 2005 and 2010 has been made by applying the new methodology to activity data for 2005 This comparison suggests a further slight increase in the combined amount of mercury emitted by industrial sectors (coal combustion production of cement pig iron and steel and non-ferrous metals) The following paragraphs describe the trend results for three sectors to illustrate some of the developments between 2005 and 2010 and some of the the difficulties in comparing emissions estimates between different years made with different methods
Coal burning for power generation and for industrial purposes continues to increase especially in Asia However increases in the application of air pollution controls including some mercury specific technologies together with more stringent regulations in a number of countries have reduced mercury emissions from coal burning in power plants in particular and thus offset some part of the emissions arising from increased coal consumption
In the United States for example emissions from coal burning at power plants have reportedly decreased from about 53 tonnes in 2005 to 27 tonnes in 2010 This decrease is largely due to new regulations that have resulted in changes in the sources of the coal that is burned in large power plants and the installation of mercury controls as well as controls on sulphur dioxide and particulates that have the co-benefit of further reducing mercury emissions
In China many of the new coal-fired power plants have state-of-the-art pollution controls installed
Emissions of mercury from artisanal and small-scale gold mining (ASGM) reported for 2010 are more than twice those reported for 2005 While the
16
UNEP Global Mercury Assessment 2013
Unintentional emission sectors Coal burning ferrous- and non-ferrous (Au Cu Hg Pb Zn) metal production cement production Intentional-use sectors Disposal and incineration of product waste cremation emissions chlor-alkali industry
Comparison of emissions in 2005 and 2010 by selected sector and region
Unintentional emission sectors
Emission t
1000
800
600
400
200
0 2005 2010
Australia New Zealand amp Oceania
Central America and the Caribbean
CIS amp other European countries
East and Southeast Asia
rise in the price of gold (from USD 400 per ounce in 2005 to USD 1100 per ounce in 2010) along with increased rural poverty may indeed have caused more activity in this sector the increased estimate for mercury emissions is considered to be due primarily to some more and better data from many countries and regions West Africa for example was regarded as having minimal ASGM in 2005 but is now recognized as a region with considerable activity Thus the baseline has improved without necessarily any change in actual activity or emission levels
Waste from consumer products is affected by the amount of mercury used For most products in which mercury is used mercury-free alternatives exist Consequently many of these uses of mercury are declining at least in some regions as alternative products or processes are adopted Compact fluorescent light bulbs are an exception Even though the mercury content of individual light bulbs has decreased use of this type of light bulb is increasing rapidly
Artisanal and small-scale gold mining Intentional-use sectors
1000 1000
Step change from 2005 to 2010 due to new information 800 800 (under-estimation in 2005)
600 600
400 400
200 200
0 0 2005 2010 2005 2010
European Union (EU27) South America
Middle Eastern States South Asia
North Africa Sub-Saharan Africa
North America
In order to make valid assessments of trends in emissions from global inventories comparable data on activity levels are required together with information on changes in fuel and raw material characteristics and applied air pollution control technology One aim of the 2010 inventory methods is to create a firmer foundation for such future trend analysis
Ralf Siemieniec Shutterstockcom
Use of mercury-containing energy-saving lamps is increasing
17
UNEP Global Mercury Assessment 2013
Emission scenarios and future trends The 2008 Global Atmospheric Mercury Assessment included a first attempt at projecting future emissions inventories These were based on three scenarios continuing with the status quo applying current emissions controls worldwide and achieving maximum feasible technological reductions At the time this effort was regarded as highly provisional Since then additional studies have extended and improved this work but the results are not markedly different from earlier projections of future mercury emissions
Global mercury models have been used to evaluate future scenarios Four global and hemispheric models projected mercury levels around the world in 2020 based on the three emission scenarios described earlier In industrial regions the status quo will cause an increase in mercury levels of 2-25 and in remote areas of 15-5 The two emission control scenarios on the other hand yield a decrease in mercury in industrial areas of 25-35 and in remote areas of 15-20
Another global model was coupled with estimates of surface reservoirs of mercury in order to quantify source-receptor relationships for the present and for 2050 Under the best-case scenario of maximum feasible reductions projected estimates for deposition in 2050 is similar to estimates for today In the other scenarios increasing emissions lead to increasing deposition A greater proportion of mercury emissions is expected to be in the oxidized form so that a greater proportion will be deposited near the source instead of being transported far away
The model results support the conclusion that reducing anthropogenic emissions will slowly reduce the amount of mercury in biologically available reservoirs Over time mercury in the environment will be taken out of circulation by natural processes for example from ocean waters down into sediments and biologically available mercury will decrease Increased emissions on the other hand will continue to build up the amount of mercury in circulation
With new databases and methods it may soon be possible to create scenarios that incorporate activity levels as well as technology use for each country If this were done it would allow countries to assess the effects of different mercury reduction strategies on their national emissions For example a country could determine the relative contributions of emission reduction technology as opposed to for example changes in raw materials
18
UNEP Global Mercury Assessment 2013
Atmospheric chemistry monitoring and trends 5 Forms of mercury in air Mercury in the atmosphere is in three primary forms Gaseous elemental mercury is the most common in anthropogenic and natural emissions to the atmosphere Gaseous oxidized mercury and mercury bound to particulates are less common The transport and deposition of atmospheric mercury depend greatly on whether the mercury is elemental or oxidized Elemental mercury stays in the atmosphere long enough for it to be transported around the world whereas oxidized and particulate mercury are more readily captured in existing pollution control systems or deposited relatively rapidly after their formation As a result most mercury in the air is in the gaseous elemental phase Relatively little elemental mercury is deposited directly but instead must fi rst be oxidized
Although gaseous oxidized mercury is very important in mercury cycling between air and other environmental compartments the process of oxidation in the air is poorly understood with reactions and resulting compounds yet to be verified in observations
When mercury moves from air to water and land it is generally in an oxidized gaseous or particulate form whereas when it is re-emitted to air it has been converted back to gaseous elemental
Particulate associated mercury
Pole
Equator
Gaseous elemental mercury
Global transport
Gaseous elemental mercury can be transported globally Mercury emitted in particulate form tends to deposit closer to sources
mercury Sunlight appears to play a large role in both oxidation and reduction of mercury but temperature and biological interactions are also likely to be involved to some degree Here too much uncertainty remains Nonetheless the reactions are important in determining net deposition and fate of mercury
Monitoring of mercury in air Monitoring of mercury in air focuses on the three primary forms of mercury The measurement of gaseous elemental mercury is routine and robust Measuring gaseous oxidized mercury and particulate-bound mercury however is challenging Concentrations are typically very low and these forms are chemically unstable leading to high uncertainty in the measurements Nonetheless these forms are critical for defining and modelling the fate and transport of airborne mercury
In the past two decades coordinated mercury monitoring networks and long-term monitoring sites have been established in a number of regions measuring mercury concentrations in the air as well as deposition of mercury in precipitation In Europe and North America high-quality continuous monitoring has been going on for more than 15 years especially in the Arctic High-quality monitoring has started more recently in East Asia and South Africa as part of a global effort to expand the coverage provided by long-term monitoring sites
Measurements and trends in atmospheric mercury Monitoring stations around the world have provided information about trends in atmospheric mercury though the time periods vary depending on how long the site has been active Overall a declining trend in background mercury levels over the past decade has been recorded from monitoring stations
19
UNEP Global Mercury Assessment 2013
in many regions Other regions however show an increase in mercury levels
The sites also provide information about geographical patterns reflecting both background levels of
Trends in atmospheric measurements of mercury
Site(s) Period
Mace Head Ireland 1996-2011
North America rural sites 1995-2005
High Arctic sub-Arctic Up to 20 years of records mid-latitudes
Monitoring networks Mercury monitoring in Europe is carried out under the European Monitoring and Evaluation Programme (EMEP) one of the first international environmental measurement networks Heavy metals such as mercury have been included in the EMEP program since 1999 Mercury measurements are available only from northern and northwestern Europe
Three monitoring networks currently operate in North America providing good coverage of Canada and the United States the Mercury Deposition Network the Canadian Air and Precipitation Monitoring Network and the Atmospheric Mercury Network More recently new sites have been established in Mexico extending coverage on the continent The stations monitor atmospheric mercury and mercury in precipitation which has measured since the mid-1990s Monitoring of mercury in the air and in precipitation has been underway in Asia for nearly a decade
Alert Nord
Point Barrow
Nuuk Stoacuterhoumlfethi
Mace Head
mercury and local and regional influences Mercury concentrations at remote sites in Asia are higher than in other regions of the Northern Hemisphere Coastal cities in China have lower levels than inland sites likely due to the influence of relatively clean
Measurement Trend
Gaseous elemental mercury Decrease of 14-18 per year
Total gaseous mercury Decrease of 22 to 174 in total
Total gaseous mercury Decreasing trend at some stations increasing at others
The monitoring network of the Arctic Monitoring and Assessment Programme (AMAP) includes air and deposition monitoring sites located in Arctic regions of Canada Greenland Iceland Norway Russia and Sweden
Building on existing national and regional monitoring networks the European Union-financed project
ldquoGlobal Mercury Observation Systemrdquo (GMOS) started in November 2010 Its goal is to develop a coordinated global system for monitoring mercury including a large network of ground-based monitoring stations New sites are being installed in regions where few monitoring stations exist especially in the Southern Hemisphere Two sites have been established in Antarctica one on the Antarctic Plateau and one on the coast
Ny-Aringlesund
Amderma Pallas
Raringouml Bredkaumllen
Listvyanka Diabla Gora
Mauna Loa
Mt Bachelor
Celestuacuten Calhau
Longobucco
Iskrba Niembro Monte Cimone Cap
Ferrat Mt Waliguan Ganghwa Island
Lulin
Cape Hedo Ev-K2
Mt Changbai
Minamata Mt Ailao
Nieuw Nickerie
Kodiakanal
Maheacute Island Manaus
Bariloche Cape Point
Amsterdam Island Cape Grim
Dumont drsquoUrville
AMAP CAMnet EMEP GMOS GMOS associated NADPAIRMoN NADPMDN
Air + precipitation Air Precipitation
20
UNEP Global Mercury Assessment 2013
John Munthe
The mercury background air monitoring station at Zeppelin mountain Svalbard
air from over the ocean Sites off the Asian coast however show higher levels of gaseous elemental mercury than the Northern Hemisphere background suggesting an outflow from the Asian mainland
Weather patterns have also been found to have a strong influence on seasonal patterns in mercury levels in the air at monitoring sites At the Mount Waliguan Observatory on the Tibetan Plateau for example northeasterly and easterly winds produced the highest levels of mercury
Measurements at high altitudes Measurements from ground-based stations above 2700 meters suggest that there is an inverse relationship between gaseous elemental mercury and gaseous oxidized mercury at these elevations In other words when there is more elemental mercury there is less oxidized mercury and vice versa These measurements are in good agreement with modelling results which gives additional confidence in current understanding of the behaviour of mercury at high altitude
An inverse relationship between total gaseous mercury and particulate concentration has also been observed in the high stratosphere From the transformation rate of total gaseous mercury to particulate-bound mercury it appears that gaseous mercury lasts about two years in the stratosphere
21
UNEP Global Mercury Assessment 2013
Atmospheric concentrations and deposition 6 Measurements and trends of mercury in precipitation Mercury deposited by precipitation decreased from the 1990s into the 2000s at many but not all sites in North America and Western Europe where such measurements were taken
Regional patterns are also evident including slightly higher levels in southern Europe than northern Europe and higher levels in Asia than in North America Total mercury concentrations in precipitation in China were much higher than those in Japan and South Korea Th is was mostly attributed to higher levels of gaseous oxidized mercury and particulate-bound mercury which are readily deposited by precipitation and thus not transported far
A comparison of data from Canadian and American monitoring sites found that deposition of mercury in precipitation was highest in summer
Dry deposition of mercury which is deposition not associated with precipitation is diffi cult to measure and consequently there is little information on trends in mercury dry deposition Th is lack of information means that it is also diffi cult to validate model results for dry deposition
106 44
474 72 91
5 7 71
05 1 5 10 100 500 1000
Total mercury emission (2005) kgcell
Modelled mercury air concentrations and deposition patterns Atmospheric mercury concentrations are highest in major industrial regions Models examining global patterns show that East and South Asia Europe North America and South Africa have the highest levels of elemental mercury in the air Concentrations are generally lower in the Southern Hemisphere than the Northern Hemisphere because most industrial activity is in northern regions Th ese model results are based on simulations using the 2005 global mercury emission inventory because the 2010 inventory has only recently become available
Intercontinental transport of mercury in the air has been examined to determine its impact on regional mercury levels Four models using diff erent parameters produced consistent results Depending on the region mercury emitted by distant sources contributes between 10 and 30 of annual mercury deposition Where local sources are low mercury transported from distant emission sources can account for more than half of the deposition East Asia is the dominant source region adding 10-14 to the deposition in
Contribution from sources outside receptor region
Model 40
GEOS-Chem GLEMOS GRAHM CMAQ-Hg
30
20
10
0 Arctic Europe North East Asia South Asia
America
Receptor region
(Left ) Global distribution of anthropogenic mercury emissions in 2005 with source regions that were considered in the analysis (North America South America Europe Africa Central Asia South Asia East Asia Australia and Oceania) and (right) the contribution of anthropogenic sources outside a particular receptor region to deposition within the receptor region
22
UNEP Global Mercury Assessment 2013
Modelling atmospheric transport and deposition Global models reproduce the movement of mercury in the atmosphere during which the mercury may move between continents They have been effective in examining sources of mercury to the Arctic and also for examining the outflow of pollution from South and Southeast Asia and its impact on western North America as well as the flow from eastern North America to Europe
Regional models on the scale of a continent or a basin such as the Mediterranean can provide more detail about specific source areas even to the level of individual industrial areas Reliable results however require a detailed understanding of mercury oxidation in the atmosphere about which there is considerably uncertainty
Most atmospheric transport models consider the full chain of mercury processes in the atmosphere Some models also consider how mercury is cycled in other atmospheric compartments such as soil vegetation snow freshwater and seawater
One of the largest sources of uncertainty in mercury models is the chemical mechanism used to determine how mercury changes forms in the air Improved experimental data can help improve model performance by making sure that the correct reactions are simulated The processes that lead from deposition to re-emission also need to be understood better Advances in this area show promise with model results becoming closer to estimates based on experimental data
other regions of the world Natural emissions and re-emissions account for 35-70 of total deposition in most regions Deposition is generally greater in low and mid-latitudes due to stronger sunlight higher concentrations of oxidants and higher precipitation
Regional mercury models show patterns at the scales of continents or individual seas The Mediterranean Sea for example is a net source of mercury as it emits more than is deposited to it In that region dry deposition generally exceeds deposition of mercury in precipitation In Central and Southern Europe total gaseous mercury concentrations and deposition in precipitation were both consistently higher than the European average
Across the United States dry deposition accounts for two-thirds of total annual deposition mainly from gaseous oxidized mercury A study examining sources and deposition of mercury to assess the
benefits of proposed emission control measures found that mercury transport from outside the country accounts for 68 of mercury deposition in the Northeast and up to 91 in the west-central United States Large point sources contribute up to three-quarters of nearby deposition and power plants contributed half of the deposition in the eastern part of the country This suggests that new emissions standards would primarily benefit eastern regions of the US
In Asia studies show high seasonal variation in mercury concentration and deposition Anthropogenic emissions are responsible for about 75 of deposition in East Asia In this region there is a net removal of gaseous oxidized mercury from the atmosphere and a net export of gaseous elemental mercury
In the Arctic gaseous elemental mercury levels in the atmosphere are depleted rapidly in spring when after the long Arctic winters sunlight returns Ozone is depleted at the same time and it is believed that bromine-containing compounds are the cause of the photo-chemical reactions that deplete ozone and mercury During these events gaseous oxidized mercury and particulate-bound mercury levels increase sharply suggesting that the gaseous mercury is oxidized and deposited enhancing mercury deposition in Arctic areas in springtime Recent research however has found that 50-80 of the deposited mercury is re-emitted within a few days Similar springtime mercury depletion events have been seen in Antarctica
23
UNEP Global Mercury Assessment 2013
Anthropogenic releases to the aquatic environment 7 Global assessment Previous UNEP global mercury assessments only considered emissions to the atmosphere The 2013 Report presents the first attempt at compiling a global inventory of mercury releases to aquatic environments Releases directly into the aquatic environment present a completely different chemistry set of pathways and fate to those released to air They are also more directly linked to the risks posed by mercury to global environmental and human health Unlike mercury releases to air which are predominantly in the form of gaseous elemental mercury releases to water are predominantly inorganic mercury and to a lesser extent liquid elemental mercury
At present only some sources of aquatic releases can be quantified with any confidence Thus many sources that may be important are not included in this first assessment of global aquatic releases For example land management practices that expose new geological sources of mercury in rocks and mineral soils or that re-mobilize previously deposited mercury cannot yet be assessed Two broad categories of current anthropogenic sources are considered here point sources of mercury release to water and diffuse releases of mercury as a result of its remobilisation from areas where it was previously deposited or accumulated due to human activity (ie contaminated sites) Artisanal and small-scale gold mining (ASGM) mercury-containing pesticides and fungicides used in agriculture and deforestation are considered separately
Point source releases to water from various sectors in tonnes per year with the range of the estimate and as a percentage of total anthropogenic emissions
Sector Releases (range) tonnes
Non-ferrous metal production 925 (193 - 268)
Consumer product waste 894 (222 - 308)
Chlor-alkali production 28 (10 ndash 55)
Oil refining 06 (03 ndash 1)
Grand Total 185 (426 ndash 582)
The global estimate of mercury release to water from point sources has been derived from the atmospheric emissions assessment and the approach employed in the UNEP Toolkit to partition total mercury releases between air land and water This approach has considerable uncertainty and may omit sectors where releases to water are high but air emissions are unimportant and therefore not addressed in the inventory Global releases from point sources were estimated to be 185 tonnes per year
For diffuse sources evaluating the relative contribution of anthropogenic and natural sources to the aquatic environment requires determining considerations of the various mercury inputs For some sectors data exist that allow a preliminary assessment of the amounts of mercury re-mobilized into aquatic systems
For mercury-contaminated sites the range of average soil concentrations of mercury reported for sites where mercury was mined used or otherwise released by human activity was considered The area of contamination is then used to determine how much mercury is available in soils and when combined with a factor for how much mercury is released from those soils in a year the total release can be estimated Among identified contaminated sites mercury mining is identified as the largest sector followed by mining of precious metals Total releases to aquatic environments from contaminated sites are estimated to be 83-335 tonnes per year
Releases to water from contaminated sites in tonnes per year with the range of the estimate
Sector Releases (range) tonnes
Primary mercury mining sites 67 ndash 266
Precious metal production sites 14 ndash 55
Non-ferrous metal production sites 01 ndash 05
Chlor-alkali production sites 01 ndash 05
Other industrial sites 01 ndash 03
Grand Total 83 ndash 335
24
UNEP Global Mercury Assessment 2013
Much of the mercury released from artisanal and small-scale gold mining goes into rivers lakes soils and sediments and tailings From soils and tailings it may be re-mobilized by leaching and erosion In addition mining may disturb mercury-containing soils and sediments that may then erode more quickly releasing more mercury than would otherwise have become available from natural erosion A key factor in these processes is the local hydrological cycle of precipitation evaporation run-off and river flow To account for this in the assessment countries were designated as dry wet or intermediate to determine the relative importance of erosion The tropical and subtropical countries which have the greatest activity in this sector also tend to experience high precipitation and run-off exacerbating this source of mercury release and re-mobilization Total worldwide releases of mercury to land and water from ASGM were estimated at over 800 tonnes per year How much of this is released to water cannot yet be determined
Mercury continues to be used in pesticides and fungicides 2100 tonnes of mercury were released in the decade of the 1960s through such agrochemical uses Current data are unavailable although the use of mercury in these products has been greatly reduced
Deforestation especially in the Amazon Basin can lead to extensive soil erosion and thus the release of mercury previously accumulated in soils Using 2010 figures for deforestation rates around the world and an estimate of soil concentrations of mercury as much as 260 tonnes of mercury may have been released into rivers in 2010 as a result of deforestation worldwide
Because this is the first attempt to quantify global mercury releases to the aquatic environment there is no previous measurement against which these results can be compared Thus it is not possible at this time to evaluate trends in releases
Uncertainties in release estimates Estimating global releases of mercury to aquatic environments is being done here for the first time Many data are missing and others are imprecise A number of assumptions have been made based on what measurements are available or on other grounds to extrapolate from known quantities or to calculate aquatic releases in relation to atmospheric
or other emissions Thus the results should be treated with great caution It is nonetheless clear that anthropogenic sources and human activity contribute hundreds of tonnes of mercury to aquatic environments each year a substantial amount relative to estimated natural releases 150-960 tonnes per year from terrestrial environments
Lapshin Shutterstockcom
Phil Augustavo istockphotocom
Bureau of Land Managem
ent
Contaminated sites (top) erosion following deforestation (middle) and a flooded store of mercury-contaminated waste (lower) illustrate potential sources of mercury releases to water
25
UNEP Global Mercury Assessment 2013
Aquatic pathways transport and fate 8 Mercury in aquatic environments The pathways and fate of mercury in aquatic environments are important because it is in waters sediments and wetland soils that inorganic mercury is converted into methylmercury which is toxic and concentrates in animals The majority of human exposure to mercury and the health risk that comes with mercury exposure is from consumption of marine foods Thus this section focuses on the worldrsquos oceans Some freshwater systems however are important sources of fish for human consumption especially for subsistence and recreational fisheries often among indigenous peoples Artisanal and small-scale gold mining (ASGM) communities may also be affected through fish consumption and drinking water if those are contaminated by local releases
The major processes of mercury cycling are generally similar for all aquatic systems Inorganic mercury in dissolved or particulate form is the dominant mercury type in most marine and fresh waters Dissolved gaseous elemental mercury accounts for less than 30 of total mercury in water Methylmercury is often present at trace levels but may in some settings reach 30 of total mercury In freshwater and coastal environments inorganic mercury is transformed into methylmercury primarily in sediments In the open ocean this conversion takes place largely at intermediate depths between 200 and 1000 meters in the water column Mercury is lost from aquatic systems in two ways When inorganic mercury is reduced to elemental mercury it can be re-emitted to the atmosphere When inorganic mercury binds to particulates in water it can settle out rapidly and be buried in sediments Deep burial in ocean sediments is one of the major pathways by which mercury is removed from the biologically active environment
The global mercury cycle is chemically and physically complex Thus it is necessary to use models to study describe and predict what happens and will happen to mercury in the aquatic environment Until recently only one model existed that incorporated
air land and water into a unified whole The model has been validated against observations of mercury and represents the current scientific consensus The largest potential errors in this model in terms of the aquatic cycle concern details of the exchange of mercury between air and water
Pathways and fate of mercury in the oceans Model simulations suggest that anthropogenic impacts on mercury levels in the ocean are greatest in the surface waters the top 100 meters or so of the water column While model results vary one recent estimate suggests that anthropogenic emissions over the last 100 years have doubled the concentration of mercury in the surface layer of the ocean and increased it by 25 in intermediate waters and by 10 in deep waters The difference is due to the length of time it takes for surface waters to circulate to the depths
Models and measurements agree that direct deposition from the atmosphere is the dominant pathway by which mercury reaches the oceans The exceptions are smaller semi-enclosed basins such as the Mediterranean Sea or the Arctic Ocean where river runoff coastal erosion and ocean currents
Ugo M
ontaldo Shutterstockcom
26
UNEP Global Mercury Assessment 2013
account for about half of mercury inputs The most recent modelling effort suggests that total deposition input of mercury to the oceans in 2008 was 3700 tonnes
Other mercury pathways appear less important on a global basis Rivers are estimated to carry more than 2800 tonnes of mercury each year but only about 380 tonnes of this is transported offshore The rest is trapped by particles in estuaries Groundwater and re-mobilization from sediments provide 100shy800 tonnes of mercury to the oceans each year Undersea hydrothermal vents add less than 600 tonnes of mercury to the oceans There are high concentrations of mercury in vent fluids but a great deal of the mercury is precipitated as solids once the vent fluids enter seawater
Models suggest that globally about 70 of the mercury deposited into the ocean is re-emitted to the atmosphere Oxidized mercury in surface waters is reduced by biological and photochemical processes to the elemental form that is volatile and readily re-emitted The removal of this mercury ultimately reduces the pool of mercury that could be converted to methylmercury and be accumulated by marine organisms The re-emission process thus simultaneously prolongs the lifetime of mercury cycling through the atmosphere and upper ocean and acts to reduce mercury availability for marine food webs
Any changes in the efficiency of mercury reduction in surface waters or the rate of re-emission is likely to impact mercury concentrations in surface waters and the air One example is the effect of sea ice in the Arctic Ocean which blocks the re-emission
Tony Magdaraog Shutterstockcom
Mercury accumulated in marine food-webs can enter the human diet
of elemental mercury leaving elevated levels in waters under ice Changes in primary productivity could change the rate at which mercury is bound to particles thus affecting re-emission to the atmosphere as well as rates of downward transport in the ocean Changes in oxidant levels in the atmosphere such as ozone and bromine may also influence the rate of oxidation of gaseous elemental mercury and thus deposition rates to the ocean
Methylmercury in the ocean Natural bacterial processes in seawater and in sediments in coastal environments convert inorganic mercury to methylmercury Methylmercury levels are highest in the subsurface waters of many oceans because it is formed at these intermediate depths likely as a result of the decomposition of organic material falling from surface waters Current understanding indicates that about 300 tonnes of methylmercury is produced in the upper ocean by this and related processes By contrast only about 80 tonnes of methylmercury reaches the ocean from other sources such as atmospheric deposition rivers and diffusion from sediments
Current modelling indicates that methylmercury stays in the upper ocean for about 11 years Deshymethylation by photochemical reaction or by microbial activity is the major removal process for methylmercury in the ocean About 240 tonnes of methylmercury is removed by this process from the surface waters of the ocean per year
The other important pathway for methylmercury in seawater is uptake into marine food webs Although only about 40 tonnes per year is taken up in this way it is this fraction that poses risks to marine animals and human consumers of seafood Methylmercury is a problem for several reasons First it is taken up by plankton much more efficiently than is inorganic mercury resulting in concentrations in plankton that are as high as 10000 times the concentration in seawater Second methylmercury is absorbed through the intestine of animals much more easily than is inorganic mercury Third methylmercury biomagnifies as it moves up the food web Thus methylmercury becomes an increasingly greater proportion of the mercury in organisms higher in the food web This explains why some indigenous populations that consume top marine predators such as fish seals and whales have some of the worldrsquos highest concentrations of methylmercury giving rise to health concerns
27
UNEP Global Mercury Assessment 2013
Pathways and fate of mercury in freshwater Observations and modelling both show that there are in general many similarities between mercury chemistry pathways and fate in lakes and in the oceans but with obvious differences in scale and in the relative importance of different processes Modelling of mercury dynamics was done for four lakes with a history of direct mercury inputs from the largest freshwater lake in the world (Lake Superior) to small lakes in Ontario Canada Atmospheric deposition and river inflow were the main sources of inorganic mercury Much of the mercury input from lake and river catchments was associated with dissolved and particulate organic matter The dominant mercury removal mechanisms as in saltwater were burial in sediments and photochemical reduction of oxidized mercury to elemental mercury followed by re-emission to the air In Lake Superior and Lake Michigan there is evidence for methylation of mercury in the water column as is seen in the open ocean
Methylmercury levels in freshwater fish vary with the level of deposition of mercury from the air though other factors such as inputs from the watershed and the number of trophic levels within the lakersquos food web are also important Methylation predominantly occurred in lake sediments and wetlands and floodplain soils where sulphateshyreducing bacteria are believed to be primarily responsible Methylmercury is de-methylated in sediments and also taken away in the outlet river from each lake
Some 400-1400 tonnes of mercury are estimated globally to be trapped behind dams and other man-made impoundments each year This has in many cases led to significant increases in total mercury and methylmercury levels in water and of methylmercury in fish and other aquatic species When artificial lakes are created plant material is submerged leading to decay and anoxia In these conditions microbially driven methylation of inorganic mercury takes place In some cases the elevated mercury levels have also been observed downstream from the artificial lakes and reservoirs
Anthropogenic impacts on aquatic mercury levels Two studies have reported that the Atlantic and Pacific Oceans have shown opposing trends over recent decades While the influence of changing ocean currents and other oceanographic factors may be a factor the trends do make sense in light of patterns of anthropogenic emissions In the North Pacific Ocean mercury concentrations appear to have increased at depths between 200 and 1000 meters over the last few decades This increase coincides with the rapid industrialization of East Asia
In the North Atlantic however results from near Bermuda suggest a substantial decrease in mercury concentration and a change in the mercury profile through the water column The Mediterranean Sea too showed a decrease in mercury concentration between 1990 and 2004 These findings are consistent with atmospheric data from around the North Atlantic The conclusion is that mercury levels in seawater in the North Atlantic were elevated by human activity but may now be declining likely as a result of decreased emissions from North America and Europe
A complementary approach to measuring mercury in seawater is to measure mercury in aquatic animals which accumulate and integrate mercury over time Teeth hair feathers and eggshells are useful long-term archives of mercury concentrations and can provide data from the pre-industrial period (ie before 1800) as well as more recent periods
Among marine animals samples are available from several regions particularly from the Arctic where cold dry conditions help preserve animal tissues Mercury concentrations between the 13th and 16th
centuries were relatively stable From the mid- to late 19th century to the end of the 20th century mercury levels increased by an average of 12 times On average therefore about 92 of the mercury in Arctic marine wildlife today is likely to be of anthropogenic origin
Similar findings were found for a 700-year sequence of seabird eggshells from the South China Sea Mercury levels increased steadily between 1800 and 2000 with a particularly rapid increase after 1970 Concentrations since 2000 are about 10 times higher than pre-industrial levels with 91 of the mercury now likely to be of anthropogenic origin In the Antarctic studies of seal hairs show that pre-industrial mercury levels were only 60 of recent levels The relatively small difference
28
UNEP Global Mercury Assessment 2013
Historical Hg concentration as a proportion of present-day 100
80
60
40
20
0
Beluga teeth Human teeth
Gyrfalcon feathers Perigrine falcon feathers
Polar bear hair Ringed seal teeth
1200 1300 1400 1500 1600 1700 1800 1900 2000
between pre-industrial and modern mercury levels in Antarctic is consistent with lower mercury emissions and atmospheric concentrations in the Southern Hemisphere as compared with the Northern Hemisphere
The timing of long-term increases of mercury in aquatic animals can shed light on the likely sources of mercury emissions that were responsible The industrialization of Europe and North America appear responsible for the large increases in marine mercury levels that began in the 19th century as these increases occurred prior to recent Asian industrialization As with water concentrations in the Pacific Ocean recent rapid increases in mercury in seabird eggs in the South China Sea coincide with industrialization in Asia
The time lag in aquatic ecosystem response One important conclusion from air-ocean modeling is that the oceans have not yet reached equilibrium with current atmospheric levels of mercury This lag is due to several factors First mercury stays in the upper ocean above 200 meters depth for about 30 years and for centuries in intermediate and deep waters This is much longer than the one year residence time in the lower atmosphere Thus removal from the ocean takes much longer than does removal from the air and so concentrations will change more slowly
Second because of the long lifetime of mercury in deeper ocean waters a great deal of natural mercury is present in the ocean already about 100000 tonnes out of a total of 135000 tonnes in intermediate waters and 200000 out of 220000 tonnes in deep waters
Rune Dietz
Analysis of museum samples reflects the increase in mercury emissions and releases since the mid-19th century associated with anthropogenic activities
Third vertical transport of mercury from intermediate depths back to the surface returns a substantial amount of mercury to the biologically active zone each year As a result average mercury concentrations in seawater and marine animals are likely to increase slowly for decades if not centuries even if atmospheric levels stabilize at present levels In short the effects of historical anthropogenic emissions from Europe and North America are still being observed in the oceans at the same time that the effects of the recent rise in emissions from Asia are being seen
Regionally different trends can be expected depending on distance from sources and ocean circulation patterns In the North Atlantic north of 55deg N it will take 50-600 years to achieve equilibrium between atmospheric and seawater mercury levels In the North Pacific this process is estimated to take 500-700 years and in the Antarctic 700-1000 years The Arctic Ocean by contrast is smaller and will only take about 35 years to reflect changes in atmospheric mercury levels Surface waters of the Mediterranean Sea should show also changes within 10-50 years
Time lags in the responses of many freshwaters and their food-webs to changes in atmospheric mercury levels are also expected Although some immediate recovery following reductions in atmospheric mercury deposition rates is likely full recovery may take decades centuries or longer depending on the characteristics of the area Highly polluted freshwaters with catchments and sediments containing large amounts of anthropogenic mercury will recover most slowly as is already observed around point sources such as smelters that have closed down
29
UNEP Global Mercury Assessment 2013
Major gaps in knowledge 9 Large uncertainties remain in global estimates of mercury emissions to the air These stem from various sources including the availability of information on activity levels but mainly from the lack of information concerning the mercury content of some raw materials and the validity of assumptions regarding processes and technologies employed to reduce mercury emissions including their rates of application and effectiveness The accuracy and precision of measurement-based estimates can depend on the validity of extrapolating measurements made at infrequent intervals to longer periods or measurements made at one plant to other facilities with similar operations
Potentially important emissions sectors that are still not quantified in the emissions inventory include the use of mercury in vinyl-chloride monomer production secondary metals production oil and gas extraction transport and processing industrial and hazardous waste incineration and disposal sewage sludge incineration and dental fillings preparation and removal
Current measurements and their evaluation are inadequate for determining spatial and temporal trends Improved more extensive and better coordinated measurements are needed A permanent global integrated monitoring network for atmospheric mercury and mercury deposition is needed to achieve this goal The atmospheric network sites should be closely integrated with water soil and biological monitoring networks The results can be used for model testing and evaluation as well as for more accurately detailing the geographic impact of anthropogenic emissions Monitoring of mercury concentrations in the important marine food species is essential to understanding possible human health impacts and the effects of future emissions changes
Better data on mercury distribution in the troposphere is needed to improve understanding of long-range transport and source-receptor relationships Coordinated studies at high altitudes and by aircraft are needed This information will
also help validate regional and global scale models improving their prediction capabilities with regard to different policy scenarios
Key processes related to global transport and cycling of mercury remain inadequately understood The chemical form of gaseous oxidized mercury is unknown Reduction and oxidation rates for mercury in the presence of atmospheric oxidants need further study including determining which oxidants are important New measurements and modelling studies are needed to examine key chemical and physical processes that affect global transport and cycling
Few data are available for reporting mercury releases to aquatic systems Systematic and consistent monitoring of mercury releases to the air is required especially for contaminated systems Releases of mercury from soils into waters depend greatly on climate and topography and these parameters need to be better accounted for Consistent approaches for measuring and reporting releases from point sources are needed to ensure comparability of data from around the world In particular the actual role of artisanal and small-scale gold mining (ASGM) in emissions to air and releases to water needs to be more accurately estimated
The link between mercury deposition methylation and uptake by living organisms needs further study The parameters that determine the rates of exchange of mercury compounds between air and sea air and soil and air and vegetation are not fully understood Whole-ecosystem studies of mercury are needed to better understand biogeochemical cycling Methylationdemethylation rates and their spatial and temporal variations and relationship to climatic factors need to be determined in most of worldrsquos major ocean basins as well as in representative freshwaters
30
UNEP Global Mercury Assessment 2013
Key findings of the 2013 assessment 10 Atmosphere Total anthropogenic emissions of mercury to the atmosphere in 2010 are estimated at 1960 (1010shy4070) tonnes which is about 30 of the total mercury that was emitted and re-emitted from anthropogenic and natural sources in that year The largest anthropogenic sources are associated with artisanal and small-scale gold mining (ASGM) and coal burning which together account for about 62 of the annual total anthropogenic emissions to air Other major sectors include ferrous and non-ferrous metal production and cement production
East and Southeast Asia are responsible for about 40 of global anthropogenic emissions About 75 of the mercury from this region comes from China which is about one-third of the global total Increased estimates for emissions from ASGM largely a result of newly obtained data and improved information mean that South America and Sub-Saharan Africa are also responsible for a greater proportion of global emissions than was previously assumed
Anthropogenic emissions over time have increased mercury loads present in the environment This leads to higher rates of re-emission and also means that there will be a time lag of years or decades between emissions reductions and lower mercury levels in the food web including pathways of human exposure
Mercury emissions to the atmosphere likely peaked in the 1950s to 1970s and subsequently declined because of reductions in Europe Russia and North America Emission trends are unclear due to changes in methods employed to produce inventories and differences in the sectors that have been accounted at different times There are however some indications that emissions may be rising again with increases from East Asia offsetting continuing reductions in Europe and North America
Aquatic environments Natural processes in aquatic systems convert less toxic elemental and inorganic mercury into much more toxic methylmercury Methylmercury concentrates and accumulates in the food web leading to high concentrations in some species of seafood and fish that many people eat
Anthropogenic releases of mercury to aquatic environments contribute hundreds of tonnes to the amount of mercury cycling in the environment Diffuse releases and point sources appear equally important Atmospheric deposition however remains the most important input of mercury to land and oceans and has increased the amount of mercury in many environmental compartments by a factor of two or three since the start of the industrial age On land mercury that is deposited is largely retained in soils and vegetation increasing the available pool for re-mobilisation to adjacent aquatic systems Re-emission from soils however is a major addition to atmospheric mercury
Hydrology is the most important factor in the transport of mercury from catchments to downstream environments Relatively little of this mercury reaches the open ocean as most is captured in sediments behind dams in estuaries and near the coast Changes in land cover and land use can have a large effect on mercury mobilisation as exposed soils erode and mercury leaches into the water table
Concentrations of mercury in Arctic marine animals today are about 10-12 times higher than in preshyindustrial times (ie prior to about 1800) This means that on average about 92 of the mercury in marine predators such as seabirds seals and whales is anthropogenic in origin The timing of the increase suggest that 19th and early 20th century emissions from Europe North America and Russia were responsible Increases mercury concentrations in seabirds in the South China Sea appear to be more recent than the Arctic increases coinciding with increasing industrialisation in East and Southeast Asia
31
UNEP Global Mercury Assessment 2013
K+S Entsorgung Gm
bH
Recovered mercury is being stockpiled at long-term storage sites above- and as shown here below ground
The upper 100 meters of the oceans have twice the mercury that they did a century ago Intermediate and deeper waters have 10-25 more mercury on average reflecting the slow transport of mercury downwards in the oceans Seawater concentrations will thus be especially slow in responding to changes in mercury inputs from atmospheric deposition and river flow As a result mercury concentrations in marine biota are likely to increase slowly for decades to centuries even without an increase in atmospheric emissions
In freshwater ecosystems atmospheric deposition and re-mobilisation from soils slow the reduction of mercury levels even in regions where atmospheric concentrations have decreased due to emission controls
Further increases in atmospheric emissions will have long-term consequences for commercial fisheries and all consumers of marine and freshwater foods
It is likely to be years or decades before reductions in anthropogenic emissions and releases of mercury have a demonstrable effect on mercury levels throughout the environment and in the fish and marine mammals which are part of the human food-chain This only reinforces the need to act now to continue and strengthen international efforts to reduce current mercury emissions and releases Delays in action now will inevitably lead to slower recovery of the worldrsquos ecosystems in future from mercury contamination leaving an even greater legacy of pollution for future generations
32
Division of Technology Industry and Economics (DTIE) Chemicals Branch Geneva Switzerland January 2013
Job number DTI1636GE
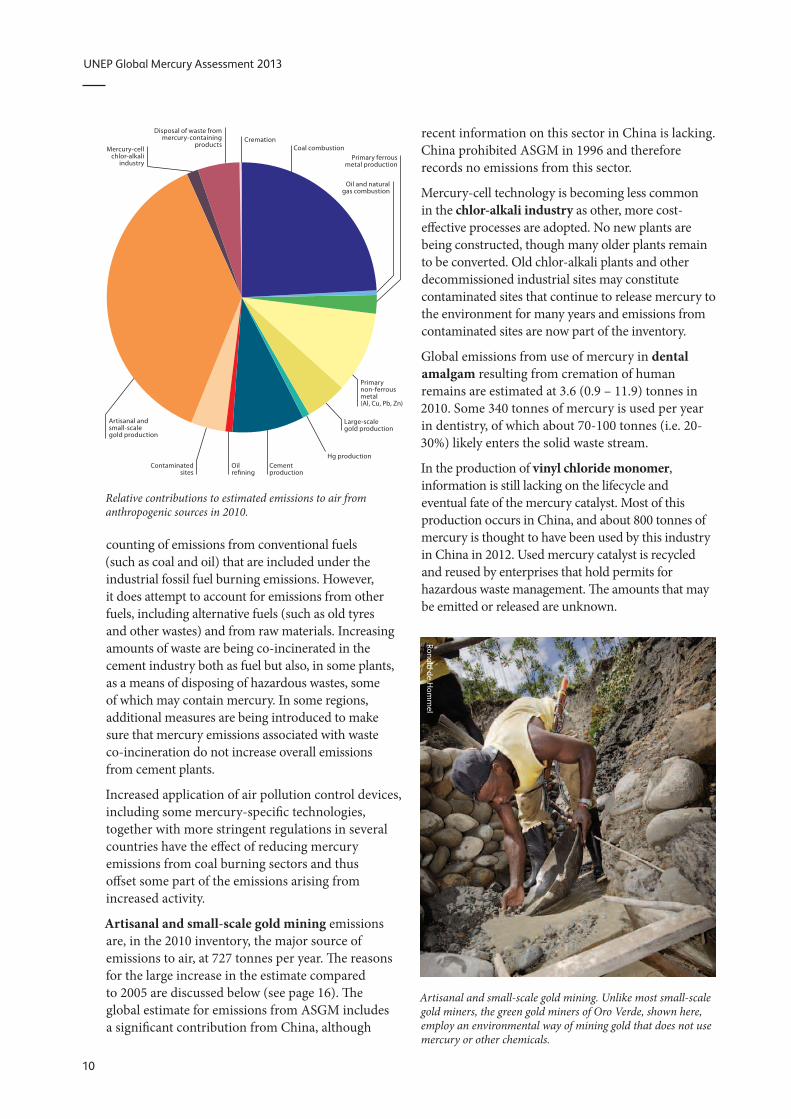
UNEP Global Mercury Assessment 2013
Disposal of waste from
Mercury-cell chlor-alkali
industry
Relative contributions to estimated emissions to air from anthropogenic sources in 2010
Oil refining
Coal combustion
Oil and natural gas combustion
Primary ferrous metal production
Primary non-ferrous metal (Al Cu Pb Zn)
Large-scale gold production
Hg production Cement production
mercury-containing products
Contaminated sites
Cremation
Artisanal and small-scale gold production
counting of emissions from conventional fuels (such as coal and oil) that are included under the industrial fossil fuel burning emissions However it does attempt to account for emissions from other fuels including alternative fuels (such as old tyres and other wastes) and from raw materials Increasing amounts of waste are being co-incinerated in the cement industry both as fuel but also in some plants as a means of disposing of hazardous wastes some of which may contain mercury In some regions additional measures are being introduced to make sure that mercury emissions associated with waste co-incineration do not increase overall emissions from cement plants
Increased application of air pollution control devices including some mercury-specific technologies together with more stringent regulations in several countries have the effect of reducing mercury emissions from coal burning sectors and thus offset some part of the emissions arising from increased activity
Artisanal and small-scale gold mining emissions are in the 2010 inventory the major source of emissions to air at 727 tonnes per year The reasons for the large increase in the estimate compared to 2005 are discussed below (see page 16) The global estimate for emissions from ASGM includes a significant contribution from China although
recent information on this sector in China is lacking China prohibited ASGM in 1996 and therefore records no emissions from this sector
Mercury-cell technology is becoming less common in the chlor-alkali industry as other more cost-effective processes are adopted No new plants are being constructed though many older plants remain to be converted Old chlor-alkali plants and other decommissioned industrial sites may constitute contaminated sites that continue to release mercury to the environment for many years and emissions from contaminated sites are now part of the inventory
Global emissions from use of mercury in dental amalgam resulting from cremation of human remains are estimated at 36 (09 ndash 119) tonnes in 2010 Some 340 tonnes of mercury is used per year in dentistry of which about 70-100 tonnes (ie 20shy30) likely enters the solid waste stream
In the production of vinyl chloride monomer information is still lacking on the lifecycle and eventual fate of the mercury catalyst Most of this production occurs in China and about 800 tonnes of mercury is thought to have been used by this industry in China in 2012 Used mercury catalyst is recycled and reused by enterprises that hold permits for hazardous waste management The amounts that may be emitted or released are unknown
Ronald de Hom
mel
Artisanal and small-scale gold mining Unlike most small-scale gold miners the green gold miners of Oro Verde shown here employ an environmental way of mining gold that does not use mercury or other chemicals
10
UNEP Global Mercury Assessment 2013
Results by region The greatest proportion of anthropogenic mercury emissions to the atmosphere comes from Asia which contributes about 50 of the global total The majority of Asian emissions come from East and Southeast Asia China accounts for three-quarters of East and Southeast Asian emissions or about one third of the global total
New data on emissions from ASGM have increased the proportion of global emissions attributed to South America and Sub-Saharan Africa largely due to increased estimates associated with improved information about ASGM activities in these areas
Emissions to air from other major source sectors are higher in Europe North America and Oceania
Mercury emission 2010 gkm2
0 2 5 10 100 1000
Global distribution of anthropogenic mercury emissions to air in 2010
Emissions from various regions in tonnes per year with the range of the estimate and as a percentage of total global anthropogenic emissions Note These numbers cannot be compared directly with those presented in the 2008 assessment (see Chapter 4 Trends in mercury emissions to the atmosphere)
See figure on the following Region Emission (range) tonnes page for map with
Australia New Zealand amp Oceania 223 (54 - 527) 11 specification of regions Values rounded to 3 Central America and the Caribbean 472 (197 - 974) 24
significant figures CIS amp other European countries 115 (426 - 289) 59
East and Southeast Asia 777 (395 - 1690) 397
European Union (EU27) 875 (445 - 226) 45
Middle Eastern States 370 (161 - 106) 19
North Africa 136 (48 - 412) 07
North America 607 (343 - 139) 31
South America 245 (128 - 465) 125
South Asia 154 (782 - 358) 79
Sub-Saharan Africa 316 (168 - 514) 161
Undefined (global total for emissions from 825 (700 - 950) 42 contaminated sites)
Grand Total 1960 (1010 ndash 4070) 100
11
UNEP Global Mercury Assessment 2013
North America
Central America and the Caribbean
South America
Unintentional emissions
Stationary combustion (coal)
Stationary combustion (oil and gas) Oil refining
Pig iron and steel
Intentional uses
Artisanal and small-scale gold mining Chlor-alkali
EU27
North Africa
Sub-Saharan Africa
Non-ferrous metals (Cu Pb Zn Al) Mercury
Large-scale gold
Cement
Product waste
Cremation
CIS amp other European countries
500
100
Middle Eastern States East and Southeast Asia
50
10 tonnes
South Asia Australia New Zealand amp Oceania
South America
North America
Central America and the Caribbean
Sub-Saharan Africa
South Asia North Africa
Middle Eastern States
EU
East and Southeast Asia
CIS amp other European countries
Australia New Zealand amp Oceania
Estimates of 2010 anthropogenic mercury emissions to air from different main sectors in different regions ASGM is shown separately to highlight its geographic distribution and better allow regional comparisons to be made for other sectors
12
UNEP Global Mercury Assessment 2013
Compiling the 2010 inventory of anthropogenic mercury emissions to air The inventories used in successive Global Mercury Assessments continue to improve as better data become available The 2013 update presents an inventory of emissions for 2010 that has a number of improvements over the 2008 assessment and its inventory for 2005
bull A more detailed analysis of emissions from some major source sectors For example fossil fuel consumption is now broken down into categories for combustion in power plants industry and other uses The type of coal or oil used is also considered providing a more accurate estimate of mercury emissions
bull A more detailed consideration of the mercury content of fuels and raw materials used in different countries and regions bull New and updated information on ASGM bull The use of different pollution control technologies
in different countries and regions have been factored into the emissions estimate bull Emission estimates for sectors not previously
included such as aluminium production oil refining and contaminated sites bull More and better information on location of major
point sources such as individual power plants smelters and cement kilns bull Better documentation and greater transparency
with respect to the data and information behind the estimates
The methods for estimating emissions from industrial sectors is complemented by other methods used for more dispersed emissions sources For example estimating emissions from some intentional-use sectors requires intensive work with those sectors Relevant and accurate information about ASGM is generally not available through official channels Estimating mercury emissions from its intentional use in lighting batteries and other products requires analysing the entire production use and waste stream to determine where mercury is likely to be released and in what quantities The approach used in the 2013 assessment addresses the emissions from breakages and wastes resulting from use of these mercury-containing products in society the majority of
which are incinerated or end up in landfills It does not however address industrial wastes or sewage sludge incineration
Uncertainties in emission estimates Estimates of mercury emissions are just that estimates To compile a global assessment requires making a number of assumptions and generalizations Uncertainty associated with the 2010 inventory arises from each of the factors used to estimate the emissions the correctness of the activity data the validity of the emission factors applied and the validity of assumptions regarding the effectiveness and use of emission-control technologies
Based on an evaluation of these sources of uncertainty and the relative contributions of sectors with reliable information and those with less reliable data uncertainty in the 2010 inventory assessment of total anthropogenic mercury emissions to air gives a range of emissions from 1010-4070 tonnes This range is greater than that reported in some previous assessments reflecting a greater appreciation of the sources of uncertainty due to the improved estimation methods and perhaps a more realistic appraisal of the state of knowledge concerning some aspects of emissions
The best estimate taking a conservative approach is 1960 tonnes If nationally produced estimates for 2010 available from some countries (Canada Japan Korea Mexico the United States and European countries reporting to LRTAP) are introduced into the global inventory in place of the inventory estimates the corresponding estimated total global anthropogenic emission to air is 1940 tonnes As most national inventories do not include uncertainty ranges it is not possible to assign a range to this number The recognition of uncertainties is an important consideration and presenting single national estimates can convey a misleading picture of what is known and more importantly not known about emissions
The numbers derived using the methods employed to produce the global inventory for 2010 were compared with a number of national inventories and emissions reported under other systems covering the same period In general the level of agreement was good in particular when the significant uncertainties
13
UNEP Global Mercury Assessment 2013
Methods for estimating emissions All global mercury emissions inventories to date have used the same basic approach for the major sectors emitting mercury to the atmosphere For specific emission sectors national emissions estimates are calculated by multiplying the amount of activity (ie amounts of fuels burned raw materials consumed or materials produced) by an emission factor that is an estimate of the mercury emitted per unit of activity For example emissions from coal-fired power generation are estimated by multiplying the tonnes of coal used by the amount of mercury estimated to be released per tonne of coal In most such inventories ldquoabatedrdquo emission factors have been employed to quantify both the emissions of mercury that occur during the processes and the effects of mercury emission controls In the new methodology used to develop the 2013 report these components are split ldquoUnabatedrdquo emission factors are employed to quantify the emissions and ldquotechnology profilesrdquo have been developed to represent the effects of mercury emission controls
Various methods are employed to estimate emissions of mercury at individual sources and at national regional and global levels In general the methods fall under one of two main categories
bull Mass-balancesubstance-flow based estimates which are based on the principle that what goes in must come out Amounts of mercury in fuels and raw materials constitute the inputs and the outputs are the amounts of mercury emitted to air released to water or land retained in products or in wastes or otherwise recovered and stored or disposed of
involved in both global and national estimates are taken into account It is important to note that there are good reasons why estimates of mercury emissions produced in the 2010 inventory may not fully agree with national inventories made by countries using other methodologies These reasons include
bull Reporting schemes may define and distinguish emissions source sectors in very different ways and aligning these sectors may not be possible
bull Industry reporting to national government may be limited to sources with emissions above a certain threshold level so that emissions from smaller sources below the threshold are not reported Where smaller sources make up a significant part of the source category reported inventories
bull Measurement-based estimates which rely on measurements made at appropriate points in the industrial process or in the productwaste output streams These measurements are used to estimate where the mercury goes as in the method above
In principle the two approaches should produce the same results In practice mass-balance based approaches tend to result in higher emission estimates than most measurement-based estimates Since future emissions reporting is likely to involve a combination of these two approaches further work is required to understand why results may differ and to reconcile the two approaches
Since the 2008 UNEP assessment was produced the number of direct measurements of emissions from certain point sources (in particular power plants and some metal and cement production plants and waste incineration facilities) has increased considerably resulting in a much improved knowledge base
A number of countries require regular reporting of emissions Increasing use is being made in these reporting systems of measurement-based estimates and facility-level reporting in particular for major point sources In other countries national mercury emissions are only being quantified for the first time Since 2005 and the start of the UNEP negotiating process in 2010 many countries have initiated work on national emission inventories which in several cases have yielded much improved information on activity data sector characteristics and mercury emissions Such inventories often make use of the UNEP Toolkit for identification and quantification of mercury emissions
may therefore significantly underestimate total mercury emissions bull National inventories in some countries are making
increasing use of actual measurements of mercury emissions at individual facilities At the global scale it is not yet feasible to base an inventory on individual site emissions Furthermore actual measurements of mercury emissions at a source may be taken only a few times during a year and may not be fully representative of normal operations In the 2013 assessment a mass-balance based approach was employed to be consistent transparent and replicable bull National reporting and monitoring schemes
may provide information that is not available to externally produced inventories
14
UNEP Global Mercury Assessment 2013
Despite these considerations most of the discrepancies noted between the 2010 inventory mass-balance-based estimates and national estimates based on measurement- approaches are modest and within the margins of error associated with the different approaches In cases where the differences are larger it is important to recognize that there are sources of error in all methods for estimating mercury emissions
Gunnar Futsaelig
ter
Sampling of mercury emissions at the Kendal coal-fired power plant in South Africa conducted under a UNEP project A probe with mercury traps is inserted into a sampling port in the stack to collect mercury present in the flue gas The mercury traps are subsequently analysed according to the US EPA Mercury Monitoring Toolkit sampling protocol
15
UNEP Global Mercury Assessment 2013
Trends in mercury emissions to the atmosphere 4 Assessing global and sectoral trends A key question in assessing anthropogenic mercury emissions worldwide is whether they are increasing or decreasing While it is tempting simply to compare the 2010 inventory with its 2005 counterpart the results would mean little As inventory methods develop and as additional sources are considered the estimate of total anthropogenic mercury emissions worldwide also changes While some changes reflect real trends others reflect changes in methods or scope Thus comparing the results of previous assessments with the present update requires considerable care and involves an understanding of the way in which these inventories have been produced and the uncertainties associated with them
It is possible however to compare certain sectors over time by attempting to compensate for any methodological changes between the various inventories since 1990
Emissions to air are thought to have peaked in the 1970s From 1990 to 2005 total anthropogenic emissions of mercury to the atmosphere appear to
Emissions to air t
1400
1200
1000
800
600
400
200
0
1990
1995
2000
2005
Africa Asia Europe Russia North Oceania South America America
Estimates of annual anthropogenic mercury emissions from different continentsregions 1990-2005
have been relatively stable with decreases in Europe and North America being offset by increases in Asia A reanalysis of the available inventories since 1990 however indicates that emissions from industrial sectors at least may be starting to increase again
The changes introduced in the 2010 inventory methodology prevent a straight-forward continuation of this analysis However an evaluation of trends for some sectors between 2005 and 2010 has been made by applying the new methodology to activity data for 2005 This comparison suggests a further slight increase in the combined amount of mercury emitted by industrial sectors (coal combustion production of cement pig iron and steel and non-ferrous metals) The following paragraphs describe the trend results for three sectors to illustrate some of the developments between 2005 and 2010 and some of the the difficulties in comparing emissions estimates between different years made with different methods
Coal burning for power generation and for industrial purposes continues to increase especially in Asia However increases in the application of air pollution controls including some mercury specific technologies together with more stringent regulations in a number of countries have reduced mercury emissions from coal burning in power plants in particular and thus offset some part of the emissions arising from increased coal consumption
In the United States for example emissions from coal burning at power plants have reportedly decreased from about 53 tonnes in 2005 to 27 tonnes in 2010 This decrease is largely due to new regulations that have resulted in changes in the sources of the coal that is burned in large power plants and the installation of mercury controls as well as controls on sulphur dioxide and particulates that have the co-benefit of further reducing mercury emissions
In China many of the new coal-fired power plants have state-of-the-art pollution controls installed
Emissions of mercury from artisanal and small-scale gold mining (ASGM) reported for 2010 are more than twice those reported for 2005 While the
16
UNEP Global Mercury Assessment 2013
Unintentional emission sectors Coal burning ferrous- and non-ferrous (Au Cu Hg Pb Zn) metal production cement production Intentional-use sectors Disposal and incineration of product waste cremation emissions chlor-alkali industry
Comparison of emissions in 2005 and 2010 by selected sector and region
Unintentional emission sectors
Emission t
1000
800
600
400
200
0 2005 2010
Australia New Zealand amp Oceania
Central America and the Caribbean
CIS amp other European countries
East and Southeast Asia
rise in the price of gold (from USD 400 per ounce in 2005 to USD 1100 per ounce in 2010) along with increased rural poverty may indeed have caused more activity in this sector the increased estimate for mercury emissions is considered to be due primarily to some more and better data from many countries and regions West Africa for example was regarded as having minimal ASGM in 2005 but is now recognized as a region with considerable activity Thus the baseline has improved without necessarily any change in actual activity or emission levels
Waste from consumer products is affected by the amount of mercury used For most products in which mercury is used mercury-free alternatives exist Consequently many of these uses of mercury are declining at least in some regions as alternative products or processes are adopted Compact fluorescent light bulbs are an exception Even though the mercury content of individual light bulbs has decreased use of this type of light bulb is increasing rapidly
Artisanal and small-scale gold mining Intentional-use sectors
1000 1000
Step change from 2005 to 2010 due to new information 800 800 (under-estimation in 2005)
600 600
400 400
200 200
0 0 2005 2010 2005 2010
European Union (EU27) South America
Middle Eastern States South Asia
North Africa Sub-Saharan Africa
North America
In order to make valid assessments of trends in emissions from global inventories comparable data on activity levels are required together with information on changes in fuel and raw material characteristics and applied air pollution control technology One aim of the 2010 inventory methods is to create a firmer foundation for such future trend analysis
Ralf Siemieniec Shutterstockcom
Use of mercury-containing energy-saving lamps is increasing
17
UNEP Global Mercury Assessment 2013
Emission scenarios and future trends The 2008 Global Atmospheric Mercury Assessment included a first attempt at projecting future emissions inventories These were based on three scenarios continuing with the status quo applying current emissions controls worldwide and achieving maximum feasible technological reductions At the time this effort was regarded as highly provisional Since then additional studies have extended and improved this work but the results are not markedly different from earlier projections of future mercury emissions
Global mercury models have been used to evaluate future scenarios Four global and hemispheric models projected mercury levels around the world in 2020 based on the three emission scenarios described earlier In industrial regions the status quo will cause an increase in mercury levels of 2-25 and in remote areas of 15-5 The two emission control scenarios on the other hand yield a decrease in mercury in industrial areas of 25-35 and in remote areas of 15-20
Another global model was coupled with estimates of surface reservoirs of mercury in order to quantify source-receptor relationships for the present and for 2050 Under the best-case scenario of maximum feasible reductions projected estimates for deposition in 2050 is similar to estimates for today In the other scenarios increasing emissions lead to increasing deposition A greater proportion of mercury emissions is expected to be in the oxidized form so that a greater proportion will be deposited near the source instead of being transported far away
The model results support the conclusion that reducing anthropogenic emissions will slowly reduce the amount of mercury in biologically available reservoirs Over time mercury in the environment will be taken out of circulation by natural processes for example from ocean waters down into sediments and biologically available mercury will decrease Increased emissions on the other hand will continue to build up the amount of mercury in circulation
With new databases and methods it may soon be possible to create scenarios that incorporate activity levels as well as technology use for each country If this were done it would allow countries to assess the effects of different mercury reduction strategies on their national emissions For example a country could determine the relative contributions of emission reduction technology as opposed to for example changes in raw materials
18
UNEP Global Mercury Assessment 2013
Atmospheric chemistry monitoring and trends 5 Forms of mercury in air Mercury in the atmosphere is in three primary forms Gaseous elemental mercury is the most common in anthropogenic and natural emissions to the atmosphere Gaseous oxidized mercury and mercury bound to particulates are less common The transport and deposition of atmospheric mercury depend greatly on whether the mercury is elemental or oxidized Elemental mercury stays in the atmosphere long enough for it to be transported around the world whereas oxidized and particulate mercury are more readily captured in existing pollution control systems or deposited relatively rapidly after their formation As a result most mercury in the air is in the gaseous elemental phase Relatively little elemental mercury is deposited directly but instead must fi rst be oxidized
Although gaseous oxidized mercury is very important in mercury cycling between air and other environmental compartments the process of oxidation in the air is poorly understood with reactions and resulting compounds yet to be verified in observations
When mercury moves from air to water and land it is generally in an oxidized gaseous or particulate form whereas when it is re-emitted to air it has been converted back to gaseous elemental
Particulate associated mercury
Pole
Equator
Gaseous elemental mercury
Global transport
Gaseous elemental mercury can be transported globally Mercury emitted in particulate form tends to deposit closer to sources
mercury Sunlight appears to play a large role in both oxidation and reduction of mercury but temperature and biological interactions are also likely to be involved to some degree Here too much uncertainty remains Nonetheless the reactions are important in determining net deposition and fate of mercury
Monitoring of mercury in air Monitoring of mercury in air focuses on the three primary forms of mercury The measurement of gaseous elemental mercury is routine and robust Measuring gaseous oxidized mercury and particulate-bound mercury however is challenging Concentrations are typically very low and these forms are chemically unstable leading to high uncertainty in the measurements Nonetheless these forms are critical for defining and modelling the fate and transport of airborne mercury
In the past two decades coordinated mercury monitoring networks and long-term monitoring sites have been established in a number of regions measuring mercury concentrations in the air as well as deposition of mercury in precipitation In Europe and North America high-quality continuous monitoring has been going on for more than 15 years especially in the Arctic High-quality monitoring has started more recently in East Asia and South Africa as part of a global effort to expand the coverage provided by long-term monitoring sites
Measurements and trends in atmospheric mercury Monitoring stations around the world have provided information about trends in atmospheric mercury though the time periods vary depending on how long the site has been active Overall a declining trend in background mercury levels over the past decade has been recorded from monitoring stations
19
UNEP Global Mercury Assessment 2013
in many regions Other regions however show an increase in mercury levels
The sites also provide information about geographical patterns reflecting both background levels of
Trends in atmospheric measurements of mercury
Site(s) Period
Mace Head Ireland 1996-2011
North America rural sites 1995-2005
High Arctic sub-Arctic Up to 20 years of records mid-latitudes
Monitoring networks Mercury monitoring in Europe is carried out under the European Monitoring and Evaluation Programme (EMEP) one of the first international environmental measurement networks Heavy metals such as mercury have been included in the EMEP program since 1999 Mercury measurements are available only from northern and northwestern Europe
Three monitoring networks currently operate in North America providing good coverage of Canada and the United States the Mercury Deposition Network the Canadian Air and Precipitation Monitoring Network and the Atmospheric Mercury Network More recently new sites have been established in Mexico extending coverage on the continent The stations monitor atmospheric mercury and mercury in precipitation which has measured since the mid-1990s Monitoring of mercury in the air and in precipitation has been underway in Asia for nearly a decade
Alert Nord
Point Barrow
Nuuk Stoacuterhoumlfethi
Mace Head
mercury and local and regional influences Mercury concentrations at remote sites in Asia are higher than in other regions of the Northern Hemisphere Coastal cities in China have lower levels than inland sites likely due to the influence of relatively clean
Measurement Trend
Gaseous elemental mercury Decrease of 14-18 per year
Total gaseous mercury Decrease of 22 to 174 in total
Total gaseous mercury Decreasing trend at some stations increasing at others
The monitoring network of the Arctic Monitoring and Assessment Programme (AMAP) includes air and deposition monitoring sites located in Arctic regions of Canada Greenland Iceland Norway Russia and Sweden
Building on existing national and regional monitoring networks the European Union-financed project
ldquoGlobal Mercury Observation Systemrdquo (GMOS) started in November 2010 Its goal is to develop a coordinated global system for monitoring mercury including a large network of ground-based monitoring stations New sites are being installed in regions where few monitoring stations exist especially in the Southern Hemisphere Two sites have been established in Antarctica one on the Antarctic Plateau and one on the coast
Ny-Aringlesund
Amderma Pallas
Raringouml Bredkaumllen
Listvyanka Diabla Gora
Mauna Loa
Mt Bachelor
Celestuacuten Calhau
Longobucco
Iskrba Niembro Monte Cimone Cap
Ferrat Mt Waliguan Ganghwa Island
Lulin
Cape Hedo Ev-K2
Mt Changbai
Minamata Mt Ailao
Nieuw Nickerie
Kodiakanal
Maheacute Island Manaus
Bariloche Cape Point
Amsterdam Island Cape Grim
Dumont drsquoUrville
AMAP CAMnet EMEP GMOS GMOS associated NADPAIRMoN NADPMDN
Air + precipitation Air Precipitation
20
UNEP Global Mercury Assessment 2013
John Munthe
The mercury background air monitoring station at Zeppelin mountain Svalbard
air from over the ocean Sites off the Asian coast however show higher levels of gaseous elemental mercury than the Northern Hemisphere background suggesting an outflow from the Asian mainland
Weather patterns have also been found to have a strong influence on seasonal patterns in mercury levels in the air at monitoring sites At the Mount Waliguan Observatory on the Tibetan Plateau for example northeasterly and easterly winds produced the highest levels of mercury
Measurements at high altitudes Measurements from ground-based stations above 2700 meters suggest that there is an inverse relationship between gaseous elemental mercury and gaseous oxidized mercury at these elevations In other words when there is more elemental mercury there is less oxidized mercury and vice versa These measurements are in good agreement with modelling results which gives additional confidence in current understanding of the behaviour of mercury at high altitude
An inverse relationship between total gaseous mercury and particulate concentration has also been observed in the high stratosphere From the transformation rate of total gaseous mercury to particulate-bound mercury it appears that gaseous mercury lasts about two years in the stratosphere
21
UNEP Global Mercury Assessment 2013
Atmospheric concentrations and deposition 6 Measurements and trends of mercury in precipitation Mercury deposited by precipitation decreased from the 1990s into the 2000s at many but not all sites in North America and Western Europe where such measurements were taken
Regional patterns are also evident including slightly higher levels in southern Europe than northern Europe and higher levels in Asia than in North America Total mercury concentrations in precipitation in China were much higher than those in Japan and South Korea Th is was mostly attributed to higher levels of gaseous oxidized mercury and particulate-bound mercury which are readily deposited by precipitation and thus not transported far
A comparison of data from Canadian and American monitoring sites found that deposition of mercury in precipitation was highest in summer
Dry deposition of mercury which is deposition not associated with precipitation is diffi cult to measure and consequently there is little information on trends in mercury dry deposition Th is lack of information means that it is also diffi cult to validate model results for dry deposition
106 44
474 72 91
5 7 71
05 1 5 10 100 500 1000
Total mercury emission (2005) kgcell
Modelled mercury air concentrations and deposition patterns Atmospheric mercury concentrations are highest in major industrial regions Models examining global patterns show that East and South Asia Europe North America and South Africa have the highest levels of elemental mercury in the air Concentrations are generally lower in the Southern Hemisphere than the Northern Hemisphere because most industrial activity is in northern regions Th ese model results are based on simulations using the 2005 global mercury emission inventory because the 2010 inventory has only recently become available
Intercontinental transport of mercury in the air has been examined to determine its impact on regional mercury levels Four models using diff erent parameters produced consistent results Depending on the region mercury emitted by distant sources contributes between 10 and 30 of annual mercury deposition Where local sources are low mercury transported from distant emission sources can account for more than half of the deposition East Asia is the dominant source region adding 10-14 to the deposition in
Contribution from sources outside receptor region
Model 40
GEOS-Chem GLEMOS GRAHM CMAQ-Hg
30
20
10
0 Arctic Europe North East Asia South Asia
America
Receptor region
(Left ) Global distribution of anthropogenic mercury emissions in 2005 with source regions that were considered in the analysis (North America South America Europe Africa Central Asia South Asia East Asia Australia and Oceania) and (right) the contribution of anthropogenic sources outside a particular receptor region to deposition within the receptor region
22
UNEP Global Mercury Assessment 2013
Modelling atmospheric transport and deposition Global models reproduce the movement of mercury in the atmosphere during which the mercury may move between continents They have been effective in examining sources of mercury to the Arctic and also for examining the outflow of pollution from South and Southeast Asia and its impact on western North America as well as the flow from eastern North America to Europe
Regional models on the scale of a continent or a basin such as the Mediterranean can provide more detail about specific source areas even to the level of individual industrial areas Reliable results however require a detailed understanding of mercury oxidation in the atmosphere about which there is considerably uncertainty
Most atmospheric transport models consider the full chain of mercury processes in the atmosphere Some models also consider how mercury is cycled in other atmospheric compartments such as soil vegetation snow freshwater and seawater
One of the largest sources of uncertainty in mercury models is the chemical mechanism used to determine how mercury changes forms in the air Improved experimental data can help improve model performance by making sure that the correct reactions are simulated The processes that lead from deposition to re-emission also need to be understood better Advances in this area show promise with model results becoming closer to estimates based on experimental data
other regions of the world Natural emissions and re-emissions account for 35-70 of total deposition in most regions Deposition is generally greater in low and mid-latitudes due to stronger sunlight higher concentrations of oxidants and higher precipitation
Regional mercury models show patterns at the scales of continents or individual seas The Mediterranean Sea for example is a net source of mercury as it emits more than is deposited to it In that region dry deposition generally exceeds deposition of mercury in precipitation In Central and Southern Europe total gaseous mercury concentrations and deposition in precipitation were both consistently higher than the European average
Across the United States dry deposition accounts for two-thirds of total annual deposition mainly from gaseous oxidized mercury A study examining sources and deposition of mercury to assess the
benefits of proposed emission control measures found that mercury transport from outside the country accounts for 68 of mercury deposition in the Northeast and up to 91 in the west-central United States Large point sources contribute up to three-quarters of nearby deposition and power plants contributed half of the deposition in the eastern part of the country This suggests that new emissions standards would primarily benefit eastern regions of the US
In Asia studies show high seasonal variation in mercury concentration and deposition Anthropogenic emissions are responsible for about 75 of deposition in East Asia In this region there is a net removal of gaseous oxidized mercury from the atmosphere and a net export of gaseous elemental mercury
In the Arctic gaseous elemental mercury levels in the atmosphere are depleted rapidly in spring when after the long Arctic winters sunlight returns Ozone is depleted at the same time and it is believed that bromine-containing compounds are the cause of the photo-chemical reactions that deplete ozone and mercury During these events gaseous oxidized mercury and particulate-bound mercury levels increase sharply suggesting that the gaseous mercury is oxidized and deposited enhancing mercury deposition in Arctic areas in springtime Recent research however has found that 50-80 of the deposited mercury is re-emitted within a few days Similar springtime mercury depletion events have been seen in Antarctica
23
UNEP Global Mercury Assessment 2013
Anthropogenic releases to the aquatic environment 7 Global assessment Previous UNEP global mercury assessments only considered emissions to the atmosphere The 2013 Report presents the first attempt at compiling a global inventory of mercury releases to aquatic environments Releases directly into the aquatic environment present a completely different chemistry set of pathways and fate to those released to air They are also more directly linked to the risks posed by mercury to global environmental and human health Unlike mercury releases to air which are predominantly in the form of gaseous elemental mercury releases to water are predominantly inorganic mercury and to a lesser extent liquid elemental mercury
At present only some sources of aquatic releases can be quantified with any confidence Thus many sources that may be important are not included in this first assessment of global aquatic releases For example land management practices that expose new geological sources of mercury in rocks and mineral soils or that re-mobilize previously deposited mercury cannot yet be assessed Two broad categories of current anthropogenic sources are considered here point sources of mercury release to water and diffuse releases of mercury as a result of its remobilisation from areas where it was previously deposited or accumulated due to human activity (ie contaminated sites) Artisanal and small-scale gold mining (ASGM) mercury-containing pesticides and fungicides used in agriculture and deforestation are considered separately
Point source releases to water from various sectors in tonnes per year with the range of the estimate and as a percentage of total anthropogenic emissions
Sector Releases (range) tonnes
Non-ferrous metal production 925 (193 - 268)
Consumer product waste 894 (222 - 308)
Chlor-alkali production 28 (10 ndash 55)
Oil refining 06 (03 ndash 1)
Grand Total 185 (426 ndash 582)
The global estimate of mercury release to water from point sources has been derived from the atmospheric emissions assessment and the approach employed in the UNEP Toolkit to partition total mercury releases between air land and water This approach has considerable uncertainty and may omit sectors where releases to water are high but air emissions are unimportant and therefore not addressed in the inventory Global releases from point sources were estimated to be 185 tonnes per year
For diffuse sources evaluating the relative contribution of anthropogenic and natural sources to the aquatic environment requires determining considerations of the various mercury inputs For some sectors data exist that allow a preliminary assessment of the amounts of mercury re-mobilized into aquatic systems
For mercury-contaminated sites the range of average soil concentrations of mercury reported for sites where mercury was mined used or otherwise released by human activity was considered The area of contamination is then used to determine how much mercury is available in soils and when combined with a factor for how much mercury is released from those soils in a year the total release can be estimated Among identified contaminated sites mercury mining is identified as the largest sector followed by mining of precious metals Total releases to aquatic environments from contaminated sites are estimated to be 83-335 tonnes per year
Releases to water from contaminated sites in tonnes per year with the range of the estimate
Sector Releases (range) tonnes
Primary mercury mining sites 67 ndash 266
Precious metal production sites 14 ndash 55
Non-ferrous metal production sites 01 ndash 05
Chlor-alkali production sites 01 ndash 05
Other industrial sites 01 ndash 03
Grand Total 83 ndash 335
24
UNEP Global Mercury Assessment 2013
Much of the mercury released from artisanal and small-scale gold mining goes into rivers lakes soils and sediments and tailings From soils and tailings it may be re-mobilized by leaching and erosion In addition mining may disturb mercury-containing soils and sediments that may then erode more quickly releasing more mercury than would otherwise have become available from natural erosion A key factor in these processes is the local hydrological cycle of precipitation evaporation run-off and river flow To account for this in the assessment countries were designated as dry wet or intermediate to determine the relative importance of erosion The tropical and subtropical countries which have the greatest activity in this sector also tend to experience high precipitation and run-off exacerbating this source of mercury release and re-mobilization Total worldwide releases of mercury to land and water from ASGM were estimated at over 800 tonnes per year How much of this is released to water cannot yet be determined
Mercury continues to be used in pesticides and fungicides 2100 tonnes of mercury were released in the decade of the 1960s through such agrochemical uses Current data are unavailable although the use of mercury in these products has been greatly reduced
Deforestation especially in the Amazon Basin can lead to extensive soil erosion and thus the release of mercury previously accumulated in soils Using 2010 figures for deforestation rates around the world and an estimate of soil concentrations of mercury as much as 260 tonnes of mercury may have been released into rivers in 2010 as a result of deforestation worldwide
Because this is the first attempt to quantify global mercury releases to the aquatic environment there is no previous measurement against which these results can be compared Thus it is not possible at this time to evaluate trends in releases
Uncertainties in release estimates Estimating global releases of mercury to aquatic environments is being done here for the first time Many data are missing and others are imprecise A number of assumptions have been made based on what measurements are available or on other grounds to extrapolate from known quantities or to calculate aquatic releases in relation to atmospheric
or other emissions Thus the results should be treated with great caution It is nonetheless clear that anthropogenic sources and human activity contribute hundreds of tonnes of mercury to aquatic environments each year a substantial amount relative to estimated natural releases 150-960 tonnes per year from terrestrial environments
Lapshin Shutterstockcom
Phil Augustavo istockphotocom
Bureau of Land Managem
ent
Contaminated sites (top) erosion following deforestation (middle) and a flooded store of mercury-contaminated waste (lower) illustrate potential sources of mercury releases to water
25
UNEP Global Mercury Assessment 2013
Aquatic pathways transport and fate 8 Mercury in aquatic environments The pathways and fate of mercury in aquatic environments are important because it is in waters sediments and wetland soils that inorganic mercury is converted into methylmercury which is toxic and concentrates in animals The majority of human exposure to mercury and the health risk that comes with mercury exposure is from consumption of marine foods Thus this section focuses on the worldrsquos oceans Some freshwater systems however are important sources of fish for human consumption especially for subsistence and recreational fisheries often among indigenous peoples Artisanal and small-scale gold mining (ASGM) communities may also be affected through fish consumption and drinking water if those are contaminated by local releases
The major processes of mercury cycling are generally similar for all aquatic systems Inorganic mercury in dissolved or particulate form is the dominant mercury type in most marine and fresh waters Dissolved gaseous elemental mercury accounts for less than 30 of total mercury in water Methylmercury is often present at trace levels but may in some settings reach 30 of total mercury In freshwater and coastal environments inorganic mercury is transformed into methylmercury primarily in sediments In the open ocean this conversion takes place largely at intermediate depths between 200 and 1000 meters in the water column Mercury is lost from aquatic systems in two ways When inorganic mercury is reduced to elemental mercury it can be re-emitted to the atmosphere When inorganic mercury binds to particulates in water it can settle out rapidly and be buried in sediments Deep burial in ocean sediments is one of the major pathways by which mercury is removed from the biologically active environment
The global mercury cycle is chemically and physically complex Thus it is necessary to use models to study describe and predict what happens and will happen to mercury in the aquatic environment Until recently only one model existed that incorporated
air land and water into a unified whole The model has been validated against observations of mercury and represents the current scientific consensus The largest potential errors in this model in terms of the aquatic cycle concern details of the exchange of mercury between air and water
Pathways and fate of mercury in the oceans Model simulations suggest that anthropogenic impacts on mercury levels in the ocean are greatest in the surface waters the top 100 meters or so of the water column While model results vary one recent estimate suggests that anthropogenic emissions over the last 100 years have doubled the concentration of mercury in the surface layer of the ocean and increased it by 25 in intermediate waters and by 10 in deep waters The difference is due to the length of time it takes for surface waters to circulate to the depths
Models and measurements agree that direct deposition from the atmosphere is the dominant pathway by which mercury reaches the oceans The exceptions are smaller semi-enclosed basins such as the Mediterranean Sea or the Arctic Ocean where river runoff coastal erosion and ocean currents
Ugo M
ontaldo Shutterstockcom
26
UNEP Global Mercury Assessment 2013
account for about half of mercury inputs The most recent modelling effort suggests that total deposition input of mercury to the oceans in 2008 was 3700 tonnes
Other mercury pathways appear less important on a global basis Rivers are estimated to carry more than 2800 tonnes of mercury each year but only about 380 tonnes of this is transported offshore The rest is trapped by particles in estuaries Groundwater and re-mobilization from sediments provide 100shy800 tonnes of mercury to the oceans each year Undersea hydrothermal vents add less than 600 tonnes of mercury to the oceans There are high concentrations of mercury in vent fluids but a great deal of the mercury is precipitated as solids once the vent fluids enter seawater
Models suggest that globally about 70 of the mercury deposited into the ocean is re-emitted to the atmosphere Oxidized mercury in surface waters is reduced by biological and photochemical processes to the elemental form that is volatile and readily re-emitted The removal of this mercury ultimately reduces the pool of mercury that could be converted to methylmercury and be accumulated by marine organisms The re-emission process thus simultaneously prolongs the lifetime of mercury cycling through the atmosphere and upper ocean and acts to reduce mercury availability for marine food webs
Any changes in the efficiency of mercury reduction in surface waters or the rate of re-emission is likely to impact mercury concentrations in surface waters and the air One example is the effect of sea ice in the Arctic Ocean which blocks the re-emission
Tony Magdaraog Shutterstockcom
Mercury accumulated in marine food-webs can enter the human diet
of elemental mercury leaving elevated levels in waters under ice Changes in primary productivity could change the rate at which mercury is bound to particles thus affecting re-emission to the atmosphere as well as rates of downward transport in the ocean Changes in oxidant levels in the atmosphere such as ozone and bromine may also influence the rate of oxidation of gaseous elemental mercury and thus deposition rates to the ocean
Methylmercury in the ocean Natural bacterial processes in seawater and in sediments in coastal environments convert inorganic mercury to methylmercury Methylmercury levels are highest in the subsurface waters of many oceans because it is formed at these intermediate depths likely as a result of the decomposition of organic material falling from surface waters Current understanding indicates that about 300 tonnes of methylmercury is produced in the upper ocean by this and related processes By contrast only about 80 tonnes of methylmercury reaches the ocean from other sources such as atmospheric deposition rivers and diffusion from sediments
Current modelling indicates that methylmercury stays in the upper ocean for about 11 years Deshymethylation by photochemical reaction or by microbial activity is the major removal process for methylmercury in the ocean About 240 tonnes of methylmercury is removed by this process from the surface waters of the ocean per year
The other important pathway for methylmercury in seawater is uptake into marine food webs Although only about 40 tonnes per year is taken up in this way it is this fraction that poses risks to marine animals and human consumers of seafood Methylmercury is a problem for several reasons First it is taken up by plankton much more efficiently than is inorganic mercury resulting in concentrations in plankton that are as high as 10000 times the concentration in seawater Second methylmercury is absorbed through the intestine of animals much more easily than is inorganic mercury Third methylmercury biomagnifies as it moves up the food web Thus methylmercury becomes an increasingly greater proportion of the mercury in organisms higher in the food web This explains why some indigenous populations that consume top marine predators such as fish seals and whales have some of the worldrsquos highest concentrations of methylmercury giving rise to health concerns
27
UNEP Global Mercury Assessment 2013
Pathways and fate of mercury in freshwater Observations and modelling both show that there are in general many similarities between mercury chemistry pathways and fate in lakes and in the oceans but with obvious differences in scale and in the relative importance of different processes Modelling of mercury dynamics was done for four lakes with a history of direct mercury inputs from the largest freshwater lake in the world (Lake Superior) to small lakes in Ontario Canada Atmospheric deposition and river inflow were the main sources of inorganic mercury Much of the mercury input from lake and river catchments was associated with dissolved and particulate organic matter The dominant mercury removal mechanisms as in saltwater were burial in sediments and photochemical reduction of oxidized mercury to elemental mercury followed by re-emission to the air In Lake Superior and Lake Michigan there is evidence for methylation of mercury in the water column as is seen in the open ocean
Methylmercury levels in freshwater fish vary with the level of deposition of mercury from the air though other factors such as inputs from the watershed and the number of trophic levels within the lakersquos food web are also important Methylation predominantly occurred in lake sediments and wetlands and floodplain soils where sulphateshyreducing bacteria are believed to be primarily responsible Methylmercury is de-methylated in sediments and also taken away in the outlet river from each lake
Some 400-1400 tonnes of mercury are estimated globally to be trapped behind dams and other man-made impoundments each year This has in many cases led to significant increases in total mercury and methylmercury levels in water and of methylmercury in fish and other aquatic species When artificial lakes are created plant material is submerged leading to decay and anoxia In these conditions microbially driven methylation of inorganic mercury takes place In some cases the elevated mercury levels have also been observed downstream from the artificial lakes and reservoirs
Anthropogenic impacts on aquatic mercury levels Two studies have reported that the Atlantic and Pacific Oceans have shown opposing trends over recent decades While the influence of changing ocean currents and other oceanographic factors may be a factor the trends do make sense in light of patterns of anthropogenic emissions In the North Pacific Ocean mercury concentrations appear to have increased at depths between 200 and 1000 meters over the last few decades This increase coincides with the rapid industrialization of East Asia
In the North Atlantic however results from near Bermuda suggest a substantial decrease in mercury concentration and a change in the mercury profile through the water column The Mediterranean Sea too showed a decrease in mercury concentration between 1990 and 2004 These findings are consistent with atmospheric data from around the North Atlantic The conclusion is that mercury levels in seawater in the North Atlantic were elevated by human activity but may now be declining likely as a result of decreased emissions from North America and Europe
A complementary approach to measuring mercury in seawater is to measure mercury in aquatic animals which accumulate and integrate mercury over time Teeth hair feathers and eggshells are useful long-term archives of mercury concentrations and can provide data from the pre-industrial period (ie before 1800) as well as more recent periods
Among marine animals samples are available from several regions particularly from the Arctic where cold dry conditions help preserve animal tissues Mercury concentrations between the 13th and 16th
centuries were relatively stable From the mid- to late 19th century to the end of the 20th century mercury levels increased by an average of 12 times On average therefore about 92 of the mercury in Arctic marine wildlife today is likely to be of anthropogenic origin
Similar findings were found for a 700-year sequence of seabird eggshells from the South China Sea Mercury levels increased steadily between 1800 and 2000 with a particularly rapid increase after 1970 Concentrations since 2000 are about 10 times higher than pre-industrial levels with 91 of the mercury now likely to be of anthropogenic origin In the Antarctic studies of seal hairs show that pre-industrial mercury levels were only 60 of recent levels The relatively small difference
28
UNEP Global Mercury Assessment 2013
Historical Hg concentration as a proportion of present-day 100
80
60
40
20
0
Beluga teeth Human teeth
Gyrfalcon feathers Perigrine falcon feathers
Polar bear hair Ringed seal teeth
1200 1300 1400 1500 1600 1700 1800 1900 2000
between pre-industrial and modern mercury levels in Antarctic is consistent with lower mercury emissions and atmospheric concentrations in the Southern Hemisphere as compared with the Northern Hemisphere
The timing of long-term increases of mercury in aquatic animals can shed light on the likely sources of mercury emissions that were responsible The industrialization of Europe and North America appear responsible for the large increases in marine mercury levels that began in the 19th century as these increases occurred prior to recent Asian industrialization As with water concentrations in the Pacific Ocean recent rapid increases in mercury in seabird eggs in the South China Sea coincide with industrialization in Asia
The time lag in aquatic ecosystem response One important conclusion from air-ocean modeling is that the oceans have not yet reached equilibrium with current atmospheric levels of mercury This lag is due to several factors First mercury stays in the upper ocean above 200 meters depth for about 30 years and for centuries in intermediate and deep waters This is much longer than the one year residence time in the lower atmosphere Thus removal from the ocean takes much longer than does removal from the air and so concentrations will change more slowly
Second because of the long lifetime of mercury in deeper ocean waters a great deal of natural mercury is present in the ocean already about 100000 tonnes out of a total of 135000 tonnes in intermediate waters and 200000 out of 220000 tonnes in deep waters
Rune Dietz
Analysis of museum samples reflects the increase in mercury emissions and releases since the mid-19th century associated with anthropogenic activities
Third vertical transport of mercury from intermediate depths back to the surface returns a substantial amount of mercury to the biologically active zone each year As a result average mercury concentrations in seawater and marine animals are likely to increase slowly for decades if not centuries even if atmospheric levels stabilize at present levels In short the effects of historical anthropogenic emissions from Europe and North America are still being observed in the oceans at the same time that the effects of the recent rise in emissions from Asia are being seen
Regionally different trends can be expected depending on distance from sources and ocean circulation patterns In the North Atlantic north of 55deg N it will take 50-600 years to achieve equilibrium between atmospheric and seawater mercury levels In the North Pacific this process is estimated to take 500-700 years and in the Antarctic 700-1000 years The Arctic Ocean by contrast is smaller and will only take about 35 years to reflect changes in atmospheric mercury levels Surface waters of the Mediterranean Sea should show also changes within 10-50 years
Time lags in the responses of many freshwaters and their food-webs to changes in atmospheric mercury levels are also expected Although some immediate recovery following reductions in atmospheric mercury deposition rates is likely full recovery may take decades centuries or longer depending on the characteristics of the area Highly polluted freshwaters with catchments and sediments containing large amounts of anthropogenic mercury will recover most slowly as is already observed around point sources such as smelters that have closed down
29
UNEP Global Mercury Assessment 2013
Major gaps in knowledge 9 Large uncertainties remain in global estimates of mercury emissions to the air These stem from various sources including the availability of information on activity levels but mainly from the lack of information concerning the mercury content of some raw materials and the validity of assumptions regarding processes and technologies employed to reduce mercury emissions including their rates of application and effectiveness The accuracy and precision of measurement-based estimates can depend on the validity of extrapolating measurements made at infrequent intervals to longer periods or measurements made at one plant to other facilities with similar operations
Potentially important emissions sectors that are still not quantified in the emissions inventory include the use of mercury in vinyl-chloride monomer production secondary metals production oil and gas extraction transport and processing industrial and hazardous waste incineration and disposal sewage sludge incineration and dental fillings preparation and removal
Current measurements and their evaluation are inadequate for determining spatial and temporal trends Improved more extensive and better coordinated measurements are needed A permanent global integrated monitoring network for atmospheric mercury and mercury deposition is needed to achieve this goal The atmospheric network sites should be closely integrated with water soil and biological monitoring networks The results can be used for model testing and evaluation as well as for more accurately detailing the geographic impact of anthropogenic emissions Monitoring of mercury concentrations in the important marine food species is essential to understanding possible human health impacts and the effects of future emissions changes
Better data on mercury distribution in the troposphere is needed to improve understanding of long-range transport and source-receptor relationships Coordinated studies at high altitudes and by aircraft are needed This information will
also help validate regional and global scale models improving their prediction capabilities with regard to different policy scenarios
Key processes related to global transport and cycling of mercury remain inadequately understood The chemical form of gaseous oxidized mercury is unknown Reduction and oxidation rates for mercury in the presence of atmospheric oxidants need further study including determining which oxidants are important New measurements and modelling studies are needed to examine key chemical and physical processes that affect global transport and cycling
Few data are available for reporting mercury releases to aquatic systems Systematic and consistent monitoring of mercury releases to the air is required especially for contaminated systems Releases of mercury from soils into waters depend greatly on climate and topography and these parameters need to be better accounted for Consistent approaches for measuring and reporting releases from point sources are needed to ensure comparability of data from around the world In particular the actual role of artisanal and small-scale gold mining (ASGM) in emissions to air and releases to water needs to be more accurately estimated
The link between mercury deposition methylation and uptake by living organisms needs further study The parameters that determine the rates of exchange of mercury compounds between air and sea air and soil and air and vegetation are not fully understood Whole-ecosystem studies of mercury are needed to better understand biogeochemical cycling Methylationdemethylation rates and their spatial and temporal variations and relationship to climatic factors need to be determined in most of worldrsquos major ocean basins as well as in representative freshwaters
30
UNEP Global Mercury Assessment 2013
Key findings of the 2013 assessment 10 Atmosphere Total anthropogenic emissions of mercury to the atmosphere in 2010 are estimated at 1960 (1010shy4070) tonnes which is about 30 of the total mercury that was emitted and re-emitted from anthropogenic and natural sources in that year The largest anthropogenic sources are associated with artisanal and small-scale gold mining (ASGM) and coal burning which together account for about 62 of the annual total anthropogenic emissions to air Other major sectors include ferrous and non-ferrous metal production and cement production
East and Southeast Asia are responsible for about 40 of global anthropogenic emissions About 75 of the mercury from this region comes from China which is about one-third of the global total Increased estimates for emissions from ASGM largely a result of newly obtained data and improved information mean that South America and Sub-Saharan Africa are also responsible for a greater proportion of global emissions than was previously assumed
Anthropogenic emissions over time have increased mercury loads present in the environment This leads to higher rates of re-emission and also means that there will be a time lag of years or decades between emissions reductions and lower mercury levels in the food web including pathways of human exposure
Mercury emissions to the atmosphere likely peaked in the 1950s to 1970s and subsequently declined because of reductions in Europe Russia and North America Emission trends are unclear due to changes in methods employed to produce inventories and differences in the sectors that have been accounted at different times There are however some indications that emissions may be rising again with increases from East Asia offsetting continuing reductions in Europe and North America
Aquatic environments Natural processes in aquatic systems convert less toxic elemental and inorganic mercury into much more toxic methylmercury Methylmercury concentrates and accumulates in the food web leading to high concentrations in some species of seafood and fish that many people eat
Anthropogenic releases of mercury to aquatic environments contribute hundreds of tonnes to the amount of mercury cycling in the environment Diffuse releases and point sources appear equally important Atmospheric deposition however remains the most important input of mercury to land and oceans and has increased the amount of mercury in many environmental compartments by a factor of two or three since the start of the industrial age On land mercury that is deposited is largely retained in soils and vegetation increasing the available pool for re-mobilisation to adjacent aquatic systems Re-emission from soils however is a major addition to atmospheric mercury
Hydrology is the most important factor in the transport of mercury from catchments to downstream environments Relatively little of this mercury reaches the open ocean as most is captured in sediments behind dams in estuaries and near the coast Changes in land cover and land use can have a large effect on mercury mobilisation as exposed soils erode and mercury leaches into the water table
Concentrations of mercury in Arctic marine animals today are about 10-12 times higher than in preshyindustrial times (ie prior to about 1800) This means that on average about 92 of the mercury in marine predators such as seabirds seals and whales is anthropogenic in origin The timing of the increase suggest that 19th and early 20th century emissions from Europe North America and Russia were responsible Increases mercury concentrations in seabirds in the South China Sea appear to be more recent than the Arctic increases coinciding with increasing industrialisation in East and Southeast Asia
31
UNEP Global Mercury Assessment 2013
K+S Entsorgung Gm
bH
Recovered mercury is being stockpiled at long-term storage sites above- and as shown here below ground
The upper 100 meters of the oceans have twice the mercury that they did a century ago Intermediate and deeper waters have 10-25 more mercury on average reflecting the slow transport of mercury downwards in the oceans Seawater concentrations will thus be especially slow in responding to changes in mercury inputs from atmospheric deposition and river flow As a result mercury concentrations in marine biota are likely to increase slowly for decades to centuries even without an increase in atmospheric emissions
In freshwater ecosystems atmospheric deposition and re-mobilisation from soils slow the reduction of mercury levels even in regions where atmospheric concentrations have decreased due to emission controls
Further increases in atmospheric emissions will have long-term consequences for commercial fisheries and all consumers of marine and freshwater foods
It is likely to be years or decades before reductions in anthropogenic emissions and releases of mercury have a demonstrable effect on mercury levels throughout the environment and in the fish and marine mammals which are part of the human food-chain This only reinforces the need to act now to continue and strengthen international efforts to reduce current mercury emissions and releases Delays in action now will inevitably lead to slower recovery of the worldrsquos ecosystems in future from mercury contamination leaving an even greater legacy of pollution for future generations
32
Division of Technology Industry and Economics (DTIE) Chemicals Branch Geneva Switzerland January 2013
Job number DTI1636GE
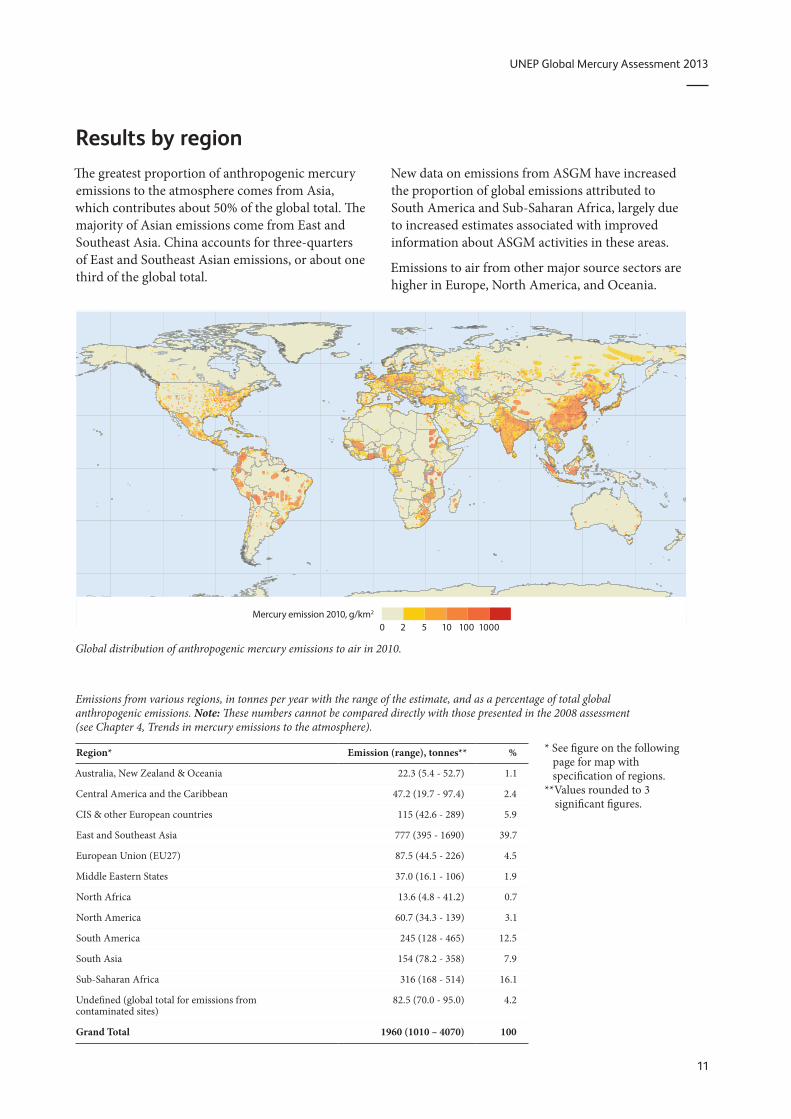
UNEP Global Mercury Assessment 2013
Results by region The greatest proportion of anthropogenic mercury emissions to the atmosphere comes from Asia which contributes about 50 of the global total The majority of Asian emissions come from East and Southeast Asia China accounts for three-quarters of East and Southeast Asian emissions or about one third of the global total
New data on emissions from ASGM have increased the proportion of global emissions attributed to South America and Sub-Saharan Africa largely due to increased estimates associated with improved information about ASGM activities in these areas
Emissions to air from other major source sectors are higher in Europe North America and Oceania
Mercury emission 2010 gkm2
0 2 5 10 100 1000
Global distribution of anthropogenic mercury emissions to air in 2010
Emissions from various regions in tonnes per year with the range of the estimate and as a percentage of total global anthropogenic emissions Note These numbers cannot be compared directly with those presented in the 2008 assessment (see Chapter 4 Trends in mercury emissions to the atmosphere)
See figure on the following Region Emission (range) tonnes page for map with
Australia New Zealand amp Oceania 223 (54 - 527) 11 specification of regions Values rounded to 3 Central America and the Caribbean 472 (197 - 974) 24
significant figures CIS amp other European countries 115 (426 - 289) 59
East and Southeast Asia 777 (395 - 1690) 397
European Union (EU27) 875 (445 - 226) 45
Middle Eastern States 370 (161 - 106) 19
North Africa 136 (48 - 412) 07
North America 607 (343 - 139) 31
South America 245 (128 - 465) 125
South Asia 154 (782 - 358) 79
Sub-Saharan Africa 316 (168 - 514) 161
Undefined (global total for emissions from 825 (700 - 950) 42 contaminated sites)
Grand Total 1960 (1010 ndash 4070) 100
11
UNEP Global Mercury Assessment 2013
North America
Central America and the Caribbean
South America
Unintentional emissions
Stationary combustion (coal)
Stationary combustion (oil and gas) Oil refining
Pig iron and steel
Intentional uses
Artisanal and small-scale gold mining Chlor-alkali
EU27
North Africa
Sub-Saharan Africa
Non-ferrous metals (Cu Pb Zn Al) Mercury
Large-scale gold
Cement
Product waste
Cremation
CIS amp other European countries
500
100
Middle Eastern States East and Southeast Asia
50
10 tonnes
South Asia Australia New Zealand amp Oceania
South America
North America
Central America and the Caribbean
Sub-Saharan Africa
South Asia North Africa
Middle Eastern States
EU
East and Southeast Asia
CIS amp other European countries
Australia New Zealand amp Oceania
Estimates of 2010 anthropogenic mercury emissions to air from different main sectors in different regions ASGM is shown separately to highlight its geographic distribution and better allow regional comparisons to be made for other sectors
12
UNEP Global Mercury Assessment 2013
Compiling the 2010 inventory of anthropogenic mercury emissions to air The inventories used in successive Global Mercury Assessments continue to improve as better data become available The 2013 update presents an inventory of emissions for 2010 that has a number of improvements over the 2008 assessment and its inventory for 2005
bull A more detailed analysis of emissions from some major source sectors For example fossil fuel consumption is now broken down into categories for combustion in power plants industry and other uses The type of coal or oil used is also considered providing a more accurate estimate of mercury emissions
bull A more detailed consideration of the mercury content of fuels and raw materials used in different countries and regions bull New and updated information on ASGM bull The use of different pollution control technologies
in different countries and regions have been factored into the emissions estimate bull Emission estimates for sectors not previously
included such as aluminium production oil refining and contaminated sites bull More and better information on location of major
point sources such as individual power plants smelters and cement kilns bull Better documentation and greater transparency
with respect to the data and information behind the estimates
The methods for estimating emissions from industrial sectors is complemented by other methods used for more dispersed emissions sources For example estimating emissions from some intentional-use sectors requires intensive work with those sectors Relevant and accurate information about ASGM is generally not available through official channels Estimating mercury emissions from its intentional use in lighting batteries and other products requires analysing the entire production use and waste stream to determine where mercury is likely to be released and in what quantities The approach used in the 2013 assessment addresses the emissions from breakages and wastes resulting from use of these mercury-containing products in society the majority of
which are incinerated or end up in landfills It does not however address industrial wastes or sewage sludge incineration
Uncertainties in emission estimates Estimates of mercury emissions are just that estimates To compile a global assessment requires making a number of assumptions and generalizations Uncertainty associated with the 2010 inventory arises from each of the factors used to estimate the emissions the correctness of the activity data the validity of the emission factors applied and the validity of assumptions regarding the effectiveness and use of emission-control technologies
Based on an evaluation of these sources of uncertainty and the relative contributions of sectors with reliable information and those with less reliable data uncertainty in the 2010 inventory assessment of total anthropogenic mercury emissions to air gives a range of emissions from 1010-4070 tonnes This range is greater than that reported in some previous assessments reflecting a greater appreciation of the sources of uncertainty due to the improved estimation methods and perhaps a more realistic appraisal of the state of knowledge concerning some aspects of emissions
The best estimate taking a conservative approach is 1960 tonnes If nationally produced estimates for 2010 available from some countries (Canada Japan Korea Mexico the United States and European countries reporting to LRTAP) are introduced into the global inventory in place of the inventory estimates the corresponding estimated total global anthropogenic emission to air is 1940 tonnes As most national inventories do not include uncertainty ranges it is not possible to assign a range to this number The recognition of uncertainties is an important consideration and presenting single national estimates can convey a misleading picture of what is known and more importantly not known about emissions
The numbers derived using the methods employed to produce the global inventory for 2010 were compared with a number of national inventories and emissions reported under other systems covering the same period In general the level of agreement was good in particular when the significant uncertainties
13
UNEP Global Mercury Assessment 2013
Methods for estimating emissions All global mercury emissions inventories to date have used the same basic approach for the major sectors emitting mercury to the atmosphere For specific emission sectors national emissions estimates are calculated by multiplying the amount of activity (ie amounts of fuels burned raw materials consumed or materials produced) by an emission factor that is an estimate of the mercury emitted per unit of activity For example emissions from coal-fired power generation are estimated by multiplying the tonnes of coal used by the amount of mercury estimated to be released per tonne of coal In most such inventories ldquoabatedrdquo emission factors have been employed to quantify both the emissions of mercury that occur during the processes and the effects of mercury emission controls In the new methodology used to develop the 2013 report these components are split ldquoUnabatedrdquo emission factors are employed to quantify the emissions and ldquotechnology profilesrdquo have been developed to represent the effects of mercury emission controls
Various methods are employed to estimate emissions of mercury at individual sources and at national regional and global levels In general the methods fall under one of two main categories
bull Mass-balancesubstance-flow based estimates which are based on the principle that what goes in must come out Amounts of mercury in fuels and raw materials constitute the inputs and the outputs are the amounts of mercury emitted to air released to water or land retained in products or in wastes or otherwise recovered and stored or disposed of
involved in both global and national estimates are taken into account It is important to note that there are good reasons why estimates of mercury emissions produced in the 2010 inventory may not fully agree with national inventories made by countries using other methodologies These reasons include
bull Reporting schemes may define and distinguish emissions source sectors in very different ways and aligning these sectors may not be possible
bull Industry reporting to national government may be limited to sources with emissions above a certain threshold level so that emissions from smaller sources below the threshold are not reported Where smaller sources make up a significant part of the source category reported inventories
bull Measurement-based estimates which rely on measurements made at appropriate points in the industrial process or in the productwaste output streams These measurements are used to estimate where the mercury goes as in the method above
In principle the two approaches should produce the same results In practice mass-balance based approaches tend to result in higher emission estimates than most measurement-based estimates Since future emissions reporting is likely to involve a combination of these two approaches further work is required to understand why results may differ and to reconcile the two approaches
Since the 2008 UNEP assessment was produced the number of direct measurements of emissions from certain point sources (in particular power plants and some metal and cement production plants and waste incineration facilities) has increased considerably resulting in a much improved knowledge base
A number of countries require regular reporting of emissions Increasing use is being made in these reporting systems of measurement-based estimates and facility-level reporting in particular for major point sources In other countries national mercury emissions are only being quantified for the first time Since 2005 and the start of the UNEP negotiating process in 2010 many countries have initiated work on national emission inventories which in several cases have yielded much improved information on activity data sector characteristics and mercury emissions Such inventories often make use of the UNEP Toolkit for identification and quantification of mercury emissions
may therefore significantly underestimate total mercury emissions bull National inventories in some countries are making
increasing use of actual measurements of mercury emissions at individual facilities At the global scale it is not yet feasible to base an inventory on individual site emissions Furthermore actual measurements of mercury emissions at a source may be taken only a few times during a year and may not be fully representative of normal operations In the 2013 assessment a mass-balance based approach was employed to be consistent transparent and replicable bull National reporting and monitoring schemes
may provide information that is not available to externally produced inventories
14
UNEP Global Mercury Assessment 2013
Despite these considerations most of the discrepancies noted between the 2010 inventory mass-balance-based estimates and national estimates based on measurement- approaches are modest and within the margins of error associated with the different approaches In cases where the differences are larger it is important to recognize that there are sources of error in all methods for estimating mercury emissions
Gunnar Futsaelig
ter
Sampling of mercury emissions at the Kendal coal-fired power plant in South Africa conducted under a UNEP project A probe with mercury traps is inserted into a sampling port in the stack to collect mercury present in the flue gas The mercury traps are subsequently analysed according to the US EPA Mercury Monitoring Toolkit sampling protocol
15
UNEP Global Mercury Assessment 2013
Trends in mercury emissions to the atmosphere 4 Assessing global and sectoral trends A key question in assessing anthropogenic mercury emissions worldwide is whether they are increasing or decreasing While it is tempting simply to compare the 2010 inventory with its 2005 counterpart the results would mean little As inventory methods develop and as additional sources are considered the estimate of total anthropogenic mercury emissions worldwide also changes While some changes reflect real trends others reflect changes in methods or scope Thus comparing the results of previous assessments with the present update requires considerable care and involves an understanding of the way in which these inventories have been produced and the uncertainties associated with them
It is possible however to compare certain sectors over time by attempting to compensate for any methodological changes between the various inventories since 1990
Emissions to air are thought to have peaked in the 1970s From 1990 to 2005 total anthropogenic emissions of mercury to the atmosphere appear to
Emissions to air t
1400
1200
1000
800
600
400
200
0
1990
1995
2000
2005
Africa Asia Europe Russia North Oceania South America America
Estimates of annual anthropogenic mercury emissions from different continentsregions 1990-2005
have been relatively stable with decreases in Europe and North America being offset by increases in Asia A reanalysis of the available inventories since 1990 however indicates that emissions from industrial sectors at least may be starting to increase again
The changes introduced in the 2010 inventory methodology prevent a straight-forward continuation of this analysis However an evaluation of trends for some sectors between 2005 and 2010 has been made by applying the new methodology to activity data for 2005 This comparison suggests a further slight increase in the combined amount of mercury emitted by industrial sectors (coal combustion production of cement pig iron and steel and non-ferrous metals) The following paragraphs describe the trend results for three sectors to illustrate some of the developments between 2005 and 2010 and some of the the difficulties in comparing emissions estimates between different years made with different methods
Coal burning for power generation and for industrial purposes continues to increase especially in Asia However increases in the application of air pollution controls including some mercury specific technologies together with more stringent regulations in a number of countries have reduced mercury emissions from coal burning in power plants in particular and thus offset some part of the emissions arising from increased coal consumption
In the United States for example emissions from coal burning at power plants have reportedly decreased from about 53 tonnes in 2005 to 27 tonnes in 2010 This decrease is largely due to new regulations that have resulted in changes in the sources of the coal that is burned in large power plants and the installation of mercury controls as well as controls on sulphur dioxide and particulates that have the co-benefit of further reducing mercury emissions
In China many of the new coal-fired power plants have state-of-the-art pollution controls installed
Emissions of mercury from artisanal and small-scale gold mining (ASGM) reported for 2010 are more than twice those reported for 2005 While the
16
UNEP Global Mercury Assessment 2013
Unintentional emission sectors Coal burning ferrous- and non-ferrous (Au Cu Hg Pb Zn) metal production cement production Intentional-use sectors Disposal and incineration of product waste cremation emissions chlor-alkali industry
Comparison of emissions in 2005 and 2010 by selected sector and region
Unintentional emission sectors
Emission t
1000
800
600
400
200
0 2005 2010
Australia New Zealand amp Oceania
Central America and the Caribbean
CIS amp other European countries
East and Southeast Asia
rise in the price of gold (from USD 400 per ounce in 2005 to USD 1100 per ounce in 2010) along with increased rural poverty may indeed have caused more activity in this sector the increased estimate for mercury emissions is considered to be due primarily to some more and better data from many countries and regions West Africa for example was regarded as having minimal ASGM in 2005 but is now recognized as a region with considerable activity Thus the baseline has improved without necessarily any change in actual activity or emission levels
Waste from consumer products is affected by the amount of mercury used For most products in which mercury is used mercury-free alternatives exist Consequently many of these uses of mercury are declining at least in some regions as alternative products or processes are adopted Compact fluorescent light bulbs are an exception Even though the mercury content of individual light bulbs has decreased use of this type of light bulb is increasing rapidly
Artisanal and small-scale gold mining Intentional-use sectors
1000 1000
Step change from 2005 to 2010 due to new information 800 800 (under-estimation in 2005)
600 600
400 400
200 200
0 0 2005 2010 2005 2010
European Union (EU27) South America
Middle Eastern States South Asia
North Africa Sub-Saharan Africa
North America
In order to make valid assessments of trends in emissions from global inventories comparable data on activity levels are required together with information on changes in fuel and raw material characteristics and applied air pollution control technology One aim of the 2010 inventory methods is to create a firmer foundation for such future trend analysis
Ralf Siemieniec Shutterstockcom
Use of mercury-containing energy-saving lamps is increasing
17
UNEP Global Mercury Assessment 2013
Emission scenarios and future trends The 2008 Global Atmospheric Mercury Assessment included a first attempt at projecting future emissions inventories These were based on three scenarios continuing with the status quo applying current emissions controls worldwide and achieving maximum feasible technological reductions At the time this effort was regarded as highly provisional Since then additional studies have extended and improved this work but the results are not markedly different from earlier projections of future mercury emissions
Global mercury models have been used to evaluate future scenarios Four global and hemispheric models projected mercury levels around the world in 2020 based on the three emission scenarios described earlier In industrial regions the status quo will cause an increase in mercury levels of 2-25 and in remote areas of 15-5 The two emission control scenarios on the other hand yield a decrease in mercury in industrial areas of 25-35 and in remote areas of 15-20
Another global model was coupled with estimates of surface reservoirs of mercury in order to quantify source-receptor relationships for the present and for 2050 Under the best-case scenario of maximum feasible reductions projected estimates for deposition in 2050 is similar to estimates for today In the other scenarios increasing emissions lead to increasing deposition A greater proportion of mercury emissions is expected to be in the oxidized form so that a greater proportion will be deposited near the source instead of being transported far away
The model results support the conclusion that reducing anthropogenic emissions will slowly reduce the amount of mercury in biologically available reservoirs Over time mercury in the environment will be taken out of circulation by natural processes for example from ocean waters down into sediments and biologically available mercury will decrease Increased emissions on the other hand will continue to build up the amount of mercury in circulation
With new databases and methods it may soon be possible to create scenarios that incorporate activity levels as well as technology use for each country If this were done it would allow countries to assess the effects of different mercury reduction strategies on their national emissions For example a country could determine the relative contributions of emission reduction technology as opposed to for example changes in raw materials
18
UNEP Global Mercury Assessment 2013
Atmospheric chemistry monitoring and trends 5 Forms of mercury in air Mercury in the atmosphere is in three primary forms Gaseous elemental mercury is the most common in anthropogenic and natural emissions to the atmosphere Gaseous oxidized mercury and mercury bound to particulates are less common The transport and deposition of atmospheric mercury depend greatly on whether the mercury is elemental or oxidized Elemental mercury stays in the atmosphere long enough for it to be transported around the world whereas oxidized and particulate mercury are more readily captured in existing pollution control systems or deposited relatively rapidly after their formation As a result most mercury in the air is in the gaseous elemental phase Relatively little elemental mercury is deposited directly but instead must fi rst be oxidized
Although gaseous oxidized mercury is very important in mercury cycling between air and other environmental compartments the process of oxidation in the air is poorly understood with reactions and resulting compounds yet to be verified in observations
When mercury moves from air to water and land it is generally in an oxidized gaseous or particulate form whereas when it is re-emitted to air it has been converted back to gaseous elemental
Particulate associated mercury
Pole
Equator
Gaseous elemental mercury
Global transport
Gaseous elemental mercury can be transported globally Mercury emitted in particulate form tends to deposit closer to sources
mercury Sunlight appears to play a large role in both oxidation and reduction of mercury but temperature and biological interactions are also likely to be involved to some degree Here too much uncertainty remains Nonetheless the reactions are important in determining net deposition and fate of mercury
Monitoring of mercury in air Monitoring of mercury in air focuses on the three primary forms of mercury The measurement of gaseous elemental mercury is routine and robust Measuring gaseous oxidized mercury and particulate-bound mercury however is challenging Concentrations are typically very low and these forms are chemically unstable leading to high uncertainty in the measurements Nonetheless these forms are critical for defining and modelling the fate and transport of airborne mercury
In the past two decades coordinated mercury monitoring networks and long-term monitoring sites have been established in a number of regions measuring mercury concentrations in the air as well as deposition of mercury in precipitation In Europe and North America high-quality continuous monitoring has been going on for more than 15 years especially in the Arctic High-quality monitoring has started more recently in East Asia and South Africa as part of a global effort to expand the coverage provided by long-term monitoring sites
Measurements and trends in atmospheric mercury Monitoring stations around the world have provided information about trends in atmospheric mercury though the time periods vary depending on how long the site has been active Overall a declining trend in background mercury levels over the past decade has been recorded from monitoring stations
19
UNEP Global Mercury Assessment 2013
in many regions Other regions however show an increase in mercury levels
The sites also provide information about geographical patterns reflecting both background levels of
Trends in atmospheric measurements of mercury
Site(s) Period
Mace Head Ireland 1996-2011
North America rural sites 1995-2005
High Arctic sub-Arctic Up to 20 years of records mid-latitudes
Monitoring networks Mercury monitoring in Europe is carried out under the European Monitoring and Evaluation Programme (EMEP) one of the first international environmental measurement networks Heavy metals such as mercury have been included in the EMEP program since 1999 Mercury measurements are available only from northern and northwestern Europe
Three monitoring networks currently operate in North America providing good coverage of Canada and the United States the Mercury Deposition Network the Canadian Air and Precipitation Monitoring Network and the Atmospheric Mercury Network More recently new sites have been established in Mexico extending coverage on the continent The stations monitor atmospheric mercury and mercury in precipitation which has measured since the mid-1990s Monitoring of mercury in the air and in precipitation has been underway in Asia for nearly a decade
Alert Nord
Point Barrow
Nuuk Stoacuterhoumlfethi
Mace Head
mercury and local and regional influences Mercury concentrations at remote sites in Asia are higher than in other regions of the Northern Hemisphere Coastal cities in China have lower levels than inland sites likely due to the influence of relatively clean
Measurement Trend
Gaseous elemental mercury Decrease of 14-18 per year
Total gaseous mercury Decrease of 22 to 174 in total
Total gaseous mercury Decreasing trend at some stations increasing at others
The monitoring network of the Arctic Monitoring and Assessment Programme (AMAP) includes air and deposition monitoring sites located in Arctic regions of Canada Greenland Iceland Norway Russia and Sweden
Building on existing national and regional monitoring networks the European Union-financed project
ldquoGlobal Mercury Observation Systemrdquo (GMOS) started in November 2010 Its goal is to develop a coordinated global system for monitoring mercury including a large network of ground-based monitoring stations New sites are being installed in regions where few monitoring stations exist especially in the Southern Hemisphere Two sites have been established in Antarctica one on the Antarctic Plateau and one on the coast
Ny-Aringlesund
Amderma Pallas
Raringouml Bredkaumllen
Listvyanka Diabla Gora
Mauna Loa
Mt Bachelor
Celestuacuten Calhau
Longobucco
Iskrba Niembro Monte Cimone Cap
Ferrat Mt Waliguan Ganghwa Island
Lulin
Cape Hedo Ev-K2
Mt Changbai
Minamata Mt Ailao
Nieuw Nickerie
Kodiakanal
Maheacute Island Manaus
Bariloche Cape Point
Amsterdam Island Cape Grim
Dumont drsquoUrville
AMAP CAMnet EMEP GMOS GMOS associated NADPAIRMoN NADPMDN
Air + precipitation Air Precipitation
20
UNEP Global Mercury Assessment 2013
John Munthe
The mercury background air monitoring station at Zeppelin mountain Svalbard
air from over the ocean Sites off the Asian coast however show higher levels of gaseous elemental mercury than the Northern Hemisphere background suggesting an outflow from the Asian mainland
Weather patterns have also been found to have a strong influence on seasonal patterns in mercury levels in the air at monitoring sites At the Mount Waliguan Observatory on the Tibetan Plateau for example northeasterly and easterly winds produced the highest levels of mercury
Measurements at high altitudes Measurements from ground-based stations above 2700 meters suggest that there is an inverse relationship between gaseous elemental mercury and gaseous oxidized mercury at these elevations In other words when there is more elemental mercury there is less oxidized mercury and vice versa These measurements are in good agreement with modelling results which gives additional confidence in current understanding of the behaviour of mercury at high altitude
An inverse relationship between total gaseous mercury and particulate concentration has also been observed in the high stratosphere From the transformation rate of total gaseous mercury to particulate-bound mercury it appears that gaseous mercury lasts about two years in the stratosphere
21
UNEP Global Mercury Assessment 2013
Atmospheric concentrations and deposition 6 Measurements and trends of mercury in precipitation Mercury deposited by precipitation decreased from the 1990s into the 2000s at many but not all sites in North America and Western Europe where such measurements were taken
Regional patterns are also evident including slightly higher levels in southern Europe than northern Europe and higher levels in Asia than in North America Total mercury concentrations in precipitation in China were much higher than those in Japan and South Korea Th is was mostly attributed to higher levels of gaseous oxidized mercury and particulate-bound mercury which are readily deposited by precipitation and thus not transported far
A comparison of data from Canadian and American monitoring sites found that deposition of mercury in precipitation was highest in summer
Dry deposition of mercury which is deposition not associated with precipitation is diffi cult to measure and consequently there is little information on trends in mercury dry deposition Th is lack of information means that it is also diffi cult to validate model results for dry deposition
106 44
474 72 91
5 7 71
05 1 5 10 100 500 1000
Total mercury emission (2005) kgcell
Modelled mercury air concentrations and deposition patterns Atmospheric mercury concentrations are highest in major industrial regions Models examining global patterns show that East and South Asia Europe North America and South Africa have the highest levels of elemental mercury in the air Concentrations are generally lower in the Southern Hemisphere than the Northern Hemisphere because most industrial activity is in northern regions Th ese model results are based on simulations using the 2005 global mercury emission inventory because the 2010 inventory has only recently become available
Intercontinental transport of mercury in the air has been examined to determine its impact on regional mercury levels Four models using diff erent parameters produced consistent results Depending on the region mercury emitted by distant sources contributes between 10 and 30 of annual mercury deposition Where local sources are low mercury transported from distant emission sources can account for more than half of the deposition East Asia is the dominant source region adding 10-14 to the deposition in
Contribution from sources outside receptor region
Model 40
GEOS-Chem GLEMOS GRAHM CMAQ-Hg
30
20
10
0 Arctic Europe North East Asia South Asia
America
Receptor region
(Left ) Global distribution of anthropogenic mercury emissions in 2005 with source regions that were considered in the analysis (North America South America Europe Africa Central Asia South Asia East Asia Australia and Oceania) and (right) the contribution of anthropogenic sources outside a particular receptor region to deposition within the receptor region
22
UNEP Global Mercury Assessment 2013
Modelling atmospheric transport and deposition Global models reproduce the movement of mercury in the atmosphere during which the mercury may move between continents They have been effective in examining sources of mercury to the Arctic and also for examining the outflow of pollution from South and Southeast Asia and its impact on western North America as well as the flow from eastern North America to Europe
Regional models on the scale of a continent or a basin such as the Mediterranean can provide more detail about specific source areas even to the level of individual industrial areas Reliable results however require a detailed understanding of mercury oxidation in the atmosphere about which there is considerably uncertainty
Most atmospheric transport models consider the full chain of mercury processes in the atmosphere Some models also consider how mercury is cycled in other atmospheric compartments such as soil vegetation snow freshwater and seawater
One of the largest sources of uncertainty in mercury models is the chemical mechanism used to determine how mercury changes forms in the air Improved experimental data can help improve model performance by making sure that the correct reactions are simulated The processes that lead from deposition to re-emission also need to be understood better Advances in this area show promise with model results becoming closer to estimates based on experimental data
other regions of the world Natural emissions and re-emissions account for 35-70 of total deposition in most regions Deposition is generally greater in low and mid-latitudes due to stronger sunlight higher concentrations of oxidants and higher precipitation
Regional mercury models show patterns at the scales of continents or individual seas The Mediterranean Sea for example is a net source of mercury as it emits more than is deposited to it In that region dry deposition generally exceeds deposition of mercury in precipitation In Central and Southern Europe total gaseous mercury concentrations and deposition in precipitation were both consistently higher than the European average
Across the United States dry deposition accounts for two-thirds of total annual deposition mainly from gaseous oxidized mercury A study examining sources and deposition of mercury to assess the
benefits of proposed emission control measures found that mercury transport from outside the country accounts for 68 of mercury deposition in the Northeast and up to 91 in the west-central United States Large point sources contribute up to three-quarters of nearby deposition and power plants contributed half of the deposition in the eastern part of the country This suggests that new emissions standards would primarily benefit eastern regions of the US
In Asia studies show high seasonal variation in mercury concentration and deposition Anthropogenic emissions are responsible for about 75 of deposition in East Asia In this region there is a net removal of gaseous oxidized mercury from the atmosphere and a net export of gaseous elemental mercury
In the Arctic gaseous elemental mercury levels in the atmosphere are depleted rapidly in spring when after the long Arctic winters sunlight returns Ozone is depleted at the same time and it is believed that bromine-containing compounds are the cause of the photo-chemical reactions that deplete ozone and mercury During these events gaseous oxidized mercury and particulate-bound mercury levels increase sharply suggesting that the gaseous mercury is oxidized and deposited enhancing mercury deposition in Arctic areas in springtime Recent research however has found that 50-80 of the deposited mercury is re-emitted within a few days Similar springtime mercury depletion events have been seen in Antarctica
23
UNEP Global Mercury Assessment 2013
Anthropogenic releases to the aquatic environment 7 Global assessment Previous UNEP global mercury assessments only considered emissions to the atmosphere The 2013 Report presents the first attempt at compiling a global inventory of mercury releases to aquatic environments Releases directly into the aquatic environment present a completely different chemistry set of pathways and fate to those released to air They are also more directly linked to the risks posed by mercury to global environmental and human health Unlike mercury releases to air which are predominantly in the form of gaseous elemental mercury releases to water are predominantly inorganic mercury and to a lesser extent liquid elemental mercury
At present only some sources of aquatic releases can be quantified with any confidence Thus many sources that may be important are not included in this first assessment of global aquatic releases For example land management practices that expose new geological sources of mercury in rocks and mineral soils or that re-mobilize previously deposited mercury cannot yet be assessed Two broad categories of current anthropogenic sources are considered here point sources of mercury release to water and diffuse releases of mercury as a result of its remobilisation from areas where it was previously deposited or accumulated due to human activity (ie contaminated sites) Artisanal and small-scale gold mining (ASGM) mercury-containing pesticides and fungicides used in agriculture and deforestation are considered separately
Point source releases to water from various sectors in tonnes per year with the range of the estimate and as a percentage of total anthropogenic emissions
Sector Releases (range) tonnes
Non-ferrous metal production 925 (193 - 268)
Consumer product waste 894 (222 - 308)
Chlor-alkali production 28 (10 ndash 55)
Oil refining 06 (03 ndash 1)
Grand Total 185 (426 ndash 582)
The global estimate of mercury release to water from point sources has been derived from the atmospheric emissions assessment and the approach employed in the UNEP Toolkit to partition total mercury releases between air land and water This approach has considerable uncertainty and may omit sectors where releases to water are high but air emissions are unimportant and therefore not addressed in the inventory Global releases from point sources were estimated to be 185 tonnes per year
For diffuse sources evaluating the relative contribution of anthropogenic and natural sources to the aquatic environment requires determining considerations of the various mercury inputs For some sectors data exist that allow a preliminary assessment of the amounts of mercury re-mobilized into aquatic systems
For mercury-contaminated sites the range of average soil concentrations of mercury reported for sites where mercury was mined used or otherwise released by human activity was considered The area of contamination is then used to determine how much mercury is available in soils and when combined with a factor for how much mercury is released from those soils in a year the total release can be estimated Among identified contaminated sites mercury mining is identified as the largest sector followed by mining of precious metals Total releases to aquatic environments from contaminated sites are estimated to be 83-335 tonnes per year
Releases to water from contaminated sites in tonnes per year with the range of the estimate
Sector Releases (range) tonnes
Primary mercury mining sites 67 ndash 266
Precious metal production sites 14 ndash 55
Non-ferrous metal production sites 01 ndash 05
Chlor-alkali production sites 01 ndash 05
Other industrial sites 01 ndash 03
Grand Total 83 ndash 335
24
UNEP Global Mercury Assessment 2013
Much of the mercury released from artisanal and small-scale gold mining goes into rivers lakes soils and sediments and tailings From soils and tailings it may be re-mobilized by leaching and erosion In addition mining may disturb mercury-containing soils and sediments that may then erode more quickly releasing more mercury than would otherwise have become available from natural erosion A key factor in these processes is the local hydrological cycle of precipitation evaporation run-off and river flow To account for this in the assessment countries were designated as dry wet or intermediate to determine the relative importance of erosion The tropical and subtropical countries which have the greatest activity in this sector also tend to experience high precipitation and run-off exacerbating this source of mercury release and re-mobilization Total worldwide releases of mercury to land and water from ASGM were estimated at over 800 tonnes per year How much of this is released to water cannot yet be determined
Mercury continues to be used in pesticides and fungicides 2100 tonnes of mercury were released in the decade of the 1960s through such agrochemical uses Current data are unavailable although the use of mercury in these products has been greatly reduced
Deforestation especially in the Amazon Basin can lead to extensive soil erosion and thus the release of mercury previously accumulated in soils Using 2010 figures for deforestation rates around the world and an estimate of soil concentrations of mercury as much as 260 tonnes of mercury may have been released into rivers in 2010 as a result of deforestation worldwide
Because this is the first attempt to quantify global mercury releases to the aquatic environment there is no previous measurement against which these results can be compared Thus it is not possible at this time to evaluate trends in releases
Uncertainties in release estimates Estimating global releases of mercury to aquatic environments is being done here for the first time Many data are missing and others are imprecise A number of assumptions have been made based on what measurements are available or on other grounds to extrapolate from known quantities or to calculate aquatic releases in relation to atmospheric
or other emissions Thus the results should be treated with great caution It is nonetheless clear that anthropogenic sources and human activity contribute hundreds of tonnes of mercury to aquatic environments each year a substantial amount relative to estimated natural releases 150-960 tonnes per year from terrestrial environments
Lapshin Shutterstockcom
Phil Augustavo istockphotocom
Bureau of Land Managem
ent
Contaminated sites (top) erosion following deforestation (middle) and a flooded store of mercury-contaminated waste (lower) illustrate potential sources of mercury releases to water
25
UNEP Global Mercury Assessment 2013
Aquatic pathways transport and fate 8 Mercury in aquatic environments The pathways and fate of mercury in aquatic environments are important because it is in waters sediments and wetland soils that inorganic mercury is converted into methylmercury which is toxic and concentrates in animals The majority of human exposure to mercury and the health risk that comes with mercury exposure is from consumption of marine foods Thus this section focuses on the worldrsquos oceans Some freshwater systems however are important sources of fish for human consumption especially for subsistence and recreational fisheries often among indigenous peoples Artisanal and small-scale gold mining (ASGM) communities may also be affected through fish consumption and drinking water if those are contaminated by local releases
The major processes of mercury cycling are generally similar for all aquatic systems Inorganic mercury in dissolved or particulate form is the dominant mercury type in most marine and fresh waters Dissolved gaseous elemental mercury accounts for less than 30 of total mercury in water Methylmercury is often present at trace levels but may in some settings reach 30 of total mercury In freshwater and coastal environments inorganic mercury is transformed into methylmercury primarily in sediments In the open ocean this conversion takes place largely at intermediate depths between 200 and 1000 meters in the water column Mercury is lost from aquatic systems in two ways When inorganic mercury is reduced to elemental mercury it can be re-emitted to the atmosphere When inorganic mercury binds to particulates in water it can settle out rapidly and be buried in sediments Deep burial in ocean sediments is one of the major pathways by which mercury is removed from the biologically active environment
The global mercury cycle is chemically and physically complex Thus it is necessary to use models to study describe and predict what happens and will happen to mercury in the aquatic environment Until recently only one model existed that incorporated
air land and water into a unified whole The model has been validated against observations of mercury and represents the current scientific consensus The largest potential errors in this model in terms of the aquatic cycle concern details of the exchange of mercury between air and water
Pathways and fate of mercury in the oceans Model simulations suggest that anthropogenic impacts on mercury levels in the ocean are greatest in the surface waters the top 100 meters or so of the water column While model results vary one recent estimate suggests that anthropogenic emissions over the last 100 years have doubled the concentration of mercury in the surface layer of the ocean and increased it by 25 in intermediate waters and by 10 in deep waters The difference is due to the length of time it takes for surface waters to circulate to the depths
Models and measurements agree that direct deposition from the atmosphere is the dominant pathway by which mercury reaches the oceans The exceptions are smaller semi-enclosed basins such as the Mediterranean Sea or the Arctic Ocean where river runoff coastal erosion and ocean currents
Ugo M
ontaldo Shutterstockcom
26
UNEP Global Mercury Assessment 2013
account for about half of mercury inputs The most recent modelling effort suggests that total deposition input of mercury to the oceans in 2008 was 3700 tonnes
Other mercury pathways appear less important on a global basis Rivers are estimated to carry more than 2800 tonnes of mercury each year but only about 380 tonnes of this is transported offshore The rest is trapped by particles in estuaries Groundwater and re-mobilization from sediments provide 100shy800 tonnes of mercury to the oceans each year Undersea hydrothermal vents add less than 600 tonnes of mercury to the oceans There are high concentrations of mercury in vent fluids but a great deal of the mercury is precipitated as solids once the vent fluids enter seawater
Models suggest that globally about 70 of the mercury deposited into the ocean is re-emitted to the atmosphere Oxidized mercury in surface waters is reduced by biological and photochemical processes to the elemental form that is volatile and readily re-emitted The removal of this mercury ultimately reduces the pool of mercury that could be converted to methylmercury and be accumulated by marine organisms The re-emission process thus simultaneously prolongs the lifetime of mercury cycling through the atmosphere and upper ocean and acts to reduce mercury availability for marine food webs
Any changes in the efficiency of mercury reduction in surface waters or the rate of re-emission is likely to impact mercury concentrations in surface waters and the air One example is the effect of sea ice in the Arctic Ocean which blocks the re-emission
Tony Magdaraog Shutterstockcom
Mercury accumulated in marine food-webs can enter the human diet
of elemental mercury leaving elevated levels in waters under ice Changes in primary productivity could change the rate at which mercury is bound to particles thus affecting re-emission to the atmosphere as well as rates of downward transport in the ocean Changes in oxidant levels in the atmosphere such as ozone and bromine may also influence the rate of oxidation of gaseous elemental mercury and thus deposition rates to the ocean
Methylmercury in the ocean Natural bacterial processes in seawater and in sediments in coastal environments convert inorganic mercury to methylmercury Methylmercury levels are highest in the subsurface waters of many oceans because it is formed at these intermediate depths likely as a result of the decomposition of organic material falling from surface waters Current understanding indicates that about 300 tonnes of methylmercury is produced in the upper ocean by this and related processes By contrast only about 80 tonnes of methylmercury reaches the ocean from other sources such as atmospheric deposition rivers and diffusion from sediments
Current modelling indicates that methylmercury stays in the upper ocean for about 11 years Deshymethylation by photochemical reaction or by microbial activity is the major removal process for methylmercury in the ocean About 240 tonnes of methylmercury is removed by this process from the surface waters of the ocean per year
The other important pathway for methylmercury in seawater is uptake into marine food webs Although only about 40 tonnes per year is taken up in this way it is this fraction that poses risks to marine animals and human consumers of seafood Methylmercury is a problem for several reasons First it is taken up by plankton much more efficiently than is inorganic mercury resulting in concentrations in plankton that are as high as 10000 times the concentration in seawater Second methylmercury is absorbed through the intestine of animals much more easily than is inorganic mercury Third methylmercury biomagnifies as it moves up the food web Thus methylmercury becomes an increasingly greater proportion of the mercury in organisms higher in the food web This explains why some indigenous populations that consume top marine predators such as fish seals and whales have some of the worldrsquos highest concentrations of methylmercury giving rise to health concerns
27
UNEP Global Mercury Assessment 2013
Pathways and fate of mercury in freshwater Observations and modelling both show that there are in general many similarities between mercury chemistry pathways and fate in lakes and in the oceans but with obvious differences in scale and in the relative importance of different processes Modelling of mercury dynamics was done for four lakes with a history of direct mercury inputs from the largest freshwater lake in the world (Lake Superior) to small lakes in Ontario Canada Atmospheric deposition and river inflow were the main sources of inorganic mercury Much of the mercury input from lake and river catchments was associated with dissolved and particulate organic matter The dominant mercury removal mechanisms as in saltwater were burial in sediments and photochemical reduction of oxidized mercury to elemental mercury followed by re-emission to the air In Lake Superior and Lake Michigan there is evidence for methylation of mercury in the water column as is seen in the open ocean
Methylmercury levels in freshwater fish vary with the level of deposition of mercury from the air though other factors such as inputs from the watershed and the number of trophic levels within the lakersquos food web are also important Methylation predominantly occurred in lake sediments and wetlands and floodplain soils where sulphateshyreducing bacteria are believed to be primarily responsible Methylmercury is de-methylated in sediments and also taken away in the outlet river from each lake
Some 400-1400 tonnes of mercury are estimated globally to be trapped behind dams and other man-made impoundments each year This has in many cases led to significant increases in total mercury and methylmercury levels in water and of methylmercury in fish and other aquatic species When artificial lakes are created plant material is submerged leading to decay and anoxia In these conditions microbially driven methylation of inorganic mercury takes place In some cases the elevated mercury levels have also been observed downstream from the artificial lakes and reservoirs
Anthropogenic impacts on aquatic mercury levels Two studies have reported that the Atlantic and Pacific Oceans have shown opposing trends over recent decades While the influence of changing ocean currents and other oceanographic factors may be a factor the trends do make sense in light of patterns of anthropogenic emissions In the North Pacific Ocean mercury concentrations appear to have increased at depths between 200 and 1000 meters over the last few decades This increase coincides with the rapid industrialization of East Asia
In the North Atlantic however results from near Bermuda suggest a substantial decrease in mercury concentration and a change in the mercury profile through the water column The Mediterranean Sea too showed a decrease in mercury concentration between 1990 and 2004 These findings are consistent with atmospheric data from around the North Atlantic The conclusion is that mercury levels in seawater in the North Atlantic were elevated by human activity but may now be declining likely as a result of decreased emissions from North America and Europe
A complementary approach to measuring mercury in seawater is to measure mercury in aquatic animals which accumulate and integrate mercury over time Teeth hair feathers and eggshells are useful long-term archives of mercury concentrations and can provide data from the pre-industrial period (ie before 1800) as well as more recent periods
Among marine animals samples are available from several regions particularly from the Arctic where cold dry conditions help preserve animal tissues Mercury concentrations between the 13th and 16th
centuries were relatively stable From the mid- to late 19th century to the end of the 20th century mercury levels increased by an average of 12 times On average therefore about 92 of the mercury in Arctic marine wildlife today is likely to be of anthropogenic origin
Similar findings were found for a 700-year sequence of seabird eggshells from the South China Sea Mercury levels increased steadily between 1800 and 2000 with a particularly rapid increase after 1970 Concentrations since 2000 are about 10 times higher than pre-industrial levels with 91 of the mercury now likely to be of anthropogenic origin In the Antarctic studies of seal hairs show that pre-industrial mercury levels were only 60 of recent levels The relatively small difference
28
UNEP Global Mercury Assessment 2013
Historical Hg concentration as a proportion of present-day 100
80
60
40
20
0
Beluga teeth Human teeth
Gyrfalcon feathers Perigrine falcon feathers
Polar bear hair Ringed seal teeth
1200 1300 1400 1500 1600 1700 1800 1900 2000
between pre-industrial and modern mercury levels in Antarctic is consistent with lower mercury emissions and atmospheric concentrations in the Southern Hemisphere as compared with the Northern Hemisphere
The timing of long-term increases of mercury in aquatic animals can shed light on the likely sources of mercury emissions that were responsible The industrialization of Europe and North America appear responsible for the large increases in marine mercury levels that began in the 19th century as these increases occurred prior to recent Asian industrialization As with water concentrations in the Pacific Ocean recent rapid increases in mercury in seabird eggs in the South China Sea coincide with industrialization in Asia
The time lag in aquatic ecosystem response One important conclusion from air-ocean modeling is that the oceans have not yet reached equilibrium with current atmospheric levels of mercury This lag is due to several factors First mercury stays in the upper ocean above 200 meters depth for about 30 years and for centuries in intermediate and deep waters This is much longer than the one year residence time in the lower atmosphere Thus removal from the ocean takes much longer than does removal from the air and so concentrations will change more slowly
Second because of the long lifetime of mercury in deeper ocean waters a great deal of natural mercury is present in the ocean already about 100000 tonnes out of a total of 135000 tonnes in intermediate waters and 200000 out of 220000 tonnes in deep waters
Rune Dietz
Analysis of museum samples reflects the increase in mercury emissions and releases since the mid-19th century associated with anthropogenic activities
Third vertical transport of mercury from intermediate depths back to the surface returns a substantial amount of mercury to the biologically active zone each year As a result average mercury concentrations in seawater and marine animals are likely to increase slowly for decades if not centuries even if atmospheric levels stabilize at present levels In short the effects of historical anthropogenic emissions from Europe and North America are still being observed in the oceans at the same time that the effects of the recent rise in emissions from Asia are being seen
Regionally different trends can be expected depending on distance from sources and ocean circulation patterns In the North Atlantic north of 55deg N it will take 50-600 years to achieve equilibrium between atmospheric and seawater mercury levels In the North Pacific this process is estimated to take 500-700 years and in the Antarctic 700-1000 years The Arctic Ocean by contrast is smaller and will only take about 35 years to reflect changes in atmospheric mercury levels Surface waters of the Mediterranean Sea should show also changes within 10-50 years
Time lags in the responses of many freshwaters and their food-webs to changes in atmospheric mercury levels are also expected Although some immediate recovery following reductions in atmospheric mercury deposition rates is likely full recovery may take decades centuries or longer depending on the characteristics of the area Highly polluted freshwaters with catchments and sediments containing large amounts of anthropogenic mercury will recover most slowly as is already observed around point sources such as smelters that have closed down
29
UNEP Global Mercury Assessment 2013
Major gaps in knowledge 9 Large uncertainties remain in global estimates of mercury emissions to the air These stem from various sources including the availability of information on activity levels but mainly from the lack of information concerning the mercury content of some raw materials and the validity of assumptions regarding processes and technologies employed to reduce mercury emissions including their rates of application and effectiveness The accuracy and precision of measurement-based estimates can depend on the validity of extrapolating measurements made at infrequent intervals to longer periods or measurements made at one plant to other facilities with similar operations
Potentially important emissions sectors that are still not quantified in the emissions inventory include the use of mercury in vinyl-chloride monomer production secondary metals production oil and gas extraction transport and processing industrial and hazardous waste incineration and disposal sewage sludge incineration and dental fillings preparation and removal
Current measurements and their evaluation are inadequate for determining spatial and temporal trends Improved more extensive and better coordinated measurements are needed A permanent global integrated monitoring network for atmospheric mercury and mercury deposition is needed to achieve this goal The atmospheric network sites should be closely integrated with water soil and biological monitoring networks The results can be used for model testing and evaluation as well as for more accurately detailing the geographic impact of anthropogenic emissions Monitoring of mercury concentrations in the important marine food species is essential to understanding possible human health impacts and the effects of future emissions changes
Better data on mercury distribution in the troposphere is needed to improve understanding of long-range transport and source-receptor relationships Coordinated studies at high altitudes and by aircraft are needed This information will
also help validate regional and global scale models improving their prediction capabilities with regard to different policy scenarios
Key processes related to global transport and cycling of mercury remain inadequately understood The chemical form of gaseous oxidized mercury is unknown Reduction and oxidation rates for mercury in the presence of atmospheric oxidants need further study including determining which oxidants are important New measurements and modelling studies are needed to examine key chemical and physical processes that affect global transport and cycling
Few data are available for reporting mercury releases to aquatic systems Systematic and consistent monitoring of mercury releases to the air is required especially for contaminated systems Releases of mercury from soils into waters depend greatly on climate and topography and these parameters need to be better accounted for Consistent approaches for measuring and reporting releases from point sources are needed to ensure comparability of data from around the world In particular the actual role of artisanal and small-scale gold mining (ASGM) in emissions to air and releases to water needs to be more accurately estimated
The link between mercury deposition methylation and uptake by living organisms needs further study The parameters that determine the rates of exchange of mercury compounds between air and sea air and soil and air and vegetation are not fully understood Whole-ecosystem studies of mercury are needed to better understand biogeochemical cycling Methylationdemethylation rates and their spatial and temporal variations and relationship to climatic factors need to be determined in most of worldrsquos major ocean basins as well as in representative freshwaters
30
UNEP Global Mercury Assessment 2013
Key findings of the 2013 assessment 10 Atmosphere Total anthropogenic emissions of mercury to the atmosphere in 2010 are estimated at 1960 (1010shy4070) tonnes which is about 30 of the total mercury that was emitted and re-emitted from anthropogenic and natural sources in that year The largest anthropogenic sources are associated with artisanal and small-scale gold mining (ASGM) and coal burning which together account for about 62 of the annual total anthropogenic emissions to air Other major sectors include ferrous and non-ferrous metal production and cement production
East and Southeast Asia are responsible for about 40 of global anthropogenic emissions About 75 of the mercury from this region comes from China which is about one-third of the global total Increased estimates for emissions from ASGM largely a result of newly obtained data and improved information mean that South America and Sub-Saharan Africa are also responsible for a greater proportion of global emissions than was previously assumed
Anthropogenic emissions over time have increased mercury loads present in the environment This leads to higher rates of re-emission and also means that there will be a time lag of years or decades between emissions reductions and lower mercury levels in the food web including pathways of human exposure
Mercury emissions to the atmosphere likely peaked in the 1950s to 1970s and subsequently declined because of reductions in Europe Russia and North America Emission trends are unclear due to changes in methods employed to produce inventories and differences in the sectors that have been accounted at different times There are however some indications that emissions may be rising again with increases from East Asia offsetting continuing reductions in Europe and North America
Aquatic environments Natural processes in aquatic systems convert less toxic elemental and inorganic mercury into much more toxic methylmercury Methylmercury concentrates and accumulates in the food web leading to high concentrations in some species of seafood and fish that many people eat
Anthropogenic releases of mercury to aquatic environments contribute hundreds of tonnes to the amount of mercury cycling in the environment Diffuse releases and point sources appear equally important Atmospheric deposition however remains the most important input of mercury to land and oceans and has increased the amount of mercury in many environmental compartments by a factor of two or three since the start of the industrial age On land mercury that is deposited is largely retained in soils and vegetation increasing the available pool for re-mobilisation to adjacent aquatic systems Re-emission from soils however is a major addition to atmospheric mercury
Hydrology is the most important factor in the transport of mercury from catchments to downstream environments Relatively little of this mercury reaches the open ocean as most is captured in sediments behind dams in estuaries and near the coast Changes in land cover and land use can have a large effect on mercury mobilisation as exposed soils erode and mercury leaches into the water table
Concentrations of mercury in Arctic marine animals today are about 10-12 times higher than in preshyindustrial times (ie prior to about 1800) This means that on average about 92 of the mercury in marine predators such as seabirds seals and whales is anthropogenic in origin The timing of the increase suggest that 19th and early 20th century emissions from Europe North America and Russia were responsible Increases mercury concentrations in seabirds in the South China Sea appear to be more recent than the Arctic increases coinciding with increasing industrialisation in East and Southeast Asia
31
UNEP Global Mercury Assessment 2013
K+S Entsorgung Gm
bH
Recovered mercury is being stockpiled at long-term storage sites above- and as shown here below ground
The upper 100 meters of the oceans have twice the mercury that they did a century ago Intermediate and deeper waters have 10-25 more mercury on average reflecting the slow transport of mercury downwards in the oceans Seawater concentrations will thus be especially slow in responding to changes in mercury inputs from atmospheric deposition and river flow As a result mercury concentrations in marine biota are likely to increase slowly for decades to centuries even without an increase in atmospheric emissions
In freshwater ecosystems atmospheric deposition and re-mobilisation from soils slow the reduction of mercury levels even in regions where atmospheric concentrations have decreased due to emission controls
Further increases in atmospheric emissions will have long-term consequences for commercial fisheries and all consumers of marine and freshwater foods
It is likely to be years or decades before reductions in anthropogenic emissions and releases of mercury have a demonstrable effect on mercury levels throughout the environment and in the fish and marine mammals which are part of the human food-chain This only reinforces the need to act now to continue and strengthen international efforts to reduce current mercury emissions and releases Delays in action now will inevitably lead to slower recovery of the worldrsquos ecosystems in future from mercury contamination leaving an even greater legacy of pollution for future generations
32
Division of Technology Industry and Economics (DTIE) Chemicals Branch Geneva Switzerland January 2013
Job number DTI1636GE
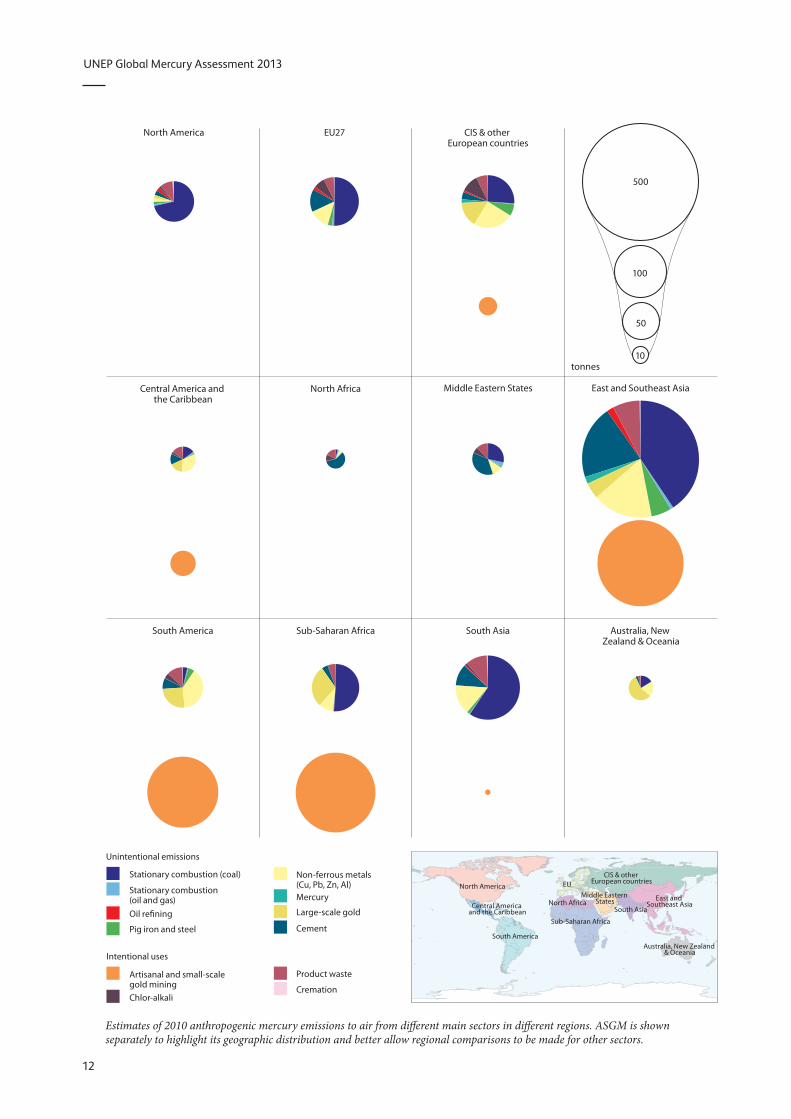
UNEP Global Mercury Assessment 2013
North America
Central America and the Caribbean
South America
Unintentional emissions
Stationary combustion (coal)
Stationary combustion (oil and gas) Oil refining
Pig iron and steel
Intentional uses
Artisanal and small-scale gold mining Chlor-alkali
EU27
North Africa
Sub-Saharan Africa
Non-ferrous metals (Cu Pb Zn Al) Mercury
Large-scale gold
Cement
Product waste
Cremation
CIS amp other European countries
500
100
Middle Eastern States East and Southeast Asia
50
10 tonnes
South Asia Australia New Zealand amp Oceania
South America
North America
Central America and the Caribbean
Sub-Saharan Africa
South Asia North Africa
Middle Eastern States
EU
East and Southeast Asia
CIS amp other European countries
Australia New Zealand amp Oceania
Estimates of 2010 anthropogenic mercury emissions to air from different main sectors in different regions ASGM is shown separately to highlight its geographic distribution and better allow regional comparisons to be made for other sectors
12
UNEP Global Mercury Assessment 2013
Compiling the 2010 inventory of anthropogenic mercury emissions to air The inventories used in successive Global Mercury Assessments continue to improve as better data become available The 2013 update presents an inventory of emissions for 2010 that has a number of improvements over the 2008 assessment and its inventory for 2005
bull A more detailed analysis of emissions from some major source sectors For example fossil fuel consumption is now broken down into categories for combustion in power plants industry and other uses The type of coal or oil used is also considered providing a more accurate estimate of mercury emissions
bull A more detailed consideration of the mercury content of fuels and raw materials used in different countries and regions bull New and updated information on ASGM bull The use of different pollution control technologies
in different countries and regions have been factored into the emissions estimate bull Emission estimates for sectors not previously
included such as aluminium production oil refining and contaminated sites bull More and better information on location of major
point sources such as individual power plants smelters and cement kilns bull Better documentation and greater transparency
with respect to the data and information behind the estimates
The methods for estimating emissions from industrial sectors is complemented by other methods used for more dispersed emissions sources For example estimating emissions from some intentional-use sectors requires intensive work with those sectors Relevant and accurate information about ASGM is generally not available through official channels Estimating mercury emissions from its intentional use in lighting batteries and other products requires analysing the entire production use and waste stream to determine where mercury is likely to be released and in what quantities The approach used in the 2013 assessment addresses the emissions from breakages and wastes resulting from use of these mercury-containing products in society the majority of
which are incinerated or end up in landfills It does not however address industrial wastes or sewage sludge incineration
Uncertainties in emission estimates Estimates of mercury emissions are just that estimates To compile a global assessment requires making a number of assumptions and generalizations Uncertainty associated with the 2010 inventory arises from each of the factors used to estimate the emissions the correctness of the activity data the validity of the emission factors applied and the validity of assumptions regarding the effectiveness and use of emission-control technologies
Based on an evaluation of these sources of uncertainty and the relative contributions of sectors with reliable information and those with less reliable data uncertainty in the 2010 inventory assessment of total anthropogenic mercury emissions to air gives a range of emissions from 1010-4070 tonnes This range is greater than that reported in some previous assessments reflecting a greater appreciation of the sources of uncertainty due to the improved estimation methods and perhaps a more realistic appraisal of the state of knowledge concerning some aspects of emissions
The best estimate taking a conservative approach is 1960 tonnes If nationally produced estimates for 2010 available from some countries (Canada Japan Korea Mexico the United States and European countries reporting to LRTAP) are introduced into the global inventory in place of the inventory estimates the corresponding estimated total global anthropogenic emission to air is 1940 tonnes As most national inventories do not include uncertainty ranges it is not possible to assign a range to this number The recognition of uncertainties is an important consideration and presenting single national estimates can convey a misleading picture of what is known and more importantly not known about emissions
The numbers derived using the methods employed to produce the global inventory for 2010 were compared with a number of national inventories and emissions reported under other systems covering the same period In general the level of agreement was good in particular when the significant uncertainties
13
UNEP Global Mercury Assessment 2013
Methods for estimating emissions All global mercury emissions inventories to date have used the same basic approach for the major sectors emitting mercury to the atmosphere For specific emission sectors national emissions estimates are calculated by multiplying the amount of activity (ie amounts of fuels burned raw materials consumed or materials produced) by an emission factor that is an estimate of the mercury emitted per unit of activity For example emissions from coal-fired power generation are estimated by multiplying the tonnes of coal used by the amount of mercury estimated to be released per tonne of coal In most such inventories ldquoabatedrdquo emission factors have been employed to quantify both the emissions of mercury that occur during the processes and the effects of mercury emission controls In the new methodology used to develop the 2013 report these components are split ldquoUnabatedrdquo emission factors are employed to quantify the emissions and ldquotechnology profilesrdquo have been developed to represent the effects of mercury emission controls
Various methods are employed to estimate emissions of mercury at individual sources and at national regional and global levels In general the methods fall under one of two main categories
bull Mass-balancesubstance-flow based estimates which are based on the principle that what goes in must come out Amounts of mercury in fuels and raw materials constitute the inputs and the outputs are the amounts of mercury emitted to air released to water or land retained in products or in wastes or otherwise recovered and stored or disposed of
involved in both global and national estimates are taken into account It is important to note that there are good reasons why estimates of mercury emissions produced in the 2010 inventory may not fully agree with national inventories made by countries using other methodologies These reasons include
bull Reporting schemes may define and distinguish emissions source sectors in very different ways and aligning these sectors may not be possible
bull Industry reporting to national government may be limited to sources with emissions above a certain threshold level so that emissions from smaller sources below the threshold are not reported Where smaller sources make up a significant part of the source category reported inventories
bull Measurement-based estimates which rely on measurements made at appropriate points in the industrial process or in the productwaste output streams These measurements are used to estimate where the mercury goes as in the method above
In principle the two approaches should produce the same results In practice mass-balance based approaches tend to result in higher emission estimates than most measurement-based estimates Since future emissions reporting is likely to involve a combination of these two approaches further work is required to understand why results may differ and to reconcile the two approaches
Since the 2008 UNEP assessment was produced the number of direct measurements of emissions from certain point sources (in particular power plants and some metal and cement production plants and waste incineration facilities) has increased considerably resulting in a much improved knowledge base
A number of countries require regular reporting of emissions Increasing use is being made in these reporting systems of measurement-based estimates and facility-level reporting in particular for major point sources In other countries national mercury emissions are only being quantified for the first time Since 2005 and the start of the UNEP negotiating process in 2010 many countries have initiated work on national emission inventories which in several cases have yielded much improved information on activity data sector characteristics and mercury emissions Such inventories often make use of the UNEP Toolkit for identification and quantification of mercury emissions
may therefore significantly underestimate total mercury emissions bull National inventories in some countries are making
increasing use of actual measurements of mercury emissions at individual facilities At the global scale it is not yet feasible to base an inventory on individual site emissions Furthermore actual measurements of mercury emissions at a source may be taken only a few times during a year and may not be fully representative of normal operations In the 2013 assessment a mass-balance based approach was employed to be consistent transparent and replicable bull National reporting and monitoring schemes
may provide information that is not available to externally produced inventories
14
UNEP Global Mercury Assessment 2013
Despite these considerations most of the discrepancies noted between the 2010 inventory mass-balance-based estimates and national estimates based on measurement- approaches are modest and within the margins of error associated with the different approaches In cases where the differences are larger it is important to recognize that there are sources of error in all methods for estimating mercury emissions
Gunnar Futsaelig
ter
Sampling of mercury emissions at the Kendal coal-fired power plant in South Africa conducted under a UNEP project A probe with mercury traps is inserted into a sampling port in the stack to collect mercury present in the flue gas The mercury traps are subsequently analysed according to the US EPA Mercury Monitoring Toolkit sampling protocol
15
UNEP Global Mercury Assessment 2013
Trends in mercury emissions to the atmosphere 4 Assessing global and sectoral trends A key question in assessing anthropogenic mercury emissions worldwide is whether they are increasing or decreasing While it is tempting simply to compare the 2010 inventory with its 2005 counterpart the results would mean little As inventory methods develop and as additional sources are considered the estimate of total anthropogenic mercury emissions worldwide also changes While some changes reflect real trends others reflect changes in methods or scope Thus comparing the results of previous assessments with the present update requires considerable care and involves an understanding of the way in which these inventories have been produced and the uncertainties associated with them
It is possible however to compare certain sectors over time by attempting to compensate for any methodological changes between the various inventories since 1990
Emissions to air are thought to have peaked in the 1970s From 1990 to 2005 total anthropogenic emissions of mercury to the atmosphere appear to
Emissions to air t
1400
1200
1000
800
600
400
200
0
1990
1995
2000
2005
Africa Asia Europe Russia North Oceania South America America
Estimates of annual anthropogenic mercury emissions from different continentsregions 1990-2005
have been relatively stable with decreases in Europe and North America being offset by increases in Asia A reanalysis of the available inventories since 1990 however indicates that emissions from industrial sectors at least may be starting to increase again
The changes introduced in the 2010 inventory methodology prevent a straight-forward continuation of this analysis However an evaluation of trends for some sectors between 2005 and 2010 has been made by applying the new methodology to activity data for 2005 This comparison suggests a further slight increase in the combined amount of mercury emitted by industrial sectors (coal combustion production of cement pig iron and steel and non-ferrous metals) The following paragraphs describe the trend results for three sectors to illustrate some of the developments between 2005 and 2010 and some of the the difficulties in comparing emissions estimates between different years made with different methods
Coal burning for power generation and for industrial purposes continues to increase especially in Asia However increases in the application of air pollution controls including some mercury specific technologies together with more stringent regulations in a number of countries have reduced mercury emissions from coal burning in power plants in particular and thus offset some part of the emissions arising from increased coal consumption
In the United States for example emissions from coal burning at power plants have reportedly decreased from about 53 tonnes in 2005 to 27 tonnes in 2010 This decrease is largely due to new regulations that have resulted in changes in the sources of the coal that is burned in large power plants and the installation of mercury controls as well as controls on sulphur dioxide and particulates that have the co-benefit of further reducing mercury emissions
In China many of the new coal-fired power plants have state-of-the-art pollution controls installed
Emissions of mercury from artisanal and small-scale gold mining (ASGM) reported for 2010 are more than twice those reported for 2005 While the
16
UNEP Global Mercury Assessment 2013
Unintentional emission sectors Coal burning ferrous- and non-ferrous (Au Cu Hg Pb Zn) metal production cement production Intentional-use sectors Disposal and incineration of product waste cremation emissions chlor-alkali industry
Comparison of emissions in 2005 and 2010 by selected sector and region
Unintentional emission sectors
Emission t
1000
800
600
400
200
0 2005 2010
Australia New Zealand amp Oceania
Central America and the Caribbean
CIS amp other European countries
East and Southeast Asia
rise in the price of gold (from USD 400 per ounce in 2005 to USD 1100 per ounce in 2010) along with increased rural poverty may indeed have caused more activity in this sector the increased estimate for mercury emissions is considered to be due primarily to some more and better data from many countries and regions West Africa for example was regarded as having minimal ASGM in 2005 but is now recognized as a region with considerable activity Thus the baseline has improved without necessarily any change in actual activity or emission levels
Waste from consumer products is affected by the amount of mercury used For most products in which mercury is used mercury-free alternatives exist Consequently many of these uses of mercury are declining at least in some regions as alternative products or processes are adopted Compact fluorescent light bulbs are an exception Even though the mercury content of individual light bulbs has decreased use of this type of light bulb is increasing rapidly
Artisanal and small-scale gold mining Intentional-use sectors
1000 1000
Step change from 2005 to 2010 due to new information 800 800 (under-estimation in 2005)
600 600
400 400
200 200
0 0 2005 2010 2005 2010
European Union (EU27) South America
Middle Eastern States South Asia
North Africa Sub-Saharan Africa
North America
In order to make valid assessments of trends in emissions from global inventories comparable data on activity levels are required together with information on changes in fuel and raw material characteristics and applied air pollution control technology One aim of the 2010 inventory methods is to create a firmer foundation for such future trend analysis
Ralf Siemieniec Shutterstockcom
Use of mercury-containing energy-saving lamps is increasing
17
UNEP Global Mercury Assessment 2013
Emission scenarios and future trends The 2008 Global Atmospheric Mercury Assessment included a first attempt at projecting future emissions inventories These were based on three scenarios continuing with the status quo applying current emissions controls worldwide and achieving maximum feasible technological reductions At the time this effort was regarded as highly provisional Since then additional studies have extended and improved this work but the results are not markedly different from earlier projections of future mercury emissions
Global mercury models have been used to evaluate future scenarios Four global and hemispheric models projected mercury levels around the world in 2020 based on the three emission scenarios described earlier In industrial regions the status quo will cause an increase in mercury levels of 2-25 and in remote areas of 15-5 The two emission control scenarios on the other hand yield a decrease in mercury in industrial areas of 25-35 and in remote areas of 15-20
Another global model was coupled with estimates of surface reservoirs of mercury in order to quantify source-receptor relationships for the present and for 2050 Under the best-case scenario of maximum feasible reductions projected estimates for deposition in 2050 is similar to estimates for today In the other scenarios increasing emissions lead to increasing deposition A greater proportion of mercury emissions is expected to be in the oxidized form so that a greater proportion will be deposited near the source instead of being transported far away
The model results support the conclusion that reducing anthropogenic emissions will slowly reduce the amount of mercury in biologically available reservoirs Over time mercury in the environment will be taken out of circulation by natural processes for example from ocean waters down into sediments and biologically available mercury will decrease Increased emissions on the other hand will continue to build up the amount of mercury in circulation
With new databases and methods it may soon be possible to create scenarios that incorporate activity levels as well as technology use for each country If this were done it would allow countries to assess the effects of different mercury reduction strategies on their national emissions For example a country could determine the relative contributions of emission reduction technology as opposed to for example changes in raw materials
18
UNEP Global Mercury Assessment 2013
Atmospheric chemistry monitoring and trends 5 Forms of mercury in air Mercury in the atmosphere is in three primary forms Gaseous elemental mercury is the most common in anthropogenic and natural emissions to the atmosphere Gaseous oxidized mercury and mercury bound to particulates are less common The transport and deposition of atmospheric mercury depend greatly on whether the mercury is elemental or oxidized Elemental mercury stays in the atmosphere long enough for it to be transported around the world whereas oxidized and particulate mercury are more readily captured in existing pollution control systems or deposited relatively rapidly after their formation As a result most mercury in the air is in the gaseous elemental phase Relatively little elemental mercury is deposited directly but instead must fi rst be oxidized
Although gaseous oxidized mercury is very important in mercury cycling between air and other environmental compartments the process of oxidation in the air is poorly understood with reactions and resulting compounds yet to be verified in observations
When mercury moves from air to water and land it is generally in an oxidized gaseous or particulate form whereas when it is re-emitted to air it has been converted back to gaseous elemental
Particulate associated mercury
Pole
Equator
Gaseous elemental mercury
Global transport
Gaseous elemental mercury can be transported globally Mercury emitted in particulate form tends to deposit closer to sources
mercury Sunlight appears to play a large role in both oxidation and reduction of mercury but temperature and biological interactions are also likely to be involved to some degree Here too much uncertainty remains Nonetheless the reactions are important in determining net deposition and fate of mercury
Monitoring of mercury in air Monitoring of mercury in air focuses on the three primary forms of mercury The measurement of gaseous elemental mercury is routine and robust Measuring gaseous oxidized mercury and particulate-bound mercury however is challenging Concentrations are typically very low and these forms are chemically unstable leading to high uncertainty in the measurements Nonetheless these forms are critical for defining and modelling the fate and transport of airborne mercury
In the past two decades coordinated mercury monitoring networks and long-term monitoring sites have been established in a number of regions measuring mercury concentrations in the air as well as deposition of mercury in precipitation In Europe and North America high-quality continuous monitoring has been going on for more than 15 years especially in the Arctic High-quality monitoring has started more recently in East Asia and South Africa as part of a global effort to expand the coverage provided by long-term monitoring sites
Measurements and trends in atmospheric mercury Monitoring stations around the world have provided information about trends in atmospheric mercury though the time periods vary depending on how long the site has been active Overall a declining trend in background mercury levels over the past decade has been recorded from monitoring stations
19
UNEP Global Mercury Assessment 2013
in many regions Other regions however show an increase in mercury levels
The sites also provide information about geographical patterns reflecting both background levels of
Trends in atmospheric measurements of mercury
Site(s) Period
Mace Head Ireland 1996-2011
North America rural sites 1995-2005
High Arctic sub-Arctic Up to 20 years of records mid-latitudes
Monitoring networks Mercury monitoring in Europe is carried out under the European Monitoring and Evaluation Programme (EMEP) one of the first international environmental measurement networks Heavy metals such as mercury have been included in the EMEP program since 1999 Mercury measurements are available only from northern and northwestern Europe
Three monitoring networks currently operate in North America providing good coverage of Canada and the United States the Mercury Deposition Network the Canadian Air and Precipitation Monitoring Network and the Atmospheric Mercury Network More recently new sites have been established in Mexico extending coverage on the continent The stations monitor atmospheric mercury and mercury in precipitation which has measured since the mid-1990s Monitoring of mercury in the air and in precipitation has been underway in Asia for nearly a decade
Alert Nord
Point Barrow
Nuuk Stoacuterhoumlfethi
Mace Head
mercury and local and regional influences Mercury concentrations at remote sites in Asia are higher than in other regions of the Northern Hemisphere Coastal cities in China have lower levels than inland sites likely due to the influence of relatively clean
Measurement Trend
Gaseous elemental mercury Decrease of 14-18 per year
Total gaseous mercury Decrease of 22 to 174 in total
Total gaseous mercury Decreasing trend at some stations increasing at others
The monitoring network of the Arctic Monitoring and Assessment Programme (AMAP) includes air and deposition monitoring sites located in Arctic regions of Canada Greenland Iceland Norway Russia and Sweden
Building on existing national and regional monitoring networks the European Union-financed project
ldquoGlobal Mercury Observation Systemrdquo (GMOS) started in November 2010 Its goal is to develop a coordinated global system for monitoring mercury including a large network of ground-based monitoring stations New sites are being installed in regions where few monitoring stations exist especially in the Southern Hemisphere Two sites have been established in Antarctica one on the Antarctic Plateau and one on the coast
Ny-Aringlesund
Amderma Pallas
Raringouml Bredkaumllen
Listvyanka Diabla Gora
Mauna Loa
Mt Bachelor
Celestuacuten Calhau
Longobucco
Iskrba Niembro Monte Cimone Cap
Ferrat Mt Waliguan Ganghwa Island
Lulin
Cape Hedo Ev-K2
Mt Changbai
Minamata Mt Ailao
Nieuw Nickerie
Kodiakanal
Maheacute Island Manaus
Bariloche Cape Point
Amsterdam Island Cape Grim
Dumont drsquoUrville
AMAP CAMnet EMEP GMOS GMOS associated NADPAIRMoN NADPMDN
Air + precipitation Air Precipitation
20
UNEP Global Mercury Assessment 2013
John Munthe
The mercury background air monitoring station at Zeppelin mountain Svalbard
air from over the ocean Sites off the Asian coast however show higher levels of gaseous elemental mercury than the Northern Hemisphere background suggesting an outflow from the Asian mainland
Weather patterns have also been found to have a strong influence on seasonal patterns in mercury levels in the air at monitoring sites At the Mount Waliguan Observatory on the Tibetan Plateau for example northeasterly and easterly winds produced the highest levels of mercury
Measurements at high altitudes Measurements from ground-based stations above 2700 meters suggest that there is an inverse relationship between gaseous elemental mercury and gaseous oxidized mercury at these elevations In other words when there is more elemental mercury there is less oxidized mercury and vice versa These measurements are in good agreement with modelling results which gives additional confidence in current understanding of the behaviour of mercury at high altitude
An inverse relationship between total gaseous mercury and particulate concentration has also been observed in the high stratosphere From the transformation rate of total gaseous mercury to particulate-bound mercury it appears that gaseous mercury lasts about two years in the stratosphere
21
UNEP Global Mercury Assessment 2013
Atmospheric concentrations and deposition 6 Measurements and trends of mercury in precipitation Mercury deposited by precipitation decreased from the 1990s into the 2000s at many but not all sites in North America and Western Europe where such measurements were taken
Regional patterns are also evident including slightly higher levels in southern Europe than northern Europe and higher levels in Asia than in North America Total mercury concentrations in precipitation in China were much higher than those in Japan and South Korea Th is was mostly attributed to higher levels of gaseous oxidized mercury and particulate-bound mercury which are readily deposited by precipitation and thus not transported far
A comparison of data from Canadian and American monitoring sites found that deposition of mercury in precipitation was highest in summer
Dry deposition of mercury which is deposition not associated with precipitation is diffi cult to measure and consequently there is little information on trends in mercury dry deposition Th is lack of information means that it is also diffi cult to validate model results for dry deposition
106 44
474 72 91
5 7 71
05 1 5 10 100 500 1000
Total mercury emission (2005) kgcell
Modelled mercury air concentrations and deposition patterns Atmospheric mercury concentrations are highest in major industrial regions Models examining global patterns show that East and South Asia Europe North America and South Africa have the highest levels of elemental mercury in the air Concentrations are generally lower in the Southern Hemisphere than the Northern Hemisphere because most industrial activity is in northern regions Th ese model results are based on simulations using the 2005 global mercury emission inventory because the 2010 inventory has only recently become available
Intercontinental transport of mercury in the air has been examined to determine its impact on regional mercury levels Four models using diff erent parameters produced consistent results Depending on the region mercury emitted by distant sources contributes between 10 and 30 of annual mercury deposition Where local sources are low mercury transported from distant emission sources can account for more than half of the deposition East Asia is the dominant source region adding 10-14 to the deposition in
Contribution from sources outside receptor region
Model 40
GEOS-Chem GLEMOS GRAHM CMAQ-Hg
30
20
10
0 Arctic Europe North East Asia South Asia
America
Receptor region
(Left ) Global distribution of anthropogenic mercury emissions in 2005 with source regions that were considered in the analysis (North America South America Europe Africa Central Asia South Asia East Asia Australia and Oceania) and (right) the contribution of anthropogenic sources outside a particular receptor region to deposition within the receptor region
22
UNEP Global Mercury Assessment 2013
Modelling atmospheric transport and deposition Global models reproduce the movement of mercury in the atmosphere during which the mercury may move between continents They have been effective in examining sources of mercury to the Arctic and also for examining the outflow of pollution from South and Southeast Asia and its impact on western North America as well as the flow from eastern North America to Europe
Regional models on the scale of a continent or a basin such as the Mediterranean can provide more detail about specific source areas even to the level of individual industrial areas Reliable results however require a detailed understanding of mercury oxidation in the atmosphere about which there is considerably uncertainty
Most atmospheric transport models consider the full chain of mercury processes in the atmosphere Some models also consider how mercury is cycled in other atmospheric compartments such as soil vegetation snow freshwater and seawater
One of the largest sources of uncertainty in mercury models is the chemical mechanism used to determine how mercury changes forms in the air Improved experimental data can help improve model performance by making sure that the correct reactions are simulated The processes that lead from deposition to re-emission also need to be understood better Advances in this area show promise with model results becoming closer to estimates based on experimental data
other regions of the world Natural emissions and re-emissions account for 35-70 of total deposition in most regions Deposition is generally greater in low and mid-latitudes due to stronger sunlight higher concentrations of oxidants and higher precipitation
Regional mercury models show patterns at the scales of continents or individual seas The Mediterranean Sea for example is a net source of mercury as it emits more than is deposited to it In that region dry deposition generally exceeds deposition of mercury in precipitation In Central and Southern Europe total gaseous mercury concentrations and deposition in precipitation were both consistently higher than the European average
Across the United States dry deposition accounts for two-thirds of total annual deposition mainly from gaseous oxidized mercury A study examining sources and deposition of mercury to assess the
benefits of proposed emission control measures found that mercury transport from outside the country accounts for 68 of mercury deposition in the Northeast and up to 91 in the west-central United States Large point sources contribute up to three-quarters of nearby deposition and power plants contributed half of the deposition in the eastern part of the country This suggests that new emissions standards would primarily benefit eastern regions of the US
In Asia studies show high seasonal variation in mercury concentration and deposition Anthropogenic emissions are responsible for about 75 of deposition in East Asia In this region there is a net removal of gaseous oxidized mercury from the atmosphere and a net export of gaseous elemental mercury
In the Arctic gaseous elemental mercury levels in the atmosphere are depleted rapidly in spring when after the long Arctic winters sunlight returns Ozone is depleted at the same time and it is believed that bromine-containing compounds are the cause of the photo-chemical reactions that deplete ozone and mercury During these events gaseous oxidized mercury and particulate-bound mercury levels increase sharply suggesting that the gaseous mercury is oxidized and deposited enhancing mercury deposition in Arctic areas in springtime Recent research however has found that 50-80 of the deposited mercury is re-emitted within a few days Similar springtime mercury depletion events have been seen in Antarctica
23
UNEP Global Mercury Assessment 2013
Anthropogenic releases to the aquatic environment 7 Global assessment Previous UNEP global mercury assessments only considered emissions to the atmosphere The 2013 Report presents the first attempt at compiling a global inventory of mercury releases to aquatic environments Releases directly into the aquatic environment present a completely different chemistry set of pathways and fate to those released to air They are also more directly linked to the risks posed by mercury to global environmental and human health Unlike mercury releases to air which are predominantly in the form of gaseous elemental mercury releases to water are predominantly inorganic mercury and to a lesser extent liquid elemental mercury
At present only some sources of aquatic releases can be quantified with any confidence Thus many sources that may be important are not included in this first assessment of global aquatic releases For example land management practices that expose new geological sources of mercury in rocks and mineral soils or that re-mobilize previously deposited mercury cannot yet be assessed Two broad categories of current anthropogenic sources are considered here point sources of mercury release to water and diffuse releases of mercury as a result of its remobilisation from areas where it was previously deposited or accumulated due to human activity (ie contaminated sites) Artisanal and small-scale gold mining (ASGM) mercury-containing pesticides and fungicides used in agriculture and deforestation are considered separately
Point source releases to water from various sectors in tonnes per year with the range of the estimate and as a percentage of total anthropogenic emissions
Sector Releases (range) tonnes
Non-ferrous metal production 925 (193 - 268)
Consumer product waste 894 (222 - 308)
Chlor-alkali production 28 (10 ndash 55)
Oil refining 06 (03 ndash 1)
Grand Total 185 (426 ndash 582)
The global estimate of mercury release to water from point sources has been derived from the atmospheric emissions assessment and the approach employed in the UNEP Toolkit to partition total mercury releases between air land and water This approach has considerable uncertainty and may omit sectors where releases to water are high but air emissions are unimportant and therefore not addressed in the inventory Global releases from point sources were estimated to be 185 tonnes per year
For diffuse sources evaluating the relative contribution of anthropogenic and natural sources to the aquatic environment requires determining considerations of the various mercury inputs For some sectors data exist that allow a preliminary assessment of the amounts of mercury re-mobilized into aquatic systems
For mercury-contaminated sites the range of average soil concentrations of mercury reported for sites where mercury was mined used or otherwise released by human activity was considered The area of contamination is then used to determine how much mercury is available in soils and when combined with a factor for how much mercury is released from those soils in a year the total release can be estimated Among identified contaminated sites mercury mining is identified as the largest sector followed by mining of precious metals Total releases to aquatic environments from contaminated sites are estimated to be 83-335 tonnes per year
Releases to water from contaminated sites in tonnes per year with the range of the estimate
Sector Releases (range) tonnes
Primary mercury mining sites 67 ndash 266
Precious metal production sites 14 ndash 55
Non-ferrous metal production sites 01 ndash 05
Chlor-alkali production sites 01 ndash 05
Other industrial sites 01 ndash 03
Grand Total 83 ndash 335
24
UNEP Global Mercury Assessment 2013
Much of the mercury released from artisanal and small-scale gold mining goes into rivers lakes soils and sediments and tailings From soils and tailings it may be re-mobilized by leaching and erosion In addition mining may disturb mercury-containing soils and sediments that may then erode more quickly releasing more mercury than would otherwise have become available from natural erosion A key factor in these processes is the local hydrological cycle of precipitation evaporation run-off and river flow To account for this in the assessment countries were designated as dry wet or intermediate to determine the relative importance of erosion The tropical and subtropical countries which have the greatest activity in this sector also tend to experience high precipitation and run-off exacerbating this source of mercury release and re-mobilization Total worldwide releases of mercury to land and water from ASGM were estimated at over 800 tonnes per year How much of this is released to water cannot yet be determined
Mercury continues to be used in pesticides and fungicides 2100 tonnes of mercury were released in the decade of the 1960s through such agrochemical uses Current data are unavailable although the use of mercury in these products has been greatly reduced
Deforestation especially in the Amazon Basin can lead to extensive soil erosion and thus the release of mercury previously accumulated in soils Using 2010 figures for deforestation rates around the world and an estimate of soil concentrations of mercury as much as 260 tonnes of mercury may have been released into rivers in 2010 as a result of deforestation worldwide
Because this is the first attempt to quantify global mercury releases to the aquatic environment there is no previous measurement against which these results can be compared Thus it is not possible at this time to evaluate trends in releases
Uncertainties in release estimates Estimating global releases of mercury to aquatic environments is being done here for the first time Many data are missing and others are imprecise A number of assumptions have been made based on what measurements are available or on other grounds to extrapolate from known quantities or to calculate aquatic releases in relation to atmospheric
or other emissions Thus the results should be treated with great caution It is nonetheless clear that anthropogenic sources and human activity contribute hundreds of tonnes of mercury to aquatic environments each year a substantial amount relative to estimated natural releases 150-960 tonnes per year from terrestrial environments
Lapshin Shutterstockcom
Phil Augustavo istockphotocom
Bureau of Land Managem
ent
Contaminated sites (top) erosion following deforestation (middle) and a flooded store of mercury-contaminated waste (lower) illustrate potential sources of mercury releases to water
25
UNEP Global Mercury Assessment 2013
Aquatic pathways transport and fate 8 Mercury in aquatic environments The pathways and fate of mercury in aquatic environments are important because it is in waters sediments and wetland soils that inorganic mercury is converted into methylmercury which is toxic and concentrates in animals The majority of human exposure to mercury and the health risk that comes with mercury exposure is from consumption of marine foods Thus this section focuses on the worldrsquos oceans Some freshwater systems however are important sources of fish for human consumption especially for subsistence and recreational fisheries often among indigenous peoples Artisanal and small-scale gold mining (ASGM) communities may also be affected through fish consumption and drinking water if those are contaminated by local releases
The major processes of mercury cycling are generally similar for all aquatic systems Inorganic mercury in dissolved or particulate form is the dominant mercury type in most marine and fresh waters Dissolved gaseous elemental mercury accounts for less than 30 of total mercury in water Methylmercury is often present at trace levels but may in some settings reach 30 of total mercury In freshwater and coastal environments inorganic mercury is transformed into methylmercury primarily in sediments In the open ocean this conversion takes place largely at intermediate depths between 200 and 1000 meters in the water column Mercury is lost from aquatic systems in two ways When inorganic mercury is reduced to elemental mercury it can be re-emitted to the atmosphere When inorganic mercury binds to particulates in water it can settle out rapidly and be buried in sediments Deep burial in ocean sediments is one of the major pathways by which mercury is removed from the biologically active environment
The global mercury cycle is chemically and physically complex Thus it is necessary to use models to study describe and predict what happens and will happen to mercury in the aquatic environment Until recently only one model existed that incorporated
air land and water into a unified whole The model has been validated against observations of mercury and represents the current scientific consensus The largest potential errors in this model in terms of the aquatic cycle concern details of the exchange of mercury between air and water
Pathways and fate of mercury in the oceans Model simulations suggest that anthropogenic impacts on mercury levels in the ocean are greatest in the surface waters the top 100 meters or so of the water column While model results vary one recent estimate suggests that anthropogenic emissions over the last 100 years have doubled the concentration of mercury in the surface layer of the ocean and increased it by 25 in intermediate waters and by 10 in deep waters The difference is due to the length of time it takes for surface waters to circulate to the depths
Models and measurements agree that direct deposition from the atmosphere is the dominant pathway by which mercury reaches the oceans The exceptions are smaller semi-enclosed basins such as the Mediterranean Sea or the Arctic Ocean where river runoff coastal erosion and ocean currents
Ugo M
ontaldo Shutterstockcom
26
UNEP Global Mercury Assessment 2013
account for about half of mercury inputs The most recent modelling effort suggests that total deposition input of mercury to the oceans in 2008 was 3700 tonnes
Other mercury pathways appear less important on a global basis Rivers are estimated to carry more than 2800 tonnes of mercury each year but only about 380 tonnes of this is transported offshore The rest is trapped by particles in estuaries Groundwater and re-mobilization from sediments provide 100shy800 tonnes of mercury to the oceans each year Undersea hydrothermal vents add less than 600 tonnes of mercury to the oceans There are high concentrations of mercury in vent fluids but a great deal of the mercury is precipitated as solids once the vent fluids enter seawater
Models suggest that globally about 70 of the mercury deposited into the ocean is re-emitted to the atmosphere Oxidized mercury in surface waters is reduced by biological and photochemical processes to the elemental form that is volatile and readily re-emitted The removal of this mercury ultimately reduces the pool of mercury that could be converted to methylmercury and be accumulated by marine organisms The re-emission process thus simultaneously prolongs the lifetime of mercury cycling through the atmosphere and upper ocean and acts to reduce mercury availability for marine food webs
Any changes in the efficiency of mercury reduction in surface waters or the rate of re-emission is likely to impact mercury concentrations in surface waters and the air One example is the effect of sea ice in the Arctic Ocean which blocks the re-emission
Tony Magdaraog Shutterstockcom
Mercury accumulated in marine food-webs can enter the human diet
of elemental mercury leaving elevated levels in waters under ice Changes in primary productivity could change the rate at which mercury is bound to particles thus affecting re-emission to the atmosphere as well as rates of downward transport in the ocean Changes in oxidant levels in the atmosphere such as ozone and bromine may also influence the rate of oxidation of gaseous elemental mercury and thus deposition rates to the ocean
Methylmercury in the ocean Natural bacterial processes in seawater and in sediments in coastal environments convert inorganic mercury to methylmercury Methylmercury levels are highest in the subsurface waters of many oceans because it is formed at these intermediate depths likely as a result of the decomposition of organic material falling from surface waters Current understanding indicates that about 300 tonnes of methylmercury is produced in the upper ocean by this and related processes By contrast only about 80 tonnes of methylmercury reaches the ocean from other sources such as atmospheric deposition rivers and diffusion from sediments
Current modelling indicates that methylmercury stays in the upper ocean for about 11 years Deshymethylation by photochemical reaction or by microbial activity is the major removal process for methylmercury in the ocean About 240 tonnes of methylmercury is removed by this process from the surface waters of the ocean per year
The other important pathway for methylmercury in seawater is uptake into marine food webs Although only about 40 tonnes per year is taken up in this way it is this fraction that poses risks to marine animals and human consumers of seafood Methylmercury is a problem for several reasons First it is taken up by plankton much more efficiently than is inorganic mercury resulting in concentrations in plankton that are as high as 10000 times the concentration in seawater Second methylmercury is absorbed through the intestine of animals much more easily than is inorganic mercury Third methylmercury biomagnifies as it moves up the food web Thus methylmercury becomes an increasingly greater proportion of the mercury in organisms higher in the food web This explains why some indigenous populations that consume top marine predators such as fish seals and whales have some of the worldrsquos highest concentrations of methylmercury giving rise to health concerns
27
UNEP Global Mercury Assessment 2013
Pathways and fate of mercury in freshwater Observations and modelling both show that there are in general many similarities between mercury chemistry pathways and fate in lakes and in the oceans but with obvious differences in scale and in the relative importance of different processes Modelling of mercury dynamics was done for four lakes with a history of direct mercury inputs from the largest freshwater lake in the world (Lake Superior) to small lakes in Ontario Canada Atmospheric deposition and river inflow were the main sources of inorganic mercury Much of the mercury input from lake and river catchments was associated with dissolved and particulate organic matter The dominant mercury removal mechanisms as in saltwater were burial in sediments and photochemical reduction of oxidized mercury to elemental mercury followed by re-emission to the air In Lake Superior and Lake Michigan there is evidence for methylation of mercury in the water column as is seen in the open ocean
Methylmercury levels in freshwater fish vary with the level of deposition of mercury from the air though other factors such as inputs from the watershed and the number of trophic levels within the lakersquos food web are also important Methylation predominantly occurred in lake sediments and wetlands and floodplain soils where sulphateshyreducing bacteria are believed to be primarily responsible Methylmercury is de-methylated in sediments and also taken away in the outlet river from each lake
Some 400-1400 tonnes of mercury are estimated globally to be trapped behind dams and other man-made impoundments each year This has in many cases led to significant increases in total mercury and methylmercury levels in water and of methylmercury in fish and other aquatic species When artificial lakes are created plant material is submerged leading to decay and anoxia In these conditions microbially driven methylation of inorganic mercury takes place In some cases the elevated mercury levels have also been observed downstream from the artificial lakes and reservoirs
Anthropogenic impacts on aquatic mercury levels Two studies have reported that the Atlantic and Pacific Oceans have shown opposing trends over recent decades While the influence of changing ocean currents and other oceanographic factors may be a factor the trends do make sense in light of patterns of anthropogenic emissions In the North Pacific Ocean mercury concentrations appear to have increased at depths between 200 and 1000 meters over the last few decades This increase coincides with the rapid industrialization of East Asia
In the North Atlantic however results from near Bermuda suggest a substantial decrease in mercury concentration and a change in the mercury profile through the water column The Mediterranean Sea too showed a decrease in mercury concentration between 1990 and 2004 These findings are consistent with atmospheric data from around the North Atlantic The conclusion is that mercury levels in seawater in the North Atlantic were elevated by human activity but may now be declining likely as a result of decreased emissions from North America and Europe
A complementary approach to measuring mercury in seawater is to measure mercury in aquatic animals which accumulate and integrate mercury over time Teeth hair feathers and eggshells are useful long-term archives of mercury concentrations and can provide data from the pre-industrial period (ie before 1800) as well as more recent periods
Among marine animals samples are available from several regions particularly from the Arctic where cold dry conditions help preserve animal tissues Mercury concentrations between the 13th and 16th
centuries were relatively stable From the mid- to late 19th century to the end of the 20th century mercury levels increased by an average of 12 times On average therefore about 92 of the mercury in Arctic marine wildlife today is likely to be of anthropogenic origin
Similar findings were found for a 700-year sequence of seabird eggshells from the South China Sea Mercury levels increased steadily between 1800 and 2000 with a particularly rapid increase after 1970 Concentrations since 2000 are about 10 times higher than pre-industrial levels with 91 of the mercury now likely to be of anthropogenic origin In the Antarctic studies of seal hairs show that pre-industrial mercury levels were only 60 of recent levels The relatively small difference
28
UNEP Global Mercury Assessment 2013
Historical Hg concentration as a proportion of present-day 100
80
60
40
20
0
Beluga teeth Human teeth
Gyrfalcon feathers Perigrine falcon feathers
Polar bear hair Ringed seal teeth
1200 1300 1400 1500 1600 1700 1800 1900 2000
between pre-industrial and modern mercury levels in Antarctic is consistent with lower mercury emissions and atmospheric concentrations in the Southern Hemisphere as compared with the Northern Hemisphere
The timing of long-term increases of mercury in aquatic animals can shed light on the likely sources of mercury emissions that were responsible The industrialization of Europe and North America appear responsible for the large increases in marine mercury levels that began in the 19th century as these increases occurred prior to recent Asian industrialization As with water concentrations in the Pacific Ocean recent rapid increases in mercury in seabird eggs in the South China Sea coincide with industrialization in Asia
The time lag in aquatic ecosystem response One important conclusion from air-ocean modeling is that the oceans have not yet reached equilibrium with current atmospheric levels of mercury This lag is due to several factors First mercury stays in the upper ocean above 200 meters depth for about 30 years and for centuries in intermediate and deep waters This is much longer than the one year residence time in the lower atmosphere Thus removal from the ocean takes much longer than does removal from the air and so concentrations will change more slowly
Second because of the long lifetime of mercury in deeper ocean waters a great deal of natural mercury is present in the ocean already about 100000 tonnes out of a total of 135000 tonnes in intermediate waters and 200000 out of 220000 tonnes in deep waters
Rune Dietz
Analysis of museum samples reflects the increase in mercury emissions and releases since the mid-19th century associated with anthropogenic activities
Third vertical transport of mercury from intermediate depths back to the surface returns a substantial amount of mercury to the biologically active zone each year As a result average mercury concentrations in seawater and marine animals are likely to increase slowly for decades if not centuries even if atmospheric levels stabilize at present levels In short the effects of historical anthropogenic emissions from Europe and North America are still being observed in the oceans at the same time that the effects of the recent rise in emissions from Asia are being seen
Regionally different trends can be expected depending on distance from sources and ocean circulation patterns In the North Atlantic north of 55deg N it will take 50-600 years to achieve equilibrium between atmospheric and seawater mercury levels In the North Pacific this process is estimated to take 500-700 years and in the Antarctic 700-1000 years The Arctic Ocean by contrast is smaller and will only take about 35 years to reflect changes in atmospheric mercury levels Surface waters of the Mediterranean Sea should show also changes within 10-50 years
Time lags in the responses of many freshwaters and their food-webs to changes in atmospheric mercury levels are also expected Although some immediate recovery following reductions in atmospheric mercury deposition rates is likely full recovery may take decades centuries or longer depending on the characteristics of the area Highly polluted freshwaters with catchments and sediments containing large amounts of anthropogenic mercury will recover most slowly as is already observed around point sources such as smelters that have closed down
29
UNEP Global Mercury Assessment 2013
Major gaps in knowledge 9 Large uncertainties remain in global estimates of mercury emissions to the air These stem from various sources including the availability of information on activity levels but mainly from the lack of information concerning the mercury content of some raw materials and the validity of assumptions regarding processes and technologies employed to reduce mercury emissions including their rates of application and effectiveness The accuracy and precision of measurement-based estimates can depend on the validity of extrapolating measurements made at infrequent intervals to longer periods or measurements made at one plant to other facilities with similar operations
Potentially important emissions sectors that are still not quantified in the emissions inventory include the use of mercury in vinyl-chloride monomer production secondary metals production oil and gas extraction transport and processing industrial and hazardous waste incineration and disposal sewage sludge incineration and dental fillings preparation and removal
Current measurements and their evaluation are inadequate for determining spatial and temporal trends Improved more extensive and better coordinated measurements are needed A permanent global integrated monitoring network for atmospheric mercury and mercury deposition is needed to achieve this goal The atmospheric network sites should be closely integrated with water soil and biological monitoring networks The results can be used for model testing and evaluation as well as for more accurately detailing the geographic impact of anthropogenic emissions Monitoring of mercury concentrations in the important marine food species is essential to understanding possible human health impacts and the effects of future emissions changes
Better data on mercury distribution in the troposphere is needed to improve understanding of long-range transport and source-receptor relationships Coordinated studies at high altitudes and by aircraft are needed This information will
also help validate regional and global scale models improving their prediction capabilities with regard to different policy scenarios
Key processes related to global transport and cycling of mercury remain inadequately understood The chemical form of gaseous oxidized mercury is unknown Reduction and oxidation rates for mercury in the presence of atmospheric oxidants need further study including determining which oxidants are important New measurements and modelling studies are needed to examine key chemical and physical processes that affect global transport and cycling
Few data are available for reporting mercury releases to aquatic systems Systematic and consistent monitoring of mercury releases to the air is required especially for contaminated systems Releases of mercury from soils into waters depend greatly on climate and topography and these parameters need to be better accounted for Consistent approaches for measuring and reporting releases from point sources are needed to ensure comparability of data from around the world In particular the actual role of artisanal and small-scale gold mining (ASGM) in emissions to air and releases to water needs to be more accurately estimated
The link between mercury deposition methylation and uptake by living organisms needs further study The parameters that determine the rates of exchange of mercury compounds between air and sea air and soil and air and vegetation are not fully understood Whole-ecosystem studies of mercury are needed to better understand biogeochemical cycling Methylationdemethylation rates and their spatial and temporal variations and relationship to climatic factors need to be determined in most of worldrsquos major ocean basins as well as in representative freshwaters
30
UNEP Global Mercury Assessment 2013
Key findings of the 2013 assessment 10 Atmosphere Total anthropogenic emissions of mercury to the atmosphere in 2010 are estimated at 1960 (1010shy4070) tonnes which is about 30 of the total mercury that was emitted and re-emitted from anthropogenic and natural sources in that year The largest anthropogenic sources are associated with artisanal and small-scale gold mining (ASGM) and coal burning which together account for about 62 of the annual total anthropogenic emissions to air Other major sectors include ferrous and non-ferrous metal production and cement production
East and Southeast Asia are responsible for about 40 of global anthropogenic emissions About 75 of the mercury from this region comes from China which is about one-third of the global total Increased estimates for emissions from ASGM largely a result of newly obtained data and improved information mean that South America and Sub-Saharan Africa are also responsible for a greater proportion of global emissions than was previously assumed
Anthropogenic emissions over time have increased mercury loads present in the environment This leads to higher rates of re-emission and also means that there will be a time lag of years or decades between emissions reductions and lower mercury levels in the food web including pathways of human exposure
Mercury emissions to the atmosphere likely peaked in the 1950s to 1970s and subsequently declined because of reductions in Europe Russia and North America Emission trends are unclear due to changes in methods employed to produce inventories and differences in the sectors that have been accounted at different times There are however some indications that emissions may be rising again with increases from East Asia offsetting continuing reductions in Europe and North America
Aquatic environments Natural processes in aquatic systems convert less toxic elemental and inorganic mercury into much more toxic methylmercury Methylmercury concentrates and accumulates in the food web leading to high concentrations in some species of seafood and fish that many people eat
Anthropogenic releases of mercury to aquatic environments contribute hundreds of tonnes to the amount of mercury cycling in the environment Diffuse releases and point sources appear equally important Atmospheric deposition however remains the most important input of mercury to land and oceans and has increased the amount of mercury in many environmental compartments by a factor of two or three since the start of the industrial age On land mercury that is deposited is largely retained in soils and vegetation increasing the available pool for re-mobilisation to adjacent aquatic systems Re-emission from soils however is a major addition to atmospheric mercury
Hydrology is the most important factor in the transport of mercury from catchments to downstream environments Relatively little of this mercury reaches the open ocean as most is captured in sediments behind dams in estuaries and near the coast Changes in land cover and land use can have a large effect on mercury mobilisation as exposed soils erode and mercury leaches into the water table
Concentrations of mercury in Arctic marine animals today are about 10-12 times higher than in preshyindustrial times (ie prior to about 1800) This means that on average about 92 of the mercury in marine predators such as seabirds seals and whales is anthropogenic in origin The timing of the increase suggest that 19th and early 20th century emissions from Europe North America and Russia were responsible Increases mercury concentrations in seabirds in the South China Sea appear to be more recent than the Arctic increases coinciding with increasing industrialisation in East and Southeast Asia
31
UNEP Global Mercury Assessment 2013
K+S Entsorgung Gm
bH
Recovered mercury is being stockpiled at long-term storage sites above- and as shown here below ground
The upper 100 meters of the oceans have twice the mercury that they did a century ago Intermediate and deeper waters have 10-25 more mercury on average reflecting the slow transport of mercury downwards in the oceans Seawater concentrations will thus be especially slow in responding to changes in mercury inputs from atmospheric deposition and river flow As a result mercury concentrations in marine biota are likely to increase slowly for decades to centuries even without an increase in atmospheric emissions
In freshwater ecosystems atmospheric deposition and re-mobilisation from soils slow the reduction of mercury levels even in regions where atmospheric concentrations have decreased due to emission controls
Further increases in atmospheric emissions will have long-term consequences for commercial fisheries and all consumers of marine and freshwater foods
It is likely to be years or decades before reductions in anthropogenic emissions and releases of mercury have a demonstrable effect on mercury levels throughout the environment and in the fish and marine mammals which are part of the human food-chain This only reinforces the need to act now to continue and strengthen international efforts to reduce current mercury emissions and releases Delays in action now will inevitably lead to slower recovery of the worldrsquos ecosystems in future from mercury contamination leaving an even greater legacy of pollution for future generations
32
Division of Technology Industry and Economics (DTIE) Chemicals Branch Geneva Switzerland January 2013
Job number DTI1636GE
UNEP Global Mercury Assessment 2013
Methods for estimating emissions All global mercury emissions inventories to date have used the same basic approach for the major sectors emitting mercury to the atmosphere For specific emission sectors national emissions estimates are calculated by multiplying the amount of activity (ie amounts of fuels burned raw materials consumed or materials produced) by an emission factor that is an estimate of the mercury emitted per unit of activity For example emissions from coal-fired power generation are estimated by multiplying the tonnes of coal used by the amount of mercury estimated to be released per tonne of coal In most such inventories ldquoabatedrdquo emission factors have been employed to quantify both the emissions of mercury that occur during the processes and the effects of mercury emission controls In the new methodology used to develop the 2013 report these components are split ldquoUnabatedrdquo emission factors are employed to quantify the emissions and ldquotechnology profilesrdquo have been developed to represent the effects of mercury emission controls
Various methods are employed to estimate emissions of mercury at individual sources and at national regional and global levels In general the methods fall under one of two main categories
bull Mass-balancesubstance-flow based estimates which are based on the principle that what goes in must come out Amounts of mercury in fuels and raw materials constitute the inputs and the outputs are the amounts of mercury emitted to air released to water or land retained in products or in wastes or otherwise recovered and stored or disposed of
involved in both global and national estimates are taken into account It is important to note that there are good reasons why estimates of mercury emissions produced in the 2010 inventory may not fully agree with national inventories made by countries using other methodologies These reasons include
bull Reporting schemes may define and distinguish emissions source sectors in very different ways and aligning these sectors may not be possible
bull Industry reporting to national government may be limited to sources with emissions above a certain threshold level so that emissions from smaller sources below the threshold are not reported Where smaller sources make up a significant part of the source category reported inventories
bull Measurement-based estimates which rely on measurements made at appropriate points in the industrial process or in the productwaste output streams These measurements are used to estimate where the mercury goes as in the method above
In principle the two approaches should produce the same results In practice mass-balance based approaches tend to result in higher emission estimates than most measurement-based estimates Since future emissions reporting is likely to involve a combination of these two approaches further work is required to understand why results may differ and to reconcile the two approaches
Since the 2008 UNEP assessment was produced the number of direct measurements of emissions from certain point sources (in particular power plants and some metal and cement production plants and waste incineration facilities) has increased considerably resulting in a much improved knowledge base
A number of countries require regular reporting of emissions Increasing use is being made in these reporting systems of measurement-based estimates and facility-level reporting in particular for major point sources In other countries national mercury emissions are only being quantified for the first time Since 2005 and the start of the UNEP negotiating process in 2010 many countries have initiated work on national emission inventories which in several cases have yielded much improved information on activity data sector characteristics and mercury emissions Such inventories often make use of the UNEP Toolkit for identification and quantification of mercury emissions
may therefore significantly underestimate total mercury emissions bull National inventories in some countries are making
increasing use of actual measurements of mercury emissions at individual facilities At the global scale it is not yet feasible to base an inventory on individual site emissions Furthermore actual measurements of mercury emissions at a source may be taken only a few times during a year and may not be fully representative of normal operations In the 2013 assessment a mass-balance based approach was employed to be consistent transparent and replicable bull National reporting and monitoring schemes
may provide information that is not available to externally produced inventories
14
UNEP Global Mercury Assessment 2013
Despite these considerations most of the discrepancies noted between the 2010 inventory mass-balance-based estimates and national estimates based on measurement- approaches are modest and within the margins of error associated with the different approaches In cases where the differences are larger it is important to recognize that there are sources of error in all methods for estimating mercury emissions
Gunnar Futsaelig
ter
Sampling of mercury emissions at the Kendal coal-fired power plant in South Africa conducted under a UNEP project A probe with mercury traps is inserted into a sampling port in the stack to collect mercury present in the flue gas The mercury traps are subsequently analysed according to the US EPA Mercury Monitoring Toolkit sampling protocol
15
UNEP Global Mercury Assessment 2013
Trends in mercury emissions to the atmosphere 4 Assessing global and sectoral trends A key question in assessing anthropogenic mercury emissions worldwide is whether they are increasing or decreasing While it is tempting simply to compare the 2010 inventory with its 2005 counterpart the results would mean little As inventory methods develop and as additional sources are considered the estimate of total anthropogenic mercury emissions worldwide also changes While some changes reflect real trends others reflect changes in methods or scope Thus comparing the results of previous assessments with the present update requires considerable care and involves an understanding of the way in which these inventories have been produced and the uncertainties associated with them
It is possible however to compare certain sectors over time by attempting to compensate for any methodological changes between the various inventories since 1990
Emissions to air are thought to have peaked in the 1970s From 1990 to 2005 total anthropogenic emissions of mercury to the atmosphere appear to
Emissions to air t
1400
1200
1000
800
600
400
200
0
1990
1995
2000
2005
Africa Asia Europe Russia North Oceania South America America
Estimates of annual anthropogenic mercury emissions from different continentsregions 1990-2005
have been relatively stable with decreases in Europe and North America being offset by increases in Asia A reanalysis of the available inventories since 1990 however indicates that emissions from industrial sectors at least may be starting to increase again
The changes introduced in the 2010 inventory methodology prevent a straight-forward continuation of this analysis However an evaluation of trends for some sectors between 2005 and 2010 has been made by applying the new methodology to activity data for 2005 This comparison suggests a further slight increase in the combined amount of mercury emitted by industrial sectors (coal combustion production of cement pig iron and steel and non-ferrous metals) The following paragraphs describe the trend results for three sectors to illustrate some of the developments between 2005 and 2010 and some of the the difficulties in comparing emissions estimates between different years made with different methods
Coal burning for power generation and for industrial purposes continues to increase especially in Asia However increases in the application of air pollution controls including some mercury specific technologies together with more stringent regulations in a number of countries have reduced mercury emissions from coal burning in power plants in particular and thus offset some part of the emissions arising from increased coal consumption
In the United States for example emissions from coal burning at power plants have reportedly decreased from about 53 tonnes in 2005 to 27 tonnes in 2010 This decrease is largely due to new regulations that have resulted in changes in the sources of the coal that is burned in large power plants and the installation of mercury controls as well as controls on sulphur dioxide and particulates that have the co-benefit of further reducing mercury emissions
In China many of the new coal-fired power plants have state-of-the-art pollution controls installed
Emissions of mercury from artisanal and small-scale gold mining (ASGM) reported for 2010 are more than twice those reported for 2005 While the
16
UNEP Global Mercury Assessment 2013
Unintentional emission sectors Coal burning ferrous- and non-ferrous (Au Cu Hg Pb Zn) metal production cement production Intentional-use sectors Disposal and incineration of product waste cremation emissions chlor-alkali industry
Comparison of emissions in 2005 and 2010 by selected sector and region
Unintentional emission sectors
Emission t
1000
800
600
400
200
0 2005 2010
Australia New Zealand amp Oceania
Central America and the Caribbean
CIS amp other European countries
East and Southeast Asia
rise in the price of gold (from USD 400 per ounce in 2005 to USD 1100 per ounce in 2010) along with increased rural poverty may indeed have caused more activity in this sector the increased estimate for mercury emissions is considered to be due primarily to some more and better data from many countries and regions West Africa for example was regarded as having minimal ASGM in 2005 but is now recognized as a region with considerable activity Thus the baseline has improved without necessarily any change in actual activity or emission levels
Waste from consumer products is affected by the amount of mercury used For most products in which mercury is used mercury-free alternatives exist Consequently many of these uses of mercury are declining at least in some regions as alternative products or processes are adopted Compact fluorescent light bulbs are an exception Even though the mercury content of individual light bulbs has decreased use of this type of light bulb is increasing rapidly
Artisanal and small-scale gold mining Intentional-use sectors
1000 1000
Step change from 2005 to 2010 due to new information 800 800 (under-estimation in 2005)
600 600
400 400
200 200
0 0 2005 2010 2005 2010
European Union (EU27) South America
Middle Eastern States South Asia
North Africa Sub-Saharan Africa
North America
In order to make valid assessments of trends in emissions from global inventories comparable data on activity levels are required together with information on changes in fuel and raw material characteristics and applied air pollution control technology One aim of the 2010 inventory methods is to create a firmer foundation for such future trend analysis
Ralf Siemieniec Shutterstockcom
Use of mercury-containing energy-saving lamps is increasing
17
UNEP Global Mercury Assessment 2013
Emission scenarios and future trends The 2008 Global Atmospheric Mercury Assessment included a first attempt at projecting future emissions inventories These were based on three scenarios continuing with the status quo applying current emissions controls worldwide and achieving maximum feasible technological reductions At the time this effort was regarded as highly provisional Since then additional studies have extended and improved this work but the results are not markedly different from earlier projections of future mercury emissions
Global mercury models have been used to evaluate future scenarios Four global and hemispheric models projected mercury levels around the world in 2020 based on the three emission scenarios described earlier In industrial regions the status quo will cause an increase in mercury levels of 2-25 and in remote areas of 15-5 The two emission control scenarios on the other hand yield a decrease in mercury in industrial areas of 25-35 and in remote areas of 15-20
Another global model was coupled with estimates of surface reservoirs of mercury in order to quantify source-receptor relationships for the present and for 2050 Under the best-case scenario of maximum feasible reductions projected estimates for deposition in 2050 is similar to estimates for today In the other scenarios increasing emissions lead to increasing deposition A greater proportion of mercury emissions is expected to be in the oxidized form so that a greater proportion will be deposited near the source instead of being transported far away
The model results support the conclusion that reducing anthropogenic emissions will slowly reduce the amount of mercury in biologically available reservoirs Over time mercury in the environment will be taken out of circulation by natural processes for example from ocean waters down into sediments and biologically available mercury will decrease Increased emissions on the other hand will continue to build up the amount of mercury in circulation
With new databases and methods it may soon be possible to create scenarios that incorporate activity levels as well as technology use for each country If this were done it would allow countries to assess the effects of different mercury reduction strategies on their national emissions For example a country could determine the relative contributions of emission reduction technology as opposed to for example changes in raw materials
18
UNEP Global Mercury Assessment 2013
Atmospheric chemistry monitoring and trends 5 Forms of mercury in air Mercury in the atmosphere is in three primary forms Gaseous elemental mercury is the most common in anthropogenic and natural emissions to the atmosphere Gaseous oxidized mercury and mercury bound to particulates are less common The transport and deposition of atmospheric mercury depend greatly on whether the mercury is elemental or oxidized Elemental mercury stays in the atmosphere long enough for it to be transported around the world whereas oxidized and particulate mercury are more readily captured in existing pollution control systems or deposited relatively rapidly after their formation As a result most mercury in the air is in the gaseous elemental phase Relatively little elemental mercury is deposited directly but instead must fi rst be oxidized
Although gaseous oxidized mercury is very important in mercury cycling between air and other environmental compartments the process of oxidation in the air is poorly understood with reactions and resulting compounds yet to be verified in observations
When mercury moves from air to water and land it is generally in an oxidized gaseous or particulate form whereas when it is re-emitted to air it has been converted back to gaseous elemental
Particulate associated mercury
Pole
Equator
Gaseous elemental mercury
Global transport
Gaseous elemental mercury can be transported globally Mercury emitted in particulate form tends to deposit closer to sources
mercury Sunlight appears to play a large role in both oxidation and reduction of mercury but temperature and biological interactions are also likely to be involved to some degree Here too much uncertainty remains Nonetheless the reactions are important in determining net deposition and fate of mercury
Monitoring of mercury in air Monitoring of mercury in air focuses on the three primary forms of mercury The measurement of gaseous elemental mercury is routine and robust Measuring gaseous oxidized mercury and particulate-bound mercury however is challenging Concentrations are typically very low and these forms are chemically unstable leading to high uncertainty in the measurements Nonetheless these forms are critical for defining and modelling the fate and transport of airborne mercury
In the past two decades coordinated mercury monitoring networks and long-term monitoring sites have been established in a number of regions measuring mercury concentrations in the air as well as deposition of mercury in precipitation In Europe and North America high-quality continuous monitoring has been going on for more than 15 years especially in the Arctic High-quality monitoring has started more recently in East Asia and South Africa as part of a global effort to expand the coverage provided by long-term monitoring sites
Measurements and trends in atmospheric mercury Monitoring stations around the world have provided information about trends in atmospheric mercury though the time periods vary depending on how long the site has been active Overall a declining trend in background mercury levels over the past decade has been recorded from monitoring stations
19
UNEP Global Mercury Assessment 2013
in many regions Other regions however show an increase in mercury levels
The sites also provide information about geographical patterns reflecting both background levels of
Trends in atmospheric measurements of mercury
Site(s) Period
Mace Head Ireland 1996-2011
North America rural sites 1995-2005
High Arctic sub-Arctic Up to 20 years of records mid-latitudes
Monitoring networks Mercury monitoring in Europe is carried out under the European Monitoring and Evaluation Programme (EMEP) one of the first international environmental measurement networks Heavy metals such as mercury have been included in the EMEP program since 1999 Mercury measurements are available only from northern and northwestern Europe
Three monitoring networks currently operate in North America providing good coverage of Canada and the United States the Mercury Deposition Network the Canadian Air and Precipitation Monitoring Network and the Atmospheric Mercury Network More recently new sites have been established in Mexico extending coverage on the continent The stations monitor atmospheric mercury and mercury in precipitation which has measured since the mid-1990s Monitoring of mercury in the air and in precipitation has been underway in Asia for nearly a decade
Alert Nord
Point Barrow
Nuuk Stoacuterhoumlfethi
Mace Head
mercury and local and regional influences Mercury concentrations at remote sites in Asia are higher than in other regions of the Northern Hemisphere Coastal cities in China have lower levels than inland sites likely due to the influence of relatively clean
Measurement Trend
Gaseous elemental mercury Decrease of 14-18 per year
Total gaseous mercury Decrease of 22 to 174 in total
Total gaseous mercury Decreasing trend at some stations increasing at others
The monitoring network of the Arctic Monitoring and Assessment Programme (AMAP) includes air and deposition monitoring sites located in Arctic regions of Canada Greenland Iceland Norway Russia and Sweden
Building on existing national and regional monitoring networks the European Union-financed project
ldquoGlobal Mercury Observation Systemrdquo (GMOS) started in November 2010 Its goal is to develop a coordinated global system for monitoring mercury including a large network of ground-based monitoring stations New sites are being installed in regions where few monitoring stations exist especially in the Southern Hemisphere Two sites have been established in Antarctica one on the Antarctic Plateau and one on the coast
Ny-Aringlesund
Amderma Pallas
Raringouml Bredkaumllen
Listvyanka Diabla Gora
Mauna Loa
Mt Bachelor
Celestuacuten Calhau
Longobucco
Iskrba Niembro Monte Cimone Cap
Ferrat Mt Waliguan Ganghwa Island
Lulin
Cape Hedo Ev-K2
Mt Changbai
Minamata Mt Ailao
Nieuw Nickerie
Kodiakanal
Maheacute Island Manaus
Bariloche Cape Point
Amsterdam Island Cape Grim
Dumont drsquoUrville
AMAP CAMnet EMEP GMOS GMOS associated NADPAIRMoN NADPMDN
Air + precipitation Air Precipitation
20
UNEP Global Mercury Assessment 2013
John Munthe
The mercury background air monitoring station at Zeppelin mountain Svalbard
air from over the ocean Sites off the Asian coast however show higher levels of gaseous elemental mercury than the Northern Hemisphere background suggesting an outflow from the Asian mainland
Weather patterns have also been found to have a strong influence on seasonal patterns in mercury levels in the air at monitoring sites At the Mount Waliguan Observatory on the Tibetan Plateau for example northeasterly and easterly winds produced the highest levels of mercury
Measurements at high altitudes Measurements from ground-based stations above 2700 meters suggest that there is an inverse relationship between gaseous elemental mercury and gaseous oxidized mercury at these elevations In other words when there is more elemental mercury there is less oxidized mercury and vice versa These measurements are in good agreement with modelling results which gives additional confidence in current understanding of the behaviour of mercury at high altitude
An inverse relationship between total gaseous mercury and particulate concentration has also been observed in the high stratosphere From the transformation rate of total gaseous mercury to particulate-bound mercury it appears that gaseous mercury lasts about two years in the stratosphere
21
UNEP Global Mercury Assessment 2013
Atmospheric concentrations and deposition 6 Measurements and trends of mercury in precipitation Mercury deposited by precipitation decreased from the 1990s into the 2000s at many but not all sites in North America and Western Europe where such measurements were taken
Regional patterns are also evident including slightly higher levels in southern Europe than northern Europe and higher levels in Asia than in North America Total mercury concentrations in precipitation in China were much higher than those in Japan and South Korea Th is was mostly attributed to higher levels of gaseous oxidized mercury and particulate-bound mercury which are readily deposited by precipitation and thus not transported far
A comparison of data from Canadian and American monitoring sites found that deposition of mercury in precipitation was highest in summer
Dry deposition of mercury which is deposition not associated with precipitation is diffi cult to measure and consequently there is little information on trends in mercury dry deposition Th is lack of information means that it is also diffi cult to validate model results for dry deposition
106 44
474 72 91
5 7 71
05 1 5 10 100 500 1000
Total mercury emission (2005) kgcell
Modelled mercury air concentrations and deposition patterns Atmospheric mercury concentrations are highest in major industrial regions Models examining global patterns show that East and South Asia Europe North America and South Africa have the highest levels of elemental mercury in the air Concentrations are generally lower in the Southern Hemisphere than the Northern Hemisphere because most industrial activity is in northern regions Th ese model results are based on simulations using the 2005 global mercury emission inventory because the 2010 inventory has only recently become available
Intercontinental transport of mercury in the air has been examined to determine its impact on regional mercury levels Four models using diff erent parameters produced consistent results Depending on the region mercury emitted by distant sources contributes between 10 and 30 of annual mercury deposition Where local sources are low mercury transported from distant emission sources can account for more than half of the deposition East Asia is the dominant source region adding 10-14 to the deposition in
Contribution from sources outside receptor region
Model 40
GEOS-Chem GLEMOS GRAHM CMAQ-Hg
30
20
10
0 Arctic Europe North East Asia South Asia
America
Receptor region
(Left ) Global distribution of anthropogenic mercury emissions in 2005 with source regions that were considered in the analysis (North America South America Europe Africa Central Asia South Asia East Asia Australia and Oceania) and (right) the contribution of anthropogenic sources outside a particular receptor region to deposition within the receptor region
22
UNEP Global Mercury Assessment 2013
Modelling atmospheric transport and deposition Global models reproduce the movement of mercury in the atmosphere during which the mercury may move between continents They have been effective in examining sources of mercury to the Arctic and also for examining the outflow of pollution from South and Southeast Asia and its impact on western North America as well as the flow from eastern North America to Europe
Regional models on the scale of a continent or a basin such as the Mediterranean can provide more detail about specific source areas even to the level of individual industrial areas Reliable results however require a detailed understanding of mercury oxidation in the atmosphere about which there is considerably uncertainty
Most atmospheric transport models consider the full chain of mercury processes in the atmosphere Some models also consider how mercury is cycled in other atmospheric compartments such as soil vegetation snow freshwater and seawater
One of the largest sources of uncertainty in mercury models is the chemical mechanism used to determine how mercury changes forms in the air Improved experimental data can help improve model performance by making sure that the correct reactions are simulated The processes that lead from deposition to re-emission also need to be understood better Advances in this area show promise with model results becoming closer to estimates based on experimental data
other regions of the world Natural emissions and re-emissions account for 35-70 of total deposition in most regions Deposition is generally greater in low and mid-latitudes due to stronger sunlight higher concentrations of oxidants and higher precipitation
Regional mercury models show patterns at the scales of continents or individual seas The Mediterranean Sea for example is a net source of mercury as it emits more than is deposited to it In that region dry deposition generally exceeds deposition of mercury in precipitation In Central and Southern Europe total gaseous mercury concentrations and deposition in precipitation were both consistently higher than the European average
Across the United States dry deposition accounts for two-thirds of total annual deposition mainly from gaseous oxidized mercury A study examining sources and deposition of mercury to assess the
benefits of proposed emission control measures found that mercury transport from outside the country accounts for 68 of mercury deposition in the Northeast and up to 91 in the west-central United States Large point sources contribute up to three-quarters of nearby deposition and power plants contributed half of the deposition in the eastern part of the country This suggests that new emissions standards would primarily benefit eastern regions of the US
In Asia studies show high seasonal variation in mercury concentration and deposition Anthropogenic emissions are responsible for about 75 of deposition in East Asia In this region there is a net removal of gaseous oxidized mercury from the atmosphere and a net export of gaseous elemental mercury
In the Arctic gaseous elemental mercury levels in the atmosphere are depleted rapidly in spring when after the long Arctic winters sunlight returns Ozone is depleted at the same time and it is believed that bromine-containing compounds are the cause of the photo-chemical reactions that deplete ozone and mercury During these events gaseous oxidized mercury and particulate-bound mercury levels increase sharply suggesting that the gaseous mercury is oxidized and deposited enhancing mercury deposition in Arctic areas in springtime Recent research however has found that 50-80 of the deposited mercury is re-emitted within a few days Similar springtime mercury depletion events have been seen in Antarctica
23
UNEP Global Mercury Assessment 2013
Anthropogenic releases to the aquatic environment 7 Global assessment Previous UNEP global mercury assessments only considered emissions to the atmosphere The 2013 Report presents the first attempt at compiling a global inventory of mercury releases to aquatic environments Releases directly into the aquatic environment present a completely different chemistry set of pathways and fate to those released to air They are also more directly linked to the risks posed by mercury to global environmental and human health Unlike mercury releases to air which are predominantly in the form of gaseous elemental mercury releases to water are predominantly inorganic mercury and to a lesser extent liquid elemental mercury
At present only some sources of aquatic releases can be quantified with any confidence Thus many sources that may be important are not included in this first assessment of global aquatic releases For example land management practices that expose new geological sources of mercury in rocks and mineral soils or that re-mobilize previously deposited mercury cannot yet be assessed Two broad categories of current anthropogenic sources are considered here point sources of mercury release to water and diffuse releases of mercury as a result of its remobilisation from areas where it was previously deposited or accumulated due to human activity (ie contaminated sites) Artisanal and small-scale gold mining (ASGM) mercury-containing pesticides and fungicides used in agriculture and deforestation are considered separately
Point source releases to water from various sectors in tonnes per year with the range of the estimate and as a percentage of total anthropogenic emissions
Sector Releases (range) tonnes
Non-ferrous metal production 925 (193 - 268)
Consumer product waste 894 (222 - 308)
Chlor-alkali production 28 (10 ndash 55)
Oil refining 06 (03 ndash 1)
Grand Total 185 (426 ndash 582)
The global estimate of mercury release to water from point sources has been derived from the atmospheric emissions assessment and the approach employed in the UNEP Toolkit to partition total mercury releases between air land and water This approach has considerable uncertainty and may omit sectors where releases to water are high but air emissions are unimportant and therefore not addressed in the inventory Global releases from point sources were estimated to be 185 tonnes per year
For diffuse sources evaluating the relative contribution of anthropogenic and natural sources to the aquatic environment requires determining considerations of the various mercury inputs For some sectors data exist that allow a preliminary assessment of the amounts of mercury re-mobilized into aquatic systems
For mercury-contaminated sites the range of average soil concentrations of mercury reported for sites where mercury was mined used or otherwise released by human activity was considered The area of contamination is then used to determine how much mercury is available in soils and when combined with a factor for how much mercury is released from those soils in a year the total release can be estimated Among identified contaminated sites mercury mining is identified as the largest sector followed by mining of precious metals Total releases to aquatic environments from contaminated sites are estimated to be 83-335 tonnes per year
Releases to water from contaminated sites in tonnes per year with the range of the estimate
Sector Releases (range) tonnes
Primary mercury mining sites 67 ndash 266
Precious metal production sites 14 ndash 55
Non-ferrous metal production sites 01 ndash 05
Chlor-alkali production sites 01 ndash 05
Other industrial sites 01 ndash 03
Grand Total 83 ndash 335
24
UNEP Global Mercury Assessment 2013
Much of the mercury released from artisanal and small-scale gold mining goes into rivers lakes soils and sediments and tailings From soils and tailings it may be re-mobilized by leaching and erosion In addition mining may disturb mercury-containing soils and sediments that may then erode more quickly releasing more mercury than would otherwise have become available from natural erosion A key factor in these processes is the local hydrological cycle of precipitation evaporation run-off and river flow To account for this in the assessment countries were designated as dry wet or intermediate to determine the relative importance of erosion The tropical and subtropical countries which have the greatest activity in this sector also tend to experience high precipitation and run-off exacerbating this source of mercury release and re-mobilization Total worldwide releases of mercury to land and water from ASGM were estimated at over 800 tonnes per year How much of this is released to water cannot yet be determined
Mercury continues to be used in pesticides and fungicides 2100 tonnes of mercury were released in the decade of the 1960s through such agrochemical uses Current data are unavailable although the use of mercury in these products has been greatly reduced
Deforestation especially in the Amazon Basin can lead to extensive soil erosion and thus the release of mercury previously accumulated in soils Using 2010 figures for deforestation rates around the world and an estimate of soil concentrations of mercury as much as 260 tonnes of mercury may have been released into rivers in 2010 as a result of deforestation worldwide
Because this is the first attempt to quantify global mercury releases to the aquatic environment there is no previous measurement against which these results can be compared Thus it is not possible at this time to evaluate trends in releases
Uncertainties in release estimates Estimating global releases of mercury to aquatic environments is being done here for the first time Many data are missing and others are imprecise A number of assumptions have been made based on what measurements are available or on other grounds to extrapolate from known quantities or to calculate aquatic releases in relation to atmospheric
or other emissions Thus the results should be treated with great caution It is nonetheless clear that anthropogenic sources and human activity contribute hundreds of tonnes of mercury to aquatic environments each year a substantial amount relative to estimated natural releases 150-960 tonnes per year from terrestrial environments
Lapshin Shutterstockcom
Phil Augustavo istockphotocom
Bureau of Land Managem
ent
Contaminated sites (top) erosion following deforestation (middle) and a flooded store of mercury-contaminated waste (lower) illustrate potential sources of mercury releases to water
25
UNEP Global Mercury Assessment 2013
Aquatic pathways transport and fate 8 Mercury in aquatic environments The pathways and fate of mercury in aquatic environments are important because it is in waters sediments and wetland soils that inorganic mercury is converted into methylmercury which is toxic and concentrates in animals The majority of human exposure to mercury and the health risk that comes with mercury exposure is from consumption of marine foods Thus this section focuses on the worldrsquos oceans Some freshwater systems however are important sources of fish for human consumption especially for subsistence and recreational fisheries often among indigenous peoples Artisanal and small-scale gold mining (ASGM) communities may also be affected through fish consumption and drinking water if those are contaminated by local releases
The major processes of mercury cycling are generally similar for all aquatic systems Inorganic mercury in dissolved or particulate form is the dominant mercury type in most marine and fresh waters Dissolved gaseous elemental mercury accounts for less than 30 of total mercury in water Methylmercury is often present at trace levels but may in some settings reach 30 of total mercury In freshwater and coastal environments inorganic mercury is transformed into methylmercury primarily in sediments In the open ocean this conversion takes place largely at intermediate depths between 200 and 1000 meters in the water column Mercury is lost from aquatic systems in two ways When inorganic mercury is reduced to elemental mercury it can be re-emitted to the atmosphere When inorganic mercury binds to particulates in water it can settle out rapidly and be buried in sediments Deep burial in ocean sediments is one of the major pathways by which mercury is removed from the biologically active environment
The global mercury cycle is chemically and physically complex Thus it is necessary to use models to study describe and predict what happens and will happen to mercury in the aquatic environment Until recently only one model existed that incorporated
air land and water into a unified whole The model has been validated against observations of mercury and represents the current scientific consensus The largest potential errors in this model in terms of the aquatic cycle concern details of the exchange of mercury between air and water
Pathways and fate of mercury in the oceans Model simulations suggest that anthropogenic impacts on mercury levels in the ocean are greatest in the surface waters the top 100 meters or so of the water column While model results vary one recent estimate suggests that anthropogenic emissions over the last 100 years have doubled the concentration of mercury in the surface layer of the ocean and increased it by 25 in intermediate waters and by 10 in deep waters The difference is due to the length of time it takes for surface waters to circulate to the depths
Models and measurements agree that direct deposition from the atmosphere is the dominant pathway by which mercury reaches the oceans The exceptions are smaller semi-enclosed basins such as the Mediterranean Sea or the Arctic Ocean where river runoff coastal erosion and ocean currents
Ugo M
ontaldo Shutterstockcom
26
UNEP Global Mercury Assessment 2013
account for about half of mercury inputs The most recent modelling effort suggests that total deposition input of mercury to the oceans in 2008 was 3700 tonnes
Other mercury pathways appear less important on a global basis Rivers are estimated to carry more than 2800 tonnes of mercury each year but only about 380 tonnes of this is transported offshore The rest is trapped by particles in estuaries Groundwater and re-mobilization from sediments provide 100shy800 tonnes of mercury to the oceans each year Undersea hydrothermal vents add less than 600 tonnes of mercury to the oceans There are high concentrations of mercury in vent fluids but a great deal of the mercury is precipitated as solids once the vent fluids enter seawater
Models suggest that globally about 70 of the mercury deposited into the ocean is re-emitted to the atmosphere Oxidized mercury in surface waters is reduced by biological and photochemical processes to the elemental form that is volatile and readily re-emitted The removal of this mercury ultimately reduces the pool of mercury that could be converted to methylmercury and be accumulated by marine organisms The re-emission process thus simultaneously prolongs the lifetime of mercury cycling through the atmosphere and upper ocean and acts to reduce mercury availability for marine food webs
Any changes in the efficiency of mercury reduction in surface waters or the rate of re-emission is likely to impact mercury concentrations in surface waters and the air One example is the effect of sea ice in the Arctic Ocean which blocks the re-emission
Tony Magdaraog Shutterstockcom
Mercury accumulated in marine food-webs can enter the human diet
of elemental mercury leaving elevated levels in waters under ice Changes in primary productivity could change the rate at which mercury is bound to particles thus affecting re-emission to the atmosphere as well as rates of downward transport in the ocean Changes in oxidant levels in the atmosphere such as ozone and bromine may also influence the rate of oxidation of gaseous elemental mercury and thus deposition rates to the ocean
Methylmercury in the ocean Natural bacterial processes in seawater and in sediments in coastal environments convert inorganic mercury to methylmercury Methylmercury levels are highest in the subsurface waters of many oceans because it is formed at these intermediate depths likely as a result of the decomposition of organic material falling from surface waters Current understanding indicates that about 300 tonnes of methylmercury is produced in the upper ocean by this and related processes By contrast only about 80 tonnes of methylmercury reaches the ocean from other sources such as atmospheric deposition rivers and diffusion from sediments
Current modelling indicates that methylmercury stays in the upper ocean for about 11 years Deshymethylation by photochemical reaction or by microbial activity is the major removal process for methylmercury in the ocean About 240 tonnes of methylmercury is removed by this process from the surface waters of the ocean per year
The other important pathway for methylmercury in seawater is uptake into marine food webs Although only about 40 tonnes per year is taken up in this way it is this fraction that poses risks to marine animals and human consumers of seafood Methylmercury is a problem for several reasons First it is taken up by plankton much more efficiently than is inorganic mercury resulting in concentrations in plankton that are as high as 10000 times the concentration in seawater Second methylmercury is absorbed through the intestine of animals much more easily than is inorganic mercury Third methylmercury biomagnifies as it moves up the food web Thus methylmercury becomes an increasingly greater proportion of the mercury in organisms higher in the food web This explains why some indigenous populations that consume top marine predators such as fish seals and whales have some of the worldrsquos highest concentrations of methylmercury giving rise to health concerns
27
UNEP Global Mercury Assessment 2013
Pathways and fate of mercury in freshwater Observations and modelling both show that there are in general many similarities between mercury chemistry pathways and fate in lakes and in the oceans but with obvious differences in scale and in the relative importance of different processes Modelling of mercury dynamics was done for four lakes with a history of direct mercury inputs from the largest freshwater lake in the world (Lake Superior) to small lakes in Ontario Canada Atmospheric deposition and river inflow were the main sources of inorganic mercury Much of the mercury input from lake and river catchments was associated with dissolved and particulate organic matter The dominant mercury removal mechanisms as in saltwater were burial in sediments and photochemical reduction of oxidized mercury to elemental mercury followed by re-emission to the air In Lake Superior and Lake Michigan there is evidence for methylation of mercury in the water column as is seen in the open ocean
Methylmercury levels in freshwater fish vary with the level of deposition of mercury from the air though other factors such as inputs from the watershed and the number of trophic levels within the lakersquos food web are also important Methylation predominantly occurred in lake sediments and wetlands and floodplain soils where sulphateshyreducing bacteria are believed to be primarily responsible Methylmercury is de-methylated in sediments and also taken away in the outlet river from each lake
Some 400-1400 tonnes of mercury are estimated globally to be trapped behind dams and other man-made impoundments each year This has in many cases led to significant increases in total mercury and methylmercury levels in water and of methylmercury in fish and other aquatic species When artificial lakes are created plant material is submerged leading to decay and anoxia In these conditions microbially driven methylation of inorganic mercury takes place In some cases the elevated mercury levels have also been observed downstream from the artificial lakes and reservoirs
Anthropogenic impacts on aquatic mercury levels Two studies have reported that the Atlantic and Pacific Oceans have shown opposing trends over recent decades While the influence of changing ocean currents and other oceanographic factors may be a factor the trends do make sense in light of patterns of anthropogenic emissions In the North Pacific Ocean mercury concentrations appear to have increased at depths between 200 and 1000 meters over the last few decades This increase coincides with the rapid industrialization of East Asia
In the North Atlantic however results from near Bermuda suggest a substantial decrease in mercury concentration and a change in the mercury profile through the water column The Mediterranean Sea too showed a decrease in mercury concentration between 1990 and 2004 These findings are consistent with atmospheric data from around the North Atlantic The conclusion is that mercury levels in seawater in the North Atlantic were elevated by human activity but may now be declining likely as a result of decreased emissions from North America and Europe
A complementary approach to measuring mercury in seawater is to measure mercury in aquatic animals which accumulate and integrate mercury over time Teeth hair feathers and eggshells are useful long-term archives of mercury concentrations and can provide data from the pre-industrial period (ie before 1800) as well as more recent periods
Among marine animals samples are available from several regions particularly from the Arctic where cold dry conditions help preserve animal tissues Mercury concentrations between the 13th and 16th
centuries were relatively stable From the mid- to late 19th century to the end of the 20th century mercury levels increased by an average of 12 times On average therefore about 92 of the mercury in Arctic marine wildlife today is likely to be of anthropogenic origin
Similar findings were found for a 700-year sequence of seabird eggshells from the South China Sea Mercury levels increased steadily between 1800 and 2000 with a particularly rapid increase after 1970 Concentrations since 2000 are about 10 times higher than pre-industrial levels with 91 of the mercury now likely to be of anthropogenic origin In the Antarctic studies of seal hairs show that pre-industrial mercury levels were only 60 of recent levels The relatively small difference
28
UNEP Global Mercury Assessment 2013
Historical Hg concentration as a proportion of present-day 100
80
60
40
20
0
Beluga teeth Human teeth
Gyrfalcon feathers Perigrine falcon feathers
Polar bear hair Ringed seal teeth
1200 1300 1400 1500 1600 1700 1800 1900 2000
between pre-industrial and modern mercury levels in Antarctic is consistent with lower mercury emissions and atmospheric concentrations in the Southern Hemisphere as compared with the Northern Hemisphere
The timing of long-term increases of mercury in aquatic animals can shed light on the likely sources of mercury emissions that were responsible The industrialization of Europe and North America appear responsible for the large increases in marine mercury levels that began in the 19th century as these increases occurred prior to recent Asian industrialization As with water concentrations in the Pacific Ocean recent rapid increases in mercury in seabird eggs in the South China Sea coincide with industrialization in Asia
The time lag in aquatic ecosystem response One important conclusion from air-ocean modeling is that the oceans have not yet reached equilibrium with current atmospheric levels of mercury This lag is due to several factors First mercury stays in the upper ocean above 200 meters depth for about 30 years and for centuries in intermediate and deep waters This is much longer than the one year residence time in the lower atmosphere Thus removal from the ocean takes much longer than does removal from the air and so concentrations will change more slowly
Second because of the long lifetime of mercury in deeper ocean waters a great deal of natural mercury is present in the ocean already about 100000 tonnes out of a total of 135000 tonnes in intermediate waters and 200000 out of 220000 tonnes in deep waters
Rune Dietz
Analysis of museum samples reflects the increase in mercury emissions and releases since the mid-19th century associated with anthropogenic activities
Third vertical transport of mercury from intermediate depths back to the surface returns a substantial amount of mercury to the biologically active zone each year As a result average mercury concentrations in seawater and marine animals are likely to increase slowly for decades if not centuries even if atmospheric levels stabilize at present levels In short the effects of historical anthropogenic emissions from Europe and North America are still being observed in the oceans at the same time that the effects of the recent rise in emissions from Asia are being seen
Regionally different trends can be expected depending on distance from sources and ocean circulation patterns In the North Atlantic north of 55deg N it will take 50-600 years to achieve equilibrium between atmospheric and seawater mercury levels In the North Pacific this process is estimated to take 500-700 years and in the Antarctic 700-1000 years The Arctic Ocean by contrast is smaller and will only take about 35 years to reflect changes in atmospheric mercury levels Surface waters of the Mediterranean Sea should show also changes within 10-50 years
Time lags in the responses of many freshwaters and their food-webs to changes in atmospheric mercury levels are also expected Although some immediate recovery following reductions in atmospheric mercury deposition rates is likely full recovery may take decades centuries or longer depending on the characteristics of the area Highly polluted freshwaters with catchments and sediments containing large amounts of anthropogenic mercury will recover most slowly as is already observed around point sources such as smelters that have closed down
29
UNEP Global Mercury Assessment 2013
Major gaps in knowledge 9 Large uncertainties remain in global estimates of mercury emissions to the air These stem from various sources including the availability of information on activity levels but mainly from the lack of information concerning the mercury content of some raw materials and the validity of assumptions regarding processes and technologies employed to reduce mercury emissions including their rates of application and effectiveness The accuracy and precision of measurement-based estimates can depend on the validity of extrapolating measurements made at infrequent intervals to longer periods or measurements made at one plant to other facilities with similar operations
Potentially important emissions sectors that are still not quantified in the emissions inventory include the use of mercury in vinyl-chloride monomer production secondary metals production oil and gas extraction transport and processing industrial and hazardous waste incineration and disposal sewage sludge incineration and dental fillings preparation and removal
Current measurements and their evaluation are inadequate for determining spatial and temporal trends Improved more extensive and better coordinated measurements are needed A permanent global integrated monitoring network for atmospheric mercury and mercury deposition is needed to achieve this goal The atmospheric network sites should be closely integrated with water soil and biological monitoring networks The results can be used for model testing and evaluation as well as for more accurately detailing the geographic impact of anthropogenic emissions Monitoring of mercury concentrations in the important marine food species is essential to understanding possible human health impacts and the effects of future emissions changes
Better data on mercury distribution in the troposphere is needed to improve understanding of long-range transport and source-receptor relationships Coordinated studies at high altitudes and by aircraft are needed This information will
also help validate regional and global scale models improving their prediction capabilities with regard to different policy scenarios
Key processes related to global transport and cycling of mercury remain inadequately understood The chemical form of gaseous oxidized mercury is unknown Reduction and oxidation rates for mercury in the presence of atmospheric oxidants need further study including determining which oxidants are important New measurements and modelling studies are needed to examine key chemical and physical processes that affect global transport and cycling
Few data are available for reporting mercury releases to aquatic systems Systematic and consistent monitoring of mercury releases to the air is required especially for contaminated systems Releases of mercury from soils into waters depend greatly on climate and topography and these parameters need to be better accounted for Consistent approaches for measuring and reporting releases from point sources are needed to ensure comparability of data from around the world In particular the actual role of artisanal and small-scale gold mining (ASGM) in emissions to air and releases to water needs to be more accurately estimated
The link between mercury deposition methylation and uptake by living organisms needs further study The parameters that determine the rates of exchange of mercury compounds between air and sea air and soil and air and vegetation are not fully understood Whole-ecosystem studies of mercury are needed to better understand biogeochemical cycling Methylationdemethylation rates and their spatial and temporal variations and relationship to climatic factors need to be determined in most of worldrsquos major ocean basins as well as in representative freshwaters
30
UNEP Global Mercury Assessment 2013
Key findings of the 2013 assessment 10 Atmosphere Total anthropogenic emissions of mercury to the atmosphere in 2010 are estimated at 1960 (1010shy4070) tonnes which is about 30 of the total mercury that was emitted and re-emitted from anthropogenic and natural sources in that year The largest anthropogenic sources are associated with artisanal and small-scale gold mining (ASGM) and coal burning which together account for about 62 of the annual total anthropogenic emissions to air Other major sectors include ferrous and non-ferrous metal production and cement production
East and Southeast Asia are responsible for about 40 of global anthropogenic emissions About 75 of the mercury from this region comes from China which is about one-third of the global total Increased estimates for emissions from ASGM largely a result of newly obtained data and improved information mean that South America and Sub-Saharan Africa are also responsible for a greater proportion of global emissions than was previously assumed
Anthropogenic emissions over time have increased mercury loads present in the environment This leads to higher rates of re-emission and also means that there will be a time lag of years or decades between emissions reductions and lower mercury levels in the food web including pathways of human exposure
Mercury emissions to the atmosphere likely peaked in the 1950s to 1970s and subsequently declined because of reductions in Europe Russia and North America Emission trends are unclear due to changes in methods employed to produce inventories and differences in the sectors that have been accounted at different times There are however some indications that emissions may be rising again with increases from East Asia offsetting continuing reductions in Europe and North America
Aquatic environments Natural processes in aquatic systems convert less toxic elemental and inorganic mercury into much more toxic methylmercury Methylmercury concentrates and accumulates in the food web leading to high concentrations in some species of seafood and fish that many people eat
Anthropogenic releases of mercury to aquatic environments contribute hundreds of tonnes to the amount of mercury cycling in the environment Diffuse releases and point sources appear equally important Atmospheric deposition however remains the most important input of mercury to land and oceans and has increased the amount of mercury in many environmental compartments by a factor of two or three since the start of the industrial age On land mercury that is deposited is largely retained in soils and vegetation increasing the available pool for re-mobilisation to adjacent aquatic systems Re-emission from soils however is a major addition to atmospheric mercury
Hydrology is the most important factor in the transport of mercury from catchments to downstream environments Relatively little of this mercury reaches the open ocean as most is captured in sediments behind dams in estuaries and near the coast Changes in land cover and land use can have a large effect on mercury mobilisation as exposed soils erode and mercury leaches into the water table
Concentrations of mercury in Arctic marine animals today are about 10-12 times higher than in preshyindustrial times (ie prior to about 1800) This means that on average about 92 of the mercury in marine predators such as seabirds seals and whales is anthropogenic in origin The timing of the increase suggest that 19th and early 20th century emissions from Europe North America and Russia were responsible Increases mercury concentrations in seabirds in the South China Sea appear to be more recent than the Arctic increases coinciding with increasing industrialisation in East and Southeast Asia
31
UNEP Global Mercury Assessment 2013
K+S Entsorgung Gm
bH
Recovered mercury is being stockpiled at long-term storage sites above- and as shown here below ground
The upper 100 meters of the oceans have twice the mercury that they did a century ago Intermediate and deeper waters have 10-25 more mercury on average reflecting the slow transport of mercury downwards in the oceans Seawater concentrations will thus be especially slow in responding to changes in mercury inputs from atmospheric deposition and river flow As a result mercury concentrations in marine biota are likely to increase slowly for decades to centuries even without an increase in atmospheric emissions
In freshwater ecosystems atmospheric deposition and re-mobilisation from soils slow the reduction of mercury levels even in regions where atmospheric concentrations have decreased due to emission controls
Further increases in atmospheric emissions will have long-term consequences for commercial fisheries and all consumers of marine and freshwater foods
It is likely to be years or decades before reductions in anthropogenic emissions and releases of mercury have a demonstrable effect on mercury levels throughout the environment and in the fish and marine mammals which are part of the human food-chain This only reinforces the need to act now to continue and strengthen international efforts to reduce current mercury emissions and releases Delays in action now will inevitably lead to slower recovery of the worldrsquos ecosystems in future from mercury contamination leaving an even greater legacy of pollution for future generations
32
Division of Technology Industry and Economics (DTIE) Chemicals Branch Geneva Switzerland January 2013
Job number DTI1636GE
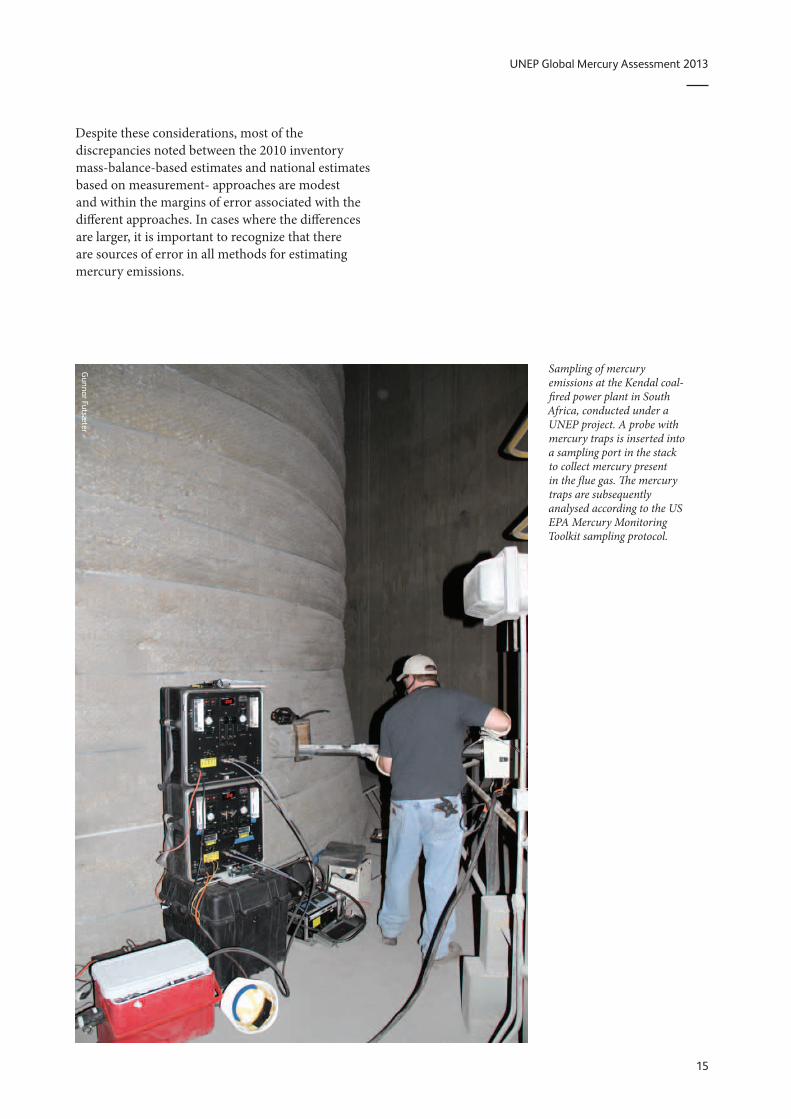
UNEP Global Mercury Assessment 2013
Despite these considerations most of the discrepancies noted between the 2010 inventory mass-balance-based estimates and national estimates based on measurement- approaches are modest and within the margins of error associated with the different approaches In cases where the differences are larger it is important to recognize that there are sources of error in all methods for estimating mercury emissions
Gunnar Futsaelig
ter
Sampling of mercury emissions at the Kendal coal-fired power plant in South Africa conducted under a UNEP project A probe with mercury traps is inserted into a sampling port in the stack to collect mercury present in the flue gas The mercury traps are subsequently analysed according to the US EPA Mercury Monitoring Toolkit sampling protocol
15
UNEP Global Mercury Assessment 2013
Trends in mercury emissions to the atmosphere 4 Assessing global and sectoral trends A key question in assessing anthropogenic mercury emissions worldwide is whether they are increasing or decreasing While it is tempting simply to compare the 2010 inventory with its 2005 counterpart the results would mean little As inventory methods develop and as additional sources are considered the estimate of total anthropogenic mercury emissions worldwide also changes While some changes reflect real trends others reflect changes in methods or scope Thus comparing the results of previous assessments with the present update requires considerable care and involves an understanding of the way in which these inventories have been produced and the uncertainties associated with them
It is possible however to compare certain sectors over time by attempting to compensate for any methodological changes between the various inventories since 1990
Emissions to air are thought to have peaked in the 1970s From 1990 to 2005 total anthropogenic emissions of mercury to the atmosphere appear to
Emissions to air t
1400
1200
1000
800
600
400
200
0
1990
1995
2000
2005
Africa Asia Europe Russia North Oceania South America America
Estimates of annual anthropogenic mercury emissions from different continentsregions 1990-2005
have been relatively stable with decreases in Europe and North America being offset by increases in Asia A reanalysis of the available inventories since 1990 however indicates that emissions from industrial sectors at least may be starting to increase again
The changes introduced in the 2010 inventory methodology prevent a straight-forward continuation of this analysis However an evaluation of trends for some sectors between 2005 and 2010 has been made by applying the new methodology to activity data for 2005 This comparison suggests a further slight increase in the combined amount of mercury emitted by industrial sectors (coal combustion production of cement pig iron and steel and non-ferrous metals) The following paragraphs describe the trend results for three sectors to illustrate some of the developments between 2005 and 2010 and some of the the difficulties in comparing emissions estimates between different years made with different methods
Coal burning for power generation and for industrial purposes continues to increase especially in Asia However increases in the application of air pollution controls including some mercury specific technologies together with more stringent regulations in a number of countries have reduced mercury emissions from coal burning in power plants in particular and thus offset some part of the emissions arising from increased coal consumption
In the United States for example emissions from coal burning at power plants have reportedly decreased from about 53 tonnes in 2005 to 27 tonnes in 2010 This decrease is largely due to new regulations that have resulted in changes in the sources of the coal that is burned in large power plants and the installation of mercury controls as well as controls on sulphur dioxide and particulates that have the co-benefit of further reducing mercury emissions
In China many of the new coal-fired power plants have state-of-the-art pollution controls installed
Emissions of mercury from artisanal and small-scale gold mining (ASGM) reported for 2010 are more than twice those reported for 2005 While the
16
UNEP Global Mercury Assessment 2013
Unintentional emission sectors Coal burning ferrous- and non-ferrous (Au Cu Hg Pb Zn) metal production cement production Intentional-use sectors Disposal and incineration of product waste cremation emissions chlor-alkali industry
Comparison of emissions in 2005 and 2010 by selected sector and region
Unintentional emission sectors
Emission t
1000
800
600
400
200
0 2005 2010
Australia New Zealand amp Oceania
Central America and the Caribbean
CIS amp other European countries
East and Southeast Asia
rise in the price of gold (from USD 400 per ounce in 2005 to USD 1100 per ounce in 2010) along with increased rural poverty may indeed have caused more activity in this sector the increased estimate for mercury emissions is considered to be due primarily to some more and better data from many countries and regions West Africa for example was regarded as having minimal ASGM in 2005 but is now recognized as a region with considerable activity Thus the baseline has improved without necessarily any change in actual activity or emission levels
Waste from consumer products is affected by the amount of mercury used For most products in which mercury is used mercury-free alternatives exist Consequently many of these uses of mercury are declining at least in some regions as alternative products or processes are adopted Compact fluorescent light bulbs are an exception Even though the mercury content of individual light bulbs has decreased use of this type of light bulb is increasing rapidly
Artisanal and small-scale gold mining Intentional-use sectors
1000 1000
Step change from 2005 to 2010 due to new information 800 800 (under-estimation in 2005)
600 600
400 400
200 200
0 0 2005 2010 2005 2010
European Union (EU27) South America
Middle Eastern States South Asia
North Africa Sub-Saharan Africa
North America
In order to make valid assessments of trends in emissions from global inventories comparable data on activity levels are required together with information on changes in fuel and raw material characteristics and applied air pollution control technology One aim of the 2010 inventory methods is to create a firmer foundation for such future trend analysis
Ralf Siemieniec Shutterstockcom
Use of mercury-containing energy-saving lamps is increasing
17
UNEP Global Mercury Assessment 2013
Emission scenarios and future trends The 2008 Global Atmospheric Mercury Assessment included a first attempt at projecting future emissions inventories These were based on three scenarios continuing with the status quo applying current emissions controls worldwide and achieving maximum feasible technological reductions At the time this effort was regarded as highly provisional Since then additional studies have extended and improved this work but the results are not markedly different from earlier projections of future mercury emissions
Global mercury models have been used to evaluate future scenarios Four global and hemispheric models projected mercury levels around the world in 2020 based on the three emission scenarios described earlier In industrial regions the status quo will cause an increase in mercury levels of 2-25 and in remote areas of 15-5 The two emission control scenarios on the other hand yield a decrease in mercury in industrial areas of 25-35 and in remote areas of 15-20
Another global model was coupled with estimates of surface reservoirs of mercury in order to quantify source-receptor relationships for the present and for 2050 Under the best-case scenario of maximum feasible reductions projected estimates for deposition in 2050 is similar to estimates for today In the other scenarios increasing emissions lead to increasing deposition A greater proportion of mercury emissions is expected to be in the oxidized form so that a greater proportion will be deposited near the source instead of being transported far away
The model results support the conclusion that reducing anthropogenic emissions will slowly reduce the amount of mercury in biologically available reservoirs Over time mercury in the environment will be taken out of circulation by natural processes for example from ocean waters down into sediments and biologically available mercury will decrease Increased emissions on the other hand will continue to build up the amount of mercury in circulation
With new databases and methods it may soon be possible to create scenarios that incorporate activity levels as well as technology use for each country If this were done it would allow countries to assess the effects of different mercury reduction strategies on their national emissions For example a country could determine the relative contributions of emission reduction technology as opposed to for example changes in raw materials
18
UNEP Global Mercury Assessment 2013
Atmospheric chemistry monitoring and trends 5 Forms of mercury in air Mercury in the atmosphere is in three primary forms Gaseous elemental mercury is the most common in anthropogenic and natural emissions to the atmosphere Gaseous oxidized mercury and mercury bound to particulates are less common The transport and deposition of atmospheric mercury depend greatly on whether the mercury is elemental or oxidized Elemental mercury stays in the atmosphere long enough for it to be transported around the world whereas oxidized and particulate mercury are more readily captured in existing pollution control systems or deposited relatively rapidly after their formation As a result most mercury in the air is in the gaseous elemental phase Relatively little elemental mercury is deposited directly but instead must fi rst be oxidized
Although gaseous oxidized mercury is very important in mercury cycling between air and other environmental compartments the process of oxidation in the air is poorly understood with reactions and resulting compounds yet to be verified in observations
When mercury moves from air to water and land it is generally in an oxidized gaseous or particulate form whereas when it is re-emitted to air it has been converted back to gaseous elemental
Particulate associated mercury
Pole
Equator
Gaseous elemental mercury
Global transport
Gaseous elemental mercury can be transported globally Mercury emitted in particulate form tends to deposit closer to sources
mercury Sunlight appears to play a large role in both oxidation and reduction of mercury but temperature and biological interactions are also likely to be involved to some degree Here too much uncertainty remains Nonetheless the reactions are important in determining net deposition and fate of mercury
Monitoring of mercury in air Monitoring of mercury in air focuses on the three primary forms of mercury The measurement of gaseous elemental mercury is routine and robust Measuring gaseous oxidized mercury and particulate-bound mercury however is challenging Concentrations are typically very low and these forms are chemically unstable leading to high uncertainty in the measurements Nonetheless these forms are critical for defining and modelling the fate and transport of airborne mercury
In the past two decades coordinated mercury monitoring networks and long-term monitoring sites have been established in a number of regions measuring mercury concentrations in the air as well as deposition of mercury in precipitation In Europe and North America high-quality continuous monitoring has been going on for more than 15 years especially in the Arctic High-quality monitoring has started more recently in East Asia and South Africa as part of a global effort to expand the coverage provided by long-term monitoring sites
Measurements and trends in atmospheric mercury Monitoring stations around the world have provided information about trends in atmospheric mercury though the time periods vary depending on how long the site has been active Overall a declining trend in background mercury levels over the past decade has been recorded from monitoring stations
19
UNEP Global Mercury Assessment 2013
in many regions Other regions however show an increase in mercury levels
The sites also provide information about geographical patterns reflecting both background levels of
Trends in atmospheric measurements of mercury
Site(s) Period
Mace Head Ireland 1996-2011
North America rural sites 1995-2005
High Arctic sub-Arctic Up to 20 years of records mid-latitudes
Monitoring networks Mercury monitoring in Europe is carried out under the European Monitoring and Evaluation Programme (EMEP) one of the first international environmental measurement networks Heavy metals such as mercury have been included in the EMEP program since 1999 Mercury measurements are available only from northern and northwestern Europe
Three monitoring networks currently operate in North America providing good coverage of Canada and the United States the Mercury Deposition Network the Canadian Air and Precipitation Monitoring Network and the Atmospheric Mercury Network More recently new sites have been established in Mexico extending coverage on the continent The stations monitor atmospheric mercury and mercury in precipitation which has measured since the mid-1990s Monitoring of mercury in the air and in precipitation has been underway in Asia for nearly a decade
Alert Nord
Point Barrow
Nuuk Stoacuterhoumlfethi
Mace Head
mercury and local and regional influences Mercury concentrations at remote sites in Asia are higher than in other regions of the Northern Hemisphere Coastal cities in China have lower levels than inland sites likely due to the influence of relatively clean
Measurement Trend
Gaseous elemental mercury Decrease of 14-18 per year
Total gaseous mercury Decrease of 22 to 174 in total
Total gaseous mercury Decreasing trend at some stations increasing at others
The monitoring network of the Arctic Monitoring and Assessment Programme (AMAP) includes air and deposition monitoring sites located in Arctic regions of Canada Greenland Iceland Norway Russia and Sweden
Building on existing national and regional monitoring networks the European Union-financed project
ldquoGlobal Mercury Observation Systemrdquo (GMOS) started in November 2010 Its goal is to develop a coordinated global system for monitoring mercury including a large network of ground-based monitoring stations New sites are being installed in regions where few monitoring stations exist especially in the Southern Hemisphere Two sites have been established in Antarctica one on the Antarctic Plateau and one on the coast
Ny-Aringlesund
Amderma Pallas
Raringouml Bredkaumllen
Listvyanka Diabla Gora
Mauna Loa
Mt Bachelor
Celestuacuten Calhau
Longobucco
Iskrba Niembro Monte Cimone Cap
Ferrat Mt Waliguan Ganghwa Island
Lulin
Cape Hedo Ev-K2
Mt Changbai
Minamata Mt Ailao
Nieuw Nickerie
Kodiakanal
Maheacute Island Manaus
Bariloche Cape Point
Amsterdam Island Cape Grim
Dumont drsquoUrville
AMAP CAMnet EMEP GMOS GMOS associated NADPAIRMoN NADPMDN
Air + precipitation Air Precipitation
20
UNEP Global Mercury Assessment 2013
John Munthe
The mercury background air monitoring station at Zeppelin mountain Svalbard
air from over the ocean Sites off the Asian coast however show higher levels of gaseous elemental mercury than the Northern Hemisphere background suggesting an outflow from the Asian mainland
Weather patterns have also been found to have a strong influence on seasonal patterns in mercury levels in the air at monitoring sites At the Mount Waliguan Observatory on the Tibetan Plateau for example northeasterly and easterly winds produced the highest levels of mercury
Measurements at high altitudes Measurements from ground-based stations above 2700 meters suggest that there is an inverse relationship between gaseous elemental mercury and gaseous oxidized mercury at these elevations In other words when there is more elemental mercury there is less oxidized mercury and vice versa These measurements are in good agreement with modelling results which gives additional confidence in current understanding of the behaviour of mercury at high altitude
An inverse relationship between total gaseous mercury and particulate concentration has also been observed in the high stratosphere From the transformation rate of total gaseous mercury to particulate-bound mercury it appears that gaseous mercury lasts about two years in the stratosphere
21
UNEP Global Mercury Assessment 2013
Atmospheric concentrations and deposition 6 Measurements and trends of mercury in precipitation Mercury deposited by precipitation decreased from the 1990s into the 2000s at many but not all sites in North America and Western Europe where such measurements were taken
Regional patterns are also evident including slightly higher levels in southern Europe than northern Europe and higher levels in Asia than in North America Total mercury concentrations in precipitation in China were much higher than those in Japan and South Korea Th is was mostly attributed to higher levels of gaseous oxidized mercury and particulate-bound mercury which are readily deposited by precipitation and thus not transported far
A comparison of data from Canadian and American monitoring sites found that deposition of mercury in precipitation was highest in summer
Dry deposition of mercury which is deposition not associated with precipitation is diffi cult to measure and consequently there is little information on trends in mercury dry deposition Th is lack of information means that it is also diffi cult to validate model results for dry deposition
106 44
474 72 91
5 7 71
05 1 5 10 100 500 1000
Total mercury emission (2005) kgcell
Modelled mercury air concentrations and deposition patterns Atmospheric mercury concentrations are highest in major industrial regions Models examining global patterns show that East and South Asia Europe North America and South Africa have the highest levels of elemental mercury in the air Concentrations are generally lower in the Southern Hemisphere than the Northern Hemisphere because most industrial activity is in northern regions Th ese model results are based on simulations using the 2005 global mercury emission inventory because the 2010 inventory has only recently become available
Intercontinental transport of mercury in the air has been examined to determine its impact on regional mercury levels Four models using diff erent parameters produced consistent results Depending on the region mercury emitted by distant sources contributes between 10 and 30 of annual mercury deposition Where local sources are low mercury transported from distant emission sources can account for more than half of the deposition East Asia is the dominant source region adding 10-14 to the deposition in
Contribution from sources outside receptor region
Model 40
GEOS-Chem GLEMOS GRAHM CMAQ-Hg
30
20
10
0 Arctic Europe North East Asia South Asia
America
Receptor region
(Left ) Global distribution of anthropogenic mercury emissions in 2005 with source regions that were considered in the analysis (North America South America Europe Africa Central Asia South Asia East Asia Australia and Oceania) and (right) the contribution of anthropogenic sources outside a particular receptor region to deposition within the receptor region
22
UNEP Global Mercury Assessment 2013
Modelling atmospheric transport and deposition Global models reproduce the movement of mercury in the atmosphere during which the mercury may move between continents They have been effective in examining sources of mercury to the Arctic and also for examining the outflow of pollution from South and Southeast Asia and its impact on western North America as well as the flow from eastern North America to Europe
Regional models on the scale of a continent or a basin such as the Mediterranean can provide more detail about specific source areas even to the level of individual industrial areas Reliable results however require a detailed understanding of mercury oxidation in the atmosphere about which there is considerably uncertainty
Most atmospheric transport models consider the full chain of mercury processes in the atmosphere Some models also consider how mercury is cycled in other atmospheric compartments such as soil vegetation snow freshwater and seawater
One of the largest sources of uncertainty in mercury models is the chemical mechanism used to determine how mercury changes forms in the air Improved experimental data can help improve model performance by making sure that the correct reactions are simulated The processes that lead from deposition to re-emission also need to be understood better Advances in this area show promise with model results becoming closer to estimates based on experimental data
other regions of the world Natural emissions and re-emissions account for 35-70 of total deposition in most regions Deposition is generally greater in low and mid-latitudes due to stronger sunlight higher concentrations of oxidants and higher precipitation
Regional mercury models show patterns at the scales of continents or individual seas The Mediterranean Sea for example is a net source of mercury as it emits more than is deposited to it In that region dry deposition generally exceeds deposition of mercury in precipitation In Central and Southern Europe total gaseous mercury concentrations and deposition in precipitation were both consistently higher than the European average
Across the United States dry deposition accounts for two-thirds of total annual deposition mainly from gaseous oxidized mercury A study examining sources and deposition of mercury to assess the
benefits of proposed emission control measures found that mercury transport from outside the country accounts for 68 of mercury deposition in the Northeast and up to 91 in the west-central United States Large point sources contribute up to three-quarters of nearby deposition and power plants contributed half of the deposition in the eastern part of the country This suggests that new emissions standards would primarily benefit eastern regions of the US
In Asia studies show high seasonal variation in mercury concentration and deposition Anthropogenic emissions are responsible for about 75 of deposition in East Asia In this region there is a net removal of gaseous oxidized mercury from the atmosphere and a net export of gaseous elemental mercury
In the Arctic gaseous elemental mercury levels in the atmosphere are depleted rapidly in spring when after the long Arctic winters sunlight returns Ozone is depleted at the same time and it is believed that bromine-containing compounds are the cause of the photo-chemical reactions that deplete ozone and mercury During these events gaseous oxidized mercury and particulate-bound mercury levels increase sharply suggesting that the gaseous mercury is oxidized and deposited enhancing mercury deposition in Arctic areas in springtime Recent research however has found that 50-80 of the deposited mercury is re-emitted within a few days Similar springtime mercury depletion events have been seen in Antarctica
23
UNEP Global Mercury Assessment 2013
Anthropogenic releases to the aquatic environment 7 Global assessment Previous UNEP global mercury assessments only considered emissions to the atmosphere The 2013 Report presents the first attempt at compiling a global inventory of mercury releases to aquatic environments Releases directly into the aquatic environment present a completely different chemistry set of pathways and fate to those released to air They are also more directly linked to the risks posed by mercury to global environmental and human health Unlike mercury releases to air which are predominantly in the form of gaseous elemental mercury releases to water are predominantly inorganic mercury and to a lesser extent liquid elemental mercury
At present only some sources of aquatic releases can be quantified with any confidence Thus many sources that may be important are not included in this first assessment of global aquatic releases For example land management practices that expose new geological sources of mercury in rocks and mineral soils or that re-mobilize previously deposited mercury cannot yet be assessed Two broad categories of current anthropogenic sources are considered here point sources of mercury release to water and diffuse releases of mercury as a result of its remobilisation from areas where it was previously deposited or accumulated due to human activity (ie contaminated sites) Artisanal and small-scale gold mining (ASGM) mercury-containing pesticides and fungicides used in agriculture and deforestation are considered separately
Point source releases to water from various sectors in tonnes per year with the range of the estimate and as a percentage of total anthropogenic emissions
Sector Releases (range) tonnes
Non-ferrous metal production 925 (193 - 268)
Consumer product waste 894 (222 - 308)
Chlor-alkali production 28 (10 ndash 55)
Oil refining 06 (03 ndash 1)
Grand Total 185 (426 ndash 582)
The global estimate of mercury release to water from point sources has been derived from the atmospheric emissions assessment and the approach employed in the UNEP Toolkit to partition total mercury releases between air land and water This approach has considerable uncertainty and may omit sectors where releases to water are high but air emissions are unimportant and therefore not addressed in the inventory Global releases from point sources were estimated to be 185 tonnes per year
For diffuse sources evaluating the relative contribution of anthropogenic and natural sources to the aquatic environment requires determining considerations of the various mercury inputs For some sectors data exist that allow a preliminary assessment of the amounts of mercury re-mobilized into aquatic systems
For mercury-contaminated sites the range of average soil concentrations of mercury reported for sites where mercury was mined used or otherwise released by human activity was considered The area of contamination is then used to determine how much mercury is available in soils and when combined with a factor for how much mercury is released from those soils in a year the total release can be estimated Among identified contaminated sites mercury mining is identified as the largest sector followed by mining of precious metals Total releases to aquatic environments from contaminated sites are estimated to be 83-335 tonnes per year
Releases to water from contaminated sites in tonnes per year with the range of the estimate
Sector Releases (range) tonnes
Primary mercury mining sites 67 ndash 266
Precious metal production sites 14 ndash 55
Non-ferrous metal production sites 01 ndash 05
Chlor-alkali production sites 01 ndash 05
Other industrial sites 01 ndash 03
Grand Total 83 ndash 335
24
UNEP Global Mercury Assessment 2013
Much of the mercury released from artisanal and small-scale gold mining goes into rivers lakes soils and sediments and tailings From soils and tailings it may be re-mobilized by leaching and erosion In addition mining may disturb mercury-containing soils and sediments that may then erode more quickly releasing more mercury than would otherwise have become available from natural erosion A key factor in these processes is the local hydrological cycle of precipitation evaporation run-off and river flow To account for this in the assessment countries were designated as dry wet or intermediate to determine the relative importance of erosion The tropical and subtropical countries which have the greatest activity in this sector also tend to experience high precipitation and run-off exacerbating this source of mercury release and re-mobilization Total worldwide releases of mercury to land and water from ASGM were estimated at over 800 tonnes per year How much of this is released to water cannot yet be determined
Mercury continues to be used in pesticides and fungicides 2100 tonnes of mercury were released in the decade of the 1960s through such agrochemical uses Current data are unavailable although the use of mercury in these products has been greatly reduced
Deforestation especially in the Amazon Basin can lead to extensive soil erosion and thus the release of mercury previously accumulated in soils Using 2010 figures for deforestation rates around the world and an estimate of soil concentrations of mercury as much as 260 tonnes of mercury may have been released into rivers in 2010 as a result of deforestation worldwide
Because this is the first attempt to quantify global mercury releases to the aquatic environment there is no previous measurement against which these results can be compared Thus it is not possible at this time to evaluate trends in releases
Uncertainties in release estimates Estimating global releases of mercury to aquatic environments is being done here for the first time Many data are missing and others are imprecise A number of assumptions have been made based on what measurements are available or on other grounds to extrapolate from known quantities or to calculate aquatic releases in relation to atmospheric
or other emissions Thus the results should be treated with great caution It is nonetheless clear that anthropogenic sources and human activity contribute hundreds of tonnes of mercury to aquatic environments each year a substantial amount relative to estimated natural releases 150-960 tonnes per year from terrestrial environments
Lapshin Shutterstockcom
Phil Augustavo istockphotocom
Bureau of Land Managem
ent
Contaminated sites (top) erosion following deforestation (middle) and a flooded store of mercury-contaminated waste (lower) illustrate potential sources of mercury releases to water
25
UNEP Global Mercury Assessment 2013
Aquatic pathways transport and fate 8 Mercury in aquatic environments The pathways and fate of mercury in aquatic environments are important because it is in waters sediments and wetland soils that inorganic mercury is converted into methylmercury which is toxic and concentrates in animals The majority of human exposure to mercury and the health risk that comes with mercury exposure is from consumption of marine foods Thus this section focuses on the worldrsquos oceans Some freshwater systems however are important sources of fish for human consumption especially for subsistence and recreational fisheries often among indigenous peoples Artisanal and small-scale gold mining (ASGM) communities may also be affected through fish consumption and drinking water if those are contaminated by local releases
The major processes of mercury cycling are generally similar for all aquatic systems Inorganic mercury in dissolved or particulate form is the dominant mercury type in most marine and fresh waters Dissolved gaseous elemental mercury accounts for less than 30 of total mercury in water Methylmercury is often present at trace levels but may in some settings reach 30 of total mercury In freshwater and coastal environments inorganic mercury is transformed into methylmercury primarily in sediments In the open ocean this conversion takes place largely at intermediate depths between 200 and 1000 meters in the water column Mercury is lost from aquatic systems in two ways When inorganic mercury is reduced to elemental mercury it can be re-emitted to the atmosphere When inorganic mercury binds to particulates in water it can settle out rapidly and be buried in sediments Deep burial in ocean sediments is one of the major pathways by which mercury is removed from the biologically active environment
The global mercury cycle is chemically and physically complex Thus it is necessary to use models to study describe and predict what happens and will happen to mercury in the aquatic environment Until recently only one model existed that incorporated
air land and water into a unified whole The model has been validated against observations of mercury and represents the current scientific consensus The largest potential errors in this model in terms of the aquatic cycle concern details of the exchange of mercury between air and water
Pathways and fate of mercury in the oceans Model simulations suggest that anthropogenic impacts on mercury levels in the ocean are greatest in the surface waters the top 100 meters or so of the water column While model results vary one recent estimate suggests that anthropogenic emissions over the last 100 years have doubled the concentration of mercury in the surface layer of the ocean and increased it by 25 in intermediate waters and by 10 in deep waters The difference is due to the length of time it takes for surface waters to circulate to the depths
Models and measurements agree that direct deposition from the atmosphere is the dominant pathway by which mercury reaches the oceans The exceptions are smaller semi-enclosed basins such as the Mediterranean Sea or the Arctic Ocean where river runoff coastal erosion and ocean currents
Ugo M
ontaldo Shutterstockcom
26
UNEP Global Mercury Assessment 2013
account for about half of mercury inputs The most recent modelling effort suggests that total deposition input of mercury to the oceans in 2008 was 3700 tonnes
Other mercury pathways appear less important on a global basis Rivers are estimated to carry more than 2800 tonnes of mercury each year but only about 380 tonnes of this is transported offshore The rest is trapped by particles in estuaries Groundwater and re-mobilization from sediments provide 100shy800 tonnes of mercury to the oceans each year Undersea hydrothermal vents add less than 600 tonnes of mercury to the oceans There are high concentrations of mercury in vent fluids but a great deal of the mercury is precipitated as solids once the vent fluids enter seawater
Models suggest that globally about 70 of the mercury deposited into the ocean is re-emitted to the atmosphere Oxidized mercury in surface waters is reduced by biological and photochemical processes to the elemental form that is volatile and readily re-emitted The removal of this mercury ultimately reduces the pool of mercury that could be converted to methylmercury and be accumulated by marine organisms The re-emission process thus simultaneously prolongs the lifetime of mercury cycling through the atmosphere and upper ocean and acts to reduce mercury availability for marine food webs
Any changes in the efficiency of mercury reduction in surface waters or the rate of re-emission is likely to impact mercury concentrations in surface waters and the air One example is the effect of sea ice in the Arctic Ocean which blocks the re-emission
Tony Magdaraog Shutterstockcom
Mercury accumulated in marine food-webs can enter the human diet
of elemental mercury leaving elevated levels in waters under ice Changes in primary productivity could change the rate at which mercury is bound to particles thus affecting re-emission to the atmosphere as well as rates of downward transport in the ocean Changes in oxidant levels in the atmosphere such as ozone and bromine may also influence the rate of oxidation of gaseous elemental mercury and thus deposition rates to the ocean
Methylmercury in the ocean Natural bacterial processes in seawater and in sediments in coastal environments convert inorganic mercury to methylmercury Methylmercury levels are highest in the subsurface waters of many oceans because it is formed at these intermediate depths likely as a result of the decomposition of organic material falling from surface waters Current understanding indicates that about 300 tonnes of methylmercury is produced in the upper ocean by this and related processes By contrast only about 80 tonnes of methylmercury reaches the ocean from other sources such as atmospheric deposition rivers and diffusion from sediments
Current modelling indicates that methylmercury stays in the upper ocean for about 11 years Deshymethylation by photochemical reaction or by microbial activity is the major removal process for methylmercury in the ocean About 240 tonnes of methylmercury is removed by this process from the surface waters of the ocean per year
The other important pathway for methylmercury in seawater is uptake into marine food webs Although only about 40 tonnes per year is taken up in this way it is this fraction that poses risks to marine animals and human consumers of seafood Methylmercury is a problem for several reasons First it is taken up by plankton much more efficiently than is inorganic mercury resulting in concentrations in plankton that are as high as 10000 times the concentration in seawater Second methylmercury is absorbed through the intestine of animals much more easily than is inorganic mercury Third methylmercury biomagnifies as it moves up the food web Thus methylmercury becomes an increasingly greater proportion of the mercury in organisms higher in the food web This explains why some indigenous populations that consume top marine predators such as fish seals and whales have some of the worldrsquos highest concentrations of methylmercury giving rise to health concerns
27
UNEP Global Mercury Assessment 2013
Pathways and fate of mercury in freshwater Observations and modelling both show that there are in general many similarities between mercury chemistry pathways and fate in lakes and in the oceans but with obvious differences in scale and in the relative importance of different processes Modelling of mercury dynamics was done for four lakes with a history of direct mercury inputs from the largest freshwater lake in the world (Lake Superior) to small lakes in Ontario Canada Atmospheric deposition and river inflow were the main sources of inorganic mercury Much of the mercury input from lake and river catchments was associated with dissolved and particulate organic matter The dominant mercury removal mechanisms as in saltwater were burial in sediments and photochemical reduction of oxidized mercury to elemental mercury followed by re-emission to the air In Lake Superior and Lake Michigan there is evidence for methylation of mercury in the water column as is seen in the open ocean
Methylmercury levels in freshwater fish vary with the level of deposition of mercury from the air though other factors such as inputs from the watershed and the number of trophic levels within the lakersquos food web are also important Methylation predominantly occurred in lake sediments and wetlands and floodplain soils where sulphateshyreducing bacteria are believed to be primarily responsible Methylmercury is de-methylated in sediments and also taken away in the outlet river from each lake
Some 400-1400 tonnes of mercury are estimated globally to be trapped behind dams and other man-made impoundments each year This has in many cases led to significant increases in total mercury and methylmercury levels in water and of methylmercury in fish and other aquatic species When artificial lakes are created plant material is submerged leading to decay and anoxia In these conditions microbially driven methylation of inorganic mercury takes place In some cases the elevated mercury levels have also been observed downstream from the artificial lakes and reservoirs
Anthropogenic impacts on aquatic mercury levels Two studies have reported that the Atlantic and Pacific Oceans have shown opposing trends over recent decades While the influence of changing ocean currents and other oceanographic factors may be a factor the trends do make sense in light of patterns of anthropogenic emissions In the North Pacific Ocean mercury concentrations appear to have increased at depths between 200 and 1000 meters over the last few decades This increase coincides with the rapid industrialization of East Asia
In the North Atlantic however results from near Bermuda suggest a substantial decrease in mercury concentration and a change in the mercury profile through the water column The Mediterranean Sea too showed a decrease in mercury concentration between 1990 and 2004 These findings are consistent with atmospheric data from around the North Atlantic The conclusion is that mercury levels in seawater in the North Atlantic were elevated by human activity but may now be declining likely as a result of decreased emissions from North America and Europe
A complementary approach to measuring mercury in seawater is to measure mercury in aquatic animals which accumulate and integrate mercury over time Teeth hair feathers and eggshells are useful long-term archives of mercury concentrations and can provide data from the pre-industrial period (ie before 1800) as well as more recent periods
Among marine animals samples are available from several regions particularly from the Arctic where cold dry conditions help preserve animal tissues Mercury concentrations between the 13th and 16th
centuries were relatively stable From the mid- to late 19th century to the end of the 20th century mercury levels increased by an average of 12 times On average therefore about 92 of the mercury in Arctic marine wildlife today is likely to be of anthropogenic origin
Similar findings were found for a 700-year sequence of seabird eggshells from the South China Sea Mercury levels increased steadily between 1800 and 2000 with a particularly rapid increase after 1970 Concentrations since 2000 are about 10 times higher than pre-industrial levels with 91 of the mercury now likely to be of anthropogenic origin In the Antarctic studies of seal hairs show that pre-industrial mercury levels were only 60 of recent levels The relatively small difference
28
UNEP Global Mercury Assessment 2013
Historical Hg concentration as a proportion of present-day 100
80
60
40
20
0
Beluga teeth Human teeth
Gyrfalcon feathers Perigrine falcon feathers
Polar bear hair Ringed seal teeth
1200 1300 1400 1500 1600 1700 1800 1900 2000
between pre-industrial and modern mercury levels in Antarctic is consistent with lower mercury emissions and atmospheric concentrations in the Southern Hemisphere as compared with the Northern Hemisphere
The timing of long-term increases of mercury in aquatic animals can shed light on the likely sources of mercury emissions that were responsible The industrialization of Europe and North America appear responsible for the large increases in marine mercury levels that began in the 19th century as these increases occurred prior to recent Asian industrialization As with water concentrations in the Pacific Ocean recent rapid increases in mercury in seabird eggs in the South China Sea coincide with industrialization in Asia
The time lag in aquatic ecosystem response One important conclusion from air-ocean modeling is that the oceans have not yet reached equilibrium with current atmospheric levels of mercury This lag is due to several factors First mercury stays in the upper ocean above 200 meters depth for about 30 years and for centuries in intermediate and deep waters This is much longer than the one year residence time in the lower atmosphere Thus removal from the ocean takes much longer than does removal from the air and so concentrations will change more slowly
Second because of the long lifetime of mercury in deeper ocean waters a great deal of natural mercury is present in the ocean already about 100000 tonnes out of a total of 135000 tonnes in intermediate waters and 200000 out of 220000 tonnes in deep waters
Rune Dietz
Analysis of museum samples reflects the increase in mercury emissions and releases since the mid-19th century associated with anthropogenic activities
Third vertical transport of mercury from intermediate depths back to the surface returns a substantial amount of mercury to the biologically active zone each year As a result average mercury concentrations in seawater and marine animals are likely to increase slowly for decades if not centuries even if atmospheric levels stabilize at present levels In short the effects of historical anthropogenic emissions from Europe and North America are still being observed in the oceans at the same time that the effects of the recent rise in emissions from Asia are being seen
Regionally different trends can be expected depending on distance from sources and ocean circulation patterns In the North Atlantic north of 55deg N it will take 50-600 years to achieve equilibrium between atmospheric and seawater mercury levels In the North Pacific this process is estimated to take 500-700 years and in the Antarctic 700-1000 years The Arctic Ocean by contrast is smaller and will only take about 35 years to reflect changes in atmospheric mercury levels Surface waters of the Mediterranean Sea should show also changes within 10-50 years
Time lags in the responses of many freshwaters and their food-webs to changes in atmospheric mercury levels are also expected Although some immediate recovery following reductions in atmospheric mercury deposition rates is likely full recovery may take decades centuries or longer depending on the characteristics of the area Highly polluted freshwaters with catchments and sediments containing large amounts of anthropogenic mercury will recover most slowly as is already observed around point sources such as smelters that have closed down
29
UNEP Global Mercury Assessment 2013
Major gaps in knowledge 9 Large uncertainties remain in global estimates of mercury emissions to the air These stem from various sources including the availability of information on activity levels but mainly from the lack of information concerning the mercury content of some raw materials and the validity of assumptions regarding processes and technologies employed to reduce mercury emissions including their rates of application and effectiveness The accuracy and precision of measurement-based estimates can depend on the validity of extrapolating measurements made at infrequent intervals to longer periods or measurements made at one plant to other facilities with similar operations
Potentially important emissions sectors that are still not quantified in the emissions inventory include the use of mercury in vinyl-chloride monomer production secondary metals production oil and gas extraction transport and processing industrial and hazardous waste incineration and disposal sewage sludge incineration and dental fillings preparation and removal
Current measurements and their evaluation are inadequate for determining spatial and temporal trends Improved more extensive and better coordinated measurements are needed A permanent global integrated monitoring network for atmospheric mercury and mercury deposition is needed to achieve this goal The atmospheric network sites should be closely integrated with water soil and biological monitoring networks The results can be used for model testing and evaluation as well as for more accurately detailing the geographic impact of anthropogenic emissions Monitoring of mercury concentrations in the important marine food species is essential to understanding possible human health impacts and the effects of future emissions changes
Better data on mercury distribution in the troposphere is needed to improve understanding of long-range transport and source-receptor relationships Coordinated studies at high altitudes and by aircraft are needed This information will
also help validate regional and global scale models improving their prediction capabilities with regard to different policy scenarios
Key processes related to global transport and cycling of mercury remain inadequately understood The chemical form of gaseous oxidized mercury is unknown Reduction and oxidation rates for mercury in the presence of atmospheric oxidants need further study including determining which oxidants are important New measurements and modelling studies are needed to examine key chemical and physical processes that affect global transport and cycling
Few data are available for reporting mercury releases to aquatic systems Systematic and consistent monitoring of mercury releases to the air is required especially for contaminated systems Releases of mercury from soils into waters depend greatly on climate and topography and these parameters need to be better accounted for Consistent approaches for measuring and reporting releases from point sources are needed to ensure comparability of data from around the world In particular the actual role of artisanal and small-scale gold mining (ASGM) in emissions to air and releases to water needs to be more accurately estimated
The link between mercury deposition methylation and uptake by living organisms needs further study The parameters that determine the rates of exchange of mercury compounds between air and sea air and soil and air and vegetation are not fully understood Whole-ecosystem studies of mercury are needed to better understand biogeochemical cycling Methylationdemethylation rates and their spatial and temporal variations and relationship to climatic factors need to be determined in most of worldrsquos major ocean basins as well as in representative freshwaters
30
UNEP Global Mercury Assessment 2013
Key findings of the 2013 assessment 10 Atmosphere Total anthropogenic emissions of mercury to the atmosphere in 2010 are estimated at 1960 (1010shy4070) tonnes which is about 30 of the total mercury that was emitted and re-emitted from anthropogenic and natural sources in that year The largest anthropogenic sources are associated with artisanal and small-scale gold mining (ASGM) and coal burning which together account for about 62 of the annual total anthropogenic emissions to air Other major sectors include ferrous and non-ferrous metal production and cement production
East and Southeast Asia are responsible for about 40 of global anthropogenic emissions About 75 of the mercury from this region comes from China which is about one-third of the global total Increased estimates for emissions from ASGM largely a result of newly obtained data and improved information mean that South America and Sub-Saharan Africa are also responsible for a greater proportion of global emissions than was previously assumed
Anthropogenic emissions over time have increased mercury loads present in the environment This leads to higher rates of re-emission and also means that there will be a time lag of years or decades between emissions reductions and lower mercury levels in the food web including pathways of human exposure
Mercury emissions to the atmosphere likely peaked in the 1950s to 1970s and subsequently declined because of reductions in Europe Russia and North America Emission trends are unclear due to changes in methods employed to produce inventories and differences in the sectors that have been accounted at different times There are however some indications that emissions may be rising again with increases from East Asia offsetting continuing reductions in Europe and North America
Aquatic environments Natural processes in aquatic systems convert less toxic elemental and inorganic mercury into much more toxic methylmercury Methylmercury concentrates and accumulates in the food web leading to high concentrations in some species of seafood and fish that many people eat
Anthropogenic releases of mercury to aquatic environments contribute hundreds of tonnes to the amount of mercury cycling in the environment Diffuse releases and point sources appear equally important Atmospheric deposition however remains the most important input of mercury to land and oceans and has increased the amount of mercury in many environmental compartments by a factor of two or three since the start of the industrial age On land mercury that is deposited is largely retained in soils and vegetation increasing the available pool for re-mobilisation to adjacent aquatic systems Re-emission from soils however is a major addition to atmospheric mercury
Hydrology is the most important factor in the transport of mercury from catchments to downstream environments Relatively little of this mercury reaches the open ocean as most is captured in sediments behind dams in estuaries and near the coast Changes in land cover and land use can have a large effect on mercury mobilisation as exposed soils erode and mercury leaches into the water table
Concentrations of mercury in Arctic marine animals today are about 10-12 times higher than in preshyindustrial times (ie prior to about 1800) This means that on average about 92 of the mercury in marine predators such as seabirds seals and whales is anthropogenic in origin The timing of the increase suggest that 19th and early 20th century emissions from Europe North America and Russia were responsible Increases mercury concentrations in seabirds in the South China Sea appear to be more recent than the Arctic increases coinciding with increasing industrialisation in East and Southeast Asia
31
UNEP Global Mercury Assessment 2013
K+S Entsorgung Gm
bH
Recovered mercury is being stockpiled at long-term storage sites above- and as shown here below ground
The upper 100 meters of the oceans have twice the mercury that they did a century ago Intermediate and deeper waters have 10-25 more mercury on average reflecting the slow transport of mercury downwards in the oceans Seawater concentrations will thus be especially slow in responding to changes in mercury inputs from atmospheric deposition and river flow As a result mercury concentrations in marine biota are likely to increase slowly for decades to centuries even without an increase in atmospheric emissions
In freshwater ecosystems atmospheric deposition and re-mobilisation from soils slow the reduction of mercury levels even in regions where atmospheric concentrations have decreased due to emission controls
Further increases in atmospheric emissions will have long-term consequences for commercial fisheries and all consumers of marine and freshwater foods
It is likely to be years or decades before reductions in anthropogenic emissions and releases of mercury have a demonstrable effect on mercury levels throughout the environment and in the fish and marine mammals which are part of the human food-chain This only reinforces the need to act now to continue and strengthen international efforts to reduce current mercury emissions and releases Delays in action now will inevitably lead to slower recovery of the worldrsquos ecosystems in future from mercury contamination leaving an even greater legacy of pollution for future generations
32
Division of Technology Industry and Economics (DTIE) Chemicals Branch Geneva Switzerland January 2013
Job number DTI1636GE
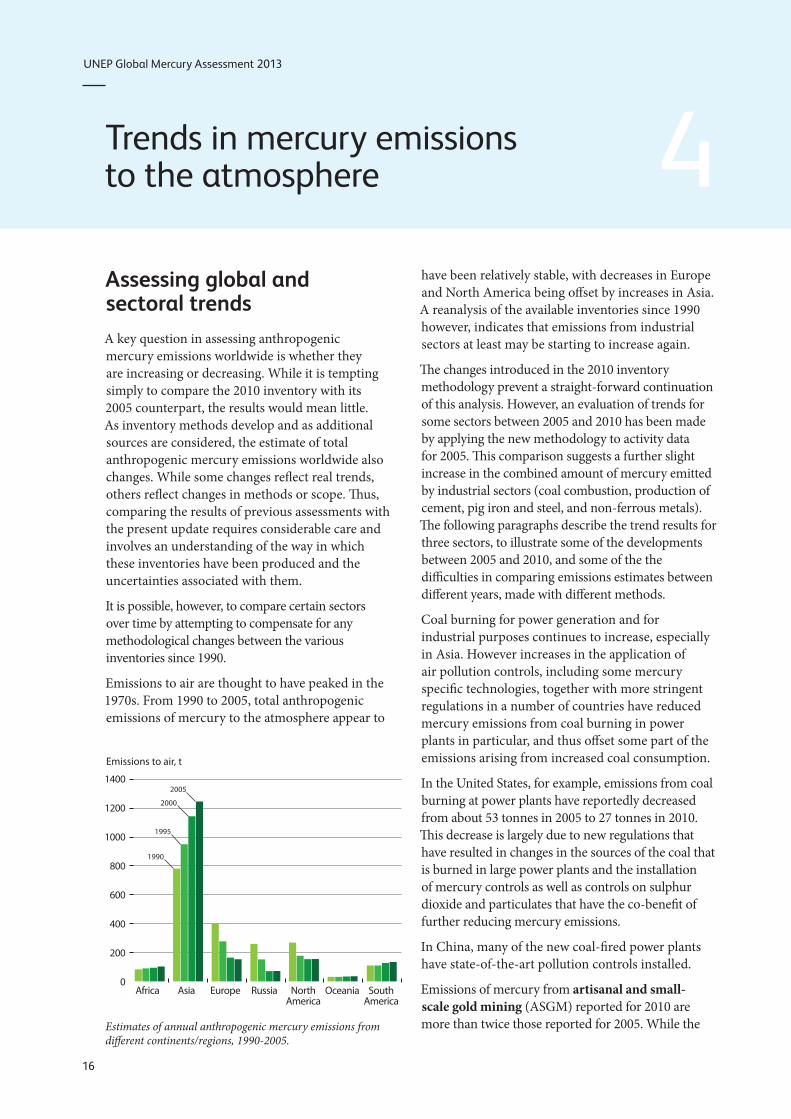
UNEP Global Mercury Assessment 2013
Trends in mercury emissions to the atmosphere 4 Assessing global and sectoral trends A key question in assessing anthropogenic mercury emissions worldwide is whether they are increasing or decreasing While it is tempting simply to compare the 2010 inventory with its 2005 counterpart the results would mean little As inventory methods develop and as additional sources are considered the estimate of total anthropogenic mercury emissions worldwide also changes While some changes reflect real trends others reflect changes in methods or scope Thus comparing the results of previous assessments with the present update requires considerable care and involves an understanding of the way in which these inventories have been produced and the uncertainties associated with them
It is possible however to compare certain sectors over time by attempting to compensate for any methodological changes between the various inventories since 1990
Emissions to air are thought to have peaked in the 1970s From 1990 to 2005 total anthropogenic emissions of mercury to the atmosphere appear to
Emissions to air t
1400
1200
1000
800
600
400
200
0
1990
1995
2000
2005
Africa Asia Europe Russia North Oceania South America America
Estimates of annual anthropogenic mercury emissions from different continentsregions 1990-2005
have been relatively stable with decreases in Europe and North America being offset by increases in Asia A reanalysis of the available inventories since 1990 however indicates that emissions from industrial sectors at least may be starting to increase again
The changes introduced in the 2010 inventory methodology prevent a straight-forward continuation of this analysis However an evaluation of trends for some sectors between 2005 and 2010 has been made by applying the new methodology to activity data for 2005 This comparison suggests a further slight increase in the combined amount of mercury emitted by industrial sectors (coal combustion production of cement pig iron and steel and non-ferrous metals) The following paragraphs describe the trend results for three sectors to illustrate some of the developments between 2005 and 2010 and some of the the difficulties in comparing emissions estimates between different years made with different methods
Coal burning for power generation and for industrial purposes continues to increase especially in Asia However increases in the application of air pollution controls including some mercury specific technologies together with more stringent regulations in a number of countries have reduced mercury emissions from coal burning in power plants in particular and thus offset some part of the emissions arising from increased coal consumption
In the United States for example emissions from coal burning at power plants have reportedly decreased from about 53 tonnes in 2005 to 27 tonnes in 2010 This decrease is largely due to new regulations that have resulted in changes in the sources of the coal that is burned in large power plants and the installation of mercury controls as well as controls on sulphur dioxide and particulates that have the co-benefit of further reducing mercury emissions
In China many of the new coal-fired power plants have state-of-the-art pollution controls installed
Emissions of mercury from artisanal and small-scale gold mining (ASGM) reported for 2010 are more than twice those reported for 2005 While the
16
UNEP Global Mercury Assessment 2013
Unintentional emission sectors Coal burning ferrous- and non-ferrous (Au Cu Hg Pb Zn) metal production cement production Intentional-use sectors Disposal and incineration of product waste cremation emissions chlor-alkali industry
Comparison of emissions in 2005 and 2010 by selected sector and region
Unintentional emission sectors
Emission t
1000
800
600
400
200
0 2005 2010
Australia New Zealand amp Oceania
Central America and the Caribbean
CIS amp other European countries
East and Southeast Asia
rise in the price of gold (from USD 400 per ounce in 2005 to USD 1100 per ounce in 2010) along with increased rural poverty may indeed have caused more activity in this sector the increased estimate for mercury emissions is considered to be due primarily to some more and better data from many countries and regions West Africa for example was regarded as having minimal ASGM in 2005 but is now recognized as a region with considerable activity Thus the baseline has improved without necessarily any change in actual activity or emission levels
Waste from consumer products is affected by the amount of mercury used For most products in which mercury is used mercury-free alternatives exist Consequently many of these uses of mercury are declining at least in some regions as alternative products or processes are adopted Compact fluorescent light bulbs are an exception Even though the mercury content of individual light bulbs has decreased use of this type of light bulb is increasing rapidly
Artisanal and small-scale gold mining Intentional-use sectors
1000 1000
Step change from 2005 to 2010 due to new information 800 800 (under-estimation in 2005)
600 600
400 400
200 200
0 0 2005 2010 2005 2010
European Union (EU27) South America
Middle Eastern States South Asia
North Africa Sub-Saharan Africa
North America
In order to make valid assessments of trends in emissions from global inventories comparable data on activity levels are required together with information on changes in fuel and raw material characteristics and applied air pollution control technology One aim of the 2010 inventory methods is to create a firmer foundation for such future trend analysis
Ralf Siemieniec Shutterstockcom
Use of mercury-containing energy-saving lamps is increasing
17
UNEP Global Mercury Assessment 2013
Emission scenarios and future trends The 2008 Global Atmospheric Mercury Assessment included a first attempt at projecting future emissions inventories These were based on three scenarios continuing with the status quo applying current emissions controls worldwide and achieving maximum feasible technological reductions At the time this effort was regarded as highly provisional Since then additional studies have extended and improved this work but the results are not markedly different from earlier projections of future mercury emissions
Global mercury models have been used to evaluate future scenarios Four global and hemispheric models projected mercury levels around the world in 2020 based on the three emission scenarios described earlier In industrial regions the status quo will cause an increase in mercury levels of 2-25 and in remote areas of 15-5 The two emission control scenarios on the other hand yield a decrease in mercury in industrial areas of 25-35 and in remote areas of 15-20
Another global model was coupled with estimates of surface reservoirs of mercury in order to quantify source-receptor relationships for the present and for 2050 Under the best-case scenario of maximum feasible reductions projected estimates for deposition in 2050 is similar to estimates for today In the other scenarios increasing emissions lead to increasing deposition A greater proportion of mercury emissions is expected to be in the oxidized form so that a greater proportion will be deposited near the source instead of being transported far away
The model results support the conclusion that reducing anthropogenic emissions will slowly reduce the amount of mercury in biologically available reservoirs Over time mercury in the environment will be taken out of circulation by natural processes for example from ocean waters down into sediments and biologically available mercury will decrease Increased emissions on the other hand will continue to build up the amount of mercury in circulation
With new databases and methods it may soon be possible to create scenarios that incorporate activity levels as well as technology use for each country If this were done it would allow countries to assess the effects of different mercury reduction strategies on their national emissions For example a country could determine the relative contributions of emission reduction technology as opposed to for example changes in raw materials
18
UNEP Global Mercury Assessment 2013
Atmospheric chemistry monitoring and trends 5 Forms of mercury in air Mercury in the atmosphere is in three primary forms Gaseous elemental mercury is the most common in anthropogenic and natural emissions to the atmosphere Gaseous oxidized mercury and mercury bound to particulates are less common The transport and deposition of atmospheric mercury depend greatly on whether the mercury is elemental or oxidized Elemental mercury stays in the atmosphere long enough for it to be transported around the world whereas oxidized and particulate mercury are more readily captured in existing pollution control systems or deposited relatively rapidly after their formation As a result most mercury in the air is in the gaseous elemental phase Relatively little elemental mercury is deposited directly but instead must fi rst be oxidized
Although gaseous oxidized mercury is very important in mercury cycling between air and other environmental compartments the process of oxidation in the air is poorly understood with reactions and resulting compounds yet to be verified in observations
When mercury moves from air to water and land it is generally in an oxidized gaseous or particulate form whereas when it is re-emitted to air it has been converted back to gaseous elemental
Particulate associated mercury
Pole
Equator
Gaseous elemental mercury
Global transport
Gaseous elemental mercury can be transported globally Mercury emitted in particulate form tends to deposit closer to sources
mercury Sunlight appears to play a large role in both oxidation and reduction of mercury but temperature and biological interactions are also likely to be involved to some degree Here too much uncertainty remains Nonetheless the reactions are important in determining net deposition and fate of mercury
Monitoring of mercury in air Monitoring of mercury in air focuses on the three primary forms of mercury The measurement of gaseous elemental mercury is routine and robust Measuring gaseous oxidized mercury and particulate-bound mercury however is challenging Concentrations are typically very low and these forms are chemically unstable leading to high uncertainty in the measurements Nonetheless these forms are critical for defining and modelling the fate and transport of airborne mercury
In the past two decades coordinated mercury monitoring networks and long-term monitoring sites have been established in a number of regions measuring mercury concentrations in the air as well as deposition of mercury in precipitation In Europe and North America high-quality continuous monitoring has been going on for more than 15 years especially in the Arctic High-quality monitoring has started more recently in East Asia and South Africa as part of a global effort to expand the coverage provided by long-term monitoring sites
Measurements and trends in atmospheric mercury Monitoring stations around the world have provided information about trends in atmospheric mercury though the time periods vary depending on how long the site has been active Overall a declining trend in background mercury levels over the past decade has been recorded from monitoring stations
19
UNEP Global Mercury Assessment 2013
in many regions Other regions however show an increase in mercury levels
The sites also provide information about geographical patterns reflecting both background levels of
Trends in atmospheric measurements of mercury
Site(s) Period
Mace Head Ireland 1996-2011
North America rural sites 1995-2005
High Arctic sub-Arctic Up to 20 years of records mid-latitudes
Monitoring networks Mercury monitoring in Europe is carried out under the European Monitoring and Evaluation Programme (EMEP) one of the first international environmental measurement networks Heavy metals such as mercury have been included in the EMEP program since 1999 Mercury measurements are available only from northern and northwestern Europe
Three monitoring networks currently operate in North America providing good coverage of Canada and the United States the Mercury Deposition Network the Canadian Air and Precipitation Monitoring Network and the Atmospheric Mercury Network More recently new sites have been established in Mexico extending coverage on the continent The stations monitor atmospheric mercury and mercury in precipitation which has measured since the mid-1990s Monitoring of mercury in the air and in precipitation has been underway in Asia for nearly a decade
Alert Nord
Point Barrow
Nuuk Stoacuterhoumlfethi
Mace Head
mercury and local and regional influences Mercury concentrations at remote sites in Asia are higher than in other regions of the Northern Hemisphere Coastal cities in China have lower levels than inland sites likely due to the influence of relatively clean
Measurement Trend
Gaseous elemental mercury Decrease of 14-18 per year
Total gaseous mercury Decrease of 22 to 174 in total
Total gaseous mercury Decreasing trend at some stations increasing at others
The monitoring network of the Arctic Monitoring and Assessment Programme (AMAP) includes air and deposition monitoring sites located in Arctic regions of Canada Greenland Iceland Norway Russia and Sweden
Building on existing national and regional monitoring networks the European Union-financed project
ldquoGlobal Mercury Observation Systemrdquo (GMOS) started in November 2010 Its goal is to develop a coordinated global system for monitoring mercury including a large network of ground-based monitoring stations New sites are being installed in regions where few monitoring stations exist especially in the Southern Hemisphere Two sites have been established in Antarctica one on the Antarctic Plateau and one on the coast
Ny-Aringlesund
Amderma Pallas
Raringouml Bredkaumllen
Listvyanka Diabla Gora
Mauna Loa
Mt Bachelor
Celestuacuten Calhau
Longobucco
Iskrba Niembro Monte Cimone Cap
Ferrat Mt Waliguan Ganghwa Island
Lulin
Cape Hedo Ev-K2
Mt Changbai
Minamata Mt Ailao
Nieuw Nickerie
Kodiakanal
Maheacute Island Manaus
Bariloche Cape Point
Amsterdam Island Cape Grim
Dumont drsquoUrville
AMAP CAMnet EMEP GMOS GMOS associated NADPAIRMoN NADPMDN
Air + precipitation Air Precipitation
20
UNEP Global Mercury Assessment 2013
John Munthe
The mercury background air monitoring station at Zeppelin mountain Svalbard
air from over the ocean Sites off the Asian coast however show higher levels of gaseous elemental mercury than the Northern Hemisphere background suggesting an outflow from the Asian mainland
Weather patterns have also been found to have a strong influence on seasonal patterns in mercury levels in the air at monitoring sites At the Mount Waliguan Observatory on the Tibetan Plateau for example northeasterly and easterly winds produced the highest levels of mercury
Measurements at high altitudes Measurements from ground-based stations above 2700 meters suggest that there is an inverse relationship between gaseous elemental mercury and gaseous oxidized mercury at these elevations In other words when there is more elemental mercury there is less oxidized mercury and vice versa These measurements are in good agreement with modelling results which gives additional confidence in current understanding of the behaviour of mercury at high altitude
An inverse relationship between total gaseous mercury and particulate concentration has also been observed in the high stratosphere From the transformation rate of total gaseous mercury to particulate-bound mercury it appears that gaseous mercury lasts about two years in the stratosphere
21
UNEP Global Mercury Assessment 2013
Atmospheric concentrations and deposition 6 Measurements and trends of mercury in precipitation Mercury deposited by precipitation decreased from the 1990s into the 2000s at many but not all sites in North America and Western Europe where such measurements were taken
Regional patterns are also evident including slightly higher levels in southern Europe than northern Europe and higher levels in Asia than in North America Total mercury concentrations in precipitation in China were much higher than those in Japan and South Korea Th is was mostly attributed to higher levels of gaseous oxidized mercury and particulate-bound mercury which are readily deposited by precipitation and thus not transported far
A comparison of data from Canadian and American monitoring sites found that deposition of mercury in precipitation was highest in summer
Dry deposition of mercury which is deposition not associated with precipitation is diffi cult to measure and consequently there is little information on trends in mercury dry deposition Th is lack of information means that it is also diffi cult to validate model results for dry deposition
106 44
474 72 91
5 7 71
05 1 5 10 100 500 1000
Total mercury emission (2005) kgcell
Modelled mercury air concentrations and deposition patterns Atmospheric mercury concentrations are highest in major industrial regions Models examining global patterns show that East and South Asia Europe North America and South Africa have the highest levels of elemental mercury in the air Concentrations are generally lower in the Southern Hemisphere than the Northern Hemisphere because most industrial activity is in northern regions Th ese model results are based on simulations using the 2005 global mercury emission inventory because the 2010 inventory has only recently become available
Intercontinental transport of mercury in the air has been examined to determine its impact on regional mercury levels Four models using diff erent parameters produced consistent results Depending on the region mercury emitted by distant sources contributes between 10 and 30 of annual mercury deposition Where local sources are low mercury transported from distant emission sources can account for more than half of the deposition East Asia is the dominant source region adding 10-14 to the deposition in
Contribution from sources outside receptor region
Model 40
GEOS-Chem GLEMOS GRAHM CMAQ-Hg
30
20
10
0 Arctic Europe North East Asia South Asia
America
Receptor region
(Left ) Global distribution of anthropogenic mercury emissions in 2005 with source regions that were considered in the analysis (North America South America Europe Africa Central Asia South Asia East Asia Australia and Oceania) and (right) the contribution of anthropogenic sources outside a particular receptor region to deposition within the receptor region
22
UNEP Global Mercury Assessment 2013
Modelling atmospheric transport and deposition Global models reproduce the movement of mercury in the atmosphere during which the mercury may move between continents They have been effective in examining sources of mercury to the Arctic and also for examining the outflow of pollution from South and Southeast Asia and its impact on western North America as well as the flow from eastern North America to Europe
Regional models on the scale of a continent or a basin such as the Mediterranean can provide more detail about specific source areas even to the level of individual industrial areas Reliable results however require a detailed understanding of mercury oxidation in the atmosphere about which there is considerably uncertainty
Most atmospheric transport models consider the full chain of mercury processes in the atmosphere Some models also consider how mercury is cycled in other atmospheric compartments such as soil vegetation snow freshwater and seawater
One of the largest sources of uncertainty in mercury models is the chemical mechanism used to determine how mercury changes forms in the air Improved experimental data can help improve model performance by making sure that the correct reactions are simulated The processes that lead from deposition to re-emission also need to be understood better Advances in this area show promise with model results becoming closer to estimates based on experimental data
other regions of the world Natural emissions and re-emissions account for 35-70 of total deposition in most regions Deposition is generally greater in low and mid-latitudes due to stronger sunlight higher concentrations of oxidants and higher precipitation
Regional mercury models show patterns at the scales of continents or individual seas The Mediterranean Sea for example is a net source of mercury as it emits more than is deposited to it In that region dry deposition generally exceeds deposition of mercury in precipitation In Central and Southern Europe total gaseous mercury concentrations and deposition in precipitation were both consistently higher than the European average
Across the United States dry deposition accounts for two-thirds of total annual deposition mainly from gaseous oxidized mercury A study examining sources and deposition of mercury to assess the
benefits of proposed emission control measures found that mercury transport from outside the country accounts for 68 of mercury deposition in the Northeast and up to 91 in the west-central United States Large point sources contribute up to three-quarters of nearby deposition and power plants contributed half of the deposition in the eastern part of the country This suggests that new emissions standards would primarily benefit eastern regions of the US
In Asia studies show high seasonal variation in mercury concentration and deposition Anthropogenic emissions are responsible for about 75 of deposition in East Asia In this region there is a net removal of gaseous oxidized mercury from the atmosphere and a net export of gaseous elemental mercury
In the Arctic gaseous elemental mercury levels in the atmosphere are depleted rapidly in spring when after the long Arctic winters sunlight returns Ozone is depleted at the same time and it is believed that bromine-containing compounds are the cause of the photo-chemical reactions that deplete ozone and mercury During these events gaseous oxidized mercury and particulate-bound mercury levels increase sharply suggesting that the gaseous mercury is oxidized and deposited enhancing mercury deposition in Arctic areas in springtime Recent research however has found that 50-80 of the deposited mercury is re-emitted within a few days Similar springtime mercury depletion events have been seen in Antarctica
23
UNEP Global Mercury Assessment 2013
Anthropogenic releases to the aquatic environment 7 Global assessment Previous UNEP global mercury assessments only considered emissions to the atmosphere The 2013 Report presents the first attempt at compiling a global inventory of mercury releases to aquatic environments Releases directly into the aquatic environment present a completely different chemistry set of pathways and fate to those released to air They are also more directly linked to the risks posed by mercury to global environmental and human health Unlike mercury releases to air which are predominantly in the form of gaseous elemental mercury releases to water are predominantly inorganic mercury and to a lesser extent liquid elemental mercury
At present only some sources of aquatic releases can be quantified with any confidence Thus many sources that may be important are not included in this first assessment of global aquatic releases For example land management practices that expose new geological sources of mercury in rocks and mineral soils or that re-mobilize previously deposited mercury cannot yet be assessed Two broad categories of current anthropogenic sources are considered here point sources of mercury release to water and diffuse releases of mercury as a result of its remobilisation from areas where it was previously deposited or accumulated due to human activity (ie contaminated sites) Artisanal and small-scale gold mining (ASGM) mercury-containing pesticides and fungicides used in agriculture and deforestation are considered separately
Point source releases to water from various sectors in tonnes per year with the range of the estimate and as a percentage of total anthropogenic emissions
Sector Releases (range) tonnes
Non-ferrous metal production 925 (193 - 268)
Consumer product waste 894 (222 - 308)
Chlor-alkali production 28 (10 ndash 55)
Oil refining 06 (03 ndash 1)
Grand Total 185 (426 ndash 582)
The global estimate of mercury release to water from point sources has been derived from the atmospheric emissions assessment and the approach employed in the UNEP Toolkit to partition total mercury releases between air land and water This approach has considerable uncertainty and may omit sectors where releases to water are high but air emissions are unimportant and therefore not addressed in the inventory Global releases from point sources were estimated to be 185 tonnes per year
For diffuse sources evaluating the relative contribution of anthropogenic and natural sources to the aquatic environment requires determining considerations of the various mercury inputs For some sectors data exist that allow a preliminary assessment of the amounts of mercury re-mobilized into aquatic systems
For mercury-contaminated sites the range of average soil concentrations of mercury reported for sites where mercury was mined used or otherwise released by human activity was considered The area of contamination is then used to determine how much mercury is available in soils and when combined with a factor for how much mercury is released from those soils in a year the total release can be estimated Among identified contaminated sites mercury mining is identified as the largest sector followed by mining of precious metals Total releases to aquatic environments from contaminated sites are estimated to be 83-335 tonnes per year
Releases to water from contaminated sites in tonnes per year with the range of the estimate
Sector Releases (range) tonnes
Primary mercury mining sites 67 ndash 266
Precious metal production sites 14 ndash 55
Non-ferrous metal production sites 01 ndash 05
Chlor-alkali production sites 01 ndash 05
Other industrial sites 01 ndash 03
Grand Total 83 ndash 335
24
UNEP Global Mercury Assessment 2013
Much of the mercury released from artisanal and small-scale gold mining goes into rivers lakes soils and sediments and tailings From soils and tailings it may be re-mobilized by leaching and erosion In addition mining may disturb mercury-containing soils and sediments that may then erode more quickly releasing more mercury than would otherwise have become available from natural erosion A key factor in these processes is the local hydrological cycle of precipitation evaporation run-off and river flow To account for this in the assessment countries were designated as dry wet or intermediate to determine the relative importance of erosion The tropical and subtropical countries which have the greatest activity in this sector also tend to experience high precipitation and run-off exacerbating this source of mercury release and re-mobilization Total worldwide releases of mercury to land and water from ASGM were estimated at over 800 tonnes per year How much of this is released to water cannot yet be determined
Mercury continues to be used in pesticides and fungicides 2100 tonnes of mercury were released in the decade of the 1960s through such agrochemical uses Current data are unavailable although the use of mercury in these products has been greatly reduced
Deforestation especially in the Amazon Basin can lead to extensive soil erosion and thus the release of mercury previously accumulated in soils Using 2010 figures for deforestation rates around the world and an estimate of soil concentrations of mercury as much as 260 tonnes of mercury may have been released into rivers in 2010 as a result of deforestation worldwide
Because this is the first attempt to quantify global mercury releases to the aquatic environment there is no previous measurement against which these results can be compared Thus it is not possible at this time to evaluate trends in releases
Uncertainties in release estimates Estimating global releases of mercury to aquatic environments is being done here for the first time Many data are missing and others are imprecise A number of assumptions have been made based on what measurements are available or on other grounds to extrapolate from known quantities or to calculate aquatic releases in relation to atmospheric
or other emissions Thus the results should be treated with great caution It is nonetheless clear that anthropogenic sources and human activity contribute hundreds of tonnes of mercury to aquatic environments each year a substantial amount relative to estimated natural releases 150-960 tonnes per year from terrestrial environments
Lapshin Shutterstockcom
Phil Augustavo istockphotocom
Bureau of Land Managem
ent
Contaminated sites (top) erosion following deforestation (middle) and a flooded store of mercury-contaminated waste (lower) illustrate potential sources of mercury releases to water
25
UNEP Global Mercury Assessment 2013
Aquatic pathways transport and fate 8 Mercury in aquatic environments The pathways and fate of mercury in aquatic environments are important because it is in waters sediments and wetland soils that inorganic mercury is converted into methylmercury which is toxic and concentrates in animals The majority of human exposure to mercury and the health risk that comes with mercury exposure is from consumption of marine foods Thus this section focuses on the worldrsquos oceans Some freshwater systems however are important sources of fish for human consumption especially for subsistence and recreational fisheries often among indigenous peoples Artisanal and small-scale gold mining (ASGM) communities may also be affected through fish consumption and drinking water if those are contaminated by local releases
The major processes of mercury cycling are generally similar for all aquatic systems Inorganic mercury in dissolved or particulate form is the dominant mercury type in most marine and fresh waters Dissolved gaseous elemental mercury accounts for less than 30 of total mercury in water Methylmercury is often present at trace levels but may in some settings reach 30 of total mercury In freshwater and coastal environments inorganic mercury is transformed into methylmercury primarily in sediments In the open ocean this conversion takes place largely at intermediate depths between 200 and 1000 meters in the water column Mercury is lost from aquatic systems in two ways When inorganic mercury is reduced to elemental mercury it can be re-emitted to the atmosphere When inorganic mercury binds to particulates in water it can settle out rapidly and be buried in sediments Deep burial in ocean sediments is one of the major pathways by which mercury is removed from the biologically active environment
The global mercury cycle is chemically and physically complex Thus it is necessary to use models to study describe and predict what happens and will happen to mercury in the aquatic environment Until recently only one model existed that incorporated
air land and water into a unified whole The model has been validated against observations of mercury and represents the current scientific consensus The largest potential errors in this model in terms of the aquatic cycle concern details of the exchange of mercury between air and water
Pathways and fate of mercury in the oceans Model simulations suggest that anthropogenic impacts on mercury levels in the ocean are greatest in the surface waters the top 100 meters or so of the water column While model results vary one recent estimate suggests that anthropogenic emissions over the last 100 years have doubled the concentration of mercury in the surface layer of the ocean and increased it by 25 in intermediate waters and by 10 in deep waters The difference is due to the length of time it takes for surface waters to circulate to the depths
Models and measurements agree that direct deposition from the atmosphere is the dominant pathway by which mercury reaches the oceans The exceptions are smaller semi-enclosed basins such as the Mediterranean Sea or the Arctic Ocean where river runoff coastal erosion and ocean currents
Ugo M
ontaldo Shutterstockcom
26
UNEP Global Mercury Assessment 2013
account for about half of mercury inputs The most recent modelling effort suggests that total deposition input of mercury to the oceans in 2008 was 3700 tonnes
Other mercury pathways appear less important on a global basis Rivers are estimated to carry more than 2800 tonnes of mercury each year but only about 380 tonnes of this is transported offshore The rest is trapped by particles in estuaries Groundwater and re-mobilization from sediments provide 100shy800 tonnes of mercury to the oceans each year Undersea hydrothermal vents add less than 600 tonnes of mercury to the oceans There are high concentrations of mercury in vent fluids but a great deal of the mercury is precipitated as solids once the vent fluids enter seawater
Models suggest that globally about 70 of the mercury deposited into the ocean is re-emitted to the atmosphere Oxidized mercury in surface waters is reduced by biological and photochemical processes to the elemental form that is volatile and readily re-emitted The removal of this mercury ultimately reduces the pool of mercury that could be converted to methylmercury and be accumulated by marine organisms The re-emission process thus simultaneously prolongs the lifetime of mercury cycling through the atmosphere and upper ocean and acts to reduce mercury availability for marine food webs
Any changes in the efficiency of mercury reduction in surface waters or the rate of re-emission is likely to impact mercury concentrations in surface waters and the air One example is the effect of sea ice in the Arctic Ocean which blocks the re-emission
Tony Magdaraog Shutterstockcom
Mercury accumulated in marine food-webs can enter the human diet
of elemental mercury leaving elevated levels in waters under ice Changes in primary productivity could change the rate at which mercury is bound to particles thus affecting re-emission to the atmosphere as well as rates of downward transport in the ocean Changes in oxidant levels in the atmosphere such as ozone and bromine may also influence the rate of oxidation of gaseous elemental mercury and thus deposition rates to the ocean
Methylmercury in the ocean Natural bacterial processes in seawater and in sediments in coastal environments convert inorganic mercury to methylmercury Methylmercury levels are highest in the subsurface waters of many oceans because it is formed at these intermediate depths likely as a result of the decomposition of organic material falling from surface waters Current understanding indicates that about 300 tonnes of methylmercury is produced in the upper ocean by this and related processes By contrast only about 80 tonnes of methylmercury reaches the ocean from other sources such as atmospheric deposition rivers and diffusion from sediments
Current modelling indicates that methylmercury stays in the upper ocean for about 11 years Deshymethylation by photochemical reaction or by microbial activity is the major removal process for methylmercury in the ocean About 240 tonnes of methylmercury is removed by this process from the surface waters of the ocean per year
The other important pathway for methylmercury in seawater is uptake into marine food webs Although only about 40 tonnes per year is taken up in this way it is this fraction that poses risks to marine animals and human consumers of seafood Methylmercury is a problem for several reasons First it is taken up by plankton much more efficiently than is inorganic mercury resulting in concentrations in plankton that are as high as 10000 times the concentration in seawater Second methylmercury is absorbed through the intestine of animals much more easily than is inorganic mercury Third methylmercury biomagnifies as it moves up the food web Thus methylmercury becomes an increasingly greater proportion of the mercury in organisms higher in the food web This explains why some indigenous populations that consume top marine predators such as fish seals and whales have some of the worldrsquos highest concentrations of methylmercury giving rise to health concerns
27
UNEP Global Mercury Assessment 2013
Pathways and fate of mercury in freshwater Observations and modelling both show that there are in general many similarities between mercury chemistry pathways and fate in lakes and in the oceans but with obvious differences in scale and in the relative importance of different processes Modelling of mercury dynamics was done for four lakes with a history of direct mercury inputs from the largest freshwater lake in the world (Lake Superior) to small lakes in Ontario Canada Atmospheric deposition and river inflow were the main sources of inorganic mercury Much of the mercury input from lake and river catchments was associated with dissolved and particulate organic matter The dominant mercury removal mechanisms as in saltwater were burial in sediments and photochemical reduction of oxidized mercury to elemental mercury followed by re-emission to the air In Lake Superior and Lake Michigan there is evidence for methylation of mercury in the water column as is seen in the open ocean
Methylmercury levels in freshwater fish vary with the level of deposition of mercury from the air though other factors such as inputs from the watershed and the number of trophic levels within the lakersquos food web are also important Methylation predominantly occurred in lake sediments and wetlands and floodplain soils where sulphateshyreducing bacteria are believed to be primarily responsible Methylmercury is de-methylated in sediments and also taken away in the outlet river from each lake
Some 400-1400 tonnes of mercury are estimated globally to be trapped behind dams and other man-made impoundments each year This has in many cases led to significant increases in total mercury and methylmercury levels in water and of methylmercury in fish and other aquatic species When artificial lakes are created plant material is submerged leading to decay and anoxia In these conditions microbially driven methylation of inorganic mercury takes place In some cases the elevated mercury levels have also been observed downstream from the artificial lakes and reservoirs
Anthropogenic impacts on aquatic mercury levels Two studies have reported that the Atlantic and Pacific Oceans have shown opposing trends over recent decades While the influence of changing ocean currents and other oceanographic factors may be a factor the trends do make sense in light of patterns of anthropogenic emissions In the North Pacific Ocean mercury concentrations appear to have increased at depths between 200 and 1000 meters over the last few decades This increase coincides with the rapid industrialization of East Asia
In the North Atlantic however results from near Bermuda suggest a substantial decrease in mercury concentration and a change in the mercury profile through the water column The Mediterranean Sea too showed a decrease in mercury concentration between 1990 and 2004 These findings are consistent with atmospheric data from around the North Atlantic The conclusion is that mercury levels in seawater in the North Atlantic were elevated by human activity but may now be declining likely as a result of decreased emissions from North America and Europe
A complementary approach to measuring mercury in seawater is to measure mercury in aquatic animals which accumulate and integrate mercury over time Teeth hair feathers and eggshells are useful long-term archives of mercury concentrations and can provide data from the pre-industrial period (ie before 1800) as well as more recent periods
Among marine animals samples are available from several regions particularly from the Arctic where cold dry conditions help preserve animal tissues Mercury concentrations between the 13th and 16th
centuries were relatively stable From the mid- to late 19th century to the end of the 20th century mercury levels increased by an average of 12 times On average therefore about 92 of the mercury in Arctic marine wildlife today is likely to be of anthropogenic origin
Similar findings were found for a 700-year sequence of seabird eggshells from the South China Sea Mercury levels increased steadily between 1800 and 2000 with a particularly rapid increase after 1970 Concentrations since 2000 are about 10 times higher than pre-industrial levels with 91 of the mercury now likely to be of anthropogenic origin In the Antarctic studies of seal hairs show that pre-industrial mercury levels were only 60 of recent levels The relatively small difference
28
UNEP Global Mercury Assessment 2013
Historical Hg concentration as a proportion of present-day 100
80
60
40
20
0
Beluga teeth Human teeth
Gyrfalcon feathers Perigrine falcon feathers
Polar bear hair Ringed seal teeth
1200 1300 1400 1500 1600 1700 1800 1900 2000
between pre-industrial and modern mercury levels in Antarctic is consistent with lower mercury emissions and atmospheric concentrations in the Southern Hemisphere as compared with the Northern Hemisphere
The timing of long-term increases of mercury in aquatic animals can shed light on the likely sources of mercury emissions that were responsible The industrialization of Europe and North America appear responsible for the large increases in marine mercury levels that began in the 19th century as these increases occurred prior to recent Asian industrialization As with water concentrations in the Pacific Ocean recent rapid increases in mercury in seabird eggs in the South China Sea coincide with industrialization in Asia
The time lag in aquatic ecosystem response One important conclusion from air-ocean modeling is that the oceans have not yet reached equilibrium with current atmospheric levels of mercury This lag is due to several factors First mercury stays in the upper ocean above 200 meters depth for about 30 years and for centuries in intermediate and deep waters This is much longer than the one year residence time in the lower atmosphere Thus removal from the ocean takes much longer than does removal from the air and so concentrations will change more slowly
Second because of the long lifetime of mercury in deeper ocean waters a great deal of natural mercury is present in the ocean already about 100000 tonnes out of a total of 135000 tonnes in intermediate waters and 200000 out of 220000 tonnes in deep waters
Rune Dietz
Analysis of museum samples reflects the increase in mercury emissions and releases since the mid-19th century associated with anthropogenic activities
Third vertical transport of mercury from intermediate depths back to the surface returns a substantial amount of mercury to the biologically active zone each year As a result average mercury concentrations in seawater and marine animals are likely to increase slowly for decades if not centuries even if atmospheric levels stabilize at present levels In short the effects of historical anthropogenic emissions from Europe and North America are still being observed in the oceans at the same time that the effects of the recent rise in emissions from Asia are being seen
Regionally different trends can be expected depending on distance from sources and ocean circulation patterns In the North Atlantic north of 55deg N it will take 50-600 years to achieve equilibrium between atmospheric and seawater mercury levels In the North Pacific this process is estimated to take 500-700 years and in the Antarctic 700-1000 years The Arctic Ocean by contrast is smaller and will only take about 35 years to reflect changes in atmospheric mercury levels Surface waters of the Mediterranean Sea should show also changes within 10-50 years
Time lags in the responses of many freshwaters and their food-webs to changes in atmospheric mercury levels are also expected Although some immediate recovery following reductions in atmospheric mercury deposition rates is likely full recovery may take decades centuries or longer depending on the characteristics of the area Highly polluted freshwaters with catchments and sediments containing large amounts of anthropogenic mercury will recover most slowly as is already observed around point sources such as smelters that have closed down
29
UNEP Global Mercury Assessment 2013
Major gaps in knowledge 9 Large uncertainties remain in global estimates of mercury emissions to the air These stem from various sources including the availability of information on activity levels but mainly from the lack of information concerning the mercury content of some raw materials and the validity of assumptions regarding processes and technologies employed to reduce mercury emissions including their rates of application and effectiveness The accuracy and precision of measurement-based estimates can depend on the validity of extrapolating measurements made at infrequent intervals to longer periods or measurements made at one plant to other facilities with similar operations
Potentially important emissions sectors that are still not quantified in the emissions inventory include the use of mercury in vinyl-chloride monomer production secondary metals production oil and gas extraction transport and processing industrial and hazardous waste incineration and disposal sewage sludge incineration and dental fillings preparation and removal
Current measurements and their evaluation are inadequate for determining spatial and temporal trends Improved more extensive and better coordinated measurements are needed A permanent global integrated monitoring network for atmospheric mercury and mercury deposition is needed to achieve this goal The atmospheric network sites should be closely integrated with water soil and biological monitoring networks The results can be used for model testing and evaluation as well as for more accurately detailing the geographic impact of anthropogenic emissions Monitoring of mercury concentrations in the important marine food species is essential to understanding possible human health impacts and the effects of future emissions changes
Better data on mercury distribution in the troposphere is needed to improve understanding of long-range transport and source-receptor relationships Coordinated studies at high altitudes and by aircraft are needed This information will
also help validate regional and global scale models improving their prediction capabilities with regard to different policy scenarios
Key processes related to global transport and cycling of mercury remain inadequately understood The chemical form of gaseous oxidized mercury is unknown Reduction and oxidation rates for mercury in the presence of atmospheric oxidants need further study including determining which oxidants are important New measurements and modelling studies are needed to examine key chemical and physical processes that affect global transport and cycling
Few data are available for reporting mercury releases to aquatic systems Systematic and consistent monitoring of mercury releases to the air is required especially for contaminated systems Releases of mercury from soils into waters depend greatly on climate and topography and these parameters need to be better accounted for Consistent approaches for measuring and reporting releases from point sources are needed to ensure comparability of data from around the world In particular the actual role of artisanal and small-scale gold mining (ASGM) in emissions to air and releases to water needs to be more accurately estimated
The link between mercury deposition methylation and uptake by living organisms needs further study The parameters that determine the rates of exchange of mercury compounds between air and sea air and soil and air and vegetation are not fully understood Whole-ecosystem studies of mercury are needed to better understand biogeochemical cycling Methylationdemethylation rates and their spatial and temporal variations and relationship to climatic factors need to be determined in most of worldrsquos major ocean basins as well as in representative freshwaters
30
UNEP Global Mercury Assessment 2013
Key findings of the 2013 assessment 10 Atmosphere Total anthropogenic emissions of mercury to the atmosphere in 2010 are estimated at 1960 (1010shy4070) tonnes which is about 30 of the total mercury that was emitted and re-emitted from anthropogenic and natural sources in that year The largest anthropogenic sources are associated with artisanal and small-scale gold mining (ASGM) and coal burning which together account for about 62 of the annual total anthropogenic emissions to air Other major sectors include ferrous and non-ferrous metal production and cement production
East and Southeast Asia are responsible for about 40 of global anthropogenic emissions About 75 of the mercury from this region comes from China which is about one-third of the global total Increased estimates for emissions from ASGM largely a result of newly obtained data and improved information mean that South America and Sub-Saharan Africa are also responsible for a greater proportion of global emissions than was previously assumed
Anthropogenic emissions over time have increased mercury loads present in the environment This leads to higher rates of re-emission and also means that there will be a time lag of years or decades between emissions reductions and lower mercury levels in the food web including pathways of human exposure
Mercury emissions to the atmosphere likely peaked in the 1950s to 1970s and subsequently declined because of reductions in Europe Russia and North America Emission trends are unclear due to changes in methods employed to produce inventories and differences in the sectors that have been accounted at different times There are however some indications that emissions may be rising again with increases from East Asia offsetting continuing reductions in Europe and North America
Aquatic environments Natural processes in aquatic systems convert less toxic elemental and inorganic mercury into much more toxic methylmercury Methylmercury concentrates and accumulates in the food web leading to high concentrations in some species of seafood and fish that many people eat
Anthropogenic releases of mercury to aquatic environments contribute hundreds of tonnes to the amount of mercury cycling in the environment Diffuse releases and point sources appear equally important Atmospheric deposition however remains the most important input of mercury to land and oceans and has increased the amount of mercury in many environmental compartments by a factor of two or three since the start of the industrial age On land mercury that is deposited is largely retained in soils and vegetation increasing the available pool for re-mobilisation to adjacent aquatic systems Re-emission from soils however is a major addition to atmospheric mercury
Hydrology is the most important factor in the transport of mercury from catchments to downstream environments Relatively little of this mercury reaches the open ocean as most is captured in sediments behind dams in estuaries and near the coast Changes in land cover and land use can have a large effect on mercury mobilisation as exposed soils erode and mercury leaches into the water table
Concentrations of mercury in Arctic marine animals today are about 10-12 times higher than in preshyindustrial times (ie prior to about 1800) This means that on average about 92 of the mercury in marine predators such as seabirds seals and whales is anthropogenic in origin The timing of the increase suggest that 19th and early 20th century emissions from Europe North America and Russia were responsible Increases mercury concentrations in seabirds in the South China Sea appear to be more recent than the Arctic increases coinciding with increasing industrialisation in East and Southeast Asia
31
UNEP Global Mercury Assessment 2013
K+S Entsorgung Gm
bH
Recovered mercury is being stockpiled at long-term storage sites above- and as shown here below ground
The upper 100 meters of the oceans have twice the mercury that they did a century ago Intermediate and deeper waters have 10-25 more mercury on average reflecting the slow transport of mercury downwards in the oceans Seawater concentrations will thus be especially slow in responding to changes in mercury inputs from atmospheric deposition and river flow As a result mercury concentrations in marine biota are likely to increase slowly for decades to centuries even without an increase in atmospheric emissions
In freshwater ecosystems atmospheric deposition and re-mobilisation from soils slow the reduction of mercury levels even in regions where atmospheric concentrations have decreased due to emission controls
Further increases in atmospheric emissions will have long-term consequences for commercial fisheries and all consumers of marine and freshwater foods
It is likely to be years or decades before reductions in anthropogenic emissions and releases of mercury have a demonstrable effect on mercury levels throughout the environment and in the fish and marine mammals which are part of the human food-chain This only reinforces the need to act now to continue and strengthen international efforts to reduce current mercury emissions and releases Delays in action now will inevitably lead to slower recovery of the worldrsquos ecosystems in future from mercury contamination leaving an even greater legacy of pollution for future generations
32
Division of Technology Industry and Economics (DTIE) Chemicals Branch Geneva Switzerland January 2013
Job number DTI1636GE
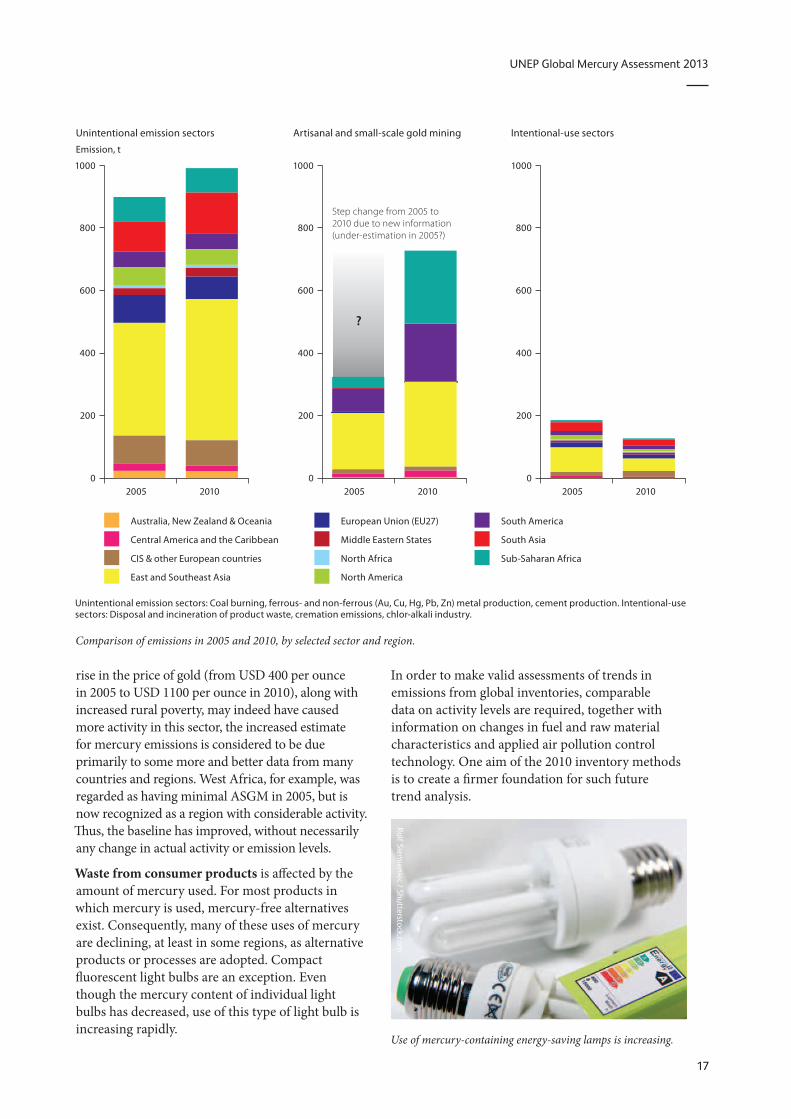
UNEP Global Mercury Assessment 2013
Unintentional emission sectors Coal burning ferrous- and non-ferrous (Au Cu Hg Pb Zn) metal production cement production Intentional-use sectors Disposal and incineration of product waste cremation emissions chlor-alkali industry
Comparison of emissions in 2005 and 2010 by selected sector and region
Unintentional emission sectors
Emission t
1000
800
600
400
200
0 2005 2010
Australia New Zealand amp Oceania
Central America and the Caribbean
CIS amp other European countries
East and Southeast Asia
rise in the price of gold (from USD 400 per ounce in 2005 to USD 1100 per ounce in 2010) along with increased rural poverty may indeed have caused more activity in this sector the increased estimate for mercury emissions is considered to be due primarily to some more and better data from many countries and regions West Africa for example was regarded as having minimal ASGM in 2005 but is now recognized as a region with considerable activity Thus the baseline has improved without necessarily any change in actual activity or emission levels
Waste from consumer products is affected by the amount of mercury used For most products in which mercury is used mercury-free alternatives exist Consequently many of these uses of mercury are declining at least in some regions as alternative products or processes are adopted Compact fluorescent light bulbs are an exception Even though the mercury content of individual light bulbs has decreased use of this type of light bulb is increasing rapidly
Artisanal and small-scale gold mining Intentional-use sectors
1000 1000
Step change from 2005 to 2010 due to new information 800 800 (under-estimation in 2005)
600 600
400 400
200 200
0 0 2005 2010 2005 2010
European Union (EU27) South America
Middle Eastern States South Asia
North Africa Sub-Saharan Africa
North America
In order to make valid assessments of trends in emissions from global inventories comparable data on activity levels are required together with information on changes in fuel and raw material characteristics and applied air pollution control technology One aim of the 2010 inventory methods is to create a firmer foundation for such future trend analysis
Ralf Siemieniec Shutterstockcom
Use of mercury-containing energy-saving lamps is increasing
17
UNEP Global Mercury Assessment 2013
Emission scenarios and future trends The 2008 Global Atmospheric Mercury Assessment included a first attempt at projecting future emissions inventories These were based on three scenarios continuing with the status quo applying current emissions controls worldwide and achieving maximum feasible technological reductions At the time this effort was regarded as highly provisional Since then additional studies have extended and improved this work but the results are not markedly different from earlier projections of future mercury emissions
Global mercury models have been used to evaluate future scenarios Four global and hemispheric models projected mercury levels around the world in 2020 based on the three emission scenarios described earlier In industrial regions the status quo will cause an increase in mercury levels of 2-25 and in remote areas of 15-5 The two emission control scenarios on the other hand yield a decrease in mercury in industrial areas of 25-35 and in remote areas of 15-20
Another global model was coupled with estimates of surface reservoirs of mercury in order to quantify source-receptor relationships for the present and for 2050 Under the best-case scenario of maximum feasible reductions projected estimates for deposition in 2050 is similar to estimates for today In the other scenarios increasing emissions lead to increasing deposition A greater proportion of mercury emissions is expected to be in the oxidized form so that a greater proportion will be deposited near the source instead of being transported far away
The model results support the conclusion that reducing anthropogenic emissions will slowly reduce the amount of mercury in biologically available reservoirs Over time mercury in the environment will be taken out of circulation by natural processes for example from ocean waters down into sediments and biologically available mercury will decrease Increased emissions on the other hand will continue to build up the amount of mercury in circulation
With new databases and methods it may soon be possible to create scenarios that incorporate activity levels as well as technology use for each country If this were done it would allow countries to assess the effects of different mercury reduction strategies on their national emissions For example a country could determine the relative contributions of emission reduction technology as opposed to for example changes in raw materials
18
UNEP Global Mercury Assessment 2013
Atmospheric chemistry monitoring and trends 5 Forms of mercury in air Mercury in the atmosphere is in three primary forms Gaseous elemental mercury is the most common in anthropogenic and natural emissions to the atmosphere Gaseous oxidized mercury and mercury bound to particulates are less common The transport and deposition of atmospheric mercury depend greatly on whether the mercury is elemental or oxidized Elemental mercury stays in the atmosphere long enough for it to be transported around the world whereas oxidized and particulate mercury are more readily captured in existing pollution control systems or deposited relatively rapidly after their formation As a result most mercury in the air is in the gaseous elemental phase Relatively little elemental mercury is deposited directly but instead must fi rst be oxidized
Although gaseous oxidized mercury is very important in mercury cycling between air and other environmental compartments the process of oxidation in the air is poorly understood with reactions and resulting compounds yet to be verified in observations
When mercury moves from air to water and land it is generally in an oxidized gaseous or particulate form whereas when it is re-emitted to air it has been converted back to gaseous elemental
Particulate associated mercury
Pole
Equator
Gaseous elemental mercury
Global transport
Gaseous elemental mercury can be transported globally Mercury emitted in particulate form tends to deposit closer to sources
mercury Sunlight appears to play a large role in both oxidation and reduction of mercury but temperature and biological interactions are also likely to be involved to some degree Here too much uncertainty remains Nonetheless the reactions are important in determining net deposition and fate of mercury
Monitoring of mercury in air Monitoring of mercury in air focuses on the three primary forms of mercury The measurement of gaseous elemental mercury is routine and robust Measuring gaseous oxidized mercury and particulate-bound mercury however is challenging Concentrations are typically very low and these forms are chemically unstable leading to high uncertainty in the measurements Nonetheless these forms are critical for defining and modelling the fate and transport of airborne mercury
In the past two decades coordinated mercury monitoring networks and long-term monitoring sites have been established in a number of regions measuring mercury concentrations in the air as well as deposition of mercury in precipitation In Europe and North America high-quality continuous monitoring has been going on for more than 15 years especially in the Arctic High-quality monitoring has started more recently in East Asia and South Africa as part of a global effort to expand the coverage provided by long-term monitoring sites
Measurements and trends in atmospheric mercury Monitoring stations around the world have provided information about trends in atmospheric mercury though the time periods vary depending on how long the site has been active Overall a declining trend in background mercury levels over the past decade has been recorded from monitoring stations
19
UNEP Global Mercury Assessment 2013
in many regions Other regions however show an increase in mercury levels
The sites also provide information about geographical patterns reflecting both background levels of
Trends in atmospheric measurements of mercury
Site(s) Period
Mace Head Ireland 1996-2011
North America rural sites 1995-2005
High Arctic sub-Arctic Up to 20 years of records mid-latitudes
Monitoring networks Mercury monitoring in Europe is carried out under the European Monitoring and Evaluation Programme (EMEP) one of the first international environmental measurement networks Heavy metals such as mercury have been included in the EMEP program since 1999 Mercury measurements are available only from northern and northwestern Europe
Three monitoring networks currently operate in North America providing good coverage of Canada and the United States the Mercury Deposition Network the Canadian Air and Precipitation Monitoring Network and the Atmospheric Mercury Network More recently new sites have been established in Mexico extending coverage on the continent The stations monitor atmospheric mercury and mercury in precipitation which has measured since the mid-1990s Monitoring of mercury in the air and in precipitation has been underway in Asia for nearly a decade
Alert Nord
Point Barrow
Nuuk Stoacuterhoumlfethi
Mace Head
mercury and local and regional influences Mercury concentrations at remote sites in Asia are higher than in other regions of the Northern Hemisphere Coastal cities in China have lower levels than inland sites likely due to the influence of relatively clean
Measurement Trend
Gaseous elemental mercury Decrease of 14-18 per year
Total gaseous mercury Decrease of 22 to 174 in total
Total gaseous mercury Decreasing trend at some stations increasing at others
The monitoring network of the Arctic Monitoring and Assessment Programme (AMAP) includes air and deposition monitoring sites located in Arctic regions of Canada Greenland Iceland Norway Russia and Sweden
Building on existing national and regional monitoring networks the European Union-financed project
ldquoGlobal Mercury Observation Systemrdquo (GMOS) started in November 2010 Its goal is to develop a coordinated global system for monitoring mercury including a large network of ground-based monitoring stations New sites are being installed in regions where few monitoring stations exist especially in the Southern Hemisphere Two sites have been established in Antarctica one on the Antarctic Plateau and one on the coast
Ny-Aringlesund
Amderma Pallas
Raringouml Bredkaumllen
Listvyanka Diabla Gora
Mauna Loa
Mt Bachelor
Celestuacuten Calhau
Longobucco
Iskrba Niembro Monte Cimone Cap
Ferrat Mt Waliguan Ganghwa Island
Lulin
Cape Hedo Ev-K2
Mt Changbai
Minamata Mt Ailao
Nieuw Nickerie
Kodiakanal
Maheacute Island Manaus
Bariloche Cape Point
Amsterdam Island Cape Grim
Dumont drsquoUrville
AMAP CAMnet EMEP GMOS GMOS associated NADPAIRMoN NADPMDN
Air + precipitation Air Precipitation
20
UNEP Global Mercury Assessment 2013
John Munthe
The mercury background air monitoring station at Zeppelin mountain Svalbard
air from over the ocean Sites off the Asian coast however show higher levels of gaseous elemental mercury than the Northern Hemisphere background suggesting an outflow from the Asian mainland
Weather patterns have also been found to have a strong influence on seasonal patterns in mercury levels in the air at monitoring sites At the Mount Waliguan Observatory on the Tibetan Plateau for example northeasterly and easterly winds produced the highest levels of mercury
Measurements at high altitudes Measurements from ground-based stations above 2700 meters suggest that there is an inverse relationship between gaseous elemental mercury and gaseous oxidized mercury at these elevations In other words when there is more elemental mercury there is less oxidized mercury and vice versa These measurements are in good agreement with modelling results which gives additional confidence in current understanding of the behaviour of mercury at high altitude
An inverse relationship between total gaseous mercury and particulate concentration has also been observed in the high stratosphere From the transformation rate of total gaseous mercury to particulate-bound mercury it appears that gaseous mercury lasts about two years in the stratosphere
21
UNEP Global Mercury Assessment 2013
Atmospheric concentrations and deposition 6 Measurements and trends of mercury in precipitation Mercury deposited by precipitation decreased from the 1990s into the 2000s at many but not all sites in North America and Western Europe where such measurements were taken
Regional patterns are also evident including slightly higher levels in southern Europe than northern Europe and higher levels in Asia than in North America Total mercury concentrations in precipitation in China were much higher than those in Japan and South Korea Th is was mostly attributed to higher levels of gaseous oxidized mercury and particulate-bound mercury which are readily deposited by precipitation and thus not transported far
A comparison of data from Canadian and American monitoring sites found that deposition of mercury in precipitation was highest in summer
Dry deposition of mercury which is deposition not associated with precipitation is diffi cult to measure and consequently there is little information on trends in mercury dry deposition Th is lack of information means that it is also diffi cult to validate model results for dry deposition
106 44
474 72 91
5 7 71
05 1 5 10 100 500 1000
Total mercury emission (2005) kgcell
Modelled mercury air concentrations and deposition patterns Atmospheric mercury concentrations are highest in major industrial regions Models examining global patterns show that East and South Asia Europe North America and South Africa have the highest levels of elemental mercury in the air Concentrations are generally lower in the Southern Hemisphere than the Northern Hemisphere because most industrial activity is in northern regions Th ese model results are based on simulations using the 2005 global mercury emission inventory because the 2010 inventory has only recently become available
Intercontinental transport of mercury in the air has been examined to determine its impact on regional mercury levels Four models using diff erent parameters produced consistent results Depending on the region mercury emitted by distant sources contributes between 10 and 30 of annual mercury deposition Where local sources are low mercury transported from distant emission sources can account for more than half of the deposition East Asia is the dominant source region adding 10-14 to the deposition in
Contribution from sources outside receptor region
Model 40
GEOS-Chem GLEMOS GRAHM CMAQ-Hg
30
20
10
0 Arctic Europe North East Asia South Asia
America
Receptor region
(Left ) Global distribution of anthropogenic mercury emissions in 2005 with source regions that were considered in the analysis (North America South America Europe Africa Central Asia South Asia East Asia Australia and Oceania) and (right) the contribution of anthropogenic sources outside a particular receptor region to deposition within the receptor region
22
UNEP Global Mercury Assessment 2013
Modelling atmospheric transport and deposition Global models reproduce the movement of mercury in the atmosphere during which the mercury may move between continents They have been effective in examining sources of mercury to the Arctic and also for examining the outflow of pollution from South and Southeast Asia and its impact on western North America as well as the flow from eastern North America to Europe
Regional models on the scale of a continent or a basin such as the Mediterranean can provide more detail about specific source areas even to the level of individual industrial areas Reliable results however require a detailed understanding of mercury oxidation in the atmosphere about which there is considerably uncertainty
Most atmospheric transport models consider the full chain of mercury processes in the atmosphere Some models also consider how mercury is cycled in other atmospheric compartments such as soil vegetation snow freshwater and seawater
One of the largest sources of uncertainty in mercury models is the chemical mechanism used to determine how mercury changes forms in the air Improved experimental data can help improve model performance by making sure that the correct reactions are simulated The processes that lead from deposition to re-emission also need to be understood better Advances in this area show promise with model results becoming closer to estimates based on experimental data
other regions of the world Natural emissions and re-emissions account for 35-70 of total deposition in most regions Deposition is generally greater in low and mid-latitudes due to stronger sunlight higher concentrations of oxidants and higher precipitation
Regional mercury models show patterns at the scales of continents or individual seas The Mediterranean Sea for example is a net source of mercury as it emits more than is deposited to it In that region dry deposition generally exceeds deposition of mercury in precipitation In Central and Southern Europe total gaseous mercury concentrations and deposition in precipitation were both consistently higher than the European average
Across the United States dry deposition accounts for two-thirds of total annual deposition mainly from gaseous oxidized mercury A study examining sources and deposition of mercury to assess the
benefits of proposed emission control measures found that mercury transport from outside the country accounts for 68 of mercury deposition in the Northeast and up to 91 in the west-central United States Large point sources contribute up to three-quarters of nearby deposition and power plants contributed half of the deposition in the eastern part of the country This suggests that new emissions standards would primarily benefit eastern regions of the US
In Asia studies show high seasonal variation in mercury concentration and deposition Anthropogenic emissions are responsible for about 75 of deposition in East Asia In this region there is a net removal of gaseous oxidized mercury from the atmosphere and a net export of gaseous elemental mercury
In the Arctic gaseous elemental mercury levels in the atmosphere are depleted rapidly in spring when after the long Arctic winters sunlight returns Ozone is depleted at the same time and it is believed that bromine-containing compounds are the cause of the photo-chemical reactions that deplete ozone and mercury During these events gaseous oxidized mercury and particulate-bound mercury levels increase sharply suggesting that the gaseous mercury is oxidized and deposited enhancing mercury deposition in Arctic areas in springtime Recent research however has found that 50-80 of the deposited mercury is re-emitted within a few days Similar springtime mercury depletion events have been seen in Antarctica
23
UNEP Global Mercury Assessment 2013
Anthropogenic releases to the aquatic environment 7 Global assessment Previous UNEP global mercury assessments only considered emissions to the atmosphere The 2013 Report presents the first attempt at compiling a global inventory of mercury releases to aquatic environments Releases directly into the aquatic environment present a completely different chemistry set of pathways and fate to those released to air They are also more directly linked to the risks posed by mercury to global environmental and human health Unlike mercury releases to air which are predominantly in the form of gaseous elemental mercury releases to water are predominantly inorganic mercury and to a lesser extent liquid elemental mercury
At present only some sources of aquatic releases can be quantified with any confidence Thus many sources that may be important are not included in this first assessment of global aquatic releases For example land management practices that expose new geological sources of mercury in rocks and mineral soils or that re-mobilize previously deposited mercury cannot yet be assessed Two broad categories of current anthropogenic sources are considered here point sources of mercury release to water and diffuse releases of mercury as a result of its remobilisation from areas where it was previously deposited or accumulated due to human activity (ie contaminated sites) Artisanal and small-scale gold mining (ASGM) mercury-containing pesticides and fungicides used in agriculture and deforestation are considered separately
Point source releases to water from various sectors in tonnes per year with the range of the estimate and as a percentage of total anthropogenic emissions
Sector Releases (range) tonnes
Non-ferrous metal production 925 (193 - 268)
Consumer product waste 894 (222 - 308)
Chlor-alkali production 28 (10 ndash 55)
Oil refining 06 (03 ndash 1)
Grand Total 185 (426 ndash 582)
The global estimate of mercury release to water from point sources has been derived from the atmospheric emissions assessment and the approach employed in the UNEP Toolkit to partition total mercury releases between air land and water This approach has considerable uncertainty and may omit sectors where releases to water are high but air emissions are unimportant and therefore not addressed in the inventory Global releases from point sources were estimated to be 185 tonnes per year
For diffuse sources evaluating the relative contribution of anthropogenic and natural sources to the aquatic environment requires determining considerations of the various mercury inputs For some sectors data exist that allow a preliminary assessment of the amounts of mercury re-mobilized into aquatic systems
For mercury-contaminated sites the range of average soil concentrations of mercury reported for sites where mercury was mined used or otherwise released by human activity was considered The area of contamination is then used to determine how much mercury is available in soils and when combined with a factor for how much mercury is released from those soils in a year the total release can be estimated Among identified contaminated sites mercury mining is identified as the largest sector followed by mining of precious metals Total releases to aquatic environments from contaminated sites are estimated to be 83-335 tonnes per year
Releases to water from contaminated sites in tonnes per year with the range of the estimate
Sector Releases (range) tonnes
Primary mercury mining sites 67 ndash 266
Precious metal production sites 14 ndash 55
Non-ferrous metal production sites 01 ndash 05
Chlor-alkali production sites 01 ndash 05
Other industrial sites 01 ndash 03
Grand Total 83 ndash 335
24
UNEP Global Mercury Assessment 2013
Much of the mercury released from artisanal and small-scale gold mining goes into rivers lakes soils and sediments and tailings From soils and tailings it may be re-mobilized by leaching and erosion In addition mining may disturb mercury-containing soils and sediments that may then erode more quickly releasing more mercury than would otherwise have become available from natural erosion A key factor in these processes is the local hydrological cycle of precipitation evaporation run-off and river flow To account for this in the assessment countries were designated as dry wet or intermediate to determine the relative importance of erosion The tropical and subtropical countries which have the greatest activity in this sector also tend to experience high precipitation and run-off exacerbating this source of mercury release and re-mobilization Total worldwide releases of mercury to land and water from ASGM were estimated at over 800 tonnes per year How much of this is released to water cannot yet be determined
Mercury continues to be used in pesticides and fungicides 2100 tonnes of mercury were released in the decade of the 1960s through such agrochemical uses Current data are unavailable although the use of mercury in these products has been greatly reduced
Deforestation especially in the Amazon Basin can lead to extensive soil erosion and thus the release of mercury previously accumulated in soils Using 2010 figures for deforestation rates around the world and an estimate of soil concentrations of mercury as much as 260 tonnes of mercury may have been released into rivers in 2010 as a result of deforestation worldwide
Because this is the first attempt to quantify global mercury releases to the aquatic environment there is no previous measurement against which these results can be compared Thus it is not possible at this time to evaluate trends in releases
Uncertainties in release estimates Estimating global releases of mercury to aquatic environments is being done here for the first time Many data are missing and others are imprecise A number of assumptions have been made based on what measurements are available or on other grounds to extrapolate from known quantities or to calculate aquatic releases in relation to atmospheric
or other emissions Thus the results should be treated with great caution It is nonetheless clear that anthropogenic sources and human activity contribute hundreds of tonnes of mercury to aquatic environments each year a substantial amount relative to estimated natural releases 150-960 tonnes per year from terrestrial environments
Lapshin Shutterstockcom
Phil Augustavo istockphotocom
Bureau of Land Managem
ent
Contaminated sites (top) erosion following deforestation (middle) and a flooded store of mercury-contaminated waste (lower) illustrate potential sources of mercury releases to water
25
UNEP Global Mercury Assessment 2013
Aquatic pathways transport and fate 8 Mercury in aquatic environments The pathways and fate of mercury in aquatic environments are important because it is in waters sediments and wetland soils that inorganic mercury is converted into methylmercury which is toxic and concentrates in animals The majority of human exposure to mercury and the health risk that comes with mercury exposure is from consumption of marine foods Thus this section focuses on the worldrsquos oceans Some freshwater systems however are important sources of fish for human consumption especially for subsistence and recreational fisheries often among indigenous peoples Artisanal and small-scale gold mining (ASGM) communities may also be affected through fish consumption and drinking water if those are contaminated by local releases
The major processes of mercury cycling are generally similar for all aquatic systems Inorganic mercury in dissolved or particulate form is the dominant mercury type in most marine and fresh waters Dissolved gaseous elemental mercury accounts for less than 30 of total mercury in water Methylmercury is often present at trace levels but may in some settings reach 30 of total mercury In freshwater and coastal environments inorganic mercury is transformed into methylmercury primarily in sediments In the open ocean this conversion takes place largely at intermediate depths between 200 and 1000 meters in the water column Mercury is lost from aquatic systems in two ways When inorganic mercury is reduced to elemental mercury it can be re-emitted to the atmosphere When inorganic mercury binds to particulates in water it can settle out rapidly and be buried in sediments Deep burial in ocean sediments is one of the major pathways by which mercury is removed from the biologically active environment
The global mercury cycle is chemically and physically complex Thus it is necessary to use models to study describe and predict what happens and will happen to mercury in the aquatic environment Until recently only one model existed that incorporated
air land and water into a unified whole The model has been validated against observations of mercury and represents the current scientific consensus The largest potential errors in this model in terms of the aquatic cycle concern details of the exchange of mercury between air and water
Pathways and fate of mercury in the oceans Model simulations suggest that anthropogenic impacts on mercury levels in the ocean are greatest in the surface waters the top 100 meters or so of the water column While model results vary one recent estimate suggests that anthropogenic emissions over the last 100 years have doubled the concentration of mercury in the surface layer of the ocean and increased it by 25 in intermediate waters and by 10 in deep waters The difference is due to the length of time it takes for surface waters to circulate to the depths
Models and measurements agree that direct deposition from the atmosphere is the dominant pathway by which mercury reaches the oceans The exceptions are smaller semi-enclosed basins such as the Mediterranean Sea or the Arctic Ocean where river runoff coastal erosion and ocean currents
Ugo M
ontaldo Shutterstockcom
26
UNEP Global Mercury Assessment 2013
account for about half of mercury inputs The most recent modelling effort suggests that total deposition input of mercury to the oceans in 2008 was 3700 tonnes
Other mercury pathways appear less important on a global basis Rivers are estimated to carry more than 2800 tonnes of mercury each year but only about 380 tonnes of this is transported offshore The rest is trapped by particles in estuaries Groundwater and re-mobilization from sediments provide 100shy800 tonnes of mercury to the oceans each year Undersea hydrothermal vents add less than 600 tonnes of mercury to the oceans There are high concentrations of mercury in vent fluids but a great deal of the mercury is precipitated as solids once the vent fluids enter seawater
Models suggest that globally about 70 of the mercury deposited into the ocean is re-emitted to the atmosphere Oxidized mercury in surface waters is reduced by biological and photochemical processes to the elemental form that is volatile and readily re-emitted The removal of this mercury ultimately reduces the pool of mercury that could be converted to methylmercury and be accumulated by marine organisms The re-emission process thus simultaneously prolongs the lifetime of mercury cycling through the atmosphere and upper ocean and acts to reduce mercury availability for marine food webs
Any changes in the efficiency of mercury reduction in surface waters or the rate of re-emission is likely to impact mercury concentrations in surface waters and the air One example is the effect of sea ice in the Arctic Ocean which blocks the re-emission
Tony Magdaraog Shutterstockcom
Mercury accumulated in marine food-webs can enter the human diet
of elemental mercury leaving elevated levels in waters under ice Changes in primary productivity could change the rate at which mercury is bound to particles thus affecting re-emission to the atmosphere as well as rates of downward transport in the ocean Changes in oxidant levels in the atmosphere such as ozone and bromine may also influence the rate of oxidation of gaseous elemental mercury and thus deposition rates to the ocean
Methylmercury in the ocean Natural bacterial processes in seawater and in sediments in coastal environments convert inorganic mercury to methylmercury Methylmercury levels are highest in the subsurface waters of many oceans because it is formed at these intermediate depths likely as a result of the decomposition of organic material falling from surface waters Current understanding indicates that about 300 tonnes of methylmercury is produced in the upper ocean by this and related processes By contrast only about 80 tonnes of methylmercury reaches the ocean from other sources such as atmospheric deposition rivers and diffusion from sediments
Current modelling indicates that methylmercury stays in the upper ocean for about 11 years Deshymethylation by photochemical reaction or by microbial activity is the major removal process for methylmercury in the ocean About 240 tonnes of methylmercury is removed by this process from the surface waters of the ocean per year
The other important pathway for methylmercury in seawater is uptake into marine food webs Although only about 40 tonnes per year is taken up in this way it is this fraction that poses risks to marine animals and human consumers of seafood Methylmercury is a problem for several reasons First it is taken up by plankton much more efficiently than is inorganic mercury resulting in concentrations in plankton that are as high as 10000 times the concentration in seawater Second methylmercury is absorbed through the intestine of animals much more easily than is inorganic mercury Third methylmercury biomagnifies as it moves up the food web Thus methylmercury becomes an increasingly greater proportion of the mercury in organisms higher in the food web This explains why some indigenous populations that consume top marine predators such as fish seals and whales have some of the worldrsquos highest concentrations of methylmercury giving rise to health concerns
27
UNEP Global Mercury Assessment 2013
Pathways and fate of mercury in freshwater Observations and modelling both show that there are in general many similarities between mercury chemistry pathways and fate in lakes and in the oceans but with obvious differences in scale and in the relative importance of different processes Modelling of mercury dynamics was done for four lakes with a history of direct mercury inputs from the largest freshwater lake in the world (Lake Superior) to small lakes in Ontario Canada Atmospheric deposition and river inflow were the main sources of inorganic mercury Much of the mercury input from lake and river catchments was associated with dissolved and particulate organic matter The dominant mercury removal mechanisms as in saltwater were burial in sediments and photochemical reduction of oxidized mercury to elemental mercury followed by re-emission to the air In Lake Superior and Lake Michigan there is evidence for methylation of mercury in the water column as is seen in the open ocean
Methylmercury levels in freshwater fish vary with the level of deposition of mercury from the air though other factors such as inputs from the watershed and the number of trophic levels within the lakersquos food web are also important Methylation predominantly occurred in lake sediments and wetlands and floodplain soils where sulphateshyreducing bacteria are believed to be primarily responsible Methylmercury is de-methylated in sediments and also taken away in the outlet river from each lake
Some 400-1400 tonnes of mercury are estimated globally to be trapped behind dams and other man-made impoundments each year This has in many cases led to significant increases in total mercury and methylmercury levels in water and of methylmercury in fish and other aquatic species When artificial lakes are created plant material is submerged leading to decay and anoxia In these conditions microbially driven methylation of inorganic mercury takes place In some cases the elevated mercury levels have also been observed downstream from the artificial lakes and reservoirs
Anthropogenic impacts on aquatic mercury levels Two studies have reported that the Atlantic and Pacific Oceans have shown opposing trends over recent decades While the influence of changing ocean currents and other oceanographic factors may be a factor the trends do make sense in light of patterns of anthropogenic emissions In the North Pacific Ocean mercury concentrations appear to have increased at depths between 200 and 1000 meters over the last few decades This increase coincides with the rapid industrialization of East Asia
In the North Atlantic however results from near Bermuda suggest a substantial decrease in mercury concentration and a change in the mercury profile through the water column The Mediterranean Sea too showed a decrease in mercury concentration between 1990 and 2004 These findings are consistent with atmospheric data from around the North Atlantic The conclusion is that mercury levels in seawater in the North Atlantic were elevated by human activity but may now be declining likely as a result of decreased emissions from North America and Europe
A complementary approach to measuring mercury in seawater is to measure mercury in aquatic animals which accumulate and integrate mercury over time Teeth hair feathers and eggshells are useful long-term archives of mercury concentrations and can provide data from the pre-industrial period (ie before 1800) as well as more recent periods
Among marine animals samples are available from several regions particularly from the Arctic where cold dry conditions help preserve animal tissues Mercury concentrations between the 13th and 16th
centuries were relatively stable From the mid- to late 19th century to the end of the 20th century mercury levels increased by an average of 12 times On average therefore about 92 of the mercury in Arctic marine wildlife today is likely to be of anthropogenic origin
Similar findings were found for a 700-year sequence of seabird eggshells from the South China Sea Mercury levels increased steadily between 1800 and 2000 with a particularly rapid increase after 1970 Concentrations since 2000 are about 10 times higher than pre-industrial levels with 91 of the mercury now likely to be of anthropogenic origin In the Antarctic studies of seal hairs show that pre-industrial mercury levels were only 60 of recent levels The relatively small difference
28
UNEP Global Mercury Assessment 2013
Historical Hg concentration as a proportion of present-day 100
80
60
40
20
0
Beluga teeth Human teeth
Gyrfalcon feathers Perigrine falcon feathers
Polar bear hair Ringed seal teeth
1200 1300 1400 1500 1600 1700 1800 1900 2000
between pre-industrial and modern mercury levels in Antarctic is consistent with lower mercury emissions and atmospheric concentrations in the Southern Hemisphere as compared with the Northern Hemisphere
The timing of long-term increases of mercury in aquatic animals can shed light on the likely sources of mercury emissions that were responsible The industrialization of Europe and North America appear responsible for the large increases in marine mercury levels that began in the 19th century as these increases occurred prior to recent Asian industrialization As with water concentrations in the Pacific Ocean recent rapid increases in mercury in seabird eggs in the South China Sea coincide with industrialization in Asia
The time lag in aquatic ecosystem response One important conclusion from air-ocean modeling is that the oceans have not yet reached equilibrium with current atmospheric levels of mercury This lag is due to several factors First mercury stays in the upper ocean above 200 meters depth for about 30 years and for centuries in intermediate and deep waters This is much longer than the one year residence time in the lower atmosphere Thus removal from the ocean takes much longer than does removal from the air and so concentrations will change more slowly
Second because of the long lifetime of mercury in deeper ocean waters a great deal of natural mercury is present in the ocean already about 100000 tonnes out of a total of 135000 tonnes in intermediate waters and 200000 out of 220000 tonnes in deep waters
Rune Dietz
Analysis of museum samples reflects the increase in mercury emissions and releases since the mid-19th century associated with anthropogenic activities
Third vertical transport of mercury from intermediate depths back to the surface returns a substantial amount of mercury to the biologically active zone each year As a result average mercury concentrations in seawater and marine animals are likely to increase slowly for decades if not centuries even if atmospheric levels stabilize at present levels In short the effects of historical anthropogenic emissions from Europe and North America are still being observed in the oceans at the same time that the effects of the recent rise in emissions from Asia are being seen
Regionally different trends can be expected depending on distance from sources and ocean circulation patterns In the North Atlantic north of 55deg N it will take 50-600 years to achieve equilibrium between atmospheric and seawater mercury levels In the North Pacific this process is estimated to take 500-700 years and in the Antarctic 700-1000 years The Arctic Ocean by contrast is smaller and will only take about 35 years to reflect changes in atmospheric mercury levels Surface waters of the Mediterranean Sea should show also changes within 10-50 years
Time lags in the responses of many freshwaters and their food-webs to changes in atmospheric mercury levels are also expected Although some immediate recovery following reductions in atmospheric mercury deposition rates is likely full recovery may take decades centuries or longer depending on the characteristics of the area Highly polluted freshwaters with catchments and sediments containing large amounts of anthropogenic mercury will recover most slowly as is already observed around point sources such as smelters that have closed down
29
UNEP Global Mercury Assessment 2013
Major gaps in knowledge 9 Large uncertainties remain in global estimates of mercury emissions to the air These stem from various sources including the availability of information on activity levels but mainly from the lack of information concerning the mercury content of some raw materials and the validity of assumptions regarding processes and technologies employed to reduce mercury emissions including their rates of application and effectiveness The accuracy and precision of measurement-based estimates can depend on the validity of extrapolating measurements made at infrequent intervals to longer periods or measurements made at one plant to other facilities with similar operations
Potentially important emissions sectors that are still not quantified in the emissions inventory include the use of mercury in vinyl-chloride monomer production secondary metals production oil and gas extraction transport and processing industrial and hazardous waste incineration and disposal sewage sludge incineration and dental fillings preparation and removal
Current measurements and their evaluation are inadequate for determining spatial and temporal trends Improved more extensive and better coordinated measurements are needed A permanent global integrated monitoring network for atmospheric mercury and mercury deposition is needed to achieve this goal The atmospheric network sites should be closely integrated with water soil and biological monitoring networks The results can be used for model testing and evaluation as well as for more accurately detailing the geographic impact of anthropogenic emissions Monitoring of mercury concentrations in the important marine food species is essential to understanding possible human health impacts and the effects of future emissions changes
Better data on mercury distribution in the troposphere is needed to improve understanding of long-range transport and source-receptor relationships Coordinated studies at high altitudes and by aircraft are needed This information will
also help validate regional and global scale models improving their prediction capabilities with regard to different policy scenarios
Key processes related to global transport and cycling of mercury remain inadequately understood The chemical form of gaseous oxidized mercury is unknown Reduction and oxidation rates for mercury in the presence of atmospheric oxidants need further study including determining which oxidants are important New measurements and modelling studies are needed to examine key chemical and physical processes that affect global transport and cycling
Few data are available for reporting mercury releases to aquatic systems Systematic and consistent monitoring of mercury releases to the air is required especially for contaminated systems Releases of mercury from soils into waters depend greatly on climate and topography and these parameters need to be better accounted for Consistent approaches for measuring and reporting releases from point sources are needed to ensure comparability of data from around the world In particular the actual role of artisanal and small-scale gold mining (ASGM) in emissions to air and releases to water needs to be more accurately estimated
The link between mercury deposition methylation and uptake by living organisms needs further study The parameters that determine the rates of exchange of mercury compounds between air and sea air and soil and air and vegetation are not fully understood Whole-ecosystem studies of mercury are needed to better understand biogeochemical cycling Methylationdemethylation rates and their spatial and temporal variations and relationship to climatic factors need to be determined in most of worldrsquos major ocean basins as well as in representative freshwaters
30
UNEP Global Mercury Assessment 2013
Key findings of the 2013 assessment 10 Atmosphere Total anthropogenic emissions of mercury to the atmosphere in 2010 are estimated at 1960 (1010shy4070) tonnes which is about 30 of the total mercury that was emitted and re-emitted from anthropogenic and natural sources in that year The largest anthropogenic sources are associated with artisanal and small-scale gold mining (ASGM) and coal burning which together account for about 62 of the annual total anthropogenic emissions to air Other major sectors include ferrous and non-ferrous metal production and cement production
East and Southeast Asia are responsible for about 40 of global anthropogenic emissions About 75 of the mercury from this region comes from China which is about one-third of the global total Increased estimates for emissions from ASGM largely a result of newly obtained data and improved information mean that South America and Sub-Saharan Africa are also responsible for a greater proportion of global emissions than was previously assumed
Anthropogenic emissions over time have increased mercury loads present in the environment This leads to higher rates of re-emission and also means that there will be a time lag of years or decades between emissions reductions and lower mercury levels in the food web including pathways of human exposure
Mercury emissions to the atmosphere likely peaked in the 1950s to 1970s and subsequently declined because of reductions in Europe Russia and North America Emission trends are unclear due to changes in methods employed to produce inventories and differences in the sectors that have been accounted at different times There are however some indications that emissions may be rising again with increases from East Asia offsetting continuing reductions in Europe and North America
Aquatic environments Natural processes in aquatic systems convert less toxic elemental and inorganic mercury into much more toxic methylmercury Methylmercury concentrates and accumulates in the food web leading to high concentrations in some species of seafood and fish that many people eat
Anthropogenic releases of mercury to aquatic environments contribute hundreds of tonnes to the amount of mercury cycling in the environment Diffuse releases and point sources appear equally important Atmospheric deposition however remains the most important input of mercury to land and oceans and has increased the amount of mercury in many environmental compartments by a factor of two or three since the start of the industrial age On land mercury that is deposited is largely retained in soils and vegetation increasing the available pool for re-mobilisation to adjacent aquatic systems Re-emission from soils however is a major addition to atmospheric mercury
Hydrology is the most important factor in the transport of mercury from catchments to downstream environments Relatively little of this mercury reaches the open ocean as most is captured in sediments behind dams in estuaries and near the coast Changes in land cover and land use can have a large effect on mercury mobilisation as exposed soils erode and mercury leaches into the water table
Concentrations of mercury in Arctic marine animals today are about 10-12 times higher than in preshyindustrial times (ie prior to about 1800) This means that on average about 92 of the mercury in marine predators such as seabirds seals and whales is anthropogenic in origin The timing of the increase suggest that 19th and early 20th century emissions from Europe North America and Russia were responsible Increases mercury concentrations in seabirds in the South China Sea appear to be more recent than the Arctic increases coinciding with increasing industrialisation in East and Southeast Asia
31
UNEP Global Mercury Assessment 2013
K+S Entsorgung Gm
bH
Recovered mercury is being stockpiled at long-term storage sites above- and as shown here below ground
The upper 100 meters of the oceans have twice the mercury that they did a century ago Intermediate and deeper waters have 10-25 more mercury on average reflecting the slow transport of mercury downwards in the oceans Seawater concentrations will thus be especially slow in responding to changes in mercury inputs from atmospheric deposition and river flow As a result mercury concentrations in marine biota are likely to increase slowly for decades to centuries even without an increase in atmospheric emissions
In freshwater ecosystems atmospheric deposition and re-mobilisation from soils slow the reduction of mercury levels even in regions where atmospheric concentrations have decreased due to emission controls
Further increases in atmospheric emissions will have long-term consequences for commercial fisheries and all consumers of marine and freshwater foods
It is likely to be years or decades before reductions in anthropogenic emissions and releases of mercury have a demonstrable effect on mercury levels throughout the environment and in the fish and marine mammals which are part of the human food-chain This only reinforces the need to act now to continue and strengthen international efforts to reduce current mercury emissions and releases Delays in action now will inevitably lead to slower recovery of the worldrsquos ecosystems in future from mercury contamination leaving an even greater legacy of pollution for future generations
32
Division of Technology Industry and Economics (DTIE) Chemicals Branch Geneva Switzerland January 2013
Job number DTI1636GE
UNEP Global Mercury Assessment 2013
Emission scenarios and future trends The 2008 Global Atmospheric Mercury Assessment included a first attempt at projecting future emissions inventories These were based on three scenarios continuing with the status quo applying current emissions controls worldwide and achieving maximum feasible technological reductions At the time this effort was regarded as highly provisional Since then additional studies have extended and improved this work but the results are not markedly different from earlier projections of future mercury emissions
Global mercury models have been used to evaluate future scenarios Four global and hemispheric models projected mercury levels around the world in 2020 based on the three emission scenarios described earlier In industrial regions the status quo will cause an increase in mercury levels of 2-25 and in remote areas of 15-5 The two emission control scenarios on the other hand yield a decrease in mercury in industrial areas of 25-35 and in remote areas of 15-20
Another global model was coupled with estimates of surface reservoirs of mercury in order to quantify source-receptor relationships for the present and for 2050 Under the best-case scenario of maximum feasible reductions projected estimates for deposition in 2050 is similar to estimates for today In the other scenarios increasing emissions lead to increasing deposition A greater proportion of mercury emissions is expected to be in the oxidized form so that a greater proportion will be deposited near the source instead of being transported far away
The model results support the conclusion that reducing anthropogenic emissions will slowly reduce the amount of mercury in biologically available reservoirs Over time mercury in the environment will be taken out of circulation by natural processes for example from ocean waters down into sediments and biologically available mercury will decrease Increased emissions on the other hand will continue to build up the amount of mercury in circulation
With new databases and methods it may soon be possible to create scenarios that incorporate activity levels as well as technology use for each country If this were done it would allow countries to assess the effects of different mercury reduction strategies on their national emissions For example a country could determine the relative contributions of emission reduction technology as opposed to for example changes in raw materials
18
UNEP Global Mercury Assessment 2013
Atmospheric chemistry monitoring and trends 5 Forms of mercury in air Mercury in the atmosphere is in three primary forms Gaseous elemental mercury is the most common in anthropogenic and natural emissions to the atmosphere Gaseous oxidized mercury and mercury bound to particulates are less common The transport and deposition of atmospheric mercury depend greatly on whether the mercury is elemental or oxidized Elemental mercury stays in the atmosphere long enough for it to be transported around the world whereas oxidized and particulate mercury are more readily captured in existing pollution control systems or deposited relatively rapidly after their formation As a result most mercury in the air is in the gaseous elemental phase Relatively little elemental mercury is deposited directly but instead must fi rst be oxidized
Although gaseous oxidized mercury is very important in mercury cycling between air and other environmental compartments the process of oxidation in the air is poorly understood with reactions and resulting compounds yet to be verified in observations
When mercury moves from air to water and land it is generally in an oxidized gaseous or particulate form whereas when it is re-emitted to air it has been converted back to gaseous elemental
Particulate associated mercury
Pole
Equator
Gaseous elemental mercury
Global transport
Gaseous elemental mercury can be transported globally Mercury emitted in particulate form tends to deposit closer to sources
mercury Sunlight appears to play a large role in both oxidation and reduction of mercury but temperature and biological interactions are also likely to be involved to some degree Here too much uncertainty remains Nonetheless the reactions are important in determining net deposition and fate of mercury
Monitoring of mercury in air Monitoring of mercury in air focuses on the three primary forms of mercury The measurement of gaseous elemental mercury is routine and robust Measuring gaseous oxidized mercury and particulate-bound mercury however is challenging Concentrations are typically very low and these forms are chemically unstable leading to high uncertainty in the measurements Nonetheless these forms are critical for defining and modelling the fate and transport of airborne mercury
In the past two decades coordinated mercury monitoring networks and long-term monitoring sites have been established in a number of regions measuring mercury concentrations in the air as well as deposition of mercury in precipitation In Europe and North America high-quality continuous monitoring has been going on for more than 15 years especially in the Arctic High-quality monitoring has started more recently in East Asia and South Africa as part of a global effort to expand the coverage provided by long-term monitoring sites
Measurements and trends in atmospheric mercury Monitoring stations around the world have provided information about trends in atmospheric mercury though the time periods vary depending on how long the site has been active Overall a declining trend in background mercury levels over the past decade has been recorded from monitoring stations
19
UNEP Global Mercury Assessment 2013
in many regions Other regions however show an increase in mercury levels
The sites also provide information about geographical patterns reflecting both background levels of
Trends in atmospheric measurements of mercury
Site(s) Period
Mace Head Ireland 1996-2011
North America rural sites 1995-2005
High Arctic sub-Arctic Up to 20 years of records mid-latitudes
Monitoring networks Mercury monitoring in Europe is carried out under the European Monitoring and Evaluation Programme (EMEP) one of the first international environmental measurement networks Heavy metals such as mercury have been included in the EMEP program since 1999 Mercury measurements are available only from northern and northwestern Europe
Three monitoring networks currently operate in North America providing good coverage of Canada and the United States the Mercury Deposition Network the Canadian Air and Precipitation Monitoring Network and the Atmospheric Mercury Network More recently new sites have been established in Mexico extending coverage on the continent The stations monitor atmospheric mercury and mercury in precipitation which has measured since the mid-1990s Monitoring of mercury in the air and in precipitation has been underway in Asia for nearly a decade
Alert Nord
Point Barrow
Nuuk Stoacuterhoumlfethi
Mace Head
mercury and local and regional influences Mercury concentrations at remote sites in Asia are higher than in other regions of the Northern Hemisphere Coastal cities in China have lower levels than inland sites likely due to the influence of relatively clean
Measurement Trend
Gaseous elemental mercury Decrease of 14-18 per year
Total gaseous mercury Decrease of 22 to 174 in total
Total gaseous mercury Decreasing trend at some stations increasing at others
The monitoring network of the Arctic Monitoring and Assessment Programme (AMAP) includes air and deposition monitoring sites located in Arctic regions of Canada Greenland Iceland Norway Russia and Sweden
Building on existing national and regional monitoring networks the European Union-financed project
ldquoGlobal Mercury Observation Systemrdquo (GMOS) started in November 2010 Its goal is to develop a coordinated global system for monitoring mercury including a large network of ground-based monitoring stations New sites are being installed in regions where few monitoring stations exist especially in the Southern Hemisphere Two sites have been established in Antarctica one on the Antarctic Plateau and one on the coast
Ny-Aringlesund
Amderma Pallas
Raringouml Bredkaumllen
Listvyanka Diabla Gora
Mauna Loa
Mt Bachelor
Celestuacuten Calhau
Longobucco
Iskrba Niembro Monte Cimone Cap
Ferrat Mt Waliguan Ganghwa Island
Lulin
Cape Hedo Ev-K2
Mt Changbai
Minamata Mt Ailao
Nieuw Nickerie
Kodiakanal
Maheacute Island Manaus
Bariloche Cape Point
Amsterdam Island Cape Grim
Dumont drsquoUrville
AMAP CAMnet EMEP GMOS GMOS associated NADPAIRMoN NADPMDN
Air + precipitation Air Precipitation
20
UNEP Global Mercury Assessment 2013
John Munthe
The mercury background air monitoring station at Zeppelin mountain Svalbard
air from over the ocean Sites off the Asian coast however show higher levels of gaseous elemental mercury than the Northern Hemisphere background suggesting an outflow from the Asian mainland
Weather patterns have also been found to have a strong influence on seasonal patterns in mercury levels in the air at monitoring sites At the Mount Waliguan Observatory on the Tibetan Plateau for example northeasterly and easterly winds produced the highest levels of mercury
Measurements at high altitudes Measurements from ground-based stations above 2700 meters suggest that there is an inverse relationship between gaseous elemental mercury and gaseous oxidized mercury at these elevations In other words when there is more elemental mercury there is less oxidized mercury and vice versa These measurements are in good agreement with modelling results which gives additional confidence in current understanding of the behaviour of mercury at high altitude
An inverse relationship between total gaseous mercury and particulate concentration has also been observed in the high stratosphere From the transformation rate of total gaseous mercury to particulate-bound mercury it appears that gaseous mercury lasts about two years in the stratosphere
21
UNEP Global Mercury Assessment 2013
Atmospheric concentrations and deposition 6 Measurements and trends of mercury in precipitation Mercury deposited by precipitation decreased from the 1990s into the 2000s at many but not all sites in North America and Western Europe where such measurements were taken
Regional patterns are also evident including slightly higher levels in southern Europe than northern Europe and higher levels in Asia than in North America Total mercury concentrations in precipitation in China were much higher than those in Japan and South Korea Th is was mostly attributed to higher levels of gaseous oxidized mercury and particulate-bound mercury which are readily deposited by precipitation and thus not transported far
A comparison of data from Canadian and American monitoring sites found that deposition of mercury in precipitation was highest in summer
Dry deposition of mercury which is deposition not associated with precipitation is diffi cult to measure and consequently there is little information on trends in mercury dry deposition Th is lack of information means that it is also diffi cult to validate model results for dry deposition
106 44
474 72 91
5 7 71
05 1 5 10 100 500 1000
Total mercury emission (2005) kgcell
Modelled mercury air concentrations and deposition patterns Atmospheric mercury concentrations are highest in major industrial regions Models examining global patterns show that East and South Asia Europe North America and South Africa have the highest levels of elemental mercury in the air Concentrations are generally lower in the Southern Hemisphere than the Northern Hemisphere because most industrial activity is in northern regions Th ese model results are based on simulations using the 2005 global mercury emission inventory because the 2010 inventory has only recently become available
Intercontinental transport of mercury in the air has been examined to determine its impact on regional mercury levels Four models using diff erent parameters produced consistent results Depending on the region mercury emitted by distant sources contributes between 10 and 30 of annual mercury deposition Where local sources are low mercury transported from distant emission sources can account for more than half of the deposition East Asia is the dominant source region adding 10-14 to the deposition in
Contribution from sources outside receptor region
Model 40
GEOS-Chem GLEMOS GRAHM CMAQ-Hg
30
20
10
0 Arctic Europe North East Asia South Asia
America
Receptor region
(Left ) Global distribution of anthropogenic mercury emissions in 2005 with source regions that were considered in the analysis (North America South America Europe Africa Central Asia South Asia East Asia Australia and Oceania) and (right) the contribution of anthropogenic sources outside a particular receptor region to deposition within the receptor region
22
UNEP Global Mercury Assessment 2013
Modelling atmospheric transport and deposition Global models reproduce the movement of mercury in the atmosphere during which the mercury may move between continents They have been effective in examining sources of mercury to the Arctic and also for examining the outflow of pollution from South and Southeast Asia and its impact on western North America as well as the flow from eastern North America to Europe
Regional models on the scale of a continent or a basin such as the Mediterranean can provide more detail about specific source areas even to the level of individual industrial areas Reliable results however require a detailed understanding of mercury oxidation in the atmosphere about which there is considerably uncertainty
Most atmospheric transport models consider the full chain of mercury processes in the atmosphere Some models also consider how mercury is cycled in other atmospheric compartments such as soil vegetation snow freshwater and seawater
One of the largest sources of uncertainty in mercury models is the chemical mechanism used to determine how mercury changes forms in the air Improved experimental data can help improve model performance by making sure that the correct reactions are simulated The processes that lead from deposition to re-emission also need to be understood better Advances in this area show promise with model results becoming closer to estimates based on experimental data
other regions of the world Natural emissions and re-emissions account for 35-70 of total deposition in most regions Deposition is generally greater in low and mid-latitudes due to stronger sunlight higher concentrations of oxidants and higher precipitation
Regional mercury models show patterns at the scales of continents or individual seas The Mediterranean Sea for example is a net source of mercury as it emits more than is deposited to it In that region dry deposition generally exceeds deposition of mercury in precipitation In Central and Southern Europe total gaseous mercury concentrations and deposition in precipitation were both consistently higher than the European average
Across the United States dry deposition accounts for two-thirds of total annual deposition mainly from gaseous oxidized mercury A study examining sources and deposition of mercury to assess the
benefits of proposed emission control measures found that mercury transport from outside the country accounts for 68 of mercury deposition in the Northeast and up to 91 in the west-central United States Large point sources contribute up to three-quarters of nearby deposition and power plants contributed half of the deposition in the eastern part of the country This suggests that new emissions standards would primarily benefit eastern regions of the US
In Asia studies show high seasonal variation in mercury concentration and deposition Anthropogenic emissions are responsible for about 75 of deposition in East Asia In this region there is a net removal of gaseous oxidized mercury from the atmosphere and a net export of gaseous elemental mercury
In the Arctic gaseous elemental mercury levels in the atmosphere are depleted rapidly in spring when after the long Arctic winters sunlight returns Ozone is depleted at the same time and it is believed that bromine-containing compounds are the cause of the photo-chemical reactions that deplete ozone and mercury During these events gaseous oxidized mercury and particulate-bound mercury levels increase sharply suggesting that the gaseous mercury is oxidized and deposited enhancing mercury deposition in Arctic areas in springtime Recent research however has found that 50-80 of the deposited mercury is re-emitted within a few days Similar springtime mercury depletion events have been seen in Antarctica
23
UNEP Global Mercury Assessment 2013
Anthropogenic releases to the aquatic environment 7 Global assessment Previous UNEP global mercury assessments only considered emissions to the atmosphere The 2013 Report presents the first attempt at compiling a global inventory of mercury releases to aquatic environments Releases directly into the aquatic environment present a completely different chemistry set of pathways and fate to those released to air They are also more directly linked to the risks posed by mercury to global environmental and human health Unlike mercury releases to air which are predominantly in the form of gaseous elemental mercury releases to water are predominantly inorganic mercury and to a lesser extent liquid elemental mercury
At present only some sources of aquatic releases can be quantified with any confidence Thus many sources that may be important are not included in this first assessment of global aquatic releases For example land management practices that expose new geological sources of mercury in rocks and mineral soils or that re-mobilize previously deposited mercury cannot yet be assessed Two broad categories of current anthropogenic sources are considered here point sources of mercury release to water and diffuse releases of mercury as a result of its remobilisation from areas where it was previously deposited or accumulated due to human activity (ie contaminated sites) Artisanal and small-scale gold mining (ASGM) mercury-containing pesticides and fungicides used in agriculture and deforestation are considered separately
Point source releases to water from various sectors in tonnes per year with the range of the estimate and as a percentage of total anthropogenic emissions
Sector Releases (range) tonnes
Non-ferrous metal production 925 (193 - 268)
Consumer product waste 894 (222 - 308)
Chlor-alkali production 28 (10 ndash 55)
Oil refining 06 (03 ndash 1)
Grand Total 185 (426 ndash 582)
The global estimate of mercury release to water from point sources has been derived from the atmospheric emissions assessment and the approach employed in the UNEP Toolkit to partition total mercury releases between air land and water This approach has considerable uncertainty and may omit sectors where releases to water are high but air emissions are unimportant and therefore not addressed in the inventory Global releases from point sources were estimated to be 185 tonnes per year
For diffuse sources evaluating the relative contribution of anthropogenic and natural sources to the aquatic environment requires determining considerations of the various mercury inputs For some sectors data exist that allow a preliminary assessment of the amounts of mercury re-mobilized into aquatic systems
For mercury-contaminated sites the range of average soil concentrations of mercury reported for sites where mercury was mined used or otherwise released by human activity was considered The area of contamination is then used to determine how much mercury is available in soils and when combined with a factor for how much mercury is released from those soils in a year the total release can be estimated Among identified contaminated sites mercury mining is identified as the largest sector followed by mining of precious metals Total releases to aquatic environments from contaminated sites are estimated to be 83-335 tonnes per year
Releases to water from contaminated sites in tonnes per year with the range of the estimate
Sector Releases (range) tonnes
Primary mercury mining sites 67 ndash 266
Precious metal production sites 14 ndash 55
Non-ferrous metal production sites 01 ndash 05
Chlor-alkali production sites 01 ndash 05
Other industrial sites 01 ndash 03
Grand Total 83 ndash 335
24
UNEP Global Mercury Assessment 2013
Much of the mercury released from artisanal and small-scale gold mining goes into rivers lakes soils and sediments and tailings From soils and tailings it may be re-mobilized by leaching and erosion In addition mining may disturb mercury-containing soils and sediments that may then erode more quickly releasing more mercury than would otherwise have become available from natural erosion A key factor in these processes is the local hydrological cycle of precipitation evaporation run-off and river flow To account for this in the assessment countries were designated as dry wet or intermediate to determine the relative importance of erosion The tropical and subtropical countries which have the greatest activity in this sector also tend to experience high precipitation and run-off exacerbating this source of mercury release and re-mobilization Total worldwide releases of mercury to land and water from ASGM were estimated at over 800 tonnes per year How much of this is released to water cannot yet be determined
Mercury continues to be used in pesticides and fungicides 2100 tonnes of mercury were released in the decade of the 1960s through such agrochemical uses Current data are unavailable although the use of mercury in these products has been greatly reduced
Deforestation especially in the Amazon Basin can lead to extensive soil erosion and thus the release of mercury previously accumulated in soils Using 2010 figures for deforestation rates around the world and an estimate of soil concentrations of mercury as much as 260 tonnes of mercury may have been released into rivers in 2010 as a result of deforestation worldwide
Because this is the first attempt to quantify global mercury releases to the aquatic environment there is no previous measurement against which these results can be compared Thus it is not possible at this time to evaluate trends in releases
Uncertainties in release estimates Estimating global releases of mercury to aquatic environments is being done here for the first time Many data are missing and others are imprecise A number of assumptions have been made based on what measurements are available or on other grounds to extrapolate from known quantities or to calculate aquatic releases in relation to atmospheric
or other emissions Thus the results should be treated with great caution It is nonetheless clear that anthropogenic sources and human activity contribute hundreds of tonnes of mercury to aquatic environments each year a substantial amount relative to estimated natural releases 150-960 tonnes per year from terrestrial environments
Lapshin Shutterstockcom
Phil Augustavo istockphotocom
Bureau of Land Managem
ent
Contaminated sites (top) erosion following deforestation (middle) and a flooded store of mercury-contaminated waste (lower) illustrate potential sources of mercury releases to water
25
UNEP Global Mercury Assessment 2013
Aquatic pathways transport and fate 8 Mercury in aquatic environments The pathways and fate of mercury in aquatic environments are important because it is in waters sediments and wetland soils that inorganic mercury is converted into methylmercury which is toxic and concentrates in animals The majority of human exposure to mercury and the health risk that comes with mercury exposure is from consumption of marine foods Thus this section focuses on the worldrsquos oceans Some freshwater systems however are important sources of fish for human consumption especially for subsistence and recreational fisheries often among indigenous peoples Artisanal and small-scale gold mining (ASGM) communities may also be affected through fish consumption and drinking water if those are contaminated by local releases
The major processes of mercury cycling are generally similar for all aquatic systems Inorganic mercury in dissolved or particulate form is the dominant mercury type in most marine and fresh waters Dissolved gaseous elemental mercury accounts for less than 30 of total mercury in water Methylmercury is often present at trace levels but may in some settings reach 30 of total mercury In freshwater and coastal environments inorganic mercury is transformed into methylmercury primarily in sediments In the open ocean this conversion takes place largely at intermediate depths between 200 and 1000 meters in the water column Mercury is lost from aquatic systems in two ways When inorganic mercury is reduced to elemental mercury it can be re-emitted to the atmosphere When inorganic mercury binds to particulates in water it can settle out rapidly and be buried in sediments Deep burial in ocean sediments is one of the major pathways by which mercury is removed from the biologically active environment
The global mercury cycle is chemically and physically complex Thus it is necessary to use models to study describe and predict what happens and will happen to mercury in the aquatic environment Until recently only one model existed that incorporated
air land and water into a unified whole The model has been validated against observations of mercury and represents the current scientific consensus The largest potential errors in this model in terms of the aquatic cycle concern details of the exchange of mercury between air and water
Pathways and fate of mercury in the oceans Model simulations suggest that anthropogenic impacts on mercury levels in the ocean are greatest in the surface waters the top 100 meters or so of the water column While model results vary one recent estimate suggests that anthropogenic emissions over the last 100 years have doubled the concentration of mercury in the surface layer of the ocean and increased it by 25 in intermediate waters and by 10 in deep waters The difference is due to the length of time it takes for surface waters to circulate to the depths
Models and measurements agree that direct deposition from the atmosphere is the dominant pathway by which mercury reaches the oceans The exceptions are smaller semi-enclosed basins such as the Mediterranean Sea or the Arctic Ocean where river runoff coastal erosion and ocean currents
Ugo M
ontaldo Shutterstockcom
26
UNEP Global Mercury Assessment 2013
account for about half of mercury inputs The most recent modelling effort suggests that total deposition input of mercury to the oceans in 2008 was 3700 tonnes
Other mercury pathways appear less important on a global basis Rivers are estimated to carry more than 2800 tonnes of mercury each year but only about 380 tonnes of this is transported offshore The rest is trapped by particles in estuaries Groundwater and re-mobilization from sediments provide 100shy800 tonnes of mercury to the oceans each year Undersea hydrothermal vents add less than 600 tonnes of mercury to the oceans There are high concentrations of mercury in vent fluids but a great deal of the mercury is precipitated as solids once the vent fluids enter seawater
Models suggest that globally about 70 of the mercury deposited into the ocean is re-emitted to the atmosphere Oxidized mercury in surface waters is reduced by biological and photochemical processes to the elemental form that is volatile and readily re-emitted The removal of this mercury ultimately reduces the pool of mercury that could be converted to methylmercury and be accumulated by marine organisms The re-emission process thus simultaneously prolongs the lifetime of mercury cycling through the atmosphere and upper ocean and acts to reduce mercury availability for marine food webs
Any changes in the efficiency of mercury reduction in surface waters or the rate of re-emission is likely to impact mercury concentrations in surface waters and the air One example is the effect of sea ice in the Arctic Ocean which blocks the re-emission
Tony Magdaraog Shutterstockcom
Mercury accumulated in marine food-webs can enter the human diet
of elemental mercury leaving elevated levels in waters under ice Changes in primary productivity could change the rate at which mercury is bound to particles thus affecting re-emission to the atmosphere as well as rates of downward transport in the ocean Changes in oxidant levels in the atmosphere such as ozone and bromine may also influence the rate of oxidation of gaseous elemental mercury and thus deposition rates to the ocean
Methylmercury in the ocean Natural bacterial processes in seawater and in sediments in coastal environments convert inorganic mercury to methylmercury Methylmercury levels are highest in the subsurface waters of many oceans because it is formed at these intermediate depths likely as a result of the decomposition of organic material falling from surface waters Current understanding indicates that about 300 tonnes of methylmercury is produced in the upper ocean by this and related processes By contrast only about 80 tonnes of methylmercury reaches the ocean from other sources such as atmospheric deposition rivers and diffusion from sediments
Current modelling indicates that methylmercury stays in the upper ocean for about 11 years Deshymethylation by photochemical reaction or by microbial activity is the major removal process for methylmercury in the ocean About 240 tonnes of methylmercury is removed by this process from the surface waters of the ocean per year
The other important pathway for methylmercury in seawater is uptake into marine food webs Although only about 40 tonnes per year is taken up in this way it is this fraction that poses risks to marine animals and human consumers of seafood Methylmercury is a problem for several reasons First it is taken up by plankton much more efficiently than is inorganic mercury resulting in concentrations in plankton that are as high as 10000 times the concentration in seawater Second methylmercury is absorbed through the intestine of animals much more easily than is inorganic mercury Third methylmercury biomagnifies as it moves up the food web Thus methylmercury becomes an increasingly greater proportion of the mercury in organisms higher in the food web This explains why some indigenous populations that consume top marine predators such as fish seals and whales have some of the worldrsquos highest concentrations of methylmercury giving rise to health concerns
27
UNEP Global Mercury Assessment 2013
Pathways and fate of mercury in freshwater Observations and modelling both show that there are in general many similarities between mercury chemistry pathways and fate in lakes and in the oceans but with obvious differences in scale and in the relative importance of different processes Modelling of mercury dynamics was done for four lakes with a history of direct mercury inputs from the largest freshwater lake in the world (Lake Superior) to small lakes in Ontario Canada Atmospheric deposition and river inflow were the main sources of inorganic mercury Much of the mercury input from lake and river catchments was associated with dissolved and particulate organic matter The dominant mercury removal mechanisms as in saltwater were burial in sediments and photochemical reduction of oxidized mercury to elemental mercury followed by re-emission to the air In Lake Superior and Lake Michigan there is evidence for methylation of mercury in the water column as is seen in the open ocean
Methylmercury levels in freshwater fish vary with the level of deposition of mercury from the air though other factors such as inputs from the watershed and the number of trophic levels within the lakersquos food web are also important Methylation predominantly occurred in lake sediments and wetlands and floodplain soils where sulphateshyreducing bacteria are believed to be primarily responsible Methylmercury is de-methylated in sediments and also taken away in the outlet river from each lake
Some 400-1400 tonnes of mercury are estimated globally to be trapped behind dams and other man-made impoundments each year This has in many cases led to significant increases in total mercury and methylmercury levels in water and of methylmercury in fish and other aquatic species When artificial lakes are created plant material is submerged leading to decay and anoxia In these conditions microbially driven methylation of inorganic mercury takes place In some cases the elevated mercury levels have also been observed downstream from the artificial lakes and reservoirs
Anthropogenic impacts on aquatic mercury levels Two studies have reported that the Atlantic and Pacific Oceans have shown opposing trends over recent decades While the influence of changing ocean currents and other oceanographic factors may be a factor the trends do make sense in light of patterns of anthropogenic emissions In the North Pacific Ocean mercury concentrations appear to have increased at depths between 200 and 1000 meters over the last few decades This increase coincides with the rapid industrialization of East Asia
In the North Atlantic however results from near Bermuda suggest a substantial decrease in mercury concentration and a change in the mercury profile through the water column The Mediterranean Sea too showed a decrease in mercury concentration between 1990 and 2004 These findings are consistent with atmospheric data from around the North Atlantic The conclusion is that mercury levels in seawater in the North Atlantic were elevated by human activity but may now be declining likely as a result of decreased emissions from North America and Europe
A complementary approach to measuring mercury in seawater is to measure mercury in aquatic animals which accumulate and integrate mercury over time Teeth hair feathers and eggshells are useful long-term archives of mercury concentrations and can provide data from the pre-industrial period (ie before 1800) as well as more recent periods
Among marine animals samples are available from several regions particularly from the Arctic where cold dry conditions help preserve animal tissues Mercury concentrations between the 13th and 16th
centuries were relatively stable From the mid- to late 19th century to the end of the 20th century mercury levels increased by an average of 12 times On average therefore about 92 of the mercury in Arctic marine wildlife today is likely to be of anthropogenic origin
Similar findings were found for a 700-year sequence of seabird eggshells from the South China Sea Mercury levels increased steadily between 1800 and 2000 with a particularly rapid increase after 1970 Concentrations since 2000 are about 10 times higher than pre-industrial levels with 91 of the mercury now likely to be of anthropogenic origin In the Antarctic studies of seal hairs show that pre-industrial mercury levels were only 60 of recent levels The relatively small difference
28
UNEP Global Mercury Assessment 2013
Historical Hg concentration as a proportion of present-day 100
80
60
40
20
0
Beluga teeth Human teeth
Gyrfalcon feathers Perigrine falcon feathers
Polar bear hair Ringed seal teeth
1200 1300 1400 1500 1600 1700 1800 1900 2000
between pre-industrial and modern mercury levels in Antarctic is consistent with lower mercury emissions and atmospheric concentrations in the Southern Hemisphere as compared with the Northern Hemisphere
The timing of long-term increases of mercury in aquatic animals can shed light on the likely sources of mercury emissions that were responsible The industrialization of Europe and North America appear responsible for the large increases in marine mercury levels that began in the 19th century as these increases occurred prior to recent Asian industrialization As with water concentrations in the Pacific Ocean recent rapid increases in mercury in seabird eggs in the South China Sea coincide with industrialization in Asia
The time lag in aquatic ecosystem response One important conclusion from air-ocean modeling is that the oceans have not yet reached equilibrium with current atmospheric levels of mercury This lag is due to several factors First mercury stays in the upper ocean above 200 meters depth for about 30 years and for centuries in intermediate and deep waters This is much longer than the one year residence time in the lower atmosphere Thus removal from the ocean takes much longer than does removal from the air and so concentrations will change more slowly
Second because of the long lifetime of mercury in deeper ocean waters a great deal of natural mercury is present in the ocean already about 100000 tonnes out of a total of 135000 tonnes in intermediate waters and 200000 out of 220000 tonnes in deep waters
Rune Dietz
Analysis of museum samples reflects the increase in mercury emissions and releases since the mid-19th century associated with anthropogenic activities
Third vertical transport of mercury from intermediate depths back to the surface returns a substantial amount of mercury to the biologically active zone each year As a result average mercury concentrations in seawater and marine animals are likely to increase slowly for decades if not centuries even if atmospheric levels stabilize at present levels In short the effects of historical anthropogenic emissions from Europe and North America are still being observed in the oceans at the same time that the effects of the recent rise in emissions from Asia are being seen
Regionally different trends can be expected depending on distance from sources and ocean circulation patterns In the North Atlantic north of 55deg N it will take 50-600 years to achieve equilibrium between atmospheric and seawater mercury levels In the North Pacific this process is estimated to take 500-700 years and in the Antarctic 700-1000 years The Arctic Ocean by contrast is smaller and will only take about 35 years to reflect changes in atmospheric mercury levels Surface waters of the Mediterranean Sea should show also changes within 10-50 years
Time lags in the responses of many freshwaters and their food-webs to changes in atmospheric mercury levels are also expected Although some immediate recovery following reductions in atmospheric mercury deposition rates is likely full recovery may take decades centuries or longer depending on the characteristics of the area Highly polluted freshwaters with catchments and sediments containing large amounts of anthropogenic mercury will recover most slowly as is already observed around point sources such as smelters that have closed down
29
UNEP Global Mercury Assessment 2013
Major gaps in knowledge 9 Large uncertainties remain in global estimates of mercury emissions to the air These stem from various sources including the availability of information on activity levels but mainly from the lack of information concerning the mercury content of some raw materials and the validity of assumptions regarding processes and technologies employed to reduce mercury emissions including their rates of application and effectiveness The accuracy and precision of measurement-based estimates can depend on the validity of extrapolating measurements made at infrequent intervals to longer periods or measurements made at one plant to other facilities with similar operations
Potentially important emissions sectors that are still not quantified in the emissions inventory include the use of mercury in vinyl-chloride monomer production secondary metals production oil and gas extraction transport and processing industrial and hazardous waste incineration and disposal sewage sludge incineration and dental fillings preparation and removal
Current measurements and their evaluation are inadequate for determining spatial and temporal trends Improved more extensive and better coordinated measurements are needed A permanent global integrated monitoring network for atmospheric mercury and mercury deposition is needed to achieve this goal The atmospheric network sites should be closely integrated with water soil and biological monitoring networks The results can be used for model testing and evaluation as well as for more accurately detailing the geographic impact of anthropogenic emissions Monitoring of mercury concentrations in the important marine food species is essential to understanding possible human health impacts and the effects of future emissions changes
Better data on mercury distribution in the troposphere is needed to improve understanding of long-range transport and source-receptor relationships Coordinated studies at high altitudes and by aircraft are needed This information will
also help validate regional and global scale models improving their prediction capabilities with regard to different policy scenarios
Key processes related to global transport and cycling of mercury remain inadequately understood The chemical form of gaseous oxidized mercury is unknown Reduction and oxidation rates for mercury in the presence of atmospheric oxidants need further study including determining which oxidants are important New measurements and modelling studies are needed to examine key chemical and physical processes that affect global transport and cycling
Few data are available for reporting mercury releases to aquatic systems Systematic and consistent monitoring of mercury releases to the air is required especially for contaminated systems Releases of mercury from soils into waters depend greatly on climate and topography and these parameters need to be better accounted for Consistent approaches for measuring and reporting releases from point sources are needed to ensure comparability of data from around the world In particular the actual role of artisanal and small-scale gold mining (ASGM) in emissions to air and releases to water needs to be more accurately estimated
The link between mercury deposition methylation and uptake by living organisms needs further study The parameters that determine the rates of exchange of mercury compounds between air and sea air and soil and air and vegetation are not fully understood Whole-ecosystem studies of mercury are needed to better understand biogeochemical cycling Methylationdemethylation rates and their spatial and temporal variations and relationship to climatic factors need to be determined in most of worldrsquos major ocean basins as well as in representative freshwaters
30
UNEP Global Mercury Assessment 2013
Key findings of the 2013 assessment 10 Atmosphere Total anthropogenic emissions of mercury to the atmosphere in 2010 are estimated at 1960 (1010shy4070) tonnes which is about 30 of the total mercury that was emitted and re-emitted from anthropogenic and natural sources in that year The largest anthropogenic sources are associated with artisanal and small-scale gold mining (ASGM) and coal burning which together account for about 62 of the annual total anthropogenic emissions to air Other major sectors include ferrous and non-ferrous metal production and cement production
East and Southeast Asia are responsible for about 40 of global anthropogenic emissions About 75 of the mercury from this region comes from China which is about one-third of the global total Increased estimates for emissions from ASGM largely a result of newly obtained data and improved information mean that South America and Sub-Saharan Africa are also responsible for a greater proportion of global emissions than was previously assumed
Anthropogenic emissions over time have increased mercury loads present in the environment This leads to higher rates of re-emission and also means that there will be a time lag of years or decades between emissions reductions and lower mercury levels in the food web including pathways of human exposure
Mercury emissions to the atmosphere likely peaked in the 1950s to 1970s and subsequently declined because of reductions in Europe Russia and North America Emission trends are unclear due to changes in methods employed to produce inventories and differences in the sectors that have been accounted at different times There are however some indications that emissions may be rising again with increases from East Asia offsetting continuing reductions in Europe and North America
Aquatic environments Natural processes in aquatic systems convert less toxic elemental and inorganic mercury into much more toxic methylmercury Methylmercury concentrates and accumulates in the food web leading to high concentrations in some species of seafood and fish that many people eat
Anthropogenic releases of mercury to aquatic environments contribute hundreds of tonnes to the amount of mercury cycling in the environment Diffuse releases and point sources appear equally important Atmospheric deposition however remains the most important input of mercury to land and oceans and has increased the amount of mercury in many environmental compartments by a factor of two or three since the start of the industrial age On land mercury that is deposited is largely retained in soils and vegetation increasing the available pool for re-mobilisation to adjacent aquatic systems Re-emission from soils however is a major addition to atmospheric mercury
Hydrology is the most important factor in the transport of mercury from catchments to downstream environments Relatively little of this mercury reaches the open ocean as most is captured in sediments behind dams in estuaries and near the coast Changes in land cover and land use can have a large effect on mercury mobilisation as exposed soils erode and mercury leaches into the water table
Concentrations of mercury in Arctic marine animals today are about 10-12 times higher than in preshyindustrial times (ie prior to about 1800) This means that on average about 92 of the mercury in marine predators such as seabirds seals and whales is anthropogenic in origin The timing of the increase suggest that 19th and early 20th century emissions from Europe North America and Russia were responsible Increases mercury concentrations in seabirds in the South China Sea appear to be more recent than the Arctic increases coinciding with increasing industrialisation in East and Southeast Asia
31
UNEP Global Mercury Assessment 2013
K+S Entsorgung Gm
bH
Recovered mercury is being stockpiled at long-term storage sites above- and as shown here below ground
The upper 100 meters of the oceans have twice the mercury that they did a century ago Intermediate and deeper waters have 10-25 more mercury on average reflecting the slow transport of mercury downwards in the oceans Seawater concentrations will thus be especially slow in responding to changes in mercury inputs from atmospheric deposition and river flow As a result mercury concentrations in marine biota are likely to increase slowly for decades to centuries even without an increase in atmospheric emissions
In freshwater ecosystems atmospheric deposition and re-mobilisation from soils slow the reduction of mercury levels even in regions where atmospheric concentrations have decreased due to emission controls
Further increases in atmospheric emissions will have long-term consequences for commercial fisheries and all consumers of marine and freshwater foods
It is likely to be years or decades before reductions in anthropogenic emissions and releases of mercury have a demonstrable effect on mercury levels throughout the environment and in the fish and marine mammals which are part of the human food-chain This only reinforces the need to act now to continue and strengthen international efforts to reduce current mercury emissions and releases Delays in action now will inevitably lead to slower recovery of the worldrsquos ecosystems in future from mercury contamination leaving an even greater legacy of pollution for future generations
32
Division of Technology Industry and Economics (DTIE) Chemicals Branch Geneva Switzerland January 2013
Job number DTI1636GE
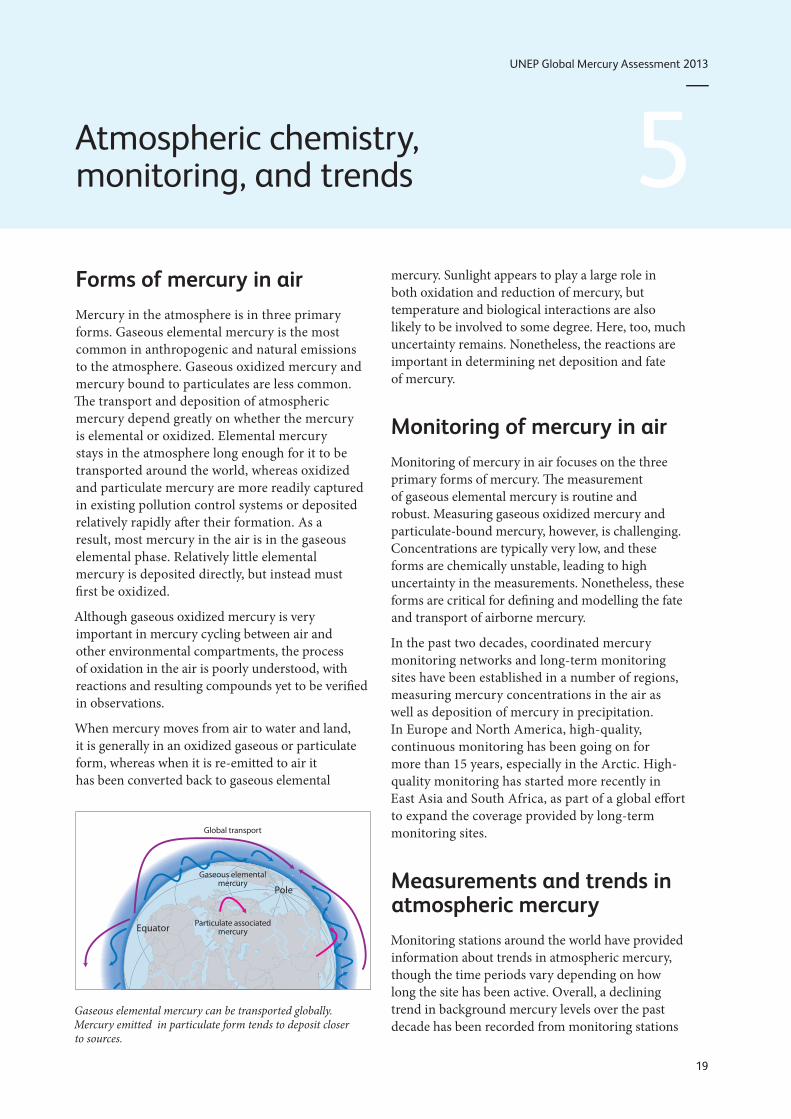
UNEP Global Mercury Assessment 2013
Atmospheric chemistry monitoring and trends 5 Forms of mercury in air Mercury in the atmosphere is in three primary forms Gaseous elemental mercury is the most common in anthropogenic and natural emissions to the atmosphere Gaseous oxidized mercury and mercury bound to particulates are less common The transport and deposition of atmospheric mercury depend greatly on whether the mercury is elemental or oxidized Elemental mercury stays in the atmosphere long enough for it to be transported around the world whereas oxidized and particulate mercury are more readily captured in existing pollution control systems or deposited relatively rapidly after their formation As a result most mercury in the air is in the gaseous elemental phase Relatively little elemental mercury is deposited directly but instead must fi rst be oxidized
Although gaseous oxidized mercury is very important in mercury cycling between air and other environmental compartments the process of oxidation in the air is poorly understood with reactions and resulting compounds yet to be verified in observations
When mercury moves from air to water and land it is generally in an oxidized gaseous or particulate form whereas when it is re-emitted to air it has been converted back to gaseous elemental
Particulate associated mercury
Pole
Equator
Gaseous elemental mercury
Global transport
Gaseous elemental mercury can be transported globally Mercury emitted in particulate form tends to deposit closer to sources
mercury Sunlight appears to play a large role in both oxidation and reduction of mercury but temperature and biological interactions are also likely to be involved to some degree Here too much uncertainty remains Nonetheless the reactions are important in determining net deposition and fate of mercury
Monitoring of mercury in air Monitoring of mercury in air focuses on the three primary forms of mercury The measurement of gaseous elemental mercury is routine and robust Measuring gaseous oxidized mercury and particulate-bound mercury however is challenging Concentrations are typically very low and these forms are chemically unstable leading to high uncertainty in the measurements Nonetheless these forms are critical for defining and modelling the fate and transport of airborne mercury
In the past two decades coordinated mercury monitoring networks and long-term monitoring sites have been established in a number of regions measuring mercury concentrations in the air as well as deposition of mercury in precipitation In Europe and North America high-quality continuous monitoring has been going on for more than 15 years especially in the Arctic High-quality monitoring has started more recently in East Asia and South Africa as part of a global effort to expand the coverage provided by long-term monitoring sites
Measurements and trends in atmospheric mercury Monitoring stations around the world have provided information about trends in atmospheric mercury though the time periods vary depending on how long the site has been active Overall a declining trend in background mercury levels over the past decade has been recorded from monitoring stations
19
UNEP Global Mercury Assessment 2013
in many regions Other regions however show an increase in mercury levels
The sites also provide information about geographical patterns reflecting both background levels of
Trends in atmospheric measurements of mercury
Site(s) Period
Mace Head Ireland 1996-2011
North America rural sites 1995-2005
High Arctic sub-Arctic Up to 20 years of records mid-latitudes
Monitoring networks Mercury monitoring in Europe is carried out under the European Monitoring and Evaluation Programme (EMEP) one of the first international environmental measurement networks Heavy metals such as mercury have been included in the EMEP program since 1999 Mercury measurements are available only from northern and northwestern Europe
Three monitoring networks currently operate in North America providing good coverage of Canada and the United States the Mercury Deposition Network the Canadian Air and Precipitation Monitoring Network and the Atmospheric Mercury Network More recently new sites have been established in Mexico extending coverage on the continent The stations monitor atmospheric mercury and mercury in precipitation which has measured since the mid-1990s Monitoring of mercury in the air and in precipitation has been underway in Asia for nearly a decade
Alert Nord
Point Barrow
Nuuk Stoacuterhoumlfethi
Mace Head
mercury and local and regional influences Mercury concentrations at remote sites in Asia are higher than in other regions of the Northern Hemisphere Coastal cities in China have lower levels than inland sites likely due to the influence of relatively clean
Measurement Trend
Gaseous elemental mercury Decrease of 14-18 per year
Total gaseous mercury Decrease of 22 to 174 in total
Total gaseous mercury Decreasing trend at some stations increasing at others
The monitoring network of the Arctic Monitoring and Assessment Programme (AMAP) includes air and deposition monitoring sites located in Arctic regions of Canada Greenland Iceland Norway Russia and Sweden
Building on existing national and regional monitoring networks the European Union-financed project
ldquoGlobal Mercury Observation Systemrdquo (GMOS) started in November 2010 Its goal is to develop a coordinated global system for monitoring mercury including a large network of ground-based monitoring stations New sites are being installed in regions where few monitoring stations exist especially in the Southern Hemisphere Two sites have been established in Antarctica one on the Antarctic Plateau and one on the coast
Ny-Aringlesund
Amderma Pallas
Raringouml Bredkaumllen
Listvyanka Diabla Gora
Mauna Loa
Mt Bachelor
Celestuacuten Calhau
Longobucco
Iskrba Niembro Monte Cimone Cap
Ferrat Mt Waliguan Ganghwa Island
Lulin
Cape Hedo Ev-K2
Mt Changbai
Minamata Mt Ailao
Nieuw Nickerie
Kodiakanal
Maheacute Island Manaus
Bariloche Cape Point
Amsterdam Island Cape Grim
Dumont drsquoUrville
AMAP CAMnet EMEP GMOS GMOS associated NADPAIRMoN NADPMDN
Air + precipitation Air Precipitation
20
UNEP Global Mercury Assessment 2013
John Munthe
The mercury background air monitoring station at Zeppelin mountain Svalbard
air from over the ocean Sites off the Asian coast however show higher levels of gaseous elemental mercury than the Northern Hemisphere background suggesting an outflow from the Asian mainland
Weather patterns have also been found to have a strong influence on seasonal patterns in mercury levels in the air at monitoring sites At the Mount Waliguan Observatory on the Tibetan Plateau for example northeasterly and easterly winds produced the highest levels of mercury
Measurements at high altitudes Measurements from ground-based stations above 2700 meters suggest that there is an inverse relationship between gaseous elemental mercury and gaseous oxidized mercury at these elevations In other words when there is more elemental mercury there is less oxidized mercury and vice versa These measurements are in good agreement with modelling results which gives additional confidence in current understanding of the behaviour of mercury at high altitude
An inverse relationship between total gaseous mercury and particulate concentration has also been observed in the high stratosphere From the transformation rate of total gaseous mercury to particulate-bound mercury it appears that gaseous mercury lasts about two years in the stratosphere
21
UNEP Global Mercury Assessment 2013
Atmospheric concentrations and deposition 6 Measurements and trends of mercury in precipitation Mercury deposited by precipitation decreased from the 1990s into the 2000s at many but not all sites in North America and Western Europe where such measurements were taken
Regional patterns are also evident including slightly higher levels in southern Europe than northern Europe and higher levels in Asia than in North America Total mercury concentrations in precipitation in China were much higher than those in Japan and South Korea Th is was mostly attributed to higher levels of gaseous oxidized mercury and particulate-bound mercury which are readily deposited by precipitation and thus not transported far
A comparison of data from Canadian and American monitoring sites found that deposition of mercury in precipitation was highest in summer
Dry deposition of mercury which is deposition not associated with precipitation is diffi cult to measure and consequently there is little information on trends in mercury dry deposition Th is lack of information means that it is also diffi cult to validate model results for dry deposition
106 44
474 72 91
5 7 71
05 1 5 10 100 500 1000
Total mercury emission (2005) kgcell
Modelled mercury air concentrations and deposition patterns Atmospheric mercury concentrations are highest in major industrial regions Models examining global patterns show that East and South Asia Europe North America and South Africa have the highest levels of elemental mercury in the air Concentrations are generally lower in the Southern Hemisphere than the Northern Hemisphere because most industrial activity is in northern regions Th ese model results are based on simulations using the 2005 global mercury emission inventory because the 2010 inventory has only recently become available
Intercontinental transport of mercury in the air has been examined to determine its impact on regional mercury levels Four models using diff erent parameters produced consistent results Depending on the region mercury emitted by distant sources contributes between 10 and 30 of annual mercury deposition Where local sources are low mercury transported from distant emission sources can account for more than half of the deposition East Asia is the dominant source region adding 10-14 to the deposition in
Contribution from sources outside receptor region
Model 40
GEOS-Chem GLEMOS GRAHM CMAQ-Hg
30
20
10
0 Arctic Europe North East Asia South Asia
America
Receptor region
(Left ) Global distribution of anthropogenic mercury emissions in 2005 with source regions that were considered in the analysis (North America South America Europe Africa Central Asia South Asia East Asia Australia and Oceania) and (right) the contribution of anthropogenic sources outside a particular receptor region to deposition within the receptor region
22
UNEP Global Mercury Assessment 2013
Modelling atmospheric transport and deposition Global models reproduce the movement of mercury in the atmosphere during which the mercury may move between continents They have been effective in examining sources of mercury to the Arctic and also for examining the outflow of pollution from South and Southeast Asia and its impact on western North America as well as the flow from eastern North America to Europe
Regional models on the scale of a continent or a basin such as the Mediterranean can provide more detail about specific source areas even to the level of individual industrial areas Reliable results however require a detailed understanding of mercury oxidation in the atmosphere about which there is considerably uncertainty
Most atmospheric transport models consider the full chain of mercury processes in the atmosphere Some models also consider how mercury is cycled in other atmospheric compartments such as soil vegetation snow freshwater and seawater
One of the largest sources of uncertainty in mercury models is the chemical mechanism used to determine how mercury changes forms in the air Improved experimental data can help improve model performance by making sure that the correct reactions are simulated The processes that lead from deposition to re-emission also need to be understood better Advances in this area show promise with model results becoming closer to estimates based on experimental data
other regions of the world Natural emissions and re-emissions account for 35-70 of total deposition in most regions Deposition is generally greater in low and mid-latitudes due to stronger sunlight higher concentrations of oxidants and higher precipitation
Regional mercury models show patterns at the scales of continents or individual seas The Mediterranean Sea for example is a net source of mercury as it emits more than is deposited to it In that region dry deposition generally exceeds deposition of mercury in precipitation In Central and Southern Europe total gaseous mercury concentrations and deposition in precipitation were both consistently higher than the European average
Across the United States dry deposition accounts for two-thirds of total annual deposition mainly from gaseous oxidized mercury A study examining sources and deposition of mercury to assess the
benefits of proposed emission control measures found that mercury transport from outside the country accounts for 68 of mercury deposition in the Northeast and up to 91 in the west-central United States Large point sources contribute up to three-quarters of nearby deposition and power plants contributed half of the deposition in the eastern part of the country This suggests that new emissions standards would primarily benefit eastern regions of the US
In Asia studies show high seasonal variation in mercury concentration and deposition Anthropogenic emissions are responsible for about 75 of deposition in East Asia In this region there is a net removal of gaseous oxidized mercury from the atmosphere and a net export of gaseous elemental mercury
In the Arctic gaseous elemental mercury levels in the atmosphere are depleted rapidly in spring when after the long Arctic winters sunlight returns Ozone is depleted at the same time and it is believed that bromine-containing compounds are the cause of the photo-chemical reactions that deplete ozone and mercury During these events gaseous oxidized mercury and particulate-bound mercury levels increase sharply suggesting that the gaseous mercury is oxidized and deposited enhancing mercury deposition in Arctic areas in springtime Recent research however has found that 50-80 of the deposited mercury is re-emitted within a few days Similar springtime mercury depletion events have been seen in Antarctica
23
UNEP Global Mercury Assessment 2013
Anthropogenic releases to the aquatic environment 7 Global assessment Previous UNEP global mercury assessments only considered emissions to the atmosphere The 2013 Report presents the first attempt at compiling a global inventory of mercury releases to aquatic environments Releases directly into the aquatic environment present a completely different chemistry set of pathways and fate to those released to air They are also more directly linked to the risks posed by mercury to global environmental and human health Unlike mercury releases to air which are predominantly in the form of gaseous elemental mercury releases to water are predominantly inorganic mercury and to a lesser extent liquid elemental mercury
At present only some sources of aquatic releases can be quantified with any confidence Thus many sources that may be important are not included in this first assessment of global aquatic releases For example land management practices that expose new geological sources of mercury in rocks and mineral soils or that re-mobilize previously deposited mercury cannot yet be assessed Two broad categories of current anthropogenic sources are considered here point sources of mercury release to water and diffuse releases of mercury as a result of its remobilisation from areas where it was previously deposited or accumulated due to human activity (ie contaminated sites) Artisanal and small-scale gold mining (ASGM) mercury-containing pesticides and fungicides used in agriculture and deforestation are considered separately
Point source releases to water from various sectors in tonnes per year with the range of the estimate and as a percentage of total anthropogenic emissions
Sector Releases (range) tonnes
Non-ferrous metal production 925 (193 - 268)
Consumer product waste 894 (222 - 308)
Chlor-alkali production 28 (10 ndash 55)
Oil refining 06 (03 ndash 1)
Grand Total 185 (426 ndash 582)
The global estimate of mercury release to water from point sources has been derived from the atmospheric emissions assessment and the approach employed in the UNEP Toolkit to partition total mercury releases between air land and water This approach has considerable uncertainty and may omit sectors where releases to water are high but air emissions are unimportant and therefore not addressed in the inventory Global releases from point sources were estimated to be 185 tonnes per year
For diffuse sources evaluating the relative contribution of anthropogenic and natural sources to the aquatic environment requires determining considerations of the various mercury inputs For some sectors data exist that allow a preliminary assessment of the amounts of mercury re-mobilized into aquatic systems
For mercury-contaminated sites the range of average soil concentrations of mercury reported for sites where mercury was mined used or otherwise released by human activity was considered The area of contamination is then used to determine how much mercury is available in soils and when combined with a factor for how much mercury is released from those soils in a year the total release can be estimated Among identified contaminated sites mercury mining is identified as the largest sector followed by mining of precious metals Total releases to aquatic environments from contaminated sites are estimated to be 83-335 tonnes per year
Releases to water from contaminated sites in tonnes per year with the range of the estimate
Sector Releases (range) tonnes
Primary mercury mining sites 67 ndash 266
Precious metal production sites 14 ndash 55
Non-ferrous metal production sites 01 ndash 05
Chlor-alkali production sites 01 ndash 05
Other industrial sites 01 ndash 03
Grand Total 83 ndash 335
24
UNEP Global Mercury Assessment 2013
Much of the mercury released from artisanal and small-scale gold mining goes into rivers lakes soils and sediments and tailings From soils and tailings it may be re-mobilized by leaching and erosion In addition mining may disturb mercury-containing soils and sediments that may then erode more quickly releasing more mercury than would otherwise have become available from natural erosion A key factor in these processes is the local hydrological cycle of precipitation evaporation run-off and river flow To account for this in the assessment countries were designated as dry wet or intermediate to determine the relative importance of erosion The tropical and subtropical countries which have the greatest activity in this sector also tend to experience high precipitation and run-off exacerbating this source of mercury release and re-mobilization Total worldwide releases of mercury to land and water from ASGM were estimated at over 800 tonnes per year How much of this is released to water cannot yet be determined
Mercury continues to be used in pesticides and fungicides 2100 tonnes of mercury were released in the decade of the 1960s through such agrochemical uses Current data are unavailable although the use of mercury in these products has been greatly reduced
Deforestation especially in the Amazon Basin can lead to extensive soil erosion and thus the release of mercury previously accumulated in soils Using 2010 figures for deforestation rates around the world and an estimate of soil concentrations of mercury as much as 260 tonnes of mercury may have been released into rivers in 2010 as a result of deforestation worldwide
Because this is the first attempt to quantify global mercury releases to the aquatic environment there is no previous measurement against which these results can be compared Thus it is not possible at this time to evaluate trends in releases
Uncertainties in release estimates Estimating global releases of mercury to aquatic environments is being done here for the first time Many data are missing and others are imprecise A number of assumptions have been made based on what measurements are available or on other grounds to extrapolate from known quantities or to calculate aquatic releases in relation to atmospheric
or other emissions Thus the results should be treated with great caution It is nonetheless clear that anthropogenic sources and human activity contribute hundreds of tonnes of mercury to aquatic environments each year a substantial amount relative to estimated natural releases 150-960 tonnes per year from terrestrial environments
Lapshin Shutterstockcom
Phil Augustavo istockphotocom
Bureau of Land Managem
ent
Contaminated sites (top) erosion following deforestation (middle) and a flooded store of mercury-contaminated waste (lower) illustrate potential sources of mercury releases to water
25
UNEP Global Mercury Assessment 2013
Aquatic pathways transport and fate 8 Mercury in aquatic environments The pathways and fate of mercury in aquatic environments are important because it is in waters sediments and wetland soils that inorganic mercury is converted into methylmercury which is toxic and concentrates in animals The majority of human exposure to mercury and the health risk that comes with mercury exposure is from consumption of marine foods Thus this section focuses on the worldrsquos oceans Some freshwater systems however are important sources of fish for human consumption especially for subsistence and recreational fisheries often among indigenous peoples Artisanal and small-scale gold mining (ASGM) communities may also be affected through fish consumption and drinking water if those are contaminated by local releases
The major processes of mercury cycling are generally similar for all aquatic systems Inorganic mercury in dissolved or particulate form is the dominant mercury type in most marine and fresh waters Dissolved gaseous elemental mercury accounts for less than 30 of total mercury in water Methylmercury is often present at trace levels but may in some settings reach 30 of total mercury In freshwater and coastal environments inorganic mercury is transformed into methylmercury primarily in sediments In the open ocean this conversion takes place largely at intermediate depths between 200 and 1000 meters in the water column Mercury is lost from aquatic systems in two ways When inorganic mercury is reduced to elemental mercury it can be re-emitted to the atmosphere When inorganic mercury binds to particulates in water it can settle out rapidly and be buried in sediments Deep burial in ocean sediments is one of the major pathways by which mercury is removed from the biologically active environment
The global mercury cycle is chemically and physically complex Thus it is necessary to use models to study describe and predict what happens and will happen to mercury in the aquatic environment Until recently only one model existed that incorporated
air land and water into a unified whole The model has been validated against observations of mercury and represents the current scientific consensus The largest potential errors in this model in terms of the aquatic cycle concern details of the exchange of mercury between air and water
Pathways and fate of mercury in the oceans Model simulations suggest that anthropogenic impacts on mercury levels in the ocean are greatest in the surface waters the top 100 meters or so of the water column While model results vary one recent estimate suggests that anthropogenic emissions over the last 100 years have doubled the concentration of mercury in the surface layer of the ocean and increased it by 25 in intermediate waters and by 10 in deep waters The difference is due to the length of time it takes for surface waters to circulate to the depths
Models and measurements agree that direct deposition from the atmosphere is the dominant pathway by which mercury reaches the oceans The exceptions are smaller semi-enclosed basins such as the Mediterranean Sea or the Arctic Ocean where river runoff coastal erosion and ocean currents
Ugo M
ontaldo Shutterstockcom
26
UNEP Global Mercury Assessment 2013
account for about half of mercury inputs The most recent modelling effort suggests that total deposition input of mercury to the oceans in 2008 was 3700 tonnes
Other mercury pathways appear less important on a global basis Rivers are estimated to carry more than 2800 tonnes of mercury each year but only about 380 tonnes of this is transported offshore The rest is trapped by particles in estuaries Groundwater and re-mobilization from sediments provide 100shy800 tonnes of mercury to the oceans each year Undersea hydrothermal vents add less than 600 tonnes of mercury to the oceans There are high concentrations of mercury in vent fluids but a great deal of the mercury is precipitated as solids once the vent fluids enter seawater
Models suggest that globally about 70 of the mercury deposited into the ocean is re-emitted to the atmosphere Oxidized mercury in surface waters is reduced by biological and photochemical processes to the elemental form that is volatile and readily re-emitted The removal of this mercury ultimately reduces the pool of mercury that could be converted to methylmercury and be accumulated by marine organisms The re-emission process thus simultaneously prolongs the lifetime of mercury cycling through the atmosphere and upper ocean and acts to reduce mercury availability for marine food webs
Any changes in the efficiency of mercury reduction in surface waters or the rate of re-emission is likely to impact mercury concentrations in surface waters and the air One example is the effect of sea ice in the Arctic Ocean which blocks the re-emission
Tony Magdaraog Shutterstockcom
Mercury accumulated in marine food-webs can enter the human diet
of elemental mercury leaving elevated levels in waters under ice Changes in primary productivity could change the rate at which mercury is bound to particles thus affecting re-emission to the atmosphere as well as rates of downward transport in the ocean Changes in oxidant levels in the atmosphere such as ozone and bromine may also influence the rate of oxidation of gaseous elemental mercury and thus deposition rates to the ocean
Methylmercury in the ocean Natural bacterial processes in seawater and in sediments in coastal environments convert inorganic mercury to methylmercury Methylmercury levels are highest in the subsurface waters of many oceans because it is formed at these intermediate depths likely as a result of the decomposition of organic material falling from surface waters Current understanding indicates that about 300 tonnes of methylmercury is produced in the upper ocean by this and related processes By contrast only about 80 tonnes of methylmercury reaches the ocean from other sources such as atmospheric deposition rivers and diffusion from sediments
Current modelling indicates that methylmercury stays in the upper ocean for about 11 years Deshymethylation by photochemical reaction or by microbial activity is the major removal process for methylmercury in the ocean About 240 tonnes of methylmercury is removed by this process from the surface waters of the ocean per year
The other important pathway for methylmercury in seawater is uptake into marine food webs Although only about 40 tonnes per year is taken up in this way it is this fraction that poses risks to marine animals and human consumers of seafood Methylmercury is a problem for several reasons First it is taken up by plankton much more efficiently than is inorganic mercury resulting in concentrations in plankton that are as high as 10000 times the concentration in seawater Second methylmercury is absorbed through the intestine of animals much more easily than is inorganic mercury Third methylmercury biomagnifies as it moves up the food web Thus methylmercury becomes an increasingly greater proportion of the mercury in organisms higher in the food web This explains why some indigenous populations that consume top marine predators such as fish seals and whales have some of the worldrsquos highest concentrations of methylmercury giving rise to health concerns
27
UNEP Global Mercury Assessment 2013
Pathways and fate of mercury in freshwater Observations and modelling both show that there are in general many similarities between mercury chemistry pathways and fate in lakes and in the oceans but with obvious differences in scale and in the relative importance of different processes Modelling of mercury dynamics was done for four lakes with a history of direct mercury inputs from the largest freshwater lake in the world (Lake Superior) to small lakes in Ontario Canada Atmospheric deposition and river inflow were the main sources of inorganic mercury Much of the mercury input from lake and river catchments was associated with dissolved and particulate organic matter The dominant mercury removal mechanisms as in saltwater were burial in sediments and photochemical reduction of oxidized mercury to elemental mercury followed by re-emission to the air In Lake Superior and Lake Michigan there is evidence for methylation of mercury in the water column as is seen in the open ocean
Methylmercury levels in freshwater fish vary with the level of deposition of mercury from the air though other factors such as inputs from the watershed and the number of trophic levels within the lakersquos food web are also important Methylation predominantly occurred in lake sediments and wetlands and floodplain soils where sulphateshyreducing bacteria are believed to be primarily responsible Methylmercury is de-methylated in sediments and also taken away in the outlet river from each lake
Some 400-1400 tonnes of mercury are estimated globally to be trapped behind dams and other man-made impoundments each year This has in many cases led to significant increases in total mercury and methylmercury levels in water and of methylmercury in fish and other aquatic species When artificial lakes are created plant material is submerged leading to decay and anoxia In these conditions microbially driven methylation of inorganic mercury takes place In some cases the elevated mercury levels have also been observed downstream from the artificial lakes and reservoirs
Anthropogenic impacts on aquatic mercury levels Two studies have reported that the Atlantic and Pacific Oceans have shown opposing trends over recent decades While the influence of changing ocean currents and other oceanographic factors may be a factor the trends do make sense in light of patterns of anthropogenic emissions In the North Pacific Ocean mercury concentrations appear to have increased at depths between 200 and 1000 meters over the last few decades This increase coincides with the rapid industrialization of East Asia
In the North Atlantic however results from near Bermuda suggest a substantial decrease in mercury concentration and a change in the mercury profile through the water column The Mediterranean Sea too showed a decrease in mercury concentration between 1990 and 2004 These findings are consistent with atmospheric data from around the North Atlantic The conclusion is that mercury levels in seawater in the North Atlantic were elevated by human activity but may now be declining likely as a result of decreased emissions from North America and Europe
A complementary approach to measuring mercury in seawater is to measure mercury in aquatic animals which accumulate and integrate mercury over time Teeth hair feathers and eggshells are useful long-term archives of mercury concentrations and can provide data from the pre-industrial period (ie before 1800) as well as more recent periods
Among marine animals samples are available from several regions particularly from the Arctic where cold dry conditions help preserve animal tissues Mercury concentrations between the 13th and 16th
centuries were relatively stable From the mid- to late 19th century to the end of the 20th century mercury levels increased by an average of 12 times On average therefore about 92 of the mercury in Arctic marine wildlife today is likely to be of anthropogenic origin
Similar findings were found for a 700-year sequence of seabird eggshells from the South China Sea Mercury levels increased steadily between 1800 and 2000 with a particularly rapid increase after 1970 Concentrations since 2000 are about 10 times higher than pre-industrial levels with 91 of the mercury now likely to be of anthropogenic origin In the Antarctic studies of seal hairs show that pre-industrial mercury levels were only 60 of recent levels The relatively small difference
28
UNEP Global Mercury Assessment 2013
Historical Hg concentration as a proportion of present-day 100
80
60
40
20
0
Beluga teeth Human teeth
Gyrfalcon feathers Perigrine falcon feathers
Polar bear hair Ringed seal teeth
1200 1300 1400 1500 1600 1700 1800 1900 2000
between pre-industrial and modern mercury levels in Antarctic is consistent with lower mercury emissions and atmospheric concentrations in the Southern Hemisphere as compared with the Northern Hemisphere
The timing of long-term increases of mercury in aquatic animals can shed light on the likely sources of mercury emissions that were responsible The industrialization of Europe and North America appear responsible for the large increases in marine mercury levels that began in the 19th century as these increases occurred prior to recent Asian industrialization As with water concentrations in the Pacific Ocean recent rapid increases in mercury in seabird eggs in the South China Sea coincide with industrialization in Asia
The time lag in aquatic ecosystem response One important conclusion from air-ocean modeling is that the oceans have not yet reached equilibrium with current atmospheric levels of mercury This lag is due to several factors First mercury stays in the upper ocean above 200 meters depth for about 30 years and for centuries in intermediate and deep waters This is much longer than the one year residence time in the lower atmosphere Thus removal from the ocean takes much longer than does removal from the air and so concentrations will change more slowly
Second because of the long lifetime of mercury in deeper ocean waters a great deal of natural mercury is present in the ocean already about 100000 tonnes out of a total of 135000 tonnes in intermediate waters and 200000 out of 220000 tonnes in deep waters
Rune Dietz
Analysis of museum samples reflects the increase in mercury emissions and releases since the mid-19th century associated with anthropogenic activities
Third vertical transport of mercury from intermediate depths back to the surface returns a substantial amount of mercury to the biologically active zone each year As a result average mercury concentrations in seawater and marine animals are likely to increase slowly for decades if not centuries even if atmospheric levels stabilize at present levels In short the effects of historical anthropogenic emissions from Europe and North America are still being observed in the oceans at the same time that the effects of the recent rise in emissions from Asia are being seen
Regionally different trends can be expected depending on distance from sources and ocean circulation patterns In the North Atlantic north of 55deg N it will take 50-600 years to achieve equilibrium between atmospheric and seawater mercury levels In the North Pacific this process is estimated to take 500-700 years and in the Antarctic 700-1000 years The Arctic Ocean by contrast is smaller and will only take about 35 years to reflect changes in atmospheric mercury levels Surface waters of the Mediterranean Sea should show also changes within 10-50 years
Time lags in the responses of many freshwaters and their food-webs to changes in atmospheric mercury levels are also expected Although some immediate recovery following reductions in atmospheric mercury deposition rates is likely full recovery may take decades centuries or longer depending on the characteristics of the area Highly polluted freshwaters with catchments and sediments containing large amounts of anthropogenic mercury will recover most slowly as is already observed around point sources such as smelters that have closed down
29
UNEP Global Mercury Assessment 2013
Major gaps in knowledge 9 Large uncertainties remain in global estimates of mercury emissions to the air These stem from various sources including the availability of information on activity levels but mainly from the lack of information concerning the mercury content of some raw materials and the validity of assumptions regarding processes and technologies employed to reduce mercury emissions including their rates of application and effectiveness The accuracy and precision of measurement-based estimates can depend on the validity of extrapolating measurements made at infrequent intervals to longer periods or measurements made at one plant to other facilities with similar operations
Potentially important emissions sectors that are still not quantified in the emissions inventory include the use of mercury in vinyl-chloride monomer production secondary metals production oil and gas extraction transport and processing industrial and hazardous waste incineration and disposal sewage sludge incineration and dental fillings preparation and removal
Current measurements and their evaluation are inadequate for determining spatial and temporal trends Improved more extensive and better coordinated measurements are needed A permanent global integrated monitoring network for atmospheric mercury and mercury deposition is needed to achieve this goal The atmospheric network sites should be closely integrated with water soil and biological monitoring networks The results can be used for model testing and evaluation as well as for more accurately detailing the geographic impact of anthropogenic emissions Monitoring of mercury concentrations in the important marine food species is essential to understanding possible human health impacts and the effects of future emissions changes
Better data on mercury distribution in the troposphere is needed to improve understanding of long-range transport and source-receptor relationships Coordinated studies at high altitudes and by aircraft are needed This information will
also help validate regional and global scale models improving their prediction capabilities with regard to different policy scenarios
Key processes related to global transport and cycling of mercury remain inadequately understood The chemical form of gaseous oxidized mercury is unknown Reduction and oxidation rates for mercury in the presence of atmospheric oxidants need further study including determining which oxidants are important New measurements and modelling studies are needed to examine key chemical and physical processes that affect global transport and cycling
Few data are available for reporting mercury releases to aquatic systems Systematic and consistent monitoring of mercury releases to the air is required especially for contaminated systems Releases of mercury from soils into waters depend greatly on climate and topography and these parameters need to be better accounted for Consistent approaches for measuring and reporting releases from point sources are needed to ensure comparability of data from around the world In particular the actual role of artisanal and small-scale gold mining (ASGM) in emissions to air and releases to water needs to be more accurately estimated
The link between mercury deposition methylation and uptake by living organisms needs further study The parameters that determine the rates of exchange of mercury compounds between air and sea air and soil and air and vegetation are not fully understood Whole-ecosystem studies of mercury are needed to better understand biogeochemical cycling Methylationdemethylation rates and their spatial and temporal variations and relationship to climatic factors need to be determined in most of worldrsquos major ocean basins as well as in representative freshwaters
30
UNEP Global Mercury Assessment 2013
Key findings of the 2013 assessment 10 Atmosphere Total anthropogenic emissions of mercury to the atmosphere in 2010 are estimated at 1960 (1010shy4070) tonnes which is about 30 of the total mercury that was emitted and re-emitted from anthropogenic and natural sources in that year The largest anthropogenic sources are associated with artisanal and small-scale gold mining (ASGM) and coal burning which together account for about 62 of the annual total anthropogenic emissions to air Other major sectors include ferrous and non-ferrous metal production and cement production
East and Southeast Asia are responsible for about 40 of global anthropogenic emissions About 75 of the mercury from this region comes from China which is about one-third of the global total Increased estimates for emissions from ASGM largely a result of newly obtained data and improved information mean that South America and Sub-Saharan Africa are also responsible for a greater proportion of global emissions than was previously assumed
Anthropogenic emissions over time have increased mercury loads present in the environment This leads to higher rates of re-emission and also means that there will be a time lag of years or decades between emissions reductions and lower mercury levels in the food web including pathways of human exposure
Mercury emissions to the atmosphere likely peaked in the 1950s to 1970s and subsequently declined because of reductions in Europe Russia and North America Emission trends are unclear due to changes in methods employed to produce inventories and differences in the sectors that have been accounted at different times There are however some indications that emissions may be rising again with increases from East Asia offsetting continuing reductions in Europe and North America
Aquatic environments Natural processes in aquatic systems convert less toxic elemental and inorganic mercury into much more toxic methylmercury Methylmercury concentrates and accumulates in the food web leading to high concentrations in some species of seafood and fish that many people eat
Anthropogenic releases of mercury to aquatic environments contribute hundreds of tonnes to the amount of mercury cycling in the environment Diffuse releases and point sources appear equally important Atmospheric deposition however remains the most important input of mercury to land and oceans and has increased the amount of mercury in many environmental compartments by a factor of two or three since the start of the industrial age On land mercury that is deposited is largely retained in soils and vegetation increasing the available pool for re-mobilisation to adjacent aquatic systems Re-emission from soils however is a major addition to atmospheric mercury
Hydrology is the most important factor in the transport of mercury from catchments to downstream environments Relatively little of this mercury reaches the open ocean as most is captured in sediments behind dams in estuaries and near the coast Changes in land cover and land use can have a large effect on mercury mobilisation as exposed soils erode and mercury leaches into the water table
Concentrations of mercury in Arctic marine animals today are about 10-12 times higher than in preshyindustrial times (ie prior to about 1800) This means that on average about 92 of the mercury in marine predators such as seabirds seals and whales is anthropogenic in origin The timing of the increase suggest that 19th and early 20th century emissions from Europe North America and Russia were responsible Increases mercury concentrations in seabirds in the South China Sea appear to be more recent than the Arctic increases coinciding with increasing industrialisation in East and Southeast Asia
31
UNEP Global Mercury Assessment 2013
K+S Entsorgung Gm
bH
Recovered mercury is being stockpiled at long-term storage sites above- and as shown here below ground
The upper 100 meters of the oceans have twice the mercury that they did a century ago Intermediate and deeper waters have 10-25 more mercury on average reflecting the slow transport of mercury downwards in the oceans Seawater concentrations will thus be especially slow in responding to changes in mercury inputs from atmospheric deposition and river flow As a result mercury concentrations in marine biota are likely to increase slowly for decades to centuries even without an increase in atmospheric emissions
In freshwater ecosystems atmospheric deposition and re-mobilisation from soils slow the reduction of mercury levels even in regions where atmospheric concentrations have decreased due to emission controls
Further increases in atmospheric emissions will have long-term consequences for commercial fisheries and all consumers of marine and freshwater foods
It is likely to be years or decades before reductions in anthropogenic emissions and releases of mercury have a demonstrable effect on mercury levels throughout the environment and in the fish and marine mammals which are part of the human food-chain This only reinforces the need to act now to continue and strengthen international efforts to reduce current mercury emissions and releases Delays in action now will inevitably lead to slower recovery of the worldrsquos ecosystems in future from mercury contamination leaving an even greater legacy of pollution for future generations
32
Division of Technology Industry and Economics (DTIE) Chemicals Branch Geneva Switzerland January 2013
Job number DTI1636GE
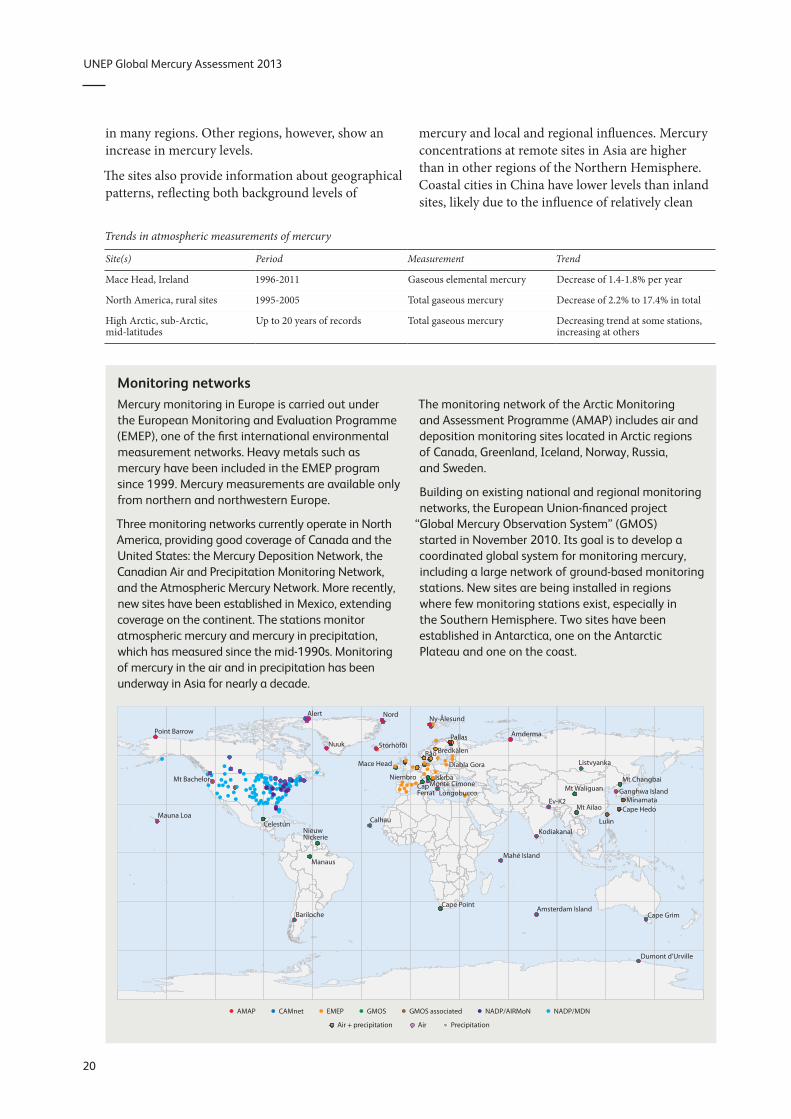
UNEP Global Mercury Assessment 2013
in many regions Other regions however show an increase in mercury levels
The sites also provide information about geographical patterns reflecting both background levels of
Trends in atmospheric measurements of mercury
Site(s) Period
Mace Head Ireland 1996-2011
North America rural sites 1995-2005
High Arctic sub-Arctic Up to 20 years of records mid-latitudes
Monitoring networks Mercury monitoring in Europe is carried out under the European Monitoring and Evaluation Programme (EMEP) one of the first international environmental measurement networks Heavy metals such as mercury have been included in the EMEP program since 1999 Mercury measurements are available only from northern and northwestern Europe
Three monitoring networks currently operate in North America providing good coverage of Canada and the United States the Mercury Deposition Network the Canadian Air and Precipitation Monitoring Network and the Atmospheric Mercury Network More recently new sites have been established in Mexico extending coverage on the continent The stations monitor atmospheric mercury and mercury in precipitation which has measured since the mid-1990s Monitoring of mercury in the air and in precipitation has been underway in Asia for nearly a decade
Alert Nord
Point Barrow
Nuuk Stoacuterhoumlfethi
Mace Head
mercury and local and regional influences Mercury concentrations at remote sites in Asia are higher than in other regions of the Northern Hemisphere Coastal cities in China have lower levels than inland sites likely due to the influence of relatively clean
Measurement Trend
Gaseous elemental mercury Decrease of 14-18 per year
Total gaseous mercury Decrease of 22 to 174 in total
Total gaseous mercury Decreasing trend at some stations increasing at others
The monitoring network of the Arctic Monitoring and Assessment Programme (AMAP) includes air and deposition monitoring sites located in Arctic regions of Canada Greenland Iceland Norway Russia and Sweden
Building on existing national and regional monitoring networks the European Union-financed project
ldquoGlobal Mercury Observation Systemrdquo (GMOS) started in November 2010 Its goal is to develop a coordinated global system for monitoring mercury including a large network of ground-based monitoring stations New sites are being installed in regions where few monitoring stations exist especially in the Southern Hemisphere Two sites have been established in Antarctica one on the Antarctic Plateau and one on the coast
Ny-Aringlesund
Amderma Pallas
Raringouml Bredkaumllen
Listvyanka Diabla Gora
Mauna Loa
Mt Bachelor
Celestuacuten Calhau
Longobucco
Iskrba Niembro Monte Cimone Cap
Ferrat Mt Waliguan Ganghwa Island
Lulin
Cape Hedo Ev-K2
Mt Changbai
Minamata Mt Ailao
Nieuw Nickerie
Kodiakanal
Maheacute Island Manaus
Bariloche Cape Point
Amsterdam Island Cape Grim
Dumont drsquoUrville
AMAP CAMnet EMEP GMOS GMOS associated NADPAIRMoN NADPMDN
Air + precipitation Air Precipitation
20
UNEP Global Mercury Assessment 2013
John Munthe
The mercury background air monitoring station at Zeppelin mountain Svalbard
air from over the ocean Sites off the Asian coast however show higher levels of gaseous elemental mercury than the Northern Hemisphere background suggesting an outflow from the Asian mainland
Weather patterns have also been found to have a strong influence on seasonal patterns in mercury levels in the air at monitoring sites At the Mount Waliguan Observatory on the Tibetan Plateau for example northeasterly and easterly winds produced the highest levels of mercury
Measurements at high altitudes Measurements from ground-based stations above 2700 meters suggest that there is an inverse relationship between gaseous elemental mercury and gaseous oxidized mercury at these elevations In other words when there is more elemental mercury there is less oxidized mercury and vice versa These measurements are in good agreement with modelling results which gives additional confidence in current understanding of the behaviour of mercury at high altitude
An inverse relationship between total gaseous mercury and particulate concentration has also been observed in the high stratosphere From the transformation rate of total gaseous mercury to particulate-bound mercury it appears that gaseous mercury lasts about two years in the stratosphere
21
UNEP Global Mercury Assessment 2013
Atmospheric concentrations and deposition 6 Measurements and trends of mercury in precipitation Mercury deposited by precipitation decreased from the 1990s into the 2000s at many but not all sites in North America and Western Europe where such measurements were taken
Regional patterns are also evident including slightly higher levels in southern Europe than northern Europe and higher levels in Asia than in North America Total mercury concentrations in precipitation in China were much higher than those in Japan and South Korea Th is was mostly attributed to higher levels of gaseous oxidized mercury and particulate-bound mercury which are readily deposited by precipitation and thus not transported far
A comparison of data from Canadian and American monitoring sites found that deposition of mercury in precipitation was highest in summer
Dry deposition of mercury which is deposition not associated with precipitation is diffi cult to measure and consequently there is little information on trends in mercury dry deposition Th is lack of information means that it is also diffi cult to validate model results for dry deposition
106 44
474 72 91
5 7 71
05 1 5 10 100 500 1000
Total mercury emission (2005) kgcell
Modelled mercury air concentrations and deposition patterns Atmospheric mercury concentrations are highest in major industrial regions Models examining global patterns show that East and South Asia Europe North America and South Africa have the highest levels of elemental mercury in the air Concentrations are generally lower in the Southern Hemisphere than the Northern Hemisphere because most industrial activity is in northern regions Th ese model results are based on simulations using the 2005 global mercury emission inventory because the 2010 inventory has only recently become available
Intercontinental transport of mercury in the air has been examined to determine its impact on regional mercury levels Four models using diff erent parameters produced consistent results Depending on the region mercury emitted by distant sources contributes between 10 and 30 of annual mercury deposition Where local sources are low mercury transported from distant emission sources can account for more than half of the deposition East Asia is the dominant source region adding 10-14 to the deposition in
Contribution from sources outside receptor region
Model 40
GEOS-Chem GLEMOS GRAHM CMAQ-Hg
30
20
10
0 Arctic Europe North East Asia South Asia
America
Receptor region
(Left ) Global distribution of anthropogenic mercury emissions in 2005 with source regions that were considered in the analysis (North America South America Europe Africa Central Asia South Asia East Asia Australia and Oceania) and (right) the contribution of anthropogenic sources outside a particular receptor region to deposition within the receptor region
22
UNEP Global Mercury Assessment 2013
Modelling atmospheric transport and deposition Global models reproduce the movement of mercury in the atmosphere during which the mercury may move between continents They have been effective in examining sources of mercury to the Arctic and also for examining the outflow of pollution from South and Southeast Asia and its impact on western North America as well as the flow from eastern North America to Europe
Regional models on the scale of a continent or a basin such as the Mediterranean can provide more detail about specific source areas even to the level of individual industrial areas Reliable results however require a detailed understanding of mercury oxidation in the atmosphere about which there is considerably uncertainty
Most atmospheric transport models consider the full chain of mercury processes in the atmosphere Some models also consider how mercury is cycled in other atmospheric compartments such as soil vegetation snow freshwater and seawater
One of the largest sources of uncertainty in mercury models is the chemical mechanism used to determine how mercury changes forms in the air Improved experimental data can help improve model performance by making sure that the correct reactions are simulated The processes that lead from deposition to re-emission also need to be understood better Advances in this area show promise with model results becoming closer to estimates based on experimental data
other regions of the world Natural emissions and re-emissions account for 35-70 of total deposition in most regions Deposition is generally greater in low and mid-latitudes due to stronger sunlight higher concentrations of oxidants and higher precipitation
Regional mercury models show patterns at the scales of continents or individual seas The Mediterranean Sea for example is a net source of mercury as it emits more than is deposited to it In that region dry deposition generally exceeds deposition of mercury in precipitation In Central and Southern Europe total gaseous mercury concentrations and deposition in precipitation were both consistently higher than the European average
Across the United States dry deposition accounts for two-thirds of total annual deposition mainly from gaseous oxidized mercury A study examining sources and deposition of mercury to assess the
benefits of proposed emission control measures found that mercury transport from outside the country accounts for 68 of mercury deposition in the Northeast and up to 91 in the west-central United States Large point sources contribute up to three-quarters of nearby deposition and power plants contributed half of the deposition in the eastern part of the country This suggests that new emissions standards would primarily benefit eastern regions of the US
In Asia studies show high seasonal variation in mercury concentration and deposition Anthropogenic emissions are responsible for about 75 of deposition in East Asia In this region there is a net removal of gaseous oxidized mercury from the atmosphere and a net export of gaseous elemental mercury
In the Arctic gaseous elemental mercury levels in the atmosphere are depleted rapidly in spring when after the long Arctic winters sunlight returns Ozone is depleted at the same time and it is believed that bromine-containing compounds are the cause of the photo-chemical reactions that deplete ozone and mercury During these events gaseous oxidized mercury and particulate-bound mercury levels increase sharply suggesting that the gaseous mercury is oxidized and deposited enhancing mercury deposition in Arctic areas in springtime Recent research however has found that 50-80 of the deposited mercury is re-emitted within a few days Similar springtime mercury depletion events have been seen in Antarctica
23
UNEP Global Mercury Assessment 2013
Anthropogenic releases to the aquatic environment 7 Global assessment Previous UNEP global mercury assessments only considered emissions to the atmosphere The 2013 Report presents the first attempt at compiling a global inventory of mercury releases to aquatic environments Releases directly into the aquatic environment present a completely different chemistry set of pathways and fate to those released to air They are also more directly linked to the risks posed by mercury to global environmental and human health Unlike mercury releases to air which are predominantly in the form of gaseous elemental mercury releases to water are predominantly inorganic mercury and to a lesser extent liquid elemental mercury
At present only some sources of aquatic releases can be quantified with any confidence Thus many sources that may be important are not included in this first assessment of global aquatic releases For example land management practices that expose new geological sources of mercury in rocks and mineral soils or that re-mobilize previously deposited mercury cannot yet be assessed Two broad categories of current anthropogenic sources are considered here point sources of mercury release to water and diffuse releases of mercury as a result of its remobilisation from areas where it was previously deposited or accumulated due to human activity (ie contaminated sites) Artisanal and small-scale gold mining (ASGM) mercury-containing pesticides and fungicides used in agriculture and deforestation are considered separately
Point source releases to water from various sectors in tonnes per year with the range of the estimate and as a percentage of total anthropogenic emissions
Sector Releases (range) tonnes
Non-ferrous metal production 925 (193 - 268)
Consumer product waste 894 (222 - 308)
Chlor-alkali production 28 (10 ndash 55)
Oil refining 06 (03 ndash 1)
Grand Total 185 (426 ndash 582)
The global estimate of mercury release to water from point sources has been derived from the atmospheric emissions assessment and the approach employed in the UNEP Toolkit to partition total mercury releases between air land and water This approach has considerable uncertainty and may omit sectors where releases to water are high but air emissions are unimportant and therefore not addressed in the inventory Global releases from point sources were estimated to be 185 tonnes per year
For diffuse sources evaluating the relative contribution of anthropogenic and natural sources to the aquatic environment requires determining considerations of the various mercury inputs For some sectors data exist that allow a preliminary assessment of the amounts of mercury re-mobilized into aquatic systems
For mercury-contaminated sites the range of average soil concentrations of mercury reported for sites where mercury was mined used or otherwise released by human activity was considered The area of contamination is then used to determine how much mercury is available in soils and when combined with a factor for how much mercury is released from those soils in a year the total release can be estimated Among identified contaminated sites mercury mining is identified as the largest sector followed by mining of precious metals Total releases to aquatic environments from contaminated sites are estimated to be 83-335 tonnes per year
Releases to water from contaminated sites in tonnes per year with the range of the estimate
Sector Releases (range) tonnes
Primary mercury mining sites 67 ndash 266
Precious metal production sites 14 ndash 55
Non-ferrous metal production sites 01 ndash 05
Chlor-alkali production sites 01 ndash 05
Other industrial sites 01 ndash 03
Grand Total 83 ndash 335
24
UNEP Global Mercury Assessment 2013
Much of the mercury released from artisanal and small-scale gold mining goes into rivers lakes soils and sediments and tailings From soils and tailings it may be re-mobilized by leaching and erosion In addition mining may disturb mercury-containing soils and sediments that may then erode more quickly releasing more mercury than would otherwise have become available from natural erosion A key factor in these processes is the local hydrological cycle of precipitation evaporation run-off and river flow To account for this in the assessment countries were designated as dry wet or intermediate to determine the relative importance of erosion The tropical and subtropical countries which have the greatest activity in this sector also tend to experience high precipitation and run-off exacerbating this source of mercury release and re-mobilization Total worldwide releases of mercury to land and water from ASGM were estimated at over 800 tonnes per year How much of this is released to water cannot yet be determined
Mercury continues to be used in pesticides and fungicides 2100 tonnes of mercury were released in the decade of the 1960s through such agrochemical uses Current data are unavailable although the use of mercury in these products has been greatly reduced
Deforestation especially in the Amazon Basin can lead to extensive soil erosion and thus the release of mercury previously accumulated in soils Using 2010 figures for deforestation rates around the world and an estimate of soil concentrations of mercury as much as 260 tonnes of mercury may have been released into rivers in 2010 as a result of deforestation worldwide
Because this is the first attempt to quantify global mercury releases to the aquatic environment there is no previous measurement against which these results can be compared Thus it is not possible at this time to evaluate trends in releases
Uncertainties in release estimates Estimating global releases of mercury to aquatic environments is being done here for the first time Many data are missing and others are imprecise A number of assumptions have been made based on what measurements are available or on other grounds to extrapolate from known quantities or to calculate aquatic releases in relation to atmospheric
or other emissions Thus the results should be treated with great caution It is nonetheless clear that anthropogenic sources and human activity contribute hundreds of tonnes of mercury to aquatic environments each year a substantial amount relative to estimated natural releases 150-960 tonnes per year from terrestrial environments
Lapshin Shutterstockcom
Phil Augustavo istockphotocom
Bureau of Land Managem
ent
Contaminated sites (top) erosion following deforestation (middle) and a flooded store of mercury-contaminated waste (lower) illustrate potential sources of mercury releases to water
25
UNEP Global Mercury Assessment 2013
Aquatic pathways transport and fate 8 Mercury in aquatic environments The pathways and fate of mercury in aquatic environments are important because it is in waters sediments and wetland soils that inorganic mercury is converted into methylmercury which is toxic and concentrates in animals The majority of human exposure to mercury and the health risk that comes with mercury exposure is from consumption of marine foods Thus this section focuses on the worldrsquos oceans Some freshwater systems however are important sources of fish for human consumption especially for subsistence and recreational fisheries often among indigenous peoples Artisanal and small-scale gold mining (ASGM) communities may also be affected through fish consumption and drinking water if those are contaminated by local releases
The major processes of mercury cycling are generally similar for all aquatic systems Inorganic mercury in dissolved or particulate form is the dominant mercury type in most marine and fresh waters Dissolved gaseous elemental mercury accounts for less than 30 of total mercury in water Methylmercury is often present at trace levels but may in some settings reach 30 of total mercury In freshwater and coastal environments inorganic mercury is transformed into methylmercury primarily in sediments In the open ocean this conversion takes place largely at intermediate depths between 200 and 1000 meters in the water column Mercury is lost from aquatic systems in two ways When inorganic mercury is reduced to elemental mercury it can be re-emitted to the atmosphere When inorganic mercury binds to particulates in water it can settle out rapidly and be buried in sediments Deep burial in ocean sediments is one of the major pathways by which mercury is removed from the biologically active environment
The global mercury cycle is chemically and physically complex Thus it is necessary to use models to study describe and predict what happens and will happen to mercury in the aquatic environment Until recently only one model existed that incorporated
air land and water into a unified whole The model has been validated against observations of mercury and represents the current scientific consensus The largest potential errors in this model in terms of the aquatic cycle concern details of the exchange of mercury between air and water
Pathways and fate of mercury in the oceans Model simulations suggest that anthropogenic impacts on mercury levels in the ocean are greatest in the surface waters the top 100 meters or so of the water column While model results vary one recent estimate suggests that anthropogenic emissions over the last 100 years have doubled the concentration of mercury in the surface layer of the ocean and increased it by 25 in intermediate waters and by 10 in deep waters The difference is due to the length of time it takes for surface waters to circulate to the depths
Models and measurements agree that direct deposition from the atmosphere is the dominant pathway by which mercury reaches the oceans The exceptions are smaller semi-enclosed basins such as the Mediterranean Sea or the Arctic Ocean where river runoff coastal erosion and ocean currents
Ugo M
ontaldo Shutterstockcom
26
UNEP Global Mercury Assessment 2013
account for about half of mercury inputs The most recent modelling effort suggests that total deposition input of mercury to the oceans in 2008 was 3700 tonnes
Other mercury pathways appear less important on a global basis Rivers are estimated to carry more than 2800 tonnes of mercury each year but only about 380 tonnes of this is transported offshore The rest is trapped by particles in estuaries Groundwater and re-mobilization from sediments provide 100shy800 tonnes of mercury to the oceans each year Undersea hydrothermal vents add less than 600 tonnes of mercury to the oceans There are high concentrations of mercury in vent fluids but a great deal of the mercury is precipitated as solids once the vent fluids enter seawater
Models suggest that globally about 70 of the mercury deposited into the ocean is re-emitted to the atmosphere Oxidized mercury in surface waters is reduced by biological and photochemical processes to the elemental form that is volatile and readily re-emitted The removal of this mercury ultimately reduces the pool of mercury that could be converted to methylmercury and be accumulated by marine organisms The re-emission process thus simultaneously prolongs the lifetime of mercury cycling through the atmosphere and upper ocean and acts to reduce mercury availability for marine food webs
Any changes in the efficiency of mercury reduction in surface waters or the rate of re-emission is likely to impact mercury concentrations in surface waters and the air One example is the effect of sea ice in the Arctic Ocean which blocks the re-emission
Tony Magdaraog Shutterstockcom
Mercury accumulated in marine food-webs can enter the human diet
of elemental mercury leaving elevated levels in waters under ice Changes in primary productivity could change the rate at which mercury is bound to particles thus affecting re-emission to the atmosphere as well as rates of downward transport in the ocean Changes in oxidant levels in the atmosphere such as ozone and bromine may also influence the rate of oxidation of gaseous elemental mercury and thus deposition rates to the ocean
Methylmercury in the ocean Natural bacterial processes in seawater and in sediments in coastal environments convert inorganic mercury to methylmercury Methylmercury levels are highest in the subsurface waters of many oceans because it is formed at these intermediate depths likely as a result of the decomposition of organic material falling from surface waters Current understanding indicates that about 300 tonnes of methylmercury is produced in the upper ocean by this and related processes By contrast only about 80 tonnes of methylmercury reaches the ocean from other sources such as atmospheric deposition rivers and diffusion from sediments
Current modelling indicates that methylmercury stays in the upper ocean for about 11 years Deshymethylation by photochemical reaction or by microbial activity is the major removal process for methylmercury in the ocean About 240 tonnes of methylmercury is removed by this process from the surface waters of the ocean per year
The other important pathway for methylmercury in seawater is uptake into marine food webs Although only about 40 tonnes per year is taken up in this way it is this fraction that poses risks to marine animals and human consumers of seafood Methylmercury is a problem for several reasons First it is taken up by plankton much more efficiently than is inorganic mercury resulting in concentrations in plankton that are as high as 10000 times the concentration in seawater Second methylmercury is absorbed through the intestine of animals much more easily than is inorganic mercury Third methylmercury biomagnifies as it moves up the food web Thus methylmercury becomes an increasingly greater proportion of the mercury in organisms higher in the food web This explains why some indigenous populations that consume top marine predators such as fish seals and whales have some of the worldrsquos highest concentrations of methylmercury giving rise to health concerns
27
UNEP Global Mercury Assessment 2013
Pathways and fate of mercury in freshwater Observations and modelling both show that there are in general many similarities between mercury chemistry pathways and fate in lakes and in the oceans but with obvious differences in scale and in the relative importance of different processes Modelling of mercury dynamics was done for four lakes with a history of direct mercury inputs from the largest freshwater lake in the world (Lake Superior) to small lakes in Ontario Canada Atmospheric deposition and river inflow were the main sources of inorganic mercury Much of the mercury input from lake and river catchments was associated with dissolved and particulate organic matter The dominant mercury removal mechanisms as in saltwater were burial in sediments and photochemical reduction of oxidized mercury to elemental mercury followed by re-emission to the air In Lake Superior and Lake Michigan there is evidence for methylation of mercury in the water column as is seen in the open ocean
Methylmercury levels in freshwater fish vary with the level of deposition of mercury from the air though other factors such as inputs from the watershed and the number of trophic levels within the lakersquos food web are also important Methylation predominantly occurred in lake sediments and wetlands and floodplain soils where sulphateshyreducing bacteria are believed to be primarily responsible Methylmercury is de-methylated in sediments and also taken away in the outlet river from each lake
Some 400-1400 tonnes of mercury are estimated globally to be trapped behind dams and other man-made impoundments each year This has in many cases led to significant increases in total mercury and methylmercury levels in water and of methylmercury in fish and other aquatic species When artificial lakes are created plant material is submerged leading to decay and anoxia In these conditions microbially driven methylation of inorganic mercury takes place In some cases the elevated mercury levels have also been observed downstream from the artificial lakes and reservoirs
Anthropogenic impacts on aquatic mercury levels Two studies have reported that the Atlantic and Pacific Oceans have shown opposing trends over recent decades While the influence of changing ocean currents and other oceanographic factors may be a factor the trends do make sense in light of patterns of anthropogenic emissions In the North Pacific Ocean mercury concentrations appear to have increased at depths between 200 and 1000 meters over the last few decades This increase coincides with the rapid industrialization of East Asia
In the North Atlantic however results from near Bermuda suggest a substantial decrease in mercury concentration and a change in the mercury profile through the water column The Mediterranean Sea too showed a decrease in mercury concentration between 1990 and 2004 These findings are consistent with atmospheric data from around the North Atlantic The conclusion is that mercury levels in seawater in the North Atlantic were elevated by human activity but may now be declining likely as a result of decreased emissions from North America and Europe
A complementary approach to measuring mercury in seawater is to measure mercury in aquatic animals which accumulate and integrate mercury over time Teeth hair feathers and eggshells are useful long-term archives of mercury concentrations and can provide data from the pre-industrial period (ie before 1800) as well as more recent periods
Among marine animals samples are available from several regions particularly from the Arctic where cold dry conditions help preserve animal tissues Mercury concentrations between the 13th and 16th
centuries were relatively stable From the mid- to late 19th century to the end of the 20th century mercury levels increased by an average of 12 times On average therefore about 92 of the mercury in Arctic marine wildlife today is likely to be of anthropogenic origin
Similar findings were found for a 700-year sequence of seabird eggshells from the South China Sea Mercury levels increased steadily between 1800 and 2000 with a particularly rapid increase after 1970 Concentrations since 2000 are about 10 times higher than pre-industrial levels with 91 of the mercury now likely to be of anthropogenic origin In the Antarctic studies of seal hairs show that pre-industrial mercury levels were only 60 of recent levels The relatively small difference
28
UNEP Global Mercury Assessment 2013
Historical Hg concentration as a proportion of present-day 100
80
60
40
20
0
Beluga teeth Human teeth
Gyrfalcon feathers Perigrine falcon feathers
Polar bear hair Ringed seal teeth
1200 1300 1400 1500 1600 1700 1800 1900 2000
between pre-industrial and modern mercury levels in Antarctic is consistent with lower mercury emissions and atmospheric concentrations in the Southern Hemisphere as compared with the Northern Hemisphere
The timing of long-term increases of mercury in aquatic animals can shed light on the likely sources of mercury emissions that were responsible The industrialization of Europe and North America appear responsible for the large increases in marine mercury levels that began in the 19th century as these increases occurred prior to recent Asian industrialization As with water concentrations in the Pacific Ocean recent rapid increases in mercury in seabird eggs in the South China Sea coincide with industrialization in Asia
The time lag in aquatic ecosystem response One important conclusion from air-ocean modeling is that the oceans have not yet reached equilibrium with current atmospheric levels of mercury This lag is due to several factors First mercury stays in the upper ocean above 200 meters depth for about 30 years and for centuries in intermediate and deep waters This is much longer than the one year residence time in the lower atmosphere Thus removal from the ocean takes much longer than does removal from the air and so concentrations will change more slowly
Second because of the long lifetime of mercury in deeper ocean waters a great deal of natural mercury is present in the ocean already about 100000 tonnes out of a total of 135000 tonnes in intermediate waters and 200000 out of 220000 tonnes in deep waters
Rune Dietz
Analysis of museum samples reflects the increase in mercury emissions and releases since the mid-19th century associated with anthropogenic activities
Third vertical transport of mercury from intermediate depths back to the surface returns a substantial amount of mercury to the biologically active zone each year As a result average mercury concentrations in seawater and marine animals are likely to increase slowly for decades if not centuries even if atmospheric levels stabilize at present levels In short the effects of historical anthropogenic emissions from Europe and North America are still being observed in the oceans at the same time that the effects of the recent rise in emissions from Asia are being seen
Regionally different trends can be expected depending on distance from sources and ocean circulation patterns In the North Atlantic north of 55deg N it will take 50-600 years to achieve equilibrium between atmospheric and seawater mercury levels In the North Pacific this process is estimated to take 500-700 years and in the Antarctic 700-1000 years The Arctic Ocean by contrast is smaller and will only take about 35 years to reflect changes in atmospheric mercury levels Surface waters of the Mediterranean Sea should show also changes within 10-50 years
Time lags in the responses of many freshwaters and their food-webs to changes in atmospheric mercury levels are also expected Although some immediate recovery following reductions in atmospheric mercury deposition rates is likely full recovery may take decades centuries or longer depending on the characteristics of the area Highly polluted freshwaters with catchments and sediments containing large amounts of anthropogenic mercury will recover most slowly as is already observed around point sources such as smelters that have closed down
29
UNEP Global Mercury Assessment 2013
Major gaps in knowledge 9 Large uncertainties remain in global estimates of mercury emissions to the air These stem from various sources including the availability of information on activity levels but mainly from the lack of information concerning the mercury content of some raw materials and the validity of assumptions regarding processes and technologies employed to reduce mercury emissions including their rates of application and effectiveness The accuracy and precision of measurement-based estimates can depend on the validity of extrapolating measurements made at infrequent intervals to longer periods or measurements made at one plant to other facilities with similar operations
Potentially important emissions sectors that are still not quantified in the emissions inventory include the use of mercury in vinyl-chloride monomer production secondary metals production oil and gas extraction transport and processing industrial and hazardous waste incineration and disposal sewage sludge incineration and dental fillings preparation and removal
Current measurements and their evaluation are inadequate for determining spatial and temporal trends Improved more extensive and better coordinated measurements are needed A permanent global integrated monitoring network for atmospheric mercury and mercury deposition is needed to achieve this goal The atmospheric network sites should be closely integrated with water soil and biological monitoring networks The results can be used for model testing and evaluation as well as for more accurately detailing the geographic impact of anthropogenic emissions Monitoring of mercury concentrations in the important marine food species is essential to understanding possible human health impacts and the effects of future emissions changes
Better data on mercury distribution in the troposphere is needed to improve understanding of long-range transport and source-receptor relationships Coordinated studies at high altitudes and by aircraft are needed This information will
also help validate regional and global scale models improving their prediction capabilities with regard to different policy scenarios
Key processes related to global transport and cycling of mercury remain inadequately understood The chemical form of gaseous oxidized mercury is unknown Reduction and oxidation rates for mercury in the presence of atmospheric oxidants need further study including determining which oxidants are important New measurements and modelling studies are needed to examine key chemical and physical processes that affect global transport and cycling
Few data are available for reporting mercury releases to aquatic systems Systematic and consistent monitoring of mercury releases to the air is required especially for contaminated systems Releases of mercury from soils into waters depend greatly on climate and topography and these parameters need to be better accounted for Consistent approaches for measuring and reporting releases from point sources are needed to ensure comparability of data from around the world In particular the actual role of artisanal and small-scale gold mining (ASGM) in emissions to air and releases to water needs to be more accurately estimated
The link between mercury deposition methylation and uptake by living organisms needs further study The parameters that determine the rates of exchange of mercury compounds between air and sea air and soil and air and vegetation are not fully understood Whole-ecosystem studies of mercury are needed to better understand biogeochemical cycling Methylationdemethylation rates and their spatial and temporal variations and relationship to climatic factors need to be determined in most of worldrsquos major ocean basins as well as in representative freshwaters
30
UNEP Global Mercury Assessment 2013
Key findings of the 2013 assessment 10 Atmosphere Total anthropogenic emissions of mercury to the atmosphere in 2010 are estimated at 1960 (1010shy4070) tonnes which is about 30 of the total mercury that was emitted and re-emitted from anthropogenic and natural sources in that year The largest anthropogenic sources are associated with artisanal and small-scale gold mining (ASGM) and coal burning which together account for about 62 of the annual total anthropogenic emissions to air Other major sectors include ferrous and non-ferrous metal production and cement production
East and Southeast Asia are responsible for about 40 of global anthropogenic emissions About 75 of the mercury from this region comes from China which is about one-third of the global total Increased estimates for emissions from ASGM largely a result of newly obtained data and improved information mean that South America and Sub-Saharan Africa are also responsible for a greater proportion of global emissions than was previously assumed
Anthropogenic emissions over time have increased mercury loads present in the environment This leads to higher rates of re-emission and also means that there will be a time lag of years or decades between emissions reductions and lower mercury levels in the food web including pathways of human exposure
Mercury emissions to the atmosphere likely peaked in the 1950s to 1970s and subsequently declined because of reductions in Europe Russia and North America Emission trends are unclear due to changes in methods employed to produce inventories and differences in the sectors that have been accounted at different times There are however some indications that emissions may be rising again with increases from East Asia offsetting continuing reductions in Europe and North America
Aquatic environments Natural processes in aquatic systems convert less toxic elemental and inorganic mercury into much more toxic methylmercury Methylmercury concentrates and accumulates in the food web leading to high concentrations in some species of seafood and fish that many people eat
Anthropogenic releases of mercury to aquatic environments contribute hundreds of tonnes to the amount of mercury cycling in the environment Diffuse releases and point sources appear equally important Atmospheric deposition however remains the most important input of mercury to land and oceans and has increased the amount of mercury in many environmental compartments by a factor of two or three since the start of the industrial age On land mercury that is deposited is largely retained in soils and vegetation increasing the available pool for re-mobilisation to adjacent aquatic systems Re-emission from soils however is a major addition to atmospheric mercury
Hydrology is the most important factor in the transport of mercury from catchments to downstream environments Relatively little of this mercury reaches the open ocean as most is captured in sediments behind dams in estuaries and near the coast Changes in land cover and land use can have a large effect on mercury mobilisation as exposed soils erode and mercury leaches into the water table
Concentrations of mercury in Arctic marine animals today are about 10-12 times higher than in preshyindustrial times (ie prior to about 1800) This means that on average about 92 of the mercury in marine predators such as seabirds seals and whales is anthropogenic in origin The timing of the increase suggest that 19th and early 20th century emissions from Europe North America and Russia were responsible Increases mercury concentrations in seabirds in the South China Sea appear to be more recent than the Arctic increases coinciding with increasing industrialisation in East and Southeast Asia
31
UNEP Global Mercury Assessment 2013
K+S Entsorgung Gm
bH
Recovered mercury is being stockpiled at long-term storage sites above- and as shown here below ground
The upper 100 meters of the oceans have twice the mercury that they did a century ago Intermediate and deeper waters have 10-25 more mercury on average reflecting the slow transport of mercury downwards in the oceans Seawater concentrations will thus be especially slow in responding to changes in mercury inputs from atmospheric deposition and river flow As a result mercury concentrations in marine biota are likely to increase slowly for decades to centuries even without an increase in atmospheric emissions
In freshwater ecosystems atmospheric deposition and re-mobilisation from soils slow the reduction of mercury levels even in regions where atmospheric concentrations have decreased due to emission controls
Further increases in atmospheric emissions will have long-term consequences for commercial fisheries and all consumers of marine and freshwater foods
It is likely to be years or decades before reductions in anthropogenic emissions and releases of mercury have a demonstrable effect on mercury levels throughout the environment and in the fish and marine mammals which are part of the human food-chain This only reinforces the need to act now to continue and strengthen international efforts to reduce current mercury emissions and releases Delays in action now will inevitably lead to slower recovery of the worldrsquos ecosystems in future from mercury contamination leaving an even greater legacy of pollution for future generations
32
Division of Technology Industry and Economics (DTIE) Chemicals Branch Geneva Switzerland January 2013
Job number DTI1636GE
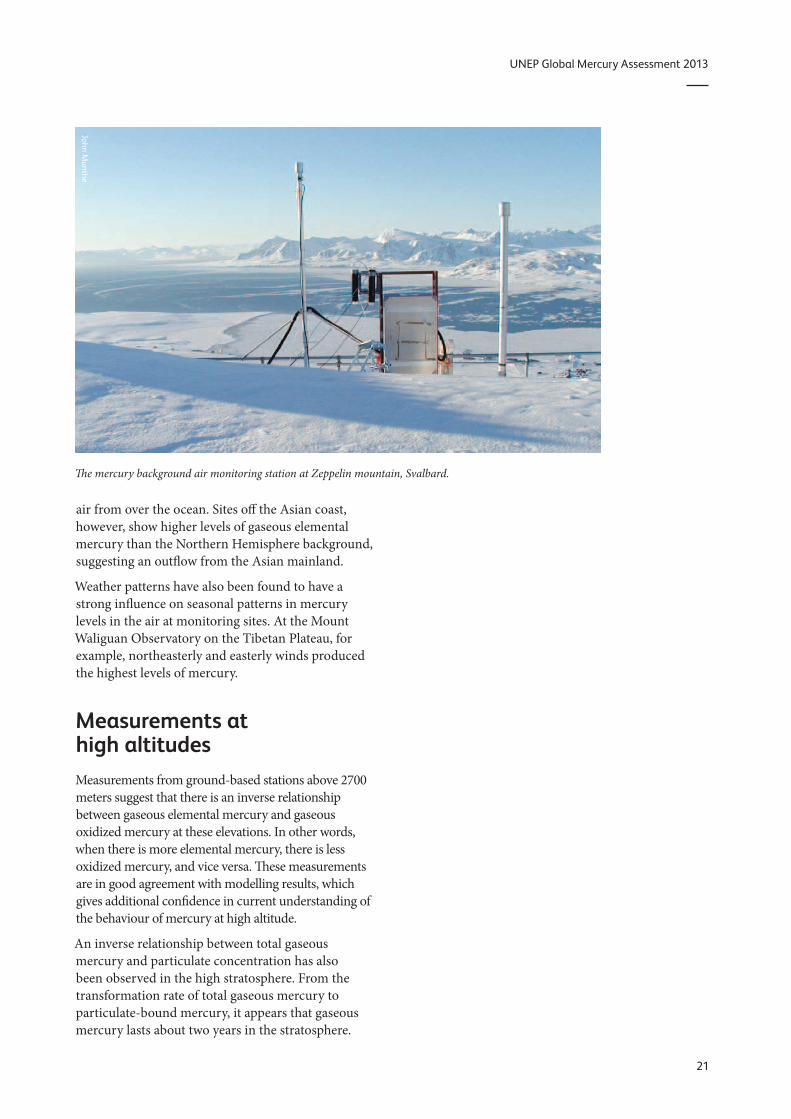
UNEP Global Mercury Assessment 2013
John Munthe
The mercury background air monitoring station at Zeppelin mountain Svalbard
air from over the ocean Sites off the Asian coast however show higher levels of gaseous elemental mercury than the Northern Hemisphere background suggesting an outflow from the Asian mainland
Weather patterns have also been found to have a strong influence on seasonal patterns in mercury levels in the air at monitoring sites At the Mount Waliguan Observatory on the Tibetan Plateau for example northeasterly and easterly winds produced the highest levels of mercury
Measurements at high altitudes Measurements from ground-based stations above 2700 meters suggest that there is an inverse relationship between gaseous elemental mercury and gaseous oxidized mercury at these elevations In other words when there is more elemental mercury there is less oxidized mercury and vice versa These measurements are in good agreement with modelling results which gives additional confidence in current understanding of the behaviour of mercury at high altitude
An inverse relationship between total gaseous mercury and particulate concentration has also been observed in the high stratosphere From the transformation rate of total gaseous mercury to particulate-bound mercury it appears that gaseous mercury lasts about two years in the stratosphere
21
UNEP Global Mercury Assessment 2013
Atmospheric concentrations and deposition 6 Measurements and trends of mercury in precipitation Mercury deposited by precipitation decreased from the 1990s into the 2000s at many but not all sites in North America and Western Europe where such measurements were taken
Regional patterns are also evident including slightly higher levels in southern Europe than northern Europe and higher levels in Asia than in North America Total mercury concentrations in precipitation in China were much higher than those in Japan and South Korea Th is was mostly attributed to higher levels of gaseous oxidized mercury and particulate-bound mercury which are readily deposited by precipitation and thus not transported far
A comparison of data from Canadian and American monitoring sites found that deposition of mercury in precipitation was highest in summer
Dry deposition of mercury which is deposition not associated with precipitation is diffi cult to measure and consequently there is little information on trends in mercury dry deposition Th is lack of information means that it is also diffi cult to validate model results for dry deposition
106 44
474 72 91
5 7 71
05 1 5 10 100 500 1000
Total mercury emission (2005) kgcell
Modelled mercury air concentrations and deposition patterns Atmospheric mercury concentrations are highest in major industrial regions Models examining global patterns show that East and South Asia Europe North America and South Africa have the highest levels of elemental mercury in the air Concentrations are generally lower in the Southern Hemisphere than the Northern Hemisphere because most industrial activity is in northern regions Th ese model results are based on simulations using the 2005 global mercury emission inventory because the 2010 inventory has only recently become available
Intercontinental transport of mercury in the air has been examined to determine its impact on regional mercury levels Four models using diff erent parameters produced consistent results Depending on the region mercury emitted by distant sources contributes between 10 and 30 of annual mercury deposition Where local sources are low mercury transported from distant emission sources can account for more than half of the deposition East Asia is the dominant source region adding 10-14 to the deposition in
Contribution from sources outside receptor region
Model 40
GEOS-Chem GLEMOS GRAHM CMAQ-Hg
30
20
10
0 Arctic Europe North East Asia South Asia
America
Receptor region
(Left ) Global distribution of anthropogenic mercury emissions in 2005 with source regions that were considered in the analysis (North America South America Europe Africa Central Asia South Asia East Asia Australia and Oceania) and (right) the contribution of anthropogenic sources outside a particular receptor region to deposition within the receptor region
22
UNEP Global Mercury Assessment 2013
Modelling atmospheric transport and deposition Global models reproduce the movement of mercury in the atmosphere during which the mercury may move between continents They have been effective in examining sources of mercury to the Arctic and also for examining the outflow of pollution from South and Southeast Asia and its impact on western North America as well as the flow from eastern North America to Europe
Regional models on the scale of a continent or a basin such as the Mediterranean can provide more detail about specific source areas even to the level of individual industrial areas Reliable results however require a detailed understanding of mercury oxidation in the atmosphere about which there is considerably uncertainty
Most atmospheric transport models consider the full chain of mercury processes in the atmosphere Some models also consider how mercury is cycled in other atmospheric compartments such as soil vegetation snow freshwater and seawater
One of the largest sources of uncertainty in mercury models is the chemical mechanism used to determine how mercury changes forms in the air Improved experimental data can help improve model performance by making sure that the correct reactions are simulated The processes that lead from deposition to re-emission also need to be understood better Advances in this area show promise with model results becoming closer to estimates based on experimental data
other regions of the world Natural emissions and re-emissions account for 35-70 of total deposition in most regions Deposition is generally greater in low and mid-latitudes due to stronger sunlight higher concentrations of oxidants and higher precipitation
Regional mercury models show patterns at the scales of continents or individual seas The Mediterranean Sea for example is a net source of mercury as it emits more than is deposited to it In that region dry deposition generally exceeds deposition of mercury in precipitation In Central and Southern Europe total gaseous mercury concentrations and deposition in precipitation were both consistently higher than the European average
Across the United States dry deposition accounts for two-thirds of total annual deposition mainly from gaseous oxidized mercury A study examining sources and deposition of mercury to assess the
benefits of proposed emission control measures found that mercury transport from outside the country accounts for 68 of mercury deposition in the Northeast and up to 91 in the west-central United States Large point sources contribute up to three-quarters of nearby deposition and power plants contributed half of the deposition in the eastern part of the country This suggests that new emissions standards would primarily benefit eastern regions of the US
In Asia studies show high seasonal variation in mercury concentration and deposition Anthropogenic emissions are responsible for about 75 of deposition in East Asia In this region there is a net removal of gaseous oxidized mercury from the atmosphere and a net export of gaseous elemental mercury
In the Arctic gaseous elemental mercury levels in the atmosphere are depleted rapidly in spring when after the long Arctic winters sunlight returns Ozone is depleted at the same time and it is believed that bromine-containing compounds are the cause of the photo-chemical reactions that deplete ozone and mercury During these events gaseous oxidized mercury and particulate-bound mercury levels increase sharply suggesting that the gaseous mercury is oxidized and deposited enhancing mercury deposition in Arctic areas in springtime Recent research however has found that 50-80 of the deposited mercury is re-emitted within a few days Similar springtime mercury depletion events have been seen in Antarctica
23
UNEP Global Mercury Assessment 2013
Anthropogenic releases to the aquatic environment 7 Global assessment Previous UNEP global mercury assessments only considered emissions to the atmosphere The 2013 Report presents the first attempt at compiling a global inventory of mercury releases to aquatic environments Releases directly into the aquatic environment present a completely different chemistry set of pathways and fate to those released to air They are also more directly linked to the risks posed by mercury to global environmental and human health Unlike mercury releases to air which are predominantly in the form of gaseous elemental mercury releases to water are predominantly inorganic mercury and to a lesser extent liquid elemental mercury
At present only some sources of aquatic releases can be quantified with any confidence Thus many sources that may be important are not included in this first assessment of global aquatic releases For example land management practices that expose new geological sources of mercury in rocks and mineral soils or that re-mobilize previously deposited mercury cannot yet be assessed Two broad categories of current anthropogenic sources are considered here point sources of mercury release to water and diffuse releases of mercury as a result of its remobilisation from areas where it was previously deposited or accumulated due to human activity (ie contaminated sites) Artisanal and small-scale gold mining (ASGM) mercury-containing pesticides and fungicides used in agriculture and deforestation are considered separately
Point source releases to water from various sectors in tonnes per year with the range of the estimate and as a percentage of total anthropogenic emissions
Sector Releases (range) tonnes
Non-ferrous metal production 925 (193 - 268)
Consumer product waste 894 (222 - 308)
Chlor-alkali production 28 (10 ndash 55)
Oil refining 06 (03 ndash 1)
Grand Total 185 (426 ndash 582)
The global estimate of mercury release to water from point sources has been derived from the atmospheric emissions assessment and the approach employed in the UNEP Toolkit to partition total mercury releases between air land and water This approach has considerable uncertainty and may omit sectors where releases to water are high but air emissions are unimportant and therefore not addressed in the inventory Global releases from point sources were estimated to be 185 tonnes per year
For diffuse sources evaluating the relative contribution of anthropogenic and natural sources to the aquatic environment requires determining considerations of the various mercury inputs For some sectors data exist that allow a preliminary assessment of the amounts of mercury re-mobilized into aquatic systems
For mercury-contaminated sites the range of average soil concentrations of mercury reported for sites where mercury was mined used or otherwise released by human activity was considered The area of contamination is then used to determine how much mercury is available in soils and when combined with a factor for how much mercury is released from those soils in a year the total release can be estimated Among identified contaminated sites mercury mining is identified as the largest sector followed by mining of precious metals Total releases to aquatic environments from contaminated sites are estimated to be 83-335 tonnes per year
Releases to water from contaminated sites in tonnes per year with the range of the estimate
Sector Releases (range) tonnes
Primary mercury mining sites 67 ndash 266
Precious metal production sites 14 ndash 55
Non-ferrous metal production sites 01 ndash 05
Chlor-alkali production sites 01 ndash 05
Other industrial sites 01 ndash 03
Grand Total 83 ndash 335
24
UNEP Global Mercury Assessment 2013
Much of the mercury released from artisanal and small-scale gold mining goes into rivers lakes soils and sediments and tailings From soils and tailings it may be re-mobilized by leaching and erosion In addition mining may disturb mercury-containing soils and sediments that may then erode more quickly releasing more mercury than would otherwise have become available from natural erosion A key factor in these processes is the local hydrological cycle of precipitation evaporation run-off and river flow To account for this in the assessment countries were designated as dry wet or intermediate to determine the relative importance of erosion The tropical and subtropical countries which have the greatest activity in this sector also tend to experience high precipitation and run-off exacerbating this source of mercury release and re-mobilization Total worldwide releases of mercury to land and water from ASGM were estimated at over 800 tonnes per year How much of this is released to water cannot yet be determined
Mercury continues to be used in pesticides and fungicides 2100 tonnes of mercury were released in the decade of the 1960s through such agrochemical uses Current data are unavailable although the use of mercury in these products has been greatly reduced
Deforestation especially in the Amazon Basin can lead to extensive soil erosion and thus the release of mercury previously accumulated in soils Using 2010 figures for deforestation rates around the world and an estimate of soil concentrations of mercury as much as 260 tonnes of mercury may have been released into rivers in 2010 as a result of deforestation worldwide
Because this is the first attempt to quantify global mercury releases to the aquatic environment there is no previous measurement against which these results can be compared Thus it is not possible at this time to evaluate trends in releases
Uncertainties in release estimates Estimating global releases of mercury to aquatic environments is being done here for the first time Many data are missing and others are imprecise A number of assumptions have been made based on what measurements are available or on other grounds to extrapolate from known quantities or to calculate aquatic releases in relation to atmospheric
or other emissions Thus the results should be treated with great caution It is nonetheless clear that anthropogenic sources and human activity contribute hundreds of tonnes of mercury to aquatic environments each year a substantial amount relative to estimated natural releases 150-960 tonnes per year from terrestrial environments
Lapshin Shutterstockcom
Phil Augustavo istockphotocom
Bureau of Land Managem
ent
Contaminated sites (top) erosion following deforestation (middle) and a flooded store of mercury-contaminated waste (lower) illustrate potential sources of mercury releases to water
25
UNEP Global Mercury Assessment 2013
Aquatic pathways transport and fate 8 Mercury in aquatic environments The pathways and fate of mercury in aquatic environments are important because it is in waters sediments and wetland soils that inorganic mercury is converted into methylmercury which is toxic and concentrates in animals The majority of human exposure to mercury and the health risk that comes with mercury exposure is from consumption of marine foods Thus this section focuses on the worldrsquos oceans Some freshwater systems however are important sources of fish for human consumption especially for subsistence and recreational fisheries often among indigenous peoples Artisanal and small-scale gold mining (ASGM) communities may also be affected through fish consumption and drinking water if those are contaminated by local releases
The major processes of mercury cycling are generally similar for all aquatic systems Inorganic mercury in dissolved or particulate form is the dominant mercury type in most marine and fresh waters Dissolved gaseous elemental mercury accounts for less than 30 of total mercury in water Methylmercury is often present at trace levels but may in some settings reach 30 of total mercury In freshwater and coastal environments inorganic mercury is transformed into methylmercury primarily in sediments In the open ocean this conversion takes place largely at intermediate depths between 200 and 1000 meters in the water column Mercury is lost from aquatic systems in two ways When inorganic mercury is reduced to elemental mercury it can be re-emitted to the atmosphere When inorganic mercury binds to particulates in water it can settle out rapidly and be buried in sediments Deep burial in ocean sediments is one of the major pathways by which mercury is removed from the biologically active environment
The global mercury cycle is chemically and physically complex Thus it is necessary to use models to study describe and predict what happens and will happen to mercury in the aquatic environment Until recently only one model existed that incorporated
air land and water into a unified whole The model has been validated against observations of mercury and represents the current scientific consensus The largest potential errors in this model in terms of the aquatic cycle concern details of the exchange of mercury between air and water
Pathways and fate of mercury in the oceans Model simulations suggest that anthropogenic impacts on mercury levels in the ocean are greatest in the surface waters the top 100 meters or so of the water column While model results vary one recent estimate suggests that anthropogenic emissions over the last 100 years have doubled the concentration of mercury in the surface layer of the ocean and increased it by 25 in intermediate waters and by 10 in deep waters The difference is due to the length of time it takes for surface waters to circulate to the depths
Models and measurements agree that direct deposition from the atmosphere is the dominant pathway by which mercury reaches the oceans The exceptions are smaller semi-enclosed basins such as the Mediterranean Sea or the Arctic Ocean where river runoff coastal erosion and ocean currents
Ugo M
ontaldo Shutterstockcom
26
UNEP Global Mercury Assessment 2013
account for about half of mercury inputs The most recent modelling effort suggests that total deposition input of mercury to the oceans in 2008 was 3700 tonnes
Other mercury pathways appear less important on a global basis Rivers are estimated to carry more than 2800 tonnes of mercury each year but only about 380 tonnes of this is transported offshore The rest is trapped by particles in estuaries Groundwater and re-mobilization from sediments provide 100shy800 tonnes of mercury to the oceans each year Undersea hydrothermal vents add less than 600 tonnes of mercury to the oceans There are high concentrations of mercury in vent fluids but a great deal of the mercury is precipitated as solids once the vent fluids enter seawater
Models suggest that globally about 70 of the mercury deposited into the ocean is re-emitted to the atmosphere Oxidized mercury in surface waters is reduced by biological and photochemical processes to the elemental form that is volatile and readily re-emitted The removal of this mercury ultimately reduces the pool of mercury that could be converted to methylmercury and be accumulated by marine organisms The re-emission process thus simultaneously prolongs the lifetime of mercury cycling through the atmosphere and upper ocean and acts to reduce mercury availability for marine food webs
Any changes in the efficiency of mercury reduction in surface waters or the rate of re-emission is likely to impact mercury concentrations in surface waters and the air One example is the effect of sea ice in the Arctic Ocean which blocks the re-emission
Tony Magdaraog Shutterstockcom
Mercury accumulated in marine food-webs can enter the human diet
of elemental mercury leaving elevated levels in waters under ice Changes in primary productivity could change the rate at which mercury is bound to particles thus affecting re-emission to the atmosphere as well as rates of downward transport in the ocean Changes in oxidant levels in the atmosphere such as ozone and bromine may also influence the rate of oxidation of gaseous elemental mercury and thus deposition rates to the ocean
Methylmercury in the ocean Natural bacterial processes in seawater and in sediments in coastal environments convert inorganic mercury to methylmercury Methylmercury levels are highest in the subsurface waters of many oceans because it is formed at these intermediate depths likely as a result of the decomposition of organic material falling from surface waters Current understanding indicates that about 300 tonnes of methylmercury is produced in the upper ocean by this and related processes By contrast only about 80 tonnes of methylmercury reaches the ocean from other sources such as atmospheric deposition rivers and diffusion from sediments
Current modelling indicates that methylmercury stays in the upper ocean for about 11 years Deshymethylation by photochemical reaction or by microbial activity is the major removal process for methylmercury in the ocean About 240 tonnes of methylmercury is removed by this process from the surface waters of the ocean per year
The other important pathway for methylmercury in seawater is uptake into marine food webs Although only about 40 tonnes per year is taken up in this way it is this fraction that poses risks to marine animals and human consumers of seafood Methylmercury is a problem for several reasons First it is taken up by plankton much more efficiently than is inorganic mercury resulting in concentrations in plankton that are as high as 10000 times the concentration in seawater Second methylmercury is absorbed through the intestine of animals much more easily than is inorganic mercury Third methylmercury biomagnifies as it moves up the food web Thus methylmercury becomes an increasingly greater proportion of the mercury in organisms higher in the food web This explains why some indigenous populations that consume top marine predators such as fish seals and whales have some of the worldrsquos highest concentrations of methylmercury giving rise to health concerns
27
UNEP Global Mercury Assessment 2013
Pathways and fate of mercury in freshwater Observations and modelling both show that there are in general many similarities between mercury chemistry pathways and fate in lakes and in the oceans but with obvious differences in scale and in the relative importance of different processes Modelling of mercury dynamics was done for four lakes with a history of direct mercury inputs from the largest freshwater lake in the world (Lake Superior) to small lakes in Ontario Canada Atmospheric deposition and river inflow were the main sources of inorganic mercury Much of the mercury input from lake and river catchments was associated with dissolved and particulate organic matter The dominant mercury removal mechanisms as in saltwater were burial in sediments and photochemical reduction of oxidized mercury to elemental mercury followed by re-emission to the air In Lake Superior and Lake Michigan there is evidence for methylation of mercury in the water column as is seen in the open ocean
Methylmercury levels in freshwater fish vary with the level of deposition of mercury from the air though other factors such as inputs from the watershed and the number of trophic levels within the lakersquos food web are also important Methylation predominantly occurred in lake sediments and wetlands and floodplain soils where sulphateshyreducing bacteria are believed to be primarily responsible Methylmercury is de-methylated in sediments and also taken away in the outlet river from each lake
Some 400-1400 tonnes of mercury are estimated globally to be trapped behind dams and other man-made impoundments each year This has in many cases led to significant increases in total mercury and methylmercury levels in water and of methylmercury in fish and other aquatic species When artificial lakes are created plant material is submerged leading to decay and anoxia In these conditions microbially driven methylation of inorganic mercury takes place In some cases the elevated mercury levels have also been observed downstream from the artificial lakes and reservoirs
Anthropogenic impacts on aquatic mercury levels Two studies have reported that the Atlantic and Pacific Oceans have shown opposing trends over recent decades While the influence of changing ocean currents and other oceanographic factors may be a factor the trends do make sense in light of patterns of anthropogenic emissions In the North Pacific Ocean mercury concentrations appear to have increased at depths between 200 and 1000 meters over the last few decades This increase coincides with the rapid industrialization of East Asia
In the North Atlantic however results from near Bermuda suggest a substantial decrease in mercury concentration and a change in the mercury profile through the water column The Mediterranean Sea too showed a decrease in mercury concentration between 1990 and 2004 These findings are consistent with atmospheric data from around the North Atlantic The conclusion is that mercury levels in seawater in the North Atlantic were elevated by human activity but may now be declining likely as a result of decreased emissions from North America and Europe
A complementary approach to measuring mercury in seawater is to measure mercury in aquatic animals which accumulate and integrate mercury over time Teeth hair feathers and eggshells are useful long-term archives of mercury concentrations and can provide data from the pre-industrial period (ie before 1800) as well as more recent periods
Among marine animals samples are available from several regions particularly from the Arctic where cold dry conditions help preserve animal tissues Mercury concentrations between the 13th and 16th
centuries were relatively stable From the mid- to late 19th century to the end of the 20th century mercury levels increased by an average of 12 times On average therefore about 92 of the mercury in Arctic marine wildlife today is likely to be of anthropogenic origin
Similar findings were found for a 700-year sequence of seabird eggshells from the South China Sea Mercury levels increased steadily between 1800 and 2000 with a particularly rapid increase after 1970 Concentrations since 2000 are about 10 times higher than pre-industrial levels with 91 of the mercury now likely to be of anthropogenic origin In the Antarctic studies of seal hairs show that pre-industrial mercury levels were only 60 of recent levels The relatively small difference
28
UNEP Global Mercury Assessment 2013
Historical Hg concentration as a proportion of present-day 100
80
60
40
20
0
Beluga teeth Human teeth
Gyrfalcon feathers Perigrine falcon feathers
Polar bear hair Ringed seal teeth
1200 1300 1400 1500 1600 1700 1800 1900 2000
between pre-industrial and modern mercury levels in Antarctic is consistent with lower mercury emissions and atmospheric concentrations in the Southern Hemisphere as compared with the Northern Hemisphere
The timing of long-term increases of mercury in aquatic animals can shed light on the likely sources of mercury emissions that were responsible The industrialization of Europe and North America appear responsible for the large increases in marine mercury levels that began in the 19th century as these increases occurred prior to recent Asian industrialization As with water concentrations in the Pacific Ocean recent rapid increases in mercury in seabird eggs in the South China Sea coincide with industrialization in Asia
The time lag in aquatic ecosystem response One important conclusion from air-ocean modeling is that the oceans have not yet reached equilibrium with current atmospheric levels of mercury This lag is due to several factors First mercury stays in the upper ocean above 200 meters depth for about 30 years and for centuries in intermediate and deep waters This is much longer than the one year residence time in the lower atmosphere Thus removal from the ocean takes much longer than does removal from the air and so concentrations will change more slowly
Second because of the long lifetime of mercury in deeper ocean waters a great deal of natural mercury is present in the ocean already about 100000 tonnes out of a total of 135000 tonnes in intermediate waters and 200000 out of 220000 tonnes in deep waters
Rune Dietz
Analysis of museum samples reflects the increase in mercury emissions and releases since the mid-19th century associated with anthropogenic activities
Third vertical transport of mercury from intermediate depths back to the surface returns a substantial amount of mercury to the biologically active zone each year As a result average mercury concentrations in seawater and marine animals are likely to increase slowly for decades if not centuries even if atmospheric levels stabilize at present levels In short the effects of historical anthropogenic emissions from Europe and North America are still being observed in the oceans at the same time that the effects of the recent rise in emissions from Asia are being seen
Regionally different trends can be expected depending on distance from sources and ocean circulation patterns In the North Atlantic north of 55deg N it will take 50-600 years to achieve equilibrium between atmospheric and seawater mercury levels In the North Pacific this process is estimated to take 500-700 years and in the Antarctic 700-1000 years The Arctic Ocean by contrast is smaller and will only take about 35 years to reflect changes in atmospheric mercury levels Surface waters of the Mediterranean Sea should show also changes within 10-50 years
Time lags in the responses of many freshwaters and their food-webs to changes in atmospheric mercury levels are also expected Although some immediate recovery following reductions in atmospheric mercury deposition rates is likely full recovery may take decades centuries or longer depending on the characteristics of the area Highly polluted freshwaters with catchments and sediments containing large amounts of anthropogenic mercury will recover most slowly as is already observed around point sources such as smelters that have closed down
29
UNEP Global Mercury Assessment 2013
Major gaps in knowledge 9 Large uncertainties remain in global estimates of mercury emissions to the air These stem from various sources including the availability of information on activity levels but mainly from the lack of information concerning the mercury content of some raw materials and the validity of assumptions regarding processes and technologies employed to reduce mercury emissions including their rates of application and effectiveness The accuracy and precision of measurement-based estimates can depend on the validity of extrapolating measurements made at infrequent intervals to longer periods or measurements made at one plant to other facilities with similar operations
Potentially important emissions sectors that are still not quantified in the emissions inventory include the use of mercury in vinyl-chloride monomer production secondary metals production oil and gas extraction transport and processing industrial and hazardous waste incineration and disposal sewage sludge incineration and dental fillings preparation and removal
Current measurements and their evaluation are inadequate for determining spatial and temporal trends Improved more extensive and better coordinated measurements are needed A permanent global integrated monitoring network for atmospheric mercury and mercury deposition is needed to achieve this goal The atmospheric network sites should be closely integrated with water soil and biological monitoring networks The results can be used for model testing and evaluation as well as for more accurately detailing the geographic impact of anthropogenic emissions Monitoring of mercury concentrations in the important marine food species is essential to understanding possible human health impacts and the effects of future emissions changes
Better data on mercury distribution in the troposphere is needed to improve understanding of long-range transport and source-receptor relationships Coordinated studies at high altitudes and by aircraft are needed This information will
also help validate regional and global scale models improving their prediction capabilities with regard to different policy scenarios
Key processes related to global transport and cycling of mercury remain inadequately understood The chemical form of gaseous oxidized mercury is unknown Reduction and oxidation rates for mercury in the presence of atmospheric oxidants need further study including determining which oxidants are important New measurements and modelling studies are needed to examine key chemical and physical processes that affect global transport and cycling
Few data are available for reporting mercury releases to aquatic systems Systematic and consistent monitoring of mercury releases to the air is required especially for contaminated systems Releases of mercury from soils into waters depend greatly on climate and topography and these parameters need to be better accounted for Consistent approaches for measuring and reporting releases from point sources are needed to ensure comparability of data from around the world In particular the actual role of artisanal and small-scale gold mining (ASGM) in emissions to air and releases to water needs to be more accurately estimated
The link between mercury deposition methylation and uptake by living organisms needs further study The parameters that determine the rates of exchange of mercury compounds between air and sea air and soil and air and vegetation are not fully understood Whole-ecosystem studies of mercury are needed to better understand biogeochemical cycling Methylationdemethylation rates and their spatial and temporal variations and relationship to climatic factors need to be determined in most of worldrsquos major ocean basins as well as in representative freshwaters
30
UNEP Global Mercury Assessment 2013
Key findings of the 2013 assessment 10 Atmosphere Total anthropogenic emissions of mercury to the atmosphere in 2010 are estimated at 1960 (1010shy4070) tonnes which is about 30 of the total mercury that was emitted and re-emitted from anthropogenic and natural sources in that year The largest anthropogenic sources are associated with artisanal and small-scale gold mining (ASGM) and coal burning which together account for about 62 of the annual total anthropogenic emissions to air Other major sectors include ferrous and non-ferrous metal production and cement production
East and Southeast Asia are responsible for about 40 of global anthropogenic emissions About 75 of the mercury from this region comes from China which is about one-third of the global total Increased estimates for emissions from ASGM largely a result of newly obtained data and improved information mean that South America and Sub-Saharan Africa are also responsible for a greater proportion of global emissions than was previously assumed
Anthropogenic emissions over time have increased mercury loads present in the environment This leads to higher rates of re-emission and also means that there will be a time lag of years or decades between emissions reductions and lower mercury levels in the food web including pathways of human exposure
Mercury emissions to the atmosphere likely peaked in the 1950s to 1970s and subsequently declined because of reductions in Europe Russia and North America Emission trends are unclear due to changes in methods employed to produce inventories and differences in the sectors that have been accounted at different times There are however some indications that emissions may be rising again with increases from East Asia offsetting continuing reductions in Europe and North America
Aquatic environments Natural processes in aquatic systems convert less toxic elemental and inorganic mercury into much more toxic methylmercury Methylmercury concentrates and accumulates in the food web leading to high concentrations in some species of seafood and fish that many people eat
Anthropogenic releases of mercury to aquatic environments contribute hundreds of tonnes to the amount of mercury cycling in the environment Diffuse releases and point sources appear equally important Atmospheric deposition however remains the most important input of mercury to land and oceans and has increased the amount of mercury in many environmental compartments by a factor of two or three since the start of the industrial age On land mercury that is deposited is largely retained in soils and vegetation increasing the available pool for re-mobilisation to adjacent aquatic systems Re-emission from soils however is a major addition to atmospheric mercury
Hydrology is the most important factor in the transport of mercury from catchments to downstream environments Relatively little of this mercury reaches the open ocean as most is captured in sediments behind dams in estuaries and near the coast Changes in land cover and land use can have a large effect on mercury mobilisation as exposed soils erode and mercury leaches into the water table
Concentrations of mercury in Arctic marine animals today are about 10-12 times higher than in preshyindustrial times (ie prior to about 1800) This means that on average about 92 of the mercury in marine predators such as seabirds seals and whales is anthropogenic in origin The timing of the increase suggest that 19th and early 20th century emissions from Europe North America and Russia were responsible Increases mercury concentrations in seabirds in the South China Sea appear to be more recent than the Arctic increases coinciding with increasing industrialisation in East and Southeast Asia
31
UNEP Global Mercury Assessment 2013
K+S Entsorgung Gm
bH
Recovered mercury is being stockpiled at long-term storage sites above- and as shown here below ground
The upper 100 meters of the oceans have twice the mercury that they did a century ago Intermediate and deeper waters have 10-25 more mercury on average reflecting the slow transport of mercury downwards in the oceans Seawater concentrations will thus be especially slow in responding to changes in mercury inputs from atmospheric deposition and river flow As a result mercury concentrations in marine biota are likely to increase slowly for decades to centuries even without an increase in atmospheric emissions
In freshwater ecosystems atmospheric deposition and re-mobilisation from soils slow the reduction of mercury levels even in regions where atmospheric concentrations have decreased due to emission controls
Further increases in atmospheric emissions will have long-term consequences for commercial fisheries and all consumers of marine and freshwater foods
It is likely to be years or decades before reductions in anthropogenic emissions and releases of mercury have a demonstrable effect on mercury levels throughout the environment and in the fish and marine mammals which are part of the human food-chain This only reinforces the need to act now to continue and strengthen international efforts to reduce current mercury emissions and releases Delays in action now will inevitably lead to slower recovery of the worldrsquos ecosystems in future from mercury contamination leaving an even greater legacy of pollution for future generations
32
Division of Technology Industry and Economics (DTIE) Chemicals Branch Geneva Switzerland January 2013
Job number DTI1636GE
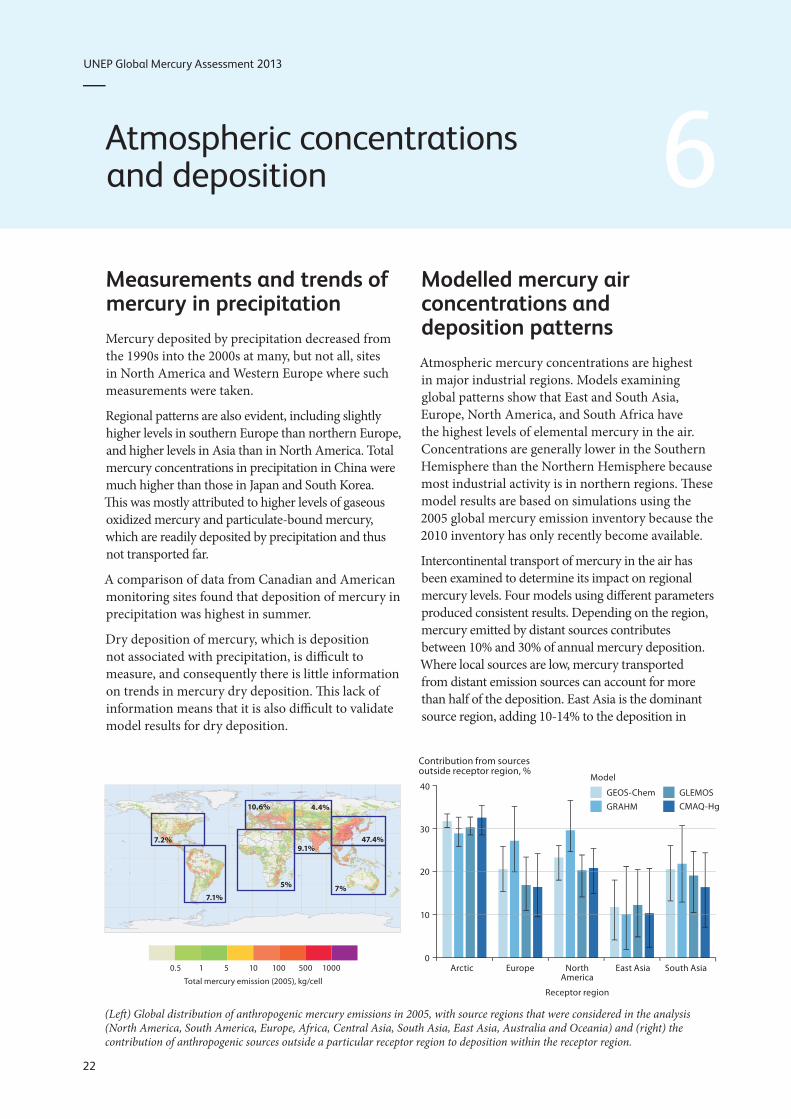
UNEP Global Mercury Assessment 2013
Atmospheric concentrations and deposition 6 Measurements and trends of mercury in precipitation Mercury deposited by precipitation decreased from the 1990s into the 2000s at many but not all sites in North America and Western Europe where such measurements were taken
Regional patterns are also evident including slightly higher levels in southern Europe than northern Europe and higher levels in Asia than in North America Total mercury concentrations in precipitation in China were much higher than those in Japan and South Korea Th is was mostly attributed to higher levels of gaseous oxidized mercury and particulate-bound mercury which are readily deposited by precipitation and thus not transported far
A comparison of data from Canadian and American monitoring sites found that deposition of mercury in precipitation was highest in summer
Dry deposition of mercury which is deposition not associated with precipitation is diffi cult to measure and consequently there is little information on trends in mercury dry deposition Th is lack of information means that it is also diffi cult to validate model results for dry deposition
106 44
474 72 91
5 7 71
05 1 5 10 100 500 1000
Total mercury emission (2005) kgcell
Modelled mercury air concentrations and deposition patterns Atmospheric mercury concentrations are highest in major industrial regions Models examining global patterns show that East and South Asia Europe North America and South Africa have the highest levels of elemental mercury in the air Concentrations are generally lower in the Southern Hemisphere than the Northern Hemisphere because most industrial activity is in northern regions Th ese model results are based on simulations using the 2005 global mercury emission inventory because the 2010 inventory has only recently become available
Intercontinental transport of mercury in the air has been examined to determine its impact on regional mercury levels Four models using diff erent parameters produced consistent results Depending on the region mercury emitted by distant sources contributes between 10 and 30 of annual mercury deposition Where local sources are low mercury transported from distant emission sources can account for more than half of the deposition East Asia is the dominant source region adding 10-14 to the deposition in
Contribution from sources outside receptor region
Model 40
GEOS-Chem GLEMOS GRAHM CMAQ-Hg
30
20
10
0 Arctic Europe North East Asia South Asia
America
Receptor region
(Left ) Global distribution of anthropogenic mercury emissions in 2005 with source regions that were considered in the analysis (North America South America Europe Africa Central Asia South Asia East Asia Australia and Oceania) and (right) the contribution of anthropogenic sources outside a particular receptor region to deposition within the receptor region
22
UNEP Global Mercury Assessment 2013
Modelling atmospheric transport and deposition Global models reproduce the movement of mercury in the atmosphere during which the mercury may move between continents They have been effective in examining sources of mercury to the Arctic and also for examining the outflow of pollution from South and Southeast Asia and its impact on western North America as well as the flow from eastern North America to Europe
Regional models on the scale of a continent or a basin such as the Mediterranean can provide more detail about specific source areas even to the level of individual industrial areas Reliable results however require a detailed understanding of mercury oxidation in the atmosphere about which there is considerably uncertainty
Most atmospheric transport models consider the full chain of mercury processes in the atmosphere Some models also consider how mercury is cycled in other atmospheric compartments such as soil vegetation snow freshwater and seawater
One of the largest sources of uncertainty in mercury models is the chemical mechanism used to determine how mercury changes forms in the air Improved experimental data can help improve model performance by making sure that the correct reactions are simulated The processes that lead from deposition to re-emission also need to be understood better Advances in this area show promise with model results becoming closer to estimates based on experimental data
other regions of the world Natural emissions and re-emissions account for 35-70 of total deposition in most regions Deposition is generally greater in low and mid-latitudes due to stronger sunlight higher concentrations of oxidants and higher precipitation
Regional mercury models show patterns at the scales of continents or individual seas The Mediterranean Sea for example is a net source of mercury as it emits more than is deposited to it In that region dry deposition generally exceeds deposition of mercury in precipitation In Central and Southern Europe total gaseous mercury concentrations and deposition in precipitation were both consistently higher than the European average
Across the United States dry deposition accounts for two-thirds of total annual deposition mainly from gaseous oxidized mercury A study examining sources and deposition of mercury to assess the
benefits of proposed emission control measures found that mercury transport from outside the country accounts for 68 of mercury deposition in the Northeast and up to 91 in the west-central United States Large point sources contribute up to three-quarters of nearby deposition and power plants contributed half of the deposition in the eastern part of the country This suggests that new emissions standards would primarily benefit eastern regions of the US
In Asia studies show high seasonal variation in mercury concentration and deposition Anthropogenic emissions are responsible for about 75 of deposition in East Asia In this region there is a net removal of gaseous oxidized mercury from the atmosphere and a net export of gaseous elemental mercury
In the Arctic gaseous elemental mercury levels in the atmosphere are depleted rapidly in spring when after the long Arctic winters sunlight returns Ozone is depleted at the same time and it is believed that bromine-containing compounds are the cause of the photo-chemical reactions that deplete ozone and mercury During these events gaseous oxidized mercury and particulate-bound mercury levels increase sharply suggesting that the gaseous mercury is oxidized and deposited enhancing mercury deposition in Arctic areas in springtime Recent research however has found that 50-80 of the deposited mercury is re-emitted within a few days Similar springtime mercury depletion events have been seen in Antarctica
23
UNEP Global Mercury Assessment 2013
Anthropogenic releases to the aquatic environment 7 Global assessment Previous UNEP global mercury assessments only considered emissions to the atmosphere The 2013 Report presents the first attempt at compiling a global inventory of mercury releases to aquatic environments Releases directly into the aquatic environment present a completely different chemistry set of pathways and fate to those released to air They are also more directly linked to the risks posed by mercury to global environmental and human health Unlike mercury releases to air which are predominantly in the form of gaseous elemental mercury releases to water are predominantly inorganic mercury and to a lesser extent liquid elemental mercury
At present only some sources of aquatic releases can be quantified with any confidence Thus many sources that may be important are not included in this first assessment of global aquatic releases For example land management practices that expose new geological sources of mercury in rocks and mineral soils or that re-mobilize previously deposited mercury cannot yet be assessed Two broad categories of current anthropogenic sources are considered here point sources of mercury release to water and diffuse releases of mercury as a result of its remobilisation from areas where it was previously deposited or accumulated due to human activity (ie contaminated sites) Artisanal and small-scale gold mining (ASGM) mercury-containing pesticides and fungicides used in agriculture and deforestation are considered separately
Point source releases to water from various sectors in tonnes per year with the range of the estimate and as a percentage of total anthropogenic emissions
Sector Releases (range) tonnes
Non-ferrous metal production 925 (193 - 268)
Consumer product waste 894 (222 - 308)
Chlor-alkali production 28 (10 ndash 55)
Oil refining 06 (03 ndash 1)
Grand Total 185 (426 ndash 582)
The global estimate of mercury release to water from point sources has been derived from the atmospheric emissions assessment and the approach employed in the UNEP Toolkit to partition total mercury releases between air land and water This approach has considerable uncertainty and may omit sectors where releases to water are high but air emissions are unimportant and therefore not addressed in the inventory Global releases from point sources were estimated to be 185 tonnes per year
For diffuse sources evaluating the relative contribution of anthropogenic and natural sources to the aquatic environment requires determining considerations of the various mercury inputs For some sectors data exist that allow a preliminary assessment of the amounts of mercury re-mobilized into aquatic systems
For mercury-contaminated sites the range of average soil concentrations of mercury reported for sites where mercury was mined used or otherwise released by human activity was considered The area of contamination is then used to determine how much mercury is available in soils and when combined with a factor for how much mercury is released from those soils in a year the total release can be estimated Among identified contaminated sites mercury mining is identified as the largest sector followed by mining of precious metals Total releases to aquatic environments from contaminated sites are estimated to be 83-335 tonnes per year
Releases to water from contaminated sites in tonnes per year with the range of the estimate
Sector Releases (range) tonnes
Primary mercury mining sites 67 ndash 266
Precious metal production sites 14 ndash 55
Non-ferrous metal production sites 01 ndash 05
Chlor-alkali production sites 01 ndash 05
Other industrial sites 01 ndash 03
Grand Total 83 ndash 335
24
UNEP Global Mercury Assessment 2013
Much of the mercury released from artisanal and small-scale gold mining goes into rivers lakes soils and sediments and tailings From soils and tailings it may be re-mobilized by leaching and erosion In addition mining may disturb mercury-containing soils and sediments that may then erode more quickly releasing more mercury than would otherwise have become available from natural erosion A key factor in these processes is the local hydrological cycle of precipitation evaporation run-off and river flow To account for this in the assessment countries were designated as dry wet or intermediate to determine the relative importance of erosion The tropical and subtropical countries which have the greatest activity in this sector also tend to experience high precipitation and run-off exacerbating this source of mercury release and re-mobilization Total worldwide releases of mercury to land and water from ASGM were estimated at over 800 tonnes per year How much of this is released to water cannot yet be determined
Mercury continues to be used in pesticides and fungicides 2100 tonnes of mercury were released in the decade of the 1960s through such agrochemical uses Current data are unavailable although the use of mercury in these products has been greatly reduced
Deforestation especially in the Amazon Basin can lead to extensive soil erosion and thus the release of mercury previously accumulated in soils Using 2010 figures for deforestation rates around the world and an estimate of soil concentrations of mercury as much as 260 tonnes of mercury may have been released into rivers in 2010 as a result of deforestation worldwide
Because this is the first attempt to quantify global mercury releases to the aquatic environment there is no previous measurement against which these results can be compared Thus it is not possible at this time to evaluate trends in releases
Uncertainties in release estimates Estimating global releases of mercury to aquatic environments is being done here for the first time Many data are missing and others are imprecise A number of assumptions have been made based on what measurements are available or on other grounds to extrapolate from known quantities or to calculate aquatic releases in relation to atmospheric
or other emissions Thus the results should be treated with great caution It is nonetheless clear that anthropogenic sources and human activity contribute hundreds of tonnes of mercury to aquatic environments each year a substantial amount relative to estimated natural releases 150-960 tonnes per year from terrestrial environments
Lapshin Shutterstockcom
Phil Augustavo istockphotocom
Bureau of Land Managem
ent
Contaminated sites (top) erosion following deforestation (middle) and a flooded store of mercury-contaminated waste (lower) illustrate potential sources of mercury releases to water
25
UNEP Global Mercury Assessment 2013
Aquatic pathways transport and fate 8 Mercury in aquatic environments The pathways and fate of mercury in aquatic environments are important because it is in waters sediments and wetland soils that inorganic mercury is converted into methylmercury which is toxic and concentrates in animals The majority of human exposure to mercury and the health risk that comes with mercury exposure is from consumption of marine foods Thus this section focuses on the worldrsquos oceans Some freshwater systems however are important sources of fish for human consumption especially for subsistence and recreational fisheries often among indigenous peoples Artisanal and small-scale gold mining (ASGM) communities may also be affected through fish consumption and drinking water if those are contaminated by local releases
The major processes of mercury cycling are generally similar for all aquatic systems Inorganic mercury in dissolved or particulate form is the dominant mercury type in most marine and fresh waters Dissolved gaseous elemental mercury accounts for less than 30 of total mercury in water Methylmercury is often present at trace levels but may in some settings reach 30 of total mercury In freshwater and coastal environments inorganic mercury is transformed into methylmercury primarily in sediments In the open ocean this conversion takes place largely at intermediate depths between 200 and 1000 meters in the water column Mercury is lost from aquatic systems in two ways When inorganic mercury is reduced to elemental mercury it can be re-emitted to the atmosphere When inorganic mercury binds to particulates in water it can settle out rapidly and be buried in sediments Deep burial in ocean sediments is one of the major pathways by which mercury is removed from the biologically active environment
The global mercury cycle is chemically and physically complex Thus it is necessary to use models to study describe and predict what happens and will happen to mercury in the aquatic environment Until recently only one model existed that incorporated
air land and water into a unified whole The model has been validated against observations of mercury and represents the current scientific consensus The largest potential errors in this model in terms of the aquatic cycle concern details of the exchange of mercury between air and water
Pathways and fate of mercury in the oceans Model simulations suggest that anthropogenic impacts on mercury levels in the ocean are greatest in the surface waters the top 100 meters or so of the water column While model results vary one recent estimate suggests that anthropogenic emissions over the last 100 years have doubled the concentration of mercury in the surface layer of the ocean and increased it by 25 in intermediate waters and by 10 in deep waters The difference is due to the length of time it takes for surface waters to circulate to the depths
Models and measurements agree that direct deposition from the atmosphere is the dominant pathway by which mercury reaches the oceans The exceptions are smaller semi-enclosed basins such as the Mediterranean Sea or the Arctic Ocean where river runoff coastal erosion and ocean currents
Ugo M
ontaldo Shutterstockcom
26
UNEP Global Mercury Assessment 2013
account for about half of mercury inputs The most recent modelling effort suggests that total deposition input of mercury to the oceans in 2008 was 3700 tonnes
Other mercury pathways appear less important on a global basis Rivers are estimated to carry more than 2800 tonnes of mercury each year but only about 380 tonnes of this is transported offshore The rest is trapped by particles in estuaries Groundwater and re-mobilization from sediments provide 100shy800 tonnes of mercury to the oceans each year Undersea hydrothermal vents add less than 600 tonnes of mercury to the oceans There are high concentrations of mercury in vent fluids but a great deal of the mercury is precipitated as solids once the vent fluids enter seawater
Models suggest that globally about 70 of the mercury deposited into the ocean is re-emitted to the atmosphere Oxidized mercury in surface waters is reduced by biological and photochemical processes to the elemental form that is volatile and readily re-emitted The removal of this mercury ultimately reduces the pool of mercury that could be converted to methylmercury and be accumulated by marine organisms The re-emission process thus simultaneously prolongs the lifetime of mercury cycling through the atmosphere and upper ocean and acts to reduce mercury availability for marine food webs
Any changes in the efficiency of mercury reduction in surface waters or the rate of re-emission is likely to impact mercury concentrations in surface waters and the air One example is the effect of sea ice in the Arctic Ocean which blocks the re-emission
Tony Magdaraog Shutterstockcom
Mercury accumulated in marine food-webs can enter the human diet
of elemental mercury leaving elevated levels in waters under ice Changes in primary productivity could change the rate at which mercury is bound to particles thus affecting re-emission to the atmosphere as well as rates of downward transport in the ocean Changes in oxidant levels in the atmosphere such as ozone and bromine may also influence the rate of oxidation of gaseous elemental mercury and thus deposition rates to the ocean
Methylmercury in the ocean Natural bacterial processes in seawater and in sediments in coastal environments convert inorganic mercury to methylmercury Methylmercury levels are highest in the subsurface waters of many oceans because it is formed at these intermediate depths likely as a result of the decomposition of organic material falling from surface waters Current understanding indicates that about 300 tonnes of methylmercury is produced in the upper ocean by this and related processes By contrast only about 80 tonnes of methylmercury reaches the ocean from other sources such as atmospheric deposition rivers and diffusion from sediments
Current modelling indicates that methylmercury stays in the upper ocean for about 11 years Deshymethylation by photochemical reaction or by microbial activity is the major removal process for methylmercury in the ocean About 240 tonnes of methylmercury is removed by this process from the surface waters of the ocean per year
The other important pathway for methylmercury in seawater is uptake into marine food webs Although only about 40 tonnes per year is taken up in this way it is this fraction that poses risks to marine animals and human consumers of seafood Methylmercury is a problem for several reasons First it is taken up by plankton much more efficiently than is inorganic mercury resulting in concentrations in plankton that are as high as 10000 times the concentration in seawater Second methylmercury is absorbed through the intestine of animals much more easily than is inorganic mercury Third methylmercury biomagnifies as it moves up the food web Thus methylmercury becomes an increasingly greater proportion of the mercury in organisms higher in the food web This explains why some indigenous populations that consume top marine predators such as fish seals and whales have some of the worldrsquos highest concentrations of methylmercury giving rise to health concerns
27
UNEP Global Mercury Assessment 2013
Pathways and fate of mercury in freshwater Observations and modelling both show that there are in general many similarities between mercury chemistry pathways and fate in lakes and in the oceans but with obvious differences in scale and in the relative importance of different processes Modelling of mercury dynamics was done for four lakes with a history of direct mercury inputs from the largest freshwater lake in the world (Lake Superior) to small lakes in Ontario Canada Atmospheric deposition and river inflow were the main sources of inorganic mercury Much of the mercury input from lake and river catchments was associated with dissolved and particulate organic matter The dominant mercury removal mechanisms as in saltwater were burial in sediments and photochemical reduction of oxidized mercury to elemental mercury followed by re-emission to the air In Lake Superior and Lake Michigan there is evidence for methylation of mercury in the water column as is seen in the open ocean
Methylmercury levels in freshwater fish vary with the level of deposition of mercury from the air though other factors such as inputs from the watershed and the number of trophic levels within the lakersquos food web are also important Methylation predominantly occurred in lake sediments and wetlands and floodplain soils where sulphateshyreducing bacteria are believed to be primarily responsible Methylmercury is de-methylated in sediments and also taken away in the outlet river from each lake
Some 400-1400 tonnes of mercury are estimated globally to be trapped behind dams and other man-made impoundments each year This has in many cases led to significant increases in total mercury and methylmercury levels in water and of methylmercury in fish and other aquatic species When artificial lakes are created plant material is submerged leading to decay and anoxia In these conditions microbially driven methylation of inorganic mercury takes place In some cases the elevated mercury levels have also been observed downstream from the artificial lakes and reservoirs
Anthropogenic impacts on aquatic mercury levels Two studies have reported that the Atlantic and Pacific Oceans have shown opposing trends over recent decades While the influence of changing ocean currents and other oceanographic factors may be a factor the trends do make sense in light of patterns of anthropogenic emissions In the North Pacific Ocean mercury concentrations appear to have increased at depths between 200 and 1000 meters over the last few decades This increase coincides with the rapid industrialization of East Asia
In the North Atlantic however results from near Bermuda suggest a substantial decrease in mercury concentration and a change in the mercury profile through the water column The Mediterranean Sea too showed a decrease in mercury concentration between 1990 and 2004 These findings are consistent with atmospheric data from around the North Atlantic The conclusion is that mercury levels in seawater in the North Atlantic were elevated by human activity but may now be declining likely as a result of decreased emissions from North America and Europe
A complementary approach to measuring mercury in seawater is to measure mercury in aquatic animals which accumulate and integrate mercury over time Teeth hair feathers and eggshells are useful long-term archives of mercury concentrations and can provide data from the pre-industrial period (ie before 1800) as well as more recent periods
Among marine animals samples are available from several regions particularly from the Arctic where cold dry conditions help preserve animal tissues Mercury concentrations between the 13th and 16th
centuries were relatively stable From the mid- to late 19th century to the end of the 20th century mercury levels increased by an average of 12 times On average therefore about 92 of the mercury in Arctic marine wildlife today is likely to be of anthropogenic origin
Similar findings were found for a 700-year sequence of seabird eggshells from the South China Sea Mercury levels increased steadily between 1800 and 2000 with a particularly rapid increase after 1970 Concentrations since 2000 are about 10 times higher than pre-industrial levels with 91 of the mercury now likely to be of anthropogenic origin In the Antarctic studies of seal hairs show that pre-industrial mercury levels were only 60 of recent levels The relatively small difference
28
UNEP Global Mercury Assessment 2013
Historical Hg concentration as a proportion of present-day 100
80
60
40
20
0
Beluga teeth Human teeth
Gyrfalcon feathers Perigrine falcon feathers
Polar bear hair Ringed seal teeth
1200 1300 1400 1500 1600 1700 1800 1900 2000
between pre-industrial and modern mercury levels in Antarctic is consistent with lower mercury emissions and atmospheric concentrations in the Southern Hemisphere as compared with the Northern Hemisphere
The timing of long-term increases of mercury in aquatic animals can shed light on the likely sources of mercury emissions that were responsible The industrialization of Europe and North America appear responsible for the large increases in marine mercury levels that began in the 19th century as these increases occurred prior to recent Asian industrialization As with water concentrations in the Pacific Ocean recent rapid increases in mercury in seabird eggs in the South China Sea coincide with industrialization in Asia
The time lag in aquatic ecosystem response One important conclusion from air-ocean modeling is that the oceans have not yet reached equilibrium with current atmospheric levels of mercury This lag is due to several factors First mercury stays in the upper ocean above 200 meters depth for about 30 years and for centuries in intermediate and deep waters This is much longer than the one year residence time in the lower atmosphere Thus removal from the ocean takes much longer than does removal from the air and so concentrations will change more slowly
Second because of the long lifetime of mercury in deeper ocean waters a great deal of natural mercury is present in the ocean already about 100000 tonnes out of a total of 135000 tonnes in intermediate waters and 200000 out of 220000 tonnes in deep waters
Rune Dietz
Analysis of museum samples reflects the increase in mercury emissions and releases since the mid-19th century associated with anthropogenic activities
Third vertical transport of mercury from intermediate depths back to the surface returns a substantial amount of mercury to the biologically active zone each year As a result average mercury concentrations in seawater and marine animals are likely to increase slowly for decades if not centuries even if atmospheric levels stabilize at present levels In short the effects of historical anthropogenic emissions from Europe and North America are still being observed in the oceans at the same time that the effects of the recent rise in emissions from Asia are being seen
Regionally different trends can be expected depending on distance from sources and ocean circulation patterns In the North Atlantic north of 55deg N it will take 50-600 years to achieve equilibrium between atmospheric and seawater mercury levels In the North Pacific this process is estimated to take 500-700 years and in the Antarctic 700-1000 years The Arctic Ocean by contrast is smaller and will only take about 35 years to reflect changes in atmospheric mercury levels Surface waters of the Mediterranean Sea should show also changes within 10-50 years
Time lags in the responses of many freshwaters and their food-webs to changes in atmospheric mercury levels are also expected Although some immediate recovery following reductions in atmospheric mercury deposition rates is likely full recovery may take decades centuries or longer depending on the characteristics of the area Highly polluted freshwaters with catchments and sediments containing large amounts of anthropogenic mercury will recover most slowly as is already observed around point sources such as smelters that have closed down
29
UNEP Global Mercury Assessment 2013
Major gaps in knowledge 9 Large uncertainties remain in global estimates of mercury emissions to the air These stem from various sources including the availability of information on activity levels but mainly from the lack of information concerning the mercury content of some raw materials and the validity of assumptions regarding processes and technologies employed to reduce mercury emissions including their rates of application and effectiveness The accuracy and precision of measurement-based estimates can depend on the validity of extrapolating measurements made at infrequent intervals to longer periods or measurements made at one plant to other facilities with similar operations
Potentially important emissions sectors that are still not quantified in the emissions inventory include the use of mercury in vinyl-chloride monomer production secondary metals production oil and gas extraction transport and processing industrial and hazardous waste incineration and disposal sewage sludge incineration and dental fillings preparation and removal
Current measurements and their evaluation are inadequate for determining spatial and temporal trends Improved more extensive and better coordinated measurements are needed A permanent global integrated monitoring network for atmospheric mercury and mercury deposition is needed to achieve this goal The atmospheric network sites should be closely integrated with water soil and biological monitoring networks The results can be used for model testing and evaluation as well as for more accurately detailing the geographic impact of anthropogenic emissions Monitoring of mercury concentrations in the important marine food species is essential to understanding possible human health impacts and the effects of future emissions changes
Better data on mercury distribution in the troposphere is needed to improve understanding of long-range transport and source-receptor relationships Coordinated studies at high altitudes and by aircraft are needed This information will
also help validate regional and global scale models improving their prediction capabilities with regard to different policy scenarios
Key processes related to global transport and cycling of mercury remain inadequately understood The chemical form of gaseous oxidized mercury is unknown Reduction and oxidation rates for mercury in the presence of atmospheric oxidants need further study including determining which oxidants are important New measurements and modelling studies are needed to examine key chemical and physical processes that affect global transport and cycling
Few data are available for reporting mercury releases to aquatic systems Systematic and consistent monitoring of mercury releases to the air is required especially for contaminated systems Releases of mercury from soils into waters depend greatly on climate and topography and these parameters need to be better accounted for Consistent approaches for measuring and reporting releases from point sources are needed to ensure comparability of data from around the world In particular the actual role of artisanal and small-scale gold mining (ASGM) in emissions to air and releases to water needs to be more accurately estimated
The link between mercury deposition methylation and uptake by living organisms needs further study The parameters that determine the rates of exchange of mercury compounds between air and sea air and soil and air and vegetation are not fully understood Whole-ecosystem studies of mercury are needed to better understand biogeochemical cycling Methylationdemethylation rates and their spatial and temporal variations and relationship to climatic factors need to be determined in most of worldrsquos major ocean basins as well as in representative freshwaters
30
UNEP Global Mercury Assessment 2013
Key findings of the 2013 assessment 10 Atmosphere Total anthropogenic emissions of mercury to the atmosphere in 2010 are estimated at 1960 (1010shy4070) tonnes which is about 30 of the total mercury that was emitted and re-emitted from anthropogenic and natural sources in that year The largest anthropogenic sources are associated with artisanal and small-scale gold mining (ASGM) and coal burning which together account for about 62 of the annual total anthropogenic emissions to air Other major sectors include ferrous and non-ferrous metal production and cement production
East and Southeast Asia are responsible for about 40 of global anthropogenic emissions About 75 of the mercury from this region comes from China which is about one-third of the global total Increased estimates for emissions from ASGM largely a result of newly obtained data and improved information mean that South America and Sub-Saharan Africa are also responsible for a greater proportion of global emissions than was previously assumed
Anthropogenic emissions over time have increased mercury loads present in the environment This leads to higher rates of re-emission and also means that there will be a time lag of years or decades between emissions reductions and lower mercury levels in the food web including pathways of human exposure
Mercury emissions to the atmosphere likely peaked in the 1950s to 1970s and subsequently declined because of reductions in Europe Russia and North America Emission trends are unclear due to changes in methods employed to produce inventories and differences in the sectors that have been accounted at different times There are however some indications that emissions may be rising again with increases from East Asia offsetting continuing reductions in Europe and North America
Aquatic environments Natural processes in aquatic systems convert less toxic elemental and inorganic mercury into much more toxic methylmercury Methylmercury concentrates and accumulates in the food web leading to high concentrations in some species of seafood and fish that many people eat
Anthropogenic releases of mercury to aquatic environments contribute hundreds of tonnes to the amount of mercury cycling in the environment Diffuse releases and point sources appear equally important Atmospheric deposition however remains the most important input of mercury to land and oceans and has increased the amount of mercury in many environmental compartments by a factor of two or three since the start of the industrial age On land mercury that is deposited is largely retained in soils and vegetation increasing the available pool for re-mobilisation to adjacent aquatic systems Re-emission from soils however is a major addition to atmospheric mercury
Hydrology is the most important factor in the transport of mercury from catchments to downstream environments Relatively little of this mercury reaches the open ocean as most is captured in sediments behind dams in estuaries and near the coast Changes in land cover and land use can have a large effect on mercury mobilisation as exposed soils erode and mercury leaches into the water table
Concentrations of mercury in Arctic marine animals today are about 10-12 times higher than in preshyindustrial times (ie prior to about 1800) This means that on average about 92 of the mercury in marine predators such as seabirds seals and whales is anthropogenic in origin The timing of the increase suggest that 19th and early 20th century emissions from Europe North America and Russia were responsible Increases mercury concentrations in seabirds in the South China Sea appear to be more recent than the Arctic increases coinciding with increasing industrialisation in East and Southeast Asia
31
UNEP Global Mercury Assessment 2013
K+S Entsorgung Gm
bH
Recovered mercury is being stockpiled at long-term storage sites above- and as shown here below ground
The upper 100 meters of the oceans have twice the mercury that they did a century ago Intermediate and deeper waters have 10-25 more mercury on average reflecting the slow transport of mercury downwards in the oceans Seawater concentrations will thus be especially slow in responding to changes in mercury inputs from atmospheric deposition and river flow As a result mercury concentrations in marine biota are likely to increase slowly for decades to centuries even without an increase in atmospheric emissions
In freshwater ecosystems atmospheric deposition and re-mobilisation from soils slow the reduction of mercury levels even in regions where atmospheric concentrations have decreased due to emission controls
Further increases in atmospheric emissions will have long-term consequences for commercial fisheries and all consumers of marine and freshwater foods
It is likely to be years or decades before reductions in anthropogenic emissions and releases of mercury have a demonstrable effect on mercury levels throughout the environment and in the fish and marine mammals which are part of the human food-chain This only reinforces the need to act now to continue and strengthen international efforts to reduce current mercury emissions and releases Delays in action now will inevitably lead to slower recovery of the worldrsquos ecosystems in future from mercury contamination leaving an even greater legacy of pollution for future generations
32
Division of Technology Industry and Economics (DTIE) Chemicals Branch Geneva Switzerland January 2013
Job number DTI1636GE
UNEP Global Mercury Assessment 2013
Modelling atmospheric transport and deposition Global models reproduce the movement of mercury in the atmosphere during which the mercury may move between continents They have been effective in examining sources of mercury to the Arctic and also for examining the outflow of pollution from South and Southeast Asia and its impact on western North America as well as the flow from eastern North America to Europe
Regional models on the scale of a continent or a basin such as the Mediterranean can provide more detail about specific source areas even to the level of individual industrial areas Reliable results however require a detailed understanding of mercury oxidation in the atmosphere about which there is considerably uncertainty
Most atmospheric transport models consider the full chain of mercury processes in the atmosphere Some models also consider how mercury is cycled in other atmospheric compartments such as soil vegetation snow freshwater and seawater
One of the largest sources of uncertainty in mercury models is the chemical mechanism used to determine how mercury changes forms in the air Improved experimental data can help improve model performance by making sure that the correct reactions are simulated The processes that lead from deposition to re-emission also need to be understood better Advances in this area show promise with model results becoming closer to estimates based on experimental data
other regions of the world Natural emissions and re-emissions account for 35-70 of total deposition in most regions Deposition is generally greater in low and mid-latitudes due to stronger sunlight higher concentrations of oxidants and higher precipitation
Regional mercury models show patterns at the scales of continents or individual seas The Mediterranean Sea for example is a net source of mercury as it emits more than is deposited to it In that region dry deposition generally exceeds deposition of mercury in precipitation In Central and Southern Europe total gaseous mercury concentrations and deposition in precipitation were both consistently higher than the European average
Across the United States dry deposition accounts for two-thirds of total annual deposition mainly from gaseous oxidized mercury A study examining sources and deposition of mercury to assess the
benefits of proposed emission control measures found that mercury transport from outside the country accounts for 68 of mercury deposition in the Northeast and up to 91 in the west-central United States Large point sources contribute up to three-quarters of nearby deposition and power plants contributed half of the deposition in the eastern part of the country This suggests that new emissions standards would primarily benefit eastern regions of the US
In Asia studies show high seasonal variation in mercury concentration and deposition Anthropogenic emissions are responsible for about 75 of deposition in East Asia In this region there is a net removal of gaseous oxidized mercury from the atmosphere and a net export of gaseous elemental mercury
In the Arctic gaseous elemental mercury levels in the atmosphere are depleted rapidly in spring when after the long Arctic winters sunlight returns Ozone is depleted at the same time and it is believed that bromine-containing compounds are the cause of the photo-chemical reactions that deplete ozone and mercury During these events gaseous oxidized mercury and particulate-bound mercury levels increase sharply suggesting that the gaseous mercury is oxidized and deposited enhancing mercury deposition in Arctic areas in springtime Recent research however has found that 50-80 of the deposited mercury is re-emitted within a few days Similar springtime mercury depletion events have been seen in Antarctica
23
UNEP Global Mercury Assessment 2013
Anthropogenic releases to the aquatic environment 7 Global assessment Previous UNEP global mercury assessments only considered emissions to the atmosphere The 2013 Report presents the first attempt at compiling a global inventory of mercury releases to aquatic environments Releases directly into the aquatic environment present a completely different chemistry set of pathways and fate to those released to air They are also more directly linked to the risks posed by mercury to global environmental and human health Unlike mercury releases to air which are predominantly in the form of gaseous elemental mercury releases to water are predominantly inorganic mercury and to a lesser extent liquid elemental mercury
At present only some sources of aquatic releases can be quantified with any confidence Thus many sources that may be important are not included in this first assessment of global aquatic releases For example land management practices that expose new geological sources of mercury in rocks and mineral soils or that re-mobilize previously deposited mercury cannot yet be assessed Two broad categories of current anthropogenic sources are considered here point sources of mercury release to water and diffuse releases of mercury as a result of its remobilisation from areas where it was previously deposited or accumulated due to human activity (ie contaminated sites) Artisanal and small-scale gold mining (ASGM) mercury-containing pesticides and fungicides used in agriculture and deforestation are considered separately
Point source releases to water from various sectors in tonnes per year with the range of the estimate and as a percentage of total anthropogenic emissions
Sector Releases (range) tonnes
Non-ferrous metal production 925 (193 - 268)
Consumer product waste 894 (222 - 308)
Chlor-alkali production 28 (10 ndash 55)
Oil refining 06 (03 ndash 1)
Grand Total 185 (426 ndash 582)
The global estimate of mercury release to water from point sources has been derived from the atmospheric emissions assessment and the approach employed in the UNEP Toolkit to partition total mercury releases between air land and water This approach has considerable uncertainty and may omit sectors where releases to water are high but air emissions are unimportant and therefore not addressed in the inventory Global releases from point sources were estimated to be 185 tonnes per year
For diffuse sources evaluating the relative contribution of anthropogenic and natural sources to the aquatic environment requires determining considerations of the various mercury inputs For some sectors data exist that allow a preliminary assessment of the amounts of mercury re-mobilized into aquatic systems
For mercury-contaminated sites the range of average soil concentrations of mercury reported for sites where mercury was mined used or otherwise released by human activity was considered The area of contamination is then used to determine how much mercury is available in soils and when combined with a factor for how much mercury is released from those soils in a year the total release can be estimated Among identified contaminated sites mercury mining is identified as the largest sector followed by mining of precious metals Total releases to aquatic environments from contaminated sites are estimated to be 83-335 tonnes per year
Releases to water from contaminated sites in tonnes per year with the range of the estimate
Sector Releases (range) tonnes
Primary mercury mining sites 67 ndash 266
Precious metal production sites 14 ndash 55
Non-ferrous metal production sites 01 ndash 05
Chlor-alkali production sites 01 ndash 05
Other industrial sites 01 ndash 03
Grand Total 83 ndash 335
24
UNEP Global Mercury Assessment 2013
Much of the mercury released from artisanal and small-scale gold mining goes into rivers lakes soils and sediments and tailings From soils and tailings it may be re-mobilized by leaching and erosion In addition mining may disturb mercury-containing soils and sediments that may then erode more quickly releasing more mercury than would otherwise have become available from natural erosion A key factor in these processes is the local hydrological cycle of precipitation evaporation run-off and river flow To account for this in the assessment countries were designated as dry wet or intermediate to determine the relative importance of erosion The tropical and subtropical countries which have the greatest activity in this sector also tend to experience high precipitation and run-off exacerbating this source of mercury release and re-mobilization Total worldwide releases of mercury to land and water from ASGM were estimated at over 800 tonnes per year How much of this is released to water cannot yet be determined
Mercury continues to be used in pesticides and fungicides 2100 tonnes of mercury were released in the decade of the 1960s through such agrochemical uses Current data are unavailable although the use of mercury in these products has been greatly reduced
Deforestation especially in the Amazon Basin can lead to extensive soil erosion and thus the release of mercury previously accumulated in soils Using 2010 figures for deforestation rates around the world and an estimate of soil concentrations of mercury as much as 260 tonnes of mercury may have been released into rivers in 2010 as a result of deforestation worldwide
Because this is the first attempt to quantify global mercury releases to the aquatic environment there is no previous measurement against which these results can be compared Thus it is not possible at this time to evaluate trends in releases
Uncertainties in release estimates Estimating global releases of mercury to aquatic environments is being done here for the first time Many data are missing and others are imprecise A number of assumptions have been made based on what measurements are available or on other grounds to extrapolate from known quantities or to calculate aquatic releases in relation to atmospheric
or other emissions Thus the results should be treated with great caution It is nonetheless clear that anthropogenic sources and human activity contribute hundreds of tonnes of mercury to aquatic environments each year a substantial amount relative to estimated natural releases 150-960 tonnes per year from terrestrial environments
Lapshin Shutterstockcom
Phil Augustavo istockphotocom
Bureau of Land Managem
ent
Contaminated sites (top) erosion following deforestation (middle) and a flooded store of mercury-contaminated waste (lower) illustrate potential sources of mercury releases to water
25
UNEP Global Mercury Assessment 2013
Aquatic pathways transport and fate 8 Mercury in aquatic environments The pathways and fate of mercury in aquatic environments are important because it is in waters sediments and wetland soils that inorganic mercury is converted into methylmercury which is toxic and concentrates in animals The majority of human exposure to mercury and the health risk that comes with mercury exposure is from consumption of marine foods Thus this section focuses on the worldrsquos oceans Some freshwater systems however are important sources of fish for human consumption especially for subsistence and recreational fisheries often among indigenous peoples Artisanal and small-scale gold mining (ASGM) communities may also be affected through fish consumption and drinking water if those are contaminated by local releases
The major processes of mercury cycling are generally similar for all aquatic systems Inorganic mercury in dissolved or particulate form is the dominant mercury type in most marine and fresh waters Dissolved gaseous elemental mercury accounts for less than 30 of total mercury in water Methylmercury is often present at trace levels but may in some settings reach 30 of total mercury In freshwater and coastal environments inorganic mercury is transformed into methylmercury primarily in sediments In the open ocean this conversion takes place largely at intermediate depths between 200 and 1000 meters in the water column Mercury is lost from aquatic systems in two ways When inorganic mercury is reduced to elemental mercury it can be re-emitted to the atmosphere When inorganic mercury binds to particulates in water it can settle out rapidly and be buried in sediments Deep burial in ocean sediments is one of the major pathways by which mercury is removed from the biologically active environment
The global mercury cycle is chemically and physically complex Thus it is necessary to use models to study describe and predict what happens and will happen to mercury in the aquatic environment Until recently only one model existed that incorporated
air land and water into a unified whole The model has been validated against observations of mercury and represents the current scientific consensus The largest potential errors in this model in terms of the aquatic cycle concern details of the exchange of mercury between air and water
Pathways and fate of mercury in the oceans Model simulations suggest that anthropogenic impacts on mercury levels in the ocean are greatest in the surface waters the top 100 meters or so of the water column While model results vary one recent estimate suggests that anthropogenic emissions over the last 100 years have doubled the concentration of mercury in the surface layer of the ocean and increased it by 25 in intermediate waters and by 10 in deep waters The difference is due to the length of time it takes for surface waters to circulate to the depths
Models and measurements agree that direct deposition from the atmosphere is the dominant pathway by which mercury reaches the oceans The exceptions are smaller semi-enclosed basins such as the Mediterranean Sea or the Arctic Ocean where river runoff coastal erosion and ocean currents
Ugo M
ontaldo Shutterstockcom
26
UNEP Global Mercury Assessment 2013
account for about half of mercury inputs The most recent modelling effort suggests that total deposition input of mercury to the oceans in 2008 was 3700 tonnes
Other mercury pathways appear less important on a global basis Rivers are estimated to carry more than 2800 tonnes of mercury each year but only about 380 tonnes of this is transported offshore The rest is trapped by particles in estuaries Groundwater and re-mobilization from sediments provide 100shy800 tonnes of mercury to the oceans each year Undersea hydrothermal vents add less than 600 tonnes of mercury to the oceans There are high concentrations of mercury in vent fluids but a great deal of the mercury is precipitated as solids once the vent fluids enter seawater
Models suggest that globally about 70 of the mercury deposited into the ocean is re-emitted to the atmosphere Oxidized mercury in surface waters is reduced by biological and photochemical processes to the elemental form that is volatile and readily re-emitted The removal of this mercury ultimately reduces the pool of mercury that could be converted to methylmercury and be accumulated by marine organisms The re-emission process thus simultaneously prolongs the lifetime of mercury cycling through the atmosphere and upper ocean and acts to reduce mercury availability for marine food webs
Any changes in the efficiency of mercury reduction in surface waters or the rate of re-emission is likely to impact mercury concentrations in surface waters and the air One example is the effect of sea ice in the Arctic Ocean which blocks the re-emission
Tony Magdaraog Shutterstockcom
Mercury accumulated in marine food-webs can enter the human diet
of elemental mercury leaving elevated levels in waters under ice Changes in primary productivity could change the rate at which mercury is bound to particles thus affecting re-emission to the atmosphere as well as rates of downward transport in the ocean Changes in oxidant levels in the atmosphere such as ozone and bromine may also influence the rate of oxidation of gaseous elemental mercury and thus deposition rates to the ocean
Methylmercury in the ocean Natural bacterial processes in seawater and in sediments in coastal environments convert inorganic mercury to methylmercury Methylmercury levels are highest in the subsurface waters of many oceans because it is formed at these intermediate depths likely as a result of the decomposition of organic material falling from surface waters Current understanding indicates that about 300 tonnes of methylmercury is produced in the upper ocean by this and related processes By contrast only about 80 tonnes of methylmercury reaches the ocean from other sources such as atmospheric deposition rivers and diffusion from sediments
Current modelling indicates that methylmercury stays in the upper ocean for about 11 years Deshymethylation by photochemical reaction or by microbial activity is the major removal process for methylmercury in the ocean About 240 tonnes of methylmercury is removed by this process from the surface waters of the ocean per year
The other important pathway for methylmercury in seawater is uptake into marine food webs Although only about 40 tonnes per year is taken up in this way it is this fraction that poses risks to marine animals and human consumers of seafood Methylmercury is a problem for several reasons First it is taken up by plankton much more efficiently than is inorganic mercury resulting in concentrations in plankton that are as high as 10000 times the concentration in seawater Second methylmercury is absorbed through the intestine of animals much more easily than is inorganic mercury Third methylmercury biomagnifies as it moves up the food web Thus methylmercury becomes an increasingly greater proportion of the mercury in organisms higher in the food web This explains why some indigenous populations that consume top marine predators such as fish seals and whales have some of the worldrsquos highest concentrations of methylmercury giving rise to health concerns
27
UNEP Global Mercury Assessment 2013
Pathways and fate of mercury in freshwater Observations and modelling both show that there are in general many similarities between mercury chemistry pathways and fate in lakes and in the oceans but with obvious differences in scale and in the relative importance of different processes Modelling of mercury dynamics was done for four lakes with a history of direct mercury inputs from the largest freshwater lake in the world (Lake Superior) to small lakes in Ontario Canada Atmospheric deposition and river inflow were the main sources of inorganic mercury Much of the mercury input from lake and river catchments was associated with dissolved and particulate organic matter The dominant mercury removal mechanisms as in saltwater were burial in sediments and photochemical reduction of oxidized mercury to elemental mercury followed by re-emission to the air In Lake Superior and Lake Michigan there is evidence for methylation of mercury in the water column as is seen in the open ocean
Methylmercury levels in freshwater fish vary with the level of deposition of mercury from the air though other factors such as inputs from the watershed and the number of trophic levels within the lakersquos food web are also important Methylation predominantly occurred in lake sediments and wetlands and floodplain soils where sulphateshyreducing bacteria are believed to be primarily responsible Methylmercury is de-methylated in sediments and also taken away in the outlet river from each lake
Some 400-1400 tonnes of mercury are estimated globally to be trapped behind dams and other man-made impoundments each year This has in many cases led to significant increases in total mercury and methylmercury levels in water and of methylmercury in fish and other aquatic species When artificial lakes are created plant material is submerged leading to decay and anoxia In these conditions microbially driven methylation of inorganic mercury takes place In some cases the elevated mercury levels have also been observed downstream from the artificial lakes and reservoirs
Anthropogenic impacts on aquatic mercury levels Two studies have reported that the Atlantic and Pacific Oceans have shown opposing trends over recent decades While the influence of changing ocean currents and other oceanographic factors may be a factor the trends do make sense in light of patterns of anthropogenic emissions In the North Pacific Ocean mercury concentrations appear to have increased at depths between 200 and 1000 meters over the last few decades This increase coincides with the rapid industrialization of East Asia
In the North Atlantic however results from near Bermuda suggest a substantial decrease in mercury concentration and a change in the mercury profile through the water column The Mediterranean Sea too showed a decrease in mercury concentration between 1990 and 2004 These findings are consistent with atmospheric data from around the North Atlantic The conclusion is that mercury levels in seawater in the North Atlantic were elevated by human activity but may now be declining likely as a result of decreased emissions from North America and Europe
A complementary approach to measuring mercury in seawater is to measure mercury in aquatic animals which accumulate and integrate mercury over time Teeth hair feathers and eggshells are useful long-term archives of mercury concentrations and can provide data from the pre-industrial period (ie before 1800) as well as more recent periods
Among marine animals samples are available from several regions particularly from the Arctic where cold dry conditions help preserve animal tissues Mercury concentrations between the 13th and 16th
centuries were relatively stable From the mid- to late 19th century to the end of the 20th century mercury levels increased by an average of 12 times On average therefore about 92 of the mercury in Arctic marine wildlife today is likely to be of anthropogenic origin
Similar findings were found for a 700-year sequence of seabird eggshells from the South China Sea Mercury levels increased steadily between 1800 and 2000 with a particularly rapid increase after 1970 Concentrations since 2000 are about 10 times higher than pre-industrial levels with 91 of the mercury now likely to be of anthropogenic origin In the Antarctic studies of seal hairs show that pre-industrial mercury levels were only 60 of recent levels The relatively small difference
28
UNEP Global Mercury Assessment 2013
Historical Hg concentration as a proportion of present-day 100
80
60
40
20
0
Beluga teeth Human teeth
Gyrfalcon feathers Perigrine falcon feathers
Polar bear hair Ringed seal teeth
1200 1300 1400 1500 1600 1700 1800 1900 2000
between pre-industrial and modern mercury levels in Antarctic is consistent with lower mercury emissions and atmospheric concentrations in the Southern Hemisphere as compared with the Northern Hemisphere
The timing of long-term increases of mercury in aquatic animals can shed light on the likely sources of mercury emissions that were responsible The industrialization of Europe and North America appear responsible for the large increases in marine mercury levels that began in the 19th century as these increases occurred prior to recent Asian industrialization As with water concentrations in the Pacific Ocean recent rapid increases in mercury in seabird eggs in the South China Sea coincide with industrialization in Asia
The time lag in aquatic ecosystem response One important conclusion from air-ocean modeling is that the oceans have not yet reached equilibrium with current atmospheric levels of mercury This lag is due to several factors First mercury stays in the upper ocean above 200 meters depth for about 30 years and for centuries in intermediate and deep waters This is much longer than the one year residence time in the lower atmosphere Thus removal from the ocean takes much longer than does removal from the air and so concentrations will change more slowly
Second because of the long lifetime of mercury in deeper ocean waters a great deal of natural mercury is present in the ocean already about 100000 tonnes out of a total of 135000 tonnes in intermediate waters and 200000 out of 220000 tonnes in deep waters
Rune Dietz
Analysis of museum samples reflects the increase in mercury emissions and releases since the mid-19th century associated with anthropogenic activities
Third vertical transport of mercury from intermediate depths back to the surface returns a substantial amount of mercury to the biologically active zone each year As a result average mercury concentrations in seawater and marine animals are likely to increase slowly for decades if not centuries even if atmospheric levels stabilize at present levels In short the effects of historical anthropogenic emissions from Europe and North America are still being observed in the oceans at the same time that the effects of the recent rise in emissions from Asia are being seen
Regionally different trends can be expected depending on distance from sources and ocean circulation patterns In the North Atlantic north of 55deg N it will take 50-600 years to achieve equilibrium between atmospheric and seawater mercury levels In the North Pacific this process is estimated to take 500-700 years and in the Antarctic 700-1000 years The Arctic Ocean by contrast is smaller and will only take about 35 years to reflect changes in atmospheric mercury levels Surface waters of the Mediterranean Sea should show also changes within 10-50 years
Time lags in the responses of many freshwaters and their food-webs to changes in atmospheric mercury levels are also expected Although some immediate recovery following reductions in atmospheric mercury deposition rates is likely full recovery may take decades centuries or longer depending on the characteristics of the area Highly polluted freshwaters with catchments and sediments containing large amounts of anthropogenic mercury will recover most slowly as is already observed around point sources such as smelters that have closed down
29
UNEP Global Mercury Assessment 2013
Major gaps in knowledge 9 Large uncertainties remain in global estimates of mercury emissions to the air These stem from various sources including the availability of information on activity levels but mainly from the lack of information concerning the mercury content of some raw materials and the validity of assumptions regarding processes and technologies employed to reduce mercury emissions including their rates of application and effectiveness The accuracy and precision of measurement-based estimates can depend on the validity of extrapolating measurements made at infrequent intervals to longer periods or measurements made at one plant to other facilities with similar operations
Potentially important emissions sectors that are still not quantified in the emissions inventory include the use of mercury in vinyl-chloride monomer production secondary metals production oil and gas extraction transport and processing industrial and hazardous waste incineration and disposal sewage sludge incineration and dental fillings preparation and removal
Current measurements and their evaluation are inadequate for determining spatial and temporal trends Improved more extensive and better coordinated measurements are needed A permanent global integrated monitoring network for atmospheric mercury and mercury deposition is needed to achieve this goal The atmospheric network sites should be closely integrated with water soil and biological monitoring networks The results can be used for model testing and evaluation as well as for more accurately detailing the geographic impact of anthropogenic emissions Monitoring of mercury concentrations in the important marine food species is essential to understanding possible human health impacts and the effects of future emissions changes
Better data on mercury distribution in the troposphere is needed to improve understanding of long-range transport and source-receptor relationships Coordinated studies at high altitudes and by aircraft are needed This information will
also help validate regional and global scale models improving their prediction capabilities with regard to different policy scenarios
Key processes related to global transport and cycling of mercury remain inadequately understood The chemical form of gaseous oxidized mercury is unknown Reduction and oxidation rates for mercury in the presence of atmospheric oxidants need further study including determining which oxidants are important New measurements and modelling studies are needed to examine key chemical and physical processes that affect global transport and cycling
Few data are available for reporting mercury releases to aquatic systems Systematic and consistent monitoring of mercury releases to the air is required especially for contaminated systems Releases of mercury from soils into waters depend greatly on climate and topography and these parameters need to be better accounted for Consistent approaches for measuring and reporting releases from point sources are needed to ensure comparability of data from around the world In particular the actual role of artisanal and small-scale gold mining (ASGM) in emissions to air and releases to water needs to be more accurately estimated
The link between mercury deposition methylation and uptake by living organisms needs further study The parameters that determine the rates of exchange of mercury compounds between air and sea air and soil and air and vegetation are not fully understood Whole-ecosystem studies of mercury are needed to better understand biogeochemical cycling Methylationdemethylation rates and their spatial and temporal variations and relationship to climatic factors need to be determined in most of worldrsquos major ocean basins as well as in representative freshwaters
30
UNEP Global Mercury Assessment 2013
Key findings of the 2013 assessment 10 Atmosphere Total anthropogenic emissions of mercury to the atmosphere in 2010 are estimated at 1960 (1010shy4070) tonnes which is about 30 of the total mercury that was emitted and re-emitted from anthropogenic and natural sources in that year The largest anthropogenic sources are associated with artisanal and small-scale gold mining (ASGM) and coal burning which together account for about 62 of the annual total anthropogenic emissions to air Other major sectors include ferrous and non-ferrous metal production and cement production
East and Southeast Asia are responsible for about 40 of global anthropogenic emissions About 75 of the mercury from this region comes from China which is about one-third of the global total Increased estimates for emissions from ASGM largely a result of newly obtained data and improved information mean that South America and Sub-Saharan Africa are also responsible for a greater proportion of global emissions than was previously assumed
Anthropogenic emissions over time have increased mercury loads present in the environment This leads to higher rates of re-emission and also means that there will be a time lag of years or decades between emissions reductions and lower mercury levels in the food web including pathways of human exposure
Mercury emissions to the atmosphere likely peaked in the 1950s to 1970s and subsequently declined because of reductions in Europe Russia and North America Emission trends are unclear due to changes in methods employed to produce inventories and differences in the sectors that have been accounted at different times There are however some indications that emissions may be rising again with increases from East Asia offsetting continuing reductions in Europe and North America
Aquatic environments Natural processes in aquatic systems convert less toxic elemental and inorganic mercury into much more toxic methylmercury Methylmercury concentrates and accumulates in the food web leading to high concentrations in some species of seafood and fish that many people eat
Anthropogenic releases of mercury to aquatic environments contribute hundreds of tonnes to the amount of mercury cycling in the environment Diffuse releases and point sources appear equally important Atmospheric deposition however remains the most important input of mercury to land and oceans and has increased the amount of mercury in many environmental compartments by a factor of two or three since the start of the industrial age On land mercury that is deposited is largely retained in soils and vegetation increasing the available pool for re-mobilisation to adjacent aquatic systems Re-emission from soils however is a major addition to atmospheric mercury
Hydrology is the most important factor in the transport of mercury from catchments to downstream environments Relatively little of this mercury reaches the open ocean as most is captured in sediments behind dams in estuaries and near the coast Changes in land cover and land use can have a large effect on mercury mobilisation as exposed soils erode and mercury leaches into the water table
Concentrations of mercury in Arctic marine animals today are about 10-12 times higher than in preshyindustrial times (ie prior to about 1800) This means that on average about 92 of the mercury in marine predators such as seabirds seals and whales is anthropogenic in origin The timing of the increase suggest that 19th and early 20th century emissions from Europe North America and Russia were responsible Increases mercury concentrations in seabirds in the South China Sea appear to be more recent than the Arctic increases coinciding with increasing industrialisation in East and Southeast Asia
31
UNEP Global Mercury Assessment 2013
K+S Entsorgung Gm
bH
Recovered mercury is being stockpiled at long-term storage sites above- and as shown here below ground
The upper 100 meters of the oceans have twice the mercury that they did a century ago Intermediate and deeper waters have 10-25 more mercury on average reflecting the slow transport of mercury downwards in the oceans Seawater concentrations will thus be especially slow in responding to changes in mercury inputs from atmospheric deposition and river flow As a result mercury concentrations in marine biota are likely to increase slowly for decades to centuries even without an increase in atmospheric emissions
In freshwater ecosystems atmospheric deposition and re-mobilisation from soils slow the reduction of mercury levels even in regions where atmospheric concentrations have decreased due to emission controls
Further increases in atmospheric emissions will have long-term consequences for commercial fisheries and all consumers of marine and freshwater foods
It is likely to be years or decades before reductions in anthropogenic emissions and releases of mercury have a demonstrable effect on mercury levels throughout the environment and in the fish and marine mammals which are part of the human food-chain This only reinforces the need to act now to continue and strengthen international efforts to reduce current mercury emissions and releases Delays in action now will inevitably lead to slower recovery of the worldrsquos ecosystems in future from mercury contamination leaving an even greater legacy of pollution for future generations
32
Division of Technology Industry and Economics (DTIE) Chemicals Branch Geneva Switzerland January 2013
Job number DTI1636GE
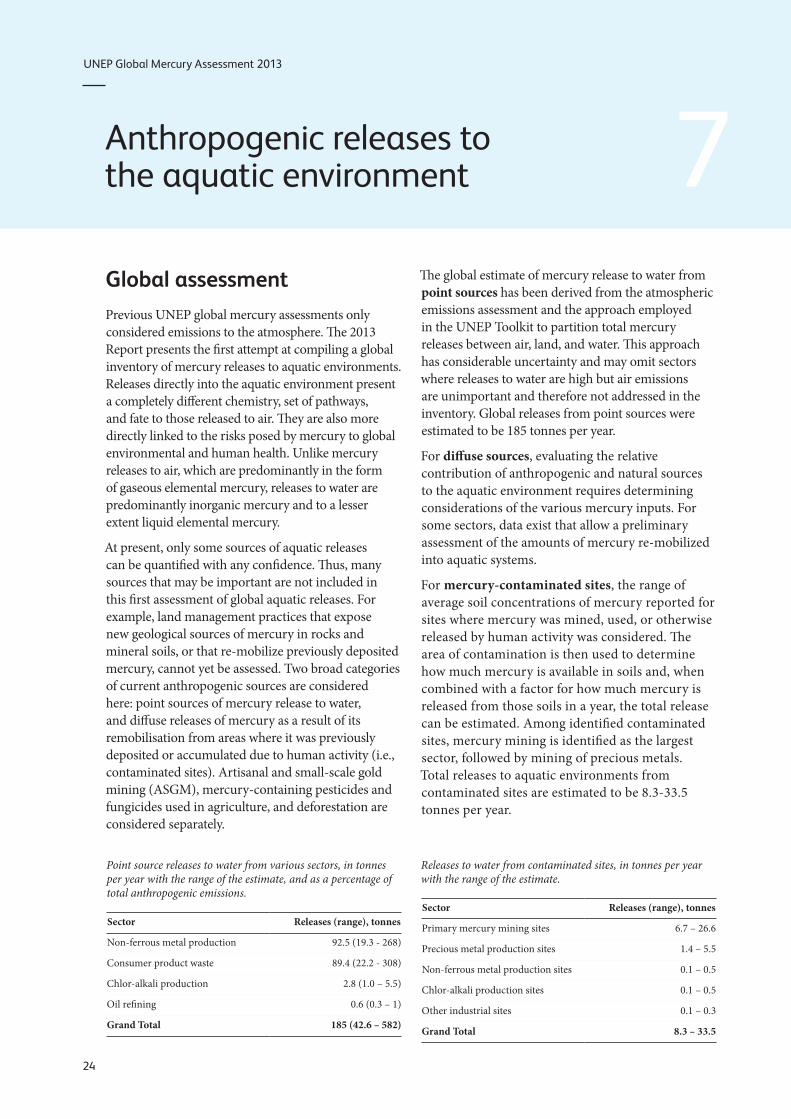
UNEP Global Mercury Assessment 2013
Anthropogenic releases to the aquatic environment 7 Global assessment Previous UNEP global mercury assessments only considered emissions to the atmosphere The 2013 Report presents the first attempt at compiling a global inventory of mercury releases to aquatic environments Releases directly into the aquatic environment present a completely different chemistry set of pathways and fate to those released to air They are also more directly linked to the risks posed by mercury to global environmental and human health Unlike mercury releases to air which are predominantly in the form of gaseous elemental mercury releases to water are predominantly inorganic mercury and to a lesser extent liquid elemental mercury
At present only some sources of aquatic releases can be quantified with any confidence Thus many sources that may be important are not included in this first assessment of global aquatic releases For example land management practices that expose new geological sources of mercury in rocks and mineral soils or that re-mobilize previously deposited mercury cannot yet be assessed Two broad categories of current anthropogenic sources are considered here point sources of mercury release to water and diffuse releases of mercury as a result of its remobilisation from areas where it was previously deposited or accumulated due to human activity (ie contaminated sites) Artisanal and small-scale gold mining (ASGM) mercury-containing pesticides and fungicides used in agriculture and deforestation are considered separately
Point source releases to water from various sectors in tonnes per year with the range of the estimate and as a percentage of total anthropogenic emissions
Sector Releases (range) tonnes
Non-ferrous metal production 925 (193 - 268)
Consumer product waste 894 (222 - 308)
Chlor-alkali production 28 (10 ndash 55)
Oil refining 06 (03 ndash 1)
Grand Total 185 (426 ndash 582)
The global estimate of mercury release to water from point sources has been derived from the atmospheric emissions assessment and the approach employed in the UNEP Toolkit to partition total mercury releases between air land and water This approach has considerable uncertainty and may omit sectors where releases to water are high but air emissions are unimportant and therefore not addressed in the inventory Global releases from point sources were estimated to be 185 tonnes per year
For diffuse sources evaluating the relative contribution of anthropogenic and natural sources to the aquatic environment requires determining considerations of the various mercury inputs For some sectors data exist that allow a preliminary assessment of the amounts of mercury re-mobilized into aquatic systems
For mercury-contaminated sites the range of average soil concentrations of mercury reported for sites where mercury was mined used or otherwise released by human activity was considered The area of contamination is then used to determine how much mercury is available in soils and when combined with a factor for how much mercury is released from those soils in a year the total release can be estimated Among identified contaminated sites mercury mining is identified as the largest sector followed by mining of precious metals Total releases to aquatic environments from contaminated sites are estimated to be 83-335 tonnes per year
Releases to water from contaminated sites in tonnes per year with the range of the estimate
Sector Releases (range) tonnes
Primary mercury mining sites 67 ndash 266
Precious metal production sites 14 ndash 55
Non-ferrous metal production sites 01 ndash 05
Chlor-alkali production sites 01 ndash 05
Other industrial sites 01 ndash 03
Grand Total 83 ndash 335
24
UNEP Global Mercury Assessment 2013
Much of the mercury released from artisanal and small-scale gold mining goes into rivers lakes soils and sediments and tailings From soils and tailings it may be re-mobilized by leaching and erosion In addition mining may disturb mercury-containing soils and sediments that may then erode more quickly releasing more mercury than would otherwise have become available from natural erosion A key factor in these processes is the local hydrological cycle of precipitation evaporation run-off and river flow To account for this in the assessment countries were designated as dry wet or intermediate to determine the relative importance of erosion The tropical and subtropical countries which have the greatest activity in this sector also tend to experience high precipitation and run-off exacerbating this source of mercury release and re-mobilization Total worldwide releases of mercury to land and water from ASGM were estimated at over 800 tonnes per year How much of this is released to water cannot yet be determined
Mercury continues to be used in pesticides and fungicides 2100 tonnes of mercury were released in the decade of the 1960s through such agrochemical uses Current data are unavailable although the use of mercury in these products has been greatly reduced
Deforestation especially in the Amazon Basin can lead to extensive soil erosion and thus the release of mercury previously accumulated in soils Using 2010 figures for deforestation rates around the world and an estimate of soil concentrations of mercury as much as 260 tonnes of mercury may have been released into rivers in 2010 as a result of deforestation worldwide
Because this is the first attempt to quantify global mercury releases to the aquatic environment there is no previous measurement against which these results can be compared Thus it is not possible at this time to evaluate trends in releases
Uncertainties in release estimates Estimating global releases of mercury to aquatic environments is being done here for the first time Many data are missing and others are imprecise A number of assumptions have been made based on what measurements are available or on other grounds to extrapolate from known quantities or to calculate aquatic releases in relation to atmospheric
or other emissions Thus the results should be treated with great caution It is nonetheless clear that anthropogenic sources and human activity contribute hundreds of tonnes of mercury to aquatic environments each year a substantial amount relative to estimated natural releases 150-960 tonnes per year from terrestrial environments
Lapshin Shutterstockcom
Phil Augustavo istockphotocom
Bureau of Land Managem
ent
Contaminated sites (top) erosion following deforestation (middle) and a flooded store of mercury-contaminated waste (lower) illustrate potential sources of mercury releases to water
25
UNEP Global Mercury Assessment 2013
Aquatic pathways transport and fate 8 Mercury in aquatic environments The pathways and fate of mercury in aquatic environments are important because it is in waters sediments and wetland soils that inorganic mercury is converted into methylmercury which is toxic and concentrates in animals The majority of human exposure to mercury and the health risk that comes with mercury exposure is from consumption of marine foods Thus this section focuses on the worldrsquos oceans Some freshwater systems however are important sources of fish for human consumption especially for subsistence and recreational fisheries often among indigenous peoples Artisanal and small-scale gold mining (ASGM) communities may also be affected through fish consumption and drinking water if those are contaminated by local releases
The major processes of mercury cycling are generally similar for all aquatic systems Inorganic mercury in dissolved or particulate form is the dominant mercury type in most marine and fresh waters Dissolved gaseous elemental mercury accounts for less than 30 of total mercury in water Methylmercury is often present at trace levels but may in some settings reach 30 of total mercury In freshwater and coastal environments inorganic mercury is transformed into methylmercury primarily in sediments In the open ocean this conversion takes place largely at intermediate depths between 200 and 1000 meters in the water column Mercury is lost from aquatic systems in two ways When inorganic mercury is reduced to elemental mercury it can be re-emitted to the atmosphere When inorganic mercury binds to particulates in water it can settle out rapidly and be buried in sediments Deep burial in ocean sediments is one of the major pathways by which mercury is removed from the biologically active environment
The global mercury cycle is chemically and physically complex Thus it is necessary to use models to study describe and predict what happens and will happen to mercury in the aquatic environment Until recently only one model existed that incorporated
air land and water into a unified whole The model has been validated against observations of mercury and represents the current scientific consensus The largest potential errors in this model in terms of the aquatic cycle concern details of the exchange of mercury between air and water
Pathways and fate of mercury in the oceans Model simulations suggest that anthropogenic impacts on mercury levels in the ocean are greatest in the surface waters the top 100 meters or so of the water column While model results vary one recent estimate suggests that anthropogenic emissions over the last 100 years have doubled the concentration of mercury in the surface layer of the ocean and increased it by 25 in intermediate waters and by 10 in deep waters The difference is due to the length of time it takes for surface waters to circulate to the depths
Models and measurements agree that direct deposition from the atmosphere is the dominant pathway by which mercury reaches the oceans The exceptions are smaller semi-enclosed basins such as the Mediterranean Sea or the Arctic Ocean where river runoff coastal erosion and ocean currents
Ugo M
ontaldo Shutterstockcom
26
UNEP Global Mercury Assessment 2013
account for about half of mercury inputs The most recent modelling effort suggests that total deposition input of mercury to the oceans in 2008 was 3700 tonnes
Other mercury pathways appear less important on a global basis Rivers are estimated to carry more than 2800 tonnes of mercury each year but only about 380 tonnes of this is transported offshore The rest is trapped by particles in estuaries Groundwater and re-mobilization from sediments provide 100shy800 tonnes of mercury to the oceans each year Undersea hydrothermal vents add less than 600 tonnes of mercury to the oceans There are high concentrations of mercury in vent fluids but a great deal of the mercury is precipitated as solids once the vent fluids enter seawater
Models suggest that globally about 70 of the mercury deposited into the ocean is re-emitted to the atmosphere Oxidized mercury in surface waters is reduced by biological and photochemical processes to the elemental form that is volatile and readily re-emitted The removal of this mercury ultimately reduces the pool of mercury that could be converted to methylmercury and be accumulated by marine organisms The re-emission process thus simultaneously prolongs the lifetime of mercury cycling through the atmosphere and upper ocean and acts to reduce mercury availability for marine food webs
Any changes in the efficiency of mercury reduction in surface waters or the rate of re-emission is likely to impact mercury concentrations in surface waters and the air One example is the effect of sea ice in the Arctic Ocean which blocks the re-emission
Tony Magdaraog Shutterstockcom
Mercury accumulated in marine food-webs can enter the human diet
of elemental mercury leaving elevated levels in waters under ice Changes in primary productivity could change the rate at which mercury is bound to particles thus affecting re-emission to the atmosphere as well as rates of downward transport in the ocean Changes in oxidant levels in the atmosphere such as ozone and bromine may also influence the rate of oxidation of gaseous elemental mercury and thus deposition rates to the ocean
Methylmercury in the ocean Natural bacterial processes in seawater and in sediments in coastal environments convert inorganic mercury to methylmercury Methylmercury levels are highest in the subsurface waters of many oceans because it is formed at these intermediate depths likely as a result of the decomposition of organic material falling from surface waters Current understanding indicates that about 300 tonnes of methylmercury is produced in the upper ocean by this and related processes By contrast only about 80 tonnes of methylmercury reaches the ocean from other sources such as atmospheric deposition rivers and diffusion from sediments
Current modelling indicates that methylmercury stays in the upper ocean for about 11 years Deshymethylation by photochemical reaction or by microbial activity is the major removal process for methylmercury in the ocean About 240 tonnes of methylmercury is removed by this process from the surface waters of the ocean per year
The other important pathway for methylmercury in seawater is uptake into marine food webs Although only about 40 tonnes per year is taken up in this way it is this fraction that poses risks to marine animals and human consumers of seafood Methylmercury is a problem for several reasons First it is taken up by plankton much more efficiently than is inorganic mercury resulting in concentrations in plankton that are as high as 10000 times the concentration in seawater Second methylmercury is absorbed through the intestine of animals much more easily than is inorganic mercury Third methylmercury biomagnifies as it moves up the food web Thus methylmercury becomes an increasingly greater proportion of the mercury in organisms higher in the food web This explains why some indigenous populations that consume top marine predators such as fish seals and whales have some of the worldrsquos highest concentrations of methylmercury giving rise to health concerns
27
UNEP Global Mercury Assessment 2013
Pathways and fate of mercury in freshwater Observations and modelling both show that there are in general many similarities between mercury chemistry pathways and fate in lakes and in the oceans but with obvious differences in scale and in the relative importance of different processes Modelling of mercury dynamics was done for four lakes with a history of direct mercury inputs from the largest freshwater lake in the world (Lake Superior) to small lakes in Ontario Canada Atmospheric deposition and river inflow were the main sources of inorganic mercury Much of the mercury input from lake and river catchments was associated with dissolved and particulate organic matter The dominant mercury removal mechanisms as in saltwater were burial in sediments and photochemical reduction of oxidized mercury to elemental mercury followed by re-emission to the air In Lake Superior and Lake Michigan there is evidence for methylation of mercury in the water column as is seen in the open ocean
Methylmercury levels in freshwater fish vary with the level of deposition of mercury from the air though other factors such as inputs from the watershed and the number of trophic levels within the lakersquos food web are also important Methylation predominantly occurred in lake sediments and wetlands and floodplain soils where sulphateshyreducing bacteria are believed to be primarily responsible Methylmercury is de-methylated in sediments and also taken away in the outlet river from each lake
Some 400-1400 tonnes of mercury are estimated globally to be trapped behind dams and other man-made impoundments each year This has in many cases led to significant increases in total mercury and methylmercury levels in water and of methylmercury in fish and other aquatic species When artificial lakes are created plant material is submerged leading to decay and anoxia In these conditions microbially driven methylation of inorganic mercury takes place In some cases the elevated mercury levels have also been observed downstream from the artificial lakes and reservoirs
Anthropogenic impacts on aquatic mercury levels Two studies have reported that the Atlantic and Pacific Oceans have shown opposing trends over recent decades While the influence of changing ocean currents and other oceanographic factors may be a factor the trends do make sense in light of patterns of anthropogenic emissions In the North Pacific Ocean mercury concentrations appear to have increased at depths between 200 and 1000 meters over the last few decades This increase coincides with the rapid industrialization of East Asia
In the North Atlantic however results from near Bermuda suggest a substantial decrease in mercury concentration and a change in the mercury profile through the water column The Mediterranean Sea too showed a decrease in mercury concentration between 1990 and 2004 These findings are consistent with atmospheric data from around the North Atlantic The conclusion is that mercury levels in seawater in the North Atlantic were elevated by human activity but may now be declining likely as a result of decreased emissions from North America and Europe
A complementary approach to measuring mercury in seawater is to measure mercury in aquatic animals which accumulate and integrate mercury over time Teeth hair feathers and eggshells are useful long-term archives of mercury concentrations and can provide data from the pre-industrial period (ie before 1800) as well as more recent periods
Among marine animals samples are available from several regions particularly from the Arctic where cold dry conditions help preserve animal tissues Mercury concentrations between the 13th and 16th
centuries were relatively stable From the mid- to late 19th century to the end of the 20th century mercury levels increased by an average of 12 times On average therefore about 92 of the mercury in Arctic marine wildlife today is likely to be of anthropogenic origin
Similar findings were found for a 700-year sequence of seabird eggshells from the South China Sea Mercury levels increased steadily between 1800 and 2000 with a particularly rapid increase after 1970 Concentrations since 2000 are about 10 times higher than pre-industrial levels with 91 of the mercury now likely to be of anthropogenic origin In the Antarctic studies of seal hairs show that pre-industrial mercury levels were only 60 of recent levels The relatively small difference
28
UNEP Global Mercury Assessment 2013
Historical Hg concentration as a proportion of present-day 100
80
60
40
20
0
Beluga teeth Human teeth
Gyrfalcon feathers Perigrine falcon feathers
Polar bear hair Ringed seal teeth
1200 1300 1400 1500 1600 1700 1800 1900 2000
between pre-industrial and modern mercury levels in Antarctic is consistent with lower mercury emissions and atmospheric concentrations in the Southern Hemisphere as compared with the Northern Hemisphere
The timing of long-term increases of mercury in aquatic animals can shed light on the likely sources of mercury emissions that were responsible The industrialization of Europe and North America appear responsible for the large increases in marine mercury levels that began in the 19th century as these increases occurred prior to recent Asian industrialization As with water concentrations in the Pacific Ocean recent rapid increases in mercury in seabird eggs in the South China Sea coincide with industrialization in Asia
The time lag in aquatic ecosystem response One important conclusion from air-ocean modeling is that the oceans have not yet reached equilibrium with current atmospheric levels of mercury This lag is due to several factors First mercury stays in the upper ocean above 200 meters depth for about 30 years and for centuries in intermediate and deep waters This is much longer than the one year residence time in the lower atmosphere Thus removal from the ocean takes much longer than does removal from the air and so concentrations will change more slowly
Second because of the long lifetime of mercury in deeper ocean waters a great deal of natural mercury is present in the ocean already about 100000 tonnes out of a total of 135000 tonnes in intermediate waters and 200000 out of 220000 tonnes in deep waters
Rune Dietz
Analysis of museum samples reflects the increase in mercury emissions and releases since the mid-19th century associated with anthropogenic activities
Third vertical transport of mercury from intermediate depths back to the surface returns a substantial amount of mercury to the biologically active zone each year As a result average mercury concentrations in seawater and marine animals are likely to increase slowly for decades if not centuries even if atmospheric levels stabilize at present levels In short the effects of historical anthropogenic emissions from Europe and North America are still being observed in the oceans at the same time that the effects of the recent rise in emissions from Asia are being seen
Regionally different trends can be expected depending on distance from sources and ocean circulation patterns In the North Atlantic north of 55deg N it will take 50-600 years to achieve equilibrium between atmospheric and seawater mercury levels In the North Pacific this process is estimated to take 500-700 years and in the Antarctic 700-1000 years The Arctic Ocean by contrast is smaller and will only take about 35 years to reflect changes in atmospheric mercury levels Surface waters of the Mediterranean Sea should show also changes within 10-50 years
Time lags in the responses of many freshwaters and their food-webs to changes in atmospheric mercury levels are also expected Although some immediate recovery following reductions in atmospheric mercury deposition rates is likely full recovery may take decades centuries or longer depending on the characteristics of the area Highly polluted freshwaters with catchments and sediments containing large amounts of anthropogenic mercury will recover most slowly as is already observed around point sources such as smelters that have closed down
29
UNEP Global Mercury Assessment 2013
Major gaps in knowledge 9 Large uncertainties remain in global estimates of mercury emissions to the air These stem from various sources including the availability of information on activity levels but mainly from the lack of information concerning the mercury content of some raw materials and the validity of assumptions regarding processes and technologies employed to reduce mercury emissions including their rates of application and effectiveness The accuracy and precision of measurement-based estimates can depend on the validity of extrapolating measurements made at infrequent intervals to longer periods or measurements made at one plant to other facilities with similar operations
Potentially important emissions sectors that are still not quantified in the emissions inventory include the use of mercury in vinyl-chloride monomer production secondary metals production oil and gas extraction transport and processing industrial and hazardous waste incineration and disposal sewage sludge incineration and dental fillings preparation and removal
Current measurements and their evaluation are inadequate for determining spatial and temporal trends Improved more extensive and better coordinated measurements are needed A permanent global integrated monitoring network for atmospheric mercury and mercury deposition is needed to achieve this goal The atmospheric network sites should be closely integrated with water soil and biological monitoring networks The results can be used for model testing and evaluation as well as for more accurately detailing the geographic impact of anthropogenic emissions Monitoring of mercury concentrations in the important marine food species is essential to understanding possible human health impacts and the effects of future emissions changes
Better data on mercury distribution in the troposphere is needed to improve understanding of long-range transport and source-receptor relationships Coordinated studies at high altitudes and by aircraft are needed This information will
also help validate regional and global scale models improving their prediction capabilities with regard to different policy scenarios
Key processes related to global transport and cycling of mercury remain inadequately understood The chemical form of gaseous oxidized mercury is unknown Reduction and oxidation rates for mercury in the presence of atmospheric oxidants need further study including determining which oxidants are important New measurements and modelling studies are needed to examine key chemical and physical processes that affect global transport and cycling
Few data are available for reporting mercury releases to aquatic systems Systematic and consistent monitoring of mercury releases to the air is required especially for contaminated systems Releases of mercury from soils into waters depend greatly on climate and topography and these parameters need to be better accounted for Consistent approaches for measuring and reporting releases from point sources are needed to ensure comparability of data from around the world In particular the actual role of artisanal and small-scale gold mining (ASGM) in emissions to air and releases to water needs to be more accurately estimated
The link between mercury deposition methylation and uptake by living organisms needs further study The parameters that determine the rates of exchange of mercury compounds between air and sea air and soil and air and vegetation are not fully understood Whole-ecosystem studies of mercury are needed to better understand biogeochemical cycling Methylationdemethylation rates and their spatial and temporal variations and relationship to climatic factors need to be determined in most of worldrsquos major ocean basins as well as in representative freshwaters
30
UNEP Global Mercury Assessment 2013
Key findings of the 2013 assessment 10 Atmosphere Total anthropogenic emissions of mercury to the atmosphere in 2010 are estimated at 1960 (1010shy4070) tonnes which is about 30 of the total mercury that was emitted and re-emitted from anthropogenic and natural sources in that year The largest anthropogenic sources are associated with artisanal and small-scale gold mining (ASGM) and coal burning which together account for about 62 of the annual total anthropogenic emissions to air Other major sectors include ferrous and non-ferrous metal production and cement production
East and Southeast Asia are responsible for about 40 of global anthropogenic emissions About 75 of the mercury from this region comes from China which is about one-third of the global total Increased estimates for emissions from ASGM largely a result of newly obtained data and improved information mean that South America and Sub-Saharan Africa are also responsible for a greater proportion of global emissions than was previously assumed
Anthropogenic emissions over time have increased mercury loads present in the environment This leads to higher rates of re-emission and also means that there will be a time lag of years or decades between emissions reductions and lower mercury levels in the food web including pathways of human exposure
Mercury emissions to the atmosphere likely peaked in the 1950s to 1970s and subsequently declined because of reductions in Europe Russia and North America Emission trends are unclear due to changes in methods employed to produce inventories and differences in the sectors that have been accounted at different times There are however some indications that emissions may be rising again with increases from East Asia offsetting continuing reductions in Europe and North America
Aquatic environments Natural processes in aquatic systems convert less toxic elemental and inorganic mercury into much more toxic methylmercury Methylmercury concentrates and accumulates in the food web leading to high concentrations in some species of seafood and fish that many people eat
Anthropogenic releases of mercury to aquatic environments contribute hundreds of tonnes to the amount of mercury cycling in the environment Diffuse releases and point sources appear equally important Atmospheric deposition however remains the most important input of mercury to land and oceans and has increased the amount of mercury in many environmental compartments by a factor of two or three since the start of the industrial age On land mercury that is deposited is largely retained in soils and vegetation increasing the available pool for re-mobilisation to adjacent aquatic systems Re-emission from soils however is a major addition to atmospheric mercury
Hydrology is the most important factor in the transport of mercury from catchments to downstream environments Relatively little of this mercury reaches the open ocean as most is captured in sediments behind dams in estuaries and near the coast Changes in land cover and land use can have a large effect on mercury mobilisation as exposed soils erode and mercury leaches into the water table
Concentrations of mercury in Arctic marine animals today are about 10-12 times higher than in preshyindustrial times (ie prior to about 1800) This means that on average about 92 of the mercury in marine predators such as seabirds seals and whales is anthropogenic in origin The timing of the increase suggest that 19th and early 20th century emissions from Europe North America and Russia were responsible Increases mercury concentrations in seabirds in the South China Sea appear to be more recent than the Arctic increases coinciding with increasing industrialisation in East and Southeast Asia
31
UNEP Global Mercury Assessment 2013
K+S Entsorgung Gm
bH
Recovered mercury is being stockpiled at long-term storage sites above- and as shown here below ground
The upper 100 meters of the oceans have twice the mercury that they did a century ago Intermediate and deeper waters have 10-25 more mercury on average reflecting the slow transport of mercury downwards in the oceans Seawater concentrations will thus be especially slow in responding to changes in mercury inputs from atmospheric deposition and river flow As a result mercury concentrations in marine biota are likely to increase slowly for decades to centuries even without an increase in atmospheric emissions
In freshwater ecosystems atmospheric deposition and re-mobilisation from soils slow the reduction of mercury levels even in regions where atmospheric concentrations have decreased due to emission controls
Further increases in atmospheric emissions will have long-term consequences for commercial fisheries and all consumers of marine and freshwater foods
It is likely to be years or decades before reductions in anthropogenic emissions and releases of mercury have a demonstrable effect on mercury levels throughout the environment and in the fish and marine mammals which are part of the human food-chain This only reinforces the need to act now to continue and strengthen international efforts to reduce current mercury emissions and releases Delays in action now will inevitably lead to slower recovery of the worldrsquos ecosystems in future from mercury contamination leaving an even greater legacy of pollution for future generations
32
Division of Technology Industry and Economics (DTIE) Chemicals Branch Geneva Switzerland January 2013
Job number DTI1636GE
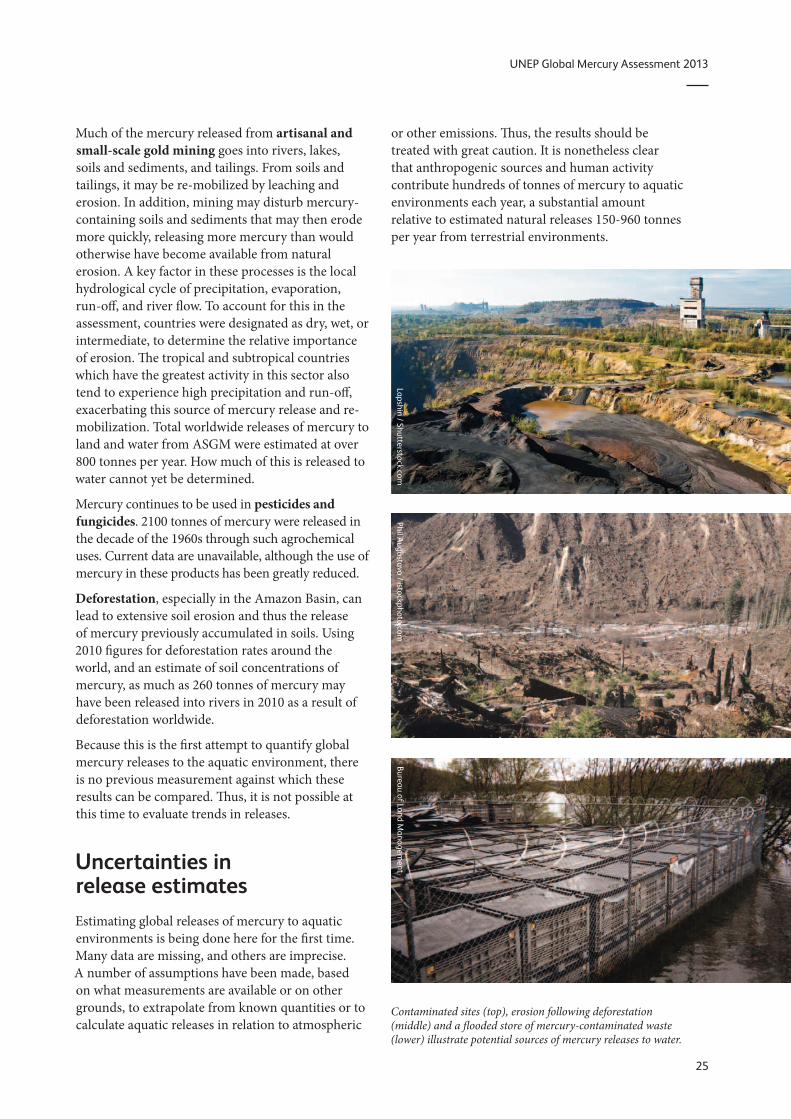
UNEP Global Mercury Assessment 2013
Much of the mercury released from artisanal and small-scale gold mining goes into rivers lakes soils and sediments and tailings From soils and tailings it may be re-mobilized by leaching and erosion In addition mining may disturb mercury-containing soils and sediments that may then erode more quickly releasing more mercury than would otherwise have become available from natural erosion A key factor in these processes is the local hydrological cycle of precipitation evaporation run-off and river flow To account for this in the assessment countries were designated as dry wet or intermediate to determine the relative importance of erosion The tropical and subtropical countries which have the greatest activity in this sector also tend to experience high precipitation and run-off exacerbating this source of mercury release and re-mobilization Total worldwide releases of mercury to land and water from ASGM were estimated at over 800 tonnes per year How much of this is released to water cannot yet be determined
Mercury continues to be used in pesticides and fungicides 2100 tonnes of mercury were released in the decade of the 1960s through such agrochemical uses Current data are unavailable although the use of mercury in these products has been greatly reduced
Deforestation especially in the Amazon Basin can lead to extensive soil erosion and thus the release of mercury previously accumulated in soils Using 2010 figures for deforestation rates around the world and an estimate of soil concentrations of mercury as much as 260 tonnes of mercury may have been released into rivers in 2010 as a result of deforestation worldwide
Because this is the first attempt to quantify global mercury releases to the aquatic environment there is no previous measurement against which these results can be compared Thus it is not possible at this time to evaluate trends in releases
Uncertainties in release estimates Estimating global releases of mercury to aquatic environments is being done here for the first time Many data are missing and others are imprecise A number of assumptions have been made based on what measurements are available or on other grounds to extrapolate from known quantities or to calculate aquatic releases in relation to atmospheric
or other emissions Thus the results should be treated with great caution It is nonetheless clear that anthropogenic sources and human activity contribute hundreds of tonnes of mercury to aquatic environments each year a substantial amount relative to estimated natural releases 150-960 tonnes per year from terrestrial environments
Lapshin Shutterstockcom
Phil Augustavo istockphotocom
Bureau of Land Managem
ent
Contaminated sites (top) erosion following deforestation (middle) and a flooded store of mercury-contaminated waste (lower) illustrate potential sources of mercury releases to water
25
UNEP Global Mercury Assessment 2013
Aquatic pathways transport and fate 8 Mercury in aquatic environments The pathways and fate of mercury in aquatic environments are important because it is in waters sediments and wetland soils that inorganic mercury is converted into methylmercury which is toxic and concentrates in animals The majority of human exposure to mercury and the health risk that comes with mercury exposure is from consumption of marine foods Thus this section focuses on the worldrsquos oceans Some freshwater systems however are important sources of fish for human consumption especially for subsistence and recreational fisheries often among indigenous peoples Artisanal and small-scale gold mining (ASGM) communities may also be affected through fish consumption and drinking water if those are contaminated by local releases
The major processes of mercury cycling are generally similar for all aquatic systems Inorganic mercury in dissolved or particulate form is the dominant mercury type in most marine and fresh waters Dissolved gaseous elemental mercury accounts for less than 30 of total mercury in water Methylmercury is often present at trace levels but may in some settings reach 30 of total mercury In freshwater and coastal environments inorganic mercury is transformed into methylmercury primarily in sediments In the open ocean this conversion takes place largely at intermediate depths between 200 and 1000 meters in the water column Mercury is lost from aquatic systems in two ways When inorganic mercury is reduced to elemental mercury it can be re-emitted to the atmosphere When inorganic mercury binds to particulates in water it can settle out rapidly and be buried in sediments Deep burial in ocean sediments is one of the major pathways by which mercury is removed from the biologically active environment
The global mercury cycle is chemically and physically complex Thus it is necessary to use models to study describe and predict what happens and will happen to mercury in the aquatic environment Until recently only one model existed that incorporated
air land and water into a unified whole The model has been validated against observations of mercury and represents the current scientific consensus The largest potential errors in this model in terms of the aquatic cycle concern details of the exchange of mercury between air and water
Pathways and fate of mercury in the oceans Model simulations suggest that anthropogenic impacts on mercury levels in the ocean are greatest in the surface waters the top 100 meters or so of the water column While model results vary one recent estimate suggests that anthropogenic emissions over the last 100 years have doubled the concentration of mercury in the surface layer of the ocean and increased it by 25 in intermediate waters and by 10 in deep waters The difference is due to the length of time it takes for surface waters to circulate to the depths
Models and measurements agree that direct deposition from the atmosphere is the dominant pathway by which mercury reaches the oceans The exceptions are smaller semi-enclosed basins such as the Mediterranean Sea or the Arctic Ocean where river runoff coastal erosion and ocean currents
Ugo M
ontaldo Shutterstockcom
26
UNEP Global Mercury Assessment 2013
account for about half of mercury inputs The most recent modelling effort suggests that total deposition input of mercury to the oceans in 2008 was 3700 tonnes
Other mercury pathways appear less important on a global basis Rivers are estimated to carry more than 2800 tonnes of mercury each year but only about 380 tonnes of this is transported offshore The rest is trapped by particles in estuaries Groundwater and re-mobilization from sediments provide 100shy800 tonnes of mercury to the oceans each year Undersea hydrothermal vents add less than 600 tonnes of mercury to the oceans There are high concentrations of mercury in vent fluids but a great deal of the mercury is precipitated as solids once the vent fluids enter seawater
Models suggest that globally about 70 of the mercury deposited into the ocean is re-emitted to the atmosphere Oxidized mercury in surface waters is reduced by biological and photochemical processes to the elemental form that is volatile and readily re-emitted The removal of this mercury ultimately reduces the pool of mercury that could be converted to methylmercury and be accumulated by marine organisms The re-emission process thus simultaneously prolongs the lifetime of mercury cycling through the atmosphere and upper ocean and acts to reduce mercury availability for marine food webs
Any changes in the efficiency of mercury reduction in surface waters or the rate of re-emission is likely to impact mercury concentrations in surface waters and the air One example is the effect of sea ice in the Arctic Ocean which blocks the re-emission
Tony Magdaraog Shutterstockcom
Mercury accumulated in marine food-webs can enter the human diet
of elemental mercury leaving elevated levels in waters under ice Changes in primary productivity could change the rate at which mercury is bound to particles thus affecting re-emission to the atmosphere as well as rates of downward transport in the ocean Changes in oxidant levels in the atmosphere such as ozone and bromine may also influence the rate of oxidation of gaseous elemental mercury and thus deposition rates to the ocean
Methylmercury in the ocean Natural bacterial processes in seawater and in sediments in coastal environments convert inorganic mercury to methylmercury Methylmercury levels are highest in the subsurface waters of many oceans because it is formed at these intermediate depths likely as a result of the decomposition of organic material falling from surface waters Current understanding indicates that about 300 tonnes of methylmercury is produced in the upper ocean by this and related processes By contrast only about 80 tonnes of methylmercury reaches the ocean from other sources such as atmospheric deposition rivers and diffusion from sediments
Current modelling indicates that methylmercury stays in the upper ocean for about 11 years Deshymethylation by photochemical reaction or by microbial activity is the major removal process for methylmercury in the ocean About 240 tonnes of methylmercury is removed by this process from the surface waters of the ocean per year
The other important pathway for methylmercury in seawater is uptake into marine food webs Although only about 40 tonnes per year is taken up in this way it is this fraction that poses risks to marine animals and human consumers of seafood Methylmercury is a problem for several reasons First it is taken up by plankton much more efficiently than is inorganic mercury resulting in concentrations in plankton that are as high as 10000 times the concentration in seawater Second methylmercury is absorbed through the intestine of animals much more easily than is inorganic mercury Third methylmercury biomagnifies as it moves up the food web Thus methylmercury becomes an increasingly greater proportion of the mercury in organisms higher in the food web This explains why some indigenous populations that consume top marine predators such as fish seals and whales have some of the worldrsquos highest concentrations of methylmercury giving rise to health concerns
27
UNEP Global Mercury Assessment 2013
Pathways and fate of mercury in freshwater Observations and modelling both show that there are in general many similarities between mercury chemistry pathways and fate in lakes and in the oceans but with obvious differences in scale and in the relative importance of different processes Modelling of mercury dynamics was done for four lakes with a history of direct mercury inputs from the largest freshwater lake in the world (Lake Superior) to small lakes in Ontario Canada Atmospheric deposition and river inflow were the main sources of inorganic mercury Much of the mercury input from lake and river catchments was associated with dissolved and particulate organic matter The dominant mercury removal mechanisms as in saltwater were burial in sediments and photochemical reduction of oxidized mercury to elemental mercury followed by re-emission to the air In Lake Superior and Lake Michigan there is evidence for methylation of mercury in the water column as is seen in the open ocean
Methylmercury levels in freshwater fish vary with the level of deposition of mercury from the air though other factors such as inputs from the watershed and the number of trophic levels within the lakersquos food web are also important Methylation predominantly occurred in lake sediments and wetlands and floodplain soils where sulphateshyreducing bacteria are believed to be primarily responsible Methylmercury is de-methylated in sediments and also taken away in the outlet river from each lake
Some 400-1400 tonnes of mercury are estimated globally to be trapped behind dams and other man-made impoundments each year This has in many cases led to significant increases in total mercury and methylmercury levels in water and of methylmercury in fish and other aquatic species When artificial lakes are created plant material is submerged leading to decay and anoxia In these conditions microbially driven methylation of inorganic mercury takes place In some cases the elevated mercury levels have also been observed downstream from the artificial lakes and reservoirs
Anthropogenic impacts on aquatic mercury levels Two studies have reported that the Atlantic and Pacific Oceans have shown opposing trends over recent decades While the influence of changing ocean currents and other oceanographic factors may be a factor the trends do make sense in light of patterns of anthropogenic emissions In the North Pacific Ocean mercury concentrations appear to have increased at depths between 200 and 1000 meters over the last few decades This increase coincides with the rapid industrialization of East Asia
In the North Atlantic however results from near Bermuda suggest a substantial decrease in mercury concentration and a change in the mercury profile through the water column The Mediterranean Sea too showed a decrease in mercury concentration between 1990 and 2004 These findings are consistent with atmospheric data from around the North Atlantic The conclusion is that mercury levels in seawater in the North Atlantic were elevated by human activity but may now be declining likely as a result of decreased emissions from North America and Europe
A complementary approach to measuring mercury in seawater is to measure mercury in aquatic animals which accumulate and integrate mercury over time Teeth hair feathers and eggshells are useful long-term archives of mercury concentrations and can provide data from the pre-industrial period (ie before 1800) as well as more recent periods
Among marine animals samples are available from several regions particularly from the Arctic where cold dry conditions help preserve animal tissues Mercury concentrations between the 13th and 16th
centuries were relatively stable From the mid- to late 19th century to the end of the 20th century mercury levels increased by an average of 12 times On average therefore about 92 of the mercury in Arctic marine wildlife today is likely to be of anthropogenic origin
Similar findings were found for a 700-year sequence of seabird eggshells from the South China Sea Mercury levels increased steadily between 1800 and 2000 with a particularly rapid increase after 1970 Concentrations since 2000 are about 10 times higher than pre-industrial levels with 91 of the mercury now likely to be of anthropogenic origin In the Antarctic studies of seal hairs show that pre-industrial mercury levels were only 60 of recent levels The relatively small difference
28
UNEP Global Mercury Assessment 2013
Historical Hg concentration as a proportion of present-day 100
80
60
40
20
0
Beluga teeth Human teeth
Gyrfalcon feathers Perigrine falcon feathers
Polar bear hair Ringed seal teeth
1200 1300 1400 1500 1600 1700 1800 1900 2000
between pre-industrial and modern mercury levels in Antarctic is consistent with lower mercury emissions and atmospheric concentrations in the Southern Hemisphere as compared with the Northern Hemisphere
The timing of long-term increases of mercury in aquatic animals can shed light on the likely sources of mercury emissions that were responsible The industrialization of Europe and North America appear responsible for the large increases in marine mercury levels that began in the 19th century as these increases occurred prior to recent Asian industrialization As with water concentrations in the Pacific Ocean recent rapid increases in mercury in seabird eggs in the South China Sea coincide with industrialization in Asia
The time lag in aquatic ecosystem response One important conclusion from air-ocean modeling is that the oceans have not yet reached equilibrium with current atmospheric levels of mercury This lag is due to several factors First mercury stays in the upper ocean above 200 meters depth for about 30 years and for centuries in intermediate and deep waters This is much longer than the one year residence time in the lower atmosphere Thus removal from the ocean takes much longer than does removal from the air and so concentrations will change more slowly
Second because of the long lifetime of mercury in deeper ocean waters a great deal of natural mercury is present in the ocean already about 100000 tonnes out of a total of 135000 tonnes in intermediate waters and 200000 out of 220000 tonnes in deep waters
Rune Dietz
Analysis of museum samples reflects the increase in mercury emissions and releases since the mid-19th century associated with anthropogenic activities
Third vertical transport of mercury from intermediate depths back to the surface returns a substantial amount of mercury to the biologically active zone each year As a result average mercury concentrations in seawater and marine animals are likely to increase slowly for decades if not centuries even if atmospheric levels stabilize at present levels In short the effects of historical anthropogenic emissions from Europe and North America are still being observed in the oceans at the same time that the effects of the recent rise in emissions from Asia are being seen
Regionally different trends can be expected depending on distance from sources and ocean circulation patterns In the North Atlantic north of 55deg N it will take 50-600 years to achieve equilibrium between atmospheric and seawater mercury levels In the North Pacific this process is estimated to take 500-700 years and in the Antarctic 700-1000 years The Arctic Ocean by contrast is smaller and will only take about 35 years to reflect changes in atmospheric mercury levels Surface waters of the Mediterranean Sea should show also changes within 10-50 years
Time lags in the responses of many freshwaters and their food-webs to changes in atmospheric mercury levels are also expected Although some immediate recovery following reductions in atmospheric mercury deposition rates is likely full recovery may take decades centuries or longer depending on the characteristics of the area Highly polluted freshwaters with catchments and sediments containing large amounts of anthropogenic mercury will recover most slowly as is already observed around point sources such as smelters that have closed down
29
UNEP Global Mercury Assessment 2013
Major gaps in knowledge 9 Large uncertainties remain in global estimates of mercury emissions to the air These stem from various sources including the availability of information on activity levels but mainly from the lack of information concerning the mercury content of some raw materials and the validity of assumptions regarding processes and technologies employed to reduce mercury emissions including their rates of application and effectiveness The accuracy and precision of measurement-based estimates can depend on the validity of extrapolating measurements made at infrequent intervals to longer periods or measurements made at one plant to other facilities with similar operations
Potentially important emissions sectors that are still not quantified in the emissions inventory include the use of mercury in vinyl-chloride monomer production secondary metals production oil and gas extraction transport and processing industrial and hazardous waste incineration and disposal sewage sludge incineration and dental fillings preparation and removal
Current measurements and their evaluation are inadequate for determining spatial and temporal trends Improved more extensive and better coordinated measurements are needed A permanent global integrated monitoring network for atmospheric mercury and mercury deposition is needed to achieve this goal The atmospheric network sites should be closely integrated with water soil and biological monitoring networks The results can be used for model testing and evaluation as well as for more accurately detailing the geographic impact of anthropogenic emissions Monitoring of mercury concentrations in the important marine food species is essential to understanding possible human health impacts and the effects of future emissions changes
Better data on mercury distribution in the troposphere is needed to improve understanding of long-range transport and source-receptor relationships Coordinated studies at high altitudes and by aircraft are needed This information will
also help validate regional and global scale models improving their prediction capabilities with regard to different policy scenarios
Key processes related to global transport and cycling of mercury remain inadequately understood The chemical form of gaseous oxidized mercury is unknown Reduction and oxidation rates for mercury in the presence of atmospheric oxidants need further study including determining which oxidants are important New measurements and modelling studies are needed to examine key chemical and physical processes that affect global transport and cycling
Few data are available for reporting mercury releases to aquatic systems Systematic and consistent monitoring of mercury releases to the air is required especially for contaminated systems Releases of mercury from soils into waters depend greatly on climate and topography and these parameters need to be better accounted for Consistent approaches for measuring and reporting releases from point sources are needed to ensure comparability of data from around the world In particular the actual role of artisanal and small-scale gold mining (ASGM) in emissions to air and releases to water needs to be more accurately estimated
The link between mercury deposition methylation and uptake by living organisms needs further study The parameters that determine the rates of exchange of mercury compounds between air and sea air and soil and air and vegetation are not fully understood Whole-ecosystem studies of mercury are needed to better understand biogeochemical cycling Methylationdemethylation rates and their spatial and temporal variations and relationship to climatic factors need to be determined in most of worldrsquos major ocean basins as well as in representative freshwaters
30
UNEP Global Mercury Assessment 2013
Key findings of the 2013 assessment 10 Atmosphere Total anthropogenic emissions of mercury to the atmosphere in 2010 are estimated at 1960 (1010shy4070) tonnes which is about 30 of the total mercury that was emitted and re-emitted from anthropogenic and natural sources in that year The largest anthropogenic sources are associated with artisanal and small-scale gold mining (ASGM) and coal burning which together account for about 62 of the annual total anthropogenic emissions to air Other major sectors include ferrous and non-ferrous metal production and cement production
East and Southeast Asia are responsible for about 40 of global anthropogenic emissions About 75 of the mercury from this region comes from China which is about one-third of the global total Increased estimates for emissions from ASGM largely a result of newly obtained data and improved information mean that South America and Sub-Saharan Africa are also responsible for a greater proportion of global emissions than was previously assumed
Anthropogenic emissions over time have increased mercury loads present in the environment This leads to higher rates of re-emission and also means that there will be a time lag of years or decades between emissions reductions and lower mercury levels in the food web including pathways of human exposure
Mercury emissions to the atmosphere likely peaked in the 1950s to 1970s and subsequently declined because of reductions in Europe Russia and North America Emission trends are unclear due to changes in methods employed to produce inventories and differences in the sectors that have been accounted at different times There are however some indications that emissions may be rising again with increases from East Asia offsetting continuing reductions in Europe and North America
Aquatic environments Natural processes in aquatic systems convert less toxic elemental and inorganic mercury into much more toxic methylmercury Methylmercury concentrates and accumulates in the food web leading to high concentrations in some species of seafood and fish that many people eat
Anthropogenic releases of mercury to aquatic environments contribute hundreds of tonnes to the amount of mercury cycling in the environment Diffuse releases and point sources appear equally important Atmospheric deposition however remains the most important input of mercury to land and oceans and has increased the amount of mercury in many environmental compartments by a factor of two or three since the start of the industrial age On land mercury that is deposited is largely retained in soils and vegetation increasing the available pool for re-mobilisation to adjacent aquatic systems Re-emission from soils however is a major addition to atmospheric mercury
Hydrology is the most important factor in the transport of mercury from catchments to downstream environments Relatively little of this mercury reaches the open ocean as most is captured in sediments behind dams in estuaries and near the coast Changes in land cover and land use can have a large effect on mercury mobilisation as exposed soils erode and mercury leaches into the water table
Concentrations of mercury in Arctic marine animals today are about 10-12 times higher than in preshyindustrial times (ie prior to about 1800) This means that on average about 92 of the mercury in marine predators such as seabirds seals and whales is anthropogenic in origin The timing of the increase suggest that 19th and early 20th century emissions from Europe North America and Russia were responsible Increases mercury concentrations in seabirds in the South China Sea appear to be more recent than the Arctic increases coinciding with increasing industrialisation in East and Southeast Asia
31
UNEP Global Mercury Assessment 2013
K+S Entsorgung Gm
bH
Recovered mercury is being stockpiled at long-term storage sites above- and as shown here below ground
The upper 100 meters of the oceans have twice the mercury that they did a century ago Intermediate and deeper waters have 10-25 more mercury on average reflecting the slow transport of mercury downwards in the oceans Seawater concentrations will thus be especially slow in responding to changes in mercury inputs from atmospheric deposition and river flow As a result mercury concentrations in marine biota are likely to increase slowly for decades to centuries even without an increase in atmospheric emissions
In freshwater ecosystems atmospheric deposition and re-mobilisation from soils slow the reduction of mercury levels even in regions where atmospheric concentrations have decreased due to emission controls
Further increases in atmospheric emissions will have long-term consequences for commercial fisheries and all consumers of marine and freshwater foods
It is likely to be years or decades before reductions in anthropogenic emissions and releases of mercury have a demonstrable effect on mercury levels throughout the environment and in the fish and marine mammals which are part of the human food-chain This only reinforces the need to act now to continue and strengthen international efforts to reduce current mercury emissions and releases Delays in action now will inevitably lead to slower recovery of the worldrsquos ecosystems in future from mercury contamination leaving an even greater legacy of pollution for future generations
32
Division of Technology Industry and Economics (DTIE) Chemicals Branch Geneva Switzerland January 2013
Job number DTI1636GE
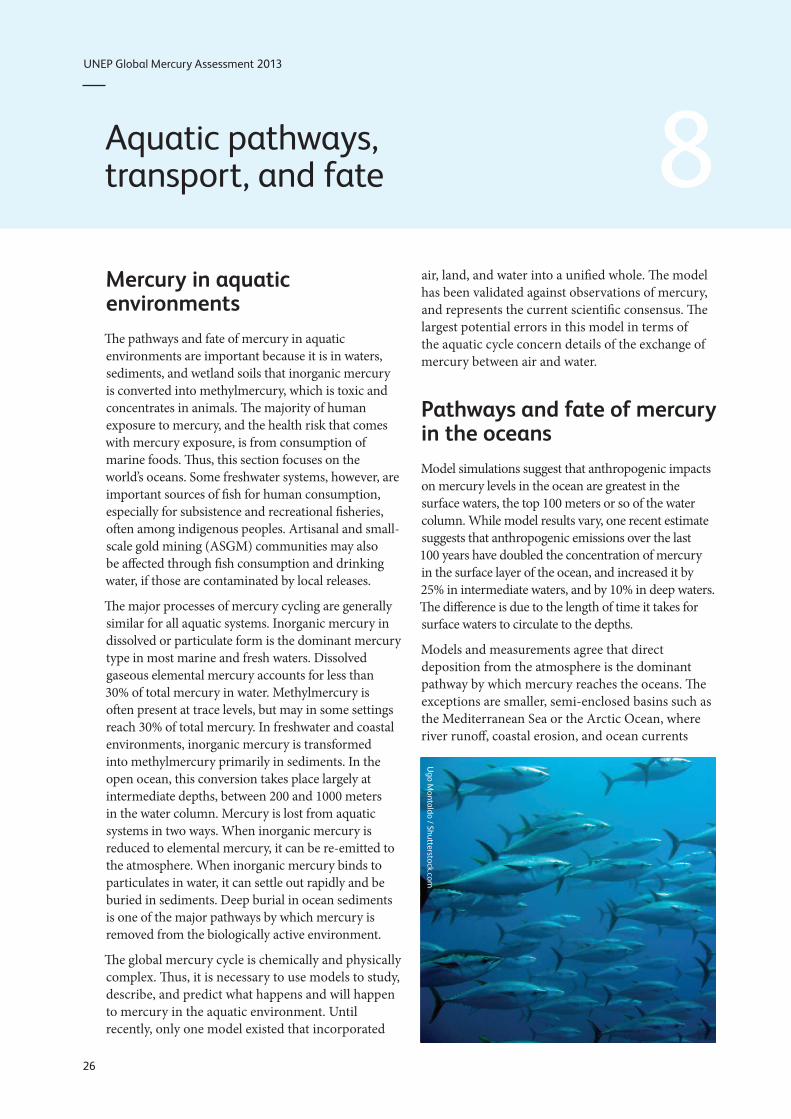
UNEP Global Mercury Assessment 2013
Aquatic pathways transport and fate 8 Mercury in aquatic environments The pathways and fate of mercury in aquatic environments are important because it is in waters sediments and wetland soils that inorganic mercury is converted into methylmercury which is toxic and concentrates in animals The majority of human exposure to mercury and the health risk that comes with mercury exposure is from consumption of marine foods Thus this section focuses on the worldrsquos oceans Some freshwater systems however are important sources of fish for human consumption especially for subsistence and recreational fisheries often among indigenous peoples Artisanal and small-scale gold mining (ASGM) communities may also be affected through fish consumption and drinking water if those are contaminated by local releases
The major processes of mercury cycling are generally similar for all aquatic systems Inorganic mercury in dissolved or particulate form is the dominant mercury type in most marine and fresh waters Dissolved gaseous elemental mercury accounts for less than 30 of total mercury in water Methylmercury is often present at trace levels but may in some settings reach 30 of total mercury In freshwater and coastal environments inorganic mercury is transformed into methylmercury primarily in sediments In the open ocean this conversion takes place largely at intermediate depths between 200 and 1000 meters in the water column Mercury is lost from aquatic systems in two ways When inorganic mercury is reduced to elemental mercury it can be re-emitted to the atmosphere When inorganic mercury binds to particulates in water it can settle out rapidly and be buried in sediments Deep burial in ocean sediments is one of the major pathways by which mercury is removed from the biologically active environment
The global mercury cycle is chemically and physically complex Thus it is necessary to use models to study describe and predict what happens and will happen to mercury in the aquatic environment Until recently only one model existed that incorporated
air land and water into a unified whole The model has been validated against observations of mercury and represents the current scientific consensus The largest potential errors in this model in terms of the aquatic cycle concern details of the exchange of mercury between air and water
Pathways and fate of mercury in the oceans Model simulations suggest that anthropogenic impacts on mercury levels in the ocean are greatest in the surface waters the top 100 meters or so of the water column While model results vary one recent estimate suggests that anthropogenic emissions over the last 100 years have doubled the concentration of mercury in the surface layer of the ocean and increased it by 25 in intermediate waters and by 10 in deep waters The difference is due to the length of time it takes for surface waters to circulate to the depths
Models and measurements agree that direct deposition from the atmosphere is the dominant pathway by which mercury reaches the oceans The exceptions are smaller semi-enclosed basins such as the Mediterranean Sea or the Arctic Ocean where river runoff coastal erosion and ocean currents
Ugo M
ontaldo Shutterstockcom
26
UNEP Global Mercury Assessment 2013
account for about half of mercury inputs The most recent modelling effort suggests that total deposition input of mercury to the oceans in 2008 was 3700 tonnes
Other mercury pathways appear less important on a global basis Rivers are estimated to carry more than 2800 tonnes of mercury each year but only about 380 tonnes of this is transported offshore The rest is trapped by particles in estuaries Groundwater and re-mobilization from sediments provide 100shy800 tonnes of mercury to the oceans each year Undersea hydrothermal vents add less than 600 tonnes of mercury to the oceans There are high concentrations of mercury in vent fluids but a great deal of the mercury is precipitated as solids once the vent fluids enter seawater
Models suggest that globally about 70 of the mercury deposited into the ocean is re-emitted to the atmosphere Oxidized mercury in surface waters is reduced by biological and photochemical processes to the elemental form that is volatile and readily re-emitted The removal of this mercury ultimately reduces the pool of mercury that could be converted to methylmercury and be accumulated by marine organisms The re-emission process thus simultaneously prolongs the lifetime of mercury cycling through the atmosphere and upper ocean and acts to reduce mercury availability for marine food webs
Any changes in the efficiency of mercury reduction in surface waters or the rate of re-emission is likely to impact mercury concentrations in surface waters and the air One example is the effect of sea ice in the Arctic Ocean which blocks the re-emission
Tony Magdaraog Shutterstockcom
Mercury accumulated in marine food-webs can enter the human diet
of elemental mercury leaving elevated levels in waters under ice Changes in primary productivity could change the rate at which mercury is bound to particles thus affecting re-emission to the atmosphere as well as rates of downward transport in the ocean Changes in oxidant levels in the atmosphere such as ozone and bromine may also influence the rate of oxidation of gaseous elemental mercury and thus deposition rates to the ocean
Methylmercury in the ocean Natural bacterial processes in seawater and in sediments in coastal environments convert inorganic mercury to methylmercury Methylmercury levels are highest in the subsurface waters of many oceans because it is formed at these intermediate depths likely as a result of the decomposition of organic material falling from surface waters Current understanding indicates that about 300 tonnes of methylmercury is produced in the upper ocean by this and related processes By contrast only about 80 tonnes of methylmercury reaches the ocean from other sources such as atmospheric deposition rivers and diffusion from sediments
Current modelling indicates that methylmercury stays in the upper ocean for about 11 years Deshymethylation by photochemical reaction or by microbial activity is the major removal process for methylmercury in the ocean About 240 tonnes of methylmercury is removed by this process from the surface waters of the ocean per year
The other important pathway for methylmercury in seawater is uptake into marine food webs Although only about 40 tonnes per year is taken up in this way it is this fraction that poses risks to marine animals and human consumers of seafood Methylmercury is a problem for several reasons First it is taken up by plankton much more efficiently than is inorganic mercury resulting in concentrations in plankton that are as high as 10000 times the concentration in seawater Second methylmercury is absorbed through the intestine of animals much more easily than is inorganic mercury Third methylmercury biomagnifies as it moves up the food web Thus methylmercury becomes an increasingly greater proportion of the mercury in organisms higher in the food web This explains why some indigenous populations that consume top marine predators such as fish seals and whales have some of the worldrsquos highest concentrations of methylmercury giving rise to health concerns
27
UNEP Global Mercury Assessment 2013
Pathways and fate of mercury in freshwater Observations and modelling both show that there are in general many similarities between mercury chemistry pathways and fate in lakes and in the oceans but with obvious differences in scale and in the relative importance of different processes Modelling of mercury dynamics was done for four lakes with a history of direct mercury inputs from the largest freshwater lake in the world (Lake Superior) to small lakes in Ontario Canada Atmospheric deposition and river inflow were the main sources of inorganic mercury Much of the mercury input from lake and river catchments was associated with dissolved and particulate organic matter The dominant mercury removal mechanisms as in saltwater were burial in sediments and photochemical reduction of oxidized mercury to elemental mercury followed by re-emission to the air In Lake Superior and Lake Michigan there is evidence for methylation of mercury in the water column as is seen in the open ocean
Methylmercury levels in freshwater fish vary with the level of deposition of mercury from the air though other factors such as inputs from the watershed and the number of trophic levels within the lakersquos food web are also important Methylation predominantly occurred in lake sediments and wetlands and floodplain soils where sulphateshyreducing bacteria are believed to be primarily responsible Methylmercury is de-methylated in sediments and also taken away in the outlet river from each lake
Some 400-1400 tonnes of mercury are estimated globally to be trapped behind dams and other man-made impoundments each year This has in many cases led to significant increases in total mercury and methylmercury levels in water and of methylmercury in fish and other aquatic species When artificial lakes are created plant material is submerged leading to decay and anoxia In these conditions microbially driven methylation of inorganic mercury takes place In some cases the elevated mercury levels have also been observed downstream from the artificial lakes and reservoirs
Anthropogenic impacts on aquatic mercury levels Two studies have reported that the Atlantic and Pacific Oceans have shown opposing trends over recent decades While the influence of changing ocean currents and other oceanographic factors may be a factor the trends do make sense in light of patterns of anthropogenic emissions In the North Pacific Ocean mercury concentrations appear to have increased at depths between 200 and 1000 meters over the last few decades This increase coincides with the rapid industrialization of East Asia
In the North Atlantic however results from near Bermuda suggest a substantial decrease in mercury concentration and a change in the mercury profile through the water column The Mediterranean Sea too showed a decrease in mercury concentration between 1990 and 2004 These findings are consistent with atmospheric data from around the North Atlantic The conclusion is that mercury levels in seawater in the North Atlantic were elevated by human activity but may now be declining likely as a result of decreased emissions from North America and Europe
A complementary approach to measuring mercury in seawater is to measure mercury in aquatic animals which accumulate and integrate mercury over time Teeth hair feathers and eggshells are useful long-term archives of mercury concentrations and can provide data from the pre-industrial period (ie before 1800) as well as more recent periods
Among marine animals samples are available from several regions particularly from the Arctic where cold dry conditions help preserve animal tissues Mercury concentrations between the 13th and 16th
centuries were relatively stable From the mid- to late 19th century to the end of the 20th century mercury levels increased by an average of 12 times On average therefore about 92 of the mercury in Arctic marine wildlife today is likely to be of anthropogenic origin
Similar findings were found for a 700-year sequence of seabird eggshells from the South China Sea Mercury levels increased steadily between 1800 and 2000 with a particularly rapid increase after 1970 Concentrations since 2000 are about 10 times higher than pre-industrial levels with 91 of the mercury now likely to be of anthropogenic origin In the Antarctic studies of seal hairs show that pre-industrial mercury levels were only 60 of recent levels The relatively small difference
28
UNEP Global Mercury Assessment 2013
Historical Hg concentration as a proportion of present-day 100
80
60
40
20
0
Beluga teeth Human teeth
Gyrfalcon feathers Perigrine falcon feathers
Polar bear hair Ringed seal teeth
1200 1300 1400 1500 1600 1700 1800 1900 2000
between pre-industrial and modern mercury levels in Antarctic is consistent with lower mercury emissions and atmospheric concentrations in the Southern Hemisphere as compared with the Northern Hemisphere
The timing of long-term increases of mercury in aquatic animals can shed light on the likely sources of mercury emissions that were responsible The industrialization of Europe and North America appear responsible for the large increases in marine mercury levels that began in the 19th century as these increases occurred prior to recent Asian industrialization As with water concentrations in the Pacific Ocean recent rapid increases in mercury in seabird eggs in the South China Sea coincide with industrialization in Asia
The time lag in aquatic ecosystem response One important conclusion from air-ocean modeling is that the oceans have not yet reached equilibrium with current atmospheric levels of mercury This lag is due to several factors First mercury stays in the upper ocean above 200 meters depth for about 30 years and for centuries in intermediate and deep waters This is much longer than the one year residence time in the lower atmosphere Thus removal from the ocean takes much longer than does removal from the air and so concentrations will change more slowly
Second because of the long lifetime of mercury in deeper ocean waters a great deal of natural mercury is present in the ocean already about 100000 tonnes out of a total of 135000 tonnes in intermediate waters and 200000 out of 220000 tonnes in deep waters
Rune Dietz
Analysis of museum samples reflects the increase in mercury emissions and releases since the mid-19th century associated with anthropogenic activities
Third vertical transport of mercury from intermediate depths back to the surface returns a substantial amount of mercury to the biologically active zone each year As a result average mercury concentrations in seawater and marine animals are likely to increase slowly for decades if not centuries even if atmospheric levels stabilize at present levels In short the effects of historical anthropogenic emissions from Europe and North America are still being observed in the oceans at the same time that the effects of the recent rise in emissions from Asia are being seen
Regionally different trends can be expected depending on distance from sources and ocean circulation patterns In the North Atlantic north of 55deg N it will take 50-600 years to achieve equilibrium between atmospheric and seawater mercury levels In the North Pacific this process is estimated to take 500-700 years and in the Antarctic 700-1000 years The Arctic Ocean by contrast is smaller and will only take about 35 years to reflect changes in atmospheric mercury levels Surface waters of the Mediterranean Sea should show also changes within 10-50 years
Time lags in the responses of many freshwaters and their food-webs to changes in atmospheric mercury levels are also expected Although some immediate recovery following reductions in atmospheric mercury deposition rates is likely full recovery may take decades centuries or longer depending on the characteristics of the area Highly polluted freshwaters with catchments and sediments containing large amounts of anthropogenic mercury will recover most slowly as is already observed around point sources such as smelters that have closed down
29
UNEP Global Mercury Assessment 2013
Major gaps in knowledge 9 Large uncertainties remain in global estimates of mercury emissions to the air These stem from various sources including the availability of information on activity levels but mainly from the lack of information concerning the mercury content of some raw materials and the validity of assumptions regarding processes and technologies employed to reduce mercury emissions including their rates of application and effectiveness The accuracy and precision of measurement-based estimates can depend on the validity of extrapolating measurements made at infrequent intervals to longer periods or measurements made at one plant to other facilities with similar operations
Potentially important emissions sectors that are still not quantified in the emissions inventory include the use of mercury in vinyl-chloride monomer production secondary metals production oil and gas extraction transport and processing industrial and hazardous waste incineration and disposal sewage sludge incineration and dental fillings preparation and removal
Current measurements and their evaluation are inadequate for determining spatial and temporal trends Improved more extensive and better coordinated measurements are needed A permanent global integrated monitoring network for atmospheric mercury and mercury deposition is needed to achieve this goal The atmospheric network sites should be closely integrated with water soil and biological monitoring networks The results can be used for model testing and evaluation as well as for more accurately detailing the geographic impact of anthropogenic emissions Monitoring of mercury concentrations in the important marine food species is essential to understanding possible human health impacts and the effects of future emissions changes
Better data on mercury distribution in the troposphere is needed to improve understanding of long-range transport and source-receptor relationships Coordinated studies at high altitudes and by aircraft are needed This information will
also help validate regional and global scale models improving their prediction capabilities with regard to different policy scenarios
Key processes related to global transport and cycling of mercury remain inadequately understood The chemical form of gaseous oxidized mercury is unknown Reduction and oxidation rates for mercury in the presence of atmospheric oxidants need further study including determining which oxidants are important New measurements and modelling studies are needed to examine key chemical and physical processes that affect global transport and cycling
Few data are available for reporting mercury releases to aquatic systems Systematic and consistent monitoring of mercury releases to the air is required especially for contaminated systems Releases of mercury from soils into waters depend greatly on climate and topography and these parameters need to be better accounted for Consistent approaches for measuring and reporting releases from point sources are needed to ensure comparability of data from around the world In particular the actual role of artisanal and small-scale gold mining (ASGM) in emissions to air and releases to water needs to be more accurately estimated
The link between mercury deposition methylation and uptake by living organisms needs further study The parameters that determine the rates of exchange of mercury compounds between air and sea air and soil and air and vegetation are not fully understood Whole-ecosystem studies of mercury are needed to better understand biogeochemical cycling Methylationdemethylation rates and their spatial and temporal variations and relationship to climatic factors need to be determined in most of worldrsquos major ocean basins as well as in representative freshwaters
30
UNEP Global Mercury Assessment 2013
Key findings of the 2013 assessment 10 Atmosphere Total anthropogenic emissions of mercury to the atmosphere in 2010 are estimated at 1960 (1010shy4070) tonnes which is about 30 of the total mercury that was emitted and re-emitted from anthropogenic and natural sources in that year The largest anthropogenic sources are associated with artisanal and small-scale gold mining (ASGM) and coal burning which together account for about 62 of the annual total anthropogenic emissions to air Other major sectors include ferrous and non-ferrous metal production and cement production
East and Southeast Asia are responsible for about 40 of global anthropogenic emissions About 75 of the mercury from this region comes from China which is about one-third of the global total Increased estimates for emissions from ASGM largely a result of newly obtained data and improved information mean that South America and Sub-Saharan Africa are also responsible for a greater proportion of global emissions than was previously assumed
Anthropogenic emissions over time have increased mercury loads present in the environment This leads to higher rates of re-emission and also means that there will be a time lag of years or decades between emissions reductions and lower mercury levels in the food web including pathways of human exposure
Mercury emissions to the atmosphere likely peaked in the 1950s to 1970s and subsequently declined because of reductions in Europe Russia and North America Emission trends are unclear due to changes in methods employed to produce inventories and differences in the sectors that have been accounted at different times There are however some indications that emissions may be rising again with increases from East Asia offsetting continuing reductions in Europe and North America
Aquatic environments Natural processes in aquatic systems convert less toxic elemental and inorganic mercury into much more toxic methylmercury Methylmercury concentrates and accumulates in the food web leading to high concentrations in some species of seafood and fish that many people eat
Anthropogenic releases of mercury to aquatic environments contribute hundreds of tonnes to the amount of mercury cycling in the environment Diffuse releases and point sources appear equally important Atmospheric deposition however remains the most important input of mercury to land and oceans and has increased the amount of mercury in many environmental compartments by a factor of two or three since the start of the industrial age On land mercury that is deposited is largely retained in soils and vegetation increasing the available pool for re-mobilisation to adjacent aquatic systems Re-emission from soils however is a major addition to atmospheric mercury
Hydrology is the most important factor in the transport of mercury from catchments to downstream environments Relatively little of this mercury reaches the open ocean as most is captured in sediments behind dams in estuaries and near the coast Changes in land cover and land use can have a large effect on mercury mobilisation as exposed soils erode and mercury leaches into the water table
Concentrations of mercury in Arctic marine animals today are about 10-12 times higher than in preshyindustrial times (ie prior to about 1800) This means that on average about 92 of the mercury in marine predators such as seabirds seals and whales is anthropogenic in origin The timing of the increase suggest that 19th and early 20th century emissions from Europe North America and Russia were responsible Increases mercury concentrations in seabirds in the South China Sea appear to be more recent than the Arctic increases coinciding with increasing industrialisation in East and Southeast Asia
31
UNEP Global Mercury Assessment 2013
K+S Entsorgung Gm
bH
Recovered mercury is being stockpiled at long-term storage sites above- and as shown here below ground
The upper 100 meters of the oceans have twice the mercury that they did a century ago Intermediate and deeper waters have 10-25 more mercury on average reflecting the slow transport of mercury downwards in the oceans Seawater concentrations will thus be especially slow in responding to changes in mercury inputs from atmospheric deposition and river flow As a result mercury concentrations in marine biota are likely to increase slowly for decades to centuries even without an increase in atmospheric emissions
In freshwater ecosystems atmospheric deposition and re-mobilisation from soils slow the reduction of mercury levels even in regions where atmospheric concentrations have decreased due to emission controls
Further increases in atmospheric emissions will have long-term consequences for commercial fisheries and all consumers of marine and freshwater foods
It is likely to be years or decades before reductions in anthropogenic emissions and releases of mercury have a demonstrable effect on mercury levels throughout the environment and in the fish and marine mammals which are part of the human food-chain This only reinforces the need to act now to continue and strengthen international efforts to reduce current mercury emissions and releases Delays in action now will inevitably lead to slower recovery of the worldrsquos ecosystems in future from mercury contamination leaving an even greater legacy of pollution for future generations
32
Division of Technology Industry and Economics (DTIE) Chemicals Branch Geneva Switzerland January 2013
Job number DTI1636GE
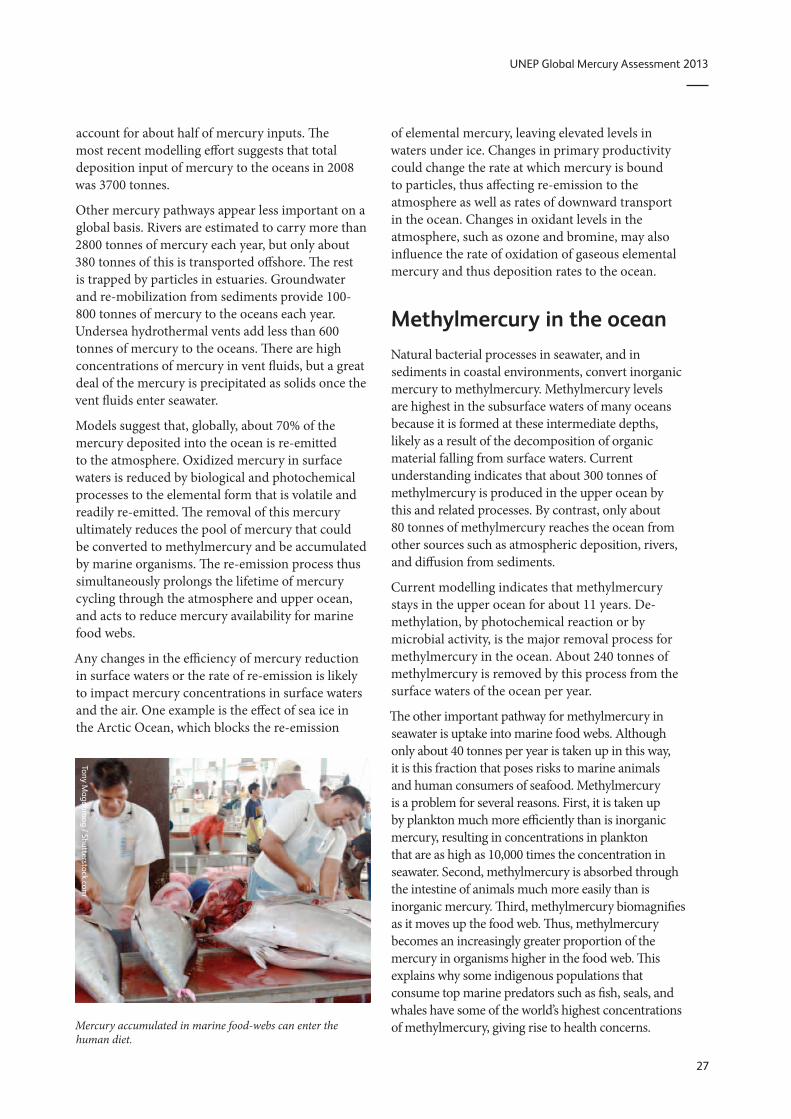
UNEP Global Mercury Assessment 2013
account for about half of mercury inputs The most recent modelling effort suggests that total deposition input of mercury to the oceans in 2008 was 3700 tonnes
Other mercury pathways appear less important on a global basis Rivers are estimated to carry more than 2800 tonnes of mercury each year but only about 380 tonnes of this is transported offshore The rest is trapped by particles in estuaries Groundwater and re-mobilization from sediments provide 100shy800 tonnes of mercury to the oceans each year Undersea hydrothermal vents add less than 600 tonnes of mercury to the oceans There are high concentrations of mercury in vent fluids but a great deal of the mercury is precipitated as solids once the vent fluids enter seawater
Models suggest that globally about 70 of the mercury deposited into the ocean is re-emitted to the atmosphere Oxidized mercury in surface waters is reduced by biological and photochemical processes to the elemental form that is volatile and readily re-emitted The removal of this mercury ultimately reduces the pool of mercury that could be converted to methylmercury and be accumulated by marine organisms The re-emission process thus simultaneously prolongs the lifetime of mercury cycling through the atmosphere and upper ocean and acts to reduce mercury availability for marine food webs
Any changes in the efficiency of mercury reduction in surface waters or the rate of re-emission is likely to impact mercury concentrations in surface waters and the air One example is the effect of sea ice in the Arctic Ocean which blocks the re-emission
Tony Magdaraog Shutterstockcom
Mercury accumulated in marine food-webs can enter the human diet
of elemental mercury leaving elevated levels in waters under ice Changes in primary productivity could change the rate at which mercury is bound to particles thus affecting re-emission to the atmosphere as well as rates of downward transport in the ocean Changes in oxidant levels in the atmosphere such as ozone and bromine may also influence the rate of oxidation of gaseous elemental mercury and thus deposition rates to the ocean
Methylmercury in the ocean Natural bacterial processes in seawater and in sediments in coastal environments convert inorganic mercury to methylmercury Methylmercury levels are highest in the subsurface waters of many oceans because it is formed at these intermediate depths likely as a result of the decomposition of organic material falling from surface waters Current understanding indicates that about 300 tonnes of methylmercury is produced in the upper ocean by this and related processes By contrast only about 80 tonnes of methylmercury reaches the ocean from other sources such as atmospheric deposition rivers and diffusion from sediments
Current modelling indicates that methylmercury stays in the upper ocean for about 11 years Deshymethylation by photochemical reaction or by microbial activity is the major removal process for methylmercury in the ocean About 240 tonnes of methylmercury is removed by this process from the surface waters of the ocean per year
The other important pathway for methylmercury in seawater is uptake into marine food webs Although only about 40 tonnes per year is taken up in this way it is this fraction that poses risks to marine animals and human consumers of seafood Methylmercury is a problem for several reasons First it is taken up by plankton much more efficiently than is inorganic mercury resulting in concentrations in plankton that are as high as 10000 times the concentration in seawater Second methylmercury is absorbed through the intestine of animals much more easily than is inorganic mercury Third methylmercury biomagnifies as it moves up the food web Thus methylmercury becomes an increasingly greater proportion of the mercury in organisms higher in the food web This explains why some indigenous populations that consume top marine predators such as fish seals and whales have some of the worldrsquos highest concentrations of methylmercury giving rise to health concerns
27
UNEP Global Mercury Assessment 2013
Pathways and fate of mercury in freshwater Observations and modelling both show that there are in general many similarities between mercury chemistry pathways and fate in lakes and in the oceans but with obvious differences in scale and in the relative importance of different processes Modelling of mercury dynamics was done for four lakes with a history of direct mercury inputs from the largest freshwater lake in the world (Lake Superior) to small lakes in Ontario Canada Atmospheric deposition and river inflow were the main sources of inorganic mercury Much of the mercury input from lake and river catchments was associated with dissolved and particulate organic matter The dominant mercury removal mechanisms as in saltwater were burial in sediments and photochemical reduction of oxidized mercury to elemental mercury followed by re-emission to the air In Lake Superior and Lake Michigan there is evidence for methylation of mercury in the water column as is seen in the open ocean
Methylmercury levels in freshwater fish vary with the level of deposition of mercury from the air though other factors such as inputs from the watershed and the number of trophic levels within the lakersquos food web are also important Methylation predominantly occurred in lake sediments and wetlands and floodplain soils where sulphateshyreducing bacteria are believed to be primarily responsible Methylmercury is de-methylated in sediments and also taken away in the outlet river from each lake
Some 400-1400 tonnes of mercury are estimated globally to be trapped behind dams and other man-made impoundments each year This has in many cases led to significant increases in total mercury and methylmercury levels in water and of methylmercury in fish and other aquatic species When artificial lakes are created plant material is submerged leading to decay and anoxia In these conditions microbially driven methylation of inorganic mercury takes place In some cases the elevated mercury levels have also been observed downstream from the artificial lakes and reservoirs
Anthropogenic impacts on aquatic mercury levels Two studies have reported that the Atlantic and Pacific Oceans have shown opposing trends over recent decades While the influence of changing ocean currents and other oceanographic factors may be a factor the trends do make sense in light of patterns of anthropogenic emissions In the North Pacific Ocean mercury concentrations appear to have increased at depths between 200 and 1000 meters over the last few decades This increase coincides with the rapid industrialization of East Asia
In the North Atlantic however results from near Bermuda suggest a substantial decrease in mercury concentration and a change in the mercury profile through the water column The Mediterranean Sea too showed a decrease in mercury concentration between 1990 and 2004 These findings are consistent with atmospheric data from around the North Atlantic The conclusion is that mercury levels in seawater in the North Atlantic were elevated by human activity but may now be declining likely as a result of decreased emissions from North America and Europe
A complementary approach to measuring mercury in seawater is to measure mercury in aquatic animals which accumulate and integrate mercury over time Teeth hair feathers and eggshells are useful long-term archives of mercury concentrations and can provide data from the pre-industrial period (ie before 1800) as well as more recent periods
Among marine animals samples are available from several regions particularly from the Arctic where cold dry conditions help preserve animal tissues Mercury concentrations between the 13th and 16th
centuries were relatively stable From the mid- to late 19th century to the end of the 20th century mercury levels increased by an average of 12 times On average therefore about 92 of the mercury in Arctic marine wildlife today is likely to be of anthropogenic origin
Similar findings were found for a 700-year sequence of seabird eggshells from the South China Sea Mercury levels increased steadily between 1800 and 2000 with a particularly rapid increase after 1970 Concentrations since 2000 are about 10 times higher than pre-industrial levels with 91 of the mercury now likely to be of anthropogenic origin In the Antarctic studies of seal hairs show that pre-industrial mercury levels were only 60 of recent levels The relatively small difference
28
UNEP Global Mercury Assessment 2013
Historical Hg concentration as a proportion of present-day 100
80
60
40
20
0
Beluga teeth Human teeth
Gyrfalcon feathers Perigrine falcon feathers
Polar bear hair Ringed seal teeth
1200 1300 1400 1500 1600 1700 1800 1900 2000
between pre-industrial and modern mercury levels in Antarctic is consistent with lower mercury emissions and atmospheric concentrations in the Southern Hemisphere as compared with the Northern Hemisphere
The timing of long-term increases of mercury in aquatic animals can shed light on the likely sources of mercury emissions that were responsible The industrialization of Europe and North America appear responsible for the large increases in marine mercury levels that began in the 19th century as these increases occurred prior to recent Asian industrialization As with water concentrations in the Pacific Ocean recent rapid increases in mercury in seabird eggs in the South China Sea coincide with industrialization in Asia
The time lag in aquatic ecosystem response One important conclusion from air-ocean modeling is that the oceans have not yet reached equilibrium with current atmospheric levels of mercury This lag is due to several factors First mercury stays in the upper ocean above 200 meters depth for about 30 years and for centuries in intermediate and deep waters This is much longer than the one year residence time in the lower atmosphere Thus removal from the ocean takes much longer than does removal from the air and so concentrations will change more slowly
Second because of the long lifetime of mercury in deeper ocean waters a great deal of natural mercury is present in the ocean already about 100000 tonnes out of a total of 135000 tonnes in intermediate waters and 200000 out of 220000 tonnes in deep waters
Rune Dietz
Analysis of museum samples reflects the increase in mercury emissions and releases since the mid-19th century associated with anthropogenic activities
Third vertical transport of mercury from intermediate depths back to the surface returns a substantial amount of mercury to the biologically active zone each year As a result average mercury concentrations in seawater and marine animals are likely to increase slowly for decades if not centuries even if atmospheric levels stabilize at present levels In short the effects of historical anthropogenic emissions from Europe and North America are still being observed in the oceans at the same time that the effects of the recent rise in emissions from Asia are being seen
Regionally different trends can be expected depending on distance from sources and ocean circulation patterns In the North Atlantic north of 55deg N it will take 50-600 years to achieve equilibrium between atmospheric and seawater mercury levels In the North Pacific this process is estimated to take 500-700 years and in the Antarctic 700-1000 years The Arctic Ocean by contrast is smaller and will only take about 35 years to reflect changes in atmospheric mercury levels Surface waters of the Mediterranean Sea should show also changes within 10-50 years
Time lags in the responses of many freshwaters and their food-webs to changes in atmospheric mercury levels are also expected Although some immediate recovery following reductions in atmospheric mercury deposition rates is likely full recovery may take decades centuries or longer depending on the characteristics of the area Highly polluted freshwaters with catchments and sediments containing large amounts of anthropogenic mercury will recover most slowly as is already observed around point sources such as smelters that have closed down
29
UNEP Global Mercury Assessment 2013
Major gaps in knowledge 9 Large uncertainties remain in global estimates of mercury emissions to the air These stem from various sources including the availability of information on activity levels but mainly from the lack of information concerning the mercury content of some raw materials and the validity of assumptions regarding processes and technologies employed to reduce mercury emissions including their rates of application and effectiveness The accuracy and precision of measurement-based estimates can depend on the validity of extrapolating measurements made at infrequent intervals to longer periods or measurements made at one plant to other facilities with similar operations
Potentially important emissions sectors that are still not quantified in the emissions inventory include the use of mercury in vinyl-chloride monomer production secondary metals production oil and gas extraction transport and processing industrial and hazardous waste incineration and disposal sewage sludge incineration and dental fillings preparation and removal
Current measurements and their evaluation are inadequate for determining spatial and temporal trends Improved more extensive and better coordinated measurements are needed A permanent global integrated monitoring network for atmospheric mercury and mercury deposition is needed to achieve this goal The atmospheric network sites should be closely integrated with water soil and biological monitoring networks The results can be used for model testing and evaluation as well as for more accurately detailing the geographic impact of anthropogenic emissions Monitoring of mercury concentrations in the important marine food species is essential to understanding possible human health impacts and the effects of future emissions changes
Better data on mercury distribution in the troposphere is needed to improve understanding of long-range transport and source-receptor relationships Coordinated studies at high altitudes and by aircraft are needed This information will
also help validate regional and global scale models improving their prediction capabilities with regard to different policy scenarios
Key processes related to global transport and cycling of mercury remain inadequately understood The chemical form of gaseous oxidized mercury is unknown Reduction and oxidation rates for mercury in the presence of atmospheric oxidants need further study including determining which oxidants are important New measurements and modelling studies are needed to examine key chemical and physical processes that affect global transport and cycling
Few data are available for reporting mercury releases to aquatic systems Systematic and consistent monitoring of mercury releases to the air is required especially for contaminated systems Releases of mercury from soils into waters depend greatly on climate and topography and these parameters need to be better accounted for Consistent approaches for measuring and reporting releases from point sources are needed to ensure comparability of data from around the world In particular the actual role of artisanal and small-scale gold mining (ASGM) in emissions to air and releases to water needs to be more accurately estimated
The link between mercury deposition methylation and uptake by living organisms needs further study The parameters that determine the rates of exchange of mercury compounds between air and sea air and soil and air and vegetation are not fully understood Whole-ecosystem studies of mercury are needed to better understand biogeochemical cycling Methylationdemethylation rates and their spatial and temporal variations and relationship to climatic factors need to be determined in most of worldrsquos major ocean basins as well as in representative freshwaters
30
UNEP Global Mercury Assessment 2013
Key findings of the 2013 assessment 10 Atmosphere Total anthropogenic emissions of mercury to the atmosphere in 2010 are estimated at 1960 (1010shy4070) tonnes which is about 30 of the total mercury that was emitted and re-emitted from anthropogenic and natural sources in that year The largest anthropogenic sources are associated with artisanal and small-scale gold mining (ASGM) and coal burning which together account for about 62 of the annual total anthropogenic emissions to air Other major sectors include ferrous and non-ferrous metal production and cement production
East and Southeast Asia are responsible for about 40 of global anthropogenic emissions About 75 of the mercury from this region comes from China which is about one-third of the global total Increased estimates for emissions from ASGM largely a result of newly obtained data and improved information mean that South America and Sub-Saharan Africa are also responsible for a greater proportion of global emissions than was previously assumed
Anthropogenic emissions over time have increased mercury loads present in the environment This leads to higher rates of re-emission and also means that there will be a time lag of years or decades between emissions reductions and lower mercury levels in the food web including pathways of human exposure
Mercury emissions to the atmosphere likely peaked in the 1950s to 1970s and subsequently declined because of reductions in Europe Russia and North America Emission trends are unclear due to changes in methods employed to produce inventories and differences in the sectors that have been accounted at different times There are however some indications that emissions may be rising again with increases from East Asia offsetting continuing reductions in Europe and North America
Aquatic environments Natural processes in aquatic systems convert less toxic elemental and inorganic mercury into much more toxic methylmercury Methylmercury concentrates and accumulates in the food web leading to high concentrations in some species of seafood and fish that many people eat
Anthropogenic releases of mercury to aquatic environments contribute hundreds of tonnes to the amount of mercury cycling in the environment Diffuse releases and point sources appear equally important Atmospheric deposition however remains the most important input of mercury to land and oceans and has increased the amount of mercury in many environmental compartments by a factor of two or three since the start of the industrial age On land mercury that is deposited is largely retained in soils and vegetation increasing the available pool for re-mobilisation to adjacent aquatic systems Re-emission from soils however is a major addition to atmospheric mercury
Hydrology is the most important factor in the transport of mercury from catchments to downstream environments Relatively little of this mercury reaches the open ocean as most is captured in sediments behind dams in estuaries and near the coast Changes in land cover and land use can have a large effect on mercury mobilisation as exposed soils erode and mercury leaches into the water table
Concentrations of mercury in Arctic marine animals today are about 10-12 times higher than in preshyindustrial times (ie prior to about 1800) This means that on average about 92 of the mercury in marine predators such as seabirds seals and whales is anthropogenic in origin The timing of the increase suggest that 19th and early 20th century emissions from Europe North America and Russia were responsible Increases mercury concentrations in seabirds in the South China Sea appear to be more recent than the Arctic increases coinciding with increasing industrialisation in East and Southeast Asia
31
UNEP Global Mercury Assessment 2013
K+S Entsorgung Gm
bH
Recovered mercury is being stockpiled at long-term storage sites above- and as shown here below ground
The upper 100 meters of the oceans have twice the mercury that they did a century ago Intermediate and deeper waters have 10-25 more mercury on average reflecting the slow transport of mercury downwards in the oceans Seawater concentrations will thus be especially slow in responding to changes in mercury inputs from atmospheric deposition and river flow As a result mercury concentrations in marine biota are likely to increase slowly for decades to centuries even without an increase in atmospheric emissions
In freshwater ecosystems atmospheric deposition and re-mobilisation from soils slow the reduction of mercury levels even in regions where atmospheric concentrations have decreased due to emission controls
Further increases in atmospheric emissions will have long-term consequences for commercial fisheries and all consumers of marine and freshwater foods
It is likely to be years or decades before reductions in anthropogenic emissions and releases of mercury have a demonstrable effect on mercury levels throughout the environment and in the fish and marine mammals which are part of the human food-chain This only reinforces the need to act now to continue and strengthen international efforts to reduce current mercury emissions and releases Delays in action now will inevitably lead to slower recovery of the worldrsquos ecosystems in future from mercury contamination leaving an even greater legacy of pollution for future generations
32
Division of Technology Industry and Economics (DTIE) Chemicals Branch Geneva Switzerland January 2013
Job number DTI1636GE
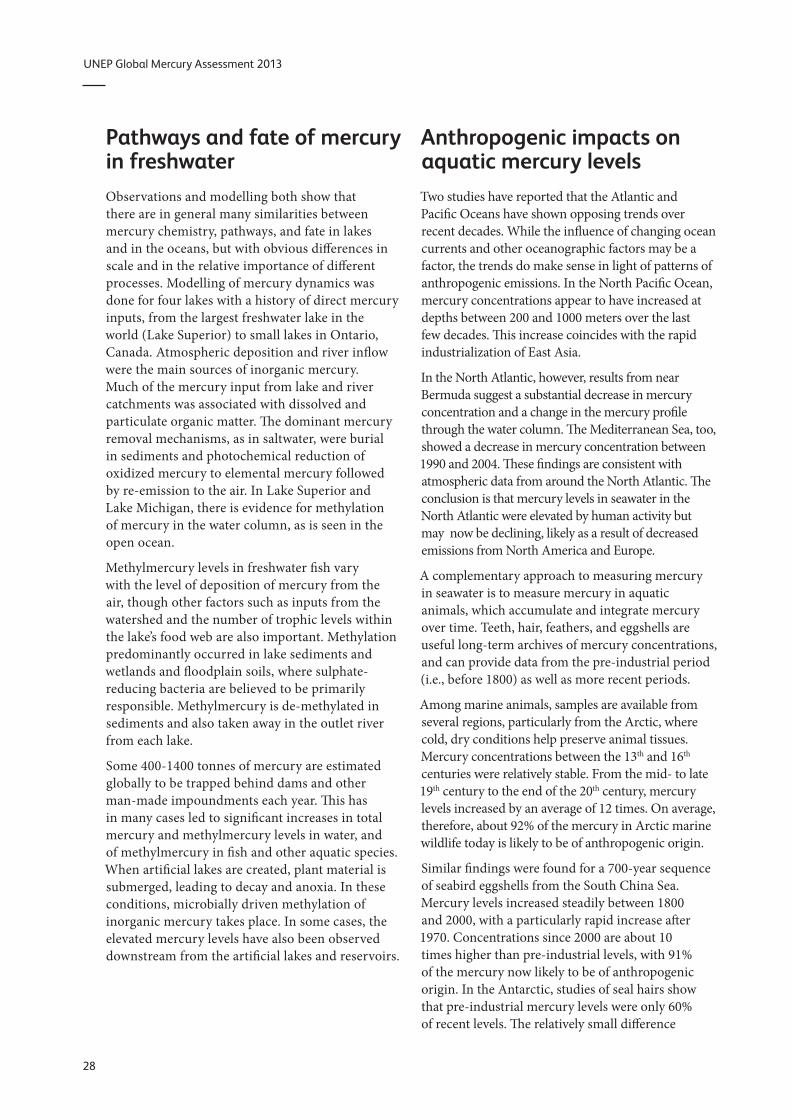
UNEP Global Mercury Assessment 2013
Pathways and fate of mercury in freshwater Observations and modelling both show that there are in general many similarities between mercury chemistry pathways and fate in lakes and in the oceans but with obvious differences in scale and in the relative importance of different processes Modelling of mercury dynamics was done for four lakes with a history of direct mercury inputs from the largest freshwater lake in the world (Lake Superior) to small lakes in Ontario Canada Atmospheric deposition and river inflow were the main sources of inorganic mercury Much of the mercury input from lake and river catchments was associated with dissolved and particulate organic matter The dominant mercury removal mechanisms as in saltwater were burial in sediments and photochemical reduction of oxidized mercury to elemental mercury followed by re-emission to the air In Lake Superior and Lake Michigan there is evidence for methylation of mercury in the water column as is seen in the open ocean
Methylmercury levels in freshwater fish vary with the level of deposition of mercury from the air though other factors such as inputs from the watershed and the number of trophic levels within the lakersquos food web are also important Methylation predominantly occurred in lake sediments and wetlands and floodplain soils where sulphateshyreducing bacteria are believed to be primarily responsible Methylmercury is de-methylated in sediments and also taken away in the outlet river from each lake
Some 400-1400 tonnes of mercury are estimated globally to be trapped behind dams and other man-made impoundments each year This has in many cases led to significant increases in total mercury and methylmercury levels in water and of methylmercury in fish and other aquatic species When artificial lakes are created plant material is submerged leading to decay and anoxia In these conditions microbially driven methylation of inorganic mercury takes place In some cases the elevated mercury levels have also been observed downstream from the artificial lakes and reservoirs
Anthropogenic impacts on aquatic mercury levels Two studies have reported that the Atlantic and Pacific Oceans have shown opposing trends over recent decades While the influence of changing ocean currents and other oceanographic factors may be a factor the trends do make sense in light of patterns of anthropogenic emissions In the North Pacific Ocean mercury concentrations appear to have increased at depths between 200 and 1000 meters over the last few decades This increase coincides with the rapid industrialization of East Asia
In the North Atlantic however results from near Bermuda suggest a substantial decrease in mercury concentration and a change in the mercury profile through the water column The Mediterranean Sea too showed a decrease in mercury concentration between 1990 and 2004 These findings are consistent with atmospheric data from around the North Atlantic The conclusion is that mercury levels in seawater in the North Atlantic were elevated by human activity but may now be declining likely as a result of decreased emissions from North America and Europe
A complementary approach to measuring mercury in seawater is to measure mercury in aquatic animals which accumulate and integrate mercury over time Teeth hair feathers and eggshells are useful long-term archives of mercury concentrations and can provide data from the pre-industrial period (ie before 1800) as well as more recent periods
Among marine animals samples are available from several regions particularly from the Arctic where cold dry conditions help preserve animal tissues Mercury concentrations between the 13th and 16th
centuries were relatively stable From the mid- to late 19th century to the end of the 20th century mercury levels increased by an average of 12 times On average therefore about 92 of the mercury in Arctic marine wildlife today is likely to be of anthropogenic origin
Similar findings were found for a 700-year sequence of seabird eggshells from the South China Sea Mercury levels increased steadily between 1800 and 2000 with a particularly rapid increase after 1970 Concentrations since 2000 are about 10 times higher than pre-industrial levels with 91 of the mercury now likely to be of anthropogenic origin In the Antarctic studies of seal hairs show that pre-industrial mercury levels were only 60 of recent levels The relatively small difference
28
UNEP Global Mercury Assessment 2013
Historical Hg concentration as a proportion of present-day 100
80
60
40
20
0
Beluga teeth Human teeth
Gyrfalcon feathers Perigrine falcon feathers
Polar bear hair Ringed seal teeth
1200 1300 1400 1500 1600 1700 1800 1900 2000
between pre-industrial and modern mercury levels in Antarctic is consistent with lower mercury emissions and atmospheric concentrations in the Southern Hemisphere as compared with the Northern Hemisphere
The timing of long-term increases of mercury in aquatic animals can shed light on the likely sources of mercury emissions that were responsible The industrialization of Europe and North America appear responsible for the large increases in marine mercury levels that began in the 19th century as these increases occurred prior to recent Asian industrialization As with water concentrations in the Pacific Ocean recent rapid increases in mercury in seabird eggs in the South China Sea coincide with industrialization in Asia
The time lag in aquatic ecosystem response One important conclusion from air-ocean modeling is that the oceans have not yet reached equilibrium with current atmospheric levels of mercury This lag is due to several factors First mercury stays in the upper ocean above 200 meters depth for about 30 years and for centuries in intermediate and deep waters This is much longer than the one year residence time in the lower atmosphere Thus removal from the ocean takes much longer than does removal from the air and so concentrations will change more slowly
Second because of the long lifetime of mercury in deeper ocean waters a great deal of natural mercury is present in the ocean already about 100000 tonnes out of a total of 135000 tonnes in intermediate waters and 200000 out of 220000 tonnes in deep waters
Rune Dietz
Analysis of museum samples reflects the increase in mercury emissions and releases since the mid-19th century associated with anthropogenic activities
Third vertical transport of mercury from intermediate depths back to the surface returns a substantial amount of mercury to the biologically active zone each year As a result average mercury concentrations in seawater and marine animals are likely to increase slowly for decades if not centuries even if atmospheric levels stabilize at present levels In short the effects of historical anthropogenic emissions from Europe and North America are still being observed in the oceans at the same time that the effects of the recent rise in emissions from Asia are being seen
Regionally different trends can be expected depending on distance from sources and ocean circulation patterns In the North Atlantic north of 55deg N it will take 50-600 years to achieve equilibrium between atmospheric and seawater mercury levels In the North Pacific this process is estimated to take 500-700 years and in the Antarctic 700-1000 years The Arctic Ocean by contrast is smaller and will only take about 35 years to reflect changes in atmospheric mercury levels Surface waters of the Mediterranean Sea should show also changes within 10-50 years
Time lags in the responses of many freshwaters and their food-webs to changes in atmospheric mercury levels are also expected Although some immediate recovery following reductions in atmospheric mercury deposition rates is likely full recovery may take decades centuries or longer depending on the characteristics of the area Highly polluted freshwaters with catchments and sediments containing large amounts of anthropogenic mercury will recover most slowly as is already observed around point sources such as smelters that have closed down
29
UNEP Global Mercury Assessment 2013
Major gaps in knowledge 9 Large uncertainties remain in global estimates of mercury emissions to the air These stem from various sources including the availability of information on activity levels but mainly from the lack of information concerning the mercury content of some raw materials and the validity of assumptions regarding processes and technologies employed to reduce mercury emissions including their rates of application and effectiveness The accuracy and precision of measurement-based estimates can depend on the validity of extrapolating measurements made at infrequent intervals to longer periods or measurements made at one plant to other facilities with similar operations
Potentially important emissions sectors that are still not quantified in the emissions inventory include the use of mercury in vinyl-chloride monomer production secondary metals production oil and gas extraction transport and processing industrial and hazardous waste incineration and disposal sewage sludge incineration and dental fillings preparation and removal
Current measurements and their evaluation are inadequate for determining spatial and temporal trends Improved more extensive and better coordinated measurements are needed A permanent global integrated monitoring network for atmospheric mercury and mercury deposition is needed to achieve this goal The atmospheric network sites should be closely integrated with water soil and biological monitoring networks The results can be used for model testing and evaluation as well as for more accurately detailing the geographic impact of anthropogenic emissions Monitoring of mercury concentrations in the important marine food species is essential to understanding possible human health impacts and the effects of future emissions changes
Better data on mercury distribution in the troposphere is needed to improve understanding of long-range transport and source-receptor relationships Coordinated studies at high altitudes and by aircraft are needed This information will
also help validate regional and global scale models improving their prediction capabilities with regard to different policy scenarios
Key processes related to global transport and cycling of mercury remain inadequately understood The chemical form of gaseous oxidized mercury is unknown Reduction and oxidation rates for mercury in the presence of atmospheric oxidants need further study including determining which oxidants are important New measurements and modelling studies are needed to examine key chemical and physical processes that affect global transport and cycling
Few data are available for reporting mercury releases to aquatic systems Systematic and consistent monitoring of mercury releases to the air is required especially for contaminated systems Releases of mercury from soils into waters depend greatly on climate and topography and these parameters need to be better accounted for Consistent approaches for measuring and reporting releases from point sources are needed to ensure comparability of data from around the world In particular the actual role of artisanal and small-scale gold mining (ASGM) in emissions to air and releases to water needs to be more accurately estimated
The link between mercury deposition methylation and uptake by living organisms needs further study The parameters that determine the rates of exchange of mercury compounds between air and sea air and soil and air and vegetation are not fully understood Whole-ecosystem studies of mercury are needed to better understand biogeochemical cycling Methylationdemethylation rates and their spatial and temporal variations and relationship to climatic factors need to be determined in most of worldrsquos major ocean basins as well as in representative freshwaters
30
UNEP Global Mercury Assessment 2013
Key findings of the 2013 assessment 10 Atmosphere Total anthropogenic emissions of mercury to the atmosphere in 2010 are estimated at 1960 (1010shy4070) tonnes which is about 30 of the total mercury that was emitted and re-emitted from anthropogenic and natural sources in that year The largest anthropogenic sources are associated with artisanal and small-scale gold mining (ASGM) and coal burning which together account for about 62 of the annual total anthropogenic emissions to air Other major sectors include ferrous and non-ferrous metal production and cement production
East and Southeast Asia are responsible for about 40 of global anthropogenic emissions About 75 of the mercury from this region comes from China which is about one-third of the global total Increased estimates for emissions from ASGM largely a result of newly obtained data and improved information mean that South America and Sub-Saharan Africa are also responsible for a greater proportion of global emissions than was previously assumed
Anthropogenic emissions over time have increased mercury loads present in the environment This leads to higher rates of re-emission and also means that there will be a time lag of years or decades between emissions reductions and lower mercury levels in the food web including pathways of human exposure
Mercury emissions to the atmosphere likely peaked in the 1950s to 1970s and subsequently declined because of reductions in Europe Russia and North America Emission trends are unclear due to changes in methods employed to produce inventories and differences in the sectors that have been accounted at different times There are however some indications that emissions may be rising again with increases from East Asia offsetting continuing reductions in Europe and North America
Aquatic environments Natural processes in aquatic systems convert less toxic elemental and inorganic mercury into much more toxic methylmercury Methylmercury concentrates and accumulates in the food web leading to high concentrations in some species of seafood and fish that many people eat
Anthropogenic releases of mercury to aquatic environments contribute hundreds of tonnes to the amount of mercury cycling in the environment Diffuse releases and point sources appear equally important Atmospheric deposition however remains the most important input of mercury to land and oceans and has increased the amount of mercury in many environmental compartments by a factor of two or three since the start of the industrial age On land mercury that is deposited is largely retained in soils and vegetation increasing the available pool for re-mobilisation to adjacent aquatic systems Re-emission from soils however is a major addition to atmospheric mercury
Hydrology is the most important factor in the transport of mercury from catchments to downstream environments Relatively little of this mercury reaches the open ocean as most is captured in sediments behind dams in estuaries and near the coast Changes in land cover and land use can have a large effect on mercury mobilisation as exposed soils erode and mercury leaches into the water table
Concentrations of mercury in Arctic marine animals today are about 10-12 times higher than in preshyindustrial times (ie prior to about 1800) This means that on average about 92 of the mercury in marine predators such as seabirds seals and whales is anthropogenic in origin The timing of the increase suggest that 19th and early 20th century emissions from Europe North America and Russia were responsible Increases mercury concentrations in seabirds in the South China Sea appear to be more recent than the Arctic increases coinciding with increasing industrialisation in East and Southeast Asia
31
UNEP Global Mercury Assessment 2013
K+S Entsorgung Gm
bH
Recovered mercury is being stockpiled at long-term storage sites above- and as shown here below ground
The upper 100 meters of the oceans have twice the mercury that they did a century ago Intermediate and deeper waters have 10-25 more mercury on average reflecting the slow transport of mercury downwards in the oceans Seawater concentrations will thus be especially slow in responding to changes in mercury inputs from atmospheric deposition and river flow As a result mercury concentrations in marine biota are likely to increase slowly for decades to centuries even without an increase in atmospheric emissions
In freshwater ecosystems atmospheric deposition and re-mobilisation from soils slow the reduction of mercury levels even in regions where atmospheric concentrations have decreased due to emission controls
Further increases in atmospheric emissions will have long-term consequences for commercial fisheries and all consumers of marine and freshwater foods
It is likely to be years or decades before reductions in anthropogenic emissions and releases of mercury have a demonstrable effect on mercury levels throughout the environment and in the fish and marine mammals which are part of the human food-chain This only reinforces the need to act now to continue and strengthen international efforts to reduce current mercury emissions and releases Delays in action now will inevitably lead to slower recovery of the worldrsquos ecosystems in future from mercury contamination leaving an even greater legacy of pollution for future generations
32
Division of Technology Industry and Economics (DTIE) Chemicals Branch Geneva Switzerland January 2013
Job number DTI1636GE
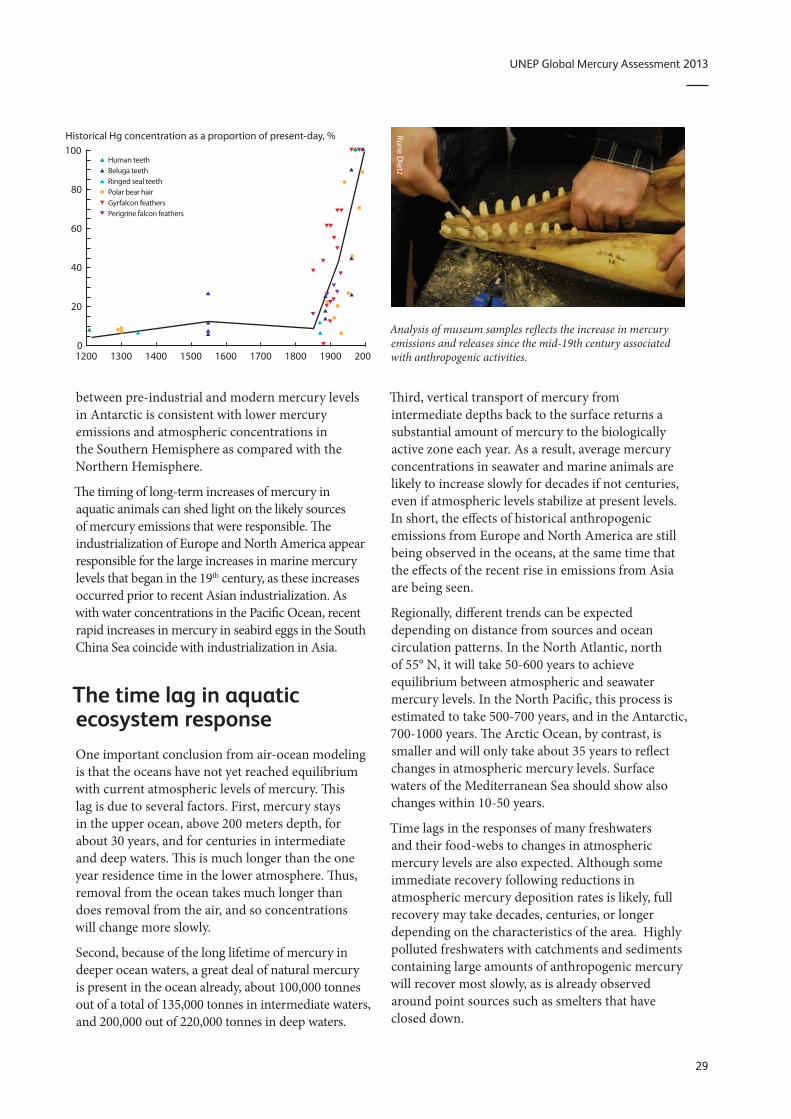
UNEP Global Mercury Assessment 2013
Historical Hg concentration as a proportion of present-day 100
80
60
40
20
0
Beluga teeth Human teeth
Gyrfalcon feathers Perigrine falcon feathers
Polar bear hair Ringed seal teeth
1200 1300 1400 1500 1600 1700 1800 1900 2000
between pre-industrial and modern mercury levels in Antarctic is consistent with lower mercury emissions and atmospheric concentrations in the Southern Hemisphere as compared with the Northern Hemisphere
The timing of long-term increases of mercury in aquatic animals can shed light on the likely sources of mercury emissions that were responsible The industrialization of Europe and North America appear responsible for the large increases in marine mercury levels that began in the 19th century as these increases occurred prior to recent Asian industrialization As with water concentrations in the Pacific Ocean recent rapid increases in mercury in seabird eggs in the South China Sea coincide with industrialization in Asia
The time lag in aquatic ecosystem response One important conclusion from air-ocean modeling is that the oceans have not yet reached equilibrium with current atmospheric levels of mercury This lag is due to several factors First mercury stays in the upper ocean above 200 meters depth for about 30 years and for centuries in intermediate and deep waters This is much longer than the one year residence time in the lower atmosphere Thus removal from the ocean takes much longer than does removal from the air and so concentrations will change more slowly
Second because of the long lifetime of mercury in deeper ocean waters a great deal of natural mercury is present in the ocean already about 100000 tonnes out of a total of 135000 tonnes in intermediate waters and 200000 out of 220000 tonnes in deep waters
Rune Dietz
Analysis of museum samples reflects the increase in mercury emissions and releases since the mid-19th century associated with anthropogenic activities
Third vertical transport of mercury from intermediate depths back to the surface returns a substantial amount of mercury to the biologically active zone each year As a result average mercury concentrations in seawater and marine animals are likely to increase slowly for decades if not centuries even if atmospheric levels stabilize at present levels In short the effects of historical anthropogenic emissions from Europe and North America are still being observed in the oceans at the same time that the effects of the recent rise in emissions from Asia are being seen
Regionally different trends can be expected depending on distance from sources and ocean circulation patterns In the North Atlantic north of 55deg N it will take 50-600 years to achieve equilibrium between atmospheric and seawater mercury levels In the North Pacific this process is estimated to take 500-700 years and in the Antarctic 700-1000 years The Arctic Ocean by contrast is smaller and will only take about 35 years to reflect changes in atmospheric mercury levels Surface waters of the Mediterranean Sea should show also changes within 10-50 years
Time lags in the responses of many freshwaters and their food-webs to changes in atmospheric mercury levels are also expected Although some immediate recovery following reductions in atmospheric mercury deposition rates is likely full recovery may take decades centuries or longer depending on the characteristics of the area Highly polluted freshwaters with catchments and sediments containing large amounts of anthropogenic mercury will recover most slowly as is already observed around point sources such as smelters that have closed down
29
UNEP Global Mercury Assessment 2013
Major gaps in knowledge 9 Large uncertainties remain in global estimates of mercury emissions to the air These stem from various sources including the availability of information on activity levels but mainly from the lack of information concerning the mercury content of some raw materials and the validity of assumptions regarding processes and technologies employed to reduce mercury emissions including their rates of application and effectiveness The accuracy and precision of measurement-based estimates can depend on the validity of extrapolating measurements made at infrequent intervals to longer periods or measurements made at one plant to other facilities with similar operations
Potentially important emissions sectors that are still not quantified in the emissions inventory include the use of mercury in vinyl-chloride monomer production secondary metals production oil and gas extraction transport and processing industrial and hazardous waste incineration and disposal sewage sludge incineration and dental fillings preparation and removal
Current measurements and their evaluation are inadequate for determining spatial and temporal trends Improved more extensive and better coordinated measurements are needed A permanent global integrated monitoring network for atmospheric mercury and mercury deposition is needed to achieve this goal The atmospheric network sites should be closely integrated with water soil and biological monitoring networks The results can be used for model testing and evaluation as well as for more accurately detailing the geographic impact of anthropogenic emissions Monitoring of mercury concentrations in the important marine food species is essential to understanding possible human health impacts and the effects of future emissions changes
Better data on mercury distribution in the troposphere is needed to improve understanding of long-range transport and source-receptor relationships Coordinated studies at high altitudes and by aircraft are needed This information will
also help validate regional and global scale models improving their prediction capabilities with regard to different policy scenarios
Key processes related to global transport and cycling of mercury remain inadequately understood The chemical form of gaseous oxidized mercury is unknown Reduction and oxidation rates for mercury in the presence of atmospheric oxidants need further study including determining which oxidants are important New measurements and modelling studies are needed to examine key chemical and physical processes that affect global transport and cycling
Few data are available for reporting mercury releases to aquatic systems Systematic and consistent monitoring of mercury releases to the air is required especially for contaminated systems Releases of mercury from soils into waters depend greatly on climate and topography and these parameters need to be better accounted for Consistent approaches for measuring and reporting releases from point sources are needed to ensure comparability of data from around the world In particular the actual role of artisanal and small-scale gold mining (ASGM) in emissions to air and releases to water needs to be more accurately estimated
The link between mercury deposition methylation and uptake by living organisms needs further study The parameters that determine the rates of exchange of mercury compounds between air and sea air and soil and air and vegetation are not fully understood Whole-ecosystem studies of mercury are needed to better understand biogeochemical cycling Methylationdemethylation rates and their spatial and temporal variations and relationship to climatic factors need to be determined in most of worldrsquos major ocean basins as well as in representative freshwaters
30
UNEP Global Mercury Assessment 2013
Key findings of the 2013 assessment 10 Atmosphere Total anthropogenic emissions of mercury to the atmosphere in 2010 are estimated at 1960 (1010shy4070) tonnes which is about 30 of the total mercury that was emitted and re-emitted from anthropogenic and natural sources in that year The largest anthropogenic sources are associated with artisanal and small-scale gold mining (ASGM) and coal burning which together account for about 62 of the annual total anthropogenic emissions to air Other major sectors include ferrous and non-ferrous metal production and cement production
East and Southeast Asia are responsible for about 40 of global anthropogenic emissions About 75 of the mercury from this region comes from China which is about one-third of the global total Increased estimates for emissions from ASGM largely a result of newly obtained data and improved information mean that South America and Sub-Saharan Africa are also responsible for a greater proportion of global emissions than was previously assumed
Anthropogenic emissions over time have increased mercury loads present in the environment This leads to higher rates of re-emission and also means that there will be a time lag of years or decades between emissions reductions and lower mercury levels in the food web including pathways of human exposure
Mercury emissions to the atmosphere likely peaked in the 1950s to 1970s and subsequently declined because of reductions in Europe Russia and North America Emission trends are unclear due to changes in methods employed to produce inventories and differences in the sectors that have been accounted at different times There are however some indications that emissions may be rising again with increases from East Asia offsetting continuing reductions in Europe and North America
Aquatic environments Natural processes in aquatic systems convert less toxic elemental and inorganic mercury into much more toxic methylmercury Methylmercury concentrates and accumulates in the food web leading to high concentrations in some species of seafood and fish that many people eat
Anthropogenic releases of mercury to aquatic environments contribute hundreds of tonnes to the amount of mercury cycling in the environment Diffuse releases and point sources appear equally important Atmospheric deposition however remains the most important input of mercury to land and oceans and has increased the amount of mercury in many environmental compartments by a factor of two or three since the start of the industrial age On land mercury that is deposited is largely retained in soils and vegetation increasing the available pool for re-mobilisation to adjacent aquatic systems Re-emission from soils however is a major addition to atmospheric mercury
Hydrology is the most important factor in the transport of mercury from catchments to downstream environments Relatively little of this mercury reaches the open ocean as most is captured in sediments behind dams in estuaries and near the coast Changes in land cover and land use can have a large effect on mercury mobilisation as exposed soils erode and mercury leaches into the water table
Concentrations of mercury in Arctic marine animals today are about 10-12 times higher than in preshyindustrial times (ie prior to about 1800) This means that on average about 92 of the mercury in marine predators such as seabirds seals and whales is anthropogenic in origin The timing of the increase suggest that 19th and early 20th century emissions from Europe North America and Russia were responsible Increases mercury concentrations in seabirds in the South China Sea appear to be more recent than the Arctic increases coinciding with increasing industrialisation in East and Southeast Asia
31
UNEP Global Mercury Assessment 2013
K+S Entsorgung Gm
bH
Recovered mercury is being stockpiled at long-term storage sites above- and as shown here below ground
The upper 100 meters of the oceans have twice the mercury that they did a century ago Intermediate and deeper waters have 10-25 more mercury on average reflecting the slow transport of mercury downwards in the oceans Seawater concentrations will thus be especially slow in responding to changes in mercury inputs from atmospheric deposition and river flow As a result mercury concentrations in marine biota are likely to increase slowly for decades to centuries even without an increase in atmospheric emissions
In freshwater ecosystems atmospheric deposition and re-mobilisation from soils slow the reduction of mercury levels even in regions where atmospheric concentrations have decreased due to emission controls
Further increases in atmospheric emissions will have long-term consequences for commercial fisheries and all consumers of marine and freshwater foods
It is likely to be years or decades before reductions in anthropogenic emissions and releases of mercury have a demonstrable effect on mercury levels throughout the environment and in the fish and marine mammals which are part of the human food-chain This only reinforces the need to act now to continue and strengthen international efforts to reduce current mercury emissions and releases Delays in action now will inevitably lead to slower recovery of the worldrsquos ecosystems in future from mercury contamination leaving an even greater legacy of pollution for future generations
32
Division of Technology Industry and Economics (DTIE) Chemicals Branch Geneva Switzerland January 2013
Job number DTI1636GE
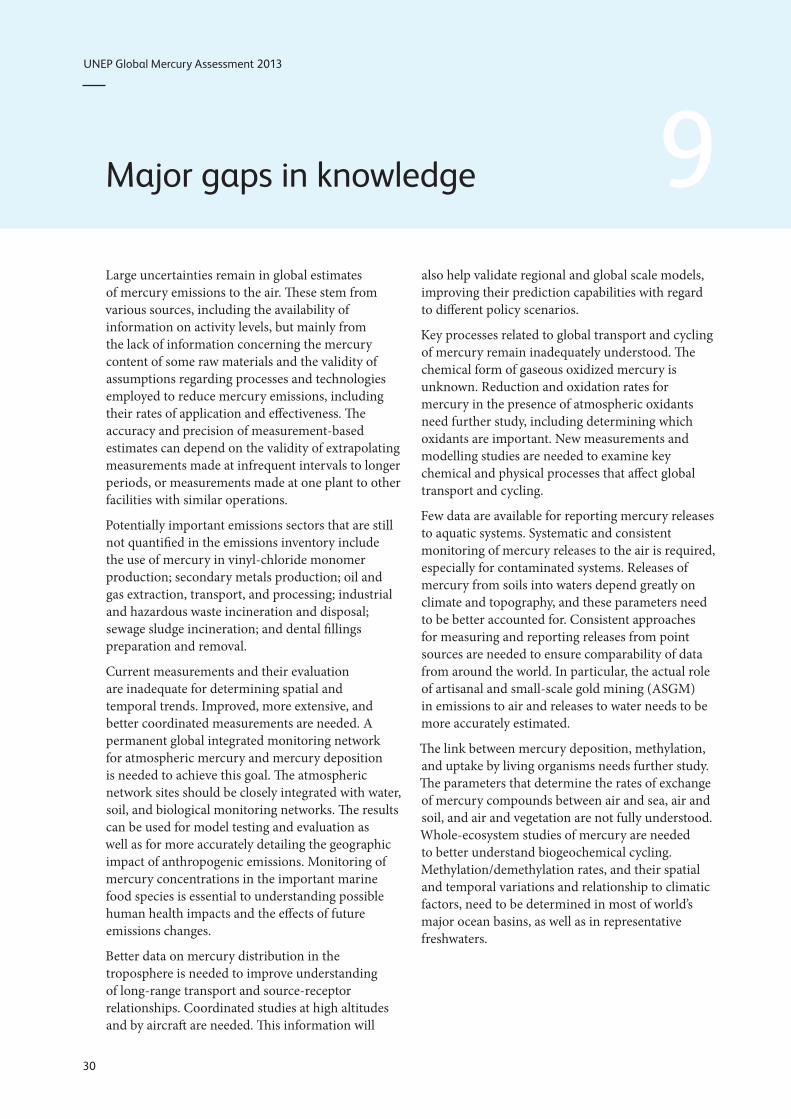
UNEP Global Mercury Assessment 2013
Major gaps in knowledge 9 Large uncertainties remain in global estimates of mercury emissions to the air These stem from various sources including the availability of information on activity levels but mainly from the lack of information concerning the mercury content of some raw materials and the validity of assumptions regarding processes and technologies employed to reduce mercury emissions including their rates of application and effectiveness The accuracy and precision of measurement-based estimates can depend on the validity of extrapolating measurements made at infrequent intervals to longer periods or measurements made at one plant to other facilities with similar operations
Potentially important emissions sectors that are still not quantified in the emissions inventory include the use of mercury in vinyl-chloride monomer production secondary metals production oil and gas extraction transport and processing industrial and hazardous waste incineration and disposal sewage sludge incineration and dental fillings preparation and removal
Current measurements and their evaluation are inadequate for determining spatial and temporal trends Improved more extensive and better coordinated measurements are needed A permanent global integrated monitoring network for atmospheric mercury and mercury deposition is needed to achieve this goal The atmospheric network sites should be closely integrated with water soil and biological monitoring networks The results can be used for model testing and evaluation as well as for more accurately detailing the geographic impact of anthropogenic emissions Monitoring of mercury concentrations in the important marine food species is essential to understanding possible human health impacts and the effects of future emissions changes
Better data on mercury distribution in the troposphere is needed to improve understanding of long-range transport and source-receptor relationships Coordinated studies at high altitudes and by aircraft are needed This information will
also help validate regional and global scale models improving their prediction capabilities with regard to different policy scenarios
Key processes related to global transport and cycling of mercury remain inadequately understood The chemical form of gaseous oxidized mercury is unknown Reduction and oxidation rates for mercury in the presence of atmospheric oxidants need further study including determining which oxidants are important New measurements and modelling studies are needed to examine key chemical and physical processes that affect global transport and cycling
Few data are available for reporting mercury releases to aquatic systems Systematic and consistent monitoring of mercury releases to the air is required especially for contaminated systems Releases of mercury from soils into waters depend greatly on climate and topography and these parameters need to be better accounted for Consistent approaches for measuring and reporting releases from point sources are needed to ensure comparability of data from around the world In particular the actual role of artisanal and small-scale gold mining (ASGM) in emissions to air and releases to water needs to be more accurately estimated
The link between mercury deposition methylation and uptake by living organisms needs further study The parameters that determine the rates of exchange of mercury compounds between air and sea air and soil and air and vegetation are not fully understood Whole-ecosystem studies of mercury are needed to better understand biogeochemical cycling Methylationdemethylation rates and their spatial and temporal variations and relationship to climatic factors need to be determined in most of worldrsquos major ocean basins as well as in representative freshwaters
30
UNEP Global Mercury Assessment 2013
Key findings of the 2013 assessment 10 Atmosphere Total anthropogenic emissions of mercury to the atmosphere in 2010 are estimated at 1960 (1010shy4070) tonnes which is about 30 of the total mercury that was emitted and re-emitted from anthropogenic and natural sources in that year The largest anthropogenic sources are associated with artisanal and small-scale gold mining (ASGM) and coal burning which together account for about 62 of the annual total anthropogenic emissions to air Other major sectors include ferrous and non-ferrous metal production and cement production
East and Southeast Asia are responsible for about 40 of global anthropogenic emissions About 75 of the mercury from this region comes from China which is about one-third of the global total Increased estimates for emissions from ASGM largely a result of newly obtained data and improved information mean that South America and Sub-Saharan Africa are also responsible for a greater proportion of global emissions than was previously assumed
Anthropogenic emissions over time have increased mercury loads present in the environment This leads to higher rates of re-emission and also means that there will be a time lag of years or decades between emissions reductions and lower mercury levels in the food web including pathways of human exposure
Mercury emissions to the atmosphere likely peaked in the 1950s to 1970s and subsequently declined because of reductions in Europe Russia and North America Emission trends are unclear due to changes in methods employed to produce inventories and differences in the sectors that have been accounted at different times There are however some indications that emissions may be rising again with increases from East Asia offsetting continuing reductions in Europe and North America
Aquatic environments Natural processes in aquatic systems convert less toxic elemental and inorganic mercury into much more toxic methylmercury Methylmercury concentrates and accumulates in the food web leading to high concentrations in some species of seafood and fish that many people eat
Anthropogenic releases of mercury to aquatic environments contribute hundreds of tonnes to the amount of mercury cycling in the environment Diffuse releases and point sources appear equally important Atmospheric deposition however remains the most important input of mercury to land and oceans and has increased the amount of mercury in many environmental compartments by a factor of two or three since the start of the industrial age On land mercury that is deposited is largely retained in soils and vegetation increasing the available pool for re-mobilisation to adjacent aquatic systems Re-emission from soils however is a major addition to atmospheric mercury
Hydrology is the most important factor in the transport of mercury from catchments to downstream environments Relatively little of this mercury reaches the open ocean as most is captured in sediments behind dams in estuaries and near the coast Changes in land cover and land use can have a large effect on mercury mobilisation as exposed soils erode and mercury leaches into the water table
Concentrations of mercury in Arctic marine animals today are about 10-12 times higher than in preshyindustrial times (ie prior to about 1800) This means that on average about 92 of the mercury in marine predators such as seabirds seals and whales is anthropogenic in origin The timing of the increase suggest that 19th and early 20th century emissions from Europe North America and Russia were responsible Increases mercury concentrations in seabirds in the South China Sea appear to be more recent than the Arctic increases coinciding with increasing industrialisation in East and Southeast Asia
31
UNEP Global Mercury Assessment 2013
K+S Entsorgung Gm
bH
Recovered mercury is being stockpiled at long-term storage sites above- and as shown here below ground
The upper 100 meters of the oceans have twice the mercury that they did a century ago Intermediate and deeper waters have 10-25 more mercury on average reflecting the slow transport of mercury downwards in the oceans Seawater concentrations will thus be especially slow in responding to changes in mercury inputs from atmospheric deposition and river flow As a result mercury concentrations in marine biota are likely to increase slowly for decades to centuries even without an increase in atmospheric emissions
In freshwater ecosystems atmospheric deposition and re-mobilisation from soils slow the reduction of mercury levels even in regions where atmospheric concentrations have decreased due to emission controls
Further increases in atmospheric emissions will have long-term consequences for commercial fisheries and all consumers of marine and freshwater foods
It is likely to be years or decades before reductions in anthropogenic emissions and releases of mercury have a demonstrable effect on mercury levels throughout the environment and in the fish and marine mammals which are part of the human food-chain This only reinforces the need to act now to continue and strengthen international efforts to reduce current mercury emissions and releases Delays in action now will inevitably lead to slower recovery of the worldrsquos ecosystems in future from mercury contamination leaving an even greater legacy of pollution for future generations
32
Division of Technology Industry and Economics (DTIE) Chemicals Branch Geneva Switzerland January 2013
Job number DTI1636GE
UNEP Global Mercury Assessment 2013
Key findings of the 2013 assessment 10 Atmosphere Total anthropogenic emissions of mercury to the atmosphere in 2010 are estimated at 1960 (1010shy4070) tonnes which is about 30 of the total mercury that was emitted and re-emitted from anthropogenic and natural sources in that year The largest anthropogenic sources are associated with artisanal and small-scale gold mining (ASGM) and coal burning which together account for about 62 of the annual total anthropogenic emissions to air Other major sectors include ferrous and non-ferrous metal production and cement production
East and Southeast Asia are responsible for about 40 of global anthropogenic emissions About 75 of the mercury from this region comes from China which is about one-third of the global total Increased estimates for emissions from ASGM largely a result of newly obtained data and improved information mean that South America and Sub-Saharan Africa are also responsible for a greater proportion of global emissions than was previously assumed
Anthropogenic emissions over time have increased mercury loads present in the environment This leads to higher rates of re-emission and also means that there will be a time lag of years or decades between emissions reductions and lower mercury levels in the food web including pathways of human exposure
Mercury emissions to the atmosphere likely peaked in the 1950s to 1970s and subsequently declined because of reductions in Europe Russia and North America Emission trends are unclear due to changes in methods employed to produce inventories and differences in the sectors that have been accounted at different times There are however some indications that emissions may be rising again with increases from East Asia offsetting continuing reductions in Europe and North America
Aquatic environments Natural processes in aquatic systems convert less toxic elemental and inorganic mercury into much more toxic methylmercury Methylmercury concentrates and accumulates in the food web leading to high concentrations in some species of seafood and fish that many people eat
Anthropogenic releases of mercury to aquatic environments contribute hundreds of tonnes to the amount of mercury cycling in the environment Diffuse releases and point sources appear equally important Atmospheric deposition however remains the most important input of mercury to land and oceans and has increased the amount of mercury in many environmental compartments by a factor of two or three since the start of the industrial age On land mercury that is deposited is largely retained in soils and vegetation increasing the available pool for re-mobilisation to adjacent aquatic systems Re-emission from soils however is a major addition to atmospheric mercury
Hydrology is the most important factor in the transport of mercury from catchments to downstream environments Relatively little of this mercury reaches the open ocean as most is captured in sediments behind dams in estuaries and near the coast Changes in land cover and land use can have a large effect on mercury mobilisation as exposed soils erode and mercury leaches into the water table
Concentrations of mercury in Arctic marine animals today are about 10-12 times higher than in preshyindustrial times (ie prior to about 1800) This means that on average about 92 of the mercury in marine predators such as seabirds seals and whales is anthropogenic in origin The timing of the increase suggest that 19th and early 20th century emissions from Europe North America and Russia were responsible Increases mercury concentrations in seabirds in the South China Sea appear to be more recent than the Arctic increases coinciding with increasing industrialisation in East and Southeast Asia
31
UNEP Global Mercury Assessment 2013
K+S Entsorgung Gm
bH
Recovered mercury is being stockpiled at long-term storage sites above- and as shown here below ground
The upper 100 meters of the oceans have twice the mercury that they did a century ago Intermediate and deeper waters have 10-25 more mercury on average reflecting the slow transport of mercury downwards in the oceans Seawater concentrations will thus be especially slow in responding to changes in mercury inputs from atmospheric deposition and river flow As a result mercury concentrations in marine biota are likely to increase slowly for decades to centuries even without an increase in atmospheric emissions
In freshwater ecosystems atmospheric deposition and re-mobilisation from soils slow the reduction of mercury levels even in regions where atmospheric concentrations have decreased due to emission controls
Further increases in atmospheric emissions will have long-term consequences for commercial fisheries and all consumers of marine and freshwater foods
It is likely to be years or decades before reductions in anthropogenic emissions and releases of mercury have a demonstrable effect on mercury levels throughout the environment and in the fish and marine mammals which are part of the human food-chain This only reinforces the need to act now to continue and strengthen international efforts to reduce current mercury emissions and releases Delays in action now will inevitably lead to slower recovery of the worldrsquos ecosystems in future from mercury contamination leaving an even greater legacy of pollution for future generations
32
Division of Technology Industry and Economics (DTIE) Chemicals Branch Geneva Switzerland January 2013
Job number DTI1636GE
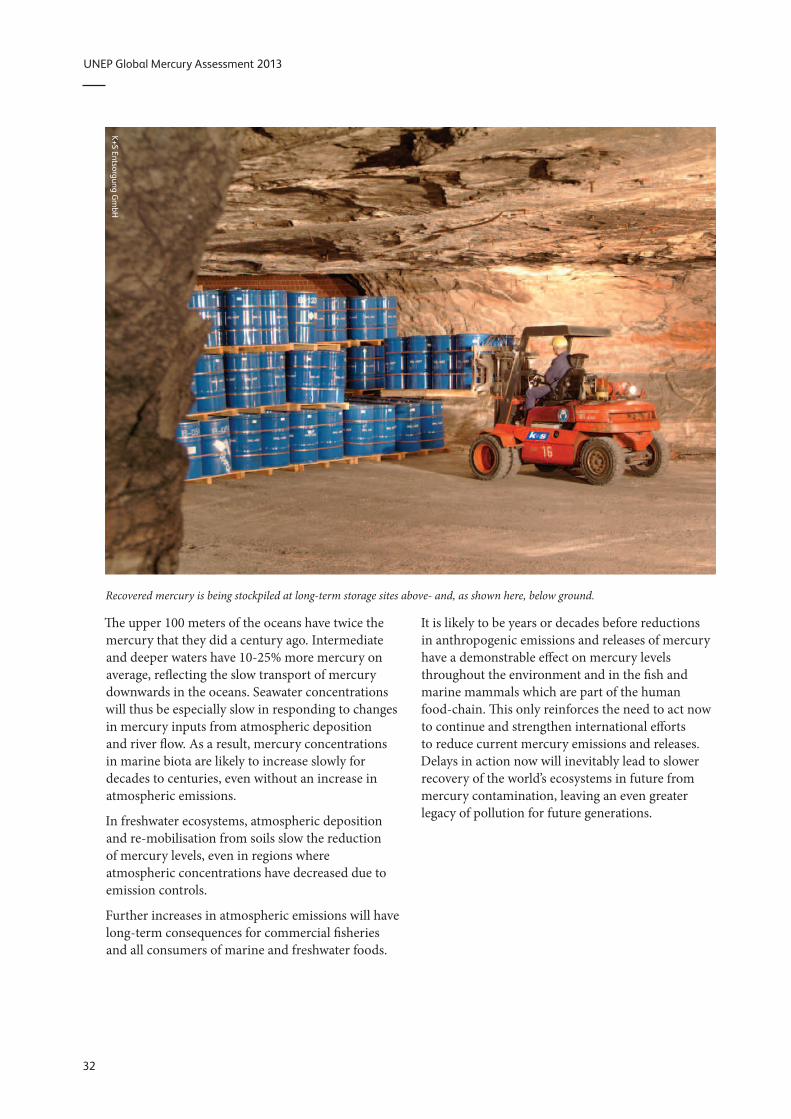

Division of Technology Industry and Economics (DTIE) Chemicals Branch Geneva Switzerland January 2013
Job number DTI1636GE