GLOBAL M&A MARKET REVIEW · Partners LP-Deal Type. Global M&A: Deal Type Breakdown. Multiple...
17
GLOBAL M&A MARKET REVIEW FINANCIAL RANKINGS 1Q 2018
Transcript of GLOBAL M&A MARKET REVIEW · Partners LP-Deal Type. Global M&A: Deal Type Breakdown. Multiple...

GLOBAL M&A MARKET REVIEW FINANCIAL RANKINGS 1Q 2018

CONTENTS
1. Introduction2. Global M&A Heat Map3. Global M&A Regional Review4. Global M&A League Tables5. Americas M&A Regional Review6. Americas M&A League Tables8. EMEA M&A Regional Review9. EMEA M&A League Tables12. APAC M&A Regional Review13. APAC M&A League Tables16. Disclaimer
DATA SUBMISSIONS AND QUERIES
North America
EMEA
Asia Pacific
Contact Nageen Qasim
Madeeha Ahmad
Sayaka Sakashita
Phone +1-646-324-2878
+44-20-3525-3754
+81-3-3201-2198
Email [email protected]
General M&A queries may be submitted to: [email protected], [email protected], [email protected]
The Bloomberg M&A Advisory League Tables are the definitive publication of M&A advisory rankings. The tables represent the top financial and legal advisors across a broad array of deal types, regions, and industry sectors. The rankings data is comprised of mergers, acquisitions, divestitures, spin-offs, debt-for-equity-swaps, joint ventures, private placements of common equity and convertible securities, and the cash injection component of recapitalization according to Bloomberg standards.
Bloomberg M&A delivers real-time coverage of the M&A market from nine countries around the world. We provide a global perspective and local insight into unique deal structures in various markets through a network of over 800 financial and legal advisory firms, ensuring an accurate reflection of key market trends. Our quarterly league table rankings are a leading benchmark for legal and financial advisory performance, and our Bloomberg Brief newsletter provides summary highlights of weekly M&A activity and top deal trends.
Visit {NI LEAG CRL <GO>} to download copies of the final release and a full range of market specific league table results. On the web, visit: http://www.bloomberg.com/professional/solutions/investment-banking/.
Due to the dynamic nature of the Professional Service product, league table rankings may vary between this release and data found on the Bloomberg Professional Service.
Q1 2018
GLOBAL M&A FINANCIAL ADVISORY RANKINGS
©2018 Bloomberg Finance L.P. All rights reserved.

Global M&A Heat Map
Deal volume and adviser market share for any regional involvement (target, seller, or acquirer) for 1Q 2018.
North AmericaUSD 589.3B1. Morgan Stanley 34.8%2. JPMorgan Chase & Co 27.5%3. Goldman Sachs & Co 25.1%
Latin AmericaUSD 43.7B1.Bank of America Merri l l Lynch 37.2%2. JPMorgan Chase & Co 34.9%3. Banco Itau BBA 34.3%
Western Europe USD 285.1B1. JPMorgan Chase & Co 39.3%2. Lazard Ltd 19.4%3. Ci tigroup Inc 18.8%
Eastern Europe USD 18.2B 1. LionTree Advisors LLC 18.9%
2. BNP Paribas SA 18.9% 3. Barclays PLC 18.9%
Asia PacificUSD 297.5B1. Morgan Stanley 16.7%2. JPMorgan Chase & Co 14.4%3. Lazard Ltd 12.8%
Middle East & AfricaUSD 27.4B1. JPMorgan Chase & Co 31.3%2. Rothschi ld & Co 22.5%3. Lazard Ltd 20.0%
2

Date
Total
Value
Amount
(Bln.) % of Total
% YoY
Change
Number of deals 10,330 Consumer Non-cyclical $253.0 26.6% 69.5%
Volume (Bln.) $936.7 Financial $209.9 22.0% 18.3%
Avg Deal Size (Mln.) $90.6 Technology $91.2 9.6% 149.6%
Consumer Cyclical $87.8 9.2% 1.1%
Industrial $76.2 8.0% 4.6%
Morgan Stanley Energy $73.0 7.7% -44.3%
Number of deals 75 Communications $67.7 7.1% 32.9%
Volume (Bln.) $248.9 Basic Materials $48.3 5.1% 144.3%
Avg Deal Size (Bln.) $3.3 Utilities $43.7 4.6% 36.1%
Diversified $1.4 0.1% -69.6%
Amount
(Bln.)
% Change
Deal Count
% Change
Volume
Company Takeover $540.6 -6.0% 41.7%
Cross Border $399.2 -5.2% 0.3%
Private Equity $215.7 -1.6% 12.0%
Asset sale $177.4 -10.7% 2.8%
Tender Offer $81.4 -31.5% -19.6%
Venture Capital $47.6 6.5% 90.3%
Spin-off $12.9 47.9% 129.1%
Minority purchase $135.1 6.3% 41.8%
Majority purchase $73.4 -2.0% 9.6%
Quarterly Volume represents any involvement (target, seller, or acquirer).
Global M&A: Industry Breakdown
Glo
bal
M&
A R
evie
w |
Q1
20
18
Global M&A Regional Review Global M&A: Premium Breakdown
Global M&A: Highlights of Q1 2018
Summary IndustryAcquirerTarget Seller
Express Scripts Holding Co Cigna Corp -
Global M&A: Quarterly Volume
3/5/2018
Top Adviser
$15,200.6XL Group Ltd AXA SA -
Thomson
Reuters Corp
Financial data unit/Thomson
Reuters Corp
1/29/2018 $23,167.7
1/29/2018 $17,000.0
Dr Pepper Snapple Group Inc Keurig Green Mountain Inc
3/8/2018 $68,375.7
3/27/2018 $27,760.8GGP IncBrookfield Property
Partners LP-
Deal Type
Global M&A: Deal Type Breakdown
Multiple Acquirers
0
1,000
2,000
3,000
4,000
5,000
6,000
$0
$200
$400
$600
$800
$1,000
2013 Q1 2014 Q1 2015 Q1 2016 Q1 2017 Q1 2018 Q1
Volume $(Bln.) Deal Count
16%
27% 45%
8%
3% 1% 0-10%
10-25%
25-50%
50-75%
75-100%
100%+
• Global merger and acquisition activity reached $936.8 billion in 1Q2018, representing an increaseof 24.9% compared to the same period last year.
• Private equity transactions reached a 1Q2018 volume of $215.7 billion, accounting for 23.0% of theglobal volume for the period. GIC Pte Ltd, Canada Pension Plan Investment Board, and BlackstoneGroup's pending acquisition of Thomson Reuters Corp's financial data unit for $17.0 billion was thelargest announced private equity deal of the quarter.
• M&A deals targeting the technology sector increased 149.7% in volume year‐on‐year to $91.3billion. Fujifilm Holdings Corp's pending acquisition of a majority stake in Xerox Corp for $10.32billion was the largest deal in this sector.
3
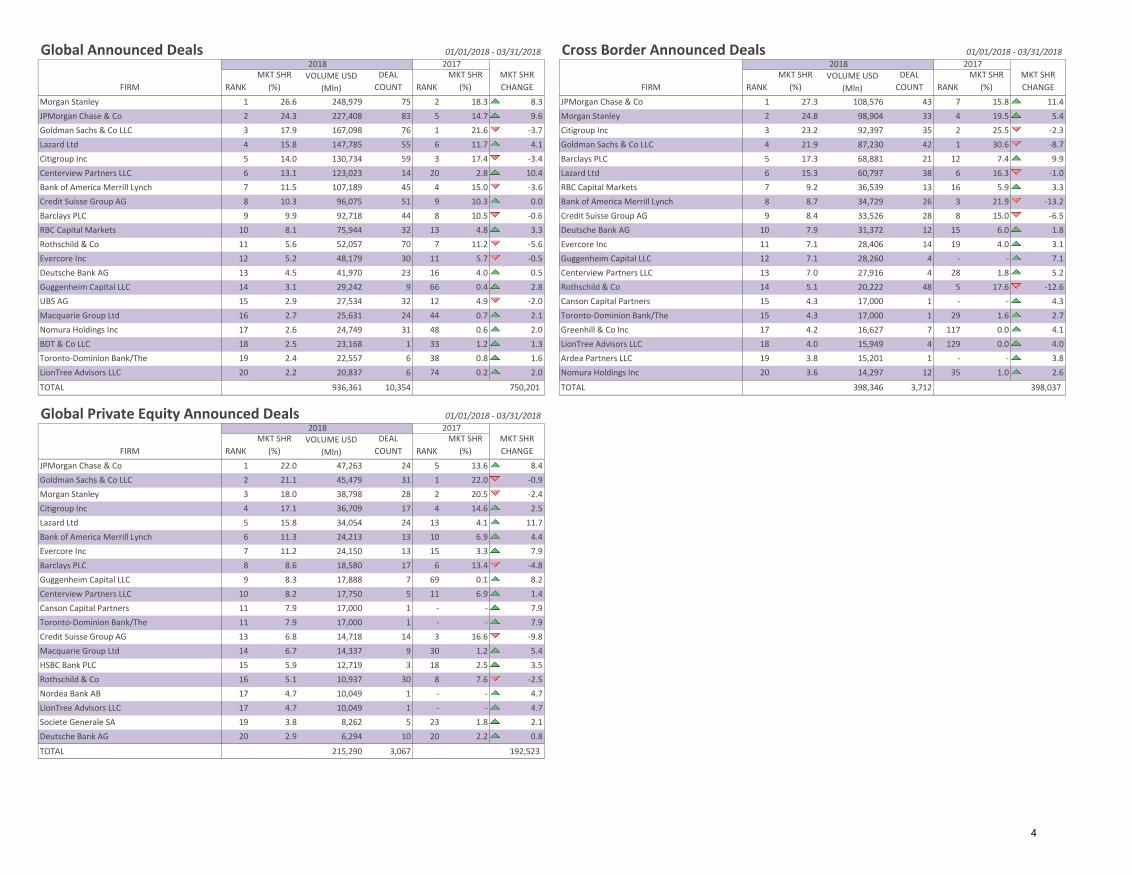
Global Announced Deals 01/01/2018 - 03/31/2018 Cross Border Announced Deals 01/01/2018 - 03/31/2018
Morgan Stanley 1 26.6 248,979 75 2 18.3 8.3 JPMorgan Chase & Co 1 27.3 108,576 43 7 15.8 11.4
JPMorgan Chase & Co 2 24.3 227,408 83 5 14.7 9.6 Morgan Stanley 2 24.8 98,904 33 4 19.5 5.4
Goldman Sachs & Co LLC 3 17.9 167,098 76 1 21.6 -3.7 Citigroup Inc 3 23.2 92,397 35 2 25.5 -2.3
Lazard Ltd 4 15.8 147,785 55 6 11.7 4.1 Goldman Sachs & Co LLC 4 21.9 87,230 42 1 30.6 -8.7
Citigroup Inc 5 14.0 130,734 59 3 17.4 -3.4 Barclays PLC 5 17.3 68,881 21 12 7.4 9.9
Centerview Partners LLC 6 13.1 123,023 14 20 2.8 10.4 Lazard Ltd 6 15.3 60,797 38 6 16.3 -1.0
Bank of America Merrill Lynch 7 11.5 107,189 45 4 15.0 -3.6 RBC Capital Markets 7 9.2 36,539 13 16 5.9 3.3
Credit Suisse Group AG 8 10.3 96,075 51 9 10.3 0.0 Bank of America Merrill Lynch 8 8.7 34,729 26 3 21.9 -13.2
Barclays PLC 9 9.9 92,718 44 8 10.5 -0.6 Credit Suisse Group AG 9 8.4 33,526 28 8 15.0 -6.5
RBC Capital Markets 10 8.1 75,944 32 13 4.8 3.3 Deutsche Bank AG 10 7.9 31,372 12 15 6.0 1.8
Rothschild & Co 11 5.6 52,057 70 7 11.2 -5.6 Evercore Inc 11 7.1 28,406 14 19 4.0 3.1
Evercore Inc 12 5.2 48,179 30 11 5.7 -0.5 Guggenheim Capital LLC 12 7.1 28,260 4 - - 7.1
Deutsche Bank AG 13 4.5 41,970 23 16 4.0 0.5 Centerview Partners LLC 13 7.0 27,916 4 28 1.8 5.2
Guggenheim Capital LLC 14 3.1 29,242 9 66 0.4 2.8 Rothschild & Co 14 5.1 20,222 48 5 17.6 -12.6
UBS AG 15 2.9 27,534 32 12 4.9 -2.0 Canson Capital Partners 15 4.3 17,000 1 - - 4.3
Macquarie Group Ltd 16 2.7 25,631 24 44 0.7 2.1 Toronto-Dominion Bank/The 15 4.3 17,000 1 29 1.6 2.7
Nomura Holdings Inc 17 2.6 24,749 31 48 0.6 2.0 Greenhill & Co Inc 17 4.2 16,627 7 117 0.0 4.1
BDT & Co LLC 18 2.5 23,168 1 33 1.2 1.3 LionTree Advisors LLC 18 4.0 15,949 4 129 0.0 4.0
Toronto-Dominion Bank/The 19 2.4 22,557 6 38 0.8 1.6 Ardea Partners LLC 19 3.8 15,201 1 - - 3.8
LionTree Advisors LLC 20 2.2 20,837 6 74 0.2 2.0 Nomura Holdings Inc 20 3.6 14,297 12 35 1.0 2.6
TOTAL 936,361 10,354 TOTAL 398,346 3,712
Global Private Equity Announced Deals 01/01/2018 - 03/31/2018
JPMorgan Chase & Co 1 22.0 47,263 24 5 13.6 8.4
Goldman Sachs & Co LLC 2 21.1 45,479 31 1 22.0 -0.9
Morgan Stanley 3 18.0 38,798 28 2 20.5 -2.4
Citigroup Inc 4 17.1 36,709 17 4 14.6 2.5
Lazard Ltd 5 15.8 34,054 24 13 4.1 11.7
Bank of America Merrill Lynch 6 11.3 24,213 13 10 6.9 4.4
Evercore Inc 7 11.2 24,150 13 15 3.3 7.9
Barclays PLC 8 8.6 18,580 17 6 13.4 -4.8
Guggenheim Capital LLC 9 8.3 17,888 7 69 0.1 8.2
Centerview Partners LLC 10 8.2 17,750 5 11 6.9 1.4
Canson Capital Partners 11 7.9 17,000 1 - - 7.9
Toronto-Dominion Bank/The 11 7.9 17,000 1 - - 7.9
Credit Suisse Group AG 13 6.8 14,718 14 3 16.6 -9.8
Macquarie Group Ltd 14 6.7 14,337 9 30 1.2 5.4
HSBC Bank PLC 15 5.9 12,719 3 18 2.5 3.5
Rothschild & Co 16 5.1 10,937 30 8 7.6 -2.5
Nordea Bank AB 17 4.7 10,049 1 - - 4.7
LionTree Advisors LLC 17 4.7 10,049 1 - - 4.7
Societe Generale SA 19 3.8 8,262 5 23 1.8 2.1
Deutsche Bank AG 20 2.9 6,294 10 20 2.2 0.8
TOTAL 215,290 3,067
398,037
FIRM
2018 2017MKT SHR
CHANGE
FIRM
RANK
MKT SHR
(%)VOLUME USD
(Mln)
DEAL
COUNT RANK
MKT SHR
(%)
750,201
2017MKT SHR
CHANGERANK
MKT SHR
(%)VOLUME USD
(Mln)
DEAL
COUNT RANK
MKT SHR
(%) RANK
2018 2017MKT SHR
CHANGE FIRM
2018MKT SHR
(%)VOLUME USD
(Mln)
DEAL
COUNT RANK
MKT SHR
(%)
192,523
4

Country
United States $451.3 87.5% 57.9%
Canada $22.2 4.3% -46.0%
Brazil $16.7 3.2% 18.4%
Bermuda $16.1 3.1% 75506.1%
Chile $3.5 0.7% 326.1%
British Virgin Islands $1.1 0.2% -54.2%
Colombia $0.5 0.1% 1368.5%
Mexico $0.4 0.1% -72.8%
Date
Total Value
(Mln.)
Amount
(Bln.) % of Total
% YoY
Change
Number of deals 4,436 Consumer Non-cyclical $181.6 35.1% 134.8%
Volume (Bln.) $515.9 Financial $107.5 20.7% 76.0%
Avg Deal Size (Mln.) $116.0 Technology $60.4 11.7% 175.7%
Energy $46.4 9.0% -51.9%
Industrial $35.1 6.8% 52.1%
Morgan Stanley Utilities $22.7 4.4% 26.1%
Number of deals 43 Basic Materials $21.7 4.2% 427.3%
Volume (Bln.) $216.8 Consumer Cyclical $21.6 4.2% -28.2%
Avg Deal Size (Bln.) $5.0 Communications $20.8 4.0% 15.0%
Diversified $0.3 0.1% 211.2%
Amount
(Bln.)
% Change
Deal Count
% Change
Volume
Company Takeover $355.2 -2.9% 75.3%
Cross Border $168.3 -1.6% 4.6%
Private Equity $107.3 5.5% 7.2%
Asset sale $79.8 -12.7% -14.3%
Tender Offer $29.8 -58.3% -17.5%
Venture Capital $21.2 13.5% 53.9%
Spin-off $8.0 25.0% 292.9%
Minority purchase $49.6 13.4% 104.6%
Majority purchase $29.4 -2.1% 200.7%
Quarterly Volume represents any involvement (target, seller, or acquirer).
Glo
bal
M&
A R
evi
ew |
Q1
20
18
3/8/2018 Express Scripts Holding Co Cigna Corp - $68,375.7
Americas M&A Regional Review Americas M&A: Country Breakdown
Americas M&A: Highlights of Q1 2018
Summary Target Acquirer Seller Industry
Americas M&A: Industry Breakdown
Amount
(Bln.) % of Total
% YoY
Change
Top Adviser1/29/2018 Dr Pepper Snapple Group Inc Keurig Green Mountain Inc -
$23,167.7
3/27/2018 GGP IncBrookfield Property Partners
LP- $27,760.8
1/29/2018Financial data unit/Thomson
Reuters CorpMultiple Acquirers
Thomson
Reuters
Corp
$17,000.0
3/5/2018 XL Group Ltd AXA SA - $15,200.6
Americas M&A: Quarterly Volume Americas M&A: Deal Type Breakdown
Deal Type
0
1000
2000
3000
4000
5000
6000
$0
$200
$400
$600
$800
$1,000
2013 Q1 2014 Q1 2015 Q1 2016 Q1 2017 Q1 2018 Q1
Volume $(Bln.) Deal Count
• In 1Q2018, M&A activity in the Americas increased by 48.7% to $515.8 billion compared to thesame period last year. The Americas continued to be the most sought after region accounting for55.1% of the global volume.
• The consumer non-cyclical industry was the most targeted in the Americas during 1Q2018,experiencing an increase of 134.8% in volume year-over-year. The pending acquisition of ExpressScripts Holding Co by Cigna Corp for $68.4 billion was the largest announced deal both in the sectorand globally.
• Morgan Stanley and Skadden Arps Slate Meagher & Flom LLP ranked as the top Financial and LegalAdviser in 1Q2018 for the region with a market share of 42.0% & 29.4% respectively.
5

US Announced Deals (Any Involvement) 01/01/2018 - 03/31/2018 US Announced Deals (Target or Seller) 01/01/2018 - 03/31/2018
Morgan Stanley 1 34.4 189,788 49 2 25.1 9.3 Morgan Stanley 1 39.6 186,222 39 2 29.8 9.8
JPMorgan Chase & Co 2 26.5 146,038 56 4 18.6 7.9 Goldman Sachs & Co LLC 2 28.8 135,190 49 1 29.8 -1.1
Goldman Sachs & Co LLC 3 26.0 143,529 58 1 28.8 -2.8 Lazard Ltd 3 23.9 112,443 21 9 7.4 16.5
Lazard Ltd 4 23.8 131,020 27 8 13.3 10.5 JPMorgan Chase & Co 4 23.6 111,085 45 3 22.4 1.3
Centerview Partners LLC 5 20.0 110,271 11 16 5.0 15.0 Centerview Partners LLC 5 23.5 110,271 11 13 6.2 17.3
Citigroup Inc 6 16.6 91,365 35 3 19.5 -2.9 Citigroup Inc 6 16.4 77,074 29 5 13.4 3.0
Credit Suisse Group AG 7 14.2 78,278 30 7 14.9 -0.7 Credit Suisse Group AG 7 14.8 69,750 25 16 3.8 11.0
Barclays PLC 8 13.1 72,353 36 6 15.3 -2.2 Bank of America Merrill Lynch 8 13.8 64,842 19 6 12.1 1.7
Bank of America Merrill Lynch 9 11.9 65,332 24 5 17.5 -5.6 Barclays PLC 9 12.0 56,187 29 4 18.0 -6.0
RBC Capital Markets 10 10.4 57,467 24 10 7.9 2.5 RBC Capital Markets 10 11.6 54,611 23 8 8.9 2.7
Evercore Inc 11 8.7 48,179 29 9 9.5 -0.7 Deutsche Bank AG 11 7.8 36,419 14 11 7.0 0.7
Deutsche Bank AG 12 6.7 36,668 15 14 5.9 0.8 Guggenheim Capital LLC 12 6.2 29,119 7 42 0.8 5.4
Guggenheim Capital LLC 13 5.3 29,119 7 45 0.6 4.6 Evercore Inc 13 5.1 24,060 23 7 10.4 -5.3
BDT & Co LLC 14 4.2 23,168 1 21 2.1 2.1 BDT & Co LLC 14 4.9 23,168 1 20 2.6 2.3
Rothschild & Co 15 3.3 17,929 23 12 6.2 -3.0 Canson Capital Partners 15 3.6 17,000 1 - - 3.6
Canson Capital Partners 16 3.1 17,000 1 - - 3.1 Toronto-Dominion Bank/The 15 3.6 17,000 1 24 1.9 1.8
Toronto-Dominion Bank/The 16 3.1 17,000 1 26 1.5 1.6 Moelis & Co 17 3.2 15,254 19 19 3.1 0.2
Moelis & Co 18 2.8 15,254 19 13 6.0 -3.2 Jefferies LLC 18 2.6 12,157 23 21 2.4 0.2
HSBC Bank PLC 19 2.5 13,663 4 15 5.9 -3.4 Macquarie Group Ltd 19 2.5 11,963 9 44 0.8 1.8
Jefferies LLC 20 2.4 13,242 26 22 2.0 0.5 Tudor Pickering Holt & Co LLC 20 2.5 11,815 6 72 0.1 2.4
TOTAL 551,524 4,719 TOTAL 470,221 3,892
Canada Announced Deals (Any Involvement) 01/01/2018 - 03/31/2018 Canada Announced Deals (Target or Seller) 01/01/2018 - 03/31/2018
Goldman Sachs & Co LLC 1 36.5 22,715 3 2 34.4 2.2 Goldman Sachs & Co LLC 1 53.9 22,715 3 3 35.9 18.0
Toronto-Dominion Bank/The 2 36.3 22,557 6 13 7.2 29.1 Toronto-Dominion Bank/The 2 53.6 22,557 6 - - 53.6
Citigroup Inc 3 32.7 20,337 5 7 15.9 16.8 Citigroup Inc 3 47.1 19,855 2 7 16.9 30.3
JPMorgan Chase & Co 4 29.7 18,463 6 1 48.5 -18.9 Morgan Stanley 4 42.8 18,041 2 9 8.8 34.0
Morgan Stanley 5 29.0 18,041 4 8 14.5 14.5 JPMorgan Chase & Co 5 41.4 17,456 3 1 53.5 -12.0
Bank of America Merrill Lynch 6 27.8 17,257 4 11 8.7 19.0 Centerview Partners LLC 6 40.4 17,000 1 - - 40.4
Centerview Partners LLC 7 27.3 17,000 1 14 6.6 20.7 Canson Capital Partners 6 40.4 17,000 1 - - 40.4
Canson Capital Partners 7 27.3 17,000 1 - - 27.3 Guggenheim Capital LLC 6 40.4 17,000 1 - - 40.4
Guggenheim Capital LLC 7 27.3 17,000 1 - - 27.3 Bank of America Merrill Lynch 6 40.4 17,000 1 11 8.1 32.3
Lazard Ltd 10 18.6 11,582 6 6 16.5 2.2 Lazard Ltd 10 25.7 10,822 2 8 15.3 10.4
BMO Capital Markets Corp/Toronto 11 16.8 10,465 10 16 6.1 10.7 RBC Capital Markets 11 23.6 9,950 9 4 34.3 -10.7
RBC Capital Markets 12 16.0 9,950 9 3 27.1 -11.1 BMO Capital Markets Corp/Toronto 12 13.9 5,865 8 15 3.1 10.8
Barclays PLC 13 11.7 7,261 3 4 26.5 -14.8 Greenhill & Co Inc 13 6.8 2,855 1 - - 6.8
Credit Suisse Group AG 14 10.1 6,302 4 10 9.1 1.0 Bank of Nova Scotia/The 14 6.8 2,845 10 6 22.5 -15.7
CIBC 15 5.2 3,238 11 18 4.9 0.4 CIBC 15 6.6 2,789 9 12 8.0 -1.4
Greenhill & Co Inc 16 4.6 2,855 1 48 0.1 4.5 GMP Securities LP 16 3.5 1,465 4 28 0.3 3.2
Bank of Nova Scotia/The 17 4.6 2,845 10 9 13.6 -9.0 Credit Suisse Group AG 17 3.4 1,445 2 13 6.8 -3.4
GMP Securities LP 18 2.4 1,465 4 44 0.2 2.2 Canaccord Genuity Corp 18 2.0 858 5 35 0.1 2.0
Macquarie Group Ltd 19 1.6 1,008 5 24 2.3 -0.7 PowerOne Capital Markets Ltd 19 1.8 748 1 - - 1.8
Canaccord Genuity Corp 20 1.4 858 5 53 0.0 1.3 Macquarie Group Ltd 20 1.6 654 1 14 3.8 -2.2
TOTAL 62,198 876 TOTAL 42,120 583
FIRM
2018 2017MKT SHR
CHANGE FIRM
2018 2017MKT SHR
CHANGERANK
MKT SHR
(%)VOLUME USD
(Mln)
DEAL
COUNT RANK
MKT SHR
(%) RANK
MKT SHR
(%)VOLUME USD
(Mln)
DEAL
COUNT RANK
MKT SHR
(%)
RANK
MKT SHR
(%)VOLUME USD
(Mln)
DEAL
COUNT RANK
MKT SHR
(%) RANK
MKT SHR
(%)
DEAL
COUNT RANK
MKT SHR
(%)FIRM
2018 2017MKT SHR
CHANGE FIRM
2018 2017
VOLUME USD
(Mln)
MKT SHR
CHANGE
421,666 337,510
87,873 53,284
6

Latin America Announced Deals (Any Involvement) 01/01/2018 - 03/31/2018 Brazil Announced Deals (Any Involvement) 01/01/2018 - 03/31/2018
Bank of America Merrill Lynch 1 59.6 16,052 7 3 18.8 40.8 Bank of America Merrill Lynch 1 86.8 15,219 4 1 25.6 61.2
JPMorgan Chase & Co 2 56.7 15,266 3 28 - 56.7 Banco Itau BBA SA 2 85.6 15,017 7 7 8.3 77.3
Banco Itau BBA SA 3 55.8 15,017 7 9 6.1 49.6 Riza Capital Consultoria de Investimentos 3 82.9 14,544 2 - - 82.9
Riza Capital Consultoria de Investimentos 4 54.0 14,544 2 - - 54.0 Morgan Stanley 4 81.9 14,362 1 5 17.5 64.4
Morgan Stanley 5 53.3 14,362 2 1 23.1 30.2 JPMorgan Chase & Co 4 81.9 14,362 1 - - 81.9
Citigroup Inc 6 8.5 2,275 5 - - 8.5 Goldman Sachs & Co LLC 6 4.0 693 2 11 1.5 2.4
Lazard Ltd 7 5.2 1,395 5 14 1.6 3.6 Vinci Partners Investimentos Ltda 7 2.8 489 1 22 - 2.8
Goldman Sachs & Co LLC 8 4.7 1,270 5 17 1.1 3.6 Banco BTG Pactual SA 8 1.7 290 2 3 20.2 -18.6
GBS Finanzas SA 9 4.2 1,120 1 - - 4.2 Credit Suisse Group AG 9 1.5 257 1 6 8.7 -7.2
Deutsche Bank AG 9 4.2 1,120 1 - - 4.2 XP Investimentos Corretora de Cambio Ti 10 0.1 22 1 - - 0.1
Credit Suisse Group AG 11 3.1 840 2 4 17.6 -14.5 Artica Participacoes e Assessoria Financei 11 - - 3 22 - -
Banco BTG Pactual SA 12 2.1 563 3 5 15.0 -12.9 Lazard Ltd 11 - - 2 - - -
Vinci Partners Investimentos Ltda 13 1.8 489 1 28 - 1.8 Banco Bradesco BBI SA 11 - - 1 4 18.7 -18.7
Rothschild & Co 14 1.6 421 3 16 1.2 0.4 Broadspan Asset Management LLC 11 - - 1 - - -
Greenhill & Co Inc 15 1.1 284 1 - - 1.1 Azevedo Sette Advogados 11 - - 1 - - -
XP Investimentos Corretora de Cambio Ti 16 0.1 22 1 - - 0.1 Pi Capital International LLC 11 - - 1 - - -
RBC Capital Markets 17 - - 1 - - - Cypress Associates 11 - - 1 - - -
Lincoln International LLC 17 - - 1 28 - -
Azevedo Sette Advogados 17 - - 1 - - -
Food Partners LLC/The 17 - - 1 - - -
TOTAL 26,935 174 TOTAL 17,542 89
Latin America Announced Deals (Target or Seller) 01/01/2018 - 03/31/2018 Brazil Announced Deals (Target or Seller) 01/01/2018 - 03/31/2018
Bank of America Merrill Lynch 1 50.2 15,855 6 2 16.1 34.1 Bank of America Merrill Lynch 1 87.6 15,219 4 1 27.0 60.6
JPMorgan Chase & Co 2 48.4 15,266 3 37 - 48.4 Banco Itau BBA SA 2 86.4 15,017 7 7 8.8 77.6
Banco Itau BBA SA 3 47.6 15,017 7 7 5.3 42.3 Riza Capital Consultoria de Investimentos 3 83.7 14,544 2 - - 83.7
Riza Capital Consultoria de Investimentos 4 46.1 14,544 2 - - 46.1 Morgan Stanley 4 82.6 14,362 1 5 15.1 67.5
Morgan Stanley 5 45.5 14,362 2 5 9.0 36.5 JPMorgan Chase & Co 4 82.6 14,362 1 - - 82.6
Citigroup Inc 6 6.8 2,135 4 - - 6.8 Goldman Sachs & Co LLC 6 4.0 693 2 10 1.6 2.4
Lazard Ltd 7 5.2 1,640 6 13 1.4 3.8 Vinci Partners Investimentos Ltda 7 2.8 489 1 20 - 2.8
Goldman Sachs & Co LLC 8 4.0 1,270 5 18 1.0 3.1 Banco BTG Pactual SA 8 1.7 290 2 3 21.2 -19.6
GBS Finanzas SA 9 3.6 1,120 1 - - 3.6 Credit Suisse Group AG 9 1.5 257 1 6 9.2 -7.7
Deutsche Bank AG 9 3.6 1,120 1 - - 3.6 XP Investimentos Corretora de Cambio Ti 10 0.1 22 1 - - 0.1
Credit Suisse Group AG 11 2.7 840 2 6 6.3 -3.6 Artica Participacoes e Assessoria Financei 11 - - 3 20 - -
Banco BTG Pactual SA 12 1.8 563 3 3 12.9 -11.1 Lazard Ltd 11 - - 2 - - -
Vinci Partners Investimentos Ltda 13 1.6 489 1 37 - 1.6 Banco Bradesco BBI SA 11 - - 1 4 19.8 -19.8
Rothschild & Co 14 1.3 421 4 17 1.0 0.3 Broadspan Asset Management LLC 11 - - 1 - - -
Greenhill & Co Inc 15 0.9 284 1 - - 0.9 Azevedo Sette Advogados 11 - - 1 - - -
BNP Paribas SA 16 0.2 64 1 14 1.2 -1.0 Pi Capital International LLC 11 - - 1 - - -
Ballas Capital Ltd 16 0.2 64 1 - - 0.2 Cypress Associates 11 - - 1 - - -
XP Investimentos Corretora de Cambio Ti 18 0.1 22 1 - - 0.1
Grant Thornton International Ltd 19 0.1 18 1 - - 0.1
Gram Capital Ltd 20 0.0 7 1 9 4.3 -4.3
TOTAL 31,567 209 TOTAL 17,381 81
FIRM
2018 2017MKT SHR
CHANGE FIRM
2018 2017MKT SHR
CHANGERANK
MKT SHR
(%)VOLUME USD
(Mln)
DEAL
COUNT RANK
MKT SHR
(%) RANK
MKT SHR
(%)VOLUME USD
(Mln)
DEAL
COUNT RANK
MKT SHR
(%)
20,418 14,986
23,801 14,194
FIRM
2018 2017MKT SHR
CHANGE FIRM
2018 2017MKT SHR
CHANGERANK
MKT SHR
(%)VOLUME USD
(Mln)
DEAL
COUNT RANK
MKT SHR
(%) RANK
MKT SHR
(%)VOLUME USD
(Mln)
DEAL
COUNT RANK
MKT SHR
(%)
7

Country
United Kingdom $63.5 28.4% 0.6%
Germany $21.3 9.5% 100.8%
Switzerland $20.7 9.3% -35.5%
Netherlands $19.4 8.7% 249.1%
Spain $15.8 7.1% 57.6%
France $13.5 6.0% -54.2%
Italy $8.2 3.7% -74.0%
Finland $0.6 0.3% -50.8%
Date
Total
Value
Amount
(Bln.) % of Total
% YoY
Change
Number of deals 2,623 Financial $46.4 20.7% -20.7%
Volume (Bln.) $223.2 Consumer Non-cyclical $45.3 20.2% -14.2%
Avg Deal Size (Mln.) $85.1 Communications $31.8 14.2% 516.5%
Consumer Cyclical $31.3 14.0% -18.4%
Basic Materials $16.3 7.3% 278.9%
JPMorgan Chase & Co Industrial $15.4 6.9% -39.4%
Number of deals 33 Energy $15.0 6.7% -47.5%
Volume (Bln.) $85.8 Utilities $14.8 6.6% 86.8%
Avg Deal Size (Bln.) $2.6 Technology $7.7 3.4% 153.6%
Diversified $0.4 0.2% -58.3%
Amount
(Bln.)
% Change
Deal Count
% Change
Volume
Company Takeover $111.7 -13.7% 5.4%
Cross Border $163.8 -8.7% -0.7%
Private Equity $72.5 -14.4% 25.7%
Asset sale $71.5 -11.3% 22.0%
Tender Offer $42.6 -34.8% -20.8%
Venture Capital $6.4 -13.6% 79.6%
Spin-off $4.6 -10.0% 97.4%
Minority purchase $25.7 -15.7% 0.0%
$14.5 6.9% -45.2%
Quarterly Volume represents any involvement (target, seller, or acquirer).
Glo
bal
M&
A R
evi
ew |
Q1
20
18
Majority purchase
EMEA M&A Regional Review EMEA M&A: Country Breakdown
EMEA M&A Highlights of Q1 2018
Summary Target Acquirer Seller Industry
3/27/2018Consumer healthcare
business/Novartis AGGlaxoSmithKline PLC Novartis AG $13,000.0
- $10,049.3
Top Adviser1/17/2018 GKN PLC Melrose Industries PLC - $11,541.4
3/27/2018Specialty chemicals
business/Akzo Nobel NVMultiple Acquirers Akzo Nobel NV $12,538.1
2/12/2018 TDC A/S Multiple Acquirers
EMEA M&A: Quarterly Volume EMEA M&A: Deal Type Breakdown
Deal Type
1/30/2018 UBM PLC Informa PLC - $6,024.0
EMEA M&A: Industry Breakdown
Amount
(Bln.) % of Total
% YoY
Change
0
1000
2000
3000
4000
5000
$0
$100
$200
$300
$400
$500
2013 Q1 2014 Q1 2015 Q1 2016 Q1 2017 Q1 2018 Q1
Volume $(Bln.) Deal Count
• M&A deals involving EMEA-based targets reached a voume of $224.1 billion in 1Q2018 which was fairlyconsistent with the deal volume reported for the same period last year.
• Deal activity targeting the communications sector increased 516.5% year-on-year to $31.8 billion. Thesector’s growth is mainly attributed to the pending private equity buyout of TDC A/S for $10.0 billion.This is the largest deal targeting the sector globally.
• The divestiture of its consumer health business by Novartis AG to GlaxoSmithKline Plc for $13.0 billionwas the largest deal targeting the region globallly.
8

Europe Announced Deals (Any Involvement) 01/01/2018 - 03/31/2018 Europe Announced Deals (Target or Seller) 01/01/2018 - 03/31/2018
JPMorgan Chase & Co 1 38.3 111,999 37 9 11.9 26.4 JPMorgan Chase & Co 1 36.3 83,054 32 8 13.0 23.3
Lazard Ltd 2 18.9 55,187 33 4 22.4 -3.5 Citigroup Inc 2 20.0 45,720 23 1 33.6 -13.7
Citigroup Inc 3 18.4 53,691 26 2 29.6 -11.2 Rothschild & Co 3 18.9 43,207 55 5 22.3 -3.5
Morgan Stanley 4 16.6 48,597 24 7 18.3 -1.6 Lazard Ltd 4 15.8 36,079 30 3 25.4 -9.7
Rothschild & Co 5 14.8 43,207 58 6 19.2 -4.5 Barclays PLC 5 14.7 33,727 14 13 6.2 8.5
Barclays PLC 6 12.4 36,316 16 16 5.2 7.2 Credit Suisse Group AG 6 12.6 28,818 17 6 22.3 -9.7
Goldman Sachs & Co LLC 7 11.3 32,897 26 3 28.6 -17.4 Goldman Sachs & Co LLC 7 12.3 28,076 22 4 23.2 -10.9
Credit Suisse Group AG 8 10.3 30,229 23 5 19.6 -9.3 Evercore Inc 8 11.7 26,696 7 27 1.6 10.0
Bank of America Merrill Lynch 9 9.7 28,386 19 1 30.4 -20.7 Bank of America Merrill Lynch 9 11.3 25,915 17 2 28.7 -17.4
Evercore Inc 10 9.1 26,696 8 28 1.4 7.8 Morgan Stanley 10 9.9 22,675 18 9 12.1 -2.2
UBS AG 11 7.1 20,671 15 14 7.6 -0.5 UBS AG 11 9.0 20,671 13 11 8.6 0.5
LionTree Advisors LLC 12 7.0 20,502 4 105 0.0 7.0 LionTree Advisors LLC 12 9.0 20,502 4 - - 9.0
HSBC Bank PLC 13 5.9 17,249 4 10 10.8 -4.9 HSBC Bank PLC 13 7.5 17,249 4 19 4.4 3.1
RBC Capital Markets 14 5.3 15,385 8 48 0.4 4.9 RBC Capital Markets 14 6.7 15,266 6 47 0.4 6.2
Ardea Partners LLC 15 5.2 15,201 1 - - 5.2 Nordea Bank AB 15 6.4 14,602 4 51 0.4 6.0
Nordea Bank AB 16 5.0 14,602 4 51 0.3 4.7 Greenhill & Co Inc 16 5.8 13,382 3 26 1.9 4.0
BNP Paribas SA 17 4.9 14,384 14 8 14.4 -9.5 Investec PLC 17 5.8 13,283 3 89 0.0 5.8
Greenhill & Co Inc 18 4.7 13,666 4 26 1.6 3.1 BNP Paribas SA 18 5.8 13,199 10 7 17.0 -11.3
Investec PLC 19 4.6 13,283 3 86 0.1 4.5 Macquarie Group Ltd 19 5.5 12,684 9 38 0.7 4.8
Macquarie Group Ltd 20 4.4 12,722 11 40 0.6 3.7 Gleacher Shacklock LLP 20 5.0 11,541 1 - - 5.0
TOTAL 292,240 3,120 TOTAL 228,998 2,537
UK Announced Deals (Any Involvement) 01/01/2018 - 03/31/2018 Germany Announced Deals (Any Involvement) 01/01/2018 - 03/31/2018
JPMorgan Chase & Co 1 43.1 49,401 14 7 15.7 27.4 JPMorgan Chase & Co 1 28.2 8,841 10 24 - 28.2
Citigroup Inc 2 24.4 28,017 11 15 9.2 15.3 Goldman Sachs & Co LLC 2 25.9 8,127 5 1 14.2 11.7
Rothschild & Co 3 23.1 26,493 33 9 13.7 9.4 BNP Paribas SA 3 18.6 5,841 2 24 - 18.6
Credit Suisse Group AG 4 18.4 21,134 12 5 18.6 -0.1 Rothschild & Co 4 16.8 5,285 10 11 1.7 15.1
Barclays PLC 5 17.2 19,768 8 16 8.7 8.5 D'Angelin & Co Ltd 5 13.6 4,267 1 - - 13.6
UBS AG 6 14.7 16,851 4 10 13.7 1.1 Bank of America Merrill Lynch 6 5.2 1,635 3 24 - 5.2
RBC Capital Markets 7 13.0 14,876 5 32 0.9 12.1 Kempen & Co NV 7 4.9 1,540 2 - - 4.9
Bank of America Merrill Lynch 8 11.9 13,613 9 3 33.4 -21.5 Citigroup Inc 8 4.3 1,361 4 3 9.9 -5.5
Greenhill & Co Inc 9 11.6 13,284 2 18 3.8 7.8 Freitag & Co GmbH 9 3.9 1,221 1 - - 3.9
Investec PLC 10 11.6 13,283 3 59 0.1 11.5 NIBC Bank NV 9 3.9 1,221 1 24 - 3.9
Gleacher Shacklock LLP 11 10.1 11,541 1 - - 10.1 Morgan Stanley 9 3.9 1,221 3 24 - 3.9
Evercore Inc 12 7.5 8,619 5 26 2.0 5.5 UBS AG 9 3.9 1,221 2 4 8.7 -4.8
Goldman Sachs & Co LLC 13 7.4 8,485 11 1 48.5 -41.1 Ernst & Young 13 2.4 760 6 10 2.1 0.4
PJT Partners Inc 14 5.8 6,616 3 42 0.3 5.4 Wells Fargo & Co 14 1.4 428 1 - - 1.4
Morgan Stanley 15 5.7 6,501 6 2 36.0 -30.4 PricewaterhouseCoopers LLP 15 0.8 244 3 17 0.5 0.3
Centerview Partners LLC 16 5.3 6,024 1 - - 5.3 Liberum Capital Ltd 16 0.8 235 2 - - 0.8
HSBC Bank PLC 17 4.1 4,711 2 8 14.7 -10.6 ING Groep NV 17 0.5 171 1 24 - 0.5
Societe Generale SA 18 4.1 4,708 1 91 - 4.1 Carnegie Fondkommission AB 18 0.5 150 1 - - 0.5
Fenchurch Advisory Partners LLP 19 4.0 4,530 1 - - 4.0 Kaiser Wealth Management 19 0.3 108 1 - - 0.3
Lazard Ltd 20 2.9 3,291 9 17 4.2 -1.3 Clifford Chance LLP 19 0.3 108 1 - - 0.3
TOTAL 114,669 1,201 TOTAL 31,407 556
FIRM
2018 2017MKT SHR
CHANGE FIRM
2018 2017MKT SHR
CHANGERANK
MKT SHR
(%)VOLUME USD
(Mln)
DEAL
COUNT RANK
MKT SHR
(%) RANK
MKT SHR
(%)VOLUME USD
(Mln)
DEAL
COUNT RANK
MKT SHR
(%)
FIRM
2018 2017MKT SHR
CHANGE FIRM
2018 2017MKT SHR
CHANGERANK
MKT SHR
(%)VOLUME USD
(Mln)
DEAL
COUNT RANK
MKT SHR
(%) RANK
MKT SHR
(%)VOLUME USD
(Mln)
DEAL
COUNT RANK
MKT SHR
(%)
297,435 251,278
125,370 20,172
9
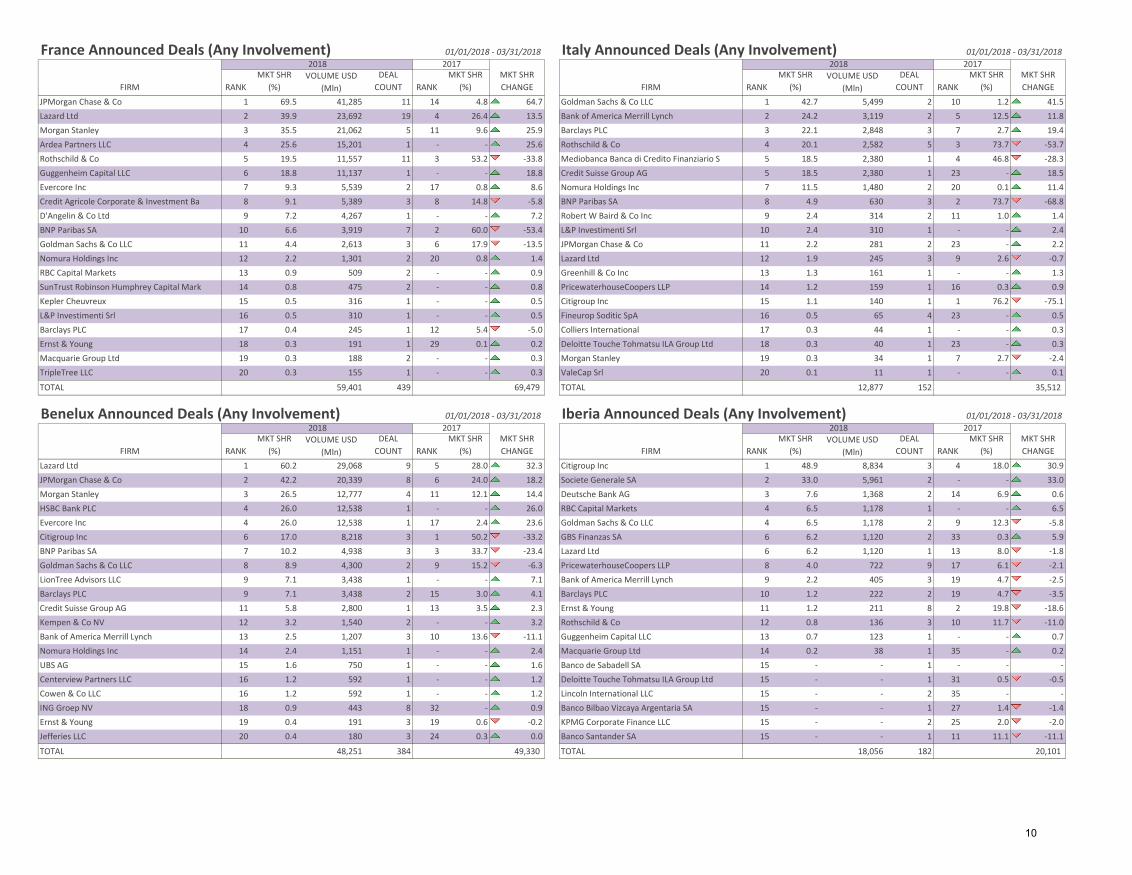
France Announced Deals (Any Involvement) 01/01/2018 - 03/31/2018 Italy Announced Deals (Any Involvement) 01/01/2018 - 03/31/2018
JPMorgan Chase & Co 1 69.5 41,285 11 14 4.8 64.7 Goldman Sachs & Co LLC 1 42.7 5,499 2 10 1.2 41.5
Lazard Ltd 2 39.9 23,692 19 4 26.4 13.5 Bank of America Merrill Lynch 2 24.2 3,119 2 5 12.5 11.8
Morgan Stanley 3 35.5 21,062 5 11 9.6 25.9 Barclays PLC 3 22.1 2,848 3 7 2.7 19.4
Ardea Partners LLC 4 25.6 15,201 1 - - 25.6 Rothschild & Co 4 20.1 2,582 5 3 73.7 -53.7
Rothschild & Co 5 19.5 11,557 11 3 53.2 -33.8 Mediobanca Banca di Credito Finanziario S 5 18.5 2,380 1 4 46.8 -28.3
Guggenheim Capital LLC 6 18.8 11,137 1 - - 18.8 Credit Suisse Group AG 5 18.5 2,380 1 23 - 18.5
Evercore Inc 7 9.3 5,539 2 17 0.8 8.6 Nomura Holdings Inc 7 11.5 1,480 2 20 0.1 11.4
Credit Agricole Corporate & Investment Ba 8 9.1 5,389 3 8 14.8 -5.8 BNP Paribas SA 8 4.9 630 3 2 73.7 -68.8
D'Angelin & Co Ltd 9 7.2 4,267 1 - - 7.2 Robert W Baird & Co Inc 9 2.4 314 2 11 1.0 1.4
BNP Paribas SA 10 6.6 3,919 7 2 60.0 -53.4 L&P Investimenti Srl 10 2.4 310 1 - - 2.4
Goldman Sachs & Co LLC 11 4.4 2,613 3 6 17.9 -13.5 JPMorgan Chase & Co 11 2.2 281 2 23 - 2.2
Nomura Holdings Inc 12 2.2 1,301 2 20 0.8 1.4 Lazard Ltd 12 1.9 245 3 9 2.6 -0.7
RBC Capital Markets 13 0.9 509 2 - - 0.9 Greenhill & Co Inc 13 1.3 161 1 - - 1.3
SunTrust Robinson Humphrey Capital Mark 14 0.8 475 2 - - 0.8 PricewaterhouseCoopers LLP 14 1.2 159 1 16 0.3 0.9
Kepler Cheuvreux 15 0.5 316 1 - - 0.5 Citigroup Inc 15 1.1 140 1 1 76.2 -75.1
L&P Investimenti Srl 16 0.5 310 1 - - 0.5 Fineurop Soditic SpA 16 0.5 65 4 23 - 0.5
Barclays PLC 17 0.4 245 1 12 5.4 -5.0 Colliers International 17 0.3 44 1 - - 0.3
Ernst & Young 18 0.3 191 1 29 0.1 0.2 Deloitte Touche Tohmatsu ILA Group Ltd 18 0.3 40 1 23 - 0.3
Macquarie Group Ltd 19 0.3 188 2 - - 0.3 Morgan Stanley 19 0.3 34 1 7 2.7 -2.4
TripleTree LLC 20 0.3 155 1 - - 0.3 ValeCap Srl 20 0.1 11 1 - - 0.1
TOTAL 59,401 439 TOTAL 12,877 152
Benelux Announced Deals (Any Involvement) 01/01/2018 - 03/31/2018 Iberia Announced Deals (Any Involvement) 01/01/2018 - 03/31/2018
Lazard Ltd 1 60.2 29,068 9 5 28.0 32.3 Citigroup Inc 1 48.9 8,834 3 4 18.0 30.9
JPMorgan Chase & Co 2 42.2 20,339 8 6 24.0 18.2 Societe Generale SA 2 33.0 5,961 2 - - 33.0
Morgan Stanley 3 26.5 12,777 4 11 12.1 14.4 Deutsche Bank AG 3 7.6 1,368 2 14 6.9 0.6
HSBC Bank PLC 4 26.0 12,538 1 - - 26.0 RBC Capital Markets 4 6.5 1,178 1 - - 6.5
Evercore Inc 4 26.0 12,538 1 17 2.4 23.6 Goldman Sachs & Co LLC 4 6.5 1,178 2 9 12.3 -5.8
Citigroup Inc 6 17.0 8,218 3 1 50.2 -33.2 GBS Finanzas SA 6 6.2 1,120 2 33 0.3 5.9
BNP Paribas SA 7 10.2 4,938 3 3 33.7 -23.4 Lazard Ltd 6 6.2 1,120 1 13 8.0 -1.8
Goldman Sachs & Co LLC 8 8.9 4,300 2 9 15.2 -6.3 PricewaterhouseCoopers LLP 8 4.0 722 9 17 6.1 -2.1
LionTree Advisors LLC 9 7.1 3,438 1 - - 7.1 Bank of America Merrill Lynch 9 2.2 405 3 19 4.7 -2.5
Barclays PLC 9 7.1 3,438 2 15 3.0 4.1 Barclays PLC 10 1.2 222 2 19 4.7 -3.5
Credit Suisse Group AG 11 5.8 2,800 1 13 3.5 2.3 Ernst & Young 11 1.2 211 8 2 19.8 -18.6
Kempen & Co NV 12 3.2 1,540 2 - - 3.2 Rothschild & Co 12 0.8 136 3 10 11.7 -11.0
Bank of America Merrill Lynch 13 2.5 1,207 3 10 13.6 -11.1 Guggenheim Capital LLC 13 0.7 123 1 - - 0.7
Nomura Holdings Inc 14 2.4 1,151 1 - - 2.4 Macquarie Group Ltd 14 0.2 38 1 35 - 0.2
UBS AG 15 1.6 750 1 - - 1.6 Banco de Sabadell SA 15 - - 1 - - -
Centerview Partners LLC 16 1.2 592 1 - - 1.2 Deloitte Touche Tohmatsu ILA Group Ltd 15 - - 1 31 0.5 -0.5
Cowen & Co LLC 16 1.2 592 1 - - 1.2 Lincoln International LLC 15 - - 2 35 - -
ING Groep NV 18 0.9 443 8 32 - 0.9 Banco Bilbao Vizcaya Argentaria SA 15 - - 1 27 1.4 -1.4
Ernst & Young 19 0.4 191 3 19 0.6 -0.2 KPMG Corporate Finance LLC 15 - - 2 25 2.0 -2.0
Jefferies LLC 20 0.4 180 3 24 0.3 0.0 Banco Santander SA 15 - - 1 11 11.1 -11.1
TOTAL 48,251 384 TOTAL 18,056 182
RANK
MKT SHR
(%)
FIRM
2018 2017
RANK
FIRM RANK
MKT SHR
(%)VOLUME USD
(Mln)
DEAL
COUNT RANK
MKT SHR
(%) RANK
MKT SHR
(%)
FIRM
2018 2017MKT SHR
CHANGERANK
MKT SHR
(%)VOLUME USD
(Mln)
DEAL
COUNT RANK
MKT SHR
(%)
MKT SHR
(%)VOLUME USD
(Mln)
DEAL
COUNT RANK
MKT SHR
(%)
2018 2017MKT SHR
CHANGE FIRM
2018
VOLUME USD
(Mln)
DEAL
COUNT
69,479 35,512
49,330 20,101
MKT SHR
CHANGE
2017MKT SHR
CHANGE
10

Nordic Announced Deals (Any Involvement) 01/01/2018 - 03/31/2018 Eastern Europe Announced Deals (Any Involvement) 01/01/2018 - 03/31/2018
LionTree Advisors LLC 1 44.6 20,502 4 - - 44.6 LionTree Advisors LLC 1 18.9 3,438 1 - - 18.9
Nordea Bank AB 2 31.7 14,602 3 8 6.4 25.4 BNP Paribas SA 1 18.9 3,438 1 18 - 18.9
Morgan Stanley 3 29.5 13,585 6 4 9.3 20.3 Barclays PLC 1 18.9 3,438 1 - - 18.9
Barclays PLC 4 29.3 13,488 3 20 1.5 27.8 VTB Capital JSC 4 13.5 2,448 3 3 9.1 4.4
JPMorgan Chase & Co 5 27.3 12,538 2 16 2.1 25.1 JPMorgan Chase & Co 5 9.6 1,738 1 18 - 9.6
Lazard Ltd 5 27.3 12,538 5 7 7.6 19.7 Goldman Sachs & Co LLC 6 1.2 213 1 - - 1.2
HSBC Bank PLC 5 27.3 12,538 1 - - 27.3 Houlihan Lokey Inc 7 0.8 153 1 14 0.9 0.0
Evercore Inc 5 27.3 12,538 1 21 1.5 25.8 UBS AG 7 0.8 153 2 18 - 0.8
Macquarie Group Ltd 9 21.8 10,049 1 16 2.1 19.7 Erneholm & Haskel 7 0.8 153 1 - - 0.8
Citigroup Inc 10 17.4 7,989 8 6 8.1 9.2 Credit Suisse Group AG 10 0.5 87 2 - - 0.5
Goldman Sachs & Co LLC 11 12.6 5,788 5 1 16.9 -4.3 Seabury Securities Holdings LLC 11 0.3 52 1 - - 0.3
Rothschild & Co 12 12.3 5,675 7 37 - 12.3 Superia Corporate Finance 11 0.3 52 1 - - 0.3
Bank of America Merrill Lynch 13 10.0 4,598 2 3 12.4 -2.4 China Merchants Securities Co Ltd 11 0.3 52 1 - - 0.3
Ondra LLP 14 9.9 4,553 1 - - 9.9 Allen & Overy LLP 14 - - 1 - - -
BNP Paribas SA 15 7.5 3,438 1 37 - 7.5 Catella Corporate Finance AB 14 - - 1 - - -
Skandinaviska Enskilda Banken AB 16 6.6 3,035 4 12 3.3 3.3 PricewaterhouseCoopers LLP 14 - - 2 6 7.5 -7.5
Credit Suisse Group AG 17 5.4 2,461 4 33 0.1 5.2 ASB Prague Sro 14 - - 1 - - -
Ernst & Young 18 2.6 1,207 5 29 0.3 2.3 KPMG Corporate Finance LLC 14 - - 3 7 6.0 -6.0
Carnegie Fondkommission AB 19 1.6 724 5 24 1.0 0.6 Lazard Ltd 14 - - 1 9 3.5 -3.5
Sundling & Warn Partners 20 1.3 574 1 - - 1.3 Deutsche Bank AG 14 - - 1 2 13.9 -13.9
TOTAL 46,003 482 TOTAL 18,155 253
Africa/ME Announced Deals (Any Involvement) 01/01/2018 - 03/31/2018
JPMorgan Chase & Co 1 31.3 8,577 5 14 5.2 26.1
Rothschild & Co 2 22.5 6,159 8 17 0.7 21.8
Lazard Ltd 3 20.0 5,485 3 7 8.0 12.1
Credit Agricole Corporate & Investment Ba 4 19.7 5,389 2 - - 19.7
Evercore Inc 4 19.7 5,389 1 30 - 19.7
Barclays PLC 6 14.7 4,026 3 - - 14.7
Goldman Sachs & Co LLC 7 14.2 3,899 3 4 10.5 3.8
PowerOne Capital Markets Ltd 8 2.7 748 1 - - 2.7
GMP Securities LP 8 2.7 748 1 10 6.1 -3.3
Citigroup Inc 10 2.3 632 2 9 7.1 -4.8
Bank of America Merrill Lynch 11 1.5 416 2 6 8.1 -6.6
Morgan Stanley 12 1.1 300 2 8 7.5 -6.4
Deutsche Bank AG 13 0.8 212 1 - - 0.8
KPMG Corporate Finance LLC 14 0.8 206 3 25 0.2 0.6
BMO Capital Markets Corp/Toronto 15 0.7 202 2 - - 0.7
FirstRand Ltd 16 0.4 100 2 - - 0.4
PricewaterhouseCoopers LLP 16 0.4 100 3 18 0.6 -0.2
Avendus Capital Pvt Ltd 18 0.4 95 2 - - 0.4
Credit Suisse Group AG 19 0.3 87 2 1 11.9 -11.6
Standard Chartered Bank 20 0.1 26 1 - - 0.1
TOTAL 27,377 347
FIRM
DEAL
COUNT RANK
MKT SHR
(%)
MKT SHR
(%) RANK
MKT SHR
(%)VOLUME USD
(Mln)
DEAL
COUNTRANK
MKT SHR
CHANGE
2018 2017MKT SHR
CHANGERANK
MKT SHR
(%)VOLUME USD
(Mln)
RANK
MKT SHR
(%)FIRM
2018 2017MKT SHR
CHANGE FIRM
2018 2017
RANK
MKT SHR
(%)VOLUME USD
(Mln)
DEAL
COUNT
15,102 13,299
18,224
11

Date
Total
Value
Number of deals 3,263
Volume (Bln.) $196.2
Avg Deal Size (Mln.) $60.1
Nomura Holdings Inc
Number of deals 23
Volume (Bln.) $11.8
Avg Deal Size (Bln.) $0.5
Deal Type
Amount
(Bln.)
% Change
Deal
% YoY
Change
Company Takeover $74.0 -2.4% 0.2%
Cross Border $65.7 -3.1% -8.2%
Private Equity $35.9 6.4% 3.3%
Asset sale $24.5 -4.1% 22.1%
Tender Offer $8.9 -23.5% -20.6%
Venture Capital $20.0 21.8% 160.2%
Spin-off $0.3 128.6% -79.1%
Minority purchase $59.9 17.1% 31.9%
Majority purchase $29.4 -6.3% -4.2%
12Graphs represent any regional involvement (target, seller, or acquirer).
$6,135.7
Multiple Acquirers $5,364.0
APAC M&A Regional Review
Glo
bal
M&
A R
evi
ew |
Q1
20
18
APAC M&A: Quarterly Volume
Australia/NZ M&A: Quarterly Volume
APAC M&A: Highlights of Q1 2018
Summary Target Acquirer Seller
1/31/2018 Fuji Xerox Co Ltd Fuji Xerox Co LtdFUJIFILM Holdings
Corp
-
APAC M&A: Breakdown
Greater China M&A: Quarterly Volume
1/22/2018Beijing New Energy
Automobile Co
Chengdu Qian Feng
Electronics Co Ltd- $4,505.1
Top Adviser3/2/2018 Snowy Hydro Ltd Commonwealth of Australia
State of New South
Wales Australia,State
of Victoria Australia
$4,830.3
1/29/2018
Dalian Wanda
Commercial
Management Group Co
Japan M&A: Quarterly Volume
$4,454.83/31/2018 Joy City Property Ltd COFCO Property Group Co Ltd COFCO Corp
27%
16%
13%
12%
11%
7%
6% 5%
3% 0%
APAC Industry Breakdown Financial
Consumer Cyclical
Consumer Non-cyclical
Industrial
Technology
Communications
Energy
Basic Materials
Utilities
Diversified
0
2000
4000
6000
$0
$200
$400
$600
Volume $(Bln.) Deal Count
0
200
400
600
$0
$20
$40
$60
Volume $(Bln.) Deal Count
0
1000
2000
3000
$0
$100
$200
$300
Volume $(Bln.) Deal Count
0
500
1000
$0
$20
$40
$60
$80
Volume $(Bln.) Deal Count
• M&A activity targeting the APAC region in 1Q2018 experienced a 9.4% decrease to $195.5 billioncompared to the same period last year. Deals exceeding $1.0 billion in value increased by 12.5% to 27deals. The value of deals targeting Chinese companies or assets in China accounted for 46.3% of thetotal deal volume.
• The financial and consumer cyclical sectors were the most targeted industries, accounting for 45.3% ofthe region's overall volume. The largest deal of the quarter in the region was the merger of FujifilmHoldings Corp's subsidiary Fuji Xerox Co with Xerox Corp of the United States for $6.1 billion.
• Deals with private equity involvement decreased 4.0% year-on-year to $36.1 billion. The largestprivate equity deal was the $2.5 billion financing for Jingdong Express Group Corp from investorsincluding Hillhouse Capital and Tencent Holdings.
12

APAC Ex-Japan Announced Deals (Any Involvement) 01/01/2018 - 03/31/2018 APAC Ex-Japan Announced Deals (Target or Seller) 01/01/2018 - 03/31/2018
JPMorgan Chase & Co 1 14.9 37,567 14 14 2.7 12.2 CITIC Securities Co Ltd 1 5.9 10,490 8 11 6.8 -1.0
Lazard Ltd 2 14.2 35,885 15 18 2.1 12.1 CSC Financial Co Ltd 2 4.1 7,400 9 59 0.2 4.0
Morgan Stanley 3 12.4 31,335 14 2 12.8 -0.4 Credit Suisse Group AG 3 4.1 7,330 14 33 0.8 3.3
Citigroup Inc 4 9.6 24,325 14 15 2.6 7.1 Citigroup Inc 4 3.5 6,191 11 16 1.9 1.6
Goldman Sachs & Co LLC 5 8.4 21,190 13 1 15.1 -6.7 China International Capital Corp Ltd 5 3.4 6,077 4 10 7.2 -3.8
Bank of America Merrill Lynch 6 7.3 18,466 6 4 9.6 -2.3 Lazard Ltd 6 2.9 5,205 7 17 1.9 1.1
Evercore Inc 7 7.3 18,327 4 43 0.4 6.8 UBS AG 7 2.8 4,975 10 3 13.0 -10.2
Canson Capital Partners 8 6.7 17,000 1 - - 6.7 Deutsche Bank AG 8 2.6 4,561 5 18 1.8 0.7
Guggenheim Capital LLC 8 6.7 17,000 1 - - 6.7 Ernst & Young 9 2.5 4,433 9 14 2.7 -0.2
Centerview Partners LLC 8 6.7 17,000 1 39 0.6 6.1 Haitong Securities Co Ltd 10 2.4 4,279 2 23 1.3 1.1
Toronto-Dominion Bank/The 8 6.7 17,000 1 - - 6.7 JM Financial Ltd 11 2.4 4,219 3 47 0.3 2.1
Macquarie Group Ltd 12 5.4 13,556 13 27 1.0 4.4 Morgan Stanley 12 2.2 3,952 9 2 14.8 -12.6
HSBC Bank PLC 13 5.1 12,795 3 85 0.1 5.0 Macquarie Group Ltd 13 1.9 3,469 8 27 1.0 1.0
CITIC Securities Co Ltd 14 4.2 10,490 8 11 5.5 -1.3 Goldman Sachs & Co LLC 14 1.6 2,874 6 1 15.4 -13.8
Barclays PLC 15 4.1 10,262 3 17 2.3 1.8 State Bank of India 15 1.6 2,814 1 - - 1.6
Nordea Bank AB 16 4.0 10,049 2 48 0.3 3.7 Somerley Group Ltd 16 1.5 2,739 7 13 2.8 -1.3
LionTree Advisors LLC 16 4.0 10,049 1 - - 4.0 JPMorgan Chase & Co 17 1.1 1,879 6 12 3.4 -2.3
Rothschild & Co 18 3.0 7,631 10 5 8.4 -5.4 Messis Capital Ltd 18 1.0 1,747 1 - - 1.0
CSC Financial Co Ltd 19 2.9 7,400 9 71 0.2 2.8 Rothschild & Co 19 0.9 1,542 4 4 9.9 -9.1
Credit Suisse Group AG 20 2.9 7,330 14 37 0.6 2.3 Bank of America Merrill Lynch 20 0.8 1,466 4 5 8.5 -7.7
TOTAL 252,436 3,210 TOTAL 178,765 2,766
APAC Private Equity (Any Involvement) 01/01/2018 - 03/31/2018
JPMorgan Chase & Co 1 34.0 34,927 7 9 5.4 28.6
Lazard Ltd 2 29.1 29,869 9 4 7.5 21.6
Morgan Stanley 3 28.6 29,384 9 2 17.0 11.6
Citigroup Inc 4 18.2 18,655 4 12 4.7 13.5
Goldman Sachs & Co LLC 5 18.1 18,608 7 1 18.1 0.0
Evercore Inc 6 17.9 18,427 5 23 0.8 17.2
Bank of America Merrill Lynch 7 16.7 17,196 3 14 3.9 12.8
Centerview Partners LLC 8 16.5 17,000 1 24 0.8 15.8
Canson Capital Partners 8 16.5 17,000 1 - - 16.5
Guggenheim Capital LLC 8 16.5 17,000 1 - - 16.5
Toronto-Dominion Bank/The 8 16.5 17,000 1 - - 16.5
HSBC Bank PLC 12 12.4 12,719 2 - - 12.4
Macquarie Group Ltd 13 12.0 12,337 4 20 1.3 10.7
Nordea Bank AB 14 9.8 10,049 1 - - 9.8
LionTree Advisors LLC 14 9.8 10,049 1 - - 9.8
Barclays PLC 14 9.8 10,049 1 3 7.6 2.2
Rothschild & Co 17 6.3 6,511 8 11 4.8 1.5
Credit Agricole Corporate & Investment Ba 18 5.2 5,389 1 - - 5.2
Moelis & Co 19 2.4 2,500 1 - - 2.4
Credit Suisse Group AG 20 2.3 2,337 2 31 0.3 1.9
TOTAL 102,769 770
2017MKT SHR
(%)VOLUME USD
(Mln)
DEAL
COUNT RANK
MKT SHR
(%) RANK
MKT SHR
(%)VOLUME USD
(Mln)
FIRM
2018 2017MKT SHR
CHANGE
207,099
FIRM
2018 2017MKT SHR
CHANGE FIRM
2018
RANK
RANK
MKT SHR
(%)VOLUME USD
(Mln)
DEAL
COUNT RANK
MKT SHR
(%)
166,070
57,554
MKT SHR
CHANGE
DEAL
COUNT RANK
MKT SHR
(%)
13

AU & NZ Announced Deals (Any Involvement) 01/01/2018 - 03/31/2018 Japan Announced Deals (Any Involvement) 01/01/2018 - 03/31/2018
Macquarie Group Ltd 1 37.4 13,556 13 11 9.9 27.5 Nomura Holdings Inc 1 43.2 23,448 26 11 3.8 39.4
Morgan Stanley 2 31.4 11,360 4 8 12.0 19.3 Morgan Stanley 2 33.7 18,299 11 3 20.5 13.3
Nordea Bank AB 3 27.7 10,049 2 - - 27.7 Centerview Partners LLC 3 31.4 17,052 3 - - 31.4
LionTree Advisors LLC 3 27.7 10,049 1 - - 27.7 Goldman Sachs & Co LLC 4 21.0 11,377 4 2 20.5 0.5
Barclays PLC 3 27.7 10,049 1 19 1.3 26.5 JPMorgan Chase & Co 5 9.7 5,262 7 1 21.5 -11.8
Lazard Ltd 6 14.4 5,205 4 5 15.2 -0.8 Sumitomo Mitsui Financial Group Inc 6 8.4 4,569 60 7 12.3 -3.9
Credit Suisse Group AG 7 13.7 4,952 6 23 0.9 12.7 Rothschild & Co 7 4.9 2,680 3 15 1.3 3.6
UBS AG 8 6.9 2,513 5 1 19.9 -13.0 Mizuho Financial Group Inc 8 4.4 2,396 29 8 9.0 -4.6
Deutsche Bank AG 9 5.1 1,858 2 8 12.0 -6.9 Lazard Ltd 9 4.0 2,160 4 5 13.5 -9.5
JPMorgan Chase & Co 10 4.9 1,785 4 6 13.7 -8.7 Credit Suisse Group AG 9 4.0 2,160 1 13 3.2 0.8
Rothschild & Co 11 4.3 1,542 3 15 1.9 2.4 Daiwa Securities Group Inc 11 2.8 1,539 10 9 7.6 -4.7
Goldman Sachs & Co LLC 12 3.5 1,271 3 2 19.7 -16.2 Citigroup Inc 12 2.1 1,119 1 19 1.1 1.0
Societe Generale SA 13 3.5 1,253 1 - - 3.5 Bank of America Merrill Lynch 13 1.8 996 3 12 3.2 -1.3
Ernst & Young 14 2.8 1,022 1 3 17.0 -14.2 UBS AG 14 1.4 752 2 - - 1.4
Bank of Nova Scotia/The 15 2.5 916 3 - - 2.5 RBC Capital Markets 15 1.4 730 1 - - 1.4
Citigroup Inc 16 2.0 707 3 12 6.4 -4.5 KPMG Corporate Finance LLC 16 1.2 652 3 6 12.3 -11.1
Bank of America Merrill Lynch 17 1.6 570 3 19 1.3 0.3 Cowen & Co LLC 17 1.1 592 1 - - 1.1
CITIC Securities Co Ltd 18 1.5 556 1 - - 1.5 GCA Corp 18 1.1 591 6 21 1.0 0.1
Highbury Partnership Pty Ltd 19 1.4 520 1 4 16.0 -14.6 Highbury Partnership Pty Ltd 19 1.0 520 1 - - 1.0
Somerley Group Ltd 20 1.3 479 1 - - 1.3 YAMADA Consulting Group Co Ltd 20 0.6 313 4 36 0.0 0.6
TOTAL 36,233 396 TOTAL 54,259 834
South Korea Announced Deals (Any Involvement) 01/01/2018 - 03/31/2018 China Announced Deals (Any Involvement) 01/01/2018 - 03/31/2018
China International Capital Corp Ltd 1 6.9 1,500 1 - - 6.9 CITIC Securities Co Ltd 1 9.8 10,490 8 2 10.3 -0.5
Morgan Stanley 2 5.6 1,221 1 2 13.8 -8.2 CSC Financial Co Ltd 2 6.9 7,400 9 41 0.3 6.6
Deutsche Bank AG 2 5.6 1,221 1 - - 5.6 China International Capital Corp Ltd 3 6.0 6,370 5 1 11.4 -5.5
RBC Capital Markets 4 2.2 488 1 - - 2.2 Haitong Securities Co Ltd 4 4.0 4,279 2 13 2.7 1.3
PricewaterhouseCoopers LLP 5 2.0 427 6 4 5.5 -3.6 Deutsche Bank AG 5 2.1 2,221 2 12 2.7 -0.7
NH Investment & Securities Co Ltd 6 1.6 354 2 11 0.4 1.3 UBS AG 6 2.1 2,191 5 5 5.1 -3.0
Ernst & Young 7 1.6 347 2 5 3.6 -2.0 Lazard Ltd 7 1.8 1,931 6 33 0.4 1.4
Goldman Sachs & Co LLC 8 0.7 150 1 1 22.2 -21.5 Messis Capital Ltd 8 1.6 1,747 1 - - 1.6
Rothschild & Co 9 0.5 100 1 - - 0.5 Somerley Group Ltd 9 1.5 1,653 5 8 3.6 -2.0
JPMorgan Chase & Co 10 0.4 95 2 7 2.1 -1.7 Citigroup Inc 10 1.3 1,414 3 14 2.6 -1.3
Nomura Holdings Inc 11 0.4 83 1 - - 0.4 Huatai Securities Co Ltd 11 1.3 1,349 6 20 1.2 0.0
Credit Suisse Group AG 12 0.4 77 1 6 2.6 -2.2 GBS Finanzas SA 12 1.1 1,120 1 88 - 1.1
KPMG Corporate Finance LLC 13 0.1 27 2 9 1.0 -0.8 Gram Capital Ltd 13 0.9 943 3 21 1.2 -0.3
Mita Securities Co Ltd 14 0.1 12 1 - - 0.1 Huajin Securities Co Ltd 14 0.9 936 1 - - 0.9
Deloitte Touche Tohmatsu ILA Group Ltd 15 0.0 2 2 - - - China Merchants Securities Co Ltd 15 0.8 830 2 40 0.3 0.5
Lazard Ltd 16 - - 1 17 - - Bank of China Ltd 16 0.7 778 1 - - 0.7
Bank of Nova Scotia/The 16 - - 1 - - - JPMorgan Chase & Co 17 0.7 760 4 7 4.1 -3.4
Moelis & Co 16 - - 1 - - - Credit Suisse Group AG 18 0.6 623 2 67 0.1 0.5
Morgan Stanley 19 0.6 600 3 4 7.8 -7.3
Dongxing Securities Co Ltd 20 0.5 573 2 39 0.3 0.3
TOTAL 21,847 414 TOTAL 107,141 1,30120,730 110,383
FIRM
2018 2017MKT SHR
CHANGE FIRM
2018 2017MKT SHR
CHANGERANK
MKT SHR
(%)VOLUME USD
(Mln)
DEAL
COUNT RANK
MKT SHR
(%) RANK
MKT SHR
(%)VOLUME USD
(Mln)
DEAL
COUNT RANK
MKT SHR
(%)
DEAL
COUNT RANK
MKT SHR
(%) RANK
MKT SHR
(%)VOLUME USD
(Mln)
DEAL
COUNT RANK
MKT SHR
(%)
20,399 41,159
FIRM
2018 2017MKT SHR
CHANGE FIRM
2018 2017MKT SHR
CHANGERANK
MKT SHR
(%)VOLUME USD
(Mln)
14

Hong Kong Announced Deals (Any Involvement) 01/01/2018 - 03/31/2018 Taiwan Announced Deals (Any Involvement) 01/01/2018 - 03/31/2018
Citigroup Inc 1 8.4 2,037 2 21 1.0 7.5 Citigroup Inc 1 26.4 1,657 1 - - 26.4
Somerley Group Ltd 2 4.5 1,086 2 17 3.3 1.2 Somerley Group Ltd 2 16.5 1,034 1 - - 16.5
Euto Capital Partners Ltd 3 2.4 573 1 30 0.3 2.0 Goldman Sachs & Co LLC 3 13.8 866 1 - - 13.8
China Construction Bank Corp 3 2.4 573 1 31 0.3 2.1 Morgan Stanley 4 0.5 34 1 - - 0.5
Goldman Sachs & Co LLC 5 2.2 520 1 1 18.5 -16.4 Mizuho Financial Group Inc 5 0.5 33 1 - - 0.5
CIMB 6 1.8 428 2 - - 1.8 Deloitte Touche Tohmatsu ILA Group Ltd 6 0.0 2 1 - - 0.0
Evercore Inc 7 1.7 400 1 - - 1.7 Union Square Advisors LLC/NY 7 - - 1 - - -
Deutsche Bank AG 8 1.6 380 1 - - 1.6 Ernst & Young 7 - - 1 - - -
Zhongtai Securities Co Ltd 9 1.4 328 6 - - 1.4 Cowen & Co LLC 7 - - 1 - - -
Ballas Capital Ltd 10 1.4 327 5 - - 1.4
Well Link International Capital Ltd 11 1.1 263 4 26 0.5 0.6
CSC Financial Co Ltd 12 1.1 262 1 - - 1.1
Barclays PLC 13 0.9 213 1 3 9.2 -8.3
Riza Capital Consultoria de Investimentos 14 0.8 183 1 - - 0.8
HSBC Bank PLC 15 0.8 181 1 55 - 0.8
Kingston Financial Group Ltd 16 0.6 147 4 41 0.1 0.5
Axis Bank Ltd 17 0.4 105 1 - - 0.4
Rothschild & Co 18 0.4 100 2 8 6.8 -6.4
Great Wall Pan Asia Corporate Finance Ltd 19 0.3 77 2 - - 0.3
Grand Harbour Corporate Finance Ltd 19 0.3 77 2 - - 0.3
TOTAL 24,156 354 TOTAL 6,282 48
SE Asia Announced Deals (Any Involvement) 01/01/2018 - 03/31/2018 India Announced Deals (Any Involvement) 01/01/2018 - 03/31/2018
JPMorgan Chase & Co 1 47.7 34,927 3 17 1.3 46.3 JM Financial Ltd 1 22.1 4,219 3 13 1.7 20.4
Lazard Ltd 2 39.2 28,749 3 11 3.8 35.4 Citigroup Inc 2 16.6 3,167 5 10 5.0 11.6
Morgan Stanley 3 26.1 19,142 4 2 8.1 18.0 Ernst & Young 3 16.0 3,064 6 15 1.2 14.9
Goldman Sachs & Co LLC 4 24.6 18,022 2 8 4.1 20.5 State Bank of India 4 14.7 2,814 1 - - 14.7
Evercore Inc 5 24.5 17,927 2 - - 24.5 Goldman Sachs & Co LLC 5 5.2 985 2 1 52.4 -47.3
Bank of America Merrill Lynch 6 24.4 17,895 2 5 4.5 19.9 Bank of America Merrill Lynch 6 4.7 895 1 2 49.6 -44.9
Citigroup Inc 7 23.6 17,317 2 5 4.5 19.1 Rothschild & Co 7 3.1 600 1 4 48.3 -45.1
Centerview Partners LLC 8 23.2 17,000 1 - - 23.2 Avendus Capital Pvt Ltd 8 2.9 561 6 16 0.9 2.1
Canson Capital Partners 8 23.2 17,000 1 - - 23.2 Credit Suisse Group AG 9 2.6 492 2 - - 2.6
Guggenheim Capital LLC 8 23.2 17,000 1 - - 23.2 Jefferies LLC 10 2.1 405 1 14 1.4 0.7
Toronto-Dominion Bank/The 8 23.2 17,000 1 - - 23.2 Morgan Stanley 11 1.6 300 1 3 49.4 -47.8
HSBC Bank PLC 12 17.2 12,614 2 - - 17.2 Kotak Mahindra Bank Ltd 12 1.4 257 3 5 48.0 -46.7
Rothschild & Co 13 8.8 6,411 5 37 - 8.8 William Blair & Co LLC 13 1.2 227 1 - - 1.2
Credit Agricole Corporate & Investment Ba 14 7.4 5,389 1 - - 7.4 Standard Chartered Bank 14 0.7 136 2 17 0.8 -0.1
Credit Suisse Group AG 15 4.8 3,522 5 12 2.5 2.3 Karvey Consultants Ltd 15 0.6 111 1 - - 0.6
Moelis & Co 16 3.4 2,500 1 37 - 3.4 Allegro Capital Management Inc 15 0.6 111 1 - - 0.6
Macquarie Group Ltd 17 3.1 2,250 1 - - 3.1 Axis Bank Ltd 17 0.6 105 2 6 47.6 -47.0
China International Capital Corp Ltd 18 2.1 1,500 2 - - 2.1 KPMG Corporate Finance LLC 18 0.5 101 3 20 0.4 0.1
RHB 19 1.8 1,336 7 9 3.9 -2.0 ICICI Bank Ltd 19 0.4 82 1 28 0.1 0.4
BNP Paribas SA 20 1.8 1,333 5 - - 1.8 Veda Corporate Advisors Pvt Ltd 20 0.4 80 1 - - 0.4
TOTAL 73,265 547 TOTAL 19,114 519
RANK
MKT SHR
(%)FIRM
2018 2017MKT SHR
CHANGE FIRM
2018 2017
RANK
MKT SHR
(%)VOLUME USD
(Mln)
DEAL
COUNT RANK
MKT SHR
(%) RANK
MKT SHR
(%)VOLUME USD
(Mln)
FIRM
2018 2017MKT SHR
CHANGE FIRM
2018 2017MKT SHR
CHANGERANK
MKT SHR
(%)VOLUME USD
(Mln)
DEAL
COUNT RANK
MKT SHR
(%) RANK
MKT SHR
(%)VOLUME USD
(Mln)
DEAL
COUNT RANK
MKT SHR
(%)
37,547 1,964
21,005 27,987
MKT SHR
CHANGE
DEAL
COUNT
15
Bloomberg League Criteria
Announced Global League Tables are based upon announced total values, unless otherwise stated in the title. Non-US dollar values are
converted to US dollars at the time of announcement.
Credit will be given to transactions in which Bloomberg classifies as mergers, acquisitions, divestitures, self-tenders, or spin-offs.
Regional and industry League Tables will be based on the country of risk and industry of the ultimate publicly traded parent of a privately held company where applicable.
Advisors to any member of an investor group, consortium, or joint venture are eligible for full credit.
Advisory fees hold no weight over advisory credit.
General Database Criteria
A transaction is considered to have been announced upon the release of terms offered by the acquirer, and acknowledgement of the offer by
the target company.
Deals that are considered to be in proposed status will not be granted credit.
Full versions of Bloomberg’s League Tables Standards & Guidelines can be accessed on Bloomberg Professional:
{LEAG<GO>}: M&A
Bloomberg L.P. reserves the right of final decision concerning league eligibility and requires adequate documentation for the same. Bloomberg L.P. and its suppliers believe the information herein was obtained from reliable sources, but they do not guarantee its accuracy. Neither the information nor the opinion expressed constitutes a solicitation of the purchase or sale of securities or commodities. Due to the dynamic nature of the Professional Service product, League Table rankings may vary between the quarterly/year-end publications and data found on the Bloomberg Professional Service.
16