Global Locations Trend 2014.PDF
20
IBM Global Business Services Executive Report IBM Institute for Business Value Operations and Supply Chain Global Location Trends 2014 annual report
-
Upload
sunny-hindwani -
Category
Documents
-
view
202 -
download
2
Transcript of Global Locations Trend 2014.PDF
IBM Global Business ServicesExecutive Report
IBM Institute for Business Value
Operations and Supply Chain
Global Location Trends 2014 annual report
About IBM-Plant Location International Plant Location International is a global service of IBM Global Business Services Strategy & Analytics practice, specialized in corporate location and economic development strategies. Operating as a fully globally integrated service — with a global center of excellence in Brussels, Belgium, supported by industry and functional subject matter experts in key markets around the world — IBM-PLI provides location strategy and site selection services to corporate clients, analyzing international business locations for expanding or consolidating companies to select the optimal location (country/city). IBM-PLI also advises economic development organizations on improving their areas’ competitiveness, strategic marketing, developing value propositions and marketing tools.
Introduction
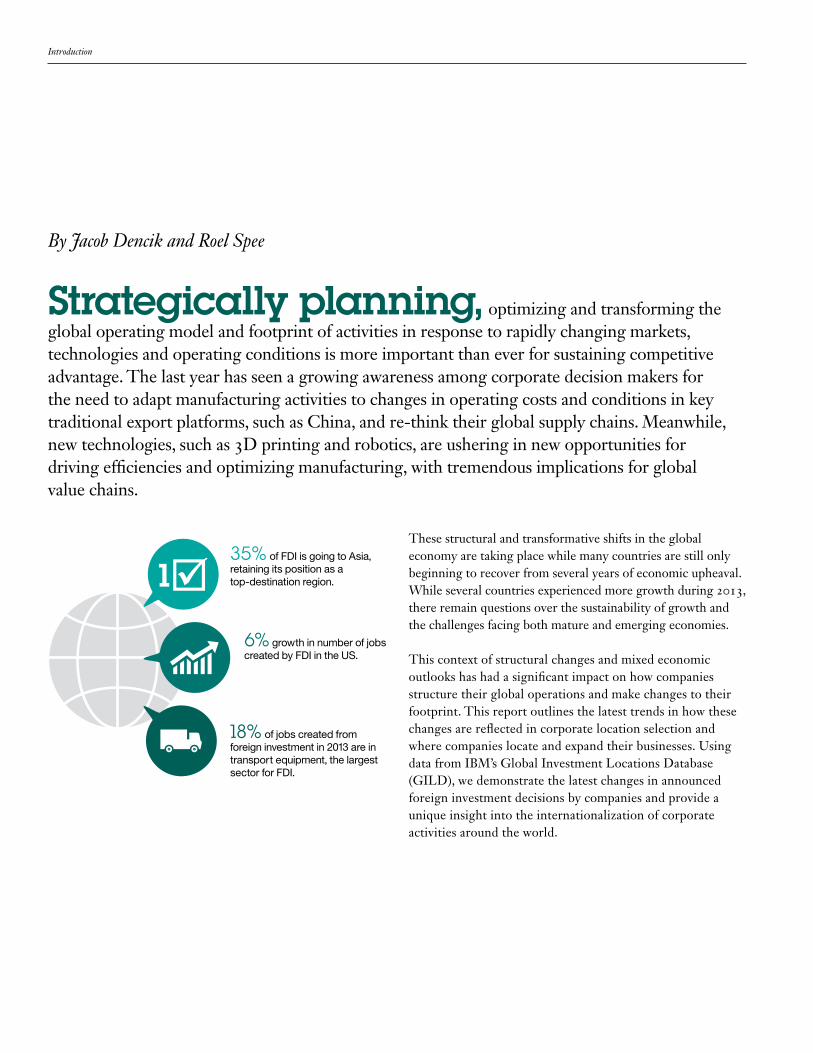
Strategically planning, optimizing and transforming the global operating model and footprint of activities in response to rapidly changing markets, technologies and operating conditions is more important than ever for sustaining competitive advantage. The last year has seen a growing awareness among corporate decision makers for the need to adapt manufacturing activities to changes in operating costs and conditions in key traditional export platforms, such as China, and re-think their global supply chains. Meanwhile, new technologies, such as 3D printing and robotics, are ushering in new opportunities for driving efficiencies and optimizing manufacturing, with tremendous implications for global value chains.
By Jacob Dencik and Roel Spee
These structural and transformative shifts in the global economy are taking place while many countries are still only beginning to recover from several years of economic upheaval. While several countries experienced more growth during 2013, there remain questions over the sustainability of growth and the challenges facing both mature and emerging economies.
This context of structural changes and mixed economic outlooks has had a significant impact on how companies structure their global operations and make changes to their footprint. This report outlines the latest trends in how these changes are reflected in corporate location selection and where companies locate and expand their businesses. Using data from IBM’s Global Investment Locations Database (GILD), we demonstrate the latest changes in announced foreign investment decisions by companies and provide a unique insight into the internationalization of corporate activities around the world.
35% of FDI is going to Asia, retaining its position as a top-destination region.
6% growth in number of jobs created by FDI in the US.
18% of jobs created from foreign investment in 2013 are in transport equipment, the largest sector for FDI.
2 Global Location Trends: 2014 annual report
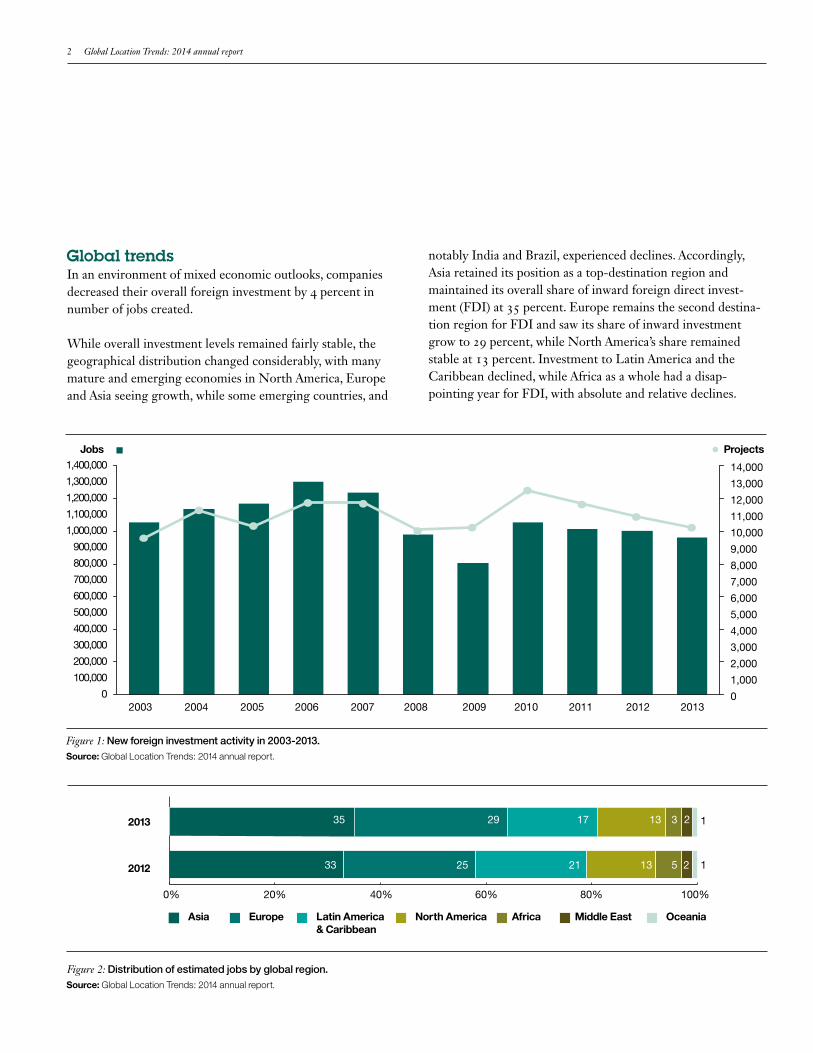
Global trendsIn an environment of mixed economic outlooks, companies decreased their overall foreign investment by 4 percent in number of jobs created.
While overall investment levels remained fairly stable, the geographical distribution changed considerably, with many mature and emerging economies in North America, Europe and Asia seeing growth, while some emerging countries, and
2003 2004 2005 2006 2007 2008 2009 2010 2011 2012 2013
Jobs1,400,000
1,300,000
1,200,000
1,100,000
1,000,000
900,000
800,000
700,000
600,000
500,000
400,000
300,000
200,000
100,000
0
14,000
13,000
12,000
11,000
10,000
9,000
8,000
7,000
6,000
5,000
4,000
3,000
2,000
1,000
0
Projects
Figure 1: New foreign investment activity in 2003-2013.
0% 20% 40% 60% 80% 100%
33 25 21 13 5
Asia
2013
2012
Europe Latin America & Caribbean
North America Africa Middle East Oceania
12
Figure 2: Distribution of estimated jobs by global region.
135 29 17 13 3 2
notably India and Brazil, experienced declines. Accordingly, Asia retained its position as a top-destination region and maintained its overall share of inward foreign direct invest-ment (FDI) at 35 percent. Europe remains the second destina-tion region for FDI and saw its share of inward investment grow to 29 percent, while North America’s share remained stable at 13 percent. Investment to Latin America and the Caribbean declined, while Africa as a whole had a disap-pointing year for FDI, with absolute and relative declines.
Source: Global Location Trends: 2014 annual report.
Source: Global Location Trends: 2014 annual report.
IBM Global Business Services 3
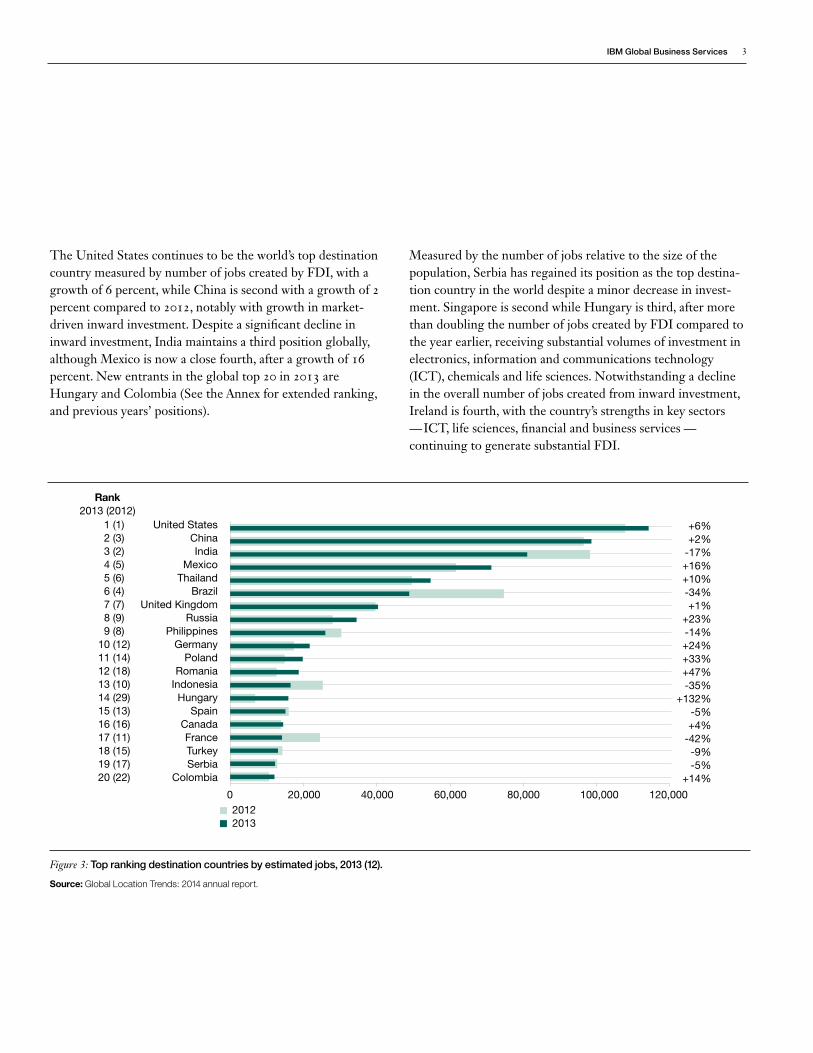
The United States continues to be the world’s top destination country measured by number of jobs created by FDI, with a growth of 6 percent, while China is second with a growth of 2 percent compared to 2012, notably with growth in market-driven inward investment. Despite a significant decline in inward investment, India maintains a third position globally, although Mexico is now a close fourth, after a growth of 16 percent. New entrants in the global top 20 in 2013 are Hungary and Colombia (See the Annex for extended ranking, and previous years’ positions).
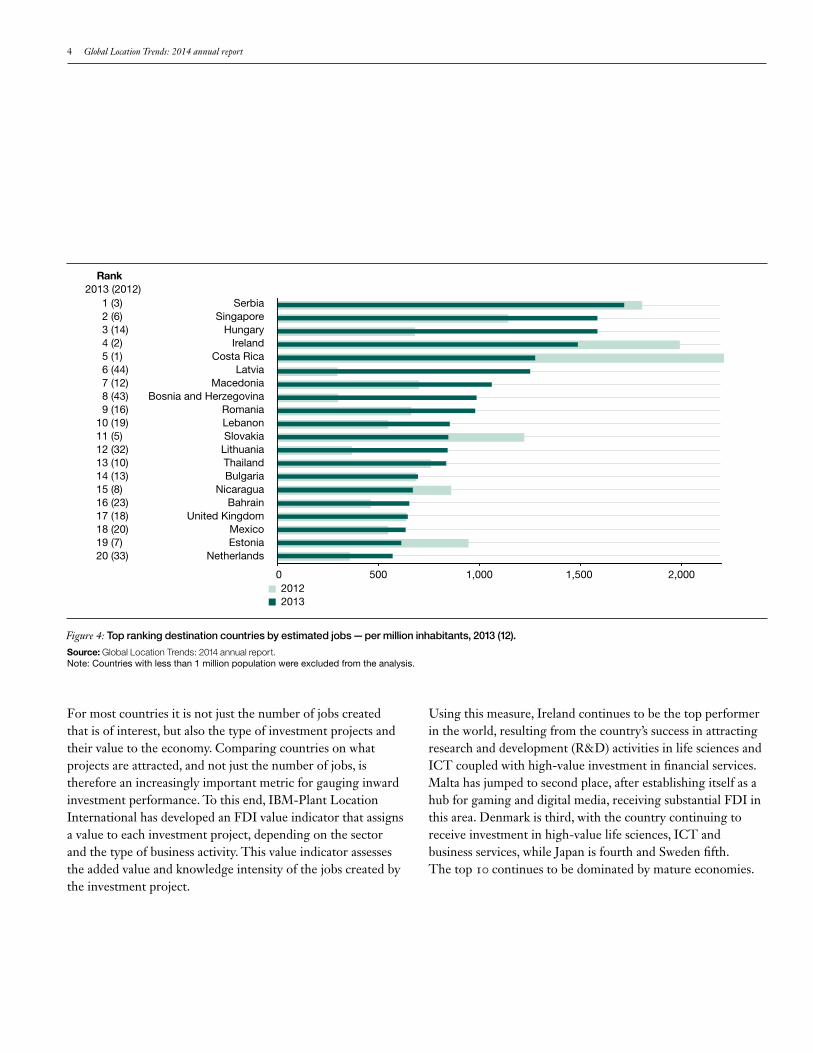
Measured by the number of jobs relative to the size of the population, Serbia has regained its position as the top destina-tion country in the world despite a minor decrease in invest-ment. Singapore is second while Hungary is third, after more than doubling the number of jobs created by FDI compared to the year earlier, receiving substantial volumes of investment in electronics, information and communications technology (ICT), chemicals and life sciences. Notwithstanding a decline in the overall number of jobs created from inward investment, Ireland is fourth, with the country’s strengths in key sectors — ICT, life sciences, financial and business services — continuing to generate substantial FDI.
United StatesChinaIndia
MexicoThailand
BrazilUnited Kingdom
Russia Philippines
Germany Poland
RomaniaIndonesiaHungary
SpainCanadaFranceTurkeySerbia
Colombia
Figure 3: Top ranking destination countries by estimated jobs, 2013 (12).
Source: Global Location Trends: 2014 annual report.
1 (1) 2 (3) 3 (2) 4 (5) 5 (6) 6 (4) 7 (7) 8 (9) 9 (8)10 (12)11 (14)12 (18)13 (10)14 (29)15 (13)16 (16)17 (11)18 (15)19 (17)20 (22)
0 20,000 40,000 60,000 80,000 100,000 120,00020122013
Rank2013 (2012)
+6%+2%
-17%+16%+10%-34%+1%
+23%-14%+24%+33%+47%-35%
+132%-5%+4%
-42%-9%-5%
+14%
4 Global Location Trends: 2014 annual report
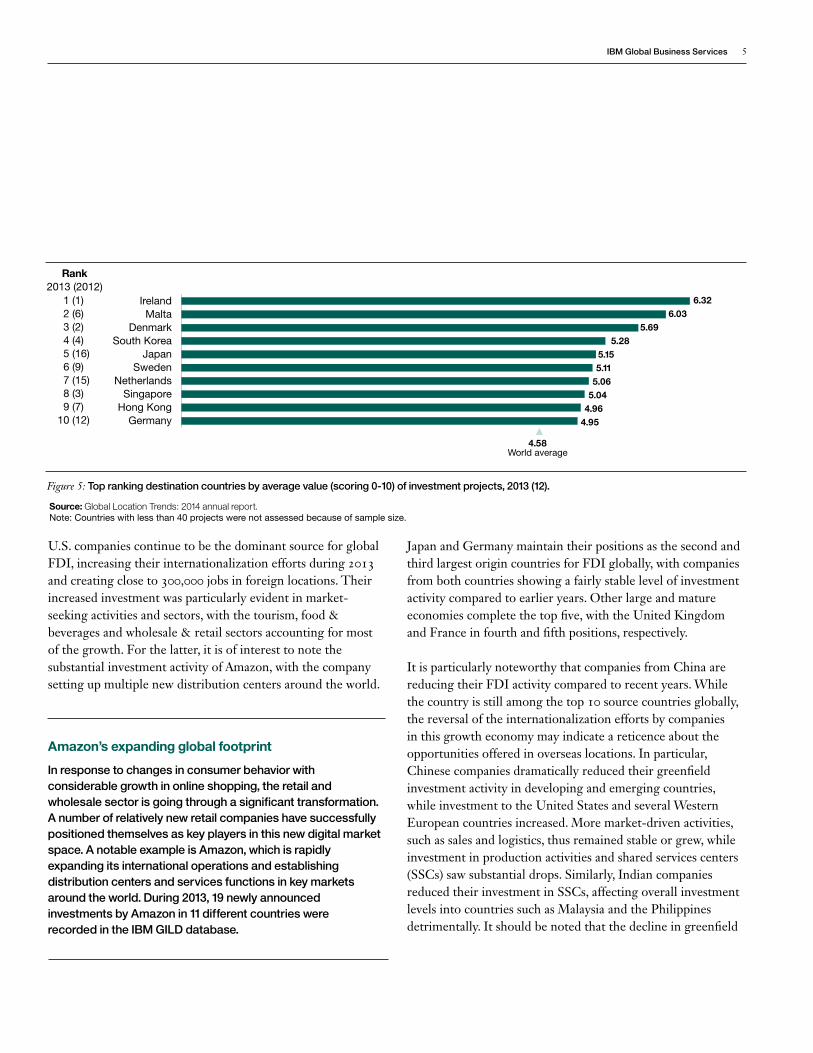
For most countries it is not just the number of jobs created that is of interest, but also the type of investment projects and their value to the economy. Comparing countries on what projects are attracted, and not just the number of jobs, is therefore an increasingly important metric for gauging inward investment performance. To this end, IBM-Plant Location International has developed an FDI value indicator that assigns a value to each investment project, depending on the sector and the type of business activity. This value indicator assesses the added value and knowledge intensity of the jobs created by the investment project.
Using this measure, Ireland continues to be the top performer in the world, resulting from the country’s success in attracting research and development (R&D) activities in life sciences and ICT coupled with high-value investment in financial services. Malta has jumped to second place, after establishing itself as a hub for gaming and digital media, receiving substantial FDI in this area. Denmark is third, with the country continuing to receive investment in high-value life sciences, ICT and business services, while Japan is fourth and Sweden fifth. The top 10 continues to be dominated by mature economies.
SerbiaSingapore
HungaryIreland
Costa RicaLatvia
MacedoniaBosnia and Herzegovina
RomaniaLebanonSlovakia
LithuaniaThailandBulgaria
NicaraguaBahrain
United KingdomMexicoEstonia
Netherlands
Figure 4: Top ranking destination countries by estimated jobs — per million inhabitants, 2013 (12).
1 (3) 2 (6) 3 (14) 4 (2) 5 (1) 6 (44) 7 (12) 8 (43) 9 (16)10 (19)11 (5)12 (32)13 (10)14 (13)15 (8)16 (23)17 (18)18 (20)19 (7)20 (33)
0 500 1,000 1,500 2,00020122013
Rank 2013 (2012)
Source: Global Location Trends: 2014 annual report.Note: Countries with less than 1 million population were excluded from the analysis.
IBM Global Business Services 5
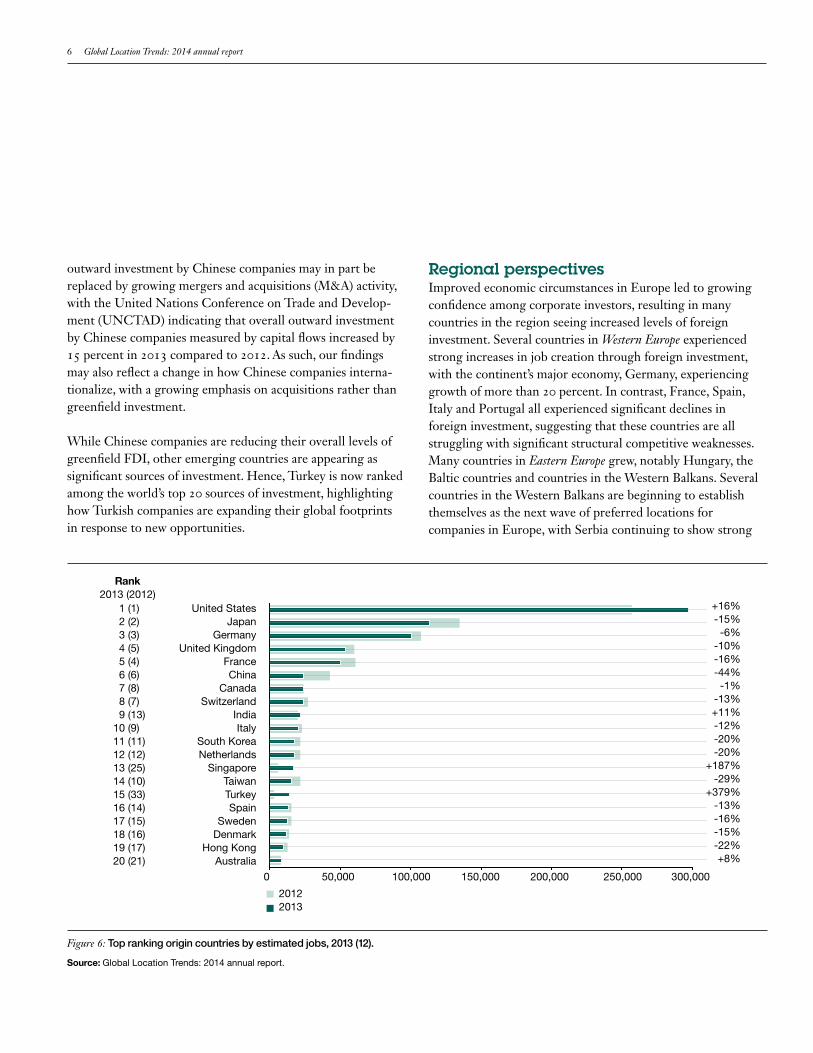
U.S. companies continue to be the dominant source for global FDI, increasing their internationalization efforts during 2013 and creating close to 300,000 jobs in foreign locations. Their increased investment was particularly evident in market-seeking activities and sectors, with the tourism, food & beverages and wholesale & retail sectors accounting for most of the growth. For the latter, it is of interest to note the substantial investment activity of Amazon, with the company setting up multiple new distribution centers around the world.
Amazon’s expanding global footprint
In response to changes in consumer behavior with considerable growth in online shopping, the retail and wholesale sector is going through a significant transformation. A number of relatively new retail companies have successfully positioned themselves as key players in this new digital market space. A notable example is Amazon, which is rapidly expanding its international operations and establishing distribution centers and services functions in key markets around the world. During 2013, 19 newly announced investments by Amazon in 11 different countries were recorded in the IBM GILD database.
Japan and Germany maintain their positions as the second and third largest origin countries for FDI globally, with companies from both countries showing a fairly stable level of investment activity compared to earlier years. Other large and mature economies complete the top five, with the United Kingdom and France in fourth and fifth positions, respectively.
It is particularly noteworthy that companies from China are reducing their FDI activity compared to recent years. While the country is still among the top 10 source countries globally, the reversal of the internationalization efforts by companies in this growth economy may indicate a reticence about the opportunities offered in overseas locations. In particular, Chinese companies dramatically reduced their greenfield investment activity in developing and emerging countries, while investment to the United States and several Western European countries increased. More market-driven activities, such as sales and logistics, thus remained stable or grew, while investment in production activities and shared services centers (SSCs) saw substantial drops. Similarly, Indian companies reduced their investment in SSCs, affecting overall investment levels into countries such as Malaysia and the Philippines detrimentally. It should be noted that the decline in greenfield
IrelandMalta
DenmarkSouth Korea
JapanSweden
NetherlandsSingapore
Hong KongGermany
6.326.03
5.695.28
5.155.11
5.065.04
4.964.95
4.58World average
Figure 5: Top ranking destination countries by average value (scoring 0-10) of investment projects, 2013 (12).
1 (1) 2 (6) 3 (2) 4 (4) 5 (16) 6 (9) 7 (15) 8 (3) 9 (7)10 (12)
Rank2013 (2012)
Source: Global Location Trends: 2014 annual report.Note: Countries with less than 40 projects were not assessed because of sample size.
6 Global Location Trends: 2014 annual report
outward investment by Chinese companies may in part be replaced by growing mergers and acquisitions (M&A) activity, with the United Nations Conference on Trade and Develop-ment (UNCTAD) indicating that overall outward investment by Chinese companies measured by capital flows increased by 15 percent in 2013 compared to 2012. As such, our findings may also reflect a change in how Chinese companies interna-tionalize, with a growing emphasis on acquisitions rather than greenfield investment.
While Chinese companies are reducing their overall levels of greenfield FDI, other emerging countries are appearing as significant sources of investment. Hence, Turkey is now ranked among the world’s top 20 sources of investment, highlighting how Turkish companies are expanding their global footprints in response to new opportunities.
Regional perspectivesImproved economic circumstances in Europe led to growing confidence among corporate investors, resulting in many countries in the region seeing increased levels of foreign investment. Several countries in Western Europe experienced strong increases in job creation through foreign investment, with the continent’s major economy, Germany, experiencing growth of more than 20 percent. In contrast, France, Spain, Italy and Portugal all experienced significant declines in foreign investment, suggesting that these countries are all struggling with significant structural competitive weaknesses. Many countries in Eastern Europe grew, notably Hungary, the Baltic countries and countries in the Western Balkans. Several countries in the Western Balkans are beginning to establish themselves as the next wave of preferred locations for companies in Europe, with Serbia continuing to show strong
United StatesJapan
GermanyUnited Kingdom
FranceChina
CanadaSwitzerland
IndiaItaly
South KoreaNetherlands
SingaporeTaiwanTurkeySpain
SwedenDenmark
Hong KongAustralia
Figure 6: Top ranking origin countries by estimated jobs, 2013 (12).
Source: Global Location Trends: 2014 annual report.
1 (1) 2 (2) 3 (3) 4 (5) 5 (4) 6 (6) 7 (8) 8 (7) 9 (13)10 (9)11 (11)12 (12)13 (25)14 (10)15 (33)16 (14)17 (15)18 (16)19 (17)20 (21)
0 50,000 100,000 150,000 200,000 250,000 300,000
20122013
Rank2013 (2012)
+16%-15%-6%
-10%-16%-44%-1%
-13%+11%-12%-20%-20%
+187%-29%
+379%-13%-16%-15%-22%+8%
IBM Global Business Services 7
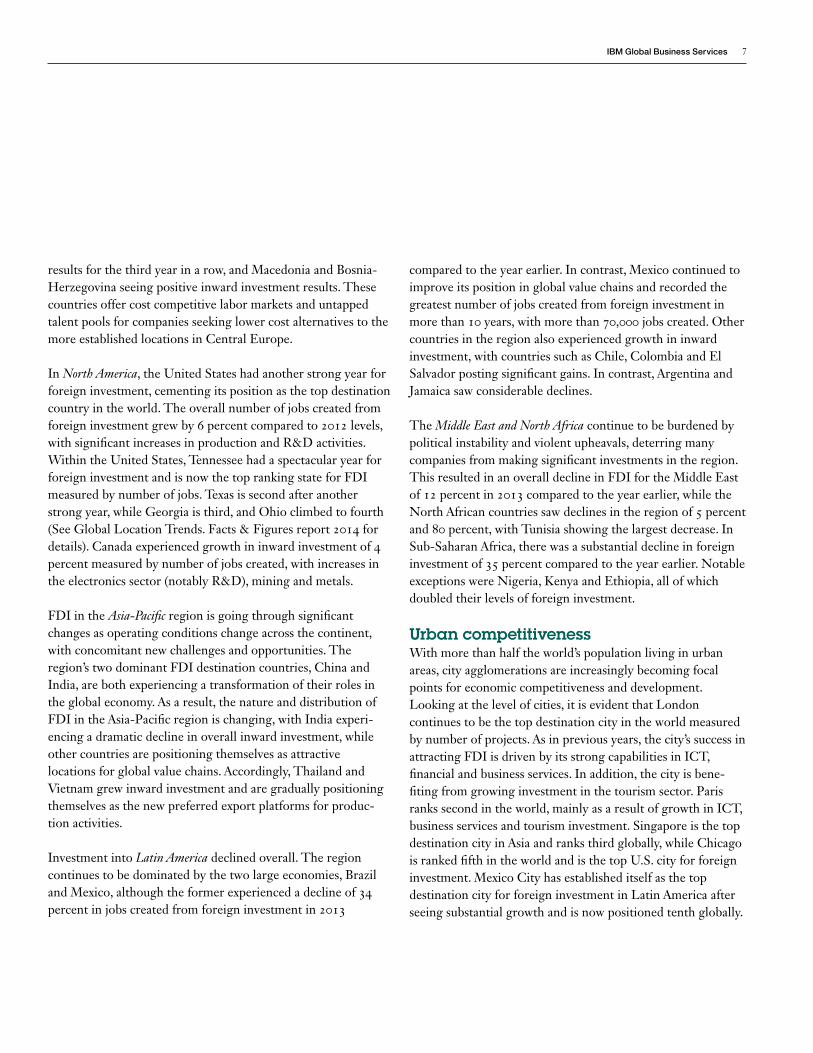
compared to the year earlier. In contrast, Mexico continued to improve its position in global value chains and recorded the greatest number of jobs created from foreign investment in more than 10 years, with more than 70,000 jobs created. Other countries in the region also experienced growth in inward investment, with countries such as Chile, Colombia and El Salvador posting significant gains. In contrast, Argentina and Jamaica saw considerable declines.
The Middle East and North Africa continue to be burdened by political instability and violent upheavals, deterring many companies from making significant investments in the region. This resulted in an overall decline in FDI for the Middle East of 12 percent in 2013 compared to the year earlier, while the North African countries saw declines in the region of 5 percent and 80 percent, with Tunisia showing the largest decrease. In Sub-Saharan Africa, there was a substantial decline in foreign investment of 35 percent compared to the year earlier. Notable exceptions were Nigeria, Kenya and Ethiopia, all of which doubled their levels of foreign investment.
Urban competitiveness With more than half the world’s population living in urban areas, city agglomerations are increasingly becoming focal points for economic competitiveness and development. Looking at the level of cities, it is evident that London continues to be the top destination city in the world measured by number of projects. As in previous years, the city’s success in attracting FDI is driven by its strong capabilities in ICT, financial and business services. In addition, the city is bene-fiting from growing investment in the tourism sector. Paris ranks second in the world, mainly as a result of growth in ICT, business services and tourism investment. Singapore is the top destination city in Asia and ranks third globally, while Chicago is ranked fifth in the world and is the top U.S. city for foreign investment. Mexico City has established itself as the top destination city for foreign investment in Latin America after seeing substantial growth and is now positioned tenth globally.
results for the third year in a row, and Macedonia and Bosnia-Herzegovina seeing positive inward investment results. These countries offer cost competitive labor markets and untapped talent pools for companies seeking lower cost alternatives to the more established locations in Central Europe.
In North America, the United States had another strong year for foreign investment, cementing its position as the top destination country in the world. The overall number of jobs created from foreign investment grew by 6 percent compared to 2012 levels, with significant increases in production and R&D activities. Within the United States, Tennessee had a spectacular year for foreign investment and is now the top ranking state for FDI measured by number of jobs. Texas is second after another strong year, while Georgia is third, and Ohio climbed to fourth (See Global Location Trends. Facts & Figures report 2014 for details). Canada experienced growth in inward investment of 4 percent measured by number of jobs created, with increases in the electronics sector (notably R&D), mining and metals.
FDI in the Asia-Pacific region is going through significant changes as operating conditions change across the continent, with concomitant new challenges and opportunities. The region’s two dominant FDI destination countries, China and India, are both experiencing a transformation of their roles in the global economy. As a result, the nature and distribution of FDI in the Asia-Pacific region is changing, with India experi-encing a dramatic decline in overall inward investment, while other countries are positioning themselves as attractive locations for global value chains. Accordingly, Thailand and Vietnam grew inward investment and are gradually positioning themselves as the new preferred export platforms for produc-tion activities.
Investment into Latin America declined overall. The region continues to be dominated by the two large economies, Brazil and Mexico, although the former experienced a decline of 34 percent in jobs created from foreign investment in 2013
8 Global Location Trends: 2014 annual report
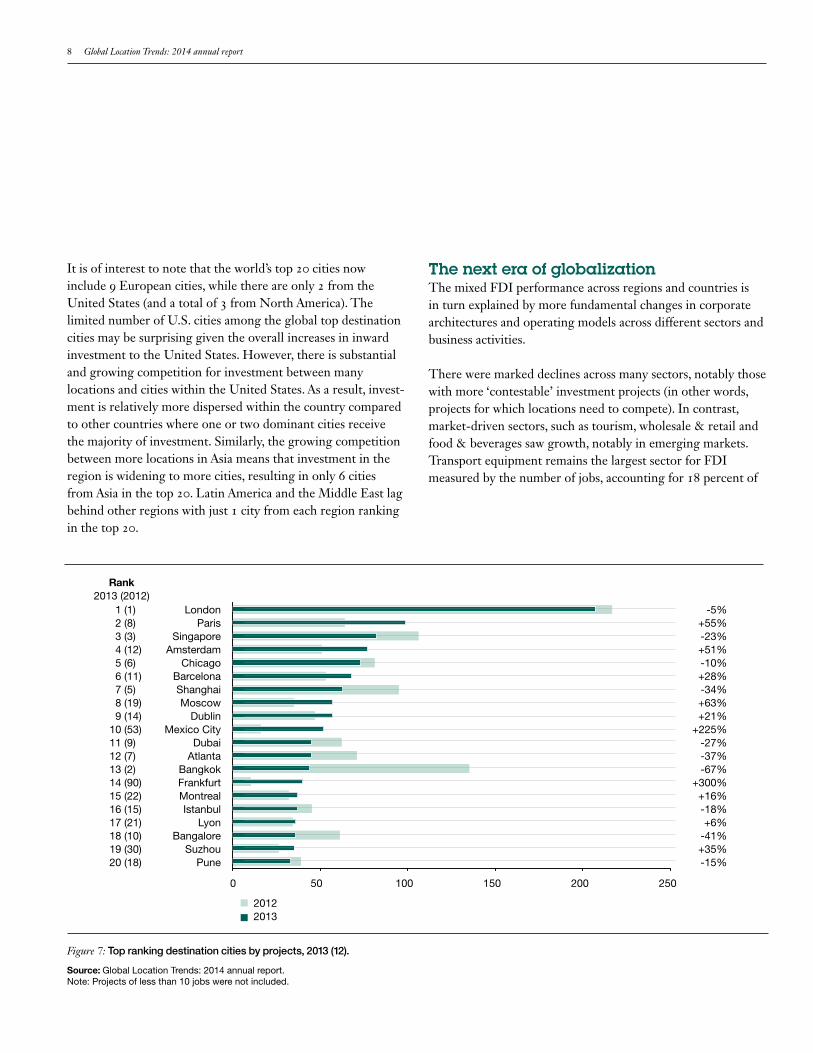
It is of interest to note that the world’s top 20 cities now include 9 European cities, while there are only 2 from the United States (and a total of 3 from North America). The limited number of U.S. cities among the global top destination cities may be surprising given the overall increases in inward investment to the United States. However, there is substantial and growing competition for investment between many locations and cities within the United States. As a result, invest-ment is relatively more dispersed within the country compared to other countries where one or two dominant cities receive the majority of investment. Similarly, the growing competition between more locations in Asia means that investment in the region is widening to more cities, resulting in only 6 cities from Asia in the top 20. Latin America and the Middle East lag behind other regions with just 1 city from each region ranking in the top 20.
The next era of globalization The mixed FDI performance across regions and countries is in turn explained by more fundamental changes in corporate architectures and operating models across different sectors and business activities.
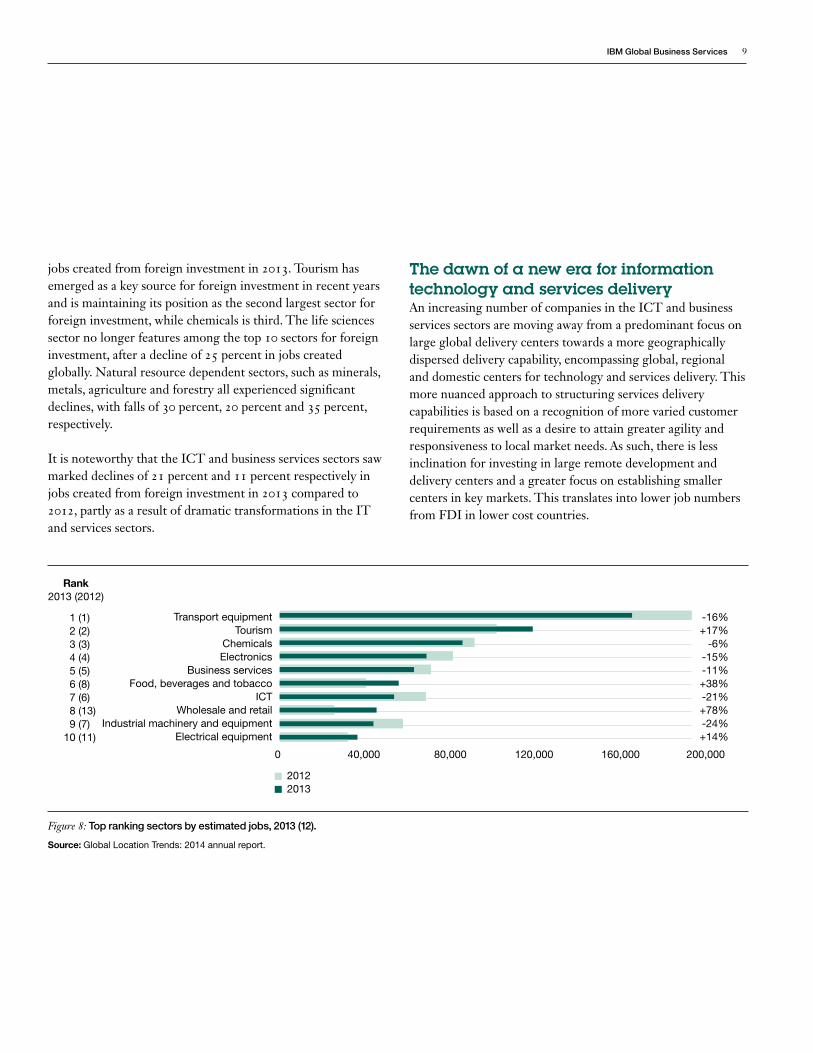
There were marked declines across many sectors, notably those with more ‘contestable’ investment projects (in other words, projects for which locations need to compete). In contrast, market-driven sectors, such as tourism, wholesale & retail and food & beverages saw growth, notably in emerging markets. Transport equipment remains the largest sector for FDI measured by the number of jobs, accounting for 18 percent of
LondonParis
SingaporeAmsterdam
ChicagoBarcelonaShanghaiMoscow
DublinMexico City
DubaiAtlanta
BangkokFrankfurtMontrealIstanbul
LyonBangalore
SuzhouPune
Figure 7: Top ranking destination cities by projects, 2013 (12).
Source: Global Location Trends: 2014 annual report. Note: Projects of less than 10 jobs were not included.
1 (1) 2 (8) 3 (3) 4 (12) 5 (6) 6 (11) 7 (5) 8 (19) 9 (14)10 (53)11 (9)12 (7)13 (2)14 (90)15 (22)16 (15)17 (21)18 (10)19 (30)20 (18)
0 50 100 150 200 250
20122013
Rank2013 (2012)
-5%+55%-23%+51%-10%+28%-34%+63%+21%
+225%-27%-37%-67%
+300%+16%-18%+6%
-41%+35%-15%
IBM Global Business Services 9
jobs created from foreign investment in 2013. Tourism has emerged as a key source for foreign investment in recent years and is maintaining its position as the second largest sector for foreign investment, while chemicals is third. The life sciences sector no longer features among the top 10 sectors for foreign investment, after a decline of 25 percent in jobs created globally. Natural resource dependent sectors, such as minerals, metals, agriculture and forestry all experienced significant declines, with falls of 30 percent, 20 percent and 35 percent, respectively.
It is noteworthy that the ICT and business services sectors saw marked declines of 21 percent and 11 percent respectively in jobs created from foreign investment in 2013 compared to 2012, partly as a result of dramatic transformations in the IT and services sectors.
The dawn of a new era for information technology and services deliveryAn increasing number of companies in the ICT and business services sectors are moving away from a predominant focus on large global delivery centers towards a more geographically dispersed delivery capability, encompassing global, regional and domestic centers for technology and services delivery. This more nuanced approach to structuring services delivery capabilities is based on a recognition of more varied customer requirements as well as a desire to attain greater agility and responsiveness to local market needs. As such, there is less inclination for investing in large remote development and delivery centers and a greater focus on establishing smaller centers in key markets. This translates into lower job numbers from FDI in lower cost countries.
Transport equipmentTourism
ChemicalsElectronics
Business servicesFood, beverages and tobacco
ICTWholesale and retail
Industrial machinery and equipmentElectrical equipment
Figure 8: Top ranking sectors by estimated jobs, 2013 (12).
Source: Global Location Trends: 2014 annual report.
0 40,000 80,000 120,000 160,000 200,000
20122013
1 (1) 2 (2) 3 (3) 4 (4) 5 (5) 6 (8) 7 (6) 8 (13) 9 (7)10 (11)
Rank2013 (2012)
-16%+17%
-6%-15%-11%+38%-21%+78%-24%+14%
10 Global Location Trends: 2014 annual report
In addition, the business process outsourcing (BPO) and SSC models are increasingly being adopted for more and higher value activities and functions, leading to different requirements and types of centers. In some cases, this leads to smaller centers with higher skills requirements, while other companies are implementing multi-functional centers, where locations have to be able to accommodate more varied skills needs.
Moreover, the ICT industry is going through a dramatic transformation with significant implications for FDI, as cloud, data, mobile and social technologies are reconfiguring the way information technology is provided to and used by organiza-tions and individuals. These new technologies are creating substantial new opportunities and transformational challenges for existing players in the ICT industry, while also generating a flurry of start-up activity and the emergence of rapidly growing small and medium sized enterprises in niche areas. The combination of these developments has in turn led to increased M&A activity within the sector, as cash-rich established companies acquire emerging niche companies with specialized intellectual property and capabilities in strategic growth domains. Furthermore, we are seeing a number of ICT companies establishing niche centers of competence in key areas, such as cloud computing. These centers are often smaller and tend to be located in more mature markets where new ideas and solutions can be co-developed and tested with clients. As such, the technological changes that are transforming the ICT industry are resulting in a different kind of investment activity, with greater M&A activity and strategic investment in key capabilities, which does not translate into the same large greenfield FDI seen in earlier years.
Outside of the ICT and business services sectors, it is also evident that the internal services activities of companies across sectors are changing. As companies begin to implement the shared services model for higher value activities, the centers are smaller and driven by qualitative as much as cost consider-ations. Consequently, companies are looking for a different type of location solution, favoring locations with a combination of relevant talent pools and attractive operating costs coupled with greater proximity to clients and key business operations.
Taken together, these changes translate into a substantial reduction in overall foreign investment in services activities, notably BPO and SSC.
Near-shoring, new export-platforms and complex supply chains — a new era for global manufacturingIn production, we are witnessing a considerable reconfigura-tion of global corporate operations, as companies are seeking alternatives to some of the world’s manufacturing hotspots, notably China. Accordingly, China has in recent years experi-enced a significant decline in inward production investment of 44 percent compared to 2010 levels, as increasing costs and questions about quality deterred companies from locating new or expanding facilities in the country. In response to these changing operating conditions, we are witnessing different strategic responses by companies. For labor-intensive cost sensitive operations, notably in sectors with low margins such as textiles, companies looked to other lower cost countries for their production activities. Particularly, Vietnam and Thailand benefitted from increases in inward production investment of 16 percent and 19 percent, respectively year-on-year.
IBM Global Business Services 11
China’s new role as FDI location
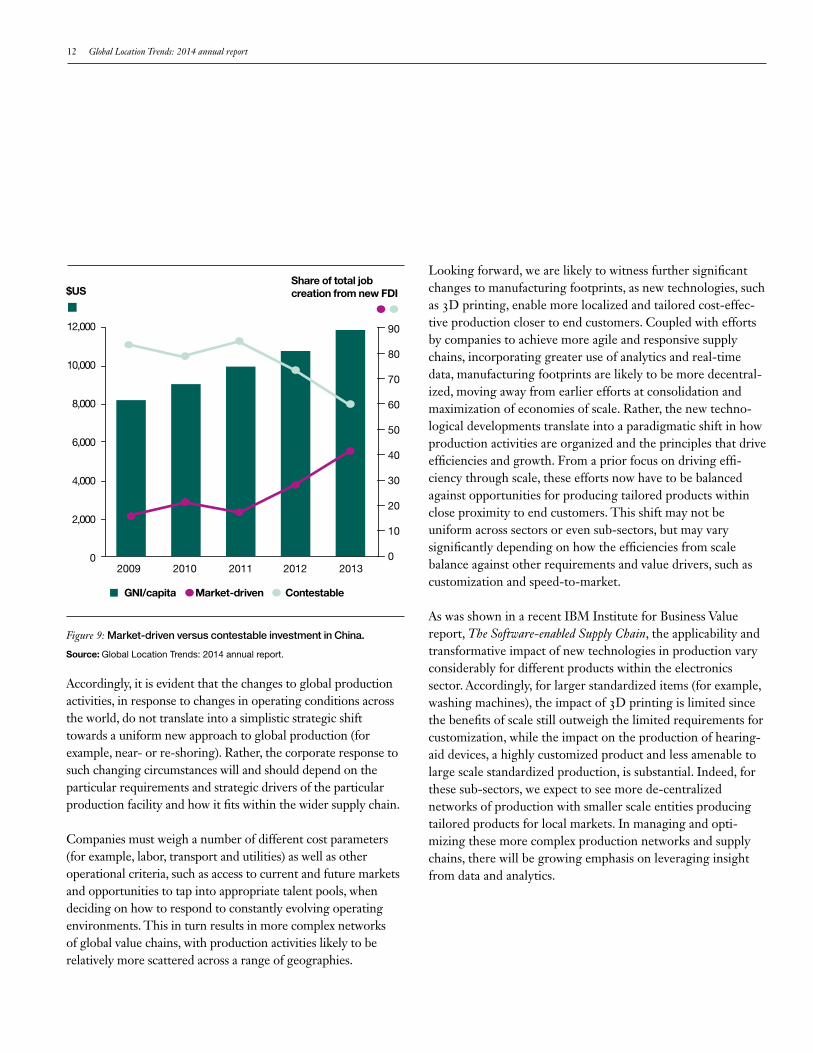
Having been the world’s leading export platform and recipient of production investment for many years, China is in the process of transforming its role in the global economy. As incomes, and thus labor costs, rise, the country is receiving substantially more market-driven foreign investment, such as sales offices, logistics, tourism, wholesale & retail, which aims to serve a growing Chinese market. Meanwhile, investment in production activities for serving international markets is declining. Such activities are in turn going to other emerging locations, for example, Thailand, Vietnam or Indonesia, which offer more attractive operating costs and improving business environments. Alternatively, they locate closer to key markets as companies re-evaluate the costs and benefits of producing from remote locations. As is evident from Figure 9, China has seen a gradual increase in the share of market-driven foreign investment, while activities serving international markets have declined as incomes and operating costs have increased.
As such, China’s role in the global economy is continuing the change we noted in last year’s report and the country is becoming increasingly interesting to companies as a market in its own right, rather than as an export platform with an emphasis on production for international markets.
Moreover, the role of China in global value chains is increasingly moving away from being a host to more cost sensitive activities and is focusing on higher value segments that seek to tap into the country’s talent base and leverage competencies and capabilities.
For production activities that are less labor intensive but are relatively more sensitive to transportation costs, such as many of the production activities in the transport equipment supply chains, the changing operating conditions in China, coupled with improvements in conditions closer to home markets, are resulting in some companies locating new production facilities near or within their key markets (often referred to as ‘near-shoring’). Key beneficiaries of this development have been Mexico and various U.S. states for the North American market and countries in Central and Eastern Europe for the European markets. Hungary experienced a 132 percent increase in foreign investment and countries in the Western Balkans (for example, Serbia, Macedonia and Bosnia-Herzegovina) also saw substantial increases in foreign investment.
A third group of companies are choosing to maintain their production activities in China, but aim to achieve productivity improvements through increased automation and adoption of leaner production processes, thus compensating for the rising labor costs. In addition, some companies are seeking alterna-tive locations within China, deciding to set up new production activities, or relocate existing operations away from the large coastal tier-one cities towards tier-two cities such as Chengdu, Wuhan and Xi’an. This response is particularly evident among companies with production activities that are in part intended to serve the rapidly growing domestic Chinese market as well as markets overseas, and thus attach strategic importance to remaining in the country.
12 Global Location Trends: 2014 annual report
Accordingly, it is evident that the changes to global production activities, in response to changes in operating conditions across the world, do not translate into a simplistic strategic shift towards a uniform new approach to global production (for example, near- or re-shoring). Rather, the corporate response to such changing circumstances will and should depend on the particular requirements and strategic drivers of the particular production facility and how it fits within the wider supply chain.
Companies must weigh a number of different cost parameters (for example, labor, transport and utilities) as well as other operational criteria, such as access to current and future markets and opportunities to tap into appropriate talent pools, when deciding on how to respond to constantly evolving operating environments. This in turn results in more complex networks of global value chains, with production activities likely to be relatively more scattered across a range of geographies.
Looking forward, we are likely to witness further significant changes to manufacturing footprints, as new technologies, such as 3D printing, enable more localized and tailored cost-effec-tive production closer to end customers. Coupled with efforts by companies to achieve more agile and responsive supply chains, incorporating greater use of analytics and real-time data, manufacturing footprints are likely to be more decentral-ized, moving away from earlier efforts at consolidation and maximization of economies of scale. Rather, the new techno-logical developments translate into a paradigmatic shift in how production activities are organized and the principles that drive efficiencies and growth. From a prior focus on driving effi-ciency through scale, these efforts now have to be balanced against opportunities for producing tailored products within close proximity to end customers. This shift may not be uniform across sectors or even sub-sectors, but may vary significantly depending on how the efficiencies from scale balance against other requirements and value drivers, such as customization and speed-to-market.
As was shown in a recent IBM Institute for Business Value report, The Software-enabled Supply Chain, the applicability and transformative impact of new technologies in production vary considerably for different products within the electronics sector. Accordingly, for larger standardized items (for example, washing machines), the impact of 3D printing is limited since the benefits of scale still outweigh the limited requirements for customization, while the impact on the production of hearing-aid devices, a highly customized product and less amenable to large scale standardized production, is substantial. Indeed, for these sub-sectors, we expect to see more de-centralized networks of production with smaller scale entities producing tailored products for local markets. In managing and opti-mizing these more complex production networks and supply chains, there will be growing emphasis on leveraging insight from data and analytics.
Source: Global Location Trends: 2014 annual report.
2009 2010 2011 2012 2013
$US
12,000
10,000
8,000
6,000
4,000
2,000
0
90
80
70
60
50
40
30
20
10
0
Share of total job creation from new FDI
Figure 9: Market-driven versus contestable investment in China.
GNI/capita Market-driven Contestable
IBM Global Business Services 13
These efforts have to be led by a professional and effective economic development organization with a clear mandate to plan, coordinate and execute the location’s economic develop-ment strategy. Findings from our Global Location Trends reports in the past few years highlight the risks and detrimental impacts associated with weak or disrupted economic develop-ment efforts, with some countries and cities seeing poor FDI performance as a result of ineffective, or even absent, economic development organizations. Consequently, local governments and stakeholders need to critically review the performance of these organizations and ensure that activities are aligned with the wider economic development strategy. These agencies play a critical role in executing and delivering the economic development objectives of a location, and their activities should be focused on providing the best possible opportunities for the location to benefit from the changing market for FDI.
In some cases, this may involve a widening of the organization’s mandate beyond traditional investment promotion activities to include cluster development. This should be focused on key target sectors and clusters and involve a number of activities to foster innovation, skills development, partnerships and entre-preneurship among indigenous and foreign companies. In some cases, a particular cluster may take on such importance that it merits a separate cluster organization that operates in collabo-ration with and reports to the local economic development organization. Examples of these include the Copenhagen Cleantech Cluster and Tech City UK in London, which both have dedicated teams and resources for developing their locations’ clusters in Cleantech and ICT and digital technolo-gies, respectively. With the growing emphasis on skills, compe-tencies and innovation as key factors for competitive advan-tages, such cluster development activities and organizations are likely to take on a more prominent role in the future.
Implications for economic developmentAs companies adapt to a changing global economy, so policy makers tasked with stimulating economic development and job creation in their respective locations are faced with new challenges. Firstly, they need to understand how the new corporate operating models and types of investment projects translate into new location requirements and ascertain how their location is positioned in view of this. This entails a more nuanced assessment of their location’s capabilities and compe-tencies in areas of growth, such as the emerging services and competence centers or new types of manufacturing facilities, resulting from a wish to be close to market or leverage the latest technological developments.
Furthermore, they need to ensure that their locations align skills supply and demand in key target sectors. Across the world, companies are heard complaining about the mismatch between the skills provided by local education systems and those they require to maintain their competitiveness. Engaging companies and relevant sector representatives in shaping and providing education and training can help align supply and demand for skills and ensure that a location’s talent and competencies are viewed as a clear competitive advantage.
This is particularly relevant for many cities, regions and countries where unemployment and under-employment, notably among the young, is a pressing societal challenge that must urgently be addressed. Ensuring that people obtain skills that are relevant for industry is a key priority in these efforts and need to involve all relevant stakeholders in the develop-ment of tailored skills strategies for key sectors and industries. This is particularly relevant for industries such as the ICT sector that are subject to considerable, and in some cases transformative, change.
14 Global Location Trends: 2014 annual report
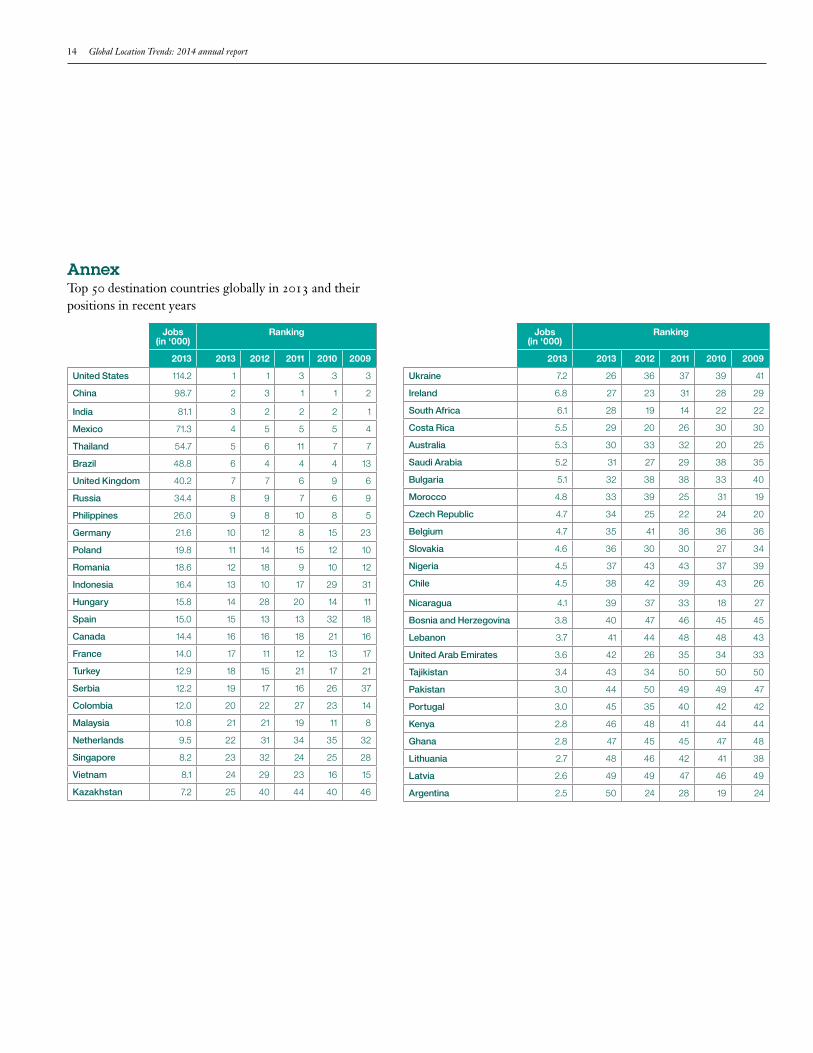
AnnexTop 50 destination countries globally in 2013 and their positions in recent years
Jobs (in ‘000)
Ranking
2013 2013 2012 2011 2010 2009
United States 114.2 1 1 3 3 3
China 98.7 2 3 1 1 2
India 81.1 3 2 2 2 1
Mexico 71.3 4 5 5 5 4
Thailand 54.7 5 6 11 7 7
Brazil 48.8 6 4 4 4 13
United Kingdom 40.2 7 7 6 9 6
Russia 34.4 8 9 7 6 9
Philippines 26.0 9 8 10 8 5
Germany 21.6 10 12 8 15 23
Poland 19.8 11 14 15 12 10
Romania 18.6 12 18 9 10 12
Indonesia 16.4 13 10 17 29 31
Hungary 15.8 14 28 20 14 11
Spain 15.0 15 13 13 32 18
Canada 14.4 16 16 18 21 16
France 14.0 17 11 12 13 17
Turkey 12.9 18 15 21 17 21
Serbia 12.2 19 17 16 26 37
Colombia 12.0 20 22 27 23 14
Malaysia 10.8 21 21 19 11 8
Netherlands 9.5 22 31 34 35 32
Singapore 8.2 23 32 24 25 28
Vietnam 8.1 24 29 23 16 15
Kazakhstan 7.2 25 40 44 40 46
Jobs (in ‘000)
Ranking
2013 2013 2012 2011 2010 2009
Ukraine 7.2 26 36 37 39 41
Ireland 6.8 27 23 31 28 29
South Africa 6.1 28 19 14 22 22
Costa Rica 5.5 29 20 26 30 30
Australia 5.3 30 33 32 20 25
Saudi Arabia 5.2 31 27 29 38 35
Bulgaria 5.1 32 38 38 33 40
Morocco 4.8 33 39 25 31 19
Czech Republic 4.7 34 25 22 24 20
Belgium 4.7 35 41 36 36 36
Slovakia 4.6 36 30 30 27 34
Nigeria 4.5 37 43 43 37 39
Chile 4.5 38 42 39 43 26
Nicaragua 4.1 39 37 33 18 27
Bosnia and Herzegovina 3.8 40 47 46 45 45
Lebanon 3.7 41 44 48 48 43
United Arab Emirates 3.6 42 26 35 34 33
Tajikistan 3.4 43 34 50 50 50
Pakistan 3.0 44 50 49 49 47
Portugal 3.0 45 35 40 42 42
Kenya 2.8 46 48 41 44 44
Ghana 2.8 47 45 45 47 48
Lithuania 2.7 48 46 42 41 38
Latvia 2.6 49 49 47 46 49
Argentina 2.5 50 24 28 19 24
IBM Global Business Services 15
About the authorsJacob Dencik is a Senior Managing Consultant with IBM-Plant Location International, with extensive experience advising companies around the world on their global operations and location strategies. He has also advised many regional, national and international government organizations as an expert and economist on competitiveness, FDI, sector/cluster analysis and innovation. Jacob is a co-author and contributing author of two recent books about economic development. He can be reached at [email protected].
Roel Spee is the Global Leader of IBM-Plant Location International (IBM-PLI), the IBM Global Business Services global center of excellence for corporate location strategies and economic development services. He has 25+ years of experience as a location strategy and economic development consultant and has advised international companies on location choices for a broad range of industries and investment projects. He has assisted corporate executives from international companies around the world with strategic location choices for over 300 projects, including manufacturing plants, distribution centers, headquarters, R&D operations, shared services centers and data centers across a variety of industries. Roel can be reached at [email protected].
ContributorsDavid Zaharchuk Research Lead IBM Institute for Business Value [email protected]
Patsy Van Hove Senior Managing Consultant IBM-Plant Location International IBM Global Business Services [email protected]
Koen Gijpers Managing Consultant IBM-Plant Location International IBM Global Business Services [email protected]
Additional support for the 2014 Global Location Trends report was provided by Katrien Castelain, Juan Francisco Achucarro, Akram Al-Rajehi, Sven Boon, Xenia Cernisenco, Stefano Di Napoli, Chunyao Du, Ulfat Hajiyev, Anett Imeli, Benedikt Simon Lebert, Wanglin Liu, Leonor Miranda, Riikka Puroveli, Sunny Sundrani, Tom Vandevelde, Elina Vilchinskaya, Bogumila Zukowska.
16 Global Location Trends: 2014 annual report
To learn more about this IBM Institute for Business Value study, please contact us at [email protected]. Follow @IBMIBV on Twitter, and for a full catalog of our research or to subscribe to our monthly newsletter, visit: ibm.com/iibv
Access IBM Institute for Business Value executive reports on your tablet by downloading the free “IBM IBV” app for iPad or Android from your app store.
About IBM Global Business ServicesWith business experts in more than 160 countries, IBM Global Business Services provides clients with deep business process and industry expertise across 17 industries, using innovation to identify, create and deliver value faster. We draw on the full breadth of IBM capabilities, standing behind our advice to help clients implement solutions designed to deliver business outcomes with far-reaching impact and sustainable results. IBM Global Business Services offers one of the largest strategy & analytics practices in the world. Strategy & analytics fuses business strategy with technology insight to help organizations develop and align their business vision across four strategic dimensions — business strategy, operations strategy, organiza-tion change strategy and technology strategy — to drive innovation and growth.
IBM’s GILD database monitors global location trends through new foreign investmentFor many years, the only available data for analyzing foreign investment trends around the world were the capital invest-ment data as published by the United Nations. These data measure the capital flows through various forms of FDI, including M&A. Often these FDI flows are used to measure the success of geographical entities (countries, states and even cities) in attracting foreign investment. However, this can lead to misleading conclusions on the capacity of the locations to attract foreign companies. M&As are driven mostly by an interest from the investor in a target company with the objective to gain market share, acquire technology, and so on.
The business location of the target company is typically not the main driver for the investment and a location decision is rarely part of M&A investment decisions.
A better approach to measure the success of individual countries in attracting foreign investment is, therefore, to focus on those investment projects for which a clear decision on the investment location has been made. This is the case for the vast majority of so-called greenfield investment projects as well as for new expansions of existing operations owned by foreign enterprises (as such expansions often can be realized in different locations owned by the company). For this reason, IBM-PLI has started to develop the Global Investment Locations Database (GILD) in 2002. GILD tracks announced decisions of companies to locate new operations in regions outside of their HQ region and country on an ongoing basis.
IBM-PLI’s analysis of volumes of foreign investment focuses on job creation. From an economic development perspective, job creation is the best indicator of the local economic impact of the investment. Job positions created through the investment are typically filled by employees in the local labor market (or staff who relocate to that market) and consequently generate income and welfare in the region around the investment location. The investment capital, however, often ends up in other regions or countries, as a result of the acquisi-tion of plant or machinery, contracting of construction and engineering work outside the investment location. Therefore, the investment capital regularly is an overestimate of the economic impact of foreign invest-ment in a specific location, particularly in the case of smaller regions or individual cities.
IBM Global Business Services 17
Interested in further detail? More Facts & Figures are availableIn 2011, we started the production of a separate “Global Location Trends. Facts & Figures” report in response to requests for detailed data and analysis underpinning the trends described in the annual Global Location Trends reports. The objective of the report is to provide more comprehensive overviews of foreign investments in various parts of the world, as well as the detailed numbers for the various investment rankings.
The Facts & Figures report provides detailed profiles of invest-ment activity in individual countries and US states, as well as many rankings on:
• Foreign investment by sector and sub-sector• Foreign investment for key activities (production,
R&D, shared services and BPO)• Foreign investment by origin country • Foreign investment by destination country• Top destination countries and cities by average investment
project value• Top origin countries and cities by average investment
project value
The Facts & Figures report is not a free report but is available for purchase. If you are interested in ordering a copy of the 2014 Facts & Figures report or wish to receive an overview of the Table of Contents first, please contact Katrien Castelain at [email protected].

GBE03629-USEN-01
© Copyright IBM Corporation 2014
IBM Corporation Route 100 Somers, NY 10589
Produced in the United States of America October 2014
IBM, the IBM logo and ibm.com are trademarks of International Business Machines Corp., registered in many jurisdictions worldwide. Other product and service names might be trademarks of IBM or other companies. A current list of IBM trademarks is available on the Web at “Copyright and trademark information” at www.ibm.com/legal/copytrade.shtml.
This document is current as of the initial date of publication and may be changed by IBM at any time. Not all offerings are available in every country in which IBM operates.
THE INFORMATION IN THIS DOCUMENT IS PROVIDED “AS IS” WITHOUT ANY WARRANTY, EXPRESS OR IMPLIED, INCLUDING WITHOUT ANY WARRANTIES OF MERCHANTABILITY, FITNESS FOR A PARTICULAR PURPOSE AND ANY WARRANTY OR CONDITION OF NONINFRINGEMENT. IBM products are warranted according to the terms and conditions of the agreements under which they are provided.
This report is intended for general guidance only. It is not intended to be a substitute for detailed research or the exercise of professional judgment. IBM shall not be responsible for any loss whatsoever sustained by any organization or person who relies on this publication.
The data used in this report may be derived from third-party sources and IBM does not independently verify, validate or audit such data. The results from the use of such data are provided on an “as is” basis and IBM makes no representations or warranties, express or implied.
Please Recycle