Global Lithium Market Outlook - University of...
30
Global Lithium Market Outlook Goldman Sachs HCID Conference March 2016
Transcript of Global Lithium Market Outlook - University of...

Global Lithium Market Outlook
Goldman Sachs HCID Conference
March 2016

Some of the information presented in this presentation and the conference call and discussions that follow, including,without limitation, statements with respect to the transaction with Rockwood and the anticipated consequences andbenefits of the transaction, product development, changes in productivity, market trends, price, expected growth andearnings, input costs, surcharges, tax rates, stock repurchases, dividends, cash flow generation, costs and costsynergies, portfolio diversification, economic trends, outlook and all other information relating to matters that are nothistorical facts may constitute forward-looking statements within the meaning of the Private Securities Litigation ReformAct of 1995. There can be no assurance that actual results will not differ materially.
Factors that could cause actual results to differ materially include, without limitation: changes in economic and businessconditions; changes in financial and operating performance of our major customers and industries and markets servedby us; the timing of orders received from customers; the gain or loss of significant customers; competition from othermanufacturers; changes in the demand for our products; limitations or prohibitions on the manufacture and sale of ourproducts; availability of raw materials; changes in the cost of raw materials and energy; changes in our markets ingeneral; fluctuations in foreign currencies; changes in laws and government regulation impacting our operations or ourproducts; the occurrence of regulatory proceedings, claims or litigation; the occurrence of cyber security breaches,terrorist attacks, industrial accidents, natural disasters, or climate change; the inability to maintain current levels ofproduct or premises liability insurance or the denial of such coverage; political unrest affecting the global economy;political instability affecting our manufacturing operations or joint ventures; changes in accounting standards; theinability to achieve results from our global manufacturing cost reduction initiatives as well as our ongoing continuousimprovement and rationalization programs; changes in the jurisdictional mix of our earnings and changes in tax lawsand rates; changes in monetary policies, inflation or interest rates; volatility and substantial uncertainties in the debt andequity markets; technology or intellectual property infringement; decisions we may make in the future; the ability tosuccessfully execute, operate and integrate acquisitions and divestitures, including the integration of Rockwood’soperations and realize estimated synergies; and the other factors detailed from time to time in the reports we file withthe SEC, including those described under "Risk Factors" in the joint proxy statement / prospectus we filed in connectionwith the transaction with Rockwood, and in our Annual Report on Form 10-K and our Quarterly Reports on Form 10-Q.These forward-looking statements speak only as of the date of this presentation. We assume no obligation to provideany revisions to any forward-looking statements should circumstances change, except as otherwise required bysecurities and other applicable laws.
Forward-looking Statements
2
It should be noted that adjusted net income attributable to Albemarle Corporation (“adjusted earnings”), adjusted diluted
earnings per share, adjusted effective income tax rates, segment operating profit, segment income, EBITDA, adjusted EBITDA,
adjusted EBITDA by operating segment, EBITDA margin and adjusted EBITDA margin are financial measures that are not required
by, or presented in accordance with, accounting principles generally accepted in the United States, or GAAP. These measures are
presented here to provide additional useful measurements to review our operations, provide transparency to investors and
enable period-to-period comparability of financial performance.
A description of these and other non-GAAP financial measures that we use to evaluate our operations and financial performance,
and reconciliation of these non-GAAP financial measures to the most directly comparable financial measures calculated and
reported in accordance with GAAP, can be found in the Appendix to this presentation, which is posted in the Investors section of
our website at www.albemarle.com, under “Non-GAAP Reconciliations” under “Financials.”
3
Non-GAAP Financial Measures

Mega-Trends Driving Lithium Growth
4
• New active pharmaceutical ingredients
• New agro ingredients & resistance
• Reduction of greenhouse gas
• Miniaturization of electronic devices
• Extended range of electronic devices
• High-power electronic devices
• Exponential growth of transportation
• Renewable energy concepts
• Smart grid & energy storage
• Less energy and water
• Fewer chemicals & simpler processes
Lithium creates sustainable future technologies

Source: Rockwood Lithium estimates and market surveys from BCG, Bloomberg, Avicenne, Roland Berger, Pike Research, Frauenhofer IST, Deutsche Bank Research, McKinsey, CTI, Anderman, JD Powers
Lit
hiu
m C
arb
on
ate
Eq
uiv
ale
nt
in M
etr
ic t
on
s
Grid Storage: Potential
Demand Could Exceed Electric
Vehicle
Application Lithium Carbonate Content
Cell Phone 3 grams ~ 0.1 oz
Notebook 30 grams ~ 1.0 oz
Power Tool 30-40 grams ~ 1.0-1.4 oz
Hybrid (HEV) 3kWh 3.5 lbs
Plug-in Hybrid (PHEV) 15 kWh 26 lbs
Electrical Vehicle (BEV) 25 kWh 44 lbs
Tesla 85 kWh 112 lbs
Lithium: Potential Lithium Demand Delivers Significant Upside
Albemarle expects to capture 50% of Lithium growth
5
Automotive HighAutomotive LowAutomotive Average

Energy Related Applications Driving Market Growth
6
Application2014
Market Size
Growth Rate
ProductsT
rad
itio
na
l U
se
s Glass/Ceramics 46KT GDP• Spodumene
• Li2CO3
Greases / Lubricants 18KT GDP • LiOH
Chemical Synthesis 11KT GDP• Li Organometallics fed by Li
Metal LiCl
En
erg
y
Portable Electronics & Other Handhelds
48KT16%
(BaseCase)
• BG Li2CO3
• BG LiOH
• BG Li Metal
• BG Electrolyte Salts
• BG LiCl
• BG Alloys
• BG Specialty Compounds
Hybrids
Battery ElectricVehicle (BEV)
Grid and Other Power Storage Applications
Total Global LCE Market: 160kT (2014)Source: Internal

Energy Storage Applications –Market Dynamics & Growth Potential

Consumer Electronics
Previously, there was one major industry investing in
batteries….
8 - 10% CAGR
Mass Uptake in Battery Markets
8
Transportation
20 - 30% CAGR
Energy Storage
>30% CAGR
Replicating Success
“We are at a dawn of a new era with ‘unprecedented technological & regulatory change’ set to come in the next 5 years…” (Deutsche Bank, Dec 2014)
Consumer Devices
>15% CAGR
Source for projected CAGRs: Signumbox, 2015

Portable Solar Energy Storage
Portable Energy Storage
Stationary Energy Storage
Power Tools
Cordless Phones
Toys
Personal Care
Smartphones
Tablets
Wearables
Payment
Buses
Golf Carts
BikesWheelchair
Forklift
Li-Ion Battery Market Has Yet to Reach Maturity and Continues to Find New Applications
Transportation Energy Storage
growing market growing market
expanding market
Consumer Electronics &
Devices
9

0
20,000
40,000
60,000
80,000
100,000
120,000
140,000
2010 20150
10,000
20,000
30,000
40,000
50,000
60,000
70,000
2010 20150
200,000
400,000
600,000
800,000
1,000,000
1,200,000
1,400,000
2010 2015
0
5
10
15
20
25
2010 2015
PHEV
20% CAGR
PHEV
86% CAGR
EV
46% CAGR
Transportation Contributing to Li-Ion Battery Growth
10
Electric Vehicle Sales (US) – All OEMs
0
1,000
2,000
3,000
4,000
5,000
6,000
7,000
8,000
Mill
ion C
ells
Li-Ion NiMH NiCd
Cost of Li-Ion batteries has declined 14% per year over
the last 15 years
Battery Type
Battery Costs
2014 U
S$/k
Wh
1,800
1,600
1,400
1,200
1,000
800
600
400
200
2005 2010 2015 2020 20302025
HEV
10% CAGR
New Model Launches (US) – All OEMs
Source: Christophe Pillot, Avicenne Report 2015
0
5
10
15
20
25
2010 2015
EV
38% CAGR
0
10
20
30
40
50
60
70
2010 2015
HEV
12% CAGR
Nissan
Tesla
GM
Ford
Toyota
Other
Sources: Lux Research & US DOE Alternative Fuels Data Center, Accessed 3Q, 2015
Nissan
Tesla
GM
Ford
Toyota
Other
Source: Nature Climate Change, 2015Sources: Lux Research & US DOE Alternative Fuels Data Center, Accessed 3Q, 2015
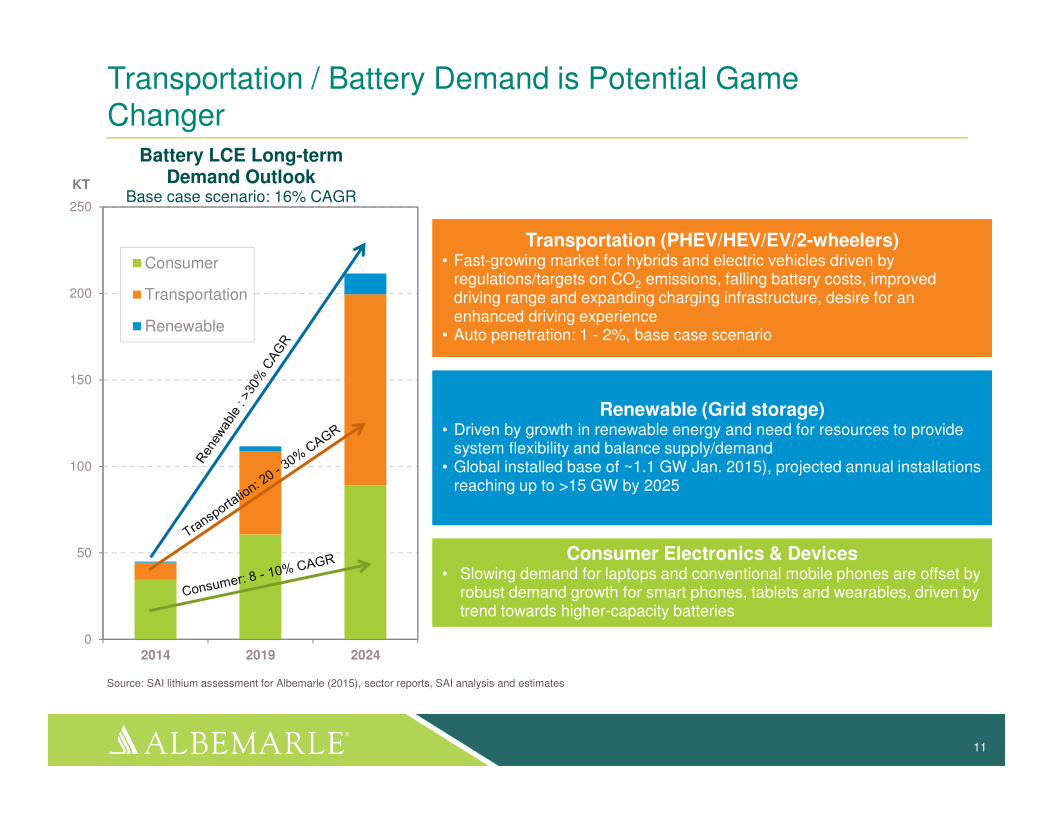
Transportation / Battery Demand is Potential Game Changer
Consumer Electronics & Devices• Slowing demand for laptops and conventional mobile phones are offset by
robust demand growth for smart phones, tablets and wearables, driven by trend towards higher-capacity batteries
Consumer Electronics & Devices• Slowing demand for laptops and conventional mobile phones are offset by
robust demand growth for smart phones, tablets and wearables, driven by trend towards higher-capacity batteries
Transportation (PHEV/HEV/EV/2-wheelers)• Fast-growing market for hybrids and electric vehicles driven by
regulations/targets on CO2 emissions, falling battery costs, improved driving range and expanding charging infrastructure, desire for an enhanced driving experience
• Auto penetration: 1 - 2%, base case scenario
Renewable (Grid storage)• Driven by growth in renewable energy and need for resources to provide
system flexibility and balance supply/demand• Global installed base of ~1.1 GW Jan. 2015), projected annual installations
reaching up to >15 GW by 2025
Renewable (Grid storage)• Driven by growth in renewable energy and need for resources to provide
system flexibility and balance supply/demand• Global installed base of ~1.1 GW Jan. 2015), projected annual installations
reaching up to >15 GW by 2025
0
50
100
150
200
250
2014 2019 2024
Battery LCE Long-term Demand Outlook
Base case scenario: 16% CAGR
Consumer
Transportation
Renewable
Source: SAI lithium assessment for Albemarle (2015), sector reports, SAI analysis and estimates
KT
11
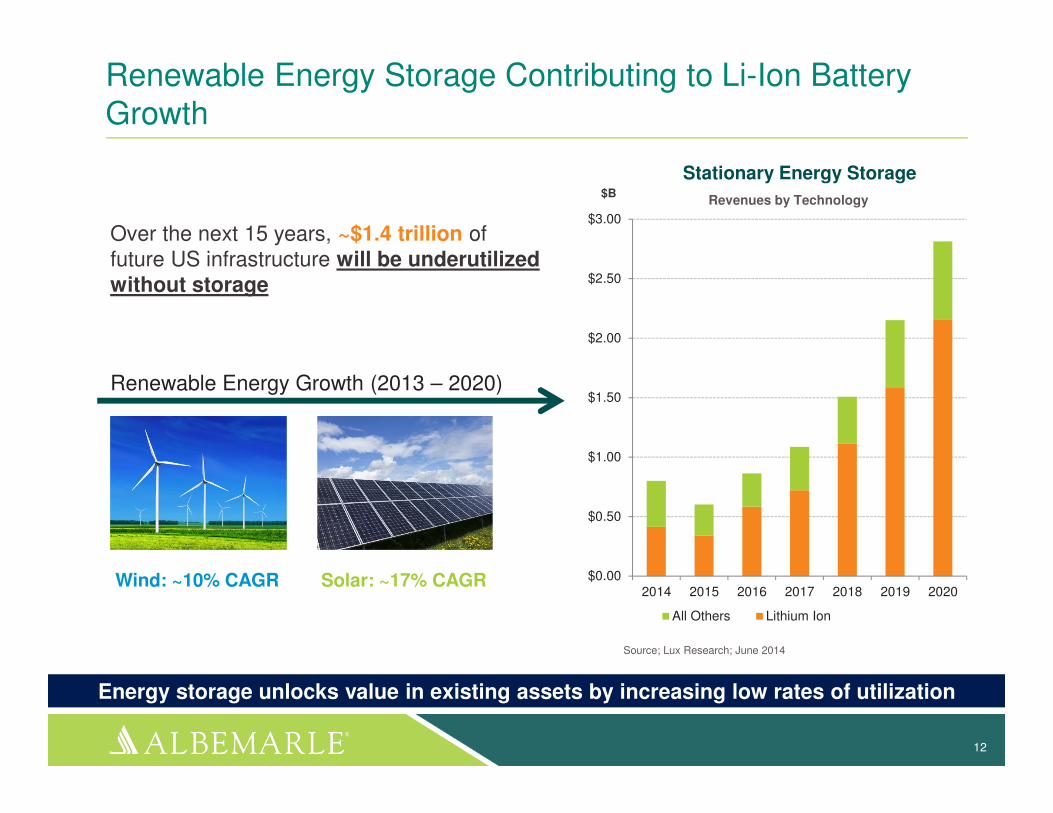
Renewable Energy Storage Contributing to Li-Ion Battery Growth
12
Stationary Energy Storage
Revenues by Technology$B
Energy storage unlocks value in existing assets by increasing low rates of utilization
Source; Lux Research; June 2014
Over the next 15 years, ~$1.4 trillion of future US infrastructure will be underutilized without storage
$0.00
$0.50
$1.00
$1.50
$2.00
$2.50
$3.00
2014 2015 2016 2017 2018 2019 2020
All Others Lithium Ion
Solar: ~17% CAGRWind: ~10% CAGR
Renewable Energy Growth (2013 – 2020)

Albemarle’s Global Position in Lithium Supply

Leadership in Lithium due to Albemarle’s Unique Position
14
Leading Natural Resources
Extensive Derivative Capability
Strength of Supply Chain Reliability
Process Innovation Expertise
Low Cost Position$
MT

Leader in High Quality Diversified Natural Resources
Hard Rock Minerals
SQM36%
Albemarle34%
FMC21%
Chinese & Others
9%
Talison 78%
Chinese 21%
Others1%
Brine
Talison 31%
Albemarle20%
SQM22%
FMC13%
Chinese 13%
Others1%
Source: SAI Report 2015, Internal Estimates
15
LCE Mined in 2014160,000 MT
2014 Brine LCE Production Share
2014 Spodumene LCE Production Share
98kT 62kT
Natural Resource Position
Albemarle >35% Total
LCE’s Mined

Two World-class Lithium Brine Resources Operated by Albemarle
Salar de Atacama, Chile
• Largest active lithium brine resource globally
• Highest LiCl concentration
• Highest evaporation rates
• Favorable brine chemistry
Silver Peak, Nevada, U.S.A.
• First operational brine resource globally
• Only U.S. operational lithium brine source
• Favorable brine chemistry
• Established Infrastructure
16Natural Resource Position

Two World-class Lithium Brine Resources in Development
Magnolia, Arkansas U.S.A.
• Unique to only Albemarle
• By-product brine from bromine operation
• Ability to leverage infrastructure
• No mining cost
• By-product enhancements given bromine derivations
17
Salares 7, Atacama Chile
• Early stage exploration project
• Part of Talison joint venture
• Positive results for lithium and potassium
Natural Resource Position
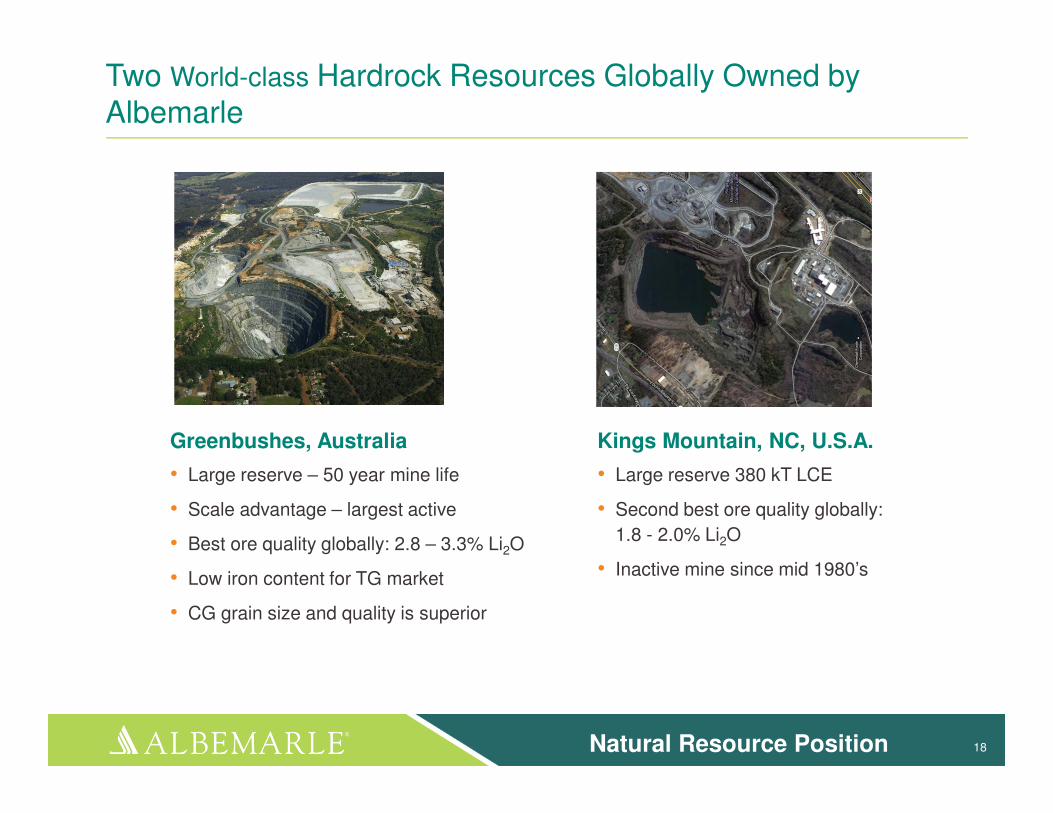
Two World-class Hardrock Resources Globally Owned by Albemarle
Greenbushes, Australia
• Large reserve – 50 year mine life
• Scale advantage – largest active
• Best ore quality globally: 2.8 – 3.3% Li2O
• Low iron content for TG market
• CG grain size and quality is superior
Kings Mountain, NC, U.S.A.
• Large reserve 380 kT LCE
• Second best ore quality globally:
1.8 - 2.0% Li2O
• Inactive mine since mid 1980’s
18Natural Resource Position

Albemarle’s Brine Resources are Geographically Well-positioned (Chile & USA)
ChileSalar de Atacama
AlbemarleBest Brine Source Globally
Shared by Albemarle
USMagnolia, ARAlbemarleSource linked to Bromine Plant
USSilver Peak, NV
AlbemarleLow Concentration
ArgentinaSalar de Hombre Muerto
Salar de Olaroz• Weather Risk• High Altitude Issue• Infrastructure Challenges• Country Risk
China • Various Salars Brine Chemistry Issues
• Weather Risk• Infrastructure Challenges
Source: USGS, Roskill, Internal
19Natural Resource Position

Albemarle’s Hardrock Mining Resources are Geographically Well-positioned (Australia & USA)
USNorth CarolinaAlbemarle MineCurrently Inactive
ChinaVarious Small Mines21% of Total Production
Australia Greenbushes Mine
78% Total Production
ZimbabweBikita Mine
1% Global Production
20Natural Resource Position
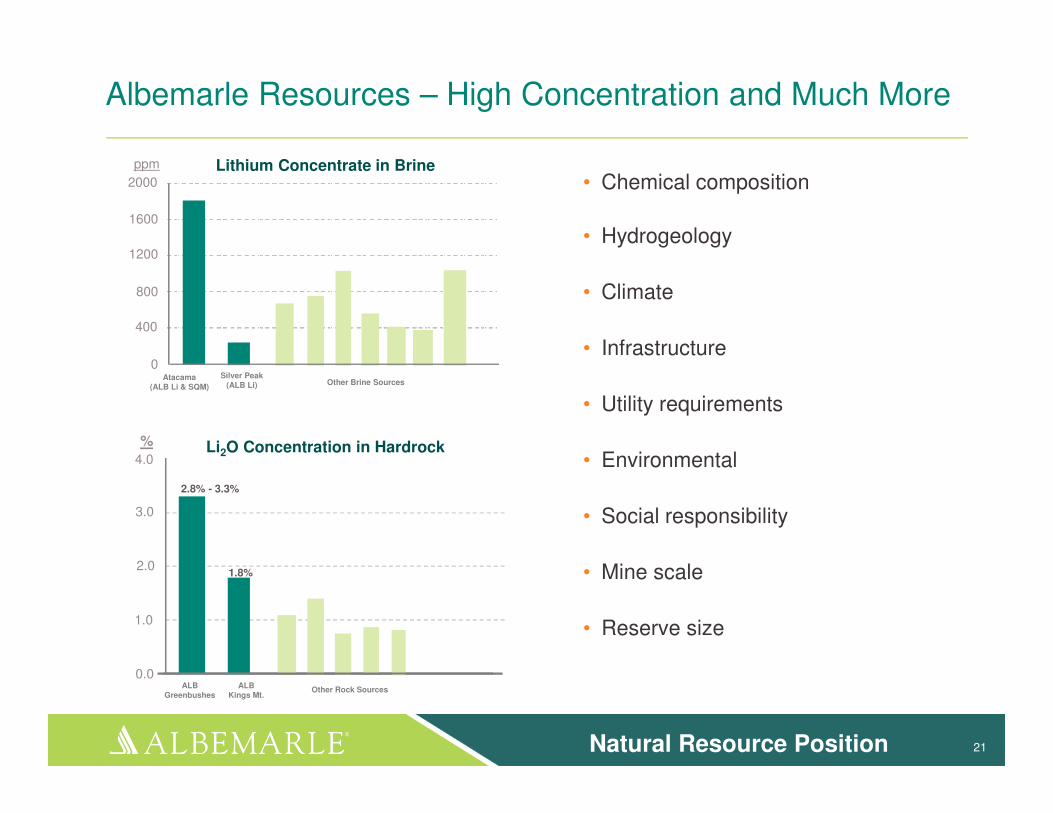
Albemarle Resources – High Concentration and Much More
21
• Chemical composition
• Hydrogeology
• Climate
• Infrastructure
• Utility requirements
• Environmental
• Social responsibility
• Mine scale
• Reserve size
Natural Resource Position
Lithium Concentrate in Brine
Silver Peak(ALB Li)
Atacama(ALB Li & SQM)
ppm
2000
1600
1200
400
0
800
Li2O Concentration in Hardrock
2.8% - 3.3%
1.8%
%4.0
3.0
2.0
1.0
0.0ALB
Kings Mt.ALB
Greenbushes
Other Brine Sources
Other Rock Sources

Lithium Resource Projects in Development
22
• xx
Source: Company reports and press releases
Company Project status
Albemarle Pilot Plant
Orocobre(started 2007)
Li2CO3 Market Production 2015-2016
Lithium Americas Pilot plant
Galaxy Resources Feasibility
ADY Resources Feasibility
Rodinia Feasibility
Critical Elements Corporation
Exploration
RB EnergyLi2CO3 Shut-down
Receivership
Nemaska Post Feasibility
Neometals (ReedResources)
Pilot
Western Lithium Demo plant
Bacanora Minerals Feasibility
BR
INE
RO
CK
CL
AY
Natural Resource Position

Lithium Resource Development is Not Easy and Takes Time
23
Exploration Feasibility Pilot Design Construction Production
Simbol
Canada Lithium
Galaxy Mt Cattlin
Albemarle Magnolia
Lithium Americas
Bacanora Minerals
Western Lithium
Bankrupt
Bankrupt
Closed
Ready for plant design
Brine
Spodumene
Spodumene
Brine
Brine
Hectorite
Nemaska Lithium
Hectorite
Spodumene
Plant
Failu
res
Curr
ent D
eve
lopm
ent
Natural Resource Position
$120 million spent collectively
<$20 million in cash reserves combined
Main focus is fundraising

Strategic Investments to Meet Market Demand
• Located in La Negra, Chile
• 20kT battery grade lithium carbonate
• Produces lowest-cost, highest-quality battery grade material in the industry
• Start-up phase
• Will be the most technologically advanced mineral conversion plant ever built
• Up to 50kT battery grade lithium derivatives – Li2CO3 and LiOH
• Fed from the highest quality Spodumene resource in the world
• Expected startup: 2020
24
Battery Grade Li2CO3 Plant Planned Battery Grade Li Derivative Plant

Lithium: Albemarle Derivative Capacity in Chile
25
0
20
40
60
80
2014 2017 2020
Li2CO3 IIIEstimated~2020
Li2CO3 II
Li2CO3
LiCl
• Increasing access to best lithium resources globally
• New Brine Permit
– Granted new increased brine pumping permit in Chile that allows for production of over 70,000 metric tons of lithium carbonate annually
– The impact of this new pumping rate will begin to be reflected in our sales during 2017
• Signed MOU with Chilean government to establish a new lithium quota
– Increases and extends expected life of our secured reserves in Chile to 27 years at an annual rate of about 70,000 MT LCE
– Continued investment to be timed to match market demand
– New commission/fee schedule does not impact the remaining 110,000 MT LCE under the current quota.
Cap
acit
y (
MT
LC
E)1
1Reflects planned plant capacity only. Timing is estimated and subject to change. Not pictured is estimated 3 year ramp-up for plants to reach full utilization after coming on-line.

Unmatched Vertical Integration from Natural Resource to Lithium Specialty
26
Albemarle SQM FMC Tianqi Ganfeng
Operating Brine Resource
Operating Hardrock Resource
Spodumene TG
Lithium Carbonate TG/BG
Lithium Hydroxide TG
Lithium Hydroxide BG
Lithium Chloride
Li Metal Bulk
Li Metal Battery Products
Butyllithium
Specialty Organics
Specialty Lithium Salts
Extensive Derivative Capability
Source: Internal

Global Supply Chain Strength For Battery Markets
27
Salar de Atacama, ChileLaNegra, Chile
Kings Mountain, NC, USASilver Peak, NV, USA
Langelsheim, Germany
Frankfurt, Germany
Greenbushes, Australia
Established Battery Growth Market
Tesla 35 GWh LG
Foxconn
LG
Samsung
Panasonic
BYD
Global Technical Centers
Production Sites
Battery Plants
Supply Chain Reliability
Emerging Battery Growth Market

Cost Advantage Continues to be Extended
• Best lithium resources globally
• Superior derivative process technology
• Scale & supply chain advantage
Why?
Cost Leader 28

Leadership in Lithium due to Albemarle’s Unique Position
29
Leading Natural Resources• Diverse, large and high quality natural resources• Geographically situated in low-risk environments with good infrastructure• Large scale for excellent economics
Extensive Derivative Capability• Broad value-added derivative portfolio• Strongest vertical position from resource to specialty• Ability to innovate with customers for next-generation lithium materials
Strength of Supply Chain Reliability• Unmatched global footprint and ability to serve growth markets• 100 years of lithium manufacturing experience
Process Innovation• Deep and broad process technology expertise• Scale of expertise has grown with merger adding to continues improvement• Strong experience in successfully commercializing new projects
A Low Cost Position• While providing the highest quality products• With the lithium industry’s most reliable and sustainable supply network
$
MT

30
www.albemarle.com