GLOBAL IPO VOLUME HITS TEN-YEAR HIGH TEN-YEAR HIGH Market stability, buoyant markets and positive...
15
1 GLOBAL IPO VOLUME HITS TEN-YEAR HIGH Market stability, buoyant markets and positive sentiment driving IPOs in 2017 CROSS-BORDER IPO INDEX 2017
-
Upload
truonghanh -
Category
Documents
-
view
222 -
download
0
Transcript of GLOBAL IPO VOLUME HITS TEN-YEAR HIGH TEN-YEAR HIGH Market stability, buoyant markets and positive...

1
GLOBAL IPO VOLUMEHITS TEN-YEAR HIGHMarket stability, buoyant markets and positive sentiment driving IPOs in 2017
CROSS-BORDER IPO INDEX 2017

32
GLOB
AL IP
O VO
LUM
E HI
TS T
EN-Y
EAR
HIGH
| C
ROSS
-BOR
DER
IPO
INDE
X 20
17
Global Insight 04
Sector Focus 08 Spotlight section on Consumer Goods & Retail 10
Stock Exchange Insight 14
Private Equity and Venture Capital-Backed IPOs 16
Regional Insight 20 Asia Pacific 21 EMEA 22 North America 24 Latin America 26
Contacts 27
Contents
3
GLOB
AL IP
O VO
LUM
E HI
TS T
EN-Y
EAR
HIGH
| C
ROSS
-BOR
DER
IPO
INDE
X 20
17
Low market volatility and improved market sentiment behind the increase in global IPO activity

54
GLOB
AL IP
O VO
LUM
E HI
TS T
EN-Y
EAR
HIGH
| C
ROSS
-BOR
DER
IPO
INDE
X 20
17
A total of 1,694 listings were recorded during the 12-month period, raising a total of USD 206.6 billion, a jump of around a third for both metrics in 2016.
Low market volatility as a result of the relatively benign geopolitical environment— one dominated last year by the US general election and the UK’s decision to leave the European Union— and improved market sentiment, were behind the increase in global IPO activity, which saw both cross-border and domestic activity grow.
Global IPO volumes in 2017 have reached the highest level in a decade, according to the latest research from Baker McKenzie. The momentum built through the year with an acceleration in both volume and value of capital raised in the second half of the year.
The IPO market in 2017 has put in its best performance in 10 years. A more stable political environment in some of the key markets, combined with strong economic growth, has boosted both the number of listings and the volume of capital raised.
Koen VanhaerentsGlobal Chair, Capital Markets
Global Insight
Key Global Data Points
25%CHANGE IN
CAPITAL RAISEDCROSS-BORDER
IPOs
55%CHANGE IN
CAPITAL RAISEDDOMESTIC
IPOs
USD 37.6BILLION
CAPITAL RAISED BYCROSS-BORDER IPOs
195CROSS-BORDER
IPOs
2017 Notable Cross-Border IPOs
HKExHKExLSE/Moscow
Exchange
ISSUER
CAPITAL RAISED (USD)
HOME JURISDICTION & EXCHANGE
SECTOR
3.84 BILLION
Ireland ISE/LSE
2.22BILLION
HKEx
1.75BILLION
China
CHINA LITERATURELTD
1.23BILLION
China
EN+ GROUPPLC
ZHONGAN ONLINE P&CINSURANCE CO LTD
1.50 BILLION
ALLIED IRISHBANKS PLC
GUOTAI JUNANSECURITIES CO LTD
China Russia
FINANCIALS
Russia
FINANCIALS FINANCIALS MATERIALS MEDIA AND ENTERTAINMENT
Cross-border deal appetite Cross-border deals jumped by 60% across all regions, including Latin America which saw its first cross-border listing in 10 years. However, growth in cross-border capital was outpaced by domestic capital raising and resulted in a slight decline in the Global Cross-Border Index Values.
Cross-border capital raising also grew in 2017 by 25%, the majority of which was accounted for by a strong performance in Europe, Middle East and Africa (EMEA) and North America. That helped offset a decline in Asia Pacific cross-border capital raising.
On the domestic front, value was up an impressive 55% year on year, while volume was up by 40%.
While the increase in total global IPOs in 2017 is impressive, the comparison with two years ago in 2015 is less so.
The number of IPOs in 2017 compared to 2015 climbed by 22%, while capital raised fell by 3%. Using the same two-year comparison, the number of cross-border deals grew by
23% and capital raised dropped by 8%, while domestic activity climbed by 2% and 21% by value and volume, respectively.

76
GLOB
AL IP
O VO
LUM
E HI
TS T
EN-Y
EAR
HIGH
| C
ROSS
-BOR
DER
IPO
INDE
X 20
17
Hong Kong continues to be market leader Hong Kong remained the most popular stock exchange for cross-border listings with USD 16 billion recorded for 2017 — an impressive figure but 26% lower than last year, likely a result of the after effects of the Chinese government’s decision to restrict offshore listings.
Of the total number of IPOs, more than two-thirds were accounted for by those issued in exchanges based in Asia Pacific, although that was just 45% of the total in capital terms.
Also of note was a storming performance by the London Stock Exchange (including AIM), which came in second on the leader board with cross-border listings worth over USD 8.1 billion, a huge 2,307% increase on 2016, possibly as a result of pent up demand following the Brexit vote. But even compared to 2015, the listings value on the LSE is up by 206%.
Global IPOs 2008 to 2017
0
50000
100000
150000
200000
250000
300000
350000 1600
1400
1200
1000
800
600
400
200
02008 2009 2010 2011 2012 2013 2014 2015 2016 2017
Domestic Value (USD million) Cross-Border Value (USD million)
No. of Domestic Deals No. of Cross-Border Deals
Number of IPOs
Valu
e (U
SD m
illio
n)
Cross-Border IPO Index
0 5 10 15 20 25
2012
2013
2014
2015
2016
2017
17.4
21.3
24.1
17.4
17.4
17.1

98
GLOB
AL IP
O VO
LUM
E HI
TS T
EN-Y
EAR
HIGH
| C
ROSS
-BOR
DER
IPO
INDE
X 20
17
Also growing is the High Technology sector, which climbed 210% year on year in capital terms to USD 28.5 billion, including the biggest deal of the year in Snap Inc’s USD 3.9 billion listing on the New York Stock Exchange.
The Industrials sector was the most active in terms of volume with 284 listings during 2017, a 50% hike on 2016. Capital raised reached USD 25.4 billion, up by 16% on the year. This was driven largely by Italian tiremaker Pirelli’s return to the public market in the third quarter of the year, having been taken over by state-controlled ChemChina two years ago. The re-listing is indicative of investor appetite for European companies and that of Chinese investors in European brands. In any event, the IPO price of USD 2.8 billion valued the group at slightly less than the price at which it delisted in 2015.
Healthcare was the most active sector for cross-border IPOs, with 32 deals in 2017, a 113% jump on the previous year, which raised a total of USD 3.3 billion, up 119% year on year. That was bolstered by WuXi Biologics’ debut on the Hong Kong Stock Exchange in June, which raised over USD 580 million.
The second most-active sector was Consumer Products and Services with 30 deals worth USD 2.6 billion, up 114% and 76% respectively. The largest deal in the sector was the USD 500 million IPO of Alibaba-backed supply chain technology firm BEST Inc. on the New York Stock Exchange.
Such strong performance was underpinned by Allied Irish Banks’ USD 3.8 billion dual listing on the London and Dublin stock exchanges in the first half of the year, the USD 2.2 billion listing of Chinese brokerage Guotai Junan Securities on the Hong Kong Stock Exchange, and the USD 1.8 billion listing of Zhong An Online P&C Insurance Co Ltd, also in Hong Kong.
Sector Focus
With USD 54 billion worth of capital raised across 245 deals, Financials once again outperformed other sectors when it comes to the number of transactions, and took the top three spots for cross-border IPOs. Total value also climbed by 30% on the year.
Top Sectors: Global
Industry
Financials
High Technology
Industrials
Healthcare
Energy & Power
Domestic
43,286
23,047
24,221
12,432
14,531
Cross-Border
14,588
5,459
1,205
3,324
1,418
Total
54,030
28,506
25,427
15,742
15,634
% Change from 2016
30%
210%
16%
23%
4%
Value (USD million)
Top Sectors: Global
Industry
Industrials
Financials
High Technology
Materials
Domestic
263
220
208
159
135
Cross-Border
21
26
24
18
30
Total
284
245
232
174
164
% Change from 2016
49%
60%
33%
61%
56%
Volume
Consumer Productsand Services
*Some IPOs dual list and count as both domestic and cross-border. Overall IPO totals may be lower than the combined value and volume for domestic and cross-border listings to avoid duplication.

1110
GLOB
AL IP
O VO
LUM
E HI
TS T
EN-Y
EAR
HIGH
| C
ROSS
-BOR
DER
IPO
INDE
X 20
17
Spotlight on the Consumer Goods & Retail Sector
Asia Pacific leads resurgenceAn active listings market in Asia Pacific, particularly in China, has led to a busy year for the Consumer Goods & Retail (CG&R) sector. A total of 348 IPOs were recorded in 2017, a jump of 98 on 2016, which raised a total of USD 30 billion, up by USD 11.6 billion.
The steady progress of the CG&R sector over the last few years has seen the number of issues more than double since 2013, although the value of those listings had held steady, apart from 2016’s drop to just USD 18.9 billion.
Brazilian wholesale hypermarket Atacadao SA’s listing on B3 was the sector’s biggest in value terms, raising a total of USD 1.4 billion. Atacadao is a subsidiary of the French retailing giant The Carrefour Group and despite pricing its IPO at the bottom of its expected price range, it is still the largest in Brazil in the last few years.
The second biggest listing of 2017 in the CG&R sector was the world’s largest tequila
maker Becle SAB de CV which raised USD 910 million on Mexico’s Bolsa Mexicana de Valores. The name behind Jose Cuervo had placed its IPO on hold twice in reaction to US
President Donald Trump’s rhetoric on Mexico, including his warnings to tax Mexican imports and scrap a trade deal between the two countries.
China and US top capital raising With USD 7.8 billion worth of capital raised, China remains the top domicile nation of listing companies and accounts for more than one-quarter of value in the CG&R sector. China has also grown the value of its listings by more than one-third from 2016. This is not surprising given the increasing strength of the Chinese consumer, the size of the market and the rise of online shopping in China. The US trails behind with USD 4.3 billion raised, although that too improved on the previous year by 44%. The Atacadao listing saw Brazil take third place. European CG&R listings lagged behind in 2017 with just three countries – France, UK and Spain – making it onto the list of the top 10 domiciled nations by capital raised.
In terms of stock exchanges, the New York Stock Exchange, Shanghai Stock Exchange and Euronext markets were the most popular destinations, all raising over USD 2 billion in total. Despite having the most number of deals at 45, the Hong Kong Stock Exchange was ranked only fifth in terms of capital raised.
Brazil’s B3 exchange makes a surprise appearance in the top five exchanges with only three deals worth USD 2 billion, although this can be explained by the USD 1.4 billion Atacadao IPO. Without the Atacadao listing, proceeds for the BOVESPA exchange would have only totalled USD 548 million.
On the Hong Kong exchanges, the largest listing this year was by the Crystal International Group Ltd, a garment supplier, valued at USD 490 million, making this the largest listing by a Hong Kong company on a Hong Kong exchange in the last two years. The IPO attracted attention from some retail heavyweights including L-Brands Inc and Fast Retailing.
Mainland Chinese-domiciled companies have dominated listings on the Hong Kong exchange, raising a total of USD 891 million
this year. Hong Kong-based companies were close behind, with a total of USD 824 million raised.
Cross-border IPOs in the CG&R sector climbed sharply in 2017, both in terms of activity, which increased 88% to 47, and in deal value which rose 34% to USD 3.5 billion. While there was year-on-year improvement, total capital raised has yet to see 2014 levels when USD 9.2 billion was reached. Unsurprisingly, China-domiciled companies dominated the activity and accounted for six out of the top 10 cross-border deals in 2017,
half of which listed in New York and half in Hong Kong.
The largest cross-border listing in CG&R of the year was the IPO of delivery and supply chain company BEST Inc, which raised USD 518 million.
The New York Stock Exchange saw the biggest value of CG&R cross-border IPOs at USD 1.7 billion for ten listings. Hong Kong had a lower value of capital raised at USD 1 billion but accounted for 20 separate listings.
The continued increasing demand in emerging countries, and strong sector performance, even in light of changing consumer demands and the role of technology, has driven the rise in IPOs in the Consumer Goods & Retail sector.
Alyssa Gallot-Auberger,Global Head of Consumer Goods & Retail
Consumer Goods and Retail IPOs
0
5
10
15
20
25
30
35
40
Valu
e (U
SD b
illio
n) Number of IPOs
2012 2013 2014 2015 2016 2017
400
350
300
250
200
150
100
50
0
156 157
241250249
348
Top Stock Exchanges for CG&R
New York Stock Exchange
Shanghai Stock Exchange
Euronext
4,339
4,037
2,296
22
42
5
Stock Exchanges Proceeds in USD Million Number of Deals
Top Countries for CG&R IPOs
DomicileNation
Value (USDmillion)
% Changefrom 2016
% Changefrom 2016
Number ofDeals
China
United States
Brazil
France
United Kingdom
7,812
4,283
2,112
1,958
1,369
39%
44%
-
328%
149%
3
28
4
3
13
-
115%
-
-
30%
1312
GLOB
AL IP
O VO
LUM
E HI
TS T
EN-Y
EAR
HIGH
| C
ROSS
-BOR
DER
IPO
INDE
X 20
17
Professional Services – a barnstorming performance Compared to 2016, the professional services sector has raised three times more capital this year at USD 6.7 billion and accounted for 22% of the total capital raised within the CG&R sector, double its contribution the previous year. The number of professional services IPOs also jumped sharply, up by 71% to 70, which made up 20% of the total number of IPOs in the sector.
The largest Professional Services listing this year was made by ALD International, a car leasing firm, raising a total of USD 1.3 billion from its IPO on the Euronext Paris exchange. At the time of listing in June, this was the largest IPO to take place in France for 18 months.
This was also the only IPO over USD 1 billion this year. Only two other issues were valued above USD 500 million: Prosegur Cash and the previously mentioned BEST Inc, which raised USD 886 million and USD 516 million respectively.
Prosegur Cash, a Spanish security company that delivers bank notes to ATMs, listed on the Madrid exchange in March and was the first IPO of the year in Spain. Chinese logistics firm BEST Inc listed on the New York Stock Exchange and had to revise the terms of its deal, raising significantly less than the original USD 932 million it had planned. Despite China’s booming logistics market, competition concerns as well as rising fuel and labor costs caused investors to balk at the original offer.
Food & Beverages – a feast of listings With USD 6 billion raised, the food and beverage sector notched up nearly a third more capital in 2017 compared to 2016, and accounted for 20% of the total raised in CG&R. The number of IPOs in the sector also climbed to 69 from 51.
The Atacadao IPO was the largest and the only one valued over USD 1 billion, while Becle SAB de CV’s USD 910 million listing was the second largest. There were no other Food and Beverages IPOs over USD 500 million.
Textiles & Fashion – stepping out with confidenceMore capital was raised in the Textiles & Fashion sector in 2017 than the previous year, with an increase of 43% recorded to bring the total to USD 3.4 billion. It accounted for 11% of total IPOs in the CG&R sector, a slight drop from 13% last year while the number of IPOs climbed by 35% to 46.
There were no IPOs in Textiles & Fashion valued over USD 500 million, but the largest was launched by garment supplier Crystal International Group for USD 490 million on the Hong Kong Stock Exchange. The second largest IPO to launch this year was issued by Mavi Jeans on the Istanbul exchange. The company’s IPO is an interesting test for appetite for Turkish equities after a year of political turmoil for the country.
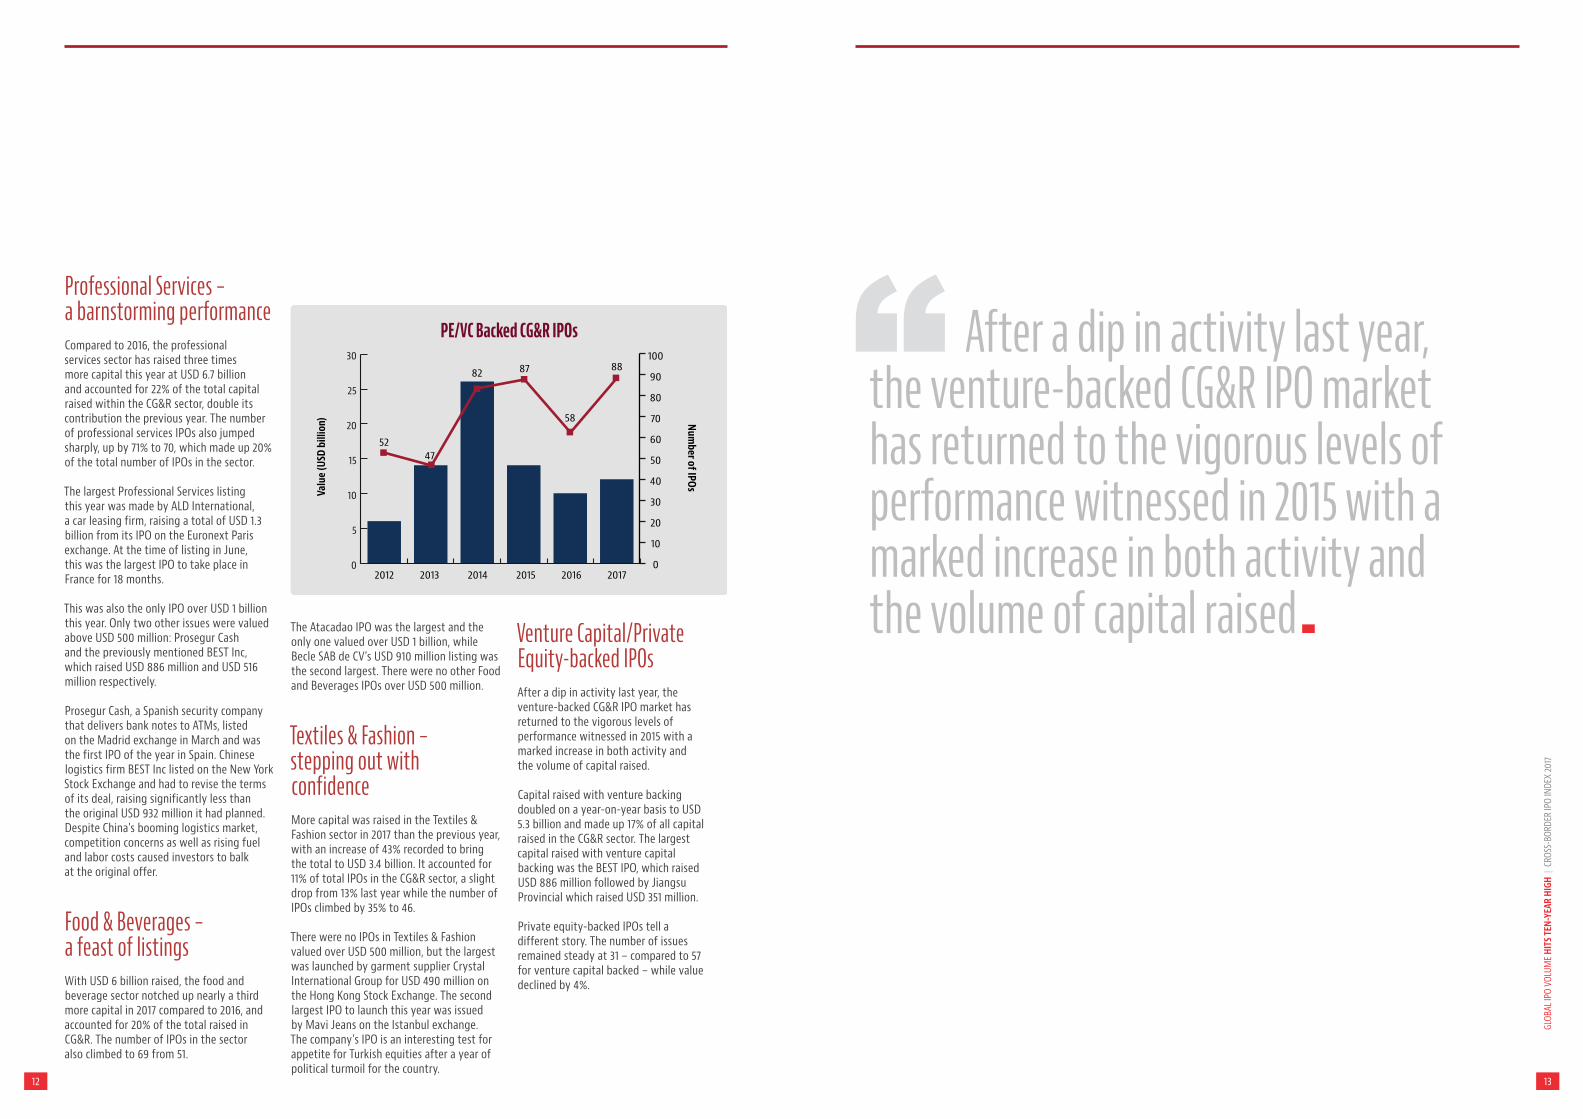
Venture Capital/Private Equity-backed IPOsAfter a dip in activity last year, the venture-backed CG&R IPO market has returned to the vigorous levels of performance witnessed in 2015 with a marked increase in both activity and the volume of capital raised.
Capital raised with venture backing doubled on a year-on-year basis to USD 5.3 billion and made up 17% of all capital raised in the CG&R sector. The largest capital raised with venture capital backing was the BEST IPO, which raised USD 886 million followed by Jiangsu Provincial which raised USD 351 million.
Private equity-backed IPOs tell a different story. The number of issues remained steady at 31 – compared to 57 for venture capital backed – while value declined by 4%.
PE/VC Backed CG&R IPOs
0
5
10
15
20
25
30
Valu
e (U
SD b
illio
n) Number of IPOs
2012 2013 2014 2015 2016 2017
100
90
80
70
60
50
40
30
20
10
0
5247
82 87
58
88
After a dip in activity last year, the venture-backed CG&R IPO market has returned to the vigorous levels of performance witnessed in 2015 with a marked increase in both activity and the volume of capital raised

1514
GLOB
AL IP
O VO
LUM
E HI
TS T
EN-Y
EAR
HIGH
| C
ROSS
-BOR
DER
IPO
INDE
X 20
17
In terms of capital raised, the New York Stock Exchange took the top spot with USD 33.3 billion, up 149%, followed by the London Stock Exchange (including AIM) at USD 19.2 billion, up 163%, and Shanghai Stock Exchange at USD 18 billion, up 9%.
Hong Kong dominates the list of cross-border IPO destinations in 2017, but the majority of companies listing on the mainboard and Growth Enterprise Market are domiciled in Asia Pacific. Capital raised from cross-border IPOs listed in Hong Kong also declined by 26% year on year to USD 16 billion, with the market still reeling from the effect of the Chinese government’s decision to restrict offshore listings.
Growth in the number of cross-border IPOs on the Hong Kong Stock Exchange during the year is dismal – down by 26% year on year and by 49% when compared with 2015 – compared with other major listing destinations such as London Stock Exchange, which is up by over 2,000% year on year, and New York Stock Exchange, up by 36%.
The easing of China’s local listing restrictions helped three Asian stock markets take the top three spots on the list of the most active exchanges. The Shenzhen Stock Exchange notched up 202 listings, up 49% on the year, Shanghai Stock Exchange 195, up 61%, and Hong Kong 149, up 26%.
Stock Exchange Insight
Stock Exchange InsightAll IPOs – Top Exchanges
Stock Exchanges Cross-Border 2017 Domestic 2017 Total 2017
New York Stock Exchange
London (Mainboard and AIM)
Shanghai Stock Exchange
Hong Kong (HKEx and HK GEM)
NASDAQ
6,603
8,126
-
15,973
2,272
26,669
11,087
18,551
2,069
13,349
33,273
19,213
18,551
18,041
15,621
Value (USD million)
Stock Exchange InsightTop Cross-Border Exchanges
Stock Exchanges 2015 2016 2017
Hong Kong (HKEx and HK GEM)
New York Stock Exchange
London (Mainboard and AIM)
NASDAQ
Warsaw Stock Exchange(Mainboard and New Connect)
31,255
1,501
2,655
3,310
136
21,581
4,856
338
1,613
-
15,973
6,603
8,126
2,272
1,330
% Changefrom 2016
-26%
36%
2,307%
41%
-
Value (USD million)
Stock Exchange InsightTop Domestic Exchanges
Stock Exchanges 2015 2016 2017
New York Stock Exchange
Shanghai Stock Exchange
National Stock Exchange (NSE)
NASDAQ
Bombay Stock Exchange
20,116
17,378
2,103
15,336
2,169
8,530
17,154
3,998
9,382
3,112
26,669
18,551
13,746
13,349
12,462
% Changefrom 2016
213%
8%
244%
42%
300%
Value (USD million)
Asian stock exchanges were the busiest in terms of the number of IPOs registered in 2017, after China’s government eased local listing restrictions. India markets also saw an uplift in activity after the Modi government incentivized local listing. But it was the New York Stock Exchange that raised the largest capital from IPOs during the year, as the market recovered following the 2016 Presidential election.
Koen VanhaerentsGlobal Chair, Capital Markets

1716
GLOB
AL IP
O VO
LUM
E HI
TS T
EN-Y
EAR
HIGH
| C
ROSS
-BOR
DER
IPO
INDE
X 20
17
That was matched by a 21% increase in the capital raised by PE and VC-backed companies to USD 64.7 billion, again the first increase in three years. That solid performance held the PE and VC IPO exit volume share of the overall IPO market at 26%.
However, a 25% fall in PE-backed capital raising prompted the combined PE and VC value share drop to 31% in 2017 from 37% in 2016. Cross-border PE and VC-backed IPO exits raised USD 8.6 billion from 24 deals in 2017, up from 17 deals and USD 13.3 billion the previous year.
The number of private equity and venture capital-backed IPO exits reached 442 in 2017, a jump of 43% on the year and a big improvement from the previous two years of decline.
Private Equity and Venture Capital-Backed IPOs
PE and VC-backed IPO exits jump sharply
PE/VC Backed IPOs
Valu
e (U
SD m
illio
n) Number of IPOs
2012 2013 2014 2015 2016 2017
500
450
400
350
300
250
200
150
100
50
0
140000
120000
100000
80000
60000
40000
20000
0
251277
457 418
310
442
PE/VC Backed IPOsCross-Border PE and VC Backed IPOs
Valu
e (U
SD m
illio
n) Number of IPOs
2012 2013 2014 2015 2016 2017
80
70
60
50
40
30
20
10
0
50000
45000
40000
35000
30000
25000
20000
15000
10000
5000
0
16
43
33
17
68
24

1918
GLOB
AL IP
O VO
LUM
E HI
TS T
EN-Y
EAR
HIGH
| C
ROSS
-BOR
DER
IPO
INDE
X 20
17
PE and VC IPO Exits – Sector InsightsWith a number of high-profile tech companies coming to the market in 2017, the volume of exits proved strong in the High Technology sector. PE and VC-backed technology IPOs numbered 85, a jump from 60 in 2016, while capital raised climbed 190% to USD 12.8 billion on a year-on-year basis, 30% of which was accounted for by Snap Inc’s IPO.
Another strong performer was the Materials sector, which saw a 96% increase in the number of PE and VC-backed IPOs during the year at 55 and a 49% increase in the capital raised of USD 3.8 billion.
The sector with the second-highest capital raised within PE and VC-backed IPOs during the year was Financials with USD 8.6 billion, but that value reflected a decline of 44% on the year.
Consumer Products & Services, Energy & Power, High Technology, Industrials, Materials and Media & Entertainment were the only sectors to see volume levels increase in the PE and VC-backed IPO market.
Consumer Products & Services, Industrials, Media & Entertainment and Real Estate were the only sectors that exceeded capital raising levels witnessed over the last two years. Consumer Products & Services grew by 165% to USD 6.4 billion, Industrials grew by 5% to USD 8.1 billion, Media & Entertainment grew by 113% to USD 2.5 billion and Real Estate grew by 134% to USD 836.8 million.
PE and VC IPO Exits – Regional InsightsChina dominated the PE and VC IPO exit market in 2017 with 258 issuances raising a total of USD 22.5 billion, an increase of 102% and 12% respectively on the year. It was closely followed by the United States which registered deals worth USD 20.6 billion from 67 PE and VC-backed IPOS.
Other countries where capital raised increased included India, Austria, Germany, Finland and Canada, while those in Japan, Spain and the United Kingdom saw capital raising drop year on year. Of note is an 80% drop in the capital raised by companies in the UK over the year to USD 741.4 million.
PE and VC IPO Exits – Stock Exchange InsightsThe New York Stock Exchange proved a strong draw in terms of the amount of capital raised for PE- and VC-backed companies going to the market in 2017 with USD 17.6 billion raised, a jump of 114% year on year. That performance gives the exchange a 27% share of the total capital raised by PE- and VC-backed companies.
Meanwhile, two Chinese stock exchanges, Shenzhen and Shanghai, have performed well in recent years in value and volume. Capital raising in both exchanges raised over USD 8 billion each and had over 200 PE- and VC-backed IPOs between them.
PE/VC Backed IPOsDomicile nation by value
0
5000
10000
15000
20000
25000Va
lue
(USD
mill
ion)
China US India Austria Germany Japan Finland
PE/VC Backed IPOsTop Stock Exchange Analysis by Value
Valu
e (U
SD m
illio
n)
New YorkStock
Exchange
Shanghai Stock
Exchange
BombayStock
Exchange
NasdaqOMX
NordicExchanges
FrankfurtStock Exchange
(Mainboardand Xetra)
ShenzhenStock Exchange
(includingChiNext and
SME)
NASDAQ
20000
18000
16000
14000
12000
10000
8000
6000
4000
2000
0
PE/VC Backed IPOs
Domicile nationby volume
7991734
67258
China
United States
Japan
India
Canada
France
United Kingdom
PE/VC Backed IPOs
141
108
40
37
3315 8
Top StockExchange Analysis
Volume
Shenzhen Stock Exchange(including ChiNext and SME)
Shanghai Stock Exchange
NASDAQ
New York Stock Exchange
Tokyo
Bombay Stock Exchange
Nasdaq OMX Nordic Exchanges

2120
GLOB
AL IP
O VO
LUM
E HI
TS T
EN-Y
EAR
HIGH
| C
ROSS
-BOR
DER
IPO
INDE
X 20
17
Regional Insight
We are bullish about transactional activity as a whole in the region in 2017. We predict that M&A activity will be strong and this will drive secondary offerings of equity and debt capital markets transactions. China will continue to drive a lot of the IPO activity, both domestically and cross-border, mainly on the Hong Kong Stock Exchange. Cross-border IPOs will continue to be a significant feature of IPO activity in the region.
David Holland,Asia Pacific Head of Capital Markets
Asia Pacific
Cross-Border IPO Index: Asia PacificThe Cross-Border IPO Index in Asia Pacific fell by 20% in 2017, as domestic deals dominated the share of new equity deals in the region and the cross-border capital raised during the year saw a decrease of 24%.
But even with this decline, Asia Pacific led all other regions in cross-border listings in 2017, with 1,130 IPOs. The Hong Kong exchange’s mainboard and GEM continue to tempt the most cross-border IPOs with many Chinese companies electing to have their IPOs on the stock exchange in the administrative region. In total, 107 cross-border IPOs were issued in Asia Pacific during 2017.
Mainland China exchanges saw another surge in new listings as a result of the government’s move to allow exchanges to take over the IPO approval process and clear the backlog of companies waiting to list. China accounted for over 50% of total cross-border listings in Asia Pacific. Of the 60 IPOs by Chinese issuers listing on Asia Pacific exchanges, 55 were issued on the Hong Kong Stock Exchange, while four others chose Australia, Korea and Singapore as their listing destinations. A total of 14 Singapore-based issuers also chose the Hong Kong Stock Exchange as their listing destination.
It proved a steady year for capital raising in Asia Pacific’s exchanges during 2017, with issuances totalling USD 92.4 billion accounting for a 13% increase compared to 2016.
Key Asia Pacific Data Points
24%CHANGE IN
CAPITAL RAISEDCROSS-BORDER
IPOs
26%CHANGE IN
CAPITAL RAISEDDOMESTIC
IPOs
USD 17BILLION
CAPITAL RAISED BYCROSS-BORDER IPOs
107CROSS-BORDER
IPOs
Cross-Border IPO Index: Asia Pacific
0 5 10 15 20 25 30
2012
2013
2014
2015
2016
2017
19.3
29.5
23.1
23.3
20.0
16.1

2322
GLOB
AL IP
O VO
LUM
E HI
TS T
EN-Y
EAR
HIGH
| C
ROSS
-BOR
DER
IPO
INDE
X 20
17
EMEA
Total capital raised climbed by 55% to USD 55.1 billion while the number of issues was up 25% to 227, both following two previous years of decline.
Cross-Border IPO Index: EMEAThe Cross-Border IPO Index in EMEA was one of the most promising increases in 2017, after continuous years of decline. The EMEA index increased by 93% in 2017, as cross-border capital raising and the number of IPOs experienced increases, driven by the largest cross-border lPO this year, Allied Irish Banks.
After a slow start to 2017, a stronger second half means we’ve witnessed a year of growth. In London – which attracts the largest pool of capital in Europe – Brexit has had little-to-no impact on choice of listing venue. Throughout Europe, there have been fewer political shocks to the European system in 2017, with fewer surprises in elections across EMEA. We continue to see a broadening of geographies in EMEA equity capital markets, with more markets open for business.
Adam Farlow,EMEA Head of Capital Markets
It has been a buoyant year for IPOs in EMEA in 2017, with both the volume of capital raised and the number of issuances climbing sharply.
In London – which attracts the largest pool of capital in Europe – Brexit has had little-to-no impact on choice of listing venue. Non-UK-based companies continue to see it as a premium listing venue, with corporate governance and disclosure at the highest standards tempting companies such as Global Ports. The city remains an attractive venue with a rich list of peers and investors, as well as deep liquidity and a large number of research analysts.
The London Stock Exchange remains the top cross-border destination for IPOs across EMEA with USD 8.1 billion recorded for the year.
Throughout Europe, there have been fewer political shocks to the European system in 2017, with fewer surprises in elections across EMEA. We continue to see a broadening of geographies in EMEA equity capital markets, with more markets open for business such as Turkey, the Middle East and the CIS.
Turkey has had an incredibly strong year for IPOs, despite the political situation. Continued sanctions in Russia are continuing to depress activity, but Russian deals are now starting to get away and have more than doubled by value.
Total value of transactions in Switzerland has quadrupled. In Scandinavia, Stockholm has been a robust market with numerous but smaller life-sciences companies seeing an increase in number of listings in particular.
When it comes to sectors within EMEA, financials took the top spot for value and volume share, accounting for 22% of the total number of IPOs and 31% of capital raised on EMEA exchanges in 2017. Other industries with a share of 10% or more in terms of volume for overall EMEA IPOs are Industrials (13%), High Technology (12%) and Consumer Products & Services (12%). In terms of capital raising, other industries that had a share of 10% or more include Industrials (USD 9.3 billion, accounting for 17% of total capital raising) and High Technology (USD 5.7 billion, accounting for 10% of total capital raising).
Financials was also busy when it comes to cross-border listings, accounting for 57% of total capital raised and 25% of total number of IPOs issued on exchanges in the region. Other industries with a share of 10% or more in terms of volume for overall EMEA IPOs are Energy & Power (18%), High Technology (14%) and Materials (11%).
In terms of capital raising, other industries which had a share of 10% or more include Materials (USD 2 billion, accounting for 18% of total capital raising) and Energy & Power (USD 1.1 billion, accounting for 10% of total capital raising).
Key EMEA Data Points
722%CHANGE IN
CAPITAL RAISEDCROSS-BORDER
IPOs
45%CHANGE IN
CAPITAL RAISEDDOMESTIC
IPOs
USD 10.7BILLION
CAPITAL RAISED BYCROSS-BORDER IPOs
28CROSS-BORDER
IPOs
Cross-Border IPO Index: EMEA
0 5 10 15 20 25 30 35
2012
2013
2014
2015
2016
2017
34.5
28.8
19.9
11.6
9.1
17.6

2524
GLOB
AL IP
O VO
LUM
E HI
TS T
EN-Y
EAR
HIGH
| C
ROSS
-BOR
DER
IPO
INDE
X 20
17
North America
Cross-Border IPO Index: North AmericaThe Cross-Border IPO Index in North America decreased by 12% in 2017, as the year-on-year growth of domestic capital raising significantly outpaced that of cross-border capital raising during the year.
Cross-border listings increased by 127% to 59, raising a total of USD 9.5 billion, up 46% on
2017 was a bounce-back year for the North American capital markets, not a surprise considering so many issuers and sponsors had sat on the sidelines in 2016 as a result of the US election and Brexit referendum. While 2017 has not been without its challenges from a geopolitical point of view, issuers and sponsors came back into the US markets in significant numbers and were rewarded with a rising tide. Issuers and sponsors have either accepted a greater level of political uncertainty, or they have simply decided that they could no longer wait until things settled down politically.
Amar Budarapu,North America Head of Capital Markets
The North America market rebounded in 2017, shaking off the lethargy which accompanied the US election in 2016. Capital raising jumped by 108% to USD 51.6 billion while the number of issuances increased by 112% to 320.
the year. Companies based in China were the most active cross-border issuers in North America and made up 25 of the 59. Of note was fintech firm Qudian and e-commerce company Sogou which raised a combined proceeds amount of over USD 1.4 billion on the New York Stock Exchange.
Financials accounted for 32% of the total volume of IPOs issued on North American exchanges in 2017. The only other industry
with a share of 10% or more in terms of volume for overall North American IPOs is Healthcare with 17%. In terms of capital raising, Financials also took the lead at 25% – USD 12.9 billion, up by 82% year on year – of total capital raised by IPOs issued in North American exchanges. This was followed by High Technology – 18% share at USD 9 billion, up by 200% – and Energy & Power – 11% share at USD 5.6 billion, up by 93%.
Key North America Data Points
46%CHANGE IN
CAPITAL RAISEDCROSS-BORDER
IPOs
133%CHANGE IN
CAPITAL RAISEDDOMESTIC
IPOs
USD 9.5BILLION
CAPITAL RAISED BYCROSS-BORDER IPOs
59CROSS-BORDER
IPOs
Cross-Border IPO Index: North America
0 5 10 15 20 25 30 35
2012
2013
2014
2015
2016
2017
13.1
14.4
31.8
17.4
25.3
22.2

2726
GLOB
AL IP
O VO
LUM
E HI
TS T
EN-Y
EAR
HIGH
| C
ROSS
-BOR
DER
IPO
INDE
X 20
17
Latin America Contacts
Behind the impressive growth was a surge in domestic capital raising, as well as the first cross-border IPO listing in a decade valued at USD 426.3 million by Brazilian healthcare firm Biotoscana Investments SA. Recovery hopes in two of the largest economies in the region – Argentina and Brazil – elicited strong investor confidence particularly in the Retail, Energy & Power, Industrials and Financials sectors. In addition, growth of IPO activity in the region was driven by regulatory changes in Argentina and Brazil designed to unlock economic
Mexico and Brazil remain the leading countries in what has been a busy year for the region. Argentina, which has traditionally been a debt market has been able to bounce back with a more business-focused president, growth in the economy and a well-educated workforce which has tempted more global businesses to set up bases in the region. Mexico has been strong on both energy and power while real estate, healthcare and government issues should directly drive business in future.
Pablo Berckholtz,Latin America Head of Capital Markets
Capital raising in Latin America in 2017 saw USD 7.6 billion raised, a 781% jump on the previous year.
growth. Other Latin America-based or domiciled companies that have listed on exchanges outside the region included Argentina’s largest cement producer Loma Negra Cia Industrial, which raised over USD 1 billion on the New York Stock Exchange.
Retail accounted for 24% of the total volume of IPOs issued on Latin American exchanges in 2017. Other industries with a share of 10% or more in terms of volume for overall Latin America IPOs were Industrials and Energy & Power – 18% each – as well as Financials and Healthcare – 12% each.
In terms of capital raising, Retail also took the lead with 35% – USD 2.7 billion, up by over 23,000% year on year – of total capital raised by IPOs issued in Latin American exchanges. This was followed by Energy & Power – 17% share at USD 1.3 billion, up by over 800,000% – Industrials – 16% share at USD 1.3 billion – and Financials – 14% share at USD 1.2 billion, up by 194% year on year.
Helping clients overcome the challenges of competing in the global economy.
Koen VanhaerentsGlobal Chair,
Capital [email protected]
David HollandAsia Pacific Chair, Capital Markets
Adam FarlowEMEA Chair,
Capital [email protected]
Amar BudarapuNorth America Chair,
Capital [email protected]
Pablo BerckholtzLatin America Chair,
Capital [email protected]
Eleanor GillilandAssociate Director,
Business [email protected]
Michael EvansAssociate Director, Communications
MethodologyBaker McKenzie’s Cross-Border IPO Index is calculated as a weighted average of three components based on IPO activity data: the amount of capital raised, number of IPOs and number of issuer home jurisdictions involved. Each component is calculated as the quotient of the component’s value when considering cross-border IPO activity divided by that component’s value when considering overall IPO activity. The population of data underlying each calculation is based on aggregate data of IPO transactions completed on all stock exchanges and is grouped by region. IPO activity includes priced IPO and IPOs expected to price in 2017 correct to 4 December 2017. All data underlying the calculations is sourced through Thomson ONE.

28
Baker McKenzie helps clients overcome the challenges of competing in the global economy.We solve complex legal problems across borders and practice areas. Our unique culture, developed over 65 years, enables our 13,000 people to understand local markets and navigate multiple jurisdictions, working together as trusted colleagues and friends to instill confidence in our clients.
© 2017 Baker McKenzie. All rights reserved. Baker & McKenzie International is a global law firm with member law firms around the world. In accordance with the common terminology used in professional service organizations, reference to a “partner” means a person who is a partner or equivalent in such a law firm. Similarly, reference to an “office” means an office of any such law firm.
This may qualify as “Attorney Advertising” requiring notice in some jurisdictions. Prior results do not guarantee a similar outcome.Baker & McKenzie Global Services LLC / 300 E. Randolph Street / Chicago, IL 60601, USA / +1 312 861 8800.
www.bakermckenzie.com