GLOBAL INVESTMENTS IN R&D - UNESCO UISuis.unesco.org/.../fs36-global-investments-in-rd-2015-en.pdf2...
8
UIS FACT SHEET NOVEMBER 2015, No.36 This fact sheet presents the latest UIS R&D data available as of October 2015. A SNAPSHOT OF R&D EXPENDITURE This fact sheet illustrates global and regional trends in the allocation of R&D resources. The UIS releases data on resources devoted to R&D once every year – in August. For developing countries, however, data are collected on a biennial basis. The most commonly used indicators to monitor resources devoted to R&D worldwide are gross domestic expenditure on R&D (GERD) expressed in purchasing power parity (PPP$) and R&D intensity (percentage of gross domestic product (GDP) devoted to R&D activities). Figure 1 presents the distribution of R&D expenditure by region . FIGURE 1. WHERE ARE R&D INVESTMENTS MADE? Shares of world R&D expenditure (GERD) by region, 2007, 2009, 2011 and 2013 Source: UNESCO Institute for Statistics estimates, August 2015 GLOBAL INVESTMENTS IN R&D
-
Upload
truongkhanh -
Category
Documents
-
view
213 -
download
0
Transcript of GLOBAL INVESTMENTS IN R&D - UNESCO UISuis.unesco.org/.../fs36-global-investments-in-rd-2015-en.pdf2...
UIS FACT SHEET NOVEMBER 2015, No.36
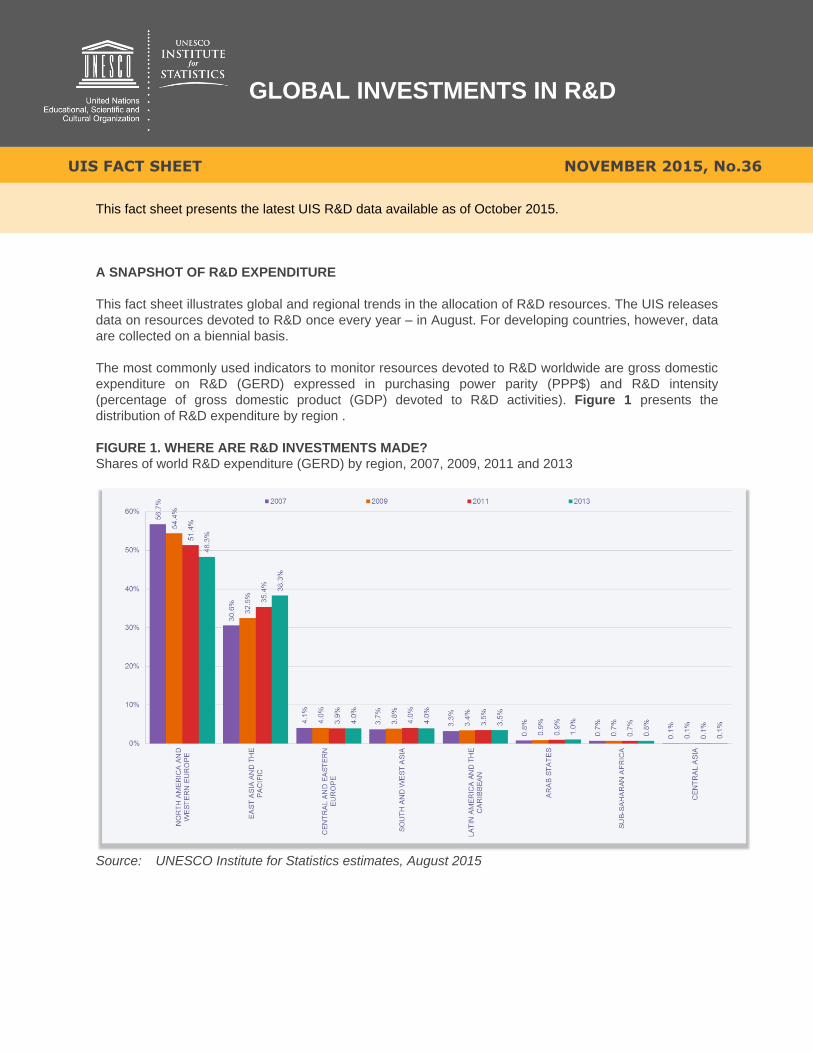
This fact sheet presents the latest UIS R&D data available as of October 2015.
A SNAPSHOT OF R&D EXPENDITURE
This fact sheet illustrates global and regional trends in the allocation of R&D resources. The UIS releases
data on resources devoted to R&D once every year – in August. For developing countries, however, data
are collected on a biennial basis.
The most commonly used indicators to monitor resources devoted to R&D worldwide are gross domestic
expenditure on R&D (GERD) expressed in purchasing power parity (PPP$) and R&D intensity
(percentage of gross domestic product (GDP) devoted to R&D activities). Figure 1 presents the
distribution of R&D expenditure by region .
FIGURE 1. WHERE ARE R&D INVESTMENTS MADE?
Shares of world R&D expenditure (GERD) by region, 2007, 2009, 2011 and 2013
Source: UNESCO Institute for Statistics estimates, August 2015
GLOBAL INVESTMENTS IN R&D
2 UIS/FS/2015/36
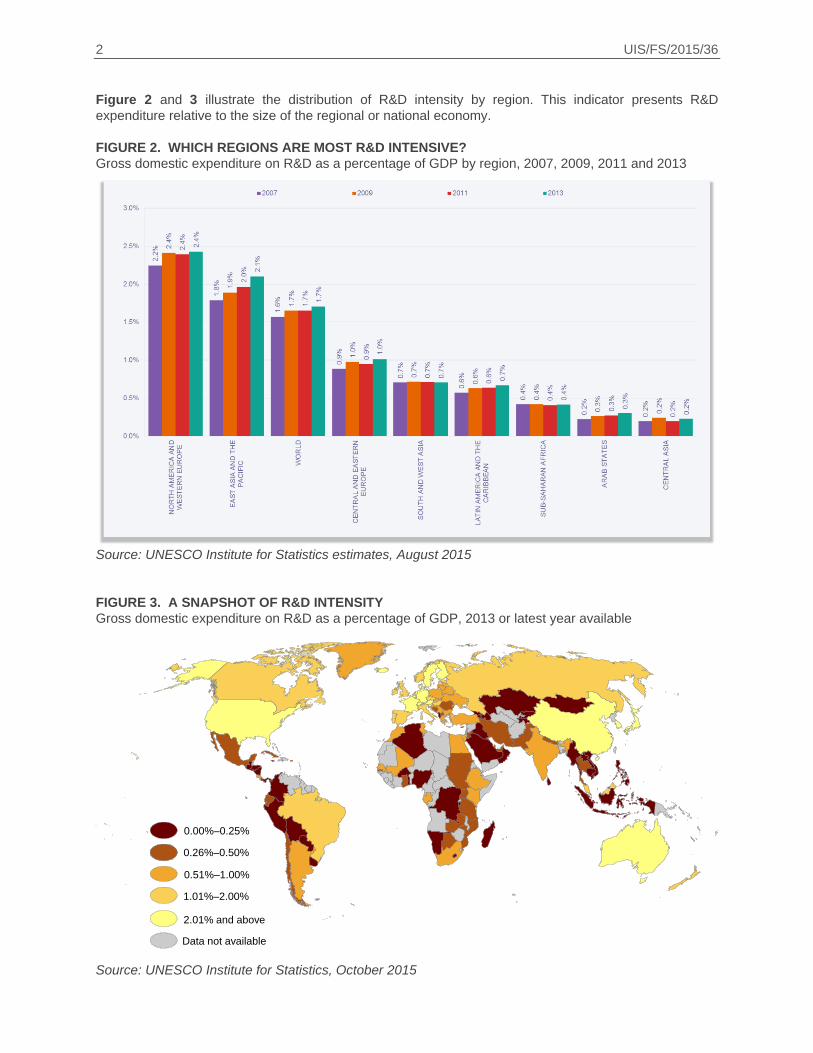
Figure 2 and 3 illustrate the distribution of R&D intensity by region. This indicator presents R&D
expenditure relative to the size of the regional or national economy.
FIGURE 2. WHICH REGIONS ARE MOST R&D INTENSIVE?
Gross domestic expenditure on R&D as a percentage of GDP by region, 2007, 2009, 2011 and 2013
Source: UNESCO Institute for Statistics estimates, August 2015
FIGURE 3. A SNAPSHOT OF R&D INTENSITY
Gross domestic expenditure on R&D as a percentage of GDP, 2013 or latest year available
Source: UNESCO Institute for Statistics, October 2015
0.00%–0.25%
0.26%–0.50%
0.51%–1.00%
1.01%–2.00%
Data not available
2.01% and above

UIS/FS/2015/36 3
The 2013 regional averages for the share of GDP devoted to R&D activities are:
1.7% for World
0.3% for Arab States
1.0% for Central and Eastern Europe
0.2% for Central Asia
2.1% for East Asia and the Pacific
0.7% for Latin America and the Caribbean
2.4% for North America and Western Europe
0.7% for South and West Asia
0.4% for Sub-Saharan Africa
Figure 4 illustrates the world’s top leaders in R&D expenditure, measured in PPP$ for the latest year
available. PPP$ better reflects the real value of investments and allows for more comparability by
eliminating differences in price levels among countries. Essentially, this means that a sum of money
converted into US dollars at PPP rates will buy the same basket of goods and services in all countries.
FIGURE 4. WORLD’S TOP 10 LEADERS IN R&D INVESTMENT
GERD (‘000, PPP$), 2013 or latest year available
Notes: -1 = 2012, -2 = 2011.
Source: UNESCO Institute for Statistics, October 2015

4 UIS/FS/2015/36
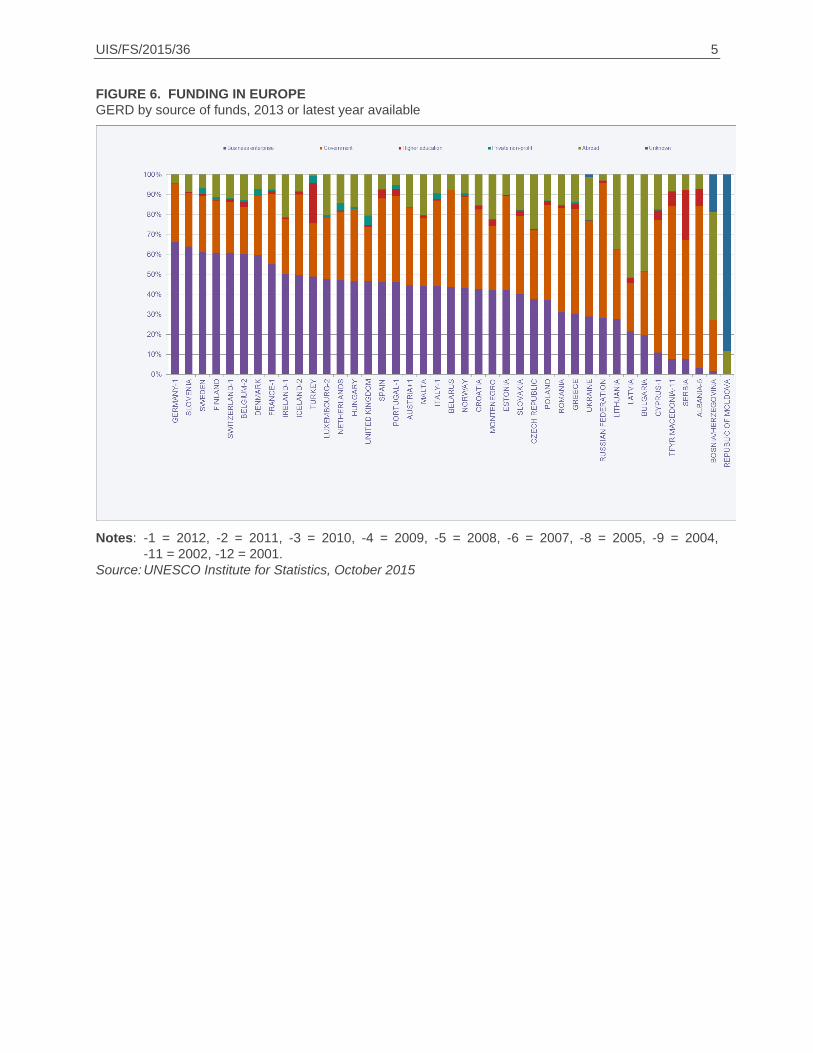
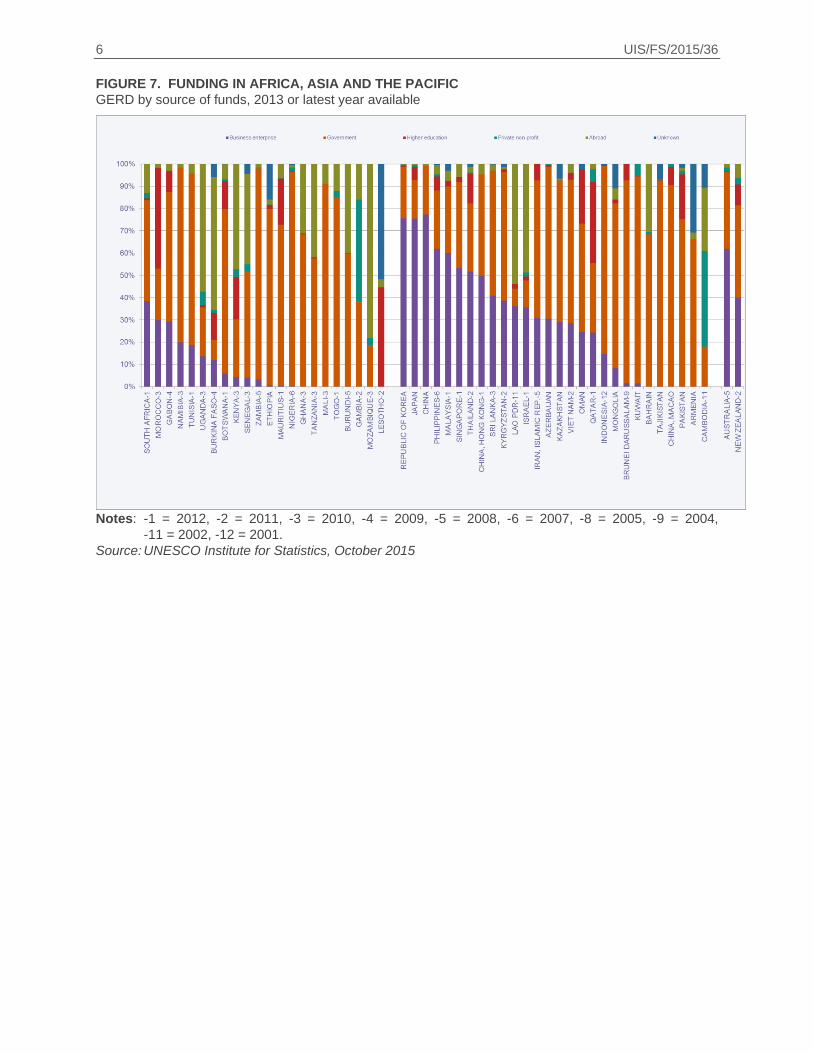
WHICH SECTORS INVEST THE MOST IN R&D?
Figures 5, 6 and 7 illustrate R&D expenditure broken down by source of funds. This refers to total gross
intramural expenditure on R&D during a given period, financed by different sectors of the economy
(business enterprise, government, higher education or private non-profit organizations) or from abroad,
and expressed as a percentage.
FIGURE 5. FUNDING IN THE AMERICAS
GERD by source of funds, 2013 or latest year available
Notes: -1 = 2012, -2 = 2011, -3 = 2010, -4 = 2009, -5 = 2008, -6 = 2007, -8 = 2005, -9 = 2004,
-11 = 2002, -12 = 2001.
Source: UNESCO Institute for Statistics, October 2015
UIS/FS/2015/36 5
FIGURE 6. FUNDING IN EUROPE
GERD by source of funds, 2013 or latest year available
Notes: -1 = 2012, -2 = 2011, -3 = 2010, -4 = 2009, -5 = 2008, -6 = 2007, -8 = 2005, -9 = 2004,
-11 = 2002, -12 = 2001.
Source: UNESCO Institute for Statistics, October 2015
6 UIS/FS/2015/36
FIGURE 7. FUNDING IN AFRICA, ASIA AND THE PACIFIC
GERD by source of funds, 2013 or latest year available
Notes: -1 = 2012, -2 = 2011, -3 = 2010, -4 = 2009, -5 = 2008, -6 = 2007, -8 = 2005, -9 = 2004,
-11 = 2002, -12 = 2001.
Source: UNESCO Institute for Statistics, October 2015
UIS/FS/2015/36 7
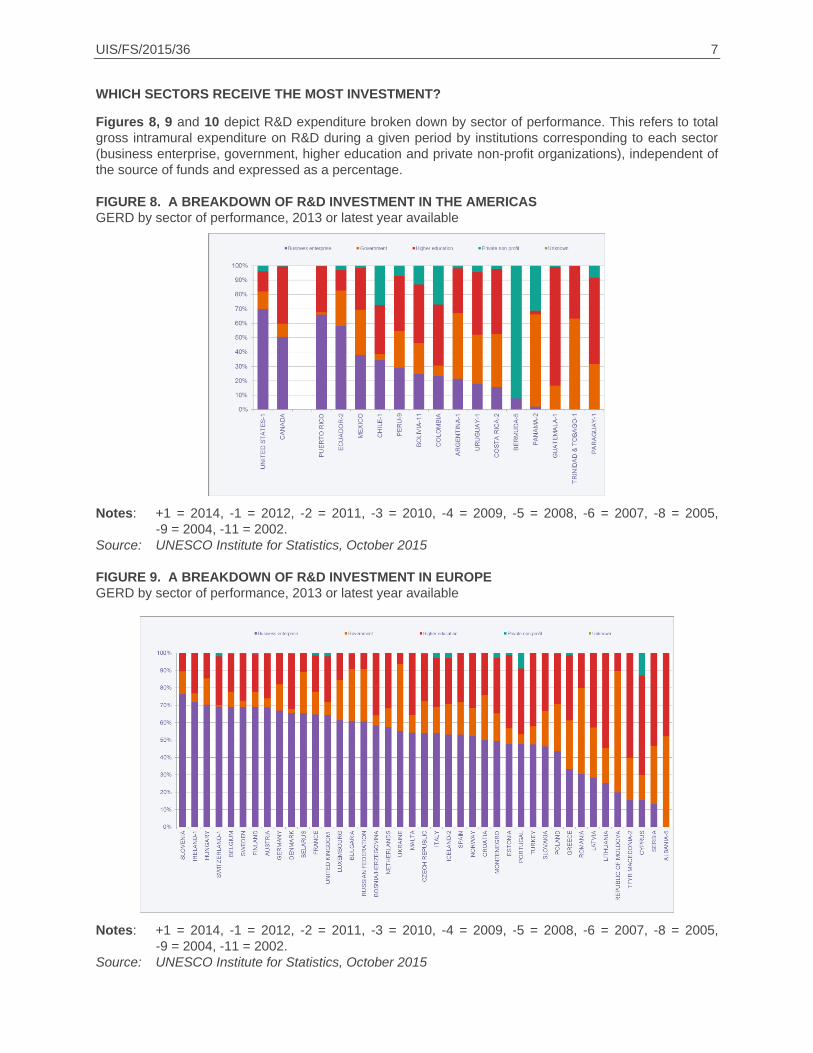
WHICH SECTORS RECEIVE THE MOST INVESTMENT?
Figures 8, 9 and 10 depict R&D expenditure broken down by sector of performance. This refers to total
gross intramural expenditure on R&D during a given period by institutions corresponding to each sector
(business enterprise, government, higher education and private non-profit organizations), independent of
the source of funds and expressed as a percentage.
FIGURE 8. A BREAKDOWN OF R&D INVESTMENT IN THE AMERICAS
GERD by sector of performance, 2013 or latest year available
Notes: +1 = 2014, -1 = 2012, -2 = 2011, -3 = 2010, -4 = 2009, -5 = 2008, -6 = 2007, -8 = 2005,
-9 = 2004, -11 = 2002.
Source: UNESCO Institute for Statistics, October 2015
FIGURE 9. A BREAKDOWN OF R&D INVESTMENT IN EUROPE
GERD by sector of performance, 2013 or latest year available
Notes: +1 = 2014, -1 = 2012, -2 = 2011, -3 = 2010, -4 = 2009, -5 = 2008, -6 = 2007, -8 = 2005,
-9 = 2004, -11 = 2002.
Source: UNESCO Institute for Statistics, October 2015

8 UIS/FS/2015/36
FIGURE 10. A BREAKDOWN OF R&D INVESTMENT IN AFRICA, ASIA AND THE PACIFIC
GERD by sector of performance, 2013 or latest year available
Notes: +1 = 2014, -1 = 2012, -2 = 2011, -3 = 2010, -4 = 2009, -5 = 2008, -6 = 2007, -8 = 2005,
-9 = 2004, -11 = 2002.
Source: UNESCO Institute for Statistics, October 2015
Please consult the UIS website www.uis.unesco.org to access the UIS Data Centre and subscribe to eAlerts on the Institute’s latest publications and data releases.
For more information on R&D data, please consult the UNESCO eAtlas of Research and Experimental Development at http://on.unesco.org/RD-map