
GLOBAL INTELLIGENCE - zenithroiagency.comzenithroiagency.com/GlobalIntelligence/Issue1.pdf ·...
17
GLOBAL INTELLIGENCE DATA & INSIGHTS FOR THE NEW AGE OF COMMUNICATION 01 Q3 2016
Transcript of GLOBAL INTELLIGENCE - zenithroiagency.comzenithroiagency.com/GlobalIntelligence/Issue1.pdf ·...

1
GLOBAL INTELLIGENCEDATA & INSIGHTS FOR THE NEW AGE OF COMMUNICATION
01 Q3 2016

2 3
04 LEADER
ADSPEND FORECASTS
MARKETING TECH
DIGITAL CHANNELS
CATEGORY INSIGHTS
06 HOTSPOTSPON.
08 Q3 2016 SUMMARY
10 Q3 2016 SUMMARY BY MEDIUM
12 MARKET FOCUS - INDIA
14 INNOVATION
16 DIGITAL GIANTS
18 MOBILE
20 CONTENT
22 PROGRAMMATIC
24 SEARCHON
26 TOUCHPOINTS
28 SOCIAL
CONTENTSGLOBAL INTELLIGENCEGlobal Intelligence is an essential briefing for marketers, brought to you by the world’s leading advertising expenditure forecasters. Published quarterly, Global Intelligence is a critical mix of data, insight and commentary, fuelled by Publicis Media’s proprietary tools and authored by our communications experts. Led with an overview of the latest quarterly Advertising Expenditure Forecasts, each issue provides intelligence on key areas of contemporary communication, including digital and mobile, technology and automation, innovation, performance marketing, and branded content.

544
GLOBAL INTELLEGENCE | LEADERGLOBAL INTELLEGENCE | LEADER
WELCOME TO THE FIRSTISSUE OF GLOBAL INTELLIGENCEZenith is very pleased to introduce the first edition of Global Intelligence, our quarterly round-up of insights and intelligence from across our global network.
We’ve put this magazine together to highlight the work being done across Zenith – and Publicis Media as a whole – to understand how the world of marketing is changing, and how we can harness these changes to communicate better with consumers.
Zenith is a global leader in forecasting advertising and marketing trends. We have published our quarterly Advertising Expenditure Forecasts for more than a quarter of a century, and have expanded our range of publications over time. We now produce dedicated forecasts for media consumption, online video, programmatic marketing and new media, as well as reports on the world’s biggest media owners and the most promising developing ad markets.
Global Intelligence is designed as a companion piece to these reports, telling you what you need to know about our latest advertising forecasts, as well as providing insights into key trends affecting our industry – such as native content, mobile technology, programmatic buying and category research. The articles were put together with the help of experts from across Zenith and across Publicis Media.
We hope you enjoy this first edition of Global Intelligence. Please let us know what you like, what you don’t, and what you want to see more of – get in touch by emailing me at [email protected].
5

76
ADSPEND FORECASTS | HOT SPOTS ADSPEND FORECASTS | HOT SPOTS
6 7
3.8 %North America
Canada, USA
THE WORLD’S ADVERTISING HOT SPOTS
Latin America Argentina, Brazil, Chile, Colombia, Costa Rica, Ecuador, El Salvador, Mexico, Panama, Peru, Puerto Rico, Uruguay, Venezuela
0.7 %
Western & Central Europe
Austria, Belgium, Bosnia & Herzegovina, Croatia, Czech Republic, Denmark, Finland, France, Germany, Greece, Hungary, Ireland, Italy, Netherlands, Norway, Poland, Portugal, Romania, Serbia, Slovakia, Slovenia, Spain, Sweden, Switzerland, UK
3.1 %Eastern Europe & Central Asia
Armenia, Azerbaijan, Belarus, Bulgaria, Estonia, Georgia, Kazakhstan, Latvia, Lithuania, Moldova, Russia, Turkey, Ukraine, Uzbekistan
4.8 %
Japan
1.4 %
Middle East & North Africa
Bahrain, Egypt, Israel, Kuwait, Oman, Qatar, Saudi Arabia, UAE
-7.8 %
Fast-track Asia
China, India, Indonesia, Malaysia, Pakistan, Philippines, Taiwan, Thailand, Vietnam
9.2 %
Advanced Asia
Australia, Hong Kong, New Zealand, Singapore, South Korea
2.3 %
AVERAGE ANNUAL GROWTH IN ADSPEND BY REGIONAL BLOC 2015-2018
-6% 9%4%
98
ADSPEND FORECASTS | Q3 2016 SUMMARY ADSPEND FORECASTS | Q3 2016 SUMMARY
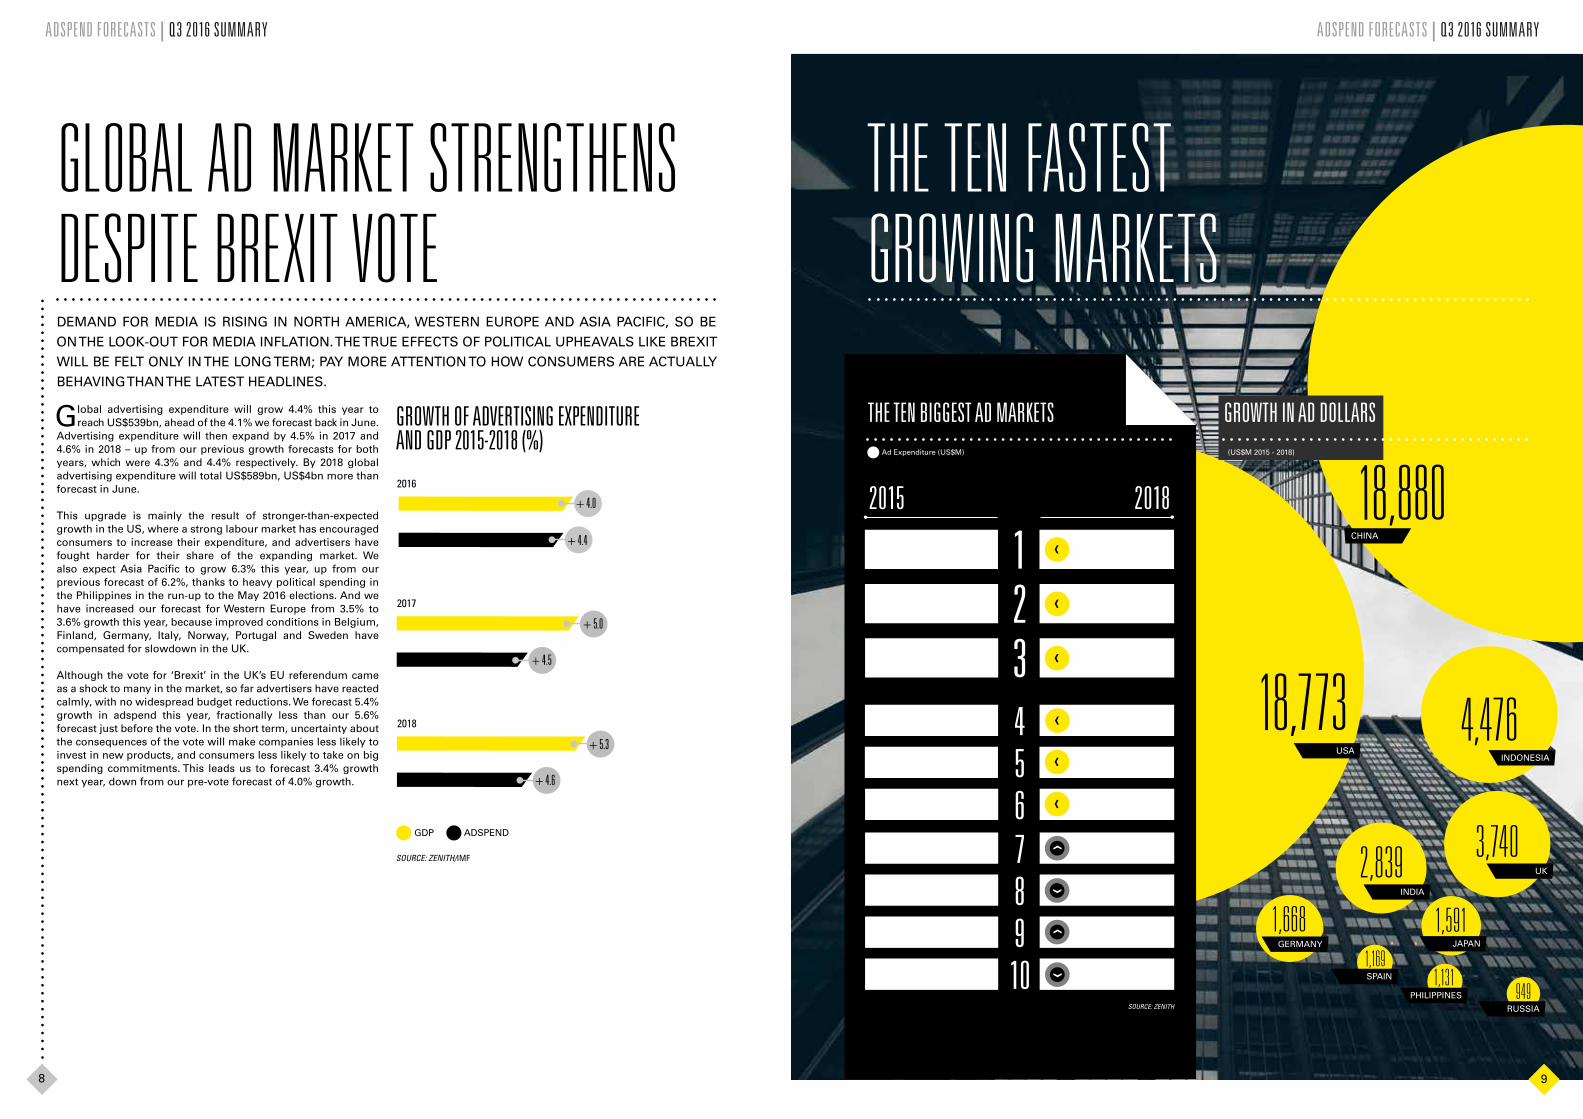
GLOBAL AD MARKET STRENGTHENS DESPITE BREXIT VOTE
THE TEN BIGGEST AD MARKETS
SOURCE: ZENITH
Global advertising expenditure will grow 4.4% this year to reach US$539bn, ahead of the 4.1% we forecast back in June.
Advertising expenditure will then expand by 4.5% in 2017 and 4.6% in 2018 – up from our previous growth forecasts for both years, which were 4.3% and 4.4% respectively. By 2018 global advertising expenditure will total US$589bn, US$4bn more than forecast in June.
This upgrade is mainly the result of stronger-than-expected growth in the US, where a strong labour market has encouraged consumers to increase their expenditure, and advertisers have fought harder for their share of the expanding market. We also expect Asia Pacific to grow 6.3% this year, up from our previous forecast of 6.2%, thanks to heavy political spending in the Philippines in the run-up to the May 2016 elections. And we have increased our forecast for Western Europe from 3.5% to 3.6% growth this year, because improved conditions in Belgium, Finland, Germany, Italy, Norway, Portugal and Sweden have compensated for slowdown in the UK. Although the vote for ‘Brexit’ in the UK’s EU referendum came as a shock to many in the market, so far advertisers have reacted calmly, with no widespread budget reductions. We forecast 5.4% growth in adspend this year, fractionally less than our 5.6% forecast just before the vote. In the short term, uncertainty about the consequences of the vote will make companies less likely to invest in new products, and consumers less likely to take on big spending commitments. This leads us to forecast 3.4% growth next year, down from our pre-vote forecast of 4.0% growth.
THE TEN FASTEST GROWING MARKETS
9491,131
1,5911,169
2,839 3,740
18,773
18,880
RUSSIA
PHILIPPINES
SPAIN
JAPAN
1,668GERMANY
INDIA
UK
4,476INDONESIA
USA
CHINA
GROWTH OF ADVERTISING EXPENDITURE AND GDP 2015-2018 (%)
2016
+ 4.4
+ 4.0
2017
+ 4.5
+ 5.0
2018
+ 4.6
+ 5.3
SOURCE: ZENITH/IMF
ADSPENDGDP
2015 2018
201,387USA
182,615USA 1
92,482CHINA
73,601CHINA 2
38,181JAPAN
36,590JAPAN 3
28,641UK
24,901UK 4
23,079GERMANY
21,412GERMANY 5
11,553AUSTRALIA
11,278FRANCE 7
11,364SOUTH KOREA 6 12,137
SOUTH KOREA
11,540FRANCE
10,634AUSTRALIA 8
10,146BRAZIL 9 10,517
INDONESIA
8,782CANADA 10 10,272
BRAZIL
Ad Expenditure (US$M)
9
‹
‹
‹
‹
‹
‹
DEMAND FOR MEDIA IS RISING IN NORTH AMERICA, WESTERN EUROPE AND ASIA PACIFIC, SO BE
ON THE LOOK-OUT FOR MEDIA INFLATION. THE TRUE EFFECTS OF POLITICAL UPHEAVALS LIKE BREXIT
WILL BE FELT ONLY IN THE LONG TERM; PAY MORE ATTENTION TO HOW CONSUMERS ARE ACTUALLY
BEHAVING THAN THE LATEST HEADLINES.
(US$M 2015 - 2018)
‹
‹
‹
‹
GROWTH IN AD DOLLARS
1110
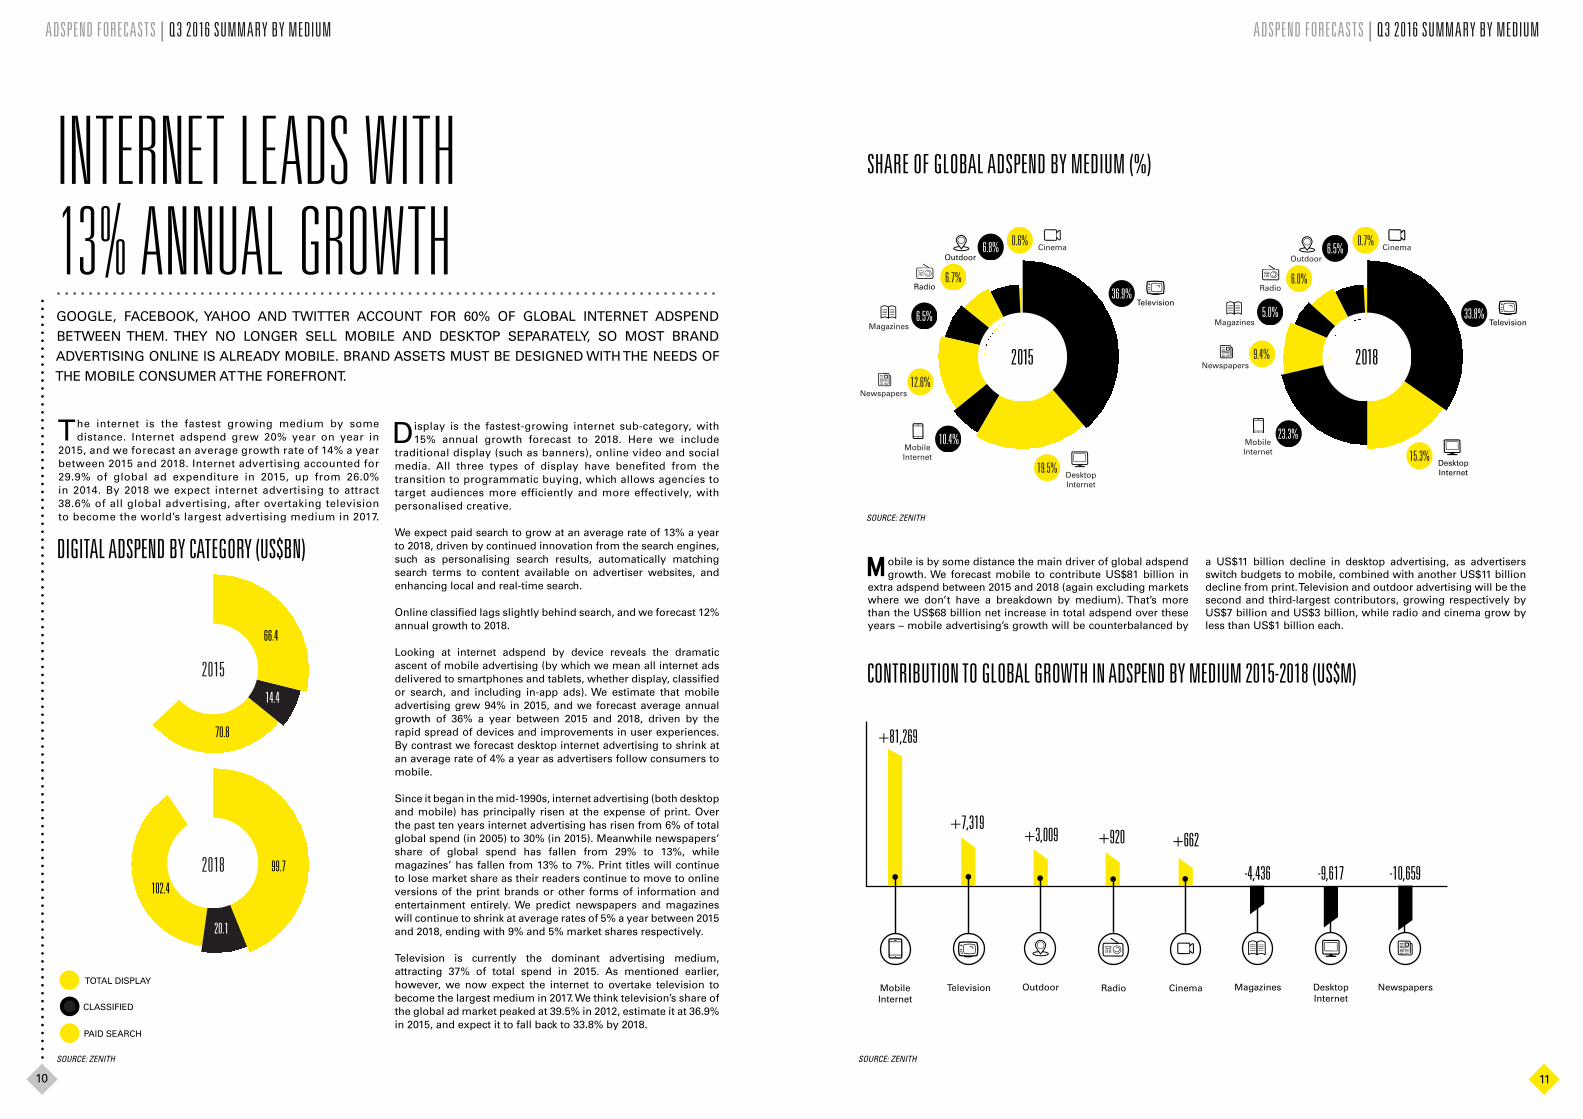
SHARE OF GLOBAL ADSPEND BY MEDIUM (%)
2015
36.9%Television
19.5%DesktopInternet
10.4%MobileInternet
12.6%Newspapers
6.5%Magazines
6.7%Radio
0.6%Cinema6.8%
Outdoor
2018
33.8%Television
15.3%DesktopInternet
23.3%MobileInternet
9.4%Newspapers
5.0%Magazines
6.0%Radio
0.7%Cinema6.5%
Outdoor
ADSPEND FORECASTS | Q3 2016 SUMMARY BY MEDIUM ADSPEND FORECASTS | Q3 2016 SUMMARY BY MEDIUM
The internet is the fastest growing medium by some distance. Internet adspend grew 20% year on year in
2015, and we forecast an average growth rate of 14% a year between 2015 and 2018. Internet advertising accounted for 29.9% of global ad expenditure in 2015, up from 26.0% in 2014. By 2018 we expect internet advertising to attract 38.6% of all global advertising, after overtaking television to become the world’s largest advertising medium in 2017.
Display is the fastest-growing internet sub-category, with 15% annual growth forecast to 2018. Here we include
traditional display (such as banners), online video and social media. All three types of display have benefited from the transition to programmatic buying, which allows agencies to target audiences more efficiently and more effectively, with personalised creative.
We expect paid search to grow at an average rate of 13% a year to 2018, driven by continued innovation from the search engines, such as personalising search results, automatically matching search terms to content available on advertiser websites, and enhancing local and real-time search.
Online classified lags slightly behind search, and we forecast 12% annual growth to 2018.
Looking at internet adspend by device reveals the dramatic ascent of mobile advertising (by which we mean all internet ads delivered to smartphones and tablets, whether display, classified or search, and including in-app ads). We estimate that mobile advertising grew 94% in 2015, and we forecast average annual growth of 36% a year between 2015 and 2018, driven by the rapid spread of devices and improvements in user experiences. By contrast we forecast desktop internet advertising to shrink at an average rate of 4% a year as advertisers follow consumers to mobile.
Since it began in the mid-1990s, internet advertising (both desktop and mobile) has principally risen at the expense of print. Over the past ten years internet advertising has risen from 6% of total global spend (in 2005) to 30% (in 2015). Meanwhile newspapers’ share of global spend has fallen from 29% to 13%, while magazines’ has fallen from 13% to 7%. Print titles will continue to lose market share as their readers continue to move to online versions of the print brands or other forms of information and entertainment entirely. We predict newspapers and magazines will continue to shrink at average rates of 5% a year between 2015 and 2018, ending with 9% and 5% market shares respectively.
Television is currently the dominant advertising medium, attracting 37% of total spend in 2015. As mentioned earlier, however, we now expect the internet to overtake television to become the largest medium in 2017. We think television’s share of the global ad market peaked at 39.5% in 2012, estimate it at 36.9% in 2015, and expect it to fall back to 33.8% by 2018.
TOTAL DISPLAY
CLASSIFIED
PAID SEARCH
2015
66.4
14.4
70.8
2018 99.7
20.1
102.4
M
INTERNET LEADS WITH 13% ANNUAL GROWTH
DIGITAL ADSPEND BY CATEGORY (US$BN)
SOURCE: ZENITH SOURCE: ZENITH
SOURCE: ZENITH
CONTRIBUTION TO GLOBAL GROWTH IN ADSPEND BY MEDIUM 2015-2018 (US$M)
MobileInternet
+7,319
+81,269
+3,009
Television DesktopInternet
+920
Outdoor
+662
Radio
-4,436 -9,617 -10,659
Cinema Magazines Newspapers
obile is by some distance the main driver of global adspend growth. We forecast mobile to contribute US$81 billion in
extra adspend between 2015 and 2018 (again excluding markets where we don’t have a breakdown by medium). That’s more than the US$68 billion net increase in total adspend over these years – mobile advertising’s growth will be counterbalanced by
a US$11 billion decline in desktop advertising, as advertisers switch budgets to mobile, combined with another US$11 billion decline from print. Television and outdoor advertising will be the second and third-largest contributors, growing respectively by US$7 billion and US$3 billion, while radio and cinema grow by less than US$1 billion each.
GOOGLE, FACEBOOK, YAHOO AND TWITTER ACCOUNT FOR 60% OF GLOBAL INTERNET ADSPEND
BETWEEN THEM. THEY NO LONGER SELL MOBILE AND DESKTOP SEPARATELY, SO MOST BRAND
ADVERTISING ONLINE IS ALREADY MOBILE. BRAND ASSETS MUST BE DESIGNED WITH THE NEEDS OF
THE MOBILE CONSUMER AT THE FOREFRONT.

1312
ADSPEND FORECASTS | MARKET FOCUS – INDIA ADSPEND FORECASTS | MARKET FOCUS – INDIA
ndia is one of the hotspots of global advertising growth, alongside Indonesia and the Philippines, combining large
scale and double-digit growth rates. Now that Brazil and Russia are in recession and China is slowing down, India is the one remaining stand-out growth market of the BRICs.
Over the last two years, increased public spending has stimulated higher economic growth, and the fall in oil prices has helped the fiscal deficit remain under control despite this extra spending. This has also given private corporations time to deleverage, and arm themselves for the next round of spending in the Indian economy. However, the balance sheets of public sector banks remain weak and will hamper lending.
The long-delayed GST Constitution bill was passed by Parliament in August, marking a historic step for tax reform in the country. Prime Minister Narendra Modi said GST was “crucial” for ending “tax terrorism” as well as reducing corruption. If implemented in 2017, a single rate of GST will replace various taxes to ensure seamless transfer of goods and services. This will pave the way for balanced and inclusive economic growth. The last quarter also saw the elections in four states – Assam, West Bengal, Kerala and Tamil Nadu – with favourable results for the BJP-led government at the centre, which managed to come to power in Assam for the first time.
The seventh pay commission awarded a 23.5% hike in the salaries and pensions of more than 4.7 million central government employees and 5.3 million pensioners, leading to higher aggregate demand in the economy.
E-commerce is in a pause-and-consolidate phase in India. Leading fashion portal Jabong was acquired by Flipkart-owned Myntra as players seek to consolidate and establish supremacy. In terms of gross merchandize value, local players Flipkart and Snapdeal have declined whereas Amazon has registered phenomenal growth. In yet another industry – the taxi aggregator services – the Didi-Uber deal in China will have implications for the business in India.
Phase III of radio is being implemented and this has led to new stations being launched across the country. This has propelled some growth of advertising on radio. Phase III of digitisation of television is also complete, and has led to increased viewing of HD channels as well as among the traditional free-to-air channels. Broadcast houses are launching free-to-air movie channels.
Broader trends reflect an increasing fragmentation and personalization of media with vernacular consumption on the rise across all media.
I
12
YEAR-ON-YEAR CHANGE AT CURRENT PRICES (%)
THE RISING FOOTPRINT OF TRADITIONAL MEDIA OFFERS NEW OPPORTUNITIES FOR MASS BRANDS
TO INCREASE PENETRATION. THE STRENGTH OF DIGITAL MEDIA WILL BE ITS ABILITY TO SELL
MORE TARGETED BRANDS TO SOPHISTICATED CONSUMERS. THE IMMINENT MASS ADOPTION OF
SMARTPHONES PROMISES TO REVOLUTIONISE BRAND COMMUNICATION.
INDIASHARE OF ADSPEND BY MEDIUM
ADSPEND IN INDIA
2013 V 2012 2014 V 2013 2015 V 2014 2016 V 2015 2017 V 2016 2018 V 2017
7.9
19.1
18.7
13.112.3
11.7
US$6.8BNTOTAL
US$9.6BNTOTAL
2015 2018
36.8%
8.3%
43.6%
2.2%4.1%
0.7%
4.2%
34.9%
10.9%
43.9%
1.6%4.0%
0.7%
4.0%
InternetInternet
Outdoor/Transport
Outdoor/Transport
RadioRadio
NewspapersNewspapers
CinemaCinema MagazinesMagazines
TelevisionTelevision
SOURCE: ZENITH
SOURCE: ZENITH
1514
MARKETING TECH | INNOVATION MARKETING TECH | INNOVATION
15
In 1931 the Internationale Funkausstellung Berlin (back then known as the Berlin Radio Show) witnessed the world’s first public demonstration of the cathode-ray tube: the birth of television. Today the IFA, as it is now known, has grown to 1,645 exhibitors across the consumer electronics and home appliances industry, and is attended by 245,000 visitors over six days.
Around 40% of the attendees are non-trade. Unlike the better-known trade-only event CES in Las Vegas, 100,000 Europeans attend purely out of curiosity, or in other words to shop the future, and see what’s in store. This creates an interesting dynamic on the show floor, where what is in effect ‘being sold’ (although nothing is for sale) is the brand image of each exhibitor to the public, and the latest products to trade. Technology brands were presented as lifestyle brands.
Exhibitors such as Samsung and Electrolux, Fitbit and Philips showed off new product lines, service layers, and paradigms of human/computer interaction that will shape the future of our modern lives.
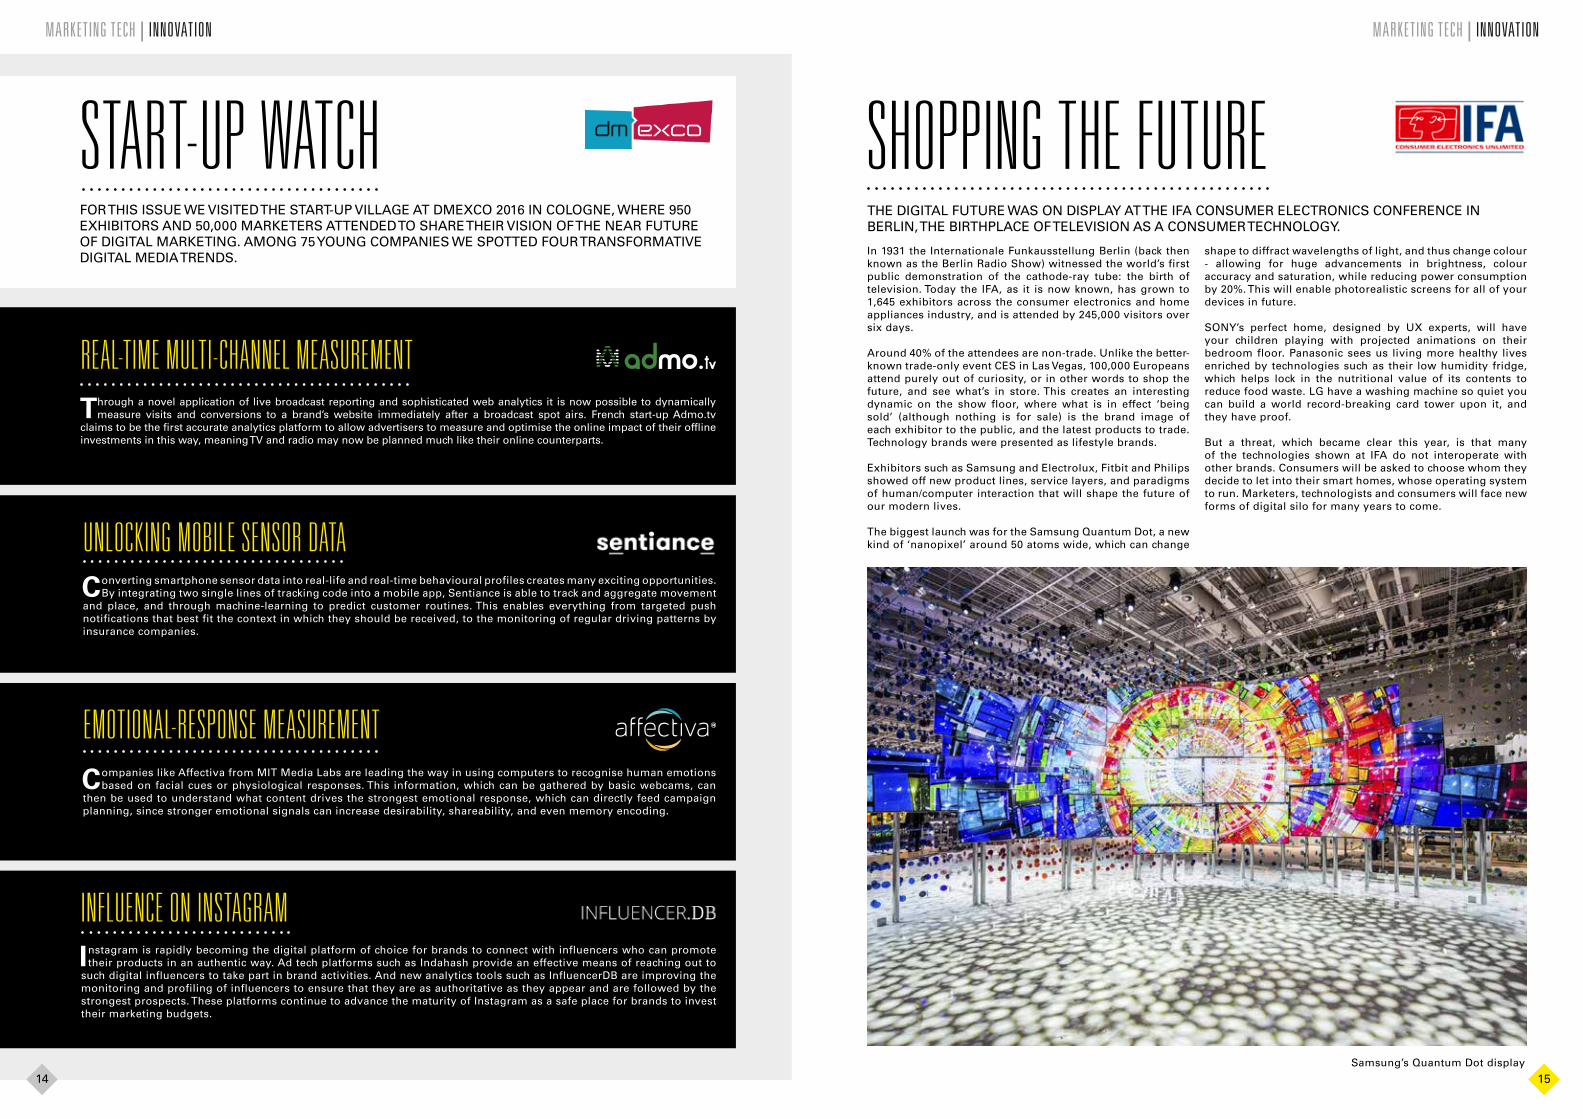
The biggest launch was for the Samsung Quantum Dot, a new kind of ‘nanopixel’ around 50 atoms wide, which can change
THE DIGITAL FUTURE WAS ON DISPLAY AT THE IFA CONSUMER ELECTRONICS CONFERENCE IN BERLIN, THE BIRTHPLACE OF TELEVISION AS A CONSUMER TECHNOLOGY.
SHOPPING THE FUTUREshape to diffract wavelengths of light, and thus change colour - allowing for huge advancements in brightness, colour accuracy and saturation, while reducing power consumption by 20%. This will enable photorealistic screens for all of your devices in future.
SONY’s perfect home, designed by UX experts, will have your children playing with projected animations on their bedroom floor. Panasonic sees us living more healthy lives enriched by technologies such as their low humidity fridge, which helps lock in the nutritional value of its contents to reduce food waste. LG have a washing machine so quiet you can build a world record-breaking card tower upon it, and they have proof.
But a threat, which became clear this year, is that many of the technologies shown at IFA do not interoperate with other brands. Consumers will be asked to choose whom they decide to let into their smart homes, whose operating system to run. Marketers, technologists and consumers will face new forms of digital silo for many years to come.
Samsung’s Quantum Dot display
14
Through a novel application of live broadcast reporting and sophisticated web analytics it is now possible to dynamically measure visits and conversions to a brand’s website immediately after a broadcast spot airs. French start-up Admo.tv
claims to be the first accurate analytics platform to allow advertisers to measure and optimise the online impact of their offline investments in this way, meaning TV and radio may now be planned much like their online counterparts.
RE AL-T IME MULTI-CHANNEL ME ASUREMENT
Companies like Affectiva from MIT Media Labs are leading the way in using computers to recognise human emotions based on facial cues or physiological responses. This information, which can be gathered by basic webcams, can
then be used to understand what content drives the strongest emotional response, which can directly feed campaign planning, since stronger emotional signals can increase desirability, shareability, and even memory encoding.
EMOTIONAL-RESPONSE ME ASUREMENT
Instagram is rapidly becoming the digital platform of choice for brands to connect with influencers who can promote their products in an authentic way. Ad tech platforms such as Indahash provide an effective means of reaching out to
such digital influencers to take part in brand activities. And new analytics tools such as InfluencerDB are improving the monitoring and profiling of influencers to ensure that they are as authoritative as they appear and are followed by the strongest prospects. These platforms continue to advance the maturity of Instagram as a safe place for brands to invest their marketing budgets.
INFLUENCE ON INSTAGRAM
FOR THIS ISSUE WE VISITED THE START-UP VILLAGE AT DMEXCO 2016 IN COLOGNE, WHERE 950 EXHIBITORS AND 50,000 MARKETERS ATTENDED TO SHARE THEIR VISION OF THE NEAR FUTURE OF DIGITAL MARKETING. AMONG 75 YOUNG COMPANIES WE SPOTTED FOUR TRANSFORMATIVE DIGITAL MEDIA TRENDS.
START-UP WATCH
Converting smartphone sensor data into real-life and real-time behavioural profiles creates many exciting opportunities. By integrating two single lines of tracking code into a mobile app, Sentiance is able to track and aggregate movement
and place, and through machine-learning to predict customer routines. This enables everything from targeted push notifications that best fit the context in which they should be received, to the monitoring of regular driving patterns by insurance companies.
UNLOCKING MOBILE SENSOR DATA

1716
OUR ROUND-UP OF THE RECENT RESULTS FROM THE DIGITAL MEDIA GIANTS THAT ARE TRANSFORMING GLOBAL MEDIA AND COMMUNICATION.
MARKETING TECH | DIGITAL GIANTS MARKETING TECH | DIGITAL GIANTS
1616
v
After years of disappointing investors with weak growth, in July Yahoo finally agreed to a takeover by Verizon, which also acquired AOL in 2015. Verizon will pay US$4.8bn for Yahoo’s main advertising and content operations, but not the more valuable stakes in Yahoo Japan and Alibaba. The takeover is due to complete in the first quarter of 2017.
It is not clear to what degree Yahoo and AOL will work together, but it is likely that some or all of their operations will be merged, to reduce shared costs and strengthen their combined negotiation position.
Twitter now has 313 million active users per month, up 3% year on year. This has exacerbated analysts’ concerns that user growth is stalling. Twitter has invested in premium video content, including live-streaming of NFL American football matches, to attract new users and take advantage of fast-growing demand for video advertising.
Twitter has launched several new features for advertisers. These includes video auto-play on all devices, support for new targeting options and creative formats, and improved optimisation and bidding for performance buys.
Source for global reach: GlobalWebIndex
Facebook now has 1.71 billion active users each month – that’s 47% of all the internet users in the world. It has just over one billion active users every day. 1.57 billion Facebook users access it by mobile. Facebook has truly transformed itself into a mobile-first business, generating 84% of its ad revenues from mobile.
Facebook is rapidly become a key platform for online video, generating 8 billion video views a day from 500 million users. It now allows public figures to share live video with their fans, and is integrating video sharing into its Messenger platform. Facebook’s 360 Video enables users to view all 360 degrees of a video scene, giving them the ability to pan around the whole scene.
Facebook’s virtual reality company Oculus is launching its Oculus Rift equipment to retail in Canada and Europe in September, following its retail launch in the US in May.
18%AD REVENUESYEAR ON YEAR
89%OF AD REVENUES
FROM MOBILE
84%
$370bn $539bn $41bn $13bnOF AD REVENUES
FROM MOBILE
MARKETCAP
MARKETCAP
MARKETCAP
MARKETCAP
63%
59.5% 82.6% 51.6% 31.6%AD REVENUES YEAR ON YEAR
GLOBALREACH
(all internet users)
GLOBALREACH
(all internet users)
GLOBALREACH
(all internet users)
GLOBALREACH
(all internet users)
-7%COST PER CLICK YEAR ON YEAR
29%PAID CLICKS
YEAR ON YEAR
5%REVENUES
YEAR ON YEAR
30%OF AD REVENUES
FROM MOBILE
DIGITAL GIANTS Q2 2016
17
Google has completed its restructure and is now a wholly owned subsidiary of holding company Alphabet, concentrating on search and advertising. Alphabet now houses all of the old Google’s more experimental projects, such as drone delivery, driverless cars and life extension.
Google’s ad revenues increased 19% year on year in Q2, a strong result it attributes to rapid growth in mobile search (thanks to improved ad formats) and online video revenues from YouTube, especially its TrueView and Google Preferred formats. The number of clicks continues to rise rapidly, but strong competition among publishers and the efficiency of programmatic advertising is forcing down the cost per click.

1918
MARKETING TECH | MOBILE MARKETING TECH | MOBILE
Apple remains the most desired handset brand – the iPhone is still considered a 'higher tier' device, luxury or even
aspirational. Apple consumers are also an extremely loyal customer base – around 90% of iPhone users claimed they would get a new iPhone rather than one of the competitor’s devices.
Android has expanded faster than Apple at the lower end of the smartphone market. This will become particularly interesting when the use of smartphones in developing nations increases.
Apple does not play as much as Google in the data game, it focuses on selling its devices instead. This is why its product still has a premium cost in comparison to the cheaper devices in the Google ecosystem. High OS penetration gives Google market share and cross-device identification – something Apple can only do probabilistically, but then it is not as invested as Google in the advertising business.
In Q1 2016 Android had by far the largest market share of any mobile operating system – 51.0%, compared to iOS’s 21.7%,
and substantially more than its 39.7% share three years earlier. Google has established this remarkable market dominance by integrating closely with handset manufacturers and providing them with a high-quality OS that users enjoy for the very reasons that they don’t like iOS: personalisation. Google’s recent Android campaigns further press on this point: “Be together, not the same”, a great way to bring their product experience to life.
Consumers who prefer consistent user experience to personalisation, however, have helped iOS double its market share over the past three years, to 21.7% in Q1 2016.
The chart also illustrates the demise of Symbian, the legacy mobile OS used by Nokia, Sony Ericsson and a number of Japanese mobile phone manufacturers, which has been eclipsed by the growth of Android. Microsoft would have loved to take its market share through its acquisition of Nokia, but by that time the OS was already in decline.
Windows OS has not managed to pass the 5% market share mark despite the company’s best efforts to counter both iOS and Android. From a consumer point of view, this is likely due to the low number of apps on Windows phones. From an industry point of view, it has been outcompeted by the colossal advertising budgets deployed by Apple, Samsung, Google and HTC over the past three years.
ANDROID INVASIONTHE MOBILE DEVICES CONSUMERS WANTQ1 2013 Q1 2016
123
ANDROID39.7%
ANDROID51.0%
IOS (FOR IPHONE)10.6%
IOS (FOR IPHONE)21.7%
SYMBIAN5.2%
WINDOWS PHONE4.9%
45
BLACKBERRY OS3.8% 1.6%
BLACKBERRY OS
WINDOWS PHONE3.5%
SYMBIAN1.2%‹
‹
‹
‹
‹
THE SHIFTING MARKET SHARES OF MOBILE OPERATING SYSTEMS
13.8%
Sony
10.8%
Lenovo HTC
11.8%
15.1%
Huawei
12.9%
Xiaomi
11.4%
LG
10.9%
Microsoft
23.5%
Samsung
28.0%
iPhone
WHICH OF THE FOLLOWING MOBILE BRANDS WOULD YOU DEFINITELY CONSIDER PURCHASING?
SOURCE: GLOBALWEBINDEX, GLOBAL INTERNET USERS
SOURCE: GLOBALWEBINDEX, GLOBAL INTERNET USERS, Q1 2016
• iPhones are popular in the marketing industry, but most of your customers don’t use them.
• When planning for mobile you should think Android first
MARKETING IMPERATIVES

2120
DIGITAL CHANNELS | CONTENTDIGITAL CHANNELS | CONTENT
CONTENT PRACTICE
THE RISE AND RISE OF NATIVE CONTENT
Native content is branded copy, images and video that are clearly marked as sponsored, but otherwise indistinguishable
from the other content on a site. And it is taking an ever greater share of advertising and creative budgets. Fully 40% of publishers expect to see over a quarter of their revenue coming from native content, according to VentureBeat.
Two years ago, we were talking about how much more time people were spending online and on their mobiles while advertising spend lingered on print and digital. The challenge that brands were facing was that for all the hours people were spending online, there was a shortage of really effective ways to communicate to them. On mobile, in particular, ads were too often either invisible or annoying.
And that’s where native has come in. IAB research has shown that audiences don’t care whether the content they encounter comes from a brand. They do care if it’s low quality. And they really care if it’s wrong for the editorial context.
Fortunately, with Buzzfeed and other digital-first media owners leading the charge, online publishers have created a remarkable ecosystem of opportunities to reach their audiences with content that people actually want to consume. And because it matches so precisely the formats of the publisher sites, it’s all immune to ad blockers.
And the creative landscape has changed as well. Social media makers have banded together into networks that offer brands access to their audiences and their artistry simultaneously. Publishers are giving brands access to their own journalists and designers to create content that perfectly matches their editorial. The question now is not whether to get into to native advertising, but how soon and how much.
THREE TIPS FOR NATIVE ADVERTISING
1
However brilliant your creative agency, they still speak the language of
advertising, not the language of the platform you’re building content on. So if you’re trying to reach millennials or teens, that means hiring a Vineer, a Snapchat star, or a gamer with a million followers on Twitch. If you want to hit the grown-ups, partner with a brand that has its own in-house creative team, like Guardian Labs, or Conde Nast’s new 23 Stories.
GET YOUR CREATIVE FROM A PLATFORM EXPERT
2
Letting your publisher create your content is brilliant for getting
engagement. It’s not always so good for getting your brand message across. Sticking a logo and some banner ads next to something with only a peripheral connection to your brand has nothing to do with being ‘native’. Being editorially consistent with the platform is great - but don’t forget to tell your story too.
BE TRUE TO YOUR BRAND
3
Not all ‘impressions’ and ‘views’ are equal, and these numbers tell you
much more about the quality of your distribution than the impact your content has had. When you create native content, engagement is what you’re paying for. Start measuring completion rate, time on site, scroll percentage (for long format copy) and brand uplift to understand the real impact. Each project should have a bespoke measurement framework, taking into account the role of each asset.
MEASURE REAL ENGAGEMENT
0THE AMOUNT OF MONEY THAT BUZZFEED MAKES FROM DISPLAY ADS – ALL THEIR REVENUE COMES FROM NATIVE CONTENT.
23STORIES: THE NAME OF CONDE NAST’S NEW NATIVE CONTENT AGENCY. NAMED FOR THE 23 STOREYS OF 1 WORLD TRADE CENTRE THAT THE MAGAZINE EMPIRE’S JOURNALISTS OCCUPY - CONTENT-CREATION TALENT THAT BRANDS CAN NOW DRAW UPON.
US$1.4BILLION: THE TOTAL VALUE OF NON-NATIVE DISPLAY ADS THAT IPHONE USERS ARE EXPECTED TO BLOCK WITH THE LAUNCH OF ADBLOCKER ON THEIR PHONESURTHER INCREASING THE VALUE OF UNBLOCKABLE NATIVE CONTENT.
US$7.9BILLION: THE AMOUNT OF MONEY THAT WILL BE SPENT ON NATIVE MEDIA THIS YEAR
US$21BILLION: THE AMOUNT OF MONEY THAT WILL BE SPENT ON NATIVE MEDIA IN 2018.
NATIVE CONTENT IN NUMBERS
SOURCE: CAMPAIGN LIVE, BUSINESS INSIDER
AS AD DOLLARS MOVING FROM TV TO DIGITAL
MEET THE ADBLOCKING JUGGERNAUT COMING
THE OTHER WAY, IT’S BECOMING CLEAR THAT
NATIVE CONTENT IS THE FUTURE

2322
DIGITAL CHANNELS | PROGRAMMATIC DIGITAL CHANNELS | PROGRAMMATIC
THE PROGRAMMATIC FUTURE
The staggering growth of programmatic advertising over the past year has made it a central component of the media
ecosystem – so much so that Zenith predicts 60% of all display ads will be programmatic in 2016.
Programmatic has long been considered a powerful and efficient communications vehicle for Publicis Groupe, and the organization has worked hard to develop best-in-class offerings for its clients. For example, our programmatic media buying practice, Audience On Demand® (AOD), was the first of its kind in the industry.
Last year we embarked on another first, by dismantling the ‘trading desk’ model and integrating programmatic planning and buying into the core media agencies, bringing them closer to our clients. The result is that all agency staff will have as much knowledge of programmatic as other disciplines and media. It has also equipped us like never before to marry online and offline intelligence, and optimise consumer engagement across all touchpoints.
The programmatic marketplace is dynamic and needs constant reassessment, but four areas of focus will define 2016 for programmatic marketers.
• The answer to improved ROI is harnessing the potential of advanced targeting and tracking.
• Advanced targeting can help deliver relevant brand experiences at each stage of the consumer journey.
• This means that the right data has to be collected, tracked and shared.
MARKETING IMPERATIVES
THE WORLD GOES PROGRAMMATIC
So what’s next for programmatic advertising? TV, radio and digital out-of-home are all experimenting with the
capabilities offered by programmatic advertising. Time Inc. has announced a platform to allow advertisers to purchase print ads programmatically via a DSP based on audience data. Strategy Analytics predicts – perhaps ambitiously – that 20% of US linear TV will be traded programmatically by 2018.
The Internet of Things is the next frontier. Our connected devices will generate multiple streams of data about each of us, and technology will combine this data into a seamless whole. Every communication will be personal, instead of on the basis of something as general as watching the Super Bowl. We are moving to a world of very sophisticated CRM, facilitated through technology and apps rather than address databases, traded programmatically.
MEDIA CPM MEASURABLE CPM VIEWABLE CPM
USA 3.29 6.06 12.12
FRANCE 1.82 2.73 5.91
UK 2.49 3.12 6.31
SE-ASIA 0.49 0.75 1.58
GERMANY 3.52 4.64 10.03
OVERALL 3.32 6.06 12.12
Advertisers are rightly concerned that the ads they buy online should actually be seen by the consumers they are served to. We
can use Active View data from Google’s DoubleClick Bid Manager to track whether ads are first measurable, and second viewable. Ads are measurable if they interact properly with the Active View system at the time they are served; they are viewable if at least 50% of their area is displayed on screen for at least one second (or two seconds for video ads). Around 50% of measurable ads are in fact viewable (though the proportion varies from market to market, ranging from 45% in France and Germany to 50% in the UK and the US). This means that the true cost of a viewable ad is twice the cost of serving a measurable ad, and three to four times the cost of buying an ad without tracking measurability or viewability.
THE TRUE COST OF VIEWABLE ADS
SOURCE: ACTIVE VIEW IN DBM
CPM BY VIEWABILITY (US$)
Programmatic is about all media, of all ranges of quality – the days when it was just about remnant inventory are long past.
Major publishers and broadcasters have publicly committed to automated trading. CNN, Reuters, FT, The Economist and The Guardian have created a consortium (Pangea) to leverage their audience data through a central programmatic exchange. Other consortia include La Place Media in France, SouthernX in Africa and Apex in Australia. AOL in the US has changed its strategy from content to ad technology: its ONE platform allows advertisers to optimise their ad campaigns across channels including video, display, and television.
PROGRAMMATIC IS PREMIUM
Over 30% of all video was traded programmatically in 2015. Recent acquisitions by large publishers (BrightRoll by
Yahoo, LiveRail by Facebook and Adapt.tv by AOL) demonstrates serious investment in video. These publishers are not looking to expand their share of existing digital display budgets, but are rather making a play for TV budgets that are shifting to digital. There is also potential to roll these platforms into existing trading deals, empowering us to properly re-shape the planning and execution of video budgets across the whole supply chain.
RISE OF THE VIDEO STAR
New technology and data management platforms (DMPs) allow advertisers to control their audiences at the centre
and decide to execute either globally or at the local level, and to make the most of their disparate data sets and generate much richer analytics and insights. The challenge is to link DMPs to advertisers’ CRM platforms, which require internal stakeholders to buy in to the process and provide access to data.
HARNESSING THE POTENTIAL OF DATA
23

2524
16%IN 2016
11%IN 2017
10%IN 2018
25
DIGITAL CHANNELS | SEARCH DIGITAL CHANNELS | SEARCH
THE EVOLUTION OF SEARCH
Zenith expects global paid search spend to enjoy double-digit growth for the next three years. This consistent growth will
be fueled by (1) user expectation for relevant mobile and local content, (2) automation and scale of advanced search capabilities (like remarketing) and (3) the emergence of nascent paid search formats and applications, like Amazon paid search.
ANNUAL DOUBLE-DIGIT GROW TH FOR PA ID SE ARCH
0.00
0.20
0.40
0.60
COST (US$)
GROWTH (%)
Q2 2014 Q3 2014 Q4 2014 Q1 2015 Q2 2015
1.9
2.0
2.1
2.2
2.3
2.4
lobal search CPCs fell 5% year-on-year in Q2 2015. This slight decrease is driven by mobile, which has historically enjoyed
lower CPCs than desktop. As advertisers dedicate more paid search budget to mobile, overall (mobile + desktop) CPCs have fallen.
SE ARCH CPCS (COSTS -PER-CLICK ) REMAIN STABLE
G
2.2%
CPC CTR
SOURCES WHERE US DIGITAL BUYERS BEGIN THEIR ONLINE SHOPPING JOURNEY
64MARKETPLACES
48FAVOURITE MERCHANTS
40%SEARCH
29SOCIAL MEDIA
July 2015% of respondents
NOTE: FOR PRODUCTS THEY PLAN TO PURCHASE VIA DESKTOP / LAPTOPSOURCE: PYMNTS.COM AND AMAZON PAYMENTS, INNOVATION AND THE DIGITAL SHOPPER, AUG 6, 2015
Per an agreement between Twitter and Google, tweets are now appearing in Google search globally, on desktop and mobile. Earned
Twitter content—opinions, reviews, social chatter—is front-and-centre amongst paid and owned content on Google. And social plays the most important role in discovery, learning, trying, buying, using and advocating. Whatever happens on Twitter is now magnified in search. Future search strategy should include Twitter content management.
T WEETS MAGNIFIED IN GOOGLE SE ARCH
$0.61
Close to two-thirds of shoppers now start their digital shopping journeys on marketplaces like Amazon or eBay (eMarketer, 2015
(U.S.)). In comparison, only 40% start on traditional search engines. As marketplaces continue to play an increasingly influential role in the shopping journey, advertisers are dedicating more budget and effort to emerging marketplace paid search formats.
SE ARCHERS TURN TO MARKETPL ACES• Search is bigger than Google: marketplaces and merchants are as important to your search strategy.
• Now that mobile takes the majority of searches, the way people search has changed. This, combined with new search technology, opens the door to new types of search campaign involving location, automation and retargeting.
• The landing page has to reflect these changes. Search is only the start of a journey. Content is what converts.
MARKETING IMPERATIVES

2726
IN FOCUS: AUTOMOTIVE
SOURCE: TOUCHPOINTS ROI TRACKER GLOBAL NORMS, 2011-2016
In the automotive category, the most influential touchpoints – those that influence purchase decision the most each time a
consumer is exposed to them – are owned by the advertiser: the test drive and after-sales service. Coming close behind these are friends and family recommendations and expert recommendations. And simply seeing a car brand on the road has a high influence on brand choice.
Paid touchpoints, like TV and magazine ads, have lower influence per exposure, but are typically able to reach more consumers, more quickly, and at a lower cost than ‘owned’ and ‘earned’ touchpoints.
The most important online touchpoints for automotive brands are comparison websites, brand websites and consumer opinion sites.
HOW TOUCHPOINTS INFLUENCE PURCHASE DECISIONS
INTERNET SEARCH
PRINT ARTICLES
RETAILER WEBSITES
SPECIALIST MAGAZINE ADS
DISPLAY IN PUBLIC AREA
TV ADS
RELEVANT WEBSITES
CONS OPINION SITE / BLOGS
INSTORE FLYERS / CATALOGUE
BROCHURE / TRADE FAIRS
SEMINARS / TRADE FAIRS
INDEPENDENT REVIEW
SEEING OTHERS WITH BRAND
BRAND WEBSITE
DEALERSHIP
EXPERT RECO
COMPARISON WEBSITES
FRIENDS / FAMILY RECO
AFTER SALES SERVICE
TEST DRIVE
71
72
72
73
74
75
75
77
77
79
81
83
83
84
84
84
84
85
86
87
PAID
EA
RN
ED
OW
NE
D
TOUCHPOINTS THAT HAVE THE MOST INFLUENCE ON AUTO PURCHASE DECISIONSTOTAL 66
PAID 59
OWNED 71
EARNED 75
SPOR
TS
/
MASS MEDIA
POS
ADV
IC
E/RECOONE-TO-ONE
EVENTS
EARNED
PAID
OW
NED
10.6%
12.9%26.9%
8.7%
40.8%
40.7%
28.2%
31.1%
28.9%
71.1%
OFFLINE
ONLIN
E
CATEGORY INSIGHTS CATEGORY INSIGHTS
27
29%ONLINE TOUCHPOINTS
ACCOUNT FOR
OF TOTAL BRAND EXPERIENCE IN AUTOMOTIVE
28%OWNED TOUCHPOINTS
ACCOUNT FOR
OF TOTAL BRAND EXPERIENCEIN AUTOMOTIVE
9%POINT OF SALE
TOUCHPOINTS ACCOUNT FOR
OF TOTAL BRAND EXPERIENCE IN AUTOMOTIVE
Based on consumer research, Touchpoints ROI Tracker is Publicis Media’s brand contact measurement and planning tool. Since 2004 a total of 944 Touchpoints projects have been completed across 62 countries, comprising 854,968 consumer interviews that provide contact point metrics for 12,544 brands in 303 product and service categories. The data from all projects are stored in a single internet-accessible database. This database provides normative and trend data for over 180 touchpoints.
Automotive advertisers will spend about US$45bn on advertising across the world in 2016, and sell about
90 million vehicles. They are among the most prominent advertisers, including three of the six largest advertisers in the world, according to Advertising Age’s latest survey of global marketers.
Over the last few years the number of ways that advertisers can communicate with potential customers has exploded, thanks to the revolution in digital and mobile technology. It is vital to understand which of these ‘touchpoints’ are most likely to reach potential consumers, and which are most likely to influence buying decisions. This is what Publicis Media’s Touchpoints ROI Tracker tool tells us.
The charts opposite show the Brand Experience scores that Touchpoints assigns to different types of contact for the automotive category, based on two factors: the likelihood that consumers will associate brands in that category with that touchpoint, and how effective that touchpoint is at influencing consumers’ buying decisions in the category.
We’ve divided the touchpoints into three different types: the place and method of communication; whether the medium is paid (e.g. advertising), owned (e.g. brand websites, packaging) or earned (e.g. consumer advocacy on social media); and whether it is offline or online.
The automotive category is dominated by mass media, which accounts for 41% of brand experience. Point-of-sale touchpoints are least important, accounting for just 9%. 41% of experience also comes from paid media, while earned (31%) and owned (28%) lag behind. Offline media provide 2.5 times more brand experience than online media.
TouchpointsROI Tracker
SOURCE: TOUCHPOINTS ROI TRACKER GLOBAL NORMS, 2011-2015
• Owned touchpoints are some of the most effective for automotive brands, but account for less of the consumer’s experience with the automotive category than paid and earned touchpoints.
• Brands have the opportunity to unlock a competitive advantage over their rivals by prioritising their owned touchpoints.
• Brands shouldn’t concentrate solely on communicating with potential buyers: the opinions of other people that they trust about automotive brands are highly influential in their ultimate purchasing decision.
MARKETING IMPERATIVES
2928
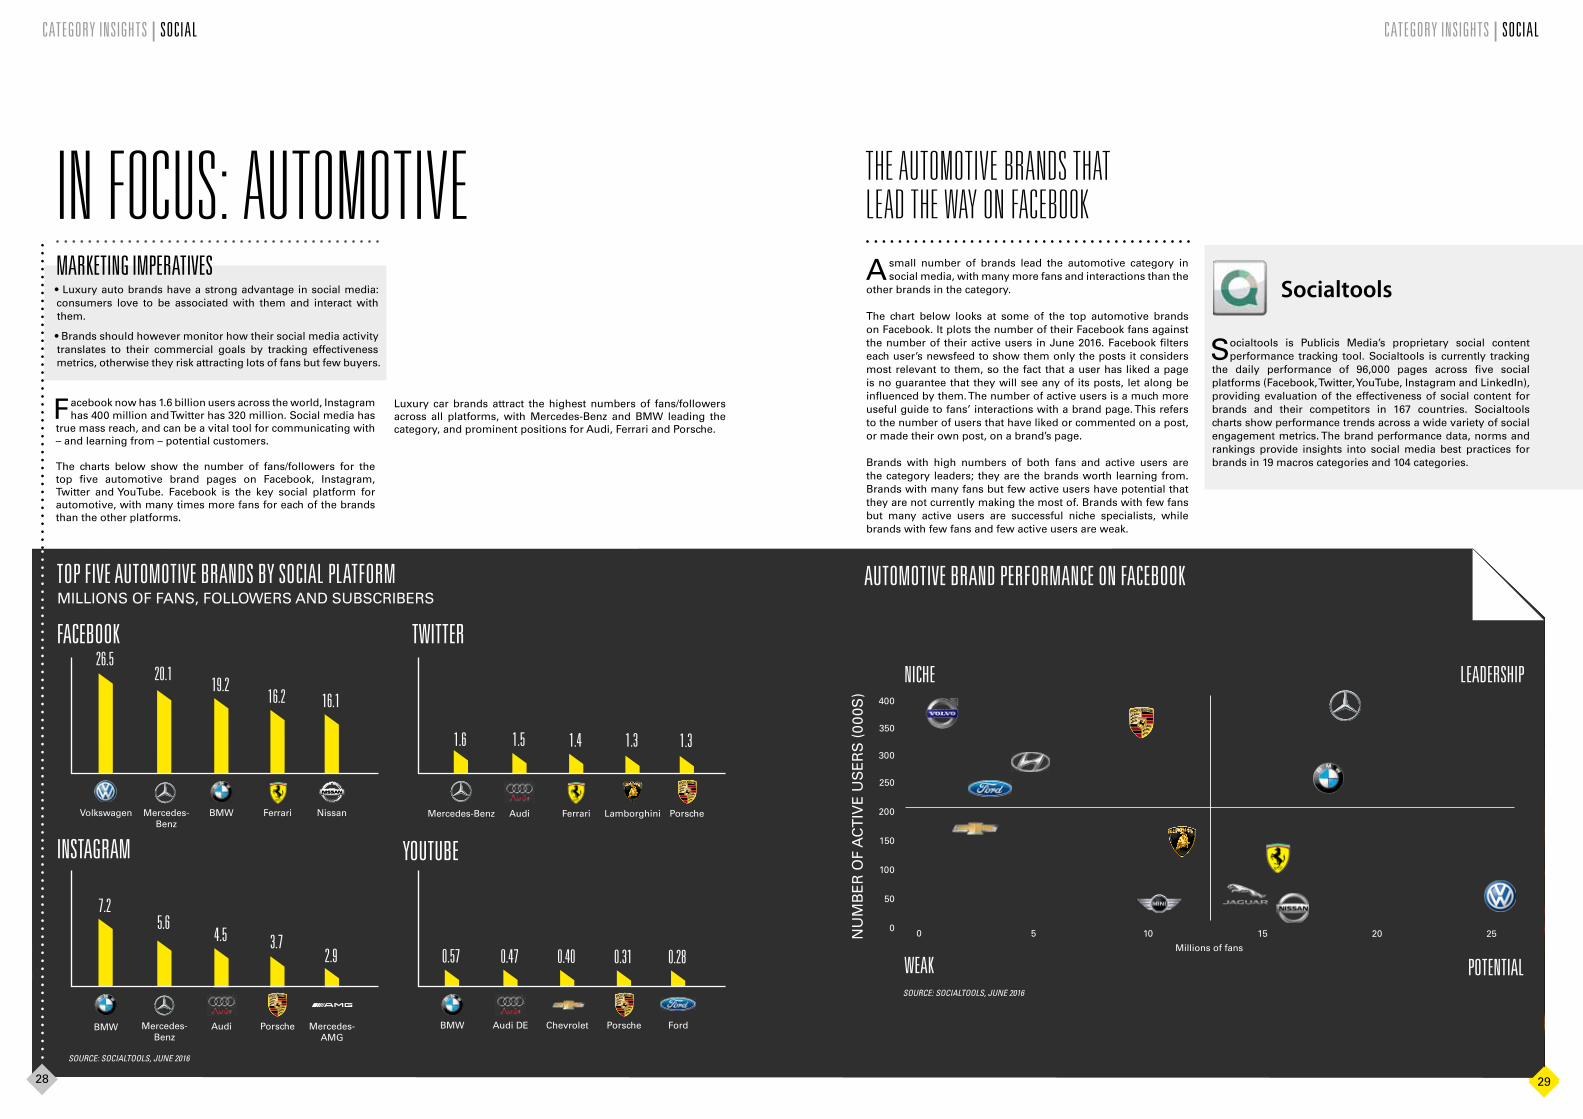
THE AUTOMOTIVE BRANDS THAT LE AD THE WAY ON FACEBOOK
Asmall number of brands lead the automotive category in social media, with many more fans and interactions than the
other brands in the category.
The chart below looks at some of the top automotive brands on Facebook. It plots the number of their Facebook fans against the number of their active users in June 2016. Facebook filters each user’s newsfeed to show them only the posts it considers most relevant to them, so the fact that a user has liked a page is no guarantee that they will see any of its posts, let along be influenced by them. The number of active users is a much more useful guide to fans’ interactions with a brand page. This refers to the number of users that have liked or commented on a post, or made their own post, on a brand’s page.
Brands with high numbers of both fans and active users are the category leaders; they are the brands worth learning from. Brands with many fans but few active users have potential that they are not currently making the most of. Brands with few fans but many active users are successful niche specialists, while brands with few fans and few active users are weak.
S ocialtools is Publicis Media’s proprietary social content performance tracking tool. Socialtools is currently tracking
the daily performance of 96,000 pages across five social platforms (Facebook, Twitter, YouTube, Instagram and LinkedIn), providing evaluation of the effectiveness of social content for brands and their competitors in 167 countries. Socialtools charts show performance trends across a wide variety of social engagement metrics. The brand performance data, norms and rankings provide insights into social media best practices for brands in 19 macros categories and 104 categories.
Socialtools
Facebook now has 1.6 billion users across the world, Instagram has 400 million and Twitter has 320 million. Social media has
true mass reach, and can be a vital tool for communicating with – and learning from – potential customers.
The charts below show the number of fans/followers for the top five automotive brand pages on Facebook, Instagram, Twitter and YouTube. Facebook is the key social platform for automotive, with many times more fans for each of the brands than the other platforms.
IN FOCUS: AUTOMOTIVE
Mercedes-Benz
20.1
BMW
19.2
Volkswagen
26.5
Ferrari
16.2
Nissan
16.1
BMW
7.2
Mercedes-Benz
5.6
Mercedes-AMG
2.9
Audi
4.5
Porsche
3.7
Ferrari
1.4
Mercedes-Benz
1.6
Lamborghini
1.3
Audi
1.5
Porsche
1.3
YOUTUBE
Chevrolet
0.40
BMW
0.57
Audi DE
0.47
Porsche
0.31
Ford
0.28
CATEGORY INSIGHTS | SOCIAL CATEGORY INSIGHTS | SOCIAL
AUTOMOTIVE BRAND PERFORMANCE ON FACEBOOKTOP FIVE AUTOMOTIVE BRANDS BY SOCIAL PLATFORM
2928
MILLIONS OF FANS, FOLLOWERS AND SUBSCRIBERS
SOURCE: SOCIALTOOLS, JUNE 2016
• Luxury auto brands have a strong advantage in social media: consumers love to be associated with them and interact with them.
• Brands should however monitor how their social media activity translates to their commercial goals by tracking effectiveness metrics, otherwise they risk attracting lots of fans but few buyers.
MARKETING IMPERATIVES
Luxury car brands attract the highest numbers of fans/followers across all platforms, with Mercedes-Benz and BMW leading the category, and prominent positions for Audi, Ferrari and Porsche.
NICHE
WEAK
LEADERSHIP
POTENTIALSOURCE: SOCIALTOOLS, JUNE 2016
NU
MB
ER
OF
AC
TIV
E U
SE
RS
(00
0S)
0
50
100
150
200
250
300
350
400
0 5 10 15 20 25
Millions of fans

3130
ABOUT ZENITHZenith is The ROI Agency. The first agency to apply a rigorous and objective approach to improving the effectiveness of marketing spend, Zenith transforms businesses and brands through evidence-led thinking. Zenith is part of Publicis Media, one of four solution hubs within Publicis Groupe [Euronext Paris FR0000130577, CAC40], and has offices within Publicis One. As a leading global media services network, Zenith has over 5,000 people working across 95 markets. Supported by Publicis Media’s Global Practices, Zenith offers its clients a full range of integrated skills across communications planning, value optimisation, performance media, content creation and data & analytics. We work with some of the world’s leading global brands including Aviva, Coty, Kering, Lactalis, L’Oréal, LVMH, Nestlé, Nomad Foods, Oracle, RB, SCA, Sanofi, Toyota and 21st Century Fox.
RECENT REPORTS AND FORECASTSFROM ZENITHZenith regularly publishes reports and forecasts about
advertising and media around the world. Here’s a selection of reports published in recent months. If you’re interested in any of these, or would like to discuss Zenith’s full range of reports, please email [email protected].
The advertising forecasts at the beginning of this magazine are taken from the September 2016 edition of our Advertising Expenditure Forecasts report. This report has been published continually since 1987, and is issued every three months. It examines trends in advertising expenditure by medium in 81 markets across the world, with forecast to 2018, providing insight into how advertising markets are adapting to new technology and new business practices, and how local developments shape budgeting decisions.
This is the second edition of this report, and was published in June 2016. The report surveys changing patterns of media consumption, and assesses how the amount of time people allocate to different media will change between 2016 and 2018. The report looks at the amount of time spent reading newspapers and magazines, watching television, listening to the radio, visiting the cinema, using the internet, and viewing outdoor advertising while out of the home. This edition covers 71 countries across the world, up from 65 last year.
The second edition of this report was published in July 2016. It examines online video expenditure and consumption in 58 countries around the world from 2012 to 2015, with forecasts to 2018. It discusses the main players in each market, explores the different formats of online video advertising and the extent to which they are used to complement or supplant traditional linear TV. We also take a look at what type of content is being viewed, and how it is being viewed, and how advertisers are making use of owned content.
This new report, published in February 2016, looks at a selection of 30 up-and-coming markets for the first time, comparing the growth of advertising expenditure with the wider economy. These advertising markets are developing quickly and are starting to rival the scale of some of the established 81 markets we cover in our regular Advertising Expenditure Forecasts. They vary widely in population, openness to international business, economic activities, productivity, and geography. What they share is that their economies are growing rapidly in the long run, and that their advertising markets are growing even faster.
ADVERTISING EXPENDITURE FORECASTS SEPTEMBER 2016
MEDIA CONSUMPTION FORECASTS 2016
ONLINE VIDEO FORECASTS 2016THIRTY RISING MEDIA MARKETS 2016

32