Global Integration, Economic Development and the...
30
Global Integration, Economic Development and the World Bank Group Trade Strategy Bernard Hoekman, Director, International Trade Department, World Bank Caribbean Growth Forum, Kingston, Jamaica, June 19, 2011
Transcript of Global Integration, Economic Development and the...
Global Integration, Economic Developmentand the World Bank Group Trade Strategy
Bernard Hoekman, Director, International Trade Department, World Bank Caribbean Growth Forum, Kingston, Jamaica, June 19, 2011

The Trade Agenda has Changed2
Globalization has led to deep inter-linkages among countries and increased vulnerability to shocks
Developing countries are new drivers of global trade (“multi-polarity”)—BRIICS
Tariffs often no longer a binding constraint to trade Trade increasingly involves global value chains and intra-
firm transactions → FDI-trade-labor market/skills linkages Higher demand for natural resources/commodities and
potential for services trade offer new opportunities to developing countries – but also challenges

Trade/GDP and South-South trade3
20%
40%
60%
1985 1988 1991 1994 1997 2000 2003 2006
Low and middle-income countries
All countries
Total trade as a percentage share of GDP
0%
5%
10%
15%
20%
25%
30%
35%
40%
1990 1993 1996 1999 2002 2005 2008
Imports from the South as % of total world imports
South-South imports as % of total South imports
Percentage share as indicated

Trend decoupling—starting in early 90s
-4
-2
0
2
4
6
8
10
1965
1967
1969
1971
1973
1975
1977
1979
1981
1983
1985
1987
1989
1991
1993
1995
1997
1999
2001
2003
2005
2007
2009
2011
High IncomeHigh Income TrendDeveloping CountriesDeveloping Countries Trend
World Growth 1965 - 2011
• Sustained high growth levels associated with expanding trade• World trade has grown twice as fast as global GDP
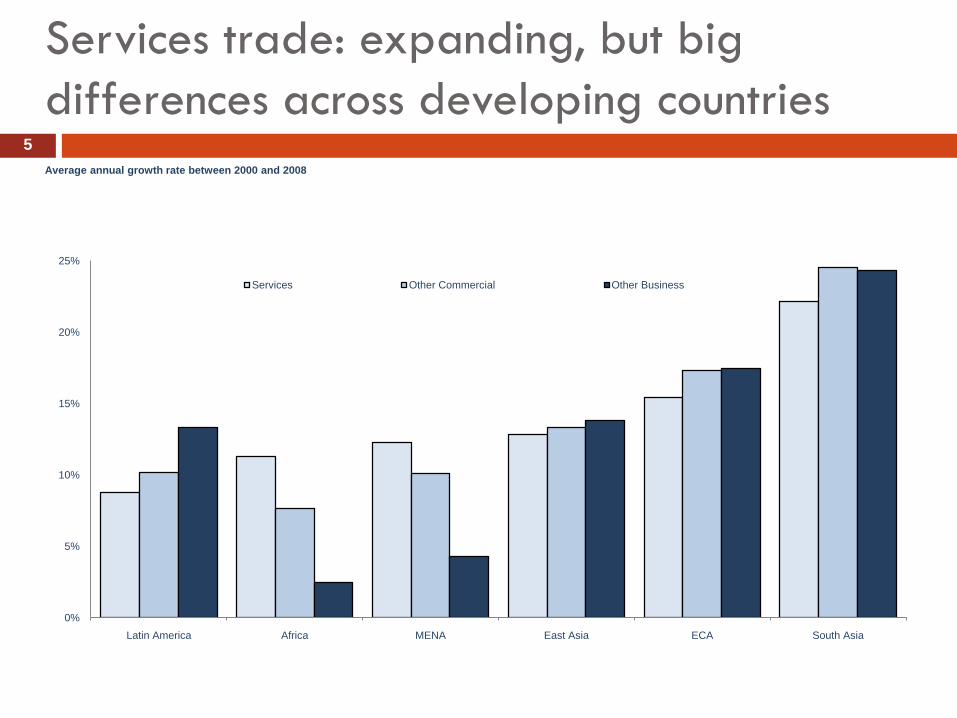
Services trade: expanding, but big differences across developing countries
5
0%
5%
10%
15%
20%
25%
Latin America Africa MENA East Asia ECA South Asia
Services Other Commercial Other Business
Average annual growth rate between 2000 and 2008

Services matter for Caribbean countriess
6
Source: World Development Indicators
0
10
20
30
40
50
60
70
80
LIC SXs/GDP
MIC SXs/GDP
Middle Income Countries Services/GDP
Low Income Countries Services/GDP
Caribbean Countries Service Exports/GDP
Caribbean Countries Services/GDP

Trade Openness: Volatility & Risk of Shocks7
20%
30%
40%
50%
60%
70%
80%
1990 1992 1994 1996 1998 2000 2002 2004 2006 2008 2010
BRICs
Developing countries
High Income
Lower Income
Lower Middle Income
Upper Middle Inc.
Trade / GDP ratio
Source: World Bank

Commodity price increases and volatility

Drivers: Trade Liberalization9
010
2030
4050
Tarif
fs(%
)
0 2000 4000 6000 8000GDP per capita(US dollars)
1980s 1990s2000s
MFN Applied Tariff Rates versus GDP per Capita
Source: Mattoo and Neagu, 2011

0
50
100
150
200
250
300
350
400
1980 85 90 95 2000 05
Working-age populationTotal labor forceExport-weighted labor force¹
0
200
400
600
800
1000
1980 85 90 95 2000 05
Advanced economies
East Asia
South Asia
Central and EasternEurope and CISOther developingcountries
Integration of China/East/South Asia: Quadrupling of effective global labor supply(index, 1980 = 100)
Global Labor supply
1National labor forces scaled by export-to-GDP ratios.
Export-Weighted Labor Force by Region1
10

Drivers: Technology (FDI, ICT, global supply chains)12
Imports of parts etc. as a share of exports: 33% for developing countries
Source: Canuto, Dutz, and Reis (2010)
Big differences:
Argentina and Brazil: 15%
China and Mexico: > 30%

FDI: Rise of emerging-market multinationals
Total cross-border M&A deals by firms from advanced and emerging economies, 1997–2010

Increase in South-South FDI flows
Cross-border M&A investment to low income countries, 1997–2010

Changing political economy and policies
Growing export sectors push to reduce input costs Greater focus on efficiency of producer services Interest in minimizing tariffs on intermediates Supply chains: restricting trade = raising costs throughout the chain
Trade and FDI are increasingly complementary Source of technology and know-how; connect to supply chains Focus on “behind-the-border” issues: investment; IPRs
Rise of China and other large emerging economies “Threat effect” but also source of demand and capital
Move to North-South, East-West, South-South PTAs E.g., Mexico: 59 PTAs; Chile: 43.

Trade policy since 2008

Rising importance of non-tariff measures
Have recently been seeing a rise in the use of NTMs but number of new measures during 2009-2011 stable; little year-to-year variation
Do not have information on average number of new NTMs in the pre-2008 period
Generally NTMs are applied to all trade, not bilaterally
18

Implication: A More Complex Trade Agenda20
Competition is fiercer—more opportunities but also faster displacement of firms/farms/workers
Many countries still highly dependent on relatively few exports and markets: diversification critical to sustain higher growth
Productivity growth critical to avoid “middle income trap” Constraints to trade-driven productivity growth lie “behind-
the-border” – skills; logistics, (trade) finance, services inputs Infrastructure Policies—especially for services, public and private
Need to manage shocks—and limit volatility

World Bank Group Trade Strategy: Four Priority Areas of Focus
21
TRA
DE
CO
MPE
TITI
VEN
SS &
DIV
ERSI
FIC
ATI
ON • Trade policy
- traditional policies - firm competitiveness
• Trade in services - digitized - movement of suppliers
• Address market failures- SEZs - Enabling domestic policy
TRA
DE
FAC
ILIT
ATI
ON
, LO
GIS
TIC
S &
TR
AD
E FI
NA
NC
E •Transit corridors; regional trade facilitation
•Logisticsservices
•Customs & border management
•Trade Finance - IFC: Short-term products (GTFP, GTLP) - MIGA: longer term insurance M
AR
KET
AC
CES
S &
TR
AD
E C
OO
PER
ATI
ON • Pro-development
institutional environment - Analysis for advocacy (WTO; agricultural policy; climate change)
•Regional integration of markets (South-South cooperation)
•Regulatory reform & cooperation-NTMs, services
MA
NA
GIN
G S
HO
CK
S &
PRO
MO
TIN
G IN
CLU
SIO
N • Labor markets
• Safety nets
• Skills
• Gender
• Lagging regions
• Food prices

Trade Competitiveness and Diversification
24

• In-depth analysis of trade data – aggregate and firm-level –generates hypotheses about obstacles to export performance
• Allows for – premised on – comparisons to other countries
• Firm-level data allows to directly connect to detailed transactions customs data
• Combined with qualitative information can help to reject or to identify constraints
• Exporters have to be productive—link to broader competitiveness agenda
How to link constraints to exports?
25
Trade Competitiveness Diagnostic

Link outcomes to factors that affect firms capacities and productivity
TRADE OUTCOMES ANALYSIS
Growth and share (Intensive margin)
Diversification (Extensive margin)
Quality & sophistication (Quality margin)
Entry & survival (Sustainability margin)
Channels
Entry costs Factor and transaction cost Technology and efficiency
COMPETITIVENESS DIAGNOSTICS
Market accessSupply side factors
Incentive framework
Factor conditions
Trade/investment promotion
infrastructure
SEZsBackbone/business services

Services export competitiveness
Assist policy makers to improve their understanding of the size, scope and potential of services exports as well as prevailing obstacles
Address the following questions: Assess role of services as inputs in the traded sector Determinants of services trade performance Relative importance of determinants across services Impact of policies as constraint and potential drivers
32

Regulatory assessments in services
33
• Mapping regulations• Horizontal regulations affecting a wide range of sectors• Specific regulations affecting a sector, subsector, or an activity• Assessing regulation-making process: transparency, necessity, and
non-discrimination• Assessing institutional arrangements in light of international best
practices
Step 1
• Assessing the impact of regulations in market structure, prices, quality, and access through econometrics tools
Step 2
• Assessing alternative regulations• Proposing new institutional arrangements, if any• Assessing feasibility of alternatives regulations and institutional
arrangements
Step 3

Services Knowledge Platforms
Mechanism to bring stakeholders together: To generate information on options for regulatory
reforms to integrate services markets; Learn from experiences elsewhere; and Focal point for effective implementation/monitoring
Demand-driven and action oriented Ongoing pilots and activities in Europe (CEFTA) and
East and Southern Africa (EAC; COMESA)

Trade Facilitation/Logistics & Finance(and trade-related infrastructure)
35

Logistics is a driver of competitiveness
Sources: World Bank, Guasch (2008)
0
5
10
15
20
25
30
Merchandise losses:Share of primary goods that do not arrive at market
Logistics costs as share of market
value
Levels of Inventory
Prod
uctiv
ity lo
sses
(%) OECD LAC
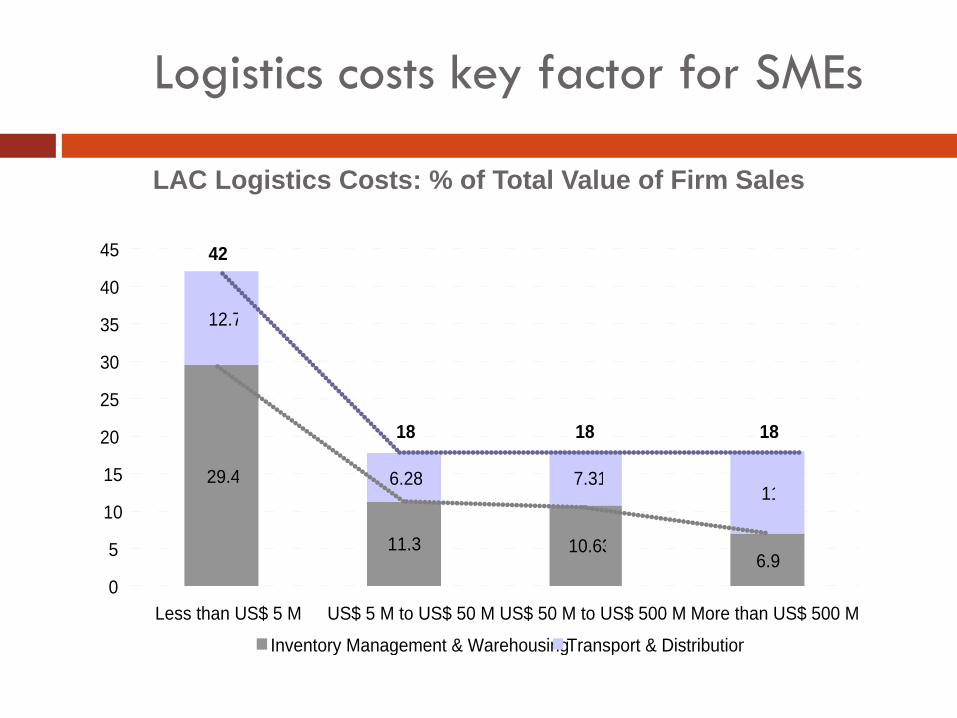
Logistics costs key factor for SMEs
29.4
11.36 10.636.9
12.7
6.28 7.3111
0
5
10
15
20
25
30
35
40
45
Less than US$ 5 M US$ 5 M to US$ 50 M US$ 50 M to US$ 500 M More than US$ 500 M
Inventory Management & WarehousingTransport & Distribution
42
18 18 18
LAC Logistics Costs: % of Total Value of Firm Sales
Fuente: Centro Logístico de Latinoamérica, Bogot, Colombia. Benchmarking 2007: Estado de la Logística en America Latina Anexo, María Rey Logistics Summit 2008

Country LPI Rank
South Africa 23China 26Turkey 27Malaysia 29Bulgaria 36Thailand 38Chile 39Tunisia 41Brazil 45Mexico 47
TOP 10 COUNTRIES
LOWER MIDDLE INCOME
Country LPI Rank
India 46Morocco 50
Philippines 52Vietnam 53
Egypt, Arab Rep. 57Indonesia 59
Yemen, Rep. 63Ukraine 66Pakistan 71
Guatemala 74
TOP 10 COUNTRIES
LOW INCOME
Country LPI Rank
Benin 67Malawi 73
Madagascar 84Niger 87
Tanzania 88Guinea-Bissau 94
Togo 97Central African Republic 98
Cambodia 101Zimbabwe 103
TOP 10 COUNTRIES
UPPER MIDDLE INCOME
Logistics Performance Index, 2012
Bahamas 80Dominican Rep. 85Jamaica 124
Haiti: 153

Improve connectivity
In part an infrastructure agenda Major factor underpinning improvement in LPI indicators
over time
But policies are critical as well … Border management Transport services competition
…. as is cooperation and coordination, especially landlocked and small island states and regions Regional ports and hubs Transshipment and regular feeder services

http://www.worldbank.org/trade
Thank you