Global Imbalances and External Adjustment after the · PDF file ·...
45
WP/14/151 Global Imbalances and External Adjustment after the Crisis Phillip R. Lane and Gian Maria Milesi-Ferretti
Transcript of Global Imbalances and External Adjustment after the · PDF file ·...
WP/14/151
Global Imbalances and External Adjustment after the Crisis
Phillip R. Lane and Gian Maria Milesi-Ferretti
© 2014 International Monetary Fund WP/14/151
IMF Working Paper
Research Department
Global Imbalances and External Adjustment after the Crisis
Prepared by Phillip R. Lane and Gian Maria Milesi-Ferretti1
August 2014
Abstract
This paper has two objectives. First, it reviews the recent dynamics of global imbalances (both “flow” and “stock” imbalances), with a special focus on the shifting position of Latin America in the global distribution. Second, it examines the cross-country variation in external adjustment over 2008-2012. In particular, it shows how pre-crisis external imbalances have strong predictive power for post-crisis macroeconomic outcomes, allowing for variation across different exchange rate regimes. We emphasize that the bulk of external adjustment has taken the form of “expenditure reduction”, with “expenditure switching” only playing a limited role.
JEL Classification Numbers:F31, F32
Keywords: Global crisis, Current account adjustment
Author’s E-Mail Address: [email protected]; [email protected]
1 Prepared for Central Bank of Chile’s 2013 Annual Research Conference. We thank our discussant Norman Loayza and conference participants for helpful comments, as well as João Nogueira Martins and participants at seminars at the European Commission, George Washington University, the International Monetary Fund, the Monetary Authority of Singapore and the Irish Economic Association Annual Meeting. We thank Rogelio Mercado and Clemens Struck for excellent research assistance. Lane also thanks the Institute for New Economic Thinking for research support.
This Working Paper should not be reported as representing the views of the IMF. The views expressed in this Working Paper are those of the author(s) and do not necessarily represent those of the IMF or IMF policy. Working Papers describe research in progress by the author(s) and are published to elicit comments and to further debate.
2
Contents Page
I. Introduction ............................................................................................................................... 4
II. Global Imbalances after the Crisis ........................................................................................... 5 A. Global trends ............................................................................................................... 5 B. Latin America .............................................................................................................. 7
III. Pre-Crisis Imbalances And External Adjustment ................................................................... 8
IV. External Adjustment Channels ............................................................................................. 14
V. Conclusions ........................................................................................................................... 18 Appendix
A. Country samples for global imbalances .................................................................... 22 B. Country sample for current account regressions ....................................................... 22 C. Exchange Rate Regimes ............................................................................................ 22
References .........................................................................................................................................20 Tables 1. Net external position (ratio of domestic GDP) ..............................................................................23 2. Output gap in surplus and deficit countries ................................................................................24 3. Current Account Adjustment between 2005-2008 and 2012 ........................................................25 4. Real Exchange Rate between 2005-2008 and 2012 ...................................................................... 26 5. Change in Demand and Output between 2007-2008 and 2012 .....................................................27 6. Policy Rates for 2005-2008 vs. 2009-2012 ................................................................................... 28 7. Inflation Adjustment...................................................................................................................... 29 8. Fiscal Adjustment .......................................................................................................................... 30 9. Net International Investment Position: Stock-Flow Adjustment 2008-2012 ................................31 10. Trade Adjustment ........................................................................................................................32 Figures 1. Global imbalances ......................................................................................................................... 33 2. Global dispersion of current account balances ..............................................................................33 3. Net foreign asset positions ............................................................................................................34 4. Dispersion of net foreign asset positions .......................................................................................34 5. Global imbalances: projections .....................................................................................................35 6. Current account balances in Latin America ..................................................................................36 7. Latin America and Caribbean: Net Foreign Assets and their Composition ..................................36 8. Net Foreign Asset Position, Central America and the Caribbean .................................................37 9. Latin America and Caribbean: actual and projected net foreign asset position ............................ 38 10. Current Account Adjustment and Current Account Gap ............................................................ 39 11a. Real Exchange Rate and Current Account Balance Changes: No Peg ...................................... 40 11b. Real Exchange Rate and Current Account Balance Changes: Peg ........................................... 40 12a. Change in Real Domestic Demand and Change in Current Account Balance .......................... 41 12b. Change in Real GDP and Change in Current Account Balance ................................................ 41 13. Policy Rate Adjustment and the Current Account Gap ............................................................... 42
3
14. Inflation Adjustment and the Current Account Gap .................................................................... 42 15. Fiscal Adjustment and the Current Account Gap ........................................................................ 43 16. Stock-Flow Adjustment and the Current Account Gap ............................................................... 43 17. Decompostion of Changes in Current Account Balance ............................................................. 44
4
I. INTRODUCTION
Over five years have passed since the most intense phase of the global financial crisis. As has been widely documented, the pre-crisis period was characterized by increased dispersion in current account deficits and surpluses, facilitated by a benign global financial environment characterized by low risk aversion by borrowers and lenders as well as low volatility (see, amongst others, Lane 2013). While the crisis was not triggered by an unraveling of global imbalances, it did lead to a drastic change in the global financial environment and a sharp compression of current account balances. But was this initial adjustment the result of cyclical factors, including the initial sharp decline in domestic demand in deficit countries such as the United States, the euro area periphery, and several countries in Central and Eastern Europe, as well as initially declining commodity prices? Or has the external adjustment process been more protracted, with a stronger structural component?
In this paper we seek to address these questions by looking both at the adjustment of “global imbalances” post-crisis and at cross-country evidence on the external adjustment process. For the first part, covered in Section II, we illustrate how global current account imbalances have narrowed since the crisis, but how stock imbalances have instead continued to increase. Furthermore, we show that, while the adjustment process has a cyclical component (in the sense that output gaps for deficit countries were estimated to be larger than for surplus countries), global current account imbalances are projected to narrow further in the years ahead.
The second part of the paper presents cross-country evidence on current account adjustment after the crisis, documenting how the extent of adjustment is strongly correlated with measures of pre-crisis “excess imbalances”. This part builds on previous work (Lane and Milesi-Ferretti, 2012) which focused on the process of adjustment in the two years following the financial crisis. We believe an extension is warranted for two reasons. First, the longer time period allows us to better incorporate the effects of the crisis in the euro area. Second, and more generally, the longer time period elapsed since the crisis allows us to provide a medium-term analysis of adjustment, which should be less contaminated by purely-cyclical factors.
The paper is related to several strands of literature: on current account reversals and sudden stops (e. g. Calvo, 1998; Milesi-Ferretti and Razin, 2000; Calvo et al, 2004); causes and consequences of global imbalances (e. g. Obstfeld and Rogoff, 2005, 2007; Blanchard and Milesi-Ferretti, 2010; Klyuev and Kang, 2013); and the cross-country impact of the global financial crisis (e. g. Rose and Spiegel, 2010, 2012; Frankel and Saravelos, 2012; Lane and Milesi-Ferretti, 2011). Also in relation to these contributions, the longer post-crisis time period provides a clearer perspective on the medium-term dynamics of current account balances and output performance.
5
II. GLOBAL IMBALANCES AFTER THE CRISIS
The decade preceding the global financial crisis was characterized by a sharp widening of global imbalances, which was underpinned by a spectacular increase in capital flows and the size of cross-border financial holdings, particularly for advanced economies. During and after the crisis capital flows declined sharply and current account balances contracted. In this section we focus on trends in current account balances and net external positions, first at the global level and subsequently for Latin America more specifically.
A. Global trends
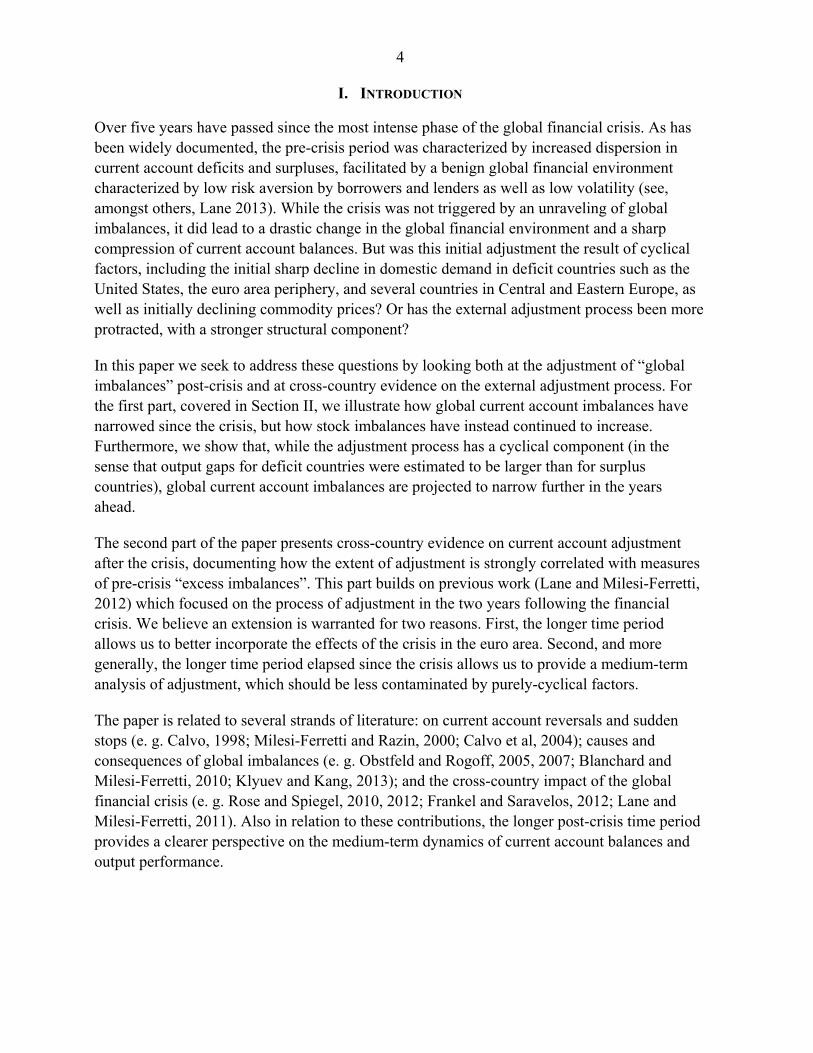
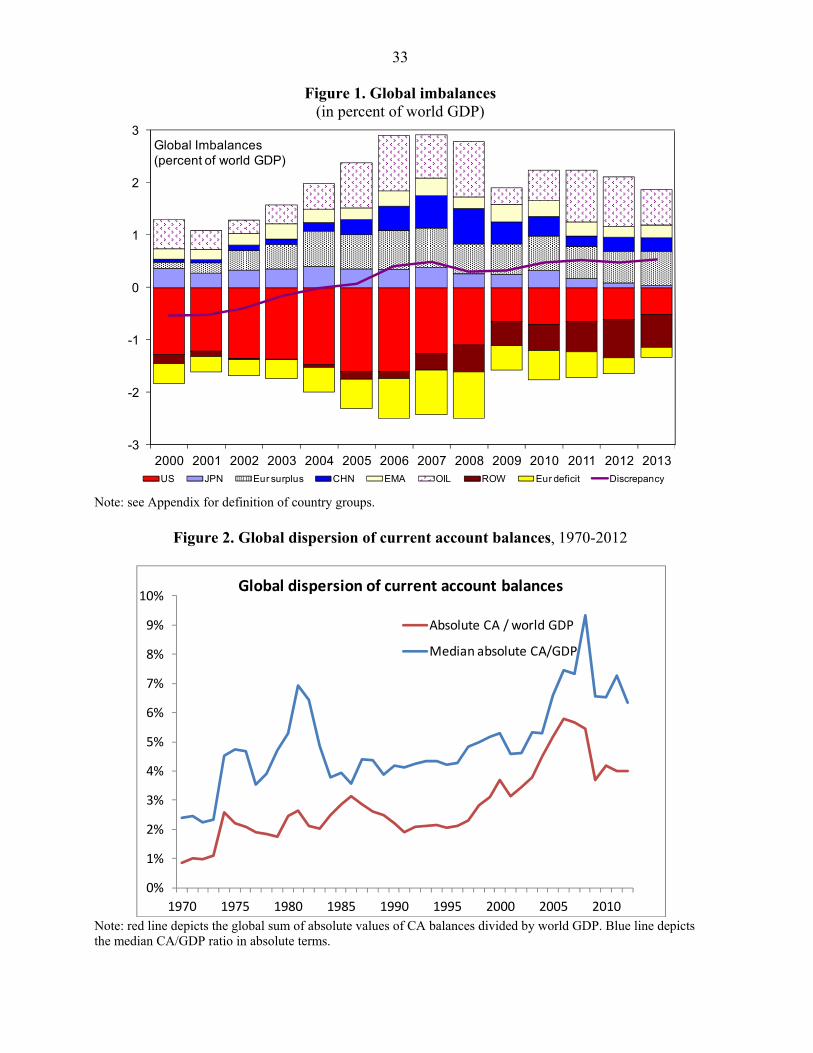
Figure 1 depicts the evolution of “global imbalances”—current account balances in the main countries/regions of the world. The classification of countries in groups follows Blanchard and Milesi-Ferretti (2010). In particular, European countries (including those in the euro area) with current account surpluses are grouped separately from those with current account deficits. As is well known, the pre-crisis period was associated by a widening U.S. current account deficit as well as growing current account deficits in the “euro area periphery”, the United Kingdom, and Central and Eastern Europe. At the same time, surpluses surged in emerging Asian countries (especially China), the group of major oil exporters and a number of advanced economies in the euro area and northern Europe. As Figure 1 shows, global imbalances peaked in 2007-08 and shrunk sharply in 2009, reflecting a global downturn but also sharply lower oil prices, and, after increasing in 2010 with the recovery in global output and oil prices, they have continued to shrink.
What was the country pattern of this adjustment? Among deficit countries, the US deficit shrank by over 1 percent of world GDP during the period 2006-13 (0.7 percent between 2007 and 2013), and current account imbalances in “deficit Europe” shrank by 80 percent (about 0.7 percent of world GDP) between 2007 and 2013. In contrast, current account deficits in the “rest of the world” increased by some 0.3 percent of world GDP (reflecting primarily the deficits of Australia, Brazil, Canada, France, India, and Mexico).2 Among surplus countries, Asian economies (China, Japan, as well as other East Asian economies) experienced the biggest decline relative to 2007 (0.8 percent of world GDP), while the surpluses in oil exporters declined modestly and those of other advanced European countries were broadly unchanged.
Ancillary evidence on the narrowing of current account imbalances comes from Figure 2. The figure depicts two measures of current account dispersion: one weighted by country size (the sum of the absolute value of current account balances, divided by world GDP) and the other unweighted (the median value of the current account to domestic GDP ratio). Both series show a decline in current account dispersion after the crisis, interrupting a trend starting in the early 1990s.
2 France is not classified among the European deficit countries because it ran current account surpluses uninterruptedly between 1992 and 2004.
6
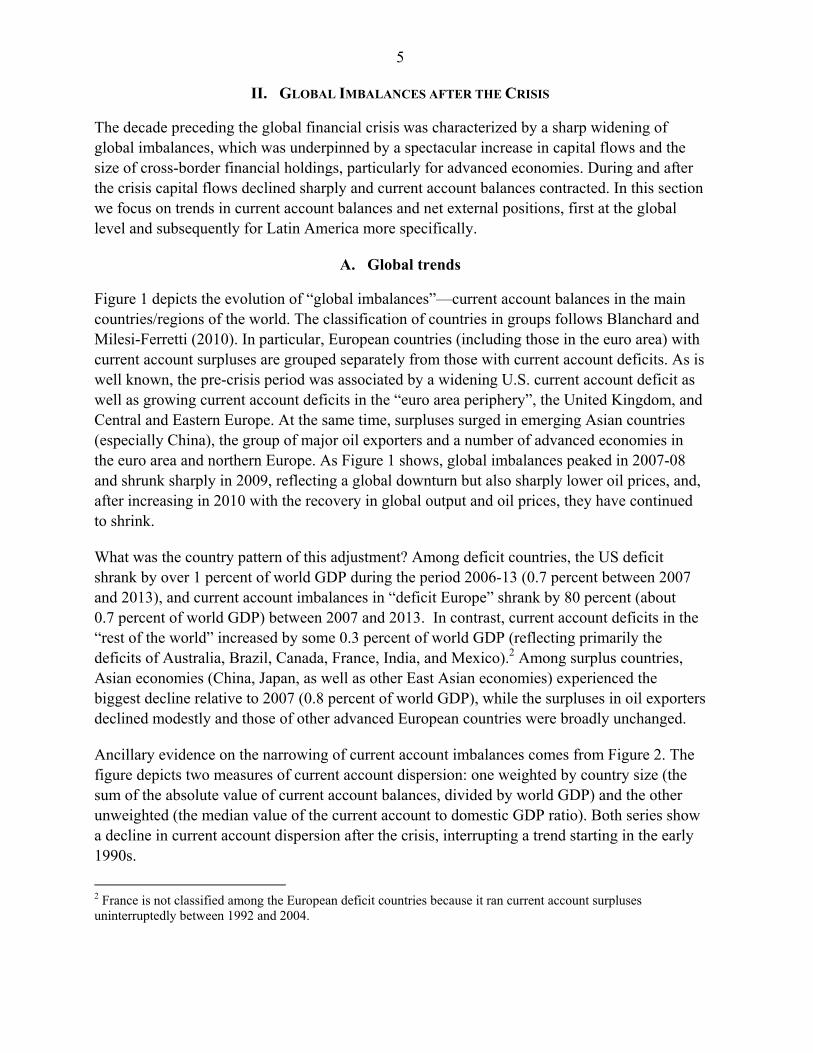
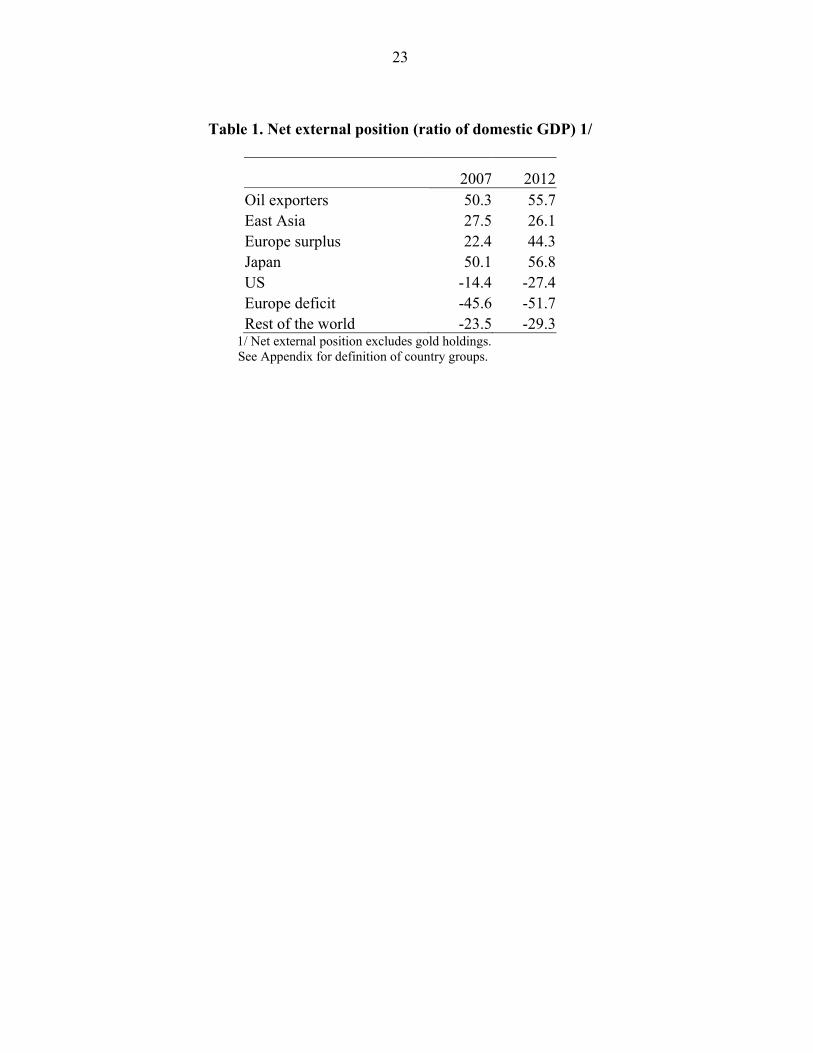
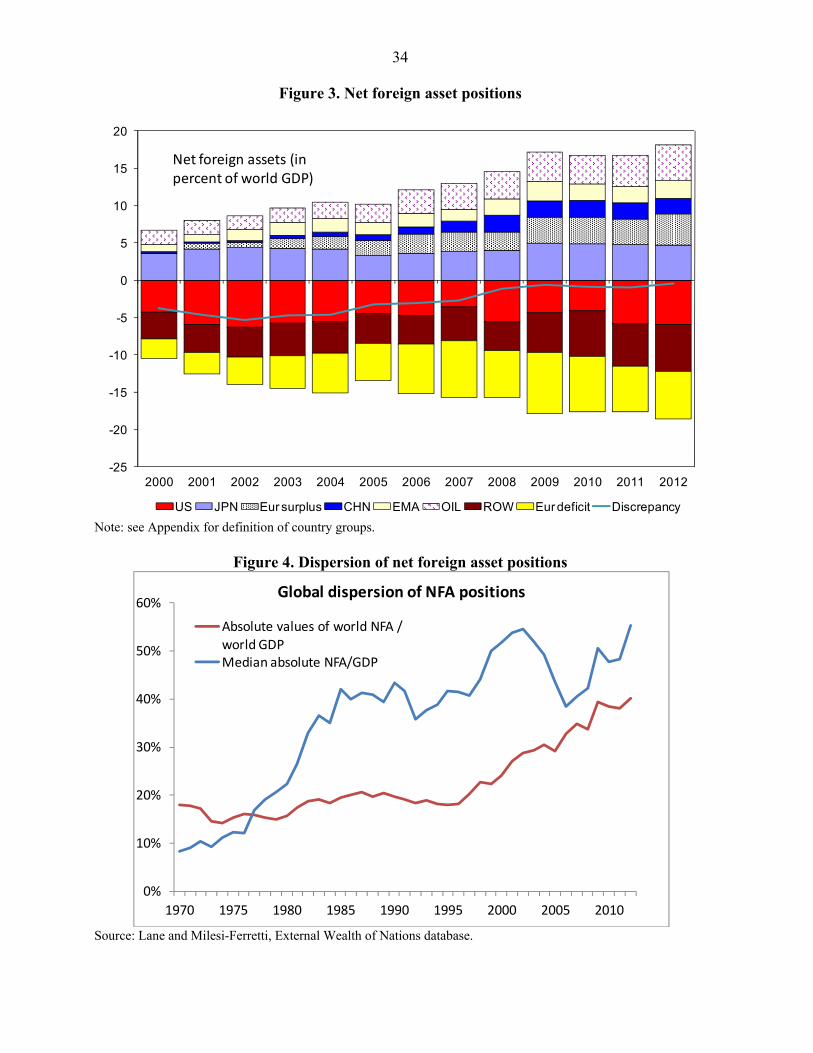
Does this imply that global imbalances are “over”? A look at international creditor and debtor positions (Figure 3) suggests some caution. As the top panel shows, global creditor and debtor positions have not shrunk as a ratio of GDP—in fact, they have widened since 2007. As of 2012, there were four major “creditors” with roughly similar net foreign assets (in the order of $3 trillion): oil exporters, Japan, China and other East Asian economies, and European surplus countries. On the other side of the ledger, there were 3 major debtor areas with liabilities of over $4 trillion: the United States, European deficit countries, and the rest of the world. As is the case for current account balances, six countries (Australia, Brazil, Canada, France, India, and Mexico) account for the lion share of the rest of the world’s liabilities. Despite the reduction in flow imbalances, creditor and debtor positions as a share of world GDP increased in absolute terms for all countries and regions depicted in Figure 3. Table 1 reports the positions for these same countries and regions scaled instead by domestic GDP: the only region for which the absolute size of the position relative to GDP has shrunk since 2012 is East Asia (including China), also reflecting the rapid pace of GDP growth.
Figure 4 reports alternative measures of dispersion of creditor and debtor positions. Symmetrically with Figure 2, the first measure is weighted by country size (the sum of the absolute value of net foreign asset positions, scaled by world GDP) and the second is unweighted (the median ratio of net foreign assets to domestic GDP). Both measures show a trend towards rising dispersion that was not interrupted by the crisis.3
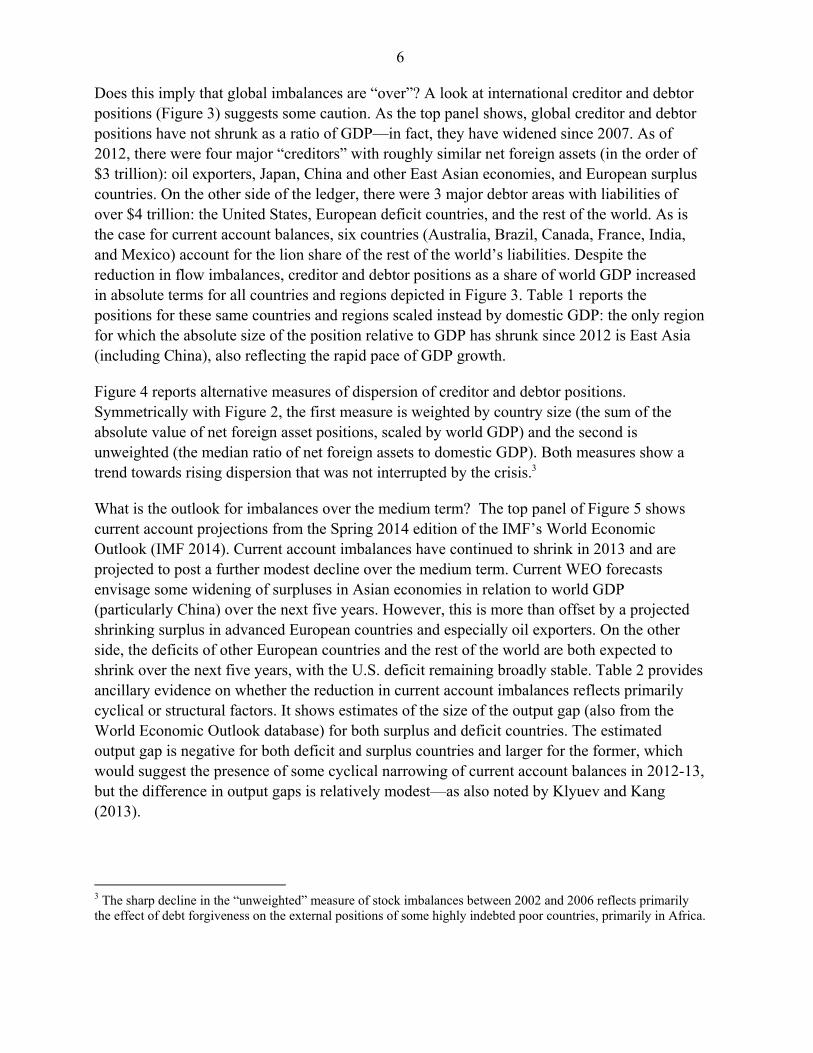
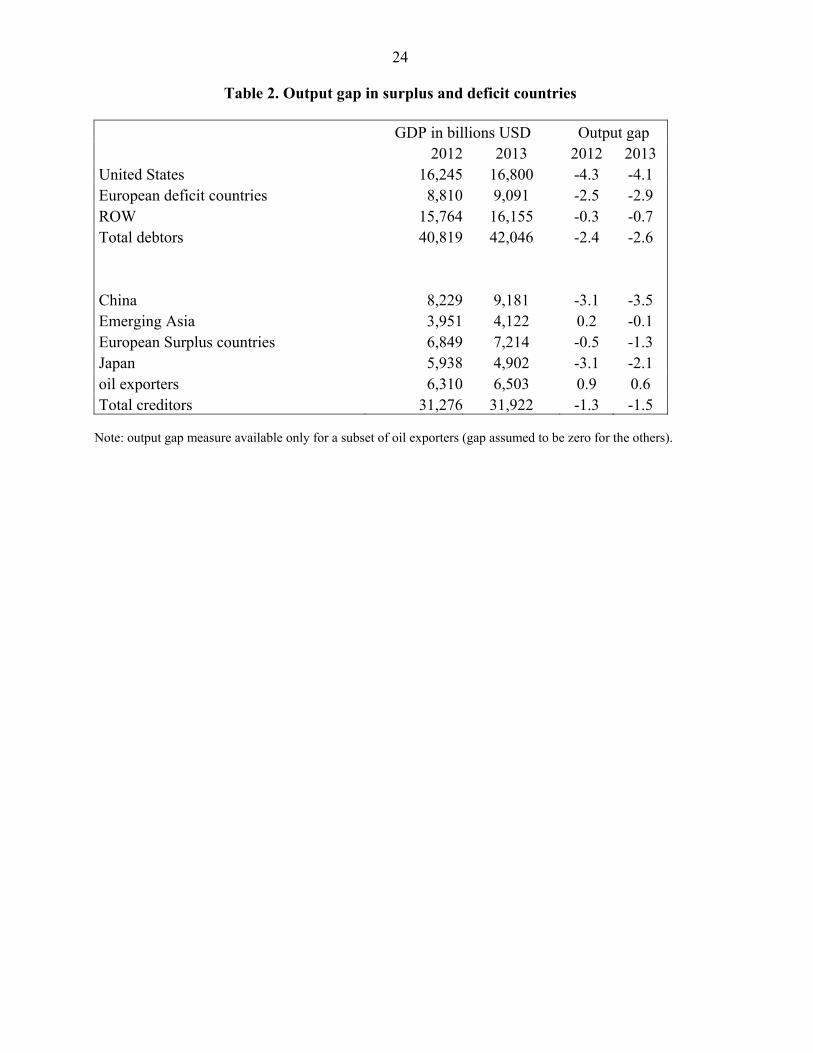
What is the outlook for imbalances over the medium term? The top panel of Figure 5 shows current account projections from the Spring 2014 edition of the IMF’s World Economic Outlook (IMF 2014). Current account imbalances have continued to shrink in 2013 and are projected to post a further modest decline over the medium term. Current WEO forecasts envisage some widening of surpluses in Asian economies in relation to world GDP (particularly China) over the next five years. However, this is more than offset by a projected shrinking surplus in advanced European countries and especially oil exporters. On the other side, the deficits of other European countries and the rest of the world are both expected to shrink over the next five years, with the U.S. deficit remaining broadly stable. Table 2 provides ancillary evidence on whether the reduction in current account imbalances reflects primarily cyclical or structural factors. It shows estimates of the size of the output gap (also from the World Economic Outlook database) for both surplus and deficit countries. The estimated output gap is negative for both deficit and surplus countries and larger for the former, which would suggest the presence of some cyclical narrowing of current account balances in 2012-13, but the difference in output gaps is relatively modest—as also noted by Klyuev and Kang (2013).
3 The sharp decline in the “unweighted” measure of stock imbalances between 2002 and 2006 reflects primarily the effect of debt forgiveness on the external positions of some highly indebted poor countries, primarily in Africa.
7
Predicting the evolution of net external positions is even more difficult than predicting current account balances, given potentially large valuation effects driven by difficult to predict exchange rate and asset price changes. With this caveat in mind, the bottom panel of Figure 5 shows the evolution of stock imbalances by assuming that the change in the stock of net foreign assets equals the (projected) current account balance. Despite the retrenchment in current account balances, these data still point to a widening of net positions over time. In turn, this suggests that, absent a stabilizing configuration of valuation changes (for example, rising asset prices or appreciating exchange rates in surplus countries), a further compression of current account balances will be needed to keep positive and negative net external positions from getting larger in relation to world GDP.
B. Latin America
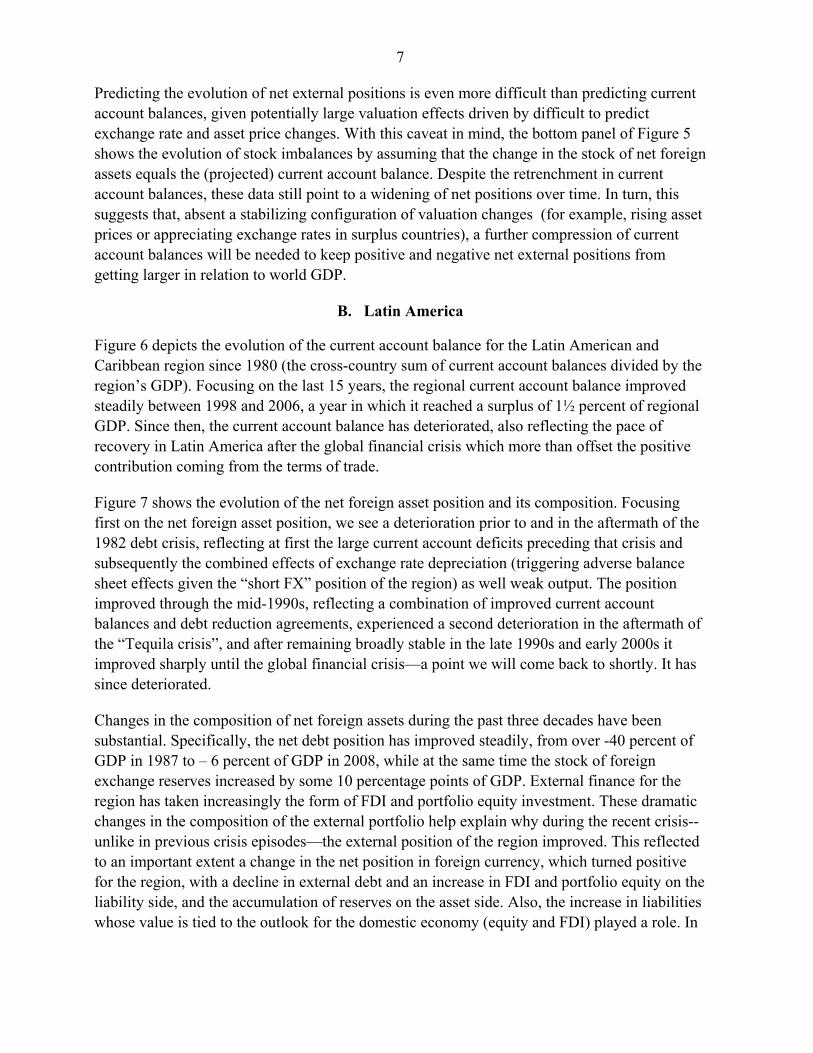
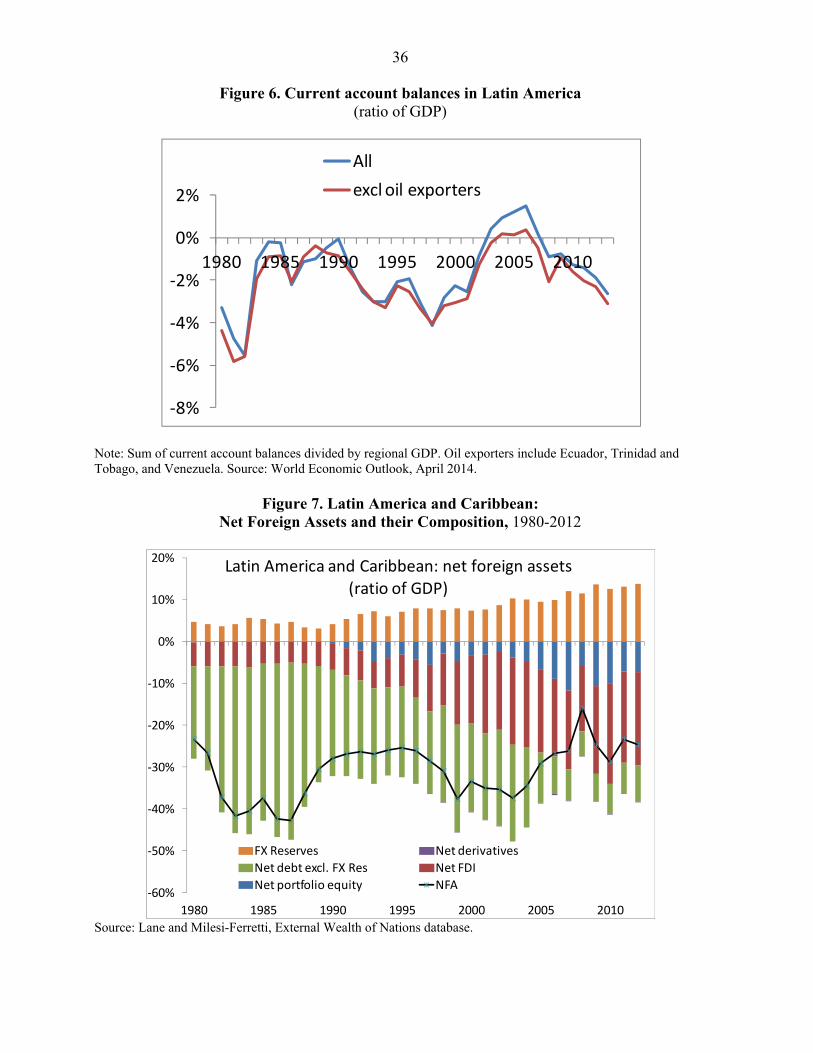
Figure 6 depicts the evolution of the current account balance for the Latin American and Caribbean region since 1980 (the cross-country sum of current account balances divided by the region’s GDP). Focusing on the last 15 years, the regional current account balance improved steadily between 1998 and 2006, a year in which it reached a surplus of 1½ percent of regional GDP. Since then, the current account balance has deteriorated, also reflecting the pace of recovery in Latin America after the global financial crisis which more than offset the positive contribution coming from the terms of trade.
Figure 7 shows the evolution of the net foreign asset position and its composition. Focusing first on the net foreign asset position, we see a deterioration prior to and in the aftermath of the 1982 debt crisis, reflecting at first the large current account deficits preceding that crisis and subsequently the combined effects of exchange rate depreciation (triggering adverse balance sheet effects given the “short FX” position of the region) as well weak output. The position improved through the mid-1990s, reflecting a combination of improved current account balances and debt reduction agreements, experienced a second deterioration in the aftermath of the “Tequila crisis”, and after remaining broadly stable in the late 1990s and early 2000s it improved sharply until the global financial crisis—a point we will come back to shortly. It has since deteriorated.
Changes in the composition of net foreign assets during the past three decades have been substantial. Specifically, the net debt position has improved steadily, from over -40 percent of GDP in 1987 to – 6 percent of GDP in 2008, while at the same time the stock of foreign exchange reserves increased by some 10 percentage points of GDP. External finance for the region has taken increasingly the form of FDI and portfolio equity investment. These dramatic changes in the composition of the external portfolio help explain why during the recent crisis--unlike in previous crisis episodes—the external position of the region improved. This reflected to an important extent a change in the net position in foreign currency, which turned positive for the region, with a decline in external debt and an increase in FDI and portfolio equity on the liability side, and the accumulation of reserves on the asset side. Also, the increase in liabilities whose value is tied to the outlook for the domestic economy (equity and FDI) played a role. In
8
this new environment, the sharp depreciation of regional currencies, together with the decline in stock market valuations, reduced the value of foreign claims on the region.
The evidence shown so far reflects regional trends, and is hence heavily affected by dynamics in the largest economies (Brazil and Mexico). But there is of course significant heterogeneity in the region, including in terms of external sector developments. Figure 8 illustrates this point by showing the ratio of net foreign assets to GDP in Central American and Caribbean countries, which account for a relatively small share of aggregate regional GDP. For both regions the evolution of the external position is less favorable—specifically, they have experienced a steady deterioration in their net external position, to levels that for Caribbean countries are particularly high. Higher commodity prices are one obvious channel that affects different parts of Latin America and the Caribbean in asymmetric fashion, providing a boost to commodity exporters in South America but implying a deterioration in the terms of trade for commodity-importing countries in the Caribbean and Central America.
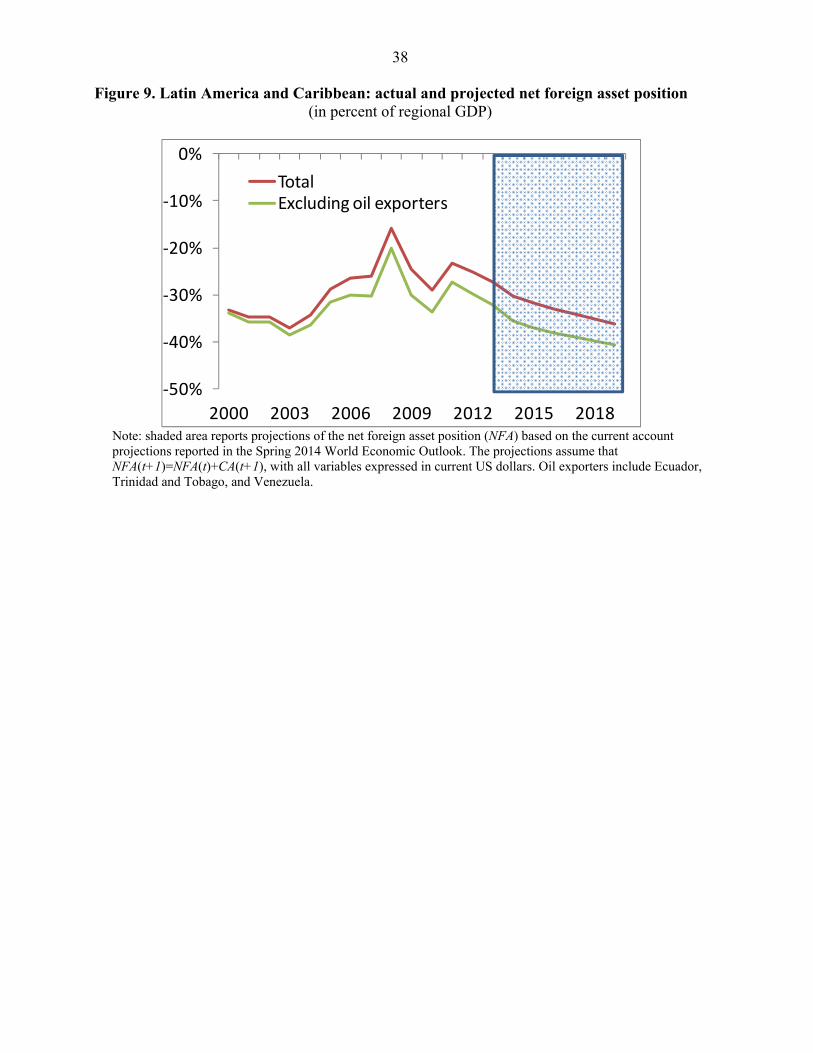
Looking to the future, WEO current account projections envisage a further modest deterioration of the regional current account balance after its sharp worsening in 2013 (Figure 9). In a global context, the regional current account deficit (excluding oil exporters) would constitute a rising fraction of the “rest of the world” deficit depicted in the lower panel of Figure 1 (from 1/5 in 2012 to over 1/3 in 2018). A simple forward-looking projection based on 2012 net foreign asset positions, the 2013 current account balance, and WEO projections for current account balances and GDP for the period 2014-19 also suggests a further deterioration of the region’s net foreign asset position (Figure 8), by some 10 percentage points of GDP. The net external liabilities of the region account for about 1/3 of the net external liabilities of the “rest of the world” group, a ratio that remains broadly stable during the projection period as depicted in the lower panel of Figure 5.
III. PRE-CRISIS IMBALANCES AND EXTERNAL ADJUSTMENT
In this section, we examine the cross-country variation in external adjustment over the crisis period. We adopt this cross-sectional approach in order to establish whether a variety of pre-determined or fixed country characteristics have influenced the direction and scale of external adjustment. The focus on predetermined and fixed country characteristics limits endogeneity issues in interpreting the regression results. In particular, we investigate whether the current account adjustment that occurred during the crisis can be viewed as correcting “excessive” imbalances that may have emerged during the pre-crisis period. As outlined in Lane and Milesi-Ferretti (2012), the increase in the dispersion of current account balances may be attributed to an unusual and temporary configuration in the global financial environment in which risk appetite was high among both lenders and borrowers and interest rates were low. Once this phase was terminated, a compression in external imbalances was required.
Our empirical strategy is to capture the “excess” component in the pre-crisis imbalances by measuring the deviation of the current account balance from a level consistent with underlying medium-term fundamentals. To this end, following Lane and Milesi-Ferretti (2012) and a large

9
empirical literature on this topic, we estimate the medium-term relation between current account balances and a set of macro-financial variables (demographic structure, level of output per capita, output growth rate, the fiscal balance, natural resource endowments, lagged net international investment position, financial center status, past experience of crisis episodes). The “excess” component of current account imbalances is derived as the deviation of the actual current account values from these estimated values. We subsequently will examine whether external adjustment during the crisis can be related to the size of this gap measure.
The current account “gap” is measured as the difference between the actual average current account balance during 2005-2008 (the final four-year interval in our pre-crisis sample) and the fitted value from the estimated regression4
The country sample includes 64 advanced economies and emerging markets (listed in the Appendix). In light of various idiosyncratic factors it excludes major oil exporters as well as countries with per capita income in 2007 below $1000 and very small countries (with GDP below $20 billion in 2007).5
Lane and Milesi-Ferretti (2012) show that the model captures much of the cross-country, cross-time variation in current account balances. For instance, there is a strong positive correlation (0.74) between the actual and model-implied values for the current account for the 2005-2008 period just prior to the onset of the global crisis. Still, there remains a substantial residual component and it is this “unexplained” component that we exploit as a proxy for “excessive” pre-crisis imbalances.
As a robustness test, we also calculated a measure of the current account gap using the more recent “External Balance Assessment” (EBA) methodology, described in IMF (2013). The EBA relies on a similar panel regression of current account balances, but covers a wider range of explanatory variables with a more explicit emphasis on policy variables. For the purpose of this paper, we construct the pre-crisis “gap” using the residuals from the EBA panel regression, thereby side-stepping the issue of whether the policy variables during that period were at “appropriate” levels. The correlation between the residuals from the EBA regression and the gap measure described earlier is extremely high. In the regression analysis, we use the CAGAP measure, since it is available for a larger sample of countries.6
4 Lane and Milesi-Ferretti (2012) report a host of robustness checks on the quality of the current account gap measure. These included additional regressors and examining alternative time windows in generating the gap estimates.`
5 See Lane and Milesi-Ferretti (2012) for further details on the choice of sample.
6 We also ran the regressions using the CAGAP-EBA measure and obtained generally similar results.
10
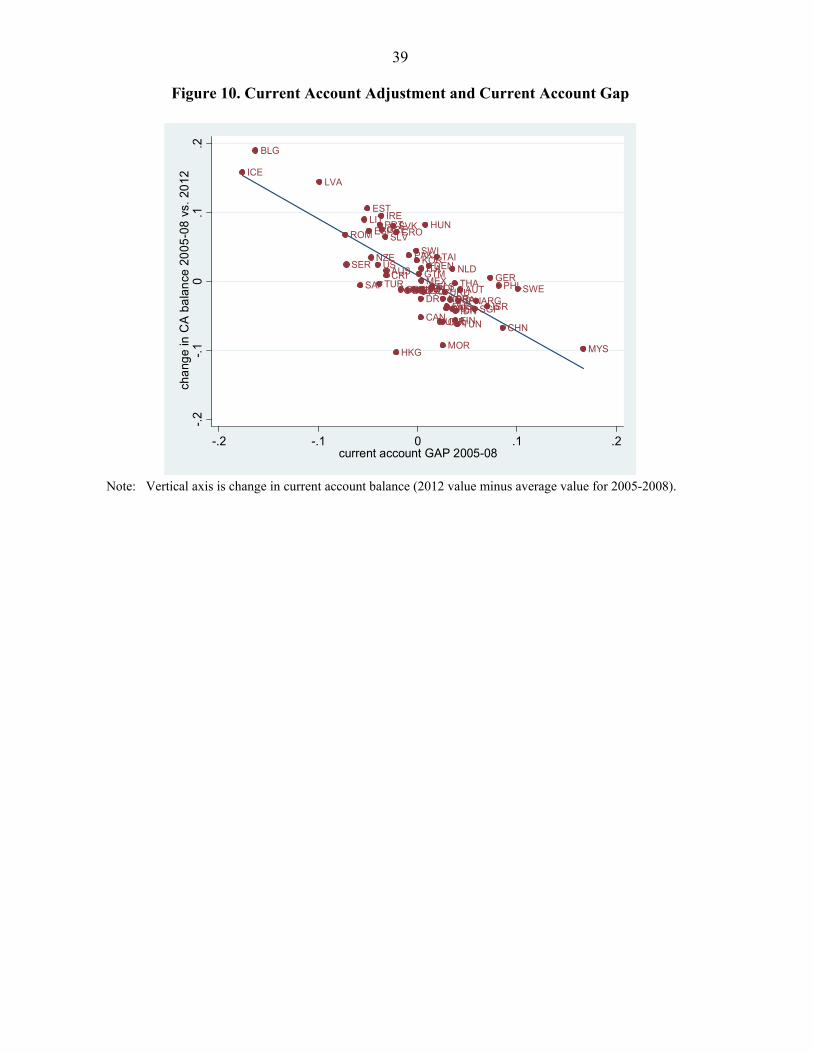
We next turn to an examination of whether macroeconomic outcomes during and following the global financial crisis can be related to our measure of the current account gap. As a first step, we look at changes in the current account balance between the 2005-08 period and 2012. As the bivariate scatterplot of Figure 10 highlights, the correlation of the current account gap with the subsequent change in the current account balance is clearly negative and very strong—those countries with the largest negative gaps (pre-crisis current account deficits in excess of the values indicated by the model specification) have experienced the biggest improvements in external balances over the crisis period, while those countries with the largest positive gaps (pre-crisis current account balances in excess of the values indicated by the model specification) have seen the largest declines in their current account to GDP ratio. Hence, the 2008-2012 period can be interpreted as a correction phase, in which the momentum has been towards the elimination of excessive external imbalances.
The pattern in Figure 10 is very similar to the relation between the CAGAP measure and current account adjustment over 2008-2010 reported by Lane and Milesi-Ferretti (2012). In fact, there is a very high correlation (0.85) between the 2008-2010 change in the current account and the 2008-2012 change—the persistence of the improvement in the current account suggests that it cannot be just attributed to the acute disruption in international credit markets during the acute phase of the crisis (late 2008 through 2009).
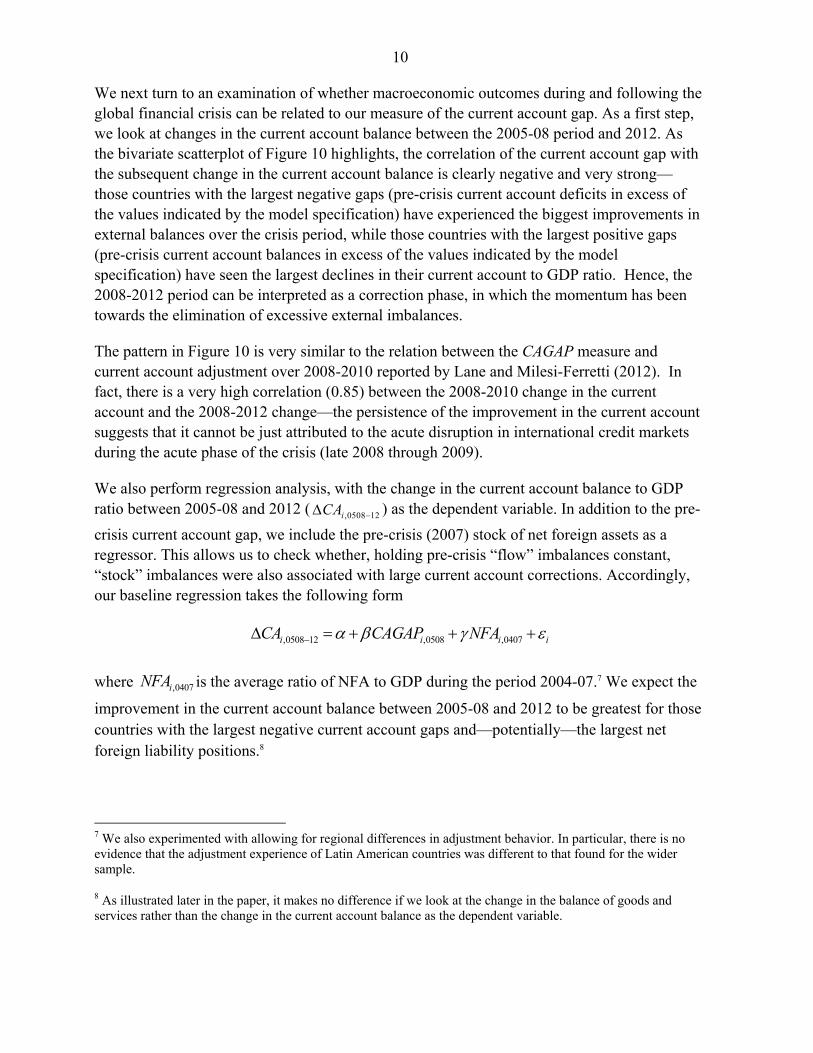
We also perform regression analysis, with the change in the current account balance to GDP ratio between 2005-08 and 2012 ( ,0508 12iCA ) as the dependent variable. In addition to the pre-
crisis current account gap, we include the pre-crisis (2007) stock of net foreign assets as a regressor. This allows us to check whether, holding pre-crisis “flow” imbalances constant, “stock” imbalances were also associated with large current account corrections. Accordingly, our baseline regression takes the following form
,0508 12 ,0508 ,0407i i i iCA CAGAP NFA
where ,0407iNFA is the average ratio of NFA to GDP during the period 2004-07.7 We expect the
improvement in the current account balance between 2005-08 and 2012 to be greatest for those countries with the largest negative current account gaps and—potentially—the largest net foreign liability positions.8
7 We also experimented with allowing for regional differences in adjustment behavior. In particular, there is no evidence that the adjustment experience of Latin American countries was different to that found for the wider sample.
8 As illustrated later in the paper, it makes no difference if we look at the change in the balance of goods and services rather than the change in the current account balance as the dependent variable.
11
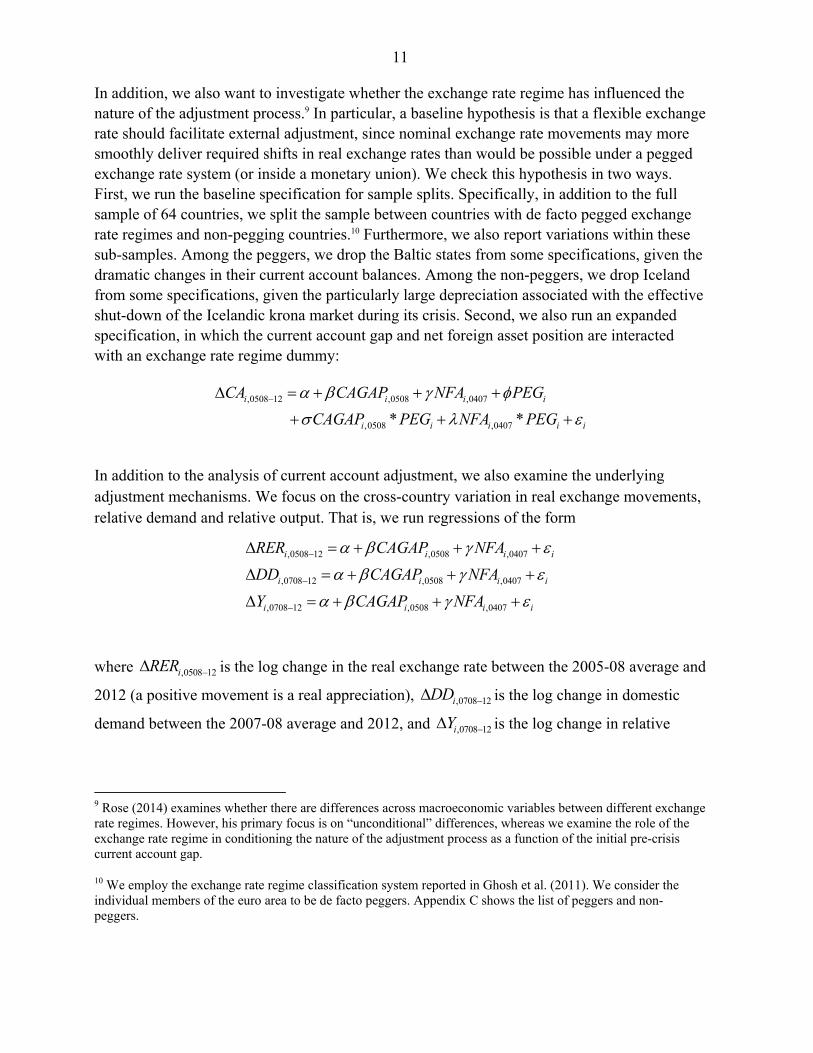
In addition, we also want to investigate whether the exchange rate regime has influenced the nature of the adjustment process.9 In particular, a baseline hypothesis is that a flexible exchange rate should facilitate external adjustment, since nominal exchange rate movements may more smoothly deliver required shifts in real exchange rates than would be possible under a pegged exchange rate system (or inside a monetary union). We check this hypothesis in two ways. First, we run the baseline specification for sample splits. Specifically, in addition to the full sample of 64 countries, we split the sample between countries with de facto pegged exchange rate regimes and non-pegging countries.10 Furthermore, we also report variations within these sub-samples. Among the peggers, we drop the Baltic states from some specifications, given the dramatic changes in their current account balances. Among the non-peggers, we drop Iceland from some specifications, given the particularly large depreciation associated with the effective shut-down of the Icelandic krona market during its crisis. Second, we also run an expanded specification, in which the current account gap and net foreign asset position are interacted with an exchange rate regime dummy:
,0508 12 ,0508 ,0407
,0508 ,0407* *i i i i
i i i i i
CA CAGAP NFA PEG
CAGAP PEG NFA PEG
In addition to the analysis of current account adjustment, we also examine the underlying adjustment mechanisms. We focus on the cross-country variation in real exchange movements, relative demand and relative output. That is, we run regressions of the form
,0508 12 ,0508 ,0407
,0708 12 ,0508 ,0407
,0708 12 ,0508 ,0407
i i i i
i i i i
i i i i
RER CAGAP NFA
DD CAGAP NFA
Y CAGAP NFA
where ,0508 12iRER is the log change in the real exchange rate between the 2005-08 average and
2012 (a positive movement is a real appreciation), ,0708 12iDD is the log change in domestic
demand between the 2007-08 average and 2012, and ,0708 12iY is the log change in relative
9 Rose (2014) examines whether there are differences across macroeconomic variables between different exchange rate regimes. However, his primary focus is on “unconditional” differences, whereas we examine the role of the exchange rate regime in conditioning the nature of the adjustment process as a function of the initial pre-crisis current account gap.
10 We employ the exchange rate regime classification system reported in Ghosh et al. (2011). We consider the individual members of the euro area to be de facto peggers. Appendix C shows the list of peggers and non-peggers.
12
output between the 2007-08 average and 2012. 11 We expect those countries with larger negative current account gaps to be under greater pressure to undergo real depreciation and/or experience a relative decline in domestic demand. Furthermore, in the presence of various nominal and real rigidities, a decline in domestic demand will map into a decline in domestic output. As in the current account regressions, we also control for the initial net foreign asset position.
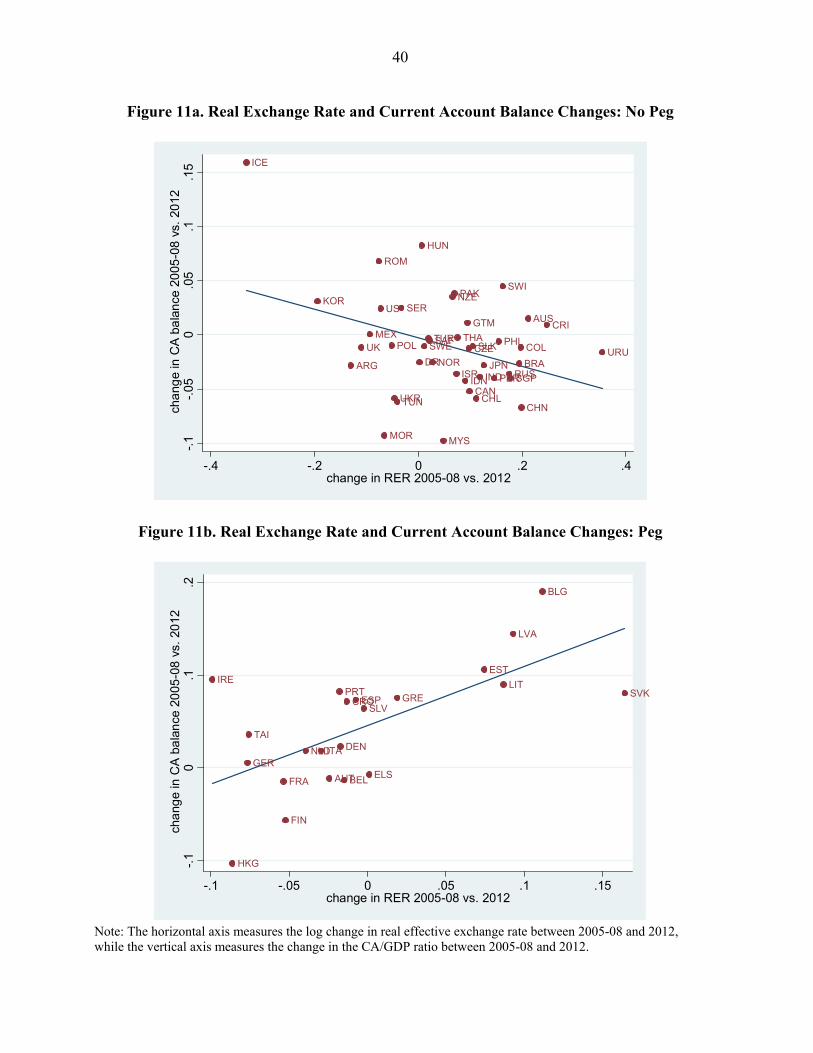
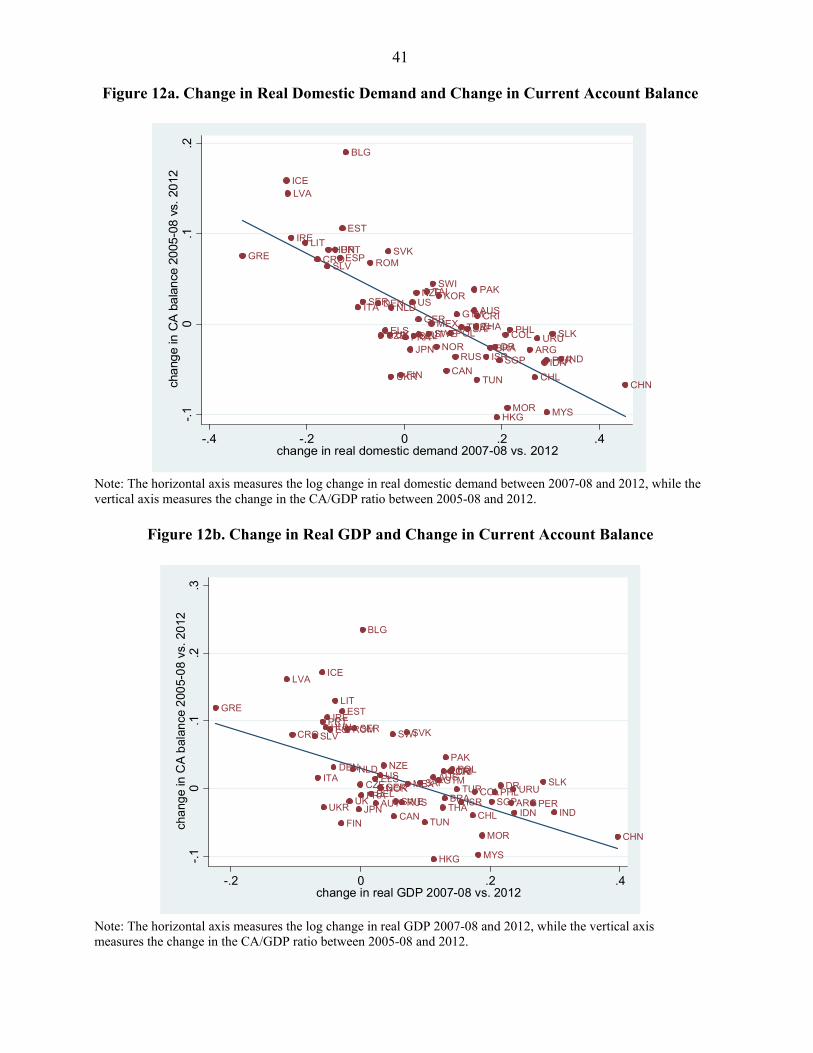
As a first step, Figures 11 and 12 show scatter plots of these variables against the change in the current account balance (2012 value minus average value for 2005-08). In Figures 11a and 11b, we separately plot the change in the real exchange rate between 2005-08 and 2012 for the “non-peg” and “peg” samples, while Figures 12a and 12b show the 2005-08 to 2012 changes in domestic demand and output respectively. Figures 11a and 11b show that for the non-peg sample real exchange rates tended to depreciate in countries experiencing an improvement in the current account balance and vice-versa, but for the peg sample the relation has the opposite sign, suggesting that relative price changes did not help the adjustment process. However, in both Figures 12a and 12b, there is considerable heterogeneity around the bivariate regression line.
Figures 12a and 12b show very high bivariate correlations between the change in the current account and the changes in domestic demand and output. These strong covariation patterns show that current account improvements were typically associated with poorer macroeconomic outcomes (less positive or negative expenditure and output growth).
Figures 11-12 capture the contemporaneous comovements between the current account and the real exchange rate, domestic demand and output. Clearly, it is difficult to infer much about underlying causal mechanisms from such data, since these variables are jointly determined.
As outlined above, our regression analysis provides an alternative framework by examining the relation between pre-crisis imbalances and cross-country variation in adjustment patterns over 2008-2012. The regression results for current account adjustment are shown in Table 3. Column (1) shows the baseline full-sample estimates. We split the sample between non-peggers and peggers in columns (2)-(3) and (4)-(5), with the latter two columns excluding extreme observations (Iceland among floaters and the Baltics among pegs). Finally, columns (6) and (7) present regressions for the whole sample with regressors interacted with an exchange regime dummy.
The gap measure is significant at the one percent level across all specifications. The estimated coefficient in column (1) suggests that over ¾ of the estimated pre-crisis current account gap was closed over the 2005-08 to 2012 period for the typical country in the sample. Furthermore,
11 Given that output and demand are trending variables, we focus on a shorter pre-crisis period, but results for the 2005-08 pre-crisis period are analogous.
13
there is no statistically significant difference across exchange rate regimes in the relation between the gap measure and the scale of current account adjustment. These results hold even when extreme observations (Baltics, Iceland) are excluded in columns (4), (5) and (7). Relative to our previous work, the striking pattern in Table 3 is that the scale of adjustment has increased relative to the (already sizable) correction during 2008-2010 (which was close to 0.6).
Table 3 also shows that those countries with more negative initial net foreign asset positions and operating under a pegged exchange rate regime underwent greater current account adjustment. While this result does not hold for the non-pegging sample, it does indicate that both ‘flow’ and ‘stock’ imbalances affected current account adjustment for the pegging sample. For robustness, we also ran regressions including both the current account gap and the actual current account balance for 2005-08 as right-hand-side variables. These clearly indicate that the former is the economically and statistically significant explanatory variable for subsequent current account changes.
The regression results for the real exchange rate are shown in Table 4. They show a sizable difference in patterns depending on the exchange rate regime. For non-peggers, results suggest some link between pre-crisis imbalances and subsequent exchange rate adjustment, but this link is robust only for stock positions as opposed to the current account gap (whose statistical significance in column (2) vanishes when Iceland is excluded, as in column (4)). For the peg sample, the evidence suggests that if anything real exchange rates appreciated for countries with negative current account gaps and negative net external liabilities. The significance of the peg dummy indicates that peggers on average experienced more real depreciation—but that pattern is orthogonal to the scale of pre-crisis external imbalances.
Taken together, these findings do not provide much support to the notion that “expenditure switching” has been an important source of external adjustment over 2008-2012—for excess deficit countries; the burden seems to have fallen mainly on “expenditure reduction”. While Lane and Milesi-Ferretti (2012) found qualitatively-similar results for the 2008-2010 period, it is more surprising that real exchange rates have not played a supportive role over the longer 2008-2012 period, since the inhibiting forces of various nominal and real rigidities should be less powerful over a longer horizon. Arguably, alternative measures of real effective exchange rates (based on unit labor costs, instead of consumer price indices) show more real exchange rate adjustment among peggers—for example in deficit countries in the euro area—but a broader cross-country comparison using these measures is hampered by more limited data availability.
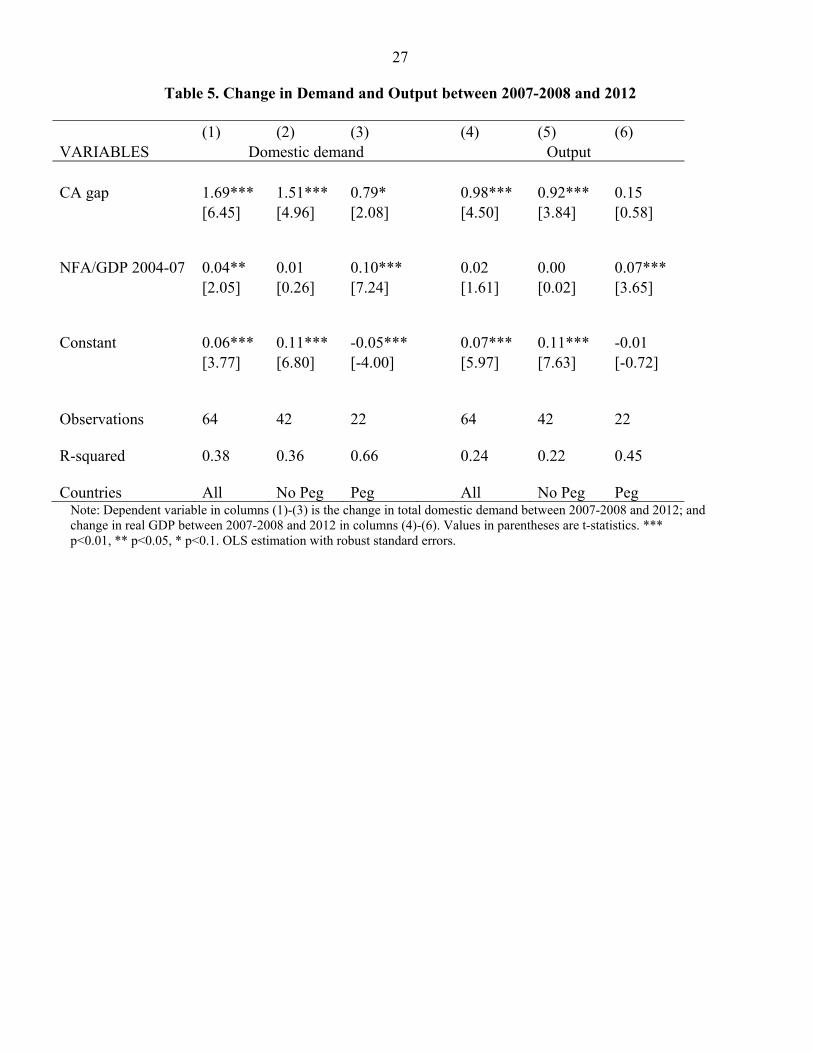
We turn to an examination of relative domestic demand and relative output dynamics in Table 5. The table underscores how pre-crisis current account gaps are strongly positively correlated with subsequent changes in domestic demand. Indeed it is striking that for the whole sample the current account gap and pre-crisis net foreign asset position help explain almost 40 percent of the cross-country variation in subsequent demand growth. Sample splits underscore
14
how for non-peggers the current account gap plays an important role in explaining subsequent demand growth, while for peggers the initial net foreign asset position is instead the dominant factor. Not surprisingly, the link between pre-crisis imbalances and GDP growth is a bit weaker, but still important, and with the same difference in patterns between non-peggers and peggers. Robustness checks indicate that the current account gap—rather than the pre-crisis current account balance—is the relevant predictor of subsequent output and demand performance.
As further robustness checks, Lane and Milesi-Ferretti (2012) reported an array of alternative specifications and found these did not affect the main results. In particular, the pattern of results is robust in extended specifications that incorporate the initial fiscal position and projections of expected future growth or that allow for different coefficients between positive and negative current account gaps.
IV. EXTERNAL ADJUSTMENT CHANNELS
In Tables 6-8 and Figures 13-15 we explore in more detail some of the channels through which external adjustment can take place, focusing on policy interest rates, inflation, and the fiscal balance during the crisis.
Figure 13 shows the bivariate scatter of the change in the policy rate (average value for 2009-2012 minus the average value for 2005-2008) against the current account gap, in order to check whether those countries with negative pre-crisis current account gaps undertook larger reductions in the policy interest rate, consistent with the need to achieve a real depreciation.12 The covariation pattern is positive—countries with negative current account gaps tended to have the largest policy rate reductions.
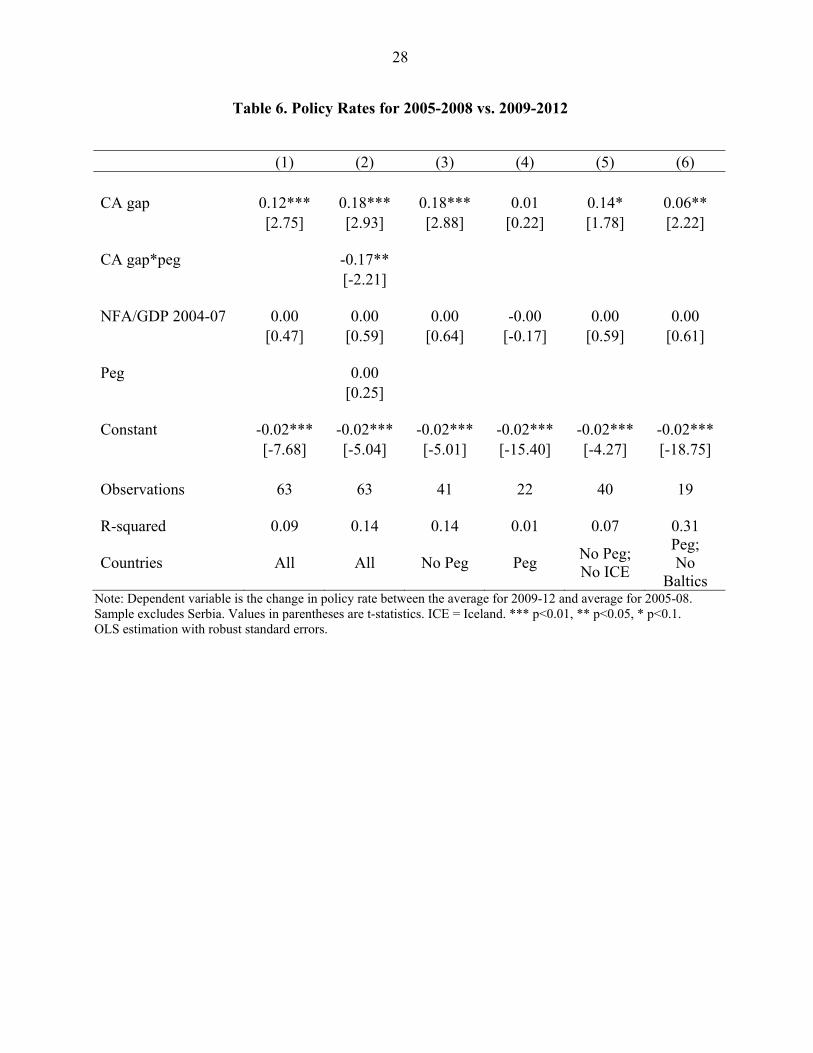
Table 6 provides multivariate regression analysis. In particular, columns (1)-(4) indicate an important difference in the behavior of policy rates between the non-peg and peg samples. In particular, non-peggers with more negative current account gaps undertook larger cuts in policy interest rates during the crisis, whereas no similar pattern is found among the peggers. Given the strong relation between the current account gap and activity indicators (domestic demand and output) in Table 5, it is not surprising that those countries with monetary policy autonomy (the non-peggers) opted to cut interest rates during the crisis, whereas this option was not available at the individual country level for the peggers.13 Finally, column (6) of Table 6 shows that the result for the peg sample is modified if the Baltics are excluded, with interest rate cuts also enjoyed by peggers with negative current account gaps. Since the euro area member countries dominate the non-Baltic peg sample, this result is explained by the cuts in ECB policy rates during the crisis, since (on an unweighted basis) there are more euro area member
12 Serbia was excluded from the sample in Table 6 as a large outlier.
13 This is not necessarily true for peggers that maintain binding capital controls.

15
countries with negative current account gaps than positive current account gaps. Overall, the evidence in Table 6 can help explain some of the results reported in Table 4—namely, the “stabilizing” (albeit weak) link between pre-crisis imbalances and subsequent changes in the real exchange rate for non-peggers.
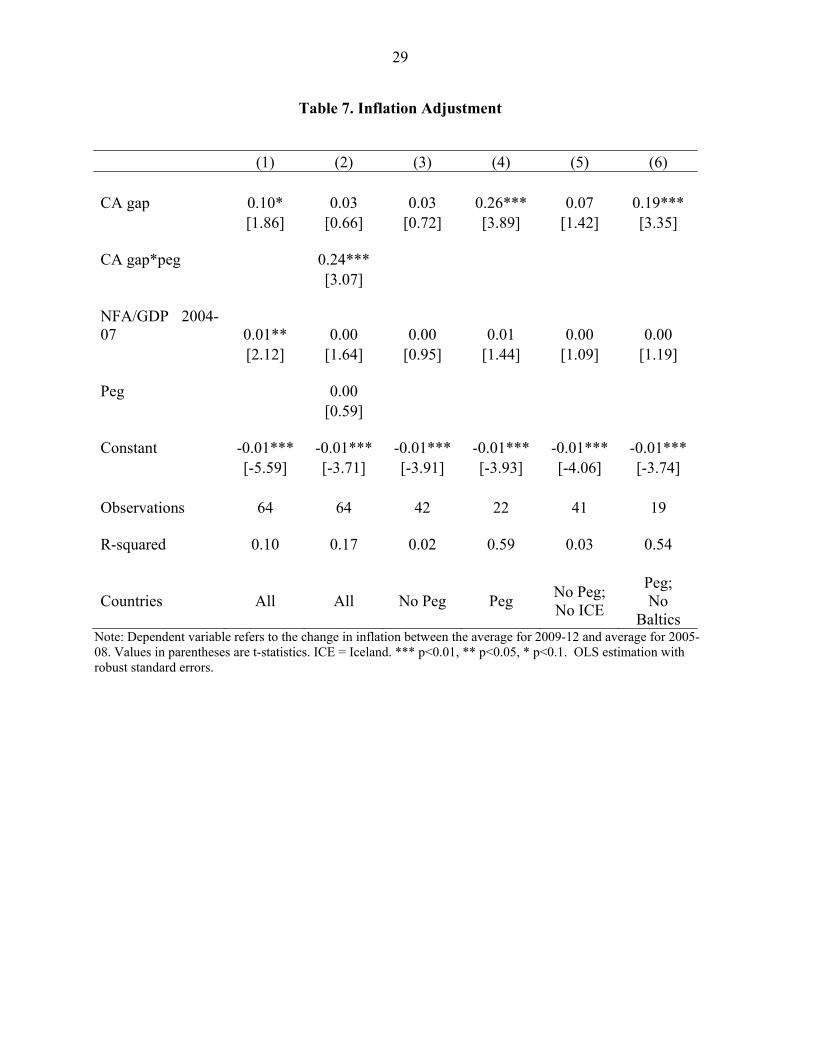
Table 7 reports regressions for the change in the inflation rate (average value for 2009-2012 minus the average value for 2005-2008), to see if those countries required to improve the external account in part achieved real depreciation through a lower domestic inflation rate. The bivariate scatter is presented in Figure 14, which does suggest that this pattern is evident in the data. However, the regressions reported in Table 7 show a significant relation between the current account gap and inflation only for the pegging sample (columns (4) and (6)). That peggers with more negative initial current account gaps experienced a reduction in inflation rates (relative to precrisis levels) in itself should contribute to real exchange rate adjustment.
However, the evidence in Table 4 is that there is no systematic relation between the initial current account gap and the real exchange rate for this sample. For some countries, the positive contribution of the inflation term may have been offset by movements in the trade-weighted exchange rate; for other countries (e.g. the Baltics), the reduction in inflation during the crisis was from a high pre-crisis level, so that the net impact of the inflation differential vis-à-vis trading partners may have remained positive.
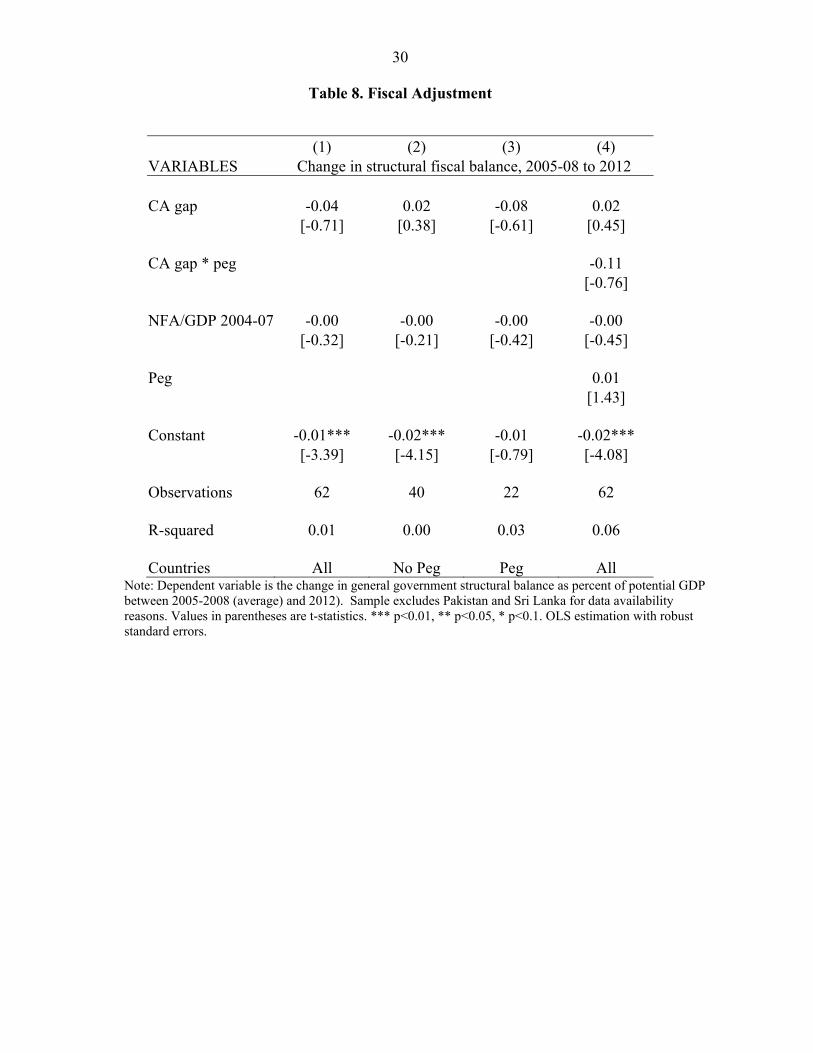
In Table 8, we examine the relation between pre-crisis imbalances and adjustment in structural fiscal balances, in order to examine whether a tightening in the fiscal stance contributed to the closing of “excessive” current account deficits. We focus on the structural fiscal balance, since this should strip out the impact of cyclical factors on the overall fiscal balance. Figure 15 shows the bivariate scatter, which shows virtually no correlation between pre-crisis imbalances and subsequent changes in the structural fiscal balance. This is confirmed in the regression analysis in Table 8--changes in the structural balance appear uncorrelated with both the pre-crisis current account gap and the pre-crisis net foreign asset position.
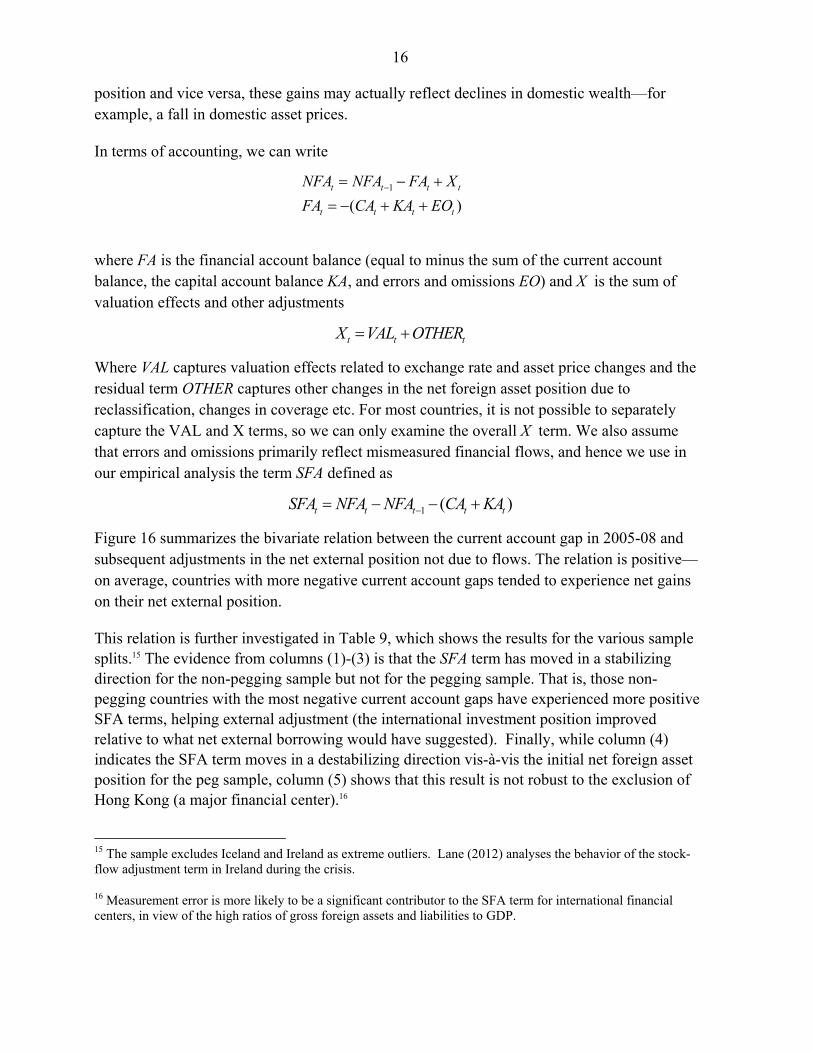
Next, we investigate whether stock-flow adjustments in net external positions over the period 2008-2012 were correlated with initial external imbalances.14 As discussed in Lane and Milesi-Ferretti (2001, 2007), the evolution of the net international investment position depends not only on the dynamics of the current account balance but also on valuation effects and other adjustments to the international balance sheet. We are specifically interested in examining whether movements in exchange rates and asset prices have been facilitating external adjustment, with countries with excess deficits experiencing net valuation gains and vice versa. In this respect, it is important to note that while net valuation gains improve the external
14 That is, the contribution of non-flow factors to the change in the net international investment position between end-2007 and end-2012. Gourinchas and Rey (2013) provide a review of the literature on valuation effects and external adjustment.
16
position and vice versa, these gains may actually reflect declines in domestic wealth—for example, a fall in domestic asset prices.
In terms of accounting, we can write
1
( )t t t t
t t t t
NFA NFA FA X
FA CA KA EO
where FA is the financial account balance (equal to minus the sum of the current account balance, the capital account balance KA, and errors and omissions EO) and X is the sum of valuation effects and other adjustments
t t tX VAL OTHER
Where VAL captures valuation effects related to exchange rate and asset price changes and the residual term OTHER captures other changes in the net foreign asset position due to reclassification, changes in coverage etc. For most countries, it is not possible to separately capture the VAL and X terms, so we can only examine the overall X term. We also assume that errors and omissions primarily reflect mismeasured financial flows, and hence we use in our empirical analysis the term SFA defined as
1 ( )t t t t tSFA NFA NFA CA KA
Figure 16 summarizes the bivariate relation between the current account gap in 2005-08 and subsequent adjustments in the net external position not due to flows. The relation is positive—on average, countries with more negative current account gaps tended to experience net gains on their net external position.
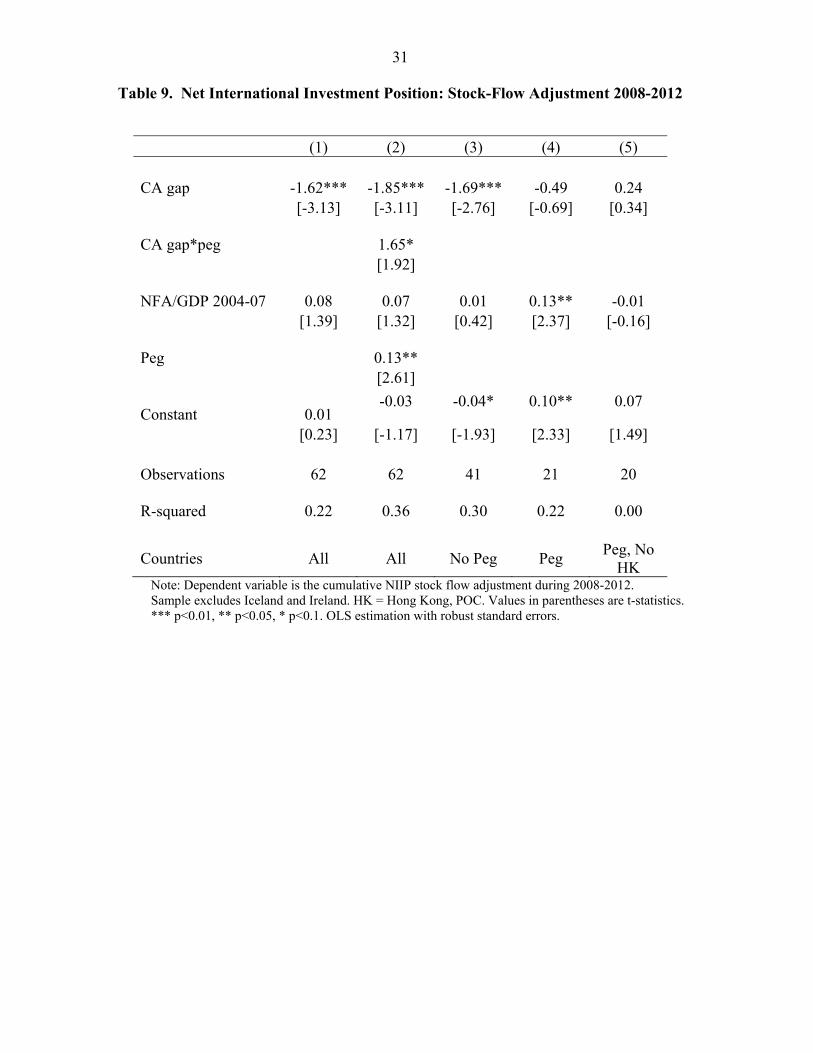
This relation is further investigated in Table 9, which shows the results for the various sample splits.15 The evidence from columns (1)-(3) is that the SFA term has moved in a stabilizing direction for the non-pegging sample but not for the pegging sample. That is, those non-pegging countries with the most negative current account gaps have experienced more positive SFA terms, helping external adjustment (the international investment position improved relative to what net external borrowing would have suggested). Finally, while column (4) indicates the SFA term moves in a destabilizing direction vis-à-vis the initial net foreign asset position for the peg sample, column (5) shows that this result is not robust to the exclusion of Hong Kong (a major financial center).16
15 The sample excludes Iceland and Ireland as extreme outliers. Lane (2012) analyses the behavior of the stock-flow adjustment term in Ireland during the crisis.
16 Measurement error is more likely to be a significant contributor to the SFA term for international financial centers, in view of the high ratios of gross foreign assets and liabilities to GDP.

17
For non-peggers, the favorable valuation effects may in part reflect exchange rate depreciation—to the extent that countries are “long” in foreign currency (having significant domestic-currency liabilities, such as portfolio equity and FDI, and foreign-currency assets), a depreciation will improve the net external position as a ratio of GDP. As shown in Table 4, real exchange rate changes for non-peggers were positively correlated with the current account gap, implying on average a depreciation for countries with excess deficits. But valuation effects may also reflect changes in asset prices more generally. To the extent that markets revised downwards their views on the prospects of (previously rapidly growing) current account deficit countries their stock market values and asset prices more generally would have underperformed during the crisis period relative to asset prices in countries with positive current account gaps. For peggers, the real exchange rate is actually negatively correlated with pre-crisis current account gaps, which in turn would imply that valuation effects would be “unfavorable” for countries with excess deficits. This can help explain the lack of evidence on a ‘stabilizing’ pattern for valuation changes in peggers. But, more generally, this is an interesting area for future research, probing more in detail the underlying mechanisms at play.
We have also examined the adjustment pattern in financial flows. As in our earlier work, we find that shifts in net debt flows account for the lion share in financial account adjustment, and that these shifts are strongly correlated with the pre-crisis current account gap (the results, not reported, are available from the authors). That debt flows experienced the largest shift is not too surprising, since the debt category also experienced the biggest surge in inflows to high-deficit countries during the pre-crisis period.
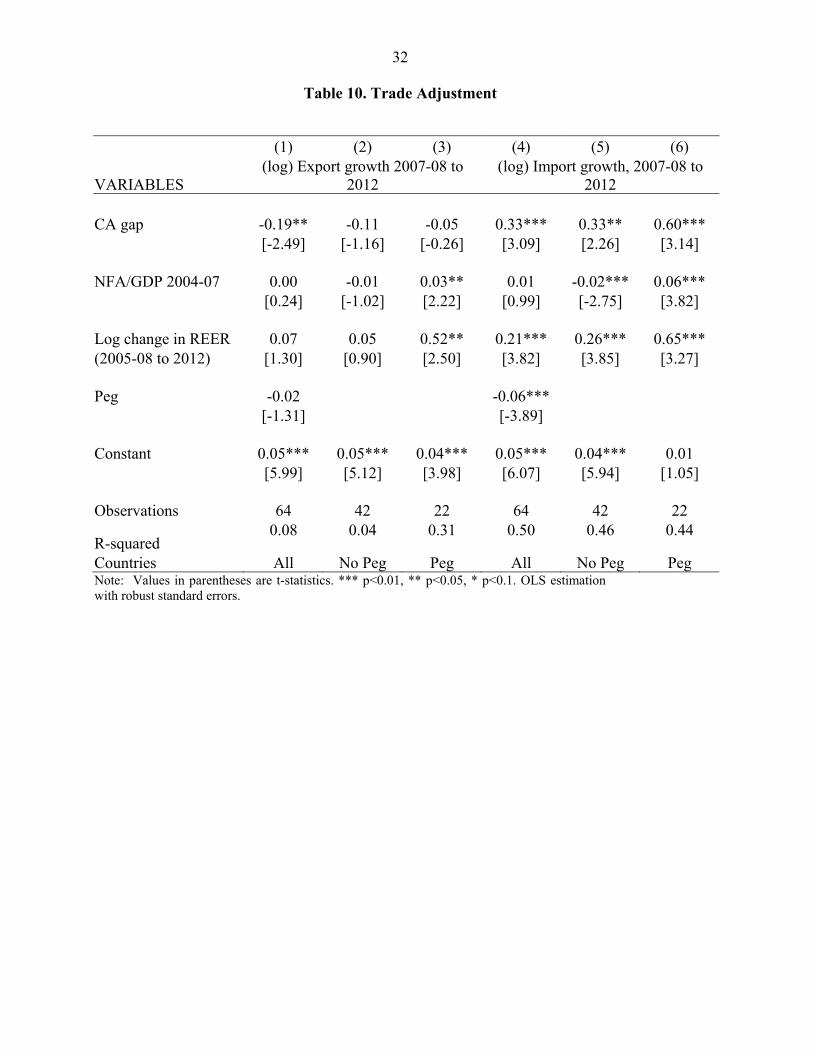
Finally, we analyze the components of the current account adjustment during the period 2005-08 to 2012. As shown in Figure 17, the lion share of changes in current account balances during this period is accounted for by changes in the balance on goods and services. Changes in the income balance are virtually uncorrelated with changes in the current account, and change in the size of current account transfers are large for only a very few countries relying on remittances. In light of this evidence, we focus on the growth rate of exports and import volumes in Table 10. For this purpose, we employ the specifications:
,0708 12 ,0508 ,2004 07 ,0508 12
,0708 12 ,0508 ,2004 07 ,0508 12
log( )
log( )i i i i i i
i i i i i i
EXPVOL CAGAP NFA REER PEG
IMPVOL CAGAP NFA REER PEG
where we consider the adjustment of trade volumes to the initial current account gap, the pre-crisis net foreign asset position, and the change in the real exchange rate over the sample period. We also run the regressions separately for our two exchange rate regime categories.
The trade adjustment patterns in Table 10 show that countries with a more negative current account gap experienced both faster export growth and slower import growth. However, the scale of import adjustment is twice as large as the scale of export adjustment vis-à-vis the current account gap term, which is consistent with the “expenditure reduction” mechanism in
18
narrowing an external deficit. More generally, the specification explains a sizable component of the cross-country variation in import growth, but a very modest share of export growth. There is a strong positive correlation between import growth and real exchange rate changes. Surprisingly, the correlation has the same sign for exports (countries with faster export growth experienced real appreciation) and is much larger and more significant for pegs. The economic and statistical significance of this result is driven by the Baltics, which (within the peg sample) experienced relatively fast export growth as well as a real appreciation.
Surprisingly, export performance post-crisis also appears to be very weakly correlated not just with pre-crisis imbalances but also with post-crisis output and import growth in trading partners, where the latter are identified on the basis of patterns of trade in goods.17 Addressing this puzzle is an important topic for future research. One conjecture is that for several countries the geographical distribution of gross exports could be weakly correlated with trade links on the basis of value added in exports, reflecting the importance of value chains.
V. CONCLUSIONS
This paper has documented the significant narrowing of current account global imbalances following the financial crisis of 2008, with projections suggesting a further compression in current account imbalances in the coming years. So is this the end of global imbalances? The evidence is not clear-cut: despite this compression, stock imbalances have continued to expand, both in relation to domestic GDP and global GDP. As of end-2012, four major creditor groups (European surplus countries; emerging Asia including China; Japan; and oil exporters) held a roughly comparable stock of net foreign assets, with three debtor groups (European deficit countries; the United States; and the rest of the world) accounting for a similar absolute level of net external liabilities. Absent large valuation changes favoring debtor countries or a further compression of current account imbalances, stock positions may well widen further in coming years.
In relation to the cross-country evidence on current account adjustment after the crisis confirms the patterns obtained in our earlier work—namely, current account balances have generally compressed in a way that narrows the gaps that emerged during the pre-crisis period. Furthermore, pre-crisis current account gaps and pre-crisis net external positions help explain an important part of subsequent cross-country differences in demand growth. Real exchange rates have moved in a stabilizing direction only for countries without exchange rate pegs, and only to a modest extent. External adjustment has involved very costly declines in demand in high deficit countries, with dramatic output declines relative to pre-crisis forecasts.
We have subsequently explored whether monetary policy changes during the crisis period are correlated with the size of initial imbalances. The answer is yes for countries without an exchange rate peg, where those with excess deficits have cut interest rates by more, but not so 17 Results available from the authors.
19
for pegs, a sample dominated by euro area countries where changes in the policy rate were of course common across surplus and deficit countries. Finally, we have provided some suggestive evidence that valuation changes have been in a ‘stabilizing’ direction—but only for countries without an exchange rate peg. This preliminary evidence is consistent with the evidence on exchange rate changes relative to the pre-crisis period and also with the expected pattern of changes in asset prices more generally.
We interpret this set of results as providing a new wave of evidence that the narrowing of large external imbalances can inflict considerable macroeconomic pain on deficit countries if it requires a sharp adjustment over a limited time horizon, especially (but not exclusively) for countries that lack monetary autonomy. From a global perspective, it reinforces the case to search for policy configurations that can make the adjustment process less costly (through some combination of less expenditure compression in deficit countries and faster demand growth in surplus countries). For individual countries, it also provides motivation for the examination of preventive policies that may curb excessive and persistent deficits.
20
References
Blanchard, Olivier and Gian Maria Milesi-Ferretti, 2010, “Global Imbalances: In Midstream,” in: Reconstructing the World Economy (edited by Il SaKong and Olivier Blanchard), Washington DC: International Monetary Fund.
Calvo, Guillermo, 1998, “Capital Flows and Capital Market Crises: The Simple Economics of
Sudden Stops,” Journal of Applied Economics 1 (1), pp. 35-54.
Calvo, Guillermo, Alejandro Izquierdo, and Luis Mejia, 2004, “On the Empirics of Sudden Stops,” Proceedings, Federal Reserve Bank of San Francisco, June.
Catao, Luis and Gian Maria Milesi-Ferretti, 2013, “External Liabilities and Crises,” IMF Working Paper No. 13/113.
Frankel, Jeffrey A. and George Saravelos, 2012, “Can Leading Indicators Assess Country
Vulnerability? Evidence from the 2008–09 Global Financial Crisis,” Journal of International Economics 87 (2), pp. 216-231.
Ghosh, Atish R., Jonathan D. Ostry and Charalambos G. Tsangarides, 2011, “Exchange Rate Regimes and the Stability of the International Monetary System,” International Monetary Fund Occasional Paper No. 270.
Gourinchas, Pierre-Olivier and Hélène Rey, 2013, “External Adjustment, Global Imbalances,
Valuation Effects,” forthcoming in Handbook of International Economics vol IV, edited by Gita Gopinath, Elhanan Helpman and Kenneth Rogoff, Elsevier. .
International Monetary Fund, 2013, “External Balance Assessment (EBA) Methodology: Technical Background,” mimeo, International Monetary Fund.
International Monetary Fund, 2014, World Economic Outlook, April. Klyuev, Vladimir and Joong Shik Kang, 2013, “The Mechanics of Global Rebalancing,”
mimeo, International Monetary Fund. Lane, Philip R., 2012, “The Dynamics of Ireland’s Net External Position,” Journal of the
Statistical and Social Inquiry Society of Ireland XLI, pp. 24-34. Lane, Philip R., 2013, “Financial Globalisation and the Crisis,” Open Economies Review 24(3),
pp. 555-580. Lane, Philip R. and Gian Maria Milesi-Ferretti, 2001, “The External Wealth of Nations:
Measures of Foreign Assets and Liabilities for Industrial and Developing Countries,” Journal of International Economics 55, pp. 263-294.
21
Lane, Philip R. and Gian Maria Milesi-Ferretti, 2007, “The External Wealth of Nations Mark II: Revised and Extended Estimates of Foreign Assets and Liabilities, 1970–2004,” Journal of International Economics 73, pp. 223-250.
Lane, Philip R. and Gian Maria Milesi-Ferretti, 2012, “External Adjustment and the Global
Crisis” Journal of International Economics 88 (2), pp. 252-265. Milesi-Ferretti, Gian Maria and Assaf Razin, 2000, “Current Account Reversals and Currency
Crises: Empirical Regularities,” in Currency Crises (edited by Paul Krugman), Chicago: University of Chicago Press for NBER.
Obstfeld, Maurice and Kenneth Rogoff, (2005), “Global current account imbalances and
exchange rate adjustments,” Brookings Papers on Economics Activity 1, 67–146. Obstfeld, Maurice and Kenneth Rogoff (2007), “The Unsustainable U.S. Current Account
Position Revisited,” in G7 Current Account Imbalances: Sustainability and Adjustment, edited by R. Clarida, Chicago: University of Chicago Press for NBER.
Rose, Andrew R., 2014, “Surprising Similarities: Recent Monetary Regimes of Small
Economies,” Journal of International Money and Finance, forthcoming. Rose, Andrew and Mark M. Spiegel, 2010, “Cross-Country Causes and Consequences of the
2008 Crisis: International Linkages and American Exposure,” Pacific Economic Review 15(3), pp. 340-63.
Rose, Andrew and Mark M. Spiegel, 2012, “The Causes and Consequences of the 2008 Crisis:
Early Warning,” Japan and the World Economy 24(1), pp. 1-16.
22
Appendix
A. Country samples for global imbalances
EUR surplus: Austria, Belgium, Denmark, Finland, Germany, Luxembourg, Netherlands, Sweden, Switzerland; EUR deficit: Greece, Ireland, Italy, Portugal, Spain, United Kingdom, Albania, Bosnia and Herzegovina, Belarus, Bulgaria, Croatia, Czech Republic, Estonia, Hungary, Kosovo, Latvia, Lithuania, Macedonia, Moldova, Montenegro, Poland, Romania, Serbia, Slovak Republic, Slovenia, Turkey, Ukraine; Emerging Asia (EMA): Hong Kong S.A.R. of China, Indonesia, Korea, Malaysia, Philippines, Singapore, Taiwan province of China, Thailand; Oil exporters (OIL): Algeria, Angola, Azerbaijan, Bahrain, Republic of Congo, Ecuador, Equatorial Guinea, Gabon, Iran, Kazakhstan, Kuwait, Libya, Nigeria, Norway, Oman, Qatar, Russia, Saudi Arabia, Sudan, Syria, Trinidad and Tobago, United Arab Emirates, Venezuela, Yemen; Rest of the world (ROW): remaining countries.
B. Country sample for current account regressions
Argentina; Australia; Austria; Belgium; Brazil; Bulgaria; Canada; Chile; China, People's Rep. of; Hong Kong, China; Colombia; Costa Rica; Croatia; Czech Republic; Denmark; Dominican Republic; El Salvador; Estonia; Finland; France; Germany; Greece; Guatemala; Hungary; Iceland; India; Indonesia; Ireland; Israel; Italy; Japan; Korea, Republic of; Latvia; Lithuania; Malaysia; Mexico; Morocco; Netherlands; New Zealand; Norway; Pakistan; Peru; Philippines; Poland; Portugal; Romania; Russian Federation; Serbia, Republic of; Singapore; Slovak Republic; Slovenia; South Africa; Spain; Sri Lanka; Sweden; Switzerland; Taiwan Prov. of China; Thailand; Tunisia; Turkey; Ukraine; United Kingdom; United States; and Uruguay.
C. Exchange Rate Regimes
Pegged: Austria; Belgium; Bulgaria; China,P.R.:Hong Kong; Croatia; Denmark; El Salvador; Estonia; Finland; France; Germany; Greece; Ireland; Italy; Latvia; Lithuania; Netherlands; Portugal; Slovak Republic; Slovenia; Spain; and Taiwan Prov.of China. Non-Pegged: Argentina; Australia; Brazil; Canada; Chile; China,P.R.: Mainland; Colombia; Costa Rica; Czech Republic; Dominican Republic; Guatemala; Hungary; Iceland; India; Indonesia; Israel; Japan; Korea, Republic of; Malaysia; Mexico; Morocco; New Zealand; Norway; Pakistan; Peru; Philippines; Poland; Romania; Russian Federation; Serbia, Republic of; Singapore; South Africa; Sri Lanka; Sweden; Switzerland; Thailand; Tunisia; Turkey; Ukraine; United Kingdom; United States; and Uruguay. Notes: “peg” refers to de facto exchange rate regime classification for the period 2005-08. Source: Ghosh et al. (2011) extended by the authors.”Baltics” include Estonia, Latvia, and Lithuania.
23
Table 1. Net external position (ratio of domestic GDP) 1/
1/ Net external position excludes gold holdings. See Appendix for definition of country groups.
2007 2012Oil exporters 50.3 55.7East Asia 27.5 26.1Europe surplus 22.4 44.3Japan 50.1 56.8US -14.4 -27.4Europe deficit -45.6 -51.7Rest of the world -23.5 -29.3
24
Table 2. Output gap in surplus and deficit countries
GDP in billions USD Output gap 2012 2013 2012 2013 United States 16,245 16,800 -4.3 -4.1 European deficit countries 8,810 9,091 -2.5 -2.9 ROW 15,764 16,155 -0.3 -0.7 Total debtors 40,819 42,046 -2.4 -2.6
China 8,229 9,181 -3.1 -3.5 Emerging Asia 3,951 4,122 0.2 -0.1 European Surplus countries 6,849 7,214 -0.5 -1.3 Japan 5,938 4,902 -3.1 -2.1 oil exporters 6,310 6,503 0.9 0.6 Total creditors 31,276 31,922 -1.3 -1.5
Note: output gap measure available only for a subset of oil exporters (gap assumed to be zero for the others).

25
Table 3. Current Account Adjustment between 2005-2008 and 2012
(1) (2) (3) (4) (5) (6) (7) CA gap -0.76*** -0.63*** -0.79*** -0.54*** -0.76*** -0.63*** -0.54*** [-8.51] [-6.46] [-5.40] [-6.71] [-4.61] [-6.38] [-6.61] CA gap*peg -0.16 -0.22 [-0.91] [-1.25] NFA/GDP 2004-07 -0.02* -0.01 -0.04** -0.01 -0.04** -0.01 -0.01 [-1.91] [-1.07] [-2.78] [-0.97] [-2.66] [-1.06] [-0.95] NFA/GDP*peg -0.03* -0.03* [-1.95] [-1.94] Peg 0.03*** 0.03*** [2.94] [3.12] Constant 0.00 -0.01 0.02** -0.01** 0.02** -0.01 -0.01** [0.89] [-1.44] [2.52] [-2.10] [2.42] [-1.42] [-2.07] Observations 64 42 22 41 19 64 60 R-squared 0.63 0.62 0.76 0.48 0.71 0.75 0.68
Countries All No Peg Peg No Peg; No ICE
Peg; No
Baltics All
All; No ICE; No Baltics
Note: Dependent variable is the change in current account to GDP between 2005-2008 (average) and 2012. Values in parentheses are t-statistics. ICE = Iceland. *** p<0.01, ** p<0.05, * p<0.1. OLS estimation with robust standard errors.

26
Table 4. Real Exchange Rate between 2005-2008 and 2012
(1) (2) (3) (4) (5) (6) (7) CA gap 0.46 0.74* -0.62*** 0.28 -0.53*** 0.74* 0.28 [1.29] [1.74] [-8.36] [0.90] [-4.44] [1.72] [0.88] CA gap*peg -1.36*** -0.81** [-3.12] [-2.38] NFA/GDP 2004-07 0.00 0.05*** -0.03*** 0.04*** -0.03*** 0.05*** 0.04*** [0.12] [3.26] [-4.44] [3.26] [-3.72] [3.22] [3.21] NFA/GDP*peg -0.08*** -0.07*** [-4.81] [-4.63] Peg -0.07*** -0.08*** [-3.13] [-3.88] Constant 0.02 0.04* -0.03*** 0.05** -0.03*** 0.04* 0.05** [1.25] [1.92] [-3.56] [2.60] [-3.57] [1.89] [2.57] Observations 64 42 22 41 19 64 60 R-squared 0.05 0.18 0.55 0.07 0.46 0.25 0.19
Countries All No Peg Peg No Peg; No ICE
Peg; No Baltics
All All; No ICE; No Baltics
Note: Dependent variable is the change in real effective exchange rate between 2005-2008 (average) and 2012. Values in parentheses are t-statistics. ICE = Iceland. *** p<0.01, ** p<0.05, * p<0.1. OLS estimation with robust standard errors.
27
Table 5. Change in Demand and Output between 2007-2008 and 2012
(1) (2) (3) (4) (5) (6) VARIABLES Domestic demand Output CA gap 1.69*** 1.51*** 0.79* 0.98*** 0.92*** 0.15 [6.45] [4.96] [2.08] [4.50] [3.84] [0.58] NFA/GDP 2004-07 0.04** 0.01 0.10***
0.02 0.00 0.07*** [2.05] [0.26] [7.24] [1.61] [0.02] [3.65] Constant 0.06*** 0.11*** -0.05***
0.07*** 0.11*** -0.01 [3.77] [6.80] [-4.00] [5.97] [7.63] [-0.72] Observations 64 42 22
64 42 22
R-squared 0.38 0.36 0.66
0.24 0.22 0.45
Countries All No Peg Peg
All No Peg Peg
Note: Dependent variable in columns (1)-(3) is the change in total domestic demand between 2007-2008 and 2012; and change in real GDP between 2007-2008 and 2012 in columns (4)-(6). Values in parentheses are t-statistics. *** p<0.01, ** p<0.05, * p<0.1. OLS estimation with robust standard errors.
28
Table 6. Policy Rates for 2005-2008 vs. 2009-2012
(1) (2) (3) (4) (5) (6) CA gap 0.12*** 0.18*** 0.18*** 0.01 0.14* 0.06** [2.75] [2.93] [2.88] [0.22] [1.78] [2.22] CA gap*peg -0.17**
[-2.21] NFA/GDP 2004-07 0.00 0.00 0.00 -0.00 0.00 0.00 [0.47] [0.59] [0.64] [-0.17] [0.59] [0.61] Peg 0.00 [0.25] Constant -0.02*** -0.02*** -0.02*** -0.02*** -0.02*** -0.02*** [-7.68] [-5.04] [-5.01] [-15.40] [-4.27] [-18.75] Observations 63 63 41 22 40 19 R-squared 0.09 0.14 0.14 0.01 0.07 0.31
Countries All All No Peg Peg No Peg; No ICE
Peg; No
Baltics Note: Dependent variable is the change in policy rate between the average for 2009-12 and average for 2005-08. Sample excludes Serbia. Values in parentheses are t-statistics. ICE = Iceland. *** p<0.01, ** p<0.05, * p<0.1. OLS estimation with robust standard errors.
29
Table 7. Inflation Adjustment
(1) (2) (3) (4) (5) (6) CA gap 0.10* 0.03 0.03 0.26*** 0.07 0.19***
[1.86] [0.66] [0.72] [3.89] [1.42] [3.35] CA gap*peg 0.24***
[3.07] NFA/GDP 2004-07 0.01** 0.00 0.00 0.01 0.00 0.00
[2.12] [1.64] [0.95] [1.44] [1.09] [1.19] Peg 0.00
[0.59] Constant -0.01*** -0.01*** -0.01*** -0.01*** -0.01*** -0.01***
[-5.59] [-3.71] [-3.91] [-3.93] [-4.06] [-3.74]
Observations 64 64 42 22 41 19 R-squared 0.10 0.17 0.02 0.59 0.03 0.54
Countries All All No Peg Peg No Peg; No ICE
Peg; No
Baltics Note: Dependent variable refers to the change in inflation between the average for 2009-12 and average for 2005-08. Values in parentheses are t-statistics. ICE = Iceland. *** p<0.01, ** p<0.05, * p<0.1. OLS estimation with robust standard errors.
30
Table 8. Fiscal Adjustment
(1) (2) (3) (4) VARIABLES Change in structural fiscal balance, 2005-08 to 2012 CA gap -0.04 0.02 -0.08 0.02
[-0.71] [0.38] [-0.61] [0.45] CA gap * peg -0.11
[-0.76] NFA/GDP 2004-07 -0.00 -0.00 -0.00 -0.00
[-0.32] [-0.21] [-0.42] [-0.45] Peg 0.01
[1.43] Constant -0.01*** -0.02*** -0.01 -0.02***
[-3.39] [-4.15] [-0.79] [-4.08]
Observations 62 40 22 62 R-squared 0.01 0.00 0.03 0.06 Countries All No Peg Peg All
Note: Dependent variable is the change in general government structural balance as percent of potential GDP between 2005-2008 (average) and 2012). Sample excludes Pakistan and Sri Lanka for data availability reasons. Values in parentheses are t-statistics. *** p<0.01, ** p<0.05, * p<0.1. OLS estimation with robust standard errors.
31
Table 9. Net International Investment Position: Stock-Flow Adjustment 2008-2012
(1) (2) (3) (4) (5) CA gap -1.62*** -1.85*** -1.69*** -0.49 0.24 [-3.13] [-3.11] [-2.76] [-0.69] [0.34] CA gap*peg 1.65* [1.92] NFA/GDP 2004-07 0.08 0.07 0.01 0.13** -0.01 [1.39] [1.32] [0.42] [2.37] [-0.16] Peg 0.13** [2.61] Constant 0.01
-0.03 -0.04* 0.10** 0.07
[0.23] [-1.17] [-1.93] [2.33] [1.49] Observations 62 62 41 21 20 R-squared 0.22 0.36 0.30 0.22 0.00
Countries All All No Peg Peg Peg, No
HK Note: Dependent variable is the cumulative NIIP stock flow adjustment during 2008-2012. Sample excludes Iceland and Ireland. HK = Hong Kong, POC. Values in parentheses are t-statistics. *** p<0.01, ** p<0.05, * p<0.1. OLS estimation with robust standard errors.
32
Table 10. Trade Adjustment
(1) (2) (3) (4) (5) (6)
VARIABLES (log) Export growth 2007-08 to
2012 (log) Import growth, 2007-08 to
2012 CA gap -0.19** -0.11 -0.05 0.33*** 0.33** 0.60***
[-2.49] [-1.16] [-0.26] [3.09] [2.26] [3.14] NFA/GDP 2004-07 0.00 -0.01 0.03** 0.01 -0.02*** 0.06***
[0.24] [-1.02] [2.22] [0.99] [-2.75] [3.82] Log change in REER 0.07 0.05 0.52** 0.21*** 0.26*** 0.65*** (2005-08 to 2012) [1.30] [0.90] [2.50] [3.82] [3.85] [3.27] Peg -0.02 -0.06***
[-1.31] [-3.89] Constant 0.05*** 0.05*** 0.04*** 0.05*** 0.04*** 0.01
[5.99] [5.12] [3.98] [6.07] [5.94] [1.05]
Observations 64 42 22 64 42 22
R-squared 0.08 0.04 0.31 0.50 0.46 0.44
Countries All No Peg Peg All No Peg Peg Note: Values in parentheses are t-statistics. *** p<0.01, ** p<0.05, * p<0.1. OLS estimation with robust standard errors.
33
Figure 1. Global imbalances (in percent of world GDP)
Note: see Appendix for definition of country groups.
Figure 2. Global dispersion of current account balances, 1970-2012
Note: red line depicts the global sum of absolute values of CA balances divided by world GDP. Blue line depicts the median CA/GDP ratio in absolute terms.
-3
-2
-1
0
1
2
3
2000 2001 2002 2003 2004 2005 2006 2007 2008 2009 2010 2011 2012 2013
Global Imbalances(percent of world GDP)
US JPN Eur surplus CHN EMA OIL ROW Eur deficit Discrepancy
0%
1%
2%
3%
4%
5%
6%
7%
8%
9%
10%
1970 1975 1980 1985 1990 1995 2000 2005 2010
Global dispersion of current account balances
Absolute CA / world GDP
Median absolute CA/GDP
34
Figure 3. Net foreign asset positions
Note: see Appendix for definition of country groups.
Figure 4. Dispersion of net foreign asset positions
Source: Lane and Milesi-Ferretti, External Wealth of Nations database.
-25
-20
-15
-10
-5
0
5
10
15
20
2000 2001 2002 2003 2004 2005 2006 2007 2008 2009 2010 2011 2012
US JPN Eur surplus CHN EMA OIL ROW Eur deficit Discrepancy
Net foreign assets (in percent of world GDP)
0%
10%
20%
30%
40%
50%
60%
1970 1975 1980 1985 1990 1995 2000 2005 2010
Global dispersion of NFA positions
Absolute values of world NFA / world GDPMedian absolute NFA/GDP

35
Figure 5. Global imbalances: projections
Current account
Net foreign assets
Note: see Appendix for definition of country groups.
-3
-2
-1
0
1
2
3
4
2000 2003 2006 2009 2012 2015 2018
Global Imbalances(percent of world GDP)
US JPN Eur surplus CHN EMA OIL ROW Eur deficit Discrepancy
WEO projections
-25
-20
-15
-10
-5
0
5
10
15
20
25
30
2004 2005 2006 2007 2008 2009 2010 2011 2012 2013 2014 2015 2016 2017 2018 2019
US JPN Eur surplus CHN EMA OIL ROW Eur deficit Discrepancy
WEO projectionsNet foreign assets (in percent of world GDP)
36
Figure 6. Current account balances in Latin America (ratio of GDP)
Note: Sum of current account balances divided by regional GDP. Oil exporters include Ecuador, Trinidad and Tobago, and Venezuela. Source: World Economic Outlook, April 2014.
Figure 7. Latin America and Caribbean: Net Foreign Assets and their Composition, 1980-2012
Source: Lane and Milesi-Ferretti, External Wealth of Nations database.
-8%
-6%
-4%
-2%
0%
2%
1980 1985 1990 1995 2000 2005 2010
All
excl oil exporters
-60%
-50%
-40%
-30%
-20%
-10%
0%
10%
20%
1980 1985 1990 1995 2000 2005 2010
FX Reserves Net derivatives
Net debt excl. FX Res Net FDI
Net portfolio equity NFA
Latin America and Caribbean: net foreign assets(ratio of GDP)

37
Figure 8. Net Foreign Asset Position, Central America and the Caribbean (in percent of regional GDP)
Note: Sum of countries’ net foreign asset position divided by regional GDP. Central America includes Costa Rica, Dominican Republic, El Salvador, Guatemala, Haiti, Honduras, Nicaragua, and Panama. Caribbean includes Antigua and Barbuda, Anguilla, Aruba, Dominica, Grenada, Guyana, Belize, Jamaica, Montserrat, Sint Maarten, St. Kitts and Nevis, St. Lucia, St. Vincent & Grenadines, Suriname, Trinidad and Tobago. Source: Lane and Milesi-Ferretti, External Wealth of Nations database.
-120%
-100%
-80%
-60%
-40%
-20%
0%
1980 1983 1986 1989 1992 1995 1998 2001 2004 2007 2010
Central America
Caribbean
38
Figure 9. Latin America and Caribbean: actual and projected net foreign asset position (in percent of regional GDP)
Note: shaded area reports projections of the net foreign asset position (NFA) based on the current account projections reported in the Spring 2014 World Economic Outlook. The projections assume that NFA(t+1)=NFA(t)+CA(t+1), with all variables expressed in current US dollars. Oil exporters include Ecuador, Trinidad and Tobago, and Venezuela.
-50%
-40%
-30%
-20%
-10%
0%
2000 2003 2006 2009 2012 2015 2018
TotalExcluding oil exporters
39
Figure 10. Current Account Adjustment and Current Account Gap
Note: Vertical axis is change in current account balance (2012 value minus average value for 2005-2008).
ARG
AUS
AUTBELBRA
BLG
CAN CHLCHN
HKG
COL
CRI
CRO
CZE
DEN
DRELS
EST
FIN
FRA
GER
GRE
GTM
HUN
ICE
INDIDN
IRE
ISR
ITA
JPN
KOR
LVA
LIT
MYS
MEX
MOR
NLDNZE
NOR
PAK
PER
PHLPOL
PRTROM
RUS
SER
SGP
SVKSLV
SAF
ESP
SLK SWE
SWITAI
THA
TUN
TUR
UKR
UK
US
URU
-.2
-.1
0.1
.2ch
ang
e in
CA
ba
lan
ce 2
005
-08
vs.
20
12
-.2 -.1 0 .1 .2current account GAP 2005-08
40
Figure 11a. Real Exchange Rate and Current Account Balance Changes: No Peg
Figure 11b. Real Exchange Rate and Current Account Balance Changes: Peg
Note: The horizontal axis measures the log change in real effective exchange rate between 2005-08 and 2012, while the vertical axis measures the change in the CA/GDP ratio between 2005-08 and 2012.
ARG
AUS
BRA
CANCHL
CHN
COL
CRI
CZEDR
GTM
HUN
ICE
INDIDNISR
JPN
KOR
MYS
MEX
MOR
NZE
NOR
PAK
PER
PHLPOL
ROM
RUS
SER
SGP
SAFSLKSWE
SWI
THA
TUN
TUR
UKR
UK
US
URU
-.1
-.05
0.0
5.1
.15
cha
nge
in C
A b
ala
nce
20
05-0
8 v
s. 2
012
-.4 -.2 0 .2 .4change in RER 2005-08 vs. 2012
AUTBEL
BLG
HKG
CRO
DEN
ELS
EST
FIN
FRA
GER
GRE
IRE
ITA
LVA
LIT
NLD
PRT SVK
SLVESP
TAI
-.1
0.1
.2ch
ang
e in
CA
ba
lan
ce 2
005
-08
vs.
20
12
-.1 -.05 0 .05 .1 .15change in RER 2005-08 vs. 2012
41
Figure 12a. Change in Real Domestic Demand and Change in Current Account Balance
Note: The horizontal axis measures the log change in real domestic demand between 2007-08 and 2012, while the vertical axis measures the change in the CA/GDP ratio between 2005-08 and 2012.
Figure 12b. Change in Real GDP and Change in Current Account Balance
Note: The horizontal axis measures the log change in real GDP 2007-08 and 2012, while the vertical axis measures the change in the CA/GDP ratio between 2005-08 and 2012.
ARG
AUS
AUTBELBRA
BLG
CANCHL
CHN
HKG
COL
CRI
CRO
CZE
DEN
DR
ELS
EST
FIN
FRA
GER
GRE
GTM
HUN
ICE
INDIDN
IRE
ISR
ITA
JPN
KOR
LVA
LIT
MYS
MEX
MOR
NLD
NZE
NOR
PAK
PER
PHLPOL
PRTROM
RUS
SER
SGP
SVK
SLV
SAF
ESP
SLKSWE
SWITAI
THA
TUN
TUR
UKR
UK
US
URU
-.1
0.1
.2ch
ang
e in
CA
ba
lan
ce 2
005
-08
vs.
2012
-.4 -.2 0 .2 .4change in real domestic demand 2007-08 vs. 2012
ARG
AUS
AUTBEL BRA
BLG
CAN CHL
CHN
HKG
COL
CRI
CRO
CZE
DEN
DRELS
EST
FIN
FRAGER
GRE
GTM
HUN
ICE
INDIDN
IRE
ISR
ITA
JPN
KOR
LVA
LIT
MYS
MEX
MOR
NLD NZE
NOR
PAK
PERPHL
POL
PRTROM
RUS
SER
SGP
SVKSLV
SAF
ESP
SLK
SWE
SWI
TAI
THA
TUN
TUR
UKRUK
US
URU
-.1
0.1
.2.3
cha
nge
in C
A b
alan
ce 2
005-
08
vs. 2
012
-.2 0 .2 .4change in real GDP 2007-08 vs. 2012

42
Figure 13. Policy Rate Adjustment and the Current Account Gap
Note: Vertical axis is change in policy interest rate (2009-2012 average value minus 2005-2008 average value). Sample excludes Serbia.
Figure 14. Inflation Adjustment and the Current Account Gap
Note: Vertical axis is change in inflation rate (2009-2012 average value minus 2005-2008 average value).
US
UK
AUTBELDEN
FRA GERITA NLD
NOR
SWESWI
CAN
JPN
FINGRE
ICE
IREPRTESP
TUR
AUS
NZE
SAF
ARG
BRA
CHL
COL
CRI
DR
ELSGTM
MEX
PER
URU
ISR
SLK
TAI
HKG
IND
IDNKOR
MYS
PAK
PHL
SGPTHA
MOR
TUN
BLG
RUS
CHN
UKR
CZESVK
ESTLVA
SER
HUN
LIT
CRO
SLV
POLROM
-.1
-.0
50
.05
cha
nge
in p
olic
yra
te 0
508
-09
12
-.2 -.1 0 .1 .2current account gap 2005-08
US
UK
AUTBEL
DENFRA GERITA
NLDNOR
SWESWI
CANJPN
FIN
GREICE
IRE
PRT
ESPTUR
AUSNZESAF
ARG
BRA
CHLCOL
CRI
DRELS
GTM
MEX PERURU ISR
SLK
TAI
HKG
IND
IDN
KOR
MYS
PAK
PHL
SGP
THAMOR
TUN
BLG
RUS
CHN
UKR
CZESVK
EST
LVA
SER
HUN
LIT
CROSLV
POL
ROM
-.1
-.0
50
.05
cha
nge
in in
flatio
n 0
508
-09
12
-.2 -.1 0 .1 .2current account gap 2005-08
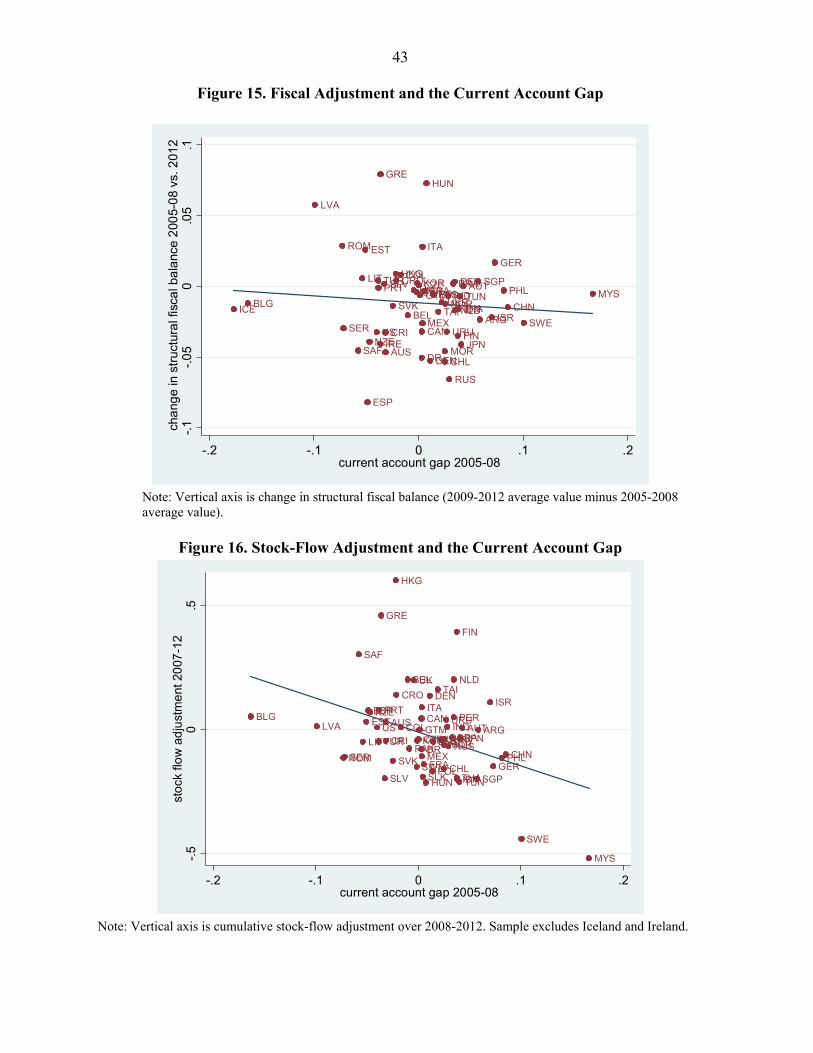
43
Figure 15. Fiscal Adjustment and the Current Account Gap
Note: Vertical axis is change in structural fiscal balance (2009-2012 average value minus 2005-2008 average value).
Figure 16. Stock-Flow Adjustment and the Current Account Gap
Note: Vertical axis is cumulative stock-flow adjustment over 2008-2012. Sample excludes Iceland and Ireland.
US
UK AUT
BEL
DEN
FRA
GER
ITA
NLDNOR
SWE
SWI
CANJPN
FIN
GRE
ICE
IRE
PRT
ESP
TUR
AUSNZE
SAF
ARG
BRA
CHL
COL
CRI
DR
ELSGTM
MEX
PER
URU
ISRTAI
HKG
INDIDN
KORMYSPHL
SGP
THA
MOR
TUNBLG
RUS
CHNUKR
CZE
SVK
EST
LVA
SER
HUN
LIT CROSLVPOL
ROM
-.1
-.0
50
.05
.1ch
ang
e in
str
uctu
ral f
isca
l ba
lanc
e 2
005-
08
vs. 2
012
-.2 -.1 0 .1 .2current account gap 2005-08
US
UK
AUT
BEL
DEN
FRA GER
ITA
NLD
NOR
SWE
SWI
CAN
JPN
FIN
GRE
PRTESP
TUR
AUSNZE
SAF
ARGBRA
CHL
COLCRI
DRELS
GTM
MEX
PERURU
ISR
SLK
TAI
HKG
IND
IDN
KOR
MYS
PAKPHL
SGPTHA
MOR
TUN
BLG
RUSCHN
UKRCZE
SVK
ESTLVA
SER
HUN
LIT
CRO
SLVPOL
ROM
-.5
0.5
sto
ck fl
ow
ad
just
me
nt 2
007
-12
-.2 -.1 0 .1 .2current account gap 2005-08
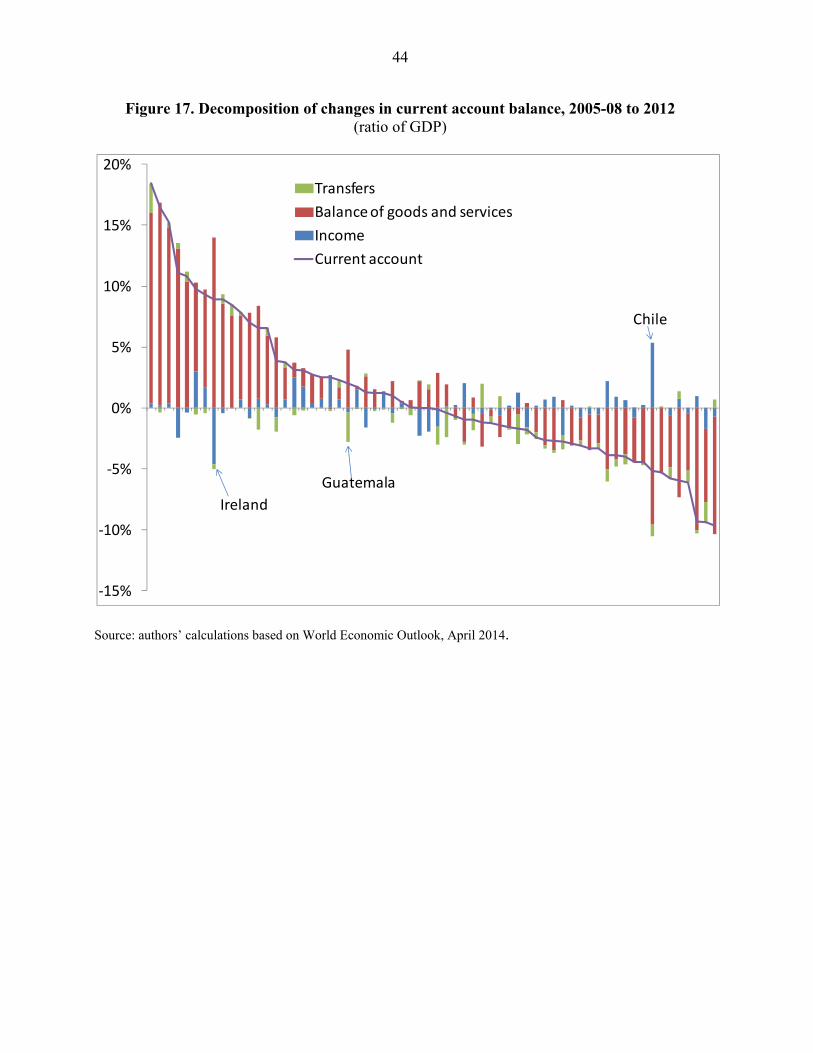
44
Figure 17. Decomposition of changes in current account balance, 2005-08 to 2012
(ratio of GDP)
Source: authors’ calculations based on World Economic Outlook, April 2014.
-15%
-10%
-5%
0%
5%
10%
15%
20%
Transfers
Balance of goods and services
Income
Current account
Ireland
Chile
Guatemala