Global Housing and Mortgage Outlook – 2020
39
Global Housing and Mortgage Outlook – 2020 Subdued Home Price Growth Despite Low Rates www.fitchratings.com | December 2019
Transcript of Global Housing and Mortgage Outlook – 2020

Global Housing and Mortgage Outlook – 2020Subdued Home Price Growth Despite Low Rates
www.fitchratings.com | December 2019

www.fitchratings.com
Contents03 MainContacts
04 GlobalHighlights
06 MarketForecasts
07 North America
08 Europe
09 Asia-Pacific
10 Latin America
11 United States
12 Canada
13 United Kingdom
14 Germany
15 The Netherlands
16 France
17 Belgium
18 Denmark
19 Sweden
20 Norway
21 Ireland
22 Spain
23 Italy
24 Portugal
25 Greece
26 Australia
27 China
28 Japan
29 South Korea
30 New Zealand
31 Singapore
32 Brazil
33 Mexico
34 Colombia
Regions
Countries
35 MacroIndicators
36 Contacts
GLOBAL HOUSING AND MORTGAGE OUTLOOK – 2020
2 December 2019
07 North America
08 Europe
09 Asia-Pacific
10 Latin America
11 United States
12 Canada
13 United Kingdom
14 Germany
15 The Netherlands
16 France
17 Belgium
18 Denmark
19 Sweden
20 Norway
21 Ireland
22 Spain
23 Italy
24 Portugal
25 Greece
26 Australia
27 China
28 Japan
29 South Korea
30 New Zealand
31 Singapore
32 Brazil
33 Mexico
34 Colombia

GLOBAL HOUSING AND MORTGAGE OUTLOOK – 2020
3 December 2019www.fitchratings.com
Main Contacts
Full contact list is on page36 and page37.
SUZANNE ALBERS
+44 20 3530 [email protected]
GEIRBRUST
+44 20 3530 [email protected]
MICHELECUNEO
+39 02 879087 [email protected]
DANIELADIFILIPPO
+39 02 879087 [email protected]
ALLASIROTIC | NorthAmerica
+1 212 908 [email protected]
ALESSANDROPIGHI | Europe
+44 20 3530 [email protected]
JUANPABLOGIL | LatinAmerica
+56 2 2499 [email protected]
BEN McCARTHY | Asia-Pacific
+61 2 8256 [email protected]
VICTORIAMITTENS
+44 20 3530 [email protected]

GLOBAL HOUSING AND MORTGAGE OUTLOOK – 2020
4 December 2019www.fitchratings.com
0102030405060
406080
100120140160
2000 2004 2009 2014 2019*
Household Debt-to-GDP RatioAs % of GDP (local currency)
Australia Canada DenmarkNetherlands New Zealand NorwaySouth Korea China (RHS)
Note: 2019 data up to 1Q.Source: BIS, Haver Analytics
Weak Home Price GrowthFitch Ratings forecasts subdued home price growth in 2020-2021 due to stretched affordability, more challenging economic growth prospects and macro-prudential measures restricting mortgage eligibility. This is despite falling or very low mortgage rates, insufficient supply in major cities and stable or improved employment levels in most countries.
We expect a nominal price fall only in Italy and Japan, due to Italy’s sluggish economy and Japan’s post-Olympics hangover. We forecast accelerating nominal and real home price growth in Australia, as prices recover from recent falls, as well as in Colombia, New Zealand, Sweden and Brazil (with Brazilian real home price growth still negative). Slowing or flat nominal price growth is common elsewhere and there are several countries where we forecast a decline in real prices (Brazil, Canada, China and the UK).
Mixed Impact from Persistent Low RatesFlat or falling policy rates contribute to our forecasts of low arrears levels for most countries. However, we also have concerns about long-term low rates. Under a market stress, the limited scope for further policy rate cuts would mean that home prices would not benefit from substantial rate cuts as per recent downturns. Home prices in some major cities are likely to continue or start to overheat if low rates and quantitative easing prompt higher demand than new supply.
Lenders are also struggling to originate the volumes needed to defend profits, which has led to higher loan-to-values (LTVs) and longer maturities being offered in several European countries. Finally, high household debt levels, which are more sustainable in periods of low rates, remain in several countries like Australia, Canada, Denmark, the Netherlands and Norway, making economies more exposed to shocks and borrowers more exposed to downturns.
Political Risk Weighs on Housing OutlooksLingering US-China trade uncertainty, despite the recent easing in tensions, and China’s de-risking drive continue to weigh on global and national growth prospects (see Global Economic Outlook) for the US and China but also for their closest trading partners (such as Australia and Canada) and areas like the EU and Latin America that are exposed to global trade. Weaker economic growth is a driver of more modest home price growth forecasts in most affected markets.
UK home price growth will continue to be affected by lingering trade ‘cliff edge’ risks until the new UK-EU relationship is negotiated. Although the newly elected Conservative government is expected to pursue a formal exit next month, there is more uncertainty about its ability to negotiate a UK-EU Free Trade Agreement by the end of 2020.
In some countries, government involvement around mortgage and housing policy is changing. The US and Canada are decreasing the government’s role in mortgage funding while in Mexico and Colombia, new national housing plans may increase government participation.
Long-term Challenges from Secular Shifts Climate change will permanently affect housing demand in areas that are already or could become more exposed to natural disasters, if they fail to attract new buyers or affordable insurance. Population redistribution to cities will continue, which will support cities’ higher price dynamism, but ageing populations and developments in remote working and autonomous vehicles are likely to also drive regional prices. If unresolved political issues, such as independence and anti-EU movements erupt, Brexit-like movements would be expected in more markets, while the push towards ESG investments may change housing investment and mortgage funding (see report on Fitch Ratings ESG relevance scores).
6080
100120140160180200220
2008 2010 2013 2016 2019 2021f
US CanadaAustralia¹ China²Japan Colombia (Real HP)UK Italy
Nominal Home Price Indices
1 Eight capital cities in Australia2 Tier 1 cities in China: Beijing, Shanghai, Guangzhou and ShenzhenNote: Forecasts of 4Q19 and later included for all countries. Source: Fitch Ratings,Scenari Immobiliari, HM Land Registry, NBS China, CoreLogic, S&P/Case-Shiller, CBA, Statistic Japan, DANE, Haver Analytics
Global Highlights

www.fitchratings.com
GLOBAL HOUSING AND MORTGAGE OUTLOOK – 2020
5 December 2019
Global Housing and Mortgage Outlook – 2020Position in Home Price Cycle and Typical Market Characteristics
Pricesbottomingout
Acceleratingpricerises
Pricesfallin
g
Home purchase affordability
concerns
Lending restrictions
Cut incentives for home
ownership
Home sales increasing
New lending increasing
Arrears reducing
Stimulate construction
New lending
recovering
Mortgage performance
stabilising
Enforcement process reform
Lending and home purchases
encouraged
Arrears rising
Mortgage stock shrinking
Enforcements increasing
Unwind market cooling
measures
Strong or improving mortgage
performance
Slowingpricerises
Global Housing and Mortgage Outlook – 2020Position in Home Price Cycle and Typical Market Characteristics
www.fitchratings.com
GLOBAL HOUSING AND MORTGAGE OUTLOOK – 2020
6 December 2019www.fitchratings.com
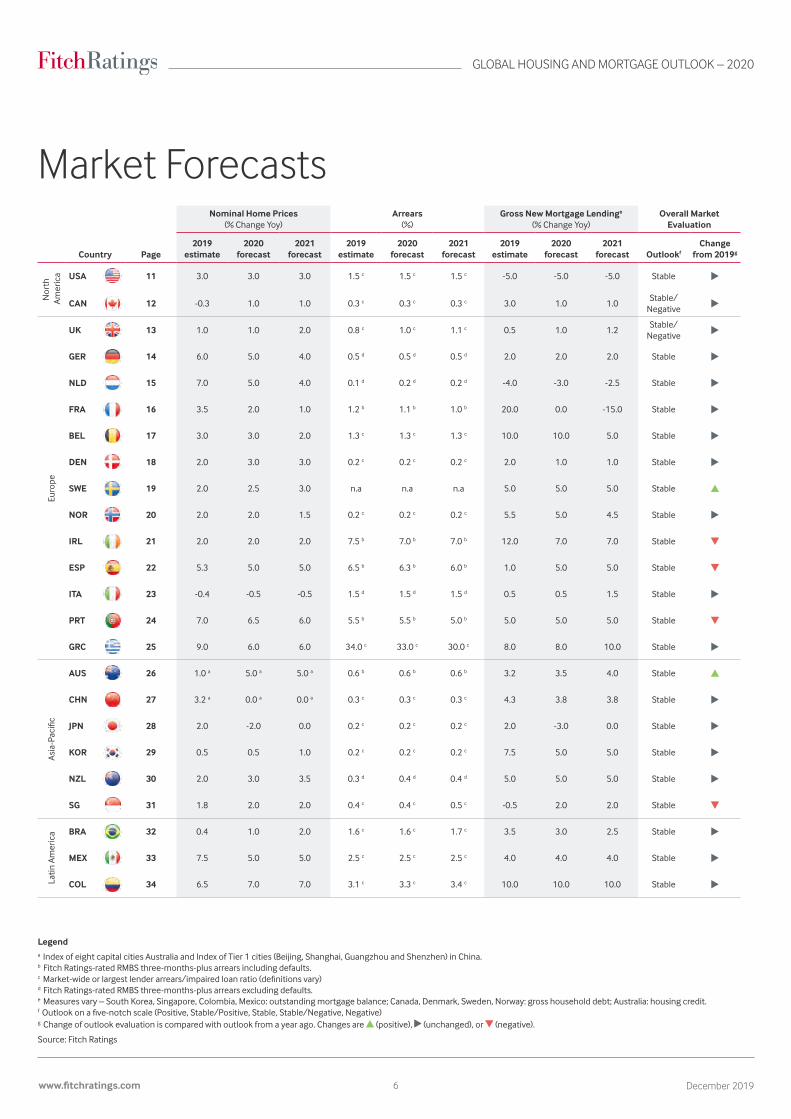
Country Page
NominalHomePrices(% Change Yoy)
Arrears(%)
GrossNewMortgageLendinge
(% Change Yoy)OverallMarketEvaluation
2019 estimate
2020 forecast
2021 forecast
2019 estimate
2020 forecast
2021 forecast
2019 estimate
2020 forecast
2021 forecast Outlookf
Changefrom2019g
Nor
th A
mer
ica USA 11 3.0 3.0 3.0 1.5 c 1.5 c 1.5 c -5.0 -5.0 -5.0 Stable
CAN 12 -0.3 1.0 1.0 0.3 c 0.3 c 0.3 c 3.0 1.0 1.0Stable/
Negative
Euro
pe
UK 13 1.0 1.0 2.0 0.8 c 1.0 c 1.1 c 0.5 1.0 1.2Stable/
Negative
GER 14 6.0 5.0 4.0 0.5 d 0.5 d 0.5 d 2.0 2.0 2.0 Stable
NLD 15 7.0 5.0 4.0 0.1 d 0.2 d 0.2 d -4.0 -3.0 -2.5 Stable
FRA 16 3.5 2.0 1.0 1.2 b 1.1 b 1.0 b 20.0 0.0 -15.0 Stable
BEL 17 3.0 3.0 2.0 1.3 c 1.3 c 1.3 c 10.0 10.0 5.0 Stable
DEN 18 2.0 3.0 3.0 0.2 c 0.2 c 0.2 c 2.0 1.0 1.0 Stable
SWE 19 2.0 2.5 3.0 n.a n.a n.a 5.0 5.0 5.0 Stable
NOR 20 2.0 2.0 1.5 0.2 c 0.2 c 0.2 c 5.5 5.0 4.5 Stable
IRL 21 2.0 2.0 2.0 7.5 b 7.0 b 7.0 b 12.0 7.0 7.0 Stable
ESP 22 5.3 5.0 5.0 6.5 b 6.3 b 6.0 b 1.0 5.0 5.0 Stable
ITA 23 -0.4 -0.5 -0.5 1.5 d 1.5 d 1.5 d 0.5 0.5 1.5 Stable
PRT 24 7.0 6.5 6.0 5.5 b 5.5 b 5.0 b 5.0 5.0 5.0 Stable
GRC 25 9.0 6.0 6.0 34.0 c 33.0 c 30.0 c 8.0 8.0 10.0 Stable
Asia-Pacific
AUS 26 1.0 a 5.0 a 5.0 a 0.6 b 0.6 b 0.6 b 3.2 3.5 4.0 Stable
CHN 27 3.2 a 0.0 a 0.0 a 0.3 c 0.3 c 0.3 c 4.3 3.8 3.8 Stable
JPN 28 2.0 -2.0 0.0 0.2 c 0.2 c 0.2 c 2.0 -3.0 0.0 Stable
KOR 29 0.5 0.5 1.0 0.2 c 0.2 c 0.2 c 7.5 5.0 5.0 Stable
NZL 30 2.0 3.0 3.5 0.3 d 0.4 d 0.4 d 5.0 5.0 5.0 Stable
SG 31 1.8 2.0 2.0 0.4 c 0.4 c 0.5 c -0.5 2.0 2.0 Stable
Latin
Am
eric
a BRA 32 0.4 1.0 2.0 1.6 c 1.6 c 1.7 c 3.5 3.0 2.5 Stable
MEX 33 7.5 5.0 5.0 2.5 c 2.5 c 2.5 c 4.0 4.0 4.0 Stable
COL 34 6.5 7.0 7.0 3.1 c 3.3 c 3.4 c 10.0 10.0 10.0 Stable
Market Forecasts
Legenda Index of eight capital cities Australia and Index of Tier 1 cities (Beijing, Shanghai, Guangzhou and Shenzhen) in China.b Fitch Ratings-rated RMBS three-months-plus arrears including defaults.c Market-wideorlargestlenderarrears/impairedloanratio(definitionsvary)d Fitch Ratings-rated RMBS three-months-plus arrears excluding defaults.e Measures vary – South Korea, Singapore, Colombia, Mexico: outstanding mortgage balance; Canada, Denmark, Sweden, Norway: gross household debt; Australia: housing credit.f Outlookonafive-notchscale(Positive,Stable/Positive,Stable,Stable/Negative,Negative)g Change of outlook evaluation is compared with outlook from a year ago. Changes are (positive), (unchanged), or (negative).
Source: Fitch Ratings

GLOBAL HOUSING AND MORTGAGE OUTLOOK – 2020
7 December 2019www.fitchratings.com
North AmericaWe forecast stalled nominal home prices in Canada and stalled real prices in the US, with the most overvalued cities still vulnerable to shocks.
More Varied Origination Standards from Reduced Government Role Fitch Ratings expects a notable reduction in government involvement in the US and Canadian mortgage markets, which will make some home loans modestly more expensive, reflecting the higher cost of private capital. We also expect less origination in line with government entity standards and more mortgage funding by the private sector. The Trump administration has announced a plan for ending government control of Fannie Mae and Freddie Mac, the government-sponsored enterprises (GSEs) that guarantee about half of the US home loan market, but significant changes are not expected before the 2020 election and could be abandoned by a different administration. Similarly, Canada Mortgage & Housing Corp. (CMHC), the government housing authority, is gradually reducing its housing market exposure by tightening standards for loans that qualify for CMHC insurance.
Low Arrears Dependent on Strong EmploymentFitch Ratings forecasts mortgage arrears to stay low in both countries, with the level staying at about 1.5% in the US and increasing slightly to about 0.3% in Canada due to high household debt. Despite the US’s trade dispute with China and the resulting economic slowdown, we expect stable performance due to strong employment, projected income growth in 2020 and low interest rates. Fitch Ratings sees some vulnerability in the Canadian economy from softening property prices and high household debt.
Stalled or Low Home Price GrowthWe expect flat nominal home prices in Canada over the next two years while real prices will fall. In the US, we forecast home price growth of 3%, which is just above CPI inflation. Fitch Ratings expects Canada’s national home price correction to continue mainly due to affordability pressure in the largest cities.
In the US, home prices will be supported by solid job growth, a high household savings ratio and low mortgage rates. However, growth will be constrained by stretched affordability and tax changes introduced in 2018 that most affect areas with higher property values and higher tax rates. Dallas, Las Vegas, Phoenix, Toronto and Vancouver remain the most overvalued cities with home prices vulnerable to shocks.
Limited Supply of Affordable Housing Hurts Credit GrowthGrowing populations, combined with insufficient affordable housing in large metropolitan areas, have fuelled some large jumps in home prices this decade. This home price inflation has been particularly tough on younger first-time buyers (FTBs) entering the housing market, as they are struggling to find affordable housing, particularly in the low to mid-tier price range. If the share of these potential buyers increases, affordability pressures will persist and limit mortgage growth.
60
80
100
120
140
160
180
2009 2010 2012 2014 2016 2017 2019f 2021f
US Canada
Nominal Home Price Indices
Source: Fitch Ratings, S&P/Case-Shiller, Bank of Canada, Haver Analytics
0
2
4
6
8
10
2009 2010 2012 2014 2016 2017 2019f 2021f
US Canada
Mortgage Loans in Late-Stage Arrears or Default
Note: Based on the the market rate for arrearsSource: Fitch Ratings, BKFS, CBA
(%)
ALLASIROTIC
+1 212 908 [email protected]

GLOBAL HOUSING AND MORTGAGE OUTLOOK – 2020
8 December 2019www.fitchratings.com
Europe
406080
100120140160180200
2009 2010 2012 2014 2016 2017 2019f 2021f
UK GermanyNetherlands SpainItaly France
Nominal Home Price Indices
Source: Fitch Ratings, HM Land Registry, CSO, INE, BIS, BulweinGesa, Scenari Immobiliari
0
3
6
9
0
1
2
3
2009 2010 2012 2014 2016 2017 2019f 2021f
UK GermanyNetherlands Spain (RHS)Italy (RHS) France
Mortgage Loans in Late-Stage Arrears or Default
Note: Fitch Ratings 3m+ arrears index except for the market rate for arrears for the UK and France. Source: Fitch Ratings, UK Finance, Banque de France
(%) (%)
With riskier origination in many markets, recent vintages are more vulnerable in a downturn.
Slower Home Price Growth ExpectedWe expect slowing but still significant nominal home price growth of 4%-6.5% in Germany, Greece, the Netherlands, Portugal and Spain in 2020 and 2021. The expected slowdown reflects weaker economies and stretched affordability in major cities. However, these are more than offset by limited new supply, as well as demand that is supported by low mortgage rates, strong consumer confidence in Germany and the Netherlands and improving labour conditions and foreign buyer interest in Greece and Portugal (see European City Housing Outlook 2019).
Elsewhere we forecast nominal price growth leading to flat or near flat real prices in Belgium, France, Ireland, Norway and Sweden and negative real price growth in the UK, while nominal prices in Italy will continue their slight fall. Drivers preventing significant price growth include macro-prudential measures that restrict mortgage eligibility in Ireland and the Nordics, uncertainty around a future UK-EU trade agreement in the UK and Ireland, and rising mortgage rates in Norway.
Vulnerability from Looser Origination We expect higher LTVs and/or longer maturities to continue to be offered in Belgium, France and Germany to support lending volumes. In case of a downturn, recent vintages of loans underwritten under less strict standards are likely to be more vulnerable. We expect regulators to remain vigilant and react, as for example in the Netherlands, where bank risk-weighted asset floors are to be linked to LTVs.
Strong Performance Depends on Low Rates and Employment Levels Low mortgage rates in most countries (plus long-term fixed rates in several markets) will support strong arrears performance, unless unemployment increases above our forecasts. However, very low rates mean that in a downturn, material policy rate cuts that could support home prices would not be possible.
Unemployment increases could stem from the impact of trade disputes and slowing global growth. The likes of Germany and the Netherlands are particularly exposed to weaker global trade and regions in other countries are vulnerable to the German manufacturing sector.
The UK is expected to face an uptick in mortgage arrears in light of rising unemployment with a much larger deterioration if the UK leaves the EU without a trade deal.
FTBs Crowded Out in Large CitiesFTBs face severe affordability constraints and a struggle to qualify for mortgages in such cities as Amsterdam, Dublin, Frankfurt, Madrid, Paris and Stockholm, which have witnessed significant home price appreciation since 2014. Cheap credit for borrowers who qualify and continued interest from foreign and domestic investors (including cash buyers) are likely to push up prices further. Should investor interest rapidly fade, demand from stretched FTBs may be insufficient to avoid sharp price corrections.
ALESSANDROPIGHI
+44 20 3530 [email protected]

GLOBAL HOUSING AND MORTGAGE OUTLOOK – 2020
9 December 2019www.fitchratings.com
Asia-Pacific
75
100
125
150
175
200
225
2009 2010 2012 2014 2016 2017 2019f 2021f
Australia (8 capitals) China (Tier 1 cities)Japan South KoreaNew Zealand Singapore
Nominal Home Price Indices
Source: Fitch Ratings, CoreLogic, NBS China, Statistics Japan, RBNZ, BIS
0.0
0.2
0.4
0.6
0.8
1.0
2009 2010 2012 2014 2016 2017 2019f 2021f
Australia ChinaJapan South KoreaNew Zealand Singapore
Mortgage Loans in Late-Stage Arrears or Default
Note: The market rate for arrears except Fitch Ratings 3m+ arrears index for Australia and New ZealandSource: Fitch Ratings, NBS China, Statistics Japan, FSS, MAS
(%)
Government intervention is the hallmark of APAC mortgage markets and should generally keep home prices stable in 2020.
BENMCCARTHY
+61 2 8256 [email protected]
Australian Prices to Rebound, Post-Olympics Drop in JapanWe forecast Australian home prices to recover from their 2017-2019 fall and rise by 5% in each of the next two years on the back of falling mortgage rates, strong net migration and a moderate increase of investor purchases. Japanese new condo prices are likely to decline by 2% in 2020, before stabilising in 2021, due to an oversupply of units, coupled with a reduction in foreign demand after the Tokyo Olympics in mid-2020.
Macro-prudential measures will keep real home prices (in Korea, New Zealand and Singapore) or nominal prices (in China) relatively flat as they curtail demand.
Regulation Targets Speculative DemandAll countries except Japan saw the continued use of macro-prudential measures in 2019 to control demand, stabilise home prices and avert systemic risk associated with high housing debt. Regulator driven LTV restrictions for mortgage lenders continue to be applied in China, Korea and New Zealand to limit speculative housing investments, and Singapore regulators have expressed readiness to implement cooling measures if prices start to overheat. In Australia, restrictions on lending to investors and the use of interest-only loans were removed in 2018 and 2019, respectively. These market segments have remained fairly subdued but are expected to recover in 2020.
Low Rates Support Serviceability We expect borrower serviceability to improve for the variable and short-term fixed-rate mortgages in the region due to low or falling interest rates. However, affordability and price-to-income ratios have deteriorated in some countries after home prices rose faster in this decade than household incomes. While we do not expect interest rates to rise in the near term, high household debt in Australia, New Zealand, Korea and China makes borrowers more vulnerable to rising interest rates. Australia’s ratio of household debt relative to GDP remains the highest (119%) among the countries in this report with the recent home price correction only leading to lower levels of new mortgages with limited impact on the stock of debt.
Trade Conflicts Pose ConcernsFitch continues to expect arrears to be stable or increase marginally (on an absolute basis) over the next two years based on relatively benign economic circumstances across the region and low or falling interest rates.
However, uncertainty surrounding future global developments such as the US-China trade dispute and tensions between Korea and Japan could disrupt global or local economies, affecting the macroeconomic stability of the countries in this region, which would cause performance to deteriorate.

GLOBAL HOUSING AND MORTGAGE OUTLOOK – 2020
10 December 2019www.fitchratings.com
Latin America
80
100
120
140
160
180
200
220
2009 2010 2012 2014 2016 2017 2019f 2021f
Brazil Mexico Colombia
Real Home Price Indices
Source: Fitch Ratings, FIPE, SHF, DANE, OECD, Haver Analytics
0
1
2
3
4
5
2009 2010 2012 2014 2016 2017 2019f 2021f
Brazil Mexico Colombia
Mortgage Loans in Late-Stage Arrears or Default
Note: Based on the the market rate for arrearsSource: BCB, Banxico and Superintendencia Financiera Colombiana
(%)
Low interest rates support mortgage performance while government initiatives should boost mortgage markets and home purchase demand.
Home Price Growth Fuelled by Strong DemandFor the next two years, we forecast nominal home price growth of 7% in Colombia and 5% in Mexico, which is 3.5% and 1.5% growth in real terms. However, in Brazil, we expect weaker nominal home price increases of 1%-2% and falling real prices. The stronger home price growth in Colombia and Mexico will be sustained by demand outpacing new supply and growing homeowner confidence.Demand is expected to remain strong given more favourable lending conditions resulting from new government housing policies. Brazilian home price growth will be more subdued, due to a slower-than-expected economic recovery. However, a worse-than-expected slowdown in international trade or a stress on commodity prices could hurt GDP growth and home price inflation throughout the region.
Low Interest Rates Improve AffordabilityHistorically low interest rates for all three markets, stable or improving unemployment, better access to credit (due to government housing initiatives) and real income growth should lead to improved affordability for housing and stronger serviceability, especially for new fixed-rate mortgages.
We expect the labour market to strengthen slightly in Brazil, as unemployment levels begin to decrease, while remaining stable in Colombia and Mexico.
Government Initiatives to Boost Mortgage Markets We expect new mortgage lending in Colombia to grow by 10% a year through 2021 given government proposals to allow bank mortgages with higher LTVs, and direct government support such as new guarantees and subsidies.
Mexico’s new National Housing Plan will focus on closing the housing deficit by increasing mortgage products for lower-income borrowers. We expect it to lead to 4% new lending a year in 2020-2021.
Fitch expects new lending in Brazil to grow by 2.5%-3% a year from 2020-2021 compared to 0.8% in 2018, as lenders will be allowed to originate regulated mortgage loans indexed to inflation, which will make the portfolios attractive to investors, increasing housing market liquidity.
Unemployment and Inflation Volatility Pose Risks The popularity of fixed-rate loans supports our expectations of low arrears and shields mortgage performance from increases in interest rates. Performance is further supported by high initial down payments in Colombia and payroll deduction collection mechanisms from Mexican Federal Government entities (Infonavit and Fovissste), which will continue to be the most important mortgage providers for low-income borrowers. However, performance could be threatened by volatile inflation or an increase in unemployment.
JUANPABLOGIL
+56 2 2499 [email protected]

GLOBAL HOUSING AND MORTGAGE OUTLOOK – 2020
11 December 2019www.fitchratings.com
United States
0
5
10
15
20
75
100
125
150
175
1992 1996 2000 2004 2009 2013 2017 2021f
Home price index (real, rebased) (LHS)Disposable income per capita (real, rebased) (LHS)Home price-to-income per capita ratio (RHS)
Home Prices and Affordability
Source: Fitch Ratings, S&P/Case-Shiller, OECD, Ameco, Haver Analytics
0
2
4
6
8
10
0
3
6
9
12
1992 1996 2000 2004 2009 2013 2017 2021f
FRM 30yr rate (LHS)US market 3m+ arrears (LHS)Unemployment (RHS)
Mortgage Rates and Arrears
Source: Fitch Ratings, BKFS ,Freddie Mac, Haver Analytics
(%)(%)
0%
20%
40%
60%
80%
100%
0
250
500
750
1,000
1,250
1992 1996 2000 2004 2009 2013 2017 2021f
Quarterly gross new mortgage lending (LHS)
Annualised prepayment rate (RHS)
Mortgage Lending and Prepayments
Source: Fitch Ratings, MBA, Haver Analytics
(USDbn) (%)
Weforecastslowinghomepricegrowthoverthenexttwoyearsdrivenbystretchedaffordabilityand an economic slowdown.
ALLASIROTIC
+1 212 908 [email protected]
Modest Home Price Growth Fitch Ratings expects national home prices to grow by about 3% on a nominal basis in both 2020 and 2021, which is 0.5%-0.7% a year in real terms. Prices will be supported by low unemployment and growing household incomes but will face downward pressure from stretched FTB affordability, slower GDP growth from the China trade dispute (below 2% in 2020 and 2021), and cooling prices in higher-priced markets, such as New York, New Jersey and California. The continued loss of state and local tax deductions for property-related payments weighs on these markets.
We view national home prices as sustainable on a long-term basis. However, prices are still overvalued by 10%-20% in Dallas, Las Vegas and Phoenix, despite annual growth slowing to 5% from over 10% one to two years ago.
Low Arrears Dependent on Strong Labour MarketsFitch Ratings expects arrears of at least three months (3m+) to increase but remain low at about 1.5% through 2021 driven by a slowing economy and low home price growth. However, many borrowers will benefit from steady job growth and increasing median wages. We forecast steady unemployment at about 3.7% over the next two years.
Mortgage Lending FallingMortgage lending will decline by about 5% in both 2020 and 2021 as refinancing activity slows. Fitch Ratings expects more relaxation of underwriting standards in 2020, including lower documentation, higher debt-to-income (DTI) ratios and lower credit scores. Non-qualified mortgage lending will rise as lenders and investors become more comfortable with loans below GSE standards. Even if government control of the GSEs continues, GSE mortgage acquisitions could drop significantly in 2021 if an expiring exception allowing GSEs to purchase loans with higher DTI ratios is not extended. Regulatory and administrative changes to the GSEs are unlikely to occur before November’s 2020 presidential election, but the US Treasury recently recommended reforms that could reduce the government’s footprint in the mortgage market including by assessing whether the GSE’s cash-out refinancing loans, loans for investment properties and larger loans are consistent with the agency’s statutory missions.

GLOBAL HOUSING AND MORTGAGE OUTLOOK – 2020
12 December 2019www.fitchratings.com
Canada
5
10
15
20
25
30
50
100
150
200
250
1992 1996 2000 2004 2009 2013 2017 2021f
Home price index (real, rebased) (LHS)Disposable income per capita (real, rebased) (LHS)Home price-to-income per capita ratio (RHS)
Home Prices and Affordability
Source: Fitch Ratings, OECD, Bank of Canada, Chamber of Commerce of Metropolitan Montreal, Haver Analytics
0
3
6
9
12
0.0%
0.5%
1.0%
1.5%
2.0%
1992 1996 2000 2004 2009 2013 2017 2021f
Market 90+ day arrears (LHS)5yr mortgage rate (RHS)Unemployment (RHS)
Mortgage Rates and Arrears
Source: Fitch Ratings, Statistics Canada, CBA (Canadian Bankers Association), Haver Analytics
(%)
0%
50%
100%
150%
200%
0
500
1,000
1,500
2,000
1992 1996 2000 2004 2009 2013 2017 2021f
Thou
sand
s
Total mortgage credit (LHS)Household debt-to-disposable income ratio (RHS)
Mortgage Credit
Source: Fitch Ratings, Statistics Canada, Haver Analytics
(CADbn) (%)
WeexpectmutedhomepricegrowthinCanadatobringlevelstoamoreaffordablepricepoint.
Home Price Correction to ContinueFitch Ratings expects modest nominal home price growth of about 1% in both 2020 and 2021, which will mean a continued real decline. Price growth turned positive in 2Q19-3Q19 after the price fall from 2018, which brought homeowners off the sidelines. However, we think stretched affordability (especially in Toronto and Vancouver) and macro-prudential measures that limit the number of borrowers able to qualify for home loans will continue to limit home price growth. Vancouver prices have been steadily declining since 2018 while Toronto prices briefly stalled before growing at a more modest 4% in the year to September 2019. Home price growth in both markets has been limited by national lending limits and local purchase restrictions.
Arrears to Rise but Remain LowFitch Ratings forecasts mortgage arrears to increase slightly to 0.3% in 2020 but to remain near historic lows, supported by tight labour markets with solid job growth, low unemployment at 5.7% and rising wages. Consumer leverage remains a concern as average household indebtedness reached 177% of disposable income in 2Q19. Fitch Ratings expects the policy rate to be unchanged through 2020 at 1.75% and to increase to 2.0% in 2021. Should larger interest rate rises resume, despite guidance to the contrary from the Bank of Canada, the ability of Canadian borrowers to repay debt could become strained.
Tight Standards Limit Loan GrowthFitch Ratings forecasts low mortgage growth of 1% in both 2020 and 2021 due to affordability limits and tighter qualification standards (i.e. mortgage stress test) by the government. The CMHC is gradually reducing its role in the market with about 20% fewer loans now qualifying for government insurance due to tighter standards since 2016 (i.e. maximum gross debt service ratio of 39%, no investor loans). Financing for non-banks and smaller banks is becoming constrained, which is lowering mortgage credit availability. A reduced government role increases the potential for private-label RMBS and new covered bond programmes. CMHC recently announced an incentive programme for FTBs that could help fund up to a 10% equity stake under certain conditions. While this should help make home ownership more affordable, buyers are still subject to tighter standards imposed by the government.
SUSANHOSTERMAN
+1 212 908 [email protected]

GLOBAL HOUSING AND MORTGAGE OUTLOOK – 2020
13 December 2019www.fitchratings.com
United Kingdom
5
10
15
50
100
150
200
250
1996 2000 2004 2008 2013 2017 2021f
HM Land Registry house price index (real, rebased) (LHS)Disposable income per capita (real, rebased) (LHS)Home price-to-income per capita ratio (RHS)
Home Prices and Affordability
Source: Fitch Ratings, HM Land Registry, OECD, Ameco, Haver Analytics
0
3
5
8
10
0
1
2
3
4
1996 2000 2004 2008 2013 2017 2021f
UK Finance 3m+ arrears2-year 75% LTV variable rate new loans (RHS)Unemployment (RHS)Standard variable rate new loans (RHS)
Mortgage Rates and Arrears
Source: Fitch Ratings, UK FInance, BoE, Haver Analytics
(%) (%)
0
10
20
30
40
0
30
60
90
120
2003 2006 2009 2012 2015 2018 2021f
Thou
sand
s
Quarterly gross new mortgage lending (LHS)Quarterly gross new mortgage lending (BTL) (LHS)Annualised prepayment rate (RHS)(GBPbn)
Mortgage Lending and Prepayments
Source: Fitch Ratings, UK Finance, Haver Analytics
(%)
No-deal Brexit risk will not be eliminated until a UK-EU trade agreement is negotiated. Uncertainty will continue to limit transaction volumes and price growth.
DUNCANPAXMAN
+44 20 3530 [email protected]
Stalled Home PricesWe forecast nominal price growth of 1% in 2020 and 2% in 2021, which would represent a small drop in real terms, as long as a UK-EU trade agreement is agreed by the end of a transition period. We expect a formal exit from the EU next month under the newly elected Conservative government, but uncertainty around a new trade agreement will continue to suppress confidence in the housing market, reduce transaction volumes and limit price growth. Nominal home prices are likely to fall if a no-deal Brexit were to occur at the end of the transition period. We view prices in London and south-east England as overvalued compared to household income, while income multiples in northern regions have not risen as much and further limited real price rises are possible.
Arrears Low but IncreasingWe forecast arrears of three months or more to remain muted but rise from a low base of 0.8% in 2019 to 1% in 2020 and 1.1% in 2021, even if a no-deal Brexit is avoided. We expect that a rise in unemployment of 40bp and a 50bp increase in the base rate by the end of 2021 will put upward pressure on arrears, especially for non-prime loans and self-employed borrowers. However, tighter underwriting standards over the past decade and continued low interest rates will support low arrears. An exit without a trade deal would prompt a larger increase in arrears.
Prepayments Fall, Slow Credit GrowthWe expect a reduction in prepayment rates in all Brexit scenarios as refinancing is occurring less frequently due to the increasing popularity of fixed-rate periods of five years or more (47% of new lending compared with 25% three years ago). We anticipate gross new mortgage lending growth to increase slightly from 0.5% in 2019 to 1.2% in 2021. Lending activity will focus on refinancing as sales numbers remain depressed. Buy-to-let (BTL) lending is expected to remain stable as professional landlords stay active. An exit without a comprehensive trade deal may lower demand for rental property, putting downward pressure on yields.

GLOBAL HOUSING AND MORTGAGE OUTLOOK – 2020
14 December 2019www.fitchratings.com
Price Growth Will Continue at a Slower PaceWe forecast solid but slowing nominal home price growth of 5% in 2020 and 4% in 2021 (from a projected 6% for 2019), a slowdown after several years of property price growth outpacing income increases, especially in metropolitan areas. However, we expect that mortgage rates close to historical lows over the next two years will continue to support demand more than the economic slowdown will reduce it. At the same time, supply continues to be limited. Construction activity is well below the historical average with only 156,000 building completions in 2018 as opposed to an annual average of 244,000 completions in the 10 years up to the financial crisis.
Good Serviceability Counterbalances Slowing EconomyWe expect mortgage arrears to be stable at about 0.5%, despite the first signs of weakening in the strong labour market. Companies in the manufacturing sector have cut their employment plans drastically since early 2018 but signs of weakening are also evident in the services and trade sectors. We forecast a moderate increase in unemployment through 2021 to 3.6% (from a projected 3.2% for 2019) due to the economic slowdown. Nominal annual wage growth of 2% to 3% in recent years has strengthened household income and we expect wages to continue increasing, but at a slower rate than home prices.
Serviceability remains healthy. Households on average spend 20% to 30% of available income to service mortgage debt. Borrowers have locked-in longer fixed-rate periods of more than 14 years on average, so eventual increases in mortgage rates will have limited impact on serviceability.
Banks’ Risk Appetite Creeping UpWe forecast mortgage lending volumes to continue to grow by about 2% for the next two years, on the back of an unbroken demand for residential real estate and expectations of further price increases.
We expect German banks’ profitability to remain under pressure as the low-rate environment challenges their ability to generate interest income. Mortgage lending will remain an attractive product, although competition has put significant pressure on margins. The regulator’s recent stress testing reveals a slow but steady increase in average LTV ratios that banks are willing to accept; the average LTV of new loans has increased to the mid-80s, from the higher 70s three years ago.
6
8
10
12
14
60
80
100
120
140
1996 2000 2004 2008 2013 2017 2021f
Home price index (real, rebased) (LHS)Disposable income per capita (real, rebased) (LHS)Home price-to-income per capita ratio (RHS)
Home Prices and Affordability
Source: Fitch Ratings, BulweinGesa, OECD, Ameco, Dr. Klien Privatkunden AG, Haver Analytics
0.0
0.2
0.4
0.6
0.8
1.0
0
2
4
6
8
10
12
2004 2006 2009 2011 2014 2016 2019 2021f
Fixed >10yr (LHS) Unemployment (LHS)Fixed 1yr - 5yr (LHS) Fixed 5yr - 10yr(LHS)ECB rate (LHS) 3m+ arrears (RHS)
Mortgage Rates & Arrears
Source: Fitch Ratings, Deutsche Bundesbank, ECB, Haver Analytics
(%) (%)
0
4
8
12
16
0
15
30
45
60
75
2004 2006 2009 2011 2014 2016 2019 2021f
Quarterly gross new mortgage lending (LHS)
Annualised prepayment rate (RHS)(EURbn)
Mortgage Lending and Prepayments
Source: Fitch Ratings, European Mortgage Federation, Haver Analytucs
(%)
The economic slowdown will not break property price growth and robust asset performance.
GermanyTHOMASKRUG,CFA
+49 69 768076 [email protected]

GLOBAL HOUSING AND MORTGAGE OUTLOOK – 2020
15 December 2019www.fitchratings.com
The Netherlands
Home Price Growth Continues to Slow We expect nominal home price growth to moderate to 5% in 2020 and 4% in 2021 (from a projected 7% for 2019). This will be driven by weakening affordability resulting from the substantial home price appreciation since 2014 (countrywide: 27% in real terms, Amsterdam: 55%) and the economy’s higher-than-average exposure to trade shocks. Continued price growth is supported by shortages in social housing and private rentals leaving few alternatives to home ownership for a population growing from positive net migration.
We expect supply to fail to match demand despite the 2020 budget promoting housing supply measures in large urban areas and refurbishment and construction incentives for housing associations. Completions are still short of pre-crisis levels (about 70,000 dwellings a year in 2017 and 2018 compared with 90,000 for 2005 to 2008), which limits the growth in households. A recent court ruling requiring builders to guarantee compensation for emissions before building close to nature reserves may further dampen construction.
Greater Share of Part-Time and Self-Employed BorrowersECB monetary easing and low rates for longer will support mortgage performance with arrears expected to increase from a low base to 0.20% by 2020. Unemployment shocks are not in our baseline, but the projected eurozone economic growth slowdown may reduce earnings for the self-employed (15.7% of the workforce in 2017 according to the IMF, higher than EU average) and temporary contractors.
Decreasing Lending VolumesWe forecast gross new mortgage lending to fall by 3% next year and 2.5% in 2021 (after a projected reduction of 4% in 2019) due to the shortage of available housing (property sales down by 5% yoy as of 2H19) and the proposal to introduce LTV-based risk-weight floors for banks’ mortgage lending. The floors should increase capital requirements and lead to higher mortgage rates and lower lending volumes. However, non-banks, which originate 30% of mortgage lending and are most active in longer fixed rates, are unaffected by these measures and could partly replace bank lending. We do not expect lending competition to reduce due to worsening funding in the short to medium term, as policy rates remain low and debt capital markets are active.
4
8
12
16
50100150200250300350400
1997 2000 2003 2006 2009 2012 2015 2018 2021f
Home price index (real, rebased) (LHS)Disposable income per capita (real, rebased) (LHS)Home price index of Amsterdam & Rotterdam (real, rebased) (LHS)Home price-to-income per capita ratio (RHS)
Home Prices and Affordability
Source: Fitch Ratings, CBS , OECD, Ameco, Haver Analytics
0
2
4
6
8
0.0
0.3
0.6
0.9
1.2
2004 2006 2009 2011 2014 2016 2019 2021f
Fitch Ratings Index 3m+ arrears (exc defaults) (LHS)Mortgage rate new loans (RHS)Unemployment (RHS)
Mortgage Rates and Arrears
Source: Fitch Ratings, DNB (De Nederlandsche Bank), Haver Analytics
(%)(%)
0
5
10
15
20
0
10
20
30
40
2004 2006 2009 2011 2014 2016 2019 2021f
Quarterly gross new mortgage lending by MFIs (LHS)Annualised prepayment rate (RHS)
(EURbn)
Mortgage Lending and Prepayments
Source: Fitch Ratings, DNB (De Nederlandsche Bank)
(%)
Fitch Ratings forecasts home price growth to moderate, driven by stretched affordabilityandtheeconomy’sexposuretoaglobaltradeslowdown.
BERNHARDSTRAETER,CFA
+44 20 3530 [email protected]

GLOBAL HOUSING AND MORTGAGE OUTLOOK – 2020
16 December 2019www.fitchratings.com
France
Relaxed Underwriting to Support PricesWe forecast nominal home price growth to slow to 2% in 2020 and 1% in 2021 (from 3.5% projected in 2019) which will mean substantially flat real prices. Borrower serviceability will no longer improve as lending rates will not decline further, but we expect banks to continue to relax their underwriting criteria by offering higher LTVs (up 4.7pp on average between 2014 and 2018) and longer maturities.
Price disparities between urban and rural areas will increase, as supply scarcity persists in the big cities, such as Paris (with 6.3% yoy home price growth in 2Q19) and Lyon (9.2% yoy in 1Q19). Home prices may cool earlier if regulators’ concerns about household indebtedness result in lending restrictions.
Lower Arrears but Some Vulnerability Fitch Ratings believes 3m+ arrears will decrease slightly to 1.0% by 2021 from a projected 1.2% for 2019 as a result of unemployment expected to fall to 8.5% by 2021 from 8.7% projected for 2019. However, we have concerns regarding recent origination in light of fierce competition between banks, which has allowed weaker borrowers to access home financing. This is likely to weigh on medium- to long-term performance.
Current arrears levels reflect prudent underwriting by French banks, which has resulted in a stable DTI of about 30%. Performance is insensitive to interest rate changes given the fixed-rate-for-life nature of residential loans (95% of the stock in 2018).
Strong Originations in 2020The high 20% growth in gross new housing lending projected for 2019 is based on a record year for real estate transactions combined with sustained refinancing activity. Origination volumes are expected to be maintained through 2020 despite less refinancing activity, driven by strong competition as banks try to increase origination to offset reduced revenue due to prolonged low interest rates. Similarly to 2018, Fitch Ratings expects a bearish correction in lending volumes of 15% for 2021 as refinancing activity fades out and the real estate market slows down.
We estimate a moderate increase in prepayments to about 15% in 2019 as the limited decline in mortgage rates fuels some refinancing. From 2020, prepayments are expected to fall below their long-term average of 11% as refinancing activity fades with flat lending rates (of 1.4%, expected through 2021).
5
7
9
11
13
50
100
150
200
250
1997 2000 2003 2006 2009 2012 2015 2018 2021f
Home price index (real, rebased) (LHS)Disposable income per capita (real, rebased) (LHS)Home price-to-income per capita ratio (RHS)
Home Prices and Affordability
Source: Fitch Ratings, INSEE, OECD, Ameco, Haver Analytics
0
2
4
6
8
10
12
0
2
4
6
2004 2006 2009 2011 2014 2016 2019 2021f
Housing loan rates for new loans (LHS)
Unemployment (RHS)
Housing Loan Rates
Source: Fitch Ratings, Banque de France, Haver Analytics
(%)(%)
0
6
12
18
24
30
0
30
60
90
120
2004 2006 2009 2011 2014 2016 2019 2021f
Quarterly gross new housing loans lending (LHS)
Annualised prepayment rate (RHS)(EURbn)
Housing Loans Lending and Prepayments
Source: Fitch Ratings, Banque de France, Haver Analytics
(%)
RAULDOMINGO
+33 1 44 29 91 [email protected]
We expect relaxed underwriting standards to overtake declining interest rates as the main supporting factor for home price growth.

GLOBAL HOUSING AND MORTGAGE OUTLOOK – 2020
17 December 2019www.fitchratings.com
Belgium
Demand Supports Home Price GrowthWe expect nominal home price growth of 3% in 2020 before slowing to 2% in 2021, due to new prudential recommendations and a tax deduction of mortgage interest in Flanders that will be scrapped from next month. Real prices will grow by 0.3%-1.3%. Home price growth will be supported by the pace of construction failing to match demand, which will be supported by the higher number of single-person dwellings (which have grown by almost twice the rate for all dwellings since 2015), BTL investors and the low-interest-rate environment.
Mortgage Performance VulnerabilityMortgage performance should remain strong, with 90 day+ arrears and defaults remaining at the low levels seen as of end-2018 (1.3%). Performance will be supported by the very low fixed rates on mortgages. Some deterioration could be triggered if GDP growth were weaker than our forecast of 1%-1.2% in 2020-2021, or if unemployment increased from the stable 5.5% we expect.
Should economic conditions worsen, the relaxation in some lending criteria (higher LTVs, longer maturities) since 2016-2017 will place strain on these riskier loans. Reduced affordability for stretched borrowers, resulting from continued home price increases, could also erode repayment capacity and lead to higher arrears.
Mortgage Lending Growth SlowingSpecific prudential recommendations to curb lending practices will be implemented from the start of 2020, although their bearing on the market will be spread over several years. We therefore expect new mortgage lending volumes to rise by a stable 10% in 2020 before slowing to 5% by 2021.
We expect that price competition will be limited given sustained low interest rates, so growth in lending volumes will be driven by relaxing credit standards. The prudential recommendations continue to allow banks to lend to riskier borrowers up to specific tolerance margins (e.g. maximum LTVs for FTBs can be greater than 100% for up to 5% of the bank’s annual production) and we do not expect to see a rapid tightening of lending practices. The recommended thresholds for new loans address LTVs, such as limits of 80% for BTL and 90% for owner-occupied properties, and specific riskier combined high LTV and DTI loan attributes.
0
5
10
15
20
50
100
150
200
250
1997 2000 2003 2006 2009 2012 2015 2018 2021f
Home price index (real, rebased) (LHS)Disposable income per capita (real, rebased) (LHS)Home price-to-income per capita ratio (RHS)
Home Prices and Affordability
Source: Fitch Ratings, Stadim, StatBel, OECD, Ameco, Haver Analytics
0%
25%
50%
75%
100%
1997 2000 2003 2006 2009 2012 2015 2018
Resetable (initial fixed period >/= 10 years)Resetable (5 years </= initial fixed period < 10 years)Resetable (3 years </= initial fixed period < 5 years)Resetable (1 years </= initial fixed period < 3 years)Resetable downwards onlyFixed-for-life
Residential Loan Distribution By interest-rate type
Source: UPV-BVK (Union Professionnelle du Credit)
(%)
0
10
20
30
40
50
0
10
20
30
40
50
2008 2010 2012 2014 2017 2019 2021f
Quarterly gross new mortgage lending (LHS)Annualised prepayment rate (based on main Belgian lenders) (RHS)Unemployment (RHS)
(EURbn)
Mortgage Lending and Prepayments
Source: Fitch Ratings, NBK, Belfius, ING Belgium, Axis, Fortis, KBC
(%)
Stretchedaffordability,risinghomepricesandgrowingmortgageindebtednessincreaseborrowers’vulnerability to an economic downturn.
WILLIAMROSSITER
+33 1 44 29 91 [email protected]

GLOBAL HOUSING AND MORTGAGE OUTLOOK – 2020
18 December 2019www.fitchratings.com
Denmark
Price Growth Contained by RegulationWe forecast nominal home prices in Denmark to increase by 3% in both 2020 and 2021, which is about 1.5% growth in real terms. Despite record low mortgage rates, home price increases will continue to be limited by tight lending practices enforced by Danish authorities since 2016, which include affordability stress tests, amortisation requirements, limits on adjustable rate mortgages and guidelines for households with high debt. We expect low price growth for Copenhagen apartments, similar to 2019, as some excess supply is absorbed after above-average annual growth of 8%-10% in 2017-2018.
Low Arrears despite High Debt LevelsFitch Ratings expects mortgage arrears to be stable over the next two years at 0.2%, because serviceability will continue to be supported by low rates, falling unemployment and the generous social security system. We expect mortgage rates to stabilize at about 1% (1.5% for the 30-year fixed) and unemployment to decline to 4.7% in 2020-2021. Risks associated with the high level of household debt (115% of GDP) have been mitigated by the tighter lending rules.
Borrowers’ sensitivity to interest rates is decreasing as they take on fixed-rate loans; 70% are fixed for more than three years (45% for 30 years). We also expect the share of loans with interest-only periods (typically for 10 years) to continue to drop from 46% in 2019 (vs 56% in 2014), despite the introduction in 2019 of interest-only periods for up to 30 years, which we expect to be a small part of the market.
Minor Growth in Household DebtWe expect options to lock in lower fixed rates, growing employment and high household income to support mortgage refinancing. However, we expect only limited annual growth in household debt of 1% in 2020-2021, as borrowers mainly lower their interest expenditure by switching their unsecured bank loans to mortgage loans, to the extent possible before hitting regulatory DTI caps.
The first issuances of 10 and 20 year negative-yielding covered bonds to fund mortgage loans occurred in 2019, with negative yielding issuance also likely in the near term. However, borrowers must also pay the banks’ administrative margin, so we do not expect mortgage rates to become negative.
0
5
10
15
20
0
50
100
150
200
250
1993 1996 1999 2002 2005 2008 2011 2014 2017 2020f
Home price index (real, rebased) (LHS)Disposable income per capita (real, rebased) (LHS)Home price-to-income per capita ratio (RHS)
Home Prices and Affordability
Source: Fitch Ratings, OECD, Ameco, Statbank DK, Haver Analytics
0
3
6
9
0.0
0.2
0.4
0.6
0.8
2004 2006 2009 2011 2014 2016 2019 2021f
Market 3.5m+ arrears (%) (LHS)Avg. outstanding mortgage bond 30yr rate (RHS)Unemployment rate (RHS)
Mortgage Rates and Arrears
Source: Fitch Ratings, Realkreditradet, Haver Analytics
(%) (%)
0
10
20
30
40
0
500
1,000
1,500
2,000
2,500
3,000
2004 2006 2009 2011 2014 2016 2019 2021f
Gross household debt (LHS)
YTD prepayment rate (RHS)(DKKbn)
Gross Household Debt and Prepayments
Source: Fitch Ratings, Realkreditradet, Haver Analytics
(%)
Strict lending regulation will counterbalance risks from cheapest ever mortgages.
OLGAKASHKINA
+49 69 768076 [email protected]

GLOBAL HOUSING AND MORTGAGE OUTLOOK – 2020
19 December 2019www.fitchratings.com
Sweden
Home Prices Limited to Income GrowthWe forecast nominal home prices to rise by 2.5% in 2020 and 3% in 2021, which will be slightly above CPI inflation. This follows a drop of 3.6% between 3Q17 and 1Q18, which was shorter than we had expected. Prices have grown in line with inflation since.
Mortgage regulation will continue to limit household leverage and therefore home price growth to income growth. Prices will be supported by strong demand from population growth, a longstanding shortage of affordable housing, low interest rates, restrictive rental regulation and favourable tax treatment of mortgage interest. The National Board of Housing forecasts new constructions to decrease by 19% (to 46,500 dwellings) in 2019 from the 2017 peak.
High Interest Rate Sensitivity Fitch Ratings expects low mortgage rates, high household wealth and a stable labour market to support strong mortgage performance. The European Banking Authority reports non-performing loans (NPLs) at 0.5% (2Q19) and we expect the ratio to remain stable in 2020-2021. Mortgage rates should marginally increase from 2020 on the back of an expected year-end policy rate rise, but competition among lenders remains high.
The higher demand for variable-rate loans (68% in 2018 compared to 41% in 2008) has increased borrower vulnerability to interest rate rises. However, serviceability should remain sound supported by the interest only nature of one loan part for most borrowers and the low household interest expenditure that should rise marginally to 3.2% of disposable income by 2021 (from 2.5%). The high household saving ratio, which should remain above 15% in 2020-2022 according to Riksbank, also supports serviceability.
Regulation Contains Lending GrowthWe expect a stable growth rate of 5% a year for household debt in 2020-2021, which is lower than the average 7% in 2015-2018. The lower rate is driven by stricter loan amortisation requirements since 2016. Lending restrictions have led to lower loan/income ratios for newly originated loans especially in Stockholm (22% lower than 2018) and Gothenburg (9% lower), where more borrowers are affected by the stricter amortisation requirements. Household indebtedness is a large concern to Sweden’s regulator; we expect further macro-prudential measures to be enacted should household debt levels increase significantly relative to income.
0
5
10
15
20
90
140
190
240
290
340
390
1992 1995 1998 2001 2005 2008 2011 2014 2018 2021f
Home price index (real, rebased) (LHS)Disposable income per capita (real, rebased) (LHS)Home price-to-income per capita ratio (RHS)
Home Prices and Affordability
Source: Fitch Ratings, OECD, Ameco, BiS, Haver Analytics
0
3
5
8
10
2005 2007 2009 2011 2013 2015 2017 2019f 2021f
Lending rates on new housing loans
Unemployment rate
Rate on New Housing Loans and Unemployment
Source: Fitch Ratings, Statistics Sweden, Haver Analytics
(%)
0
1,000
2,000
3,000
4,000
5,000
2005 2007 2009 2011 2013 2015 2017 2019 2021f
Thou
sand
s
Gross household debt ""
(SEKbn)
Gross Household Debt
Source: Fitch Ratings, Statistics Sweden, Haver Analytics
Fitch Ratings expects home prices to increase modestly in Sweden supported by limited supply and lowmortgagerates.Affordabilityremainsstrong.
ROBERTODELRAGNO
+39 02 879087 [email protected]

GLOBAL HOUSING AND MORTGAGE OUTLOOK – 2020
20 December 2019www.fitchratings.com
Higher Rates to Limit Price GrowthFitch Ratings expects nominal price growth of 2% in 2020 before slowing to 1.5% in 2021, which will be in line with CPI inflation. Rising mortgage rates will put downward pressure on home prices after lenders pass on expected base rate rises, but real income growth will be supportive of price growth. GDP growth that is slowing to about 2% and low unemployment (down to 3.1% in 2020-2021) will support consumer confidence and housing demand.
However, increasing supply will put downward pressure on home price growth. The stock of unsold properties increased in 3Q19, driven by new builds and unsold existing homes outside the capital. Oslo prices will be less affected by oversupply.
Stable Arrears despite High Rate SensitivityWe expect mortgage arrears levels to remain low at about 0.2% over the next two years, supported by low unemployment, positive wage growth, low interest rates, favourable tax treatment of household debt and Norway’s protective social security system.
Despite a recent increase in the popularity of fixed rate loans (typically for two to five years), more than 90% of mortgages continue to carry variable rates evolving with the policy rate. The policy rate has risen four times since 2018 and is expected to increase by 25bp to 1.75% next year.
Tight Regulation Contains Mortgage DebtFitch Ratings expects mortgage lending to grow more moderately at 5% in 2020 and 4.5% in 2021, driven by continued tight mortgage regulation (notably the DTI cap of 5). The household debt ratio will continue to increase (forecast at 240% of disposable income as of end-2021), albeit at a slower pace.
Following the establishment of the unsecured debt register in July 2019, unsecured lending must be considered in the calculation of DTIs for both consumer and mortgage lending. A proposed tightening of mortgage standards, such as a lower DTI cap, recommended by the Norwegian FSA was rejected in November by the Ministry of Finance. The current standards need to be reviewed within a year and we expect the regulators to monitor them closely.
0
5
10
15
90
140
190
240
290
340
1997 2000 2003 2006 2009 2012 2015 2018 2021f
Home price index (real, rebased) (LHS)Disposable income per capita (real, rebased) (LHS)Home price-to-income per capita ratio (RHS)
Home Prices and Affordability
Source: Fitch Ratings, OECD, Ameco, SSB, Haver Analytics
0
2
4
6
0.0
0.2
0.4
0.6
2009 2011 2013 2015 2017 2019f 2021f
3m+ arrears, DNB Boligkreditt (LHS)Mortage rate on outsanding loans (RHS)Unemployment (RHS)Key policy rate (RHS)
Mortgage Rates and Arrears
Source: Fitch Ratings, SSB, DNB Boligkreditt, Norges Bank, Haver Analytics
(%) (%)
0
50
100
150
200
250
0
1,000
2,000
3,000
4,000
5,000
1997 2000 2003 2006 2009 2012 2015 2018 2021f
Thou
sand
s
Gross household debt (LHS)
Household debt to disposable income (RHS)(NOKm)
Mortgage Debt and Debt-to-Income Ratio
Source: Fitch Ratings, SSB Norges Bank, Haver Analytics
(%)
Norway
FitchRatingsforecastshomepricegrowthtobelimitedtoinflation.
JULIENCARON
+33 1 44 29 91 [email protected]

GLOBAL HOUSING AND MORTGAGE OUTLOOK – 2020
21 December 2019www.fitchratings.com
Home Price Growth to Be LimitedWe forecast nominal home price growth of 2% for the next two years as long as a new UK-EU trade deal is agreed by the end of a transition period. This would be a slight increase in real terms. Continued central bank lending restrictions, uncertainty around the future UK-EU trade relationship and increased housing supply (new home competitions increased by 18%, for the year to end-3Q19) will drive lower home price growth (compared with growth of 10% in 2017 and 6% 2018). We expect the lending restrictions to remain while home price growth forecasts are positive. Downside risks, including negative nominal home price growth, would increase if a new UK-EU relationship is not negotiated by end-2020 and the transition period is not extended.
We expect FTBs to remain the most active in areas surrounding Dublin with BTL investors having a minor role. Regulatory lending limits on affordability should continue to have a larger impact in Dublin, where prices are higher than in the rest of the country and where we expect no home price inflation in 2020 and 2021.
Minimal Arrears ReductionWe forecast Fitch-rated RMBS’ 3m+ arrears to fall to 7% in 2020-2021 from a projected 7.5% for 2019 as long as a new UK-EU trade relationship is agreed during a transition period. Arrears will remain high as forbearance measures continue to apply to long-term delinquent borrowers, which form an increasingly negatively selected subset of legacy borrowers. Fitch Ratings believes that significant improvement would only result if repossessions were to increase (which is not expected) as the likelihood of a successful restructuring for the legacy borrowers in late-stage arrears is diminishing. In the case of an exit without a new UK-EU trade agreement, we expect a slight worsening of arrears.
FTBs to Drive Mortgage GrowthFitch Ratings anticipates slower mortgage credit growth of 7% in 2020 and 2021 (from 12% in 2019). FTBs (including new or returning residents) and home movers will continue to dominate, with about half of all new lending to FTBs (supported by the help-to-buy scheme) and 30% to movers. Remortgaging (15%) has the largest potential to increase its share as seasoned borrowers will increasingly take advantage of lower rates.
Mortgage rates will fall slightly to about 2.9%, but will remain above the eurozone average, due to the concentrated banking system and large stock of low-yielding legacy mortgages.
3
6
9
12
15
18
50
75
100
125
150
175
2001 2003 2006 2008 2011 2013 2016 2018 2021f
Home price index (real, rebased) (LHS)Disposable income per capita (real, rebased) (LHS)Home price-to-income per capita ratio (RHS)
Home Prices and Affordability
Source: Fitch Ratings, CSO (Central Statistics Office), Ameco, OECD
0
1
2
3
4
5
6
0
5
10
15
20
25
2007 2009 2011 2013 2015 2017 2019f 2021f
Fitch Ratings 3m+ arrears (inc defaults) (LHS)Unemployment (RHS)CBOI market 3m+ arrears (LHS)Mortgage rate new loans (RHS)
Mortgage Rates and Arrears
Source: Fitch Ratings, CBOI (Central Bank of Ireland), Haver Analytics
(%) (%)
0
5
10
15
0
2
4
6
2007 2009 2011 2013 2015 2017 2019f 2021f
Quarterly gross new mortgage lending (LHS)
Annualised prepayment rate (RHS)(EURbn)
Mortgage Lending and Prepayments
Source: Fitch Ratings, BPFI (Banking & Payments Federation Ireland)
(%)
IrelandWe forecast home price growth of close to 2% as an increase in supply and uncertainty around the future UK-EU trade relationship will limit growth.
HAIDERSARWAR,CFA
+44 20 3530 [email protected]
GLOBAL HOUSING AND MORTGAGE OUTLOOK – 2020
22 December 2019www.fitchratings.com
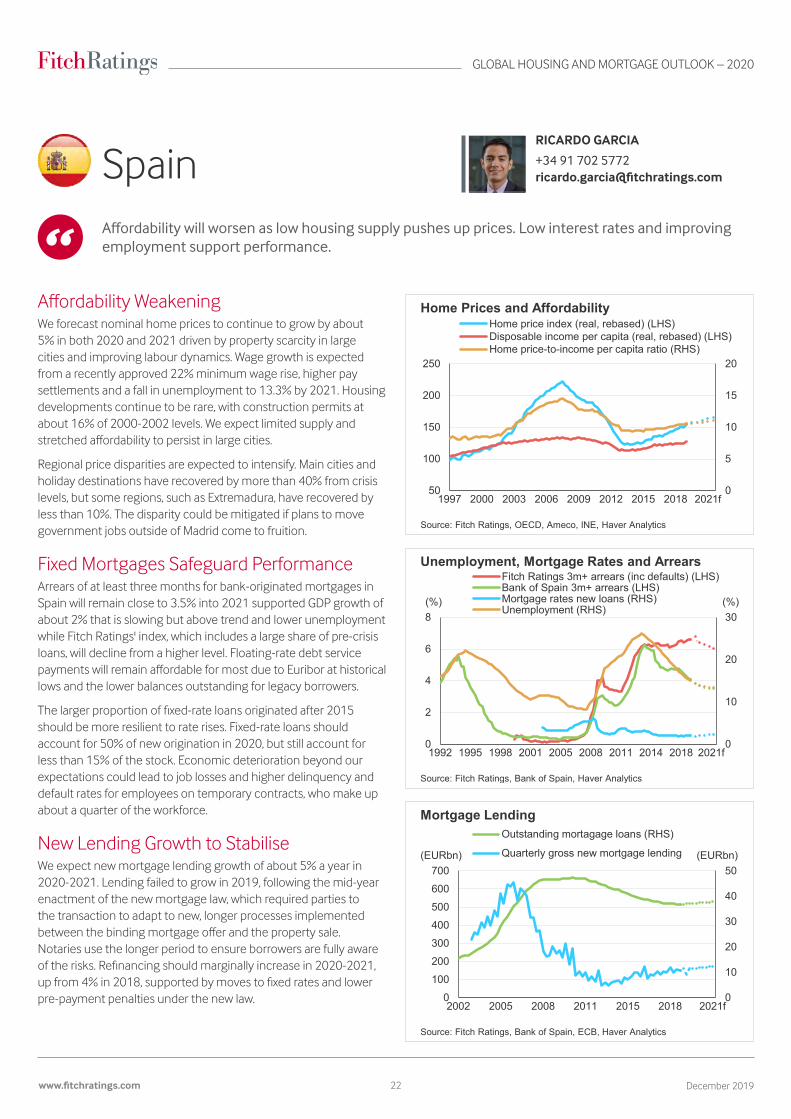
Affordability WeakeningWe forecast nominal home prices to continue to grow by about 5% in both 2020 and 2021 driven by property scarcity in large cities and improving labour dynamics. Wage growth is expected from a recently approved 22% minimum wage rise, higher pay settlements and a fall in unemployment to 13.3% by 2021. Housing developments continue to be rare, with construction permits at about 16% of 2000-2002 levels. We expect limited supply and stretched affordability to persist in large cities.
Regional price disparities are expected to intensify. Main cities and holiday destinations have recovered by more than 40% from crisis levels, but some regions, such as Extremadura, have recovered by less than 10%. The disparity could be mitigated if plans to move government jobs outside of Madrid come to fruition.
Fixed Mortgages Safeguard PerformanceArrears of at least three months for bank-originated mortgages in Spain will remain close to 3.5% into 2021 supported GDP growth of about 2% that is slowing but above trend and lower unemployment while Fitch Ratings' index, which includes a large share of pre-crisis loans, will decline from a higher level. Floating-rate debt service payments will remain affordable for most due to Euribor at historical lows and the lower balances outstanding for legacy borrowers.
The larger proportion of fixed-rate loans originated after 2015 should be more resilient to rate rises. Fixed-rate loans should account for 50% of new origination in 2020, but still account for less than 15% of the stock. Economic deterioration beyond our expectations could lead to job losses and higher delinquency and default rates for employees on temporary contracts, who make up about a quarter of the workforce.
New Lending Growth to StabiliseWe expect new mortgage lending growth of about 5% a year in 2020-2021. Lending failed to grow in 2019, following the mid-year enactment of the new mortgage law, which required parties to the transaction to adapt to new, longer processes implemented between the binding mortgage offer and the property sale. Notaries use the longer period to ensure borrowers are fully aware of the risks. Refinancing should marginally increase in 2020-2021, up from 4% in 2018, supported by moves to fixed rates and lower pre-payment penalties under the new law.
0
5
10
15
20
50
100
150
200
250
1997 2000 2003 2006 2009 2012 2015 2018 2021f
Home price index (real, rebased) (LHS)Disposable income per capita (real, rebased) (LHS)Home price-to-income per capita ratio (RHS)
Home Prices and Affordability
Source: Fitch Ratings, OECD, Ameco, INE, Haver Analytics
0
10
20
30
0
2
4
6
8
1992 1995 1998 2001 2005 2008 2011 2014 2018 2021f
Fitch Ratings 3m+ arrears (inc defaults) (LHS)Bank of Spain 3m+ arrears (LHS)Mortgage rates new loans (RHS)Unemployment (RHS)
Unemployment, Mortgage Rates and Arrears
Source: Fitch Ratings, Bank of Spain, Haver Analytics
(%) (%)
0
10
20
30
40
50
0100200300400500600700
2002 2005 2008 2011 2015 2018 2021f
Thou
sand
s
Outstanding mortagage loans (RHS)
Quarterly gross new mortgage lending(EURbn)
Mortgage Lending
Source: Fitch Ratings, Bank of Spain, ECB, Haver Analytics
(EURbn)
SpainAffordabilitywillworsenaslowhousingsupplypushesupprices.Lowinterestratesandimprovingemployment support performance.
RICARDOGARCIA
+34 91 702 [email protected]

GLOBAL HOUSING AND MORTGAGE OUTLOOK – 2020
23 December 2019www.fitchratings.com
Stagnant Prices in a Polarised MarketFitch Ratings forecasts Italian nominal home prices to slightly decrease by 0.5% in both 2020 and 2021, which will translate into a larger decline in real terms. Price expectations at the national level conceal contrasting regional trends that reflect local economic differences. Prices will continue to grow and put pressure on affordability in the north, mostly driven by the metropolitan areas of Milan and Turin , where prices have been increasing for at least two years. Prices will decrease elsewhere (including Rome), reflecting the sluggish economic environment.
Increasing sales volumes will not push up prices given the limited availability of new buildings and dated properties forming the vast majority of the stock.
Performance Vulnerability RemainsFitch Ratings forecasts 3m+ arrears to increase slightly but remain below 1.5% in 2020 and 2021. Mortgage serviceability will be supported by low rates for new mortgages given the recent extension of the TLTRO and our expectation that the vast majority of new originations will be at fixed rates. Nonetheless, performance remains vulnerable to an economic slowdown and Fitch Ratings sees limited room for banks to further reduce mortgage rates in the short term given their weak profitability.
Over the past three years, the reduction in late arrears and defaults on the banks’ books was driven by disposals. Following the recent renewal of the Garanzia per la Cartolarizzazione delle Sofferenze (GACS) until May 2021, Fitch Ratings expects banks to continue to dispose of NPLs and increasingly focus on unlikely-to-pay, as the NPL stock progressively reduces.
Positive Momentum for RefinancingFitch Ratings expects mortgage lending to grow by 0.5% in 2020 and 1.5% in 2021. We expect the growth to be driven by refinancing activity (10% of new lending in 1H19), supported by the ECB’s monetary easing and resulting low rates. Refinancing will also be supported by the increasing use of the internet as an origination channel, which facilitates the comparison of mortgage offers. Fitch Ratings expects stable prepayment rates at about 5% in 2020 and 2021, lower than the 2016 peak.
7
9
11
13
15
50
75
100
125
150
1992 1995 1998 2001 2005 2008 2011 2014 2018 2021f
Home price index (real, rebased) (LHS)Disposable income per capita (real, rebased) (LHS)Home price-to-income per capita ratio (RHS)
Home Prices and Affordability
Source: Fitch Ratings, Scenari Immobiliari, Ameco, OECD
0
2
4
6
8
10
0
2
4
6
8
10
2003 2005 2007 2009 2011 2013 2015 2017 2019 2021f
Fitch Ratings 3m+ arrears (exc defaults) (RHS)NPL/exposures plus bad debts (Market wide)Mortgage interest rate new loans (RHS)
Mortgage Rates and Arrears
Source: Fitch Ratings, ECB, Bank of Italy, Haver Analytics
(%) (%)
0
3
6
9
12
15
0
4
8
12
16
20
2003 2005 2007 2009 2011 2013 2015 2017 2019 2021f
Quarterly gross new mortgage lending (LHS)
Annualised prepayment rate (RHS)(EURbn)
Mortgage Lending and Prepayments
Source: Fitch Ratings, Bank of Italy
(%)
ItalyHome prices will slightly decrease, mirroring the stagnant economy. Mortgage performance will be stable but remains vulnerable to an economic slowdown.
NICOLASELVAGGI
+39 02 879087 [email protected]

GLOBAL HOUSING AND MORTGAGE OUTLOOK – 2020
24 December 2019www.fitchratings.com
Slowing Home Price GrowthFitch Ratings expects nominal home price growth to moderate to 6.5% in 2020 and 6% in 2021 from 7% projected for 2019. Despite the stable/positive economic outlook, intense foreign demand and limited housing supply supporting home price growth, macro-prudential measures put in place in 2Q18 to reduce high LTV origination will continue to prevent spectacular increases in home prices. We expect growth will continue to be highest in the Algarve, Lisbon and Porto.
Gradual real wage increases are expected from the ending of public-sector pay freezes, unemployment falling to 5.8% over the next two years from a projected 6.3% for 2019 and recent proposals to increase the monthly minimum wage by up to 25% to EUR750 by 2023. Nonetheless, Fitch Ratings expects wages to grow at half the rate of home price increases, which will reduce affordability.
Favourable Environment Supports PerformanceFitch Ratings forecasts stable mortgage performance with late-stage arrears decreasing to 5% by 2021 as stable economic growth, improving labour dynamics and low interest rates keep mortgages payments serviceable. Mortgages originated after 2015 will be more resilient to rate rises because more than 30% have been or are expected to be originated with an initial fixed-rate period of between five and 10 years, and because of recent regulatory requirements for loans to be underwritten based on a stressed interest rate and with lower LTVs. Borrowers with DTIs of lower than 50% increased by 12pp at end-1Q19 (from about 20% as at July 2018) and loans with LTVs over 90% reduced to just 1%.
More Social Housing PlannedFitch Ratings forecasts mortgage lending growth to remain at 5% in 2020 and 2021. The high level of competition in the banking sector and loose eurozone monetary policy will drive down mortgage rates for new loans to 1%, supporting lending growth. A newly approved integral housing law could also support origination in the medium term as it will offer significant benefits to those priced out of both the housing and rental market by encouraging social housing, which represents less than 4% of the current stock, well below the 15% in other European countries.
6
8
10
12
60
90
120
150
180
1996 2000 2004 2008 2013 2017 2021f
Home price index (real, rebased) (LHS)Disposable income per capita (real, rebased) (LHS)Home price-to-income per capita ratio (RHS)
Home Prices and Affordability
Source: Fitch Ratings, INE, Ameco, OECD, Haver Analytics
0
4
8
12
16
20
0
2
4
6
8
10
2002 2004 2007 2010 2013 2015 2018 2021f
Variable interest rate housing (LHS)Fitch Ratings 3m+ arrears (inc defaults) (LHS)% of Overdue loans for house purchase (LHS)Unemployement (RHS)
Unemployment, Mortgage Rates and Arrears
Source: Fitch Ratings, Bank of Portugal, Haver Analytics
(%) (%)
0
1
2
3
4
5
6
0
30
60
90
120
150
1996 2000 2004 2008 2013 2017 2021f
Outstanding housing loans (OMFIs) (LHS)
Quarterly new housing loans (RHS)(EURbn)
Mortgage Lending
Source: Fitch Ratings, Bank of Portugal, ECB, Haver Analytics
(EURbn)
RICARDOGARCIA
+34 91 702 [email protected]
Affordabilityconstraintspersistdespiterisingwageswhiletheeconomicoutlooksupports mortgage performance.

GLOBAL HOUSING AND MORTGAGE OUTLOOK – 2020
25 December 2019www.fitchratings.com
Affordability to Weaken as Prices RiseFitch Ratings expects nominal home prices to increase by 6% a year in 2020 and 2021 driven by sustained demand from foreign buyers attracted by investment opportunities and the Golden Visa scheme (residency visa on a minimum investment). Foreign real estate investment in 1H19 was about double the rate in 1H18, according to the Bank of Greece.
We expect foreign investment to drive home prices and rents to levels that are not affordable for the local population. Disposable income for residents increased by only 2.9% in 2018 compared with home price growth of 8%. We expect disposable income to rise by only about 4% a year over the next two years.
NPL Stock Expected to DecreaseWe expect the stock of NPLs and 3m+ arrears to decrease slightly in the medium term supported by NPL disposals and loan restructurings, which include the rescheduling of amortisation, interest rate renegotiation or both. In October 2019, the European Commission approved the Hercules Asset Protection Scheme, which will provide a state guarantee on senior tranches of NPL securitisations meeting certain conditions. The scheme will allow banks to offload up to EUR30 billion of NPLs (40% of the sector stock).
NPL reduction will also be supported by a scheme enacted in 1Q19, which allows banks to offer restructuring solutions to loans backed by primary residences. In Fitch Ratings view increasing property prices would also lead to higher recovery rates on NPL positions.
New Mortgage Lending Still LimitedNew mortgage lending is likely to remain close to historic lows despite slight increases in 2020 and 2021. We expect the growth in mortgage lending to lag behind the improving macroeconomic environment despite the enhanced liquidity positions of banks. Prepayment rates will remain low, also driven by limited refinancing opportunities.
Subdued domestic housing demand will not lead to an increase in new mortgage lending as long as wages continue to grow less than home prices. Foreign home acquisitions would not automatically boost new lending as they are predominantly cash purchases, or portfolio acquisitions funded by bespoke financing.
5
10
15
20
50
75
100
125
150
175
200
1998 2002 2007 2012 2017 2021f
Home price index (real, rebased) (LHS)Disposable income per capita (real, rebased) (LHS)Home price-to-income per capita ratio (RHS)
Home Prices and Affordability
Source: Fitch Ratings, Bank of Greece, Ameco, OECD
036912151821
05
101520253035
2006 2008 2010 2012 2015 2017 2019f 2021f
Bank of Greece 3m+ arrears (LHS)Unemployment (LHS)Mortgage rate new loans (RHS)Fitch Ratings RMBS 3m+ arrears including defaults (RHS)
Mortgage Rates and Arrears
Source: Fitch Ratings, Bank of Greece, Haver Analytics
(%) (%)
GreeceFitchRatingsexpectssolidhomepricegrowthdrivenbyoverseasdemand;affordabilityofdomestic buyers will tighten.
SARADENOVELLIS
+39 02 879087 [email protected]
0
3
6
9
12
15
18
0
1
2
3
4
5
2006 2008 2010 2012 2015 2017 2019f 2021f
Quarterly gross new mortgage lending (LHS)
Annualised prepayment rate (RHS)
Mortgage Lending and Prepayments
Source: Fitch Ratings, Bank of Greece, Ameco, OECD, Haver Analytics
(EURbn) (%)

GLOBAL HOUSING AND MORTGAGE OUTLOOK – 2020
26 December 2019www.fitchratings.com
Low Rates Fuel Home Price ReboundFitch Ratings forecasts nominal home price growth of 5% a year in 2020 and 2021, reversing the national decline of 8.4% from November 2017 to June 2019. Melbourne and Sydney, the markets that were most affected by the decline, will drive the recovery with double-digit growth forecast for 2020 slowing to high-single-digit growth in 2021 as the stimulus from lower interest rates taper off. The home price recovery will be supported by low mortgage rates, strong net migration and a moderate increase of investor purchases in 2020. The cash rate was cut by 75bp to 0.75% in 2019 and we anticipate a further 50bp reduction in 2020.
GDP Growth Drives Low ArrearsWe forecast 90+ day arrears to remain stable at 60bp in 2020 and 2021. Stronger projected economic growth of 2.3% in 2020 and 2.4% in 2021 (after 1.8% in 2019), stable employment and record low interest rates will support mortgage performance.
However, the potential economic slowdowns of key commercial partners (China, Japan, Korea and the US) are downside risks to the economic outlook. Home price-to-disposable income per capita of 12.9 times as of 2Q19 is among the highest of developed nations and poses risks to home prices and mortgage performance in the event of an economic shock. Building approvals for the year to August 2019 decreased by 21% and we project them to bottom out in 2020. If building activity were to continue to reduce further, unemployment and mortgage performance could worsen, because Australia’s construction industry comprises about 8% of GDP.
Credit Growth to Remain LowLending growth slowed in 2019 as lenders implemented a conservative interpretation of the lending standards of the Australia Prudential Regulatory Authority (APRA). In response to subdued credit growth, in July 2019 APRA relaxed the interest rate calculation for loan serviceability, which has led to greater maximum mortgage borrowing capacity. We project annual housing credit growth of 3.5% in 2020 and 4% in 2021 supported by the changes to the loan serviceability calculation and the expected increase in property sales.
6
8
10
12
14
16
100
150
2003 2005 2007 2009 2011 2013 2015 2017 2019 2021f
Home price index - 8 capitals (real, rebased) (LHS)Disposable income per capita (real, rebased) (LHS)Home price-to-income per capita ratio (RHS)
Home Prices and Affordability
Source: Fitch Ratings, CoreLogic, ABS, OECD, Haver Analytics
0
2
4
6
8
10
12
0.0
0.2
0.4
0.6
0.8
1.0
2003 2005 2007 2009 2011 2013 2015 2017 2019 2021f
Fitch Ratings Dinkum Index - 90+ days (LHS)Aus discounted lending rate (RHS)Unemployment (RHS)Underemployment - proportion of employed (RHS)
Mortgage Rates and Arrears
Source: Fitch Ratings, RBA, ABS, Haver Analytics
(%) (%)
0
10
20
30
40
0
5
10
15
20
25
2003 2005 2007 2009 2011 2013 2015 2017 2019 2021f
Annual Housing Credit Growth (LHS)
Fitch Ratings Dinkum prepayments (RHS)(%)
Mortgage Lending and Prepayments
Source: Fitch Ratings, RBA Haver Analytics
(%)
Australia
We expect national home prices to rebound with 5% growth in 2020 and 2021.
CHRISSTANKOVSKI
+61 2 8256 [email protected]

GLOBAL HOUSING AND MORTGAGE OUTLOOK – 2020
27 December 2019www.fitchratings.com
Moderate Tier 3 Home Price Decline We expect flat nominal home prices in Tier 1 and 2 cities while Tier 3 cities will experience declines of 3% in each of the next two years. Real prices will decline for all three tiers. We do not expect price growth, because the purchasing restrictions from the regulator that have curbed demand in recent years continue to be enforced. Tier 3 cities face less robust demand and oversupply, but the risk of greater declines is mitigated by new regulations that encourage rural populations to move to lower-tier cities. Fitch Ratings believes that the government will maintain its resolve to limit speculative housing investments. However, home purchase restrictions could be relaxed in a more severe downturn to stabilise home prices, especially in Tier 3 cities.
Stable Mortgage PerformanceFitch Ratings forecasts annual mortgage NPLs to remain at 0.3% through 2021 despite GDP growth forecasts for each of 2020 and 2021 to be lower than previous years at 5.7%. Low interest rates coupled with stable employment and rising incomes will support mortgage performance and offset the serviceability pressure stemming from the fast growth of household debt than disposal income. Regulatory restrictions related to underwriting requirements (e.g. maximum LTV and a higher interest rate for non-FTBs) may be relaxed if economic growth falters. However, underwriting requirements are tight by global standards and Fitch Ratings does not expect a short-term deterioration of performance.
Sustained Credit Growth ContinuesFitch Ratings expects mortgage lending growth to decelerate slightly but to remain at a high level with the balance of outstanding mortgages growing by 15% in both 2020 and 2021 from 17% projected for 2019. Slowing demand for housing upgrades, as well as restrictions on speculative demand will contribute to decelerating mortgage growth, although the central bank’s monetary easing policies continue to support liquidity in the banking system and banks remain incentivised to provide mortgage loans. Fitch Ratings does not think the recent change of benchmark rate to a more market-driven Loan Prime Rate will materially affect mortgage rates for FTBs, given that banks price their loans based on the government’s rate benchmark and the continued government desire to contain speculative housing purchases.
0
20
40
60
75
100
125
150
175
2009 2011 2013 2015 2017 2019 2021f
Home Price - Tier 1 cities (4 largest citiesª) (LHS, real)Home Price - Tier 2 cities (31 citiesᵇ) (LHS, real)Home Price - Tier 3 cities (other 35 cities) (LHS, real)Disposable annual income per capita (RHS)
Home Prices and Affordability
ª (Beijing, Shanghai, Shenzhen & Guangzhou)b (Capitals of provinces and autonomous regions), Real Home Price is calculated by NBS nominal home price divided by CPI growth rate since 2010Source: Fitch Ratings, NBS China, OECD, Haver Analytics
(CNY 000)(HPI)
0.0
0.2
0.4
0.6
0.8
0
2
4
6
8
10
2009 2011 2013 2015 2017 2019f 2021f
Financial institutions' WA mortgage interest rate (LHS)Unemployment (LHS)Annual residential mortgage NPL ratio (RHS)
Mortgage Rates and Arrears
Source: Fitch Ratings, NBS China (National Bureau of Statistics)
0.00.30.60.91.21.51.82.1
05
1015202530354045
2013 2014 2015 2016 2018 2019 2020f 2021f
Mortgage outstanding balance (LHS)Quarterly net new mortgage lending (RHS)
Mortgage Lending
Source: Fitch Ratings, NBS China (National Bureau of Statistics)
(CNYtrn) (CNYtrn)
China
Tier 3 home prices will decline moderately. Serviceability and mortgage performance will remain stable.
HILARYTAN
+852 2263 [email protected]

GLOBAL HOUSING AND MORTGAGE OUTLOOK – 2020
28 December 2019www.fitchratings.com
Home Prices to Drop in 2020 Fitch Ratings expects nominal new condo prices to decline by 2% in 2020, as investment demand from non-residents due to the Tokyo Olympics ends and strong demand from domestic buyers for second-hand properties compresses the price of new condos. The 2% rise of new condo prices projected for 2019 has led to more second-hand housing being put up for sale; the second-hand supply now exceeds the supply of new condos.
However, Fitch Ratings believes that new condo prices will stabilise in 2021 due to their limited supply and continued high construction costs and land prices. The low interest rates and 10-year tax reduction on mortgage loans also support Japanese prices, helping borrowers’ ability to purchase expensive properties. Over the longer term, demographic movement in Japan is likely to put downward pressure on home prices as the number of households is expected to fall from 2025 as the population declines.
Stable Performance to ContinueWe expect 3m+ mortgage arrears to remain low at 0.2% over the next two years due to low mortgage interest rates driven by negative policy rates (Fitch Ratings forecasts -0.1% in 2020 and 2021) and a gradual improvement in household incomes, supported by low unemployment rates (2.5% in 2020 and 2021). Fitch Ratings believes that an unexpected decrease in employment or household income would lead to a deterioration of mortgage loan performance. Younger borrowers (30-40 years old) are purchasing new homes at higher prices and their household debt-to-income ratios are higher than for senior borrowers. This makes them more exposed to an economic downturn. However, Fitch Ratings does not expect the Japanese economy to slow rapidly. We forecast the GDP growth of 0.4% in 2020 and 0.6% in 2021.
Low Credit Growth and RepaymentsFitch Ratings forecasts new mortgage lending growth of -3% in 2020 and 0% in 2021, following a slight increase in 2019.
Fitch Ratings expects banks to be less active in mortgage lending as the spreads of mortgage loans have already tightened in light of the competitive lending market and low policy rates. A slowdown of refinancing activities, which leads to low prepayments, also compresses new mortgage lending volume over this period.
10
15
20
25
30
0
50
100
150
200
2001 2005 2009 2013 2017 2021f
Home price index of New Condo (real, rebased) (LHS)Disposable income per capita (real, rebased) (LHS)Home price-to-income per capita ratio (New Condo, RHS)
Home Prices and Affordability
Source: Fitch Ratings, STAT.GO (Statistics Japan), Ameco, OECD
0
1
2
3
4
5
6
0.0
0.2
0.4
0.6
0.8
1.0
2001 2005 2009 2013 2017 2021f
Market 3m+ arrears (LHS)Mortgage rate (new fixed loans, RHS)Unemployment (RHS)
Mortgage Rates and Arrears
Source: Fitch Ratings, STAT.GO (Statsitics Japan), Japan Housing Finance Agency
(%) (%)
0
4
8
12
16
0
8,000
16,000
24,000
32,000
2001 2005 2009 2013 2017 2021f
Annual gross new mortgage lending (LHS)
Annualised prepayment rates (RHS)(JPYbn)
Mortgage Lending and Prepayments
Source: Fitch Ratings, STAT.GO (Statistics Japan), Japan Housing Finance Agency
(%)
JapanFitch Ratings forecasts a small home price fall after the Olympics but stable mortgage performance next year.
HITOSHIHIBINO
+81 3 3288 [email protected]
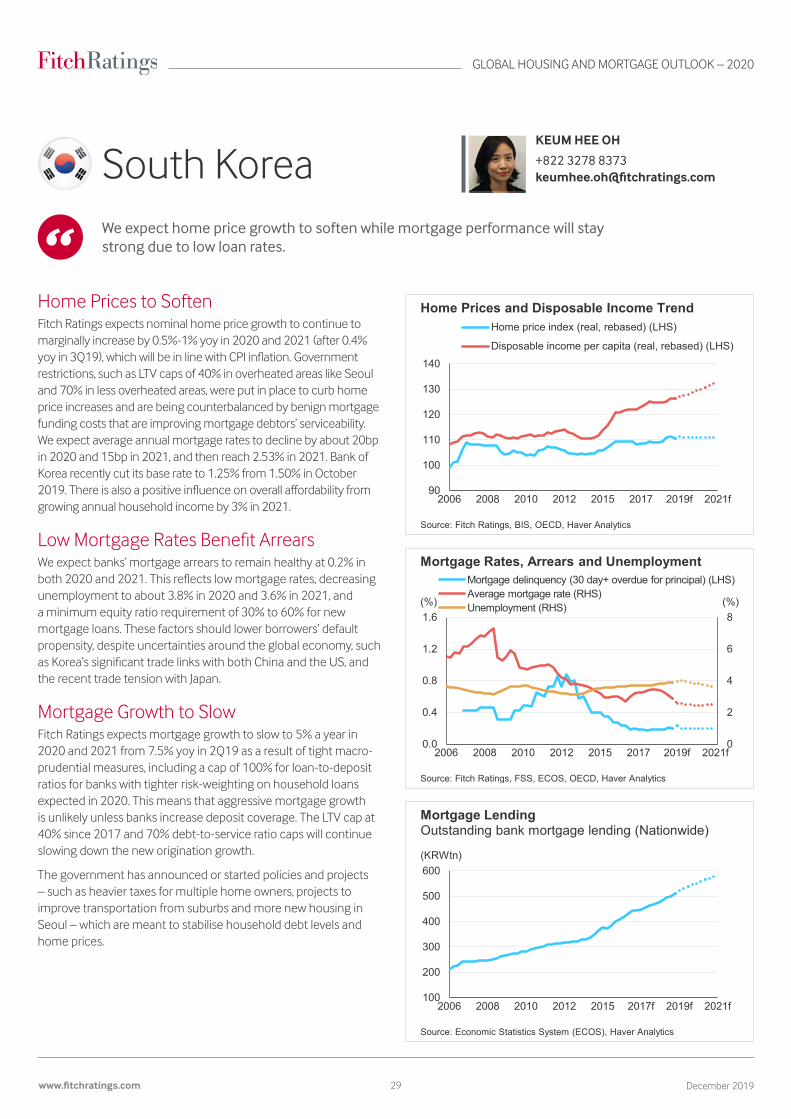
GLOBAL HOUSING AND MORTGAGE OUTLOOK – 2020
29 December 2019www.fitchratings.com
South Korea
Home Prices to SoftenFitch Ratings expects nominal home price growth to continue to marginally increase by 0.5%-1% yoy in 2020 and 2021 (after 0.4% yoy in 3Q19), which will be in line with CPI inflation. Government restrictions, such as LTV caps of 40% in overheated areas like Seoul and 70% in less overheated areas, were put in place to curb home price increases and are being counterbalanced by benign mortgage funding costs that are improving mortgage debtors’ serviceability. We expect average annual mortgage rates to decline by about 20bp in 2020 and 15bp in 2021, and then reach 2.53% in 2021. Bank of Korea recently cut its base rate to 1.25% from 1.50% in October 2019. There is also a positive influence on overall affordability from growing annual household income by 3% in 2021.
Low Mortgage Rates Benefit ArrearsWe expect banks’ mortgage arrears to remain healthy at 0.2% in both 2020 and 2021. This reflects low mortgage rates, decreasing unemployment to about 3.8% in 2020 and 3.6% in 2021, and a minimum equity ratio requirement of 30% to 60% for new mortgage loans. These factors should lower borrowers’ default propensity, despite uncertainties around the global economy, such as Korea’s significant trade links with both China and the US, and the recent trade tension with Japan.
Mortgage Growth to SlowFitch Ratings expects mortgage growth to slow to 5% a year in 2020 and 2021 from 7.5% yoy in 2Q19 as a result of tight macro-prudential measures, including a cap of 100% for loan-to-deposit ratios for banks with tighter risk-weighting on household loans expected in 2020. This means that aggressive mortgage growth is unlikely unless banks increase deposit coverage. The LTV cap at 40% since 2017 and 70% debt-to-service ratio caps will continue slowing down the new origination growth.
The government has announced or started policies and projects – such as heavier taxes for multiple home owners, projects to improve transportation from suburbs and more new housing in Seoul – which are meant to stabilise household debt levels and home prices.
90
100
110
120
130
140
2006 2008 2010 2012 2015 2017 2019f 2021f
Home price index (real, rebased) (LHS)
Disposable income per capita (real, rebased) (LHS)
Home Prices and Disposable Income Trend
Source: Fitch Ratings, BIS, OECD, Haver Analytics
0
2
4
6
8
0.0
0.4
0.8
1.2
1.6
2006 2008 2010 2012 2015 2017 2019f 2021f
Mortgage delinquency (30 day+ overdue for principal) (LHS)Average mortgage rate (RHS)Unemployment (RHS)
Mortgage Rates, Arrears and Unemployment
Source: Fitch Ratings, FSS, ECOS, OECD, Haver Analytics
(%) (%)
100
200
300
400
500
600
2006 2008 2010 2012 2015 2017f 2019f 2021f
(KRWtn)
Mortgage LendingOutstanding bank mortgage lending (Nationwide)
Source: Economic Statistics System (ECOS), Haver Analytics
We expect home price growth to soften while mortgage performance will stay strong due to low loan rates.
KEUMHEEOH
+822 3278 [email protected]

GLOBAL HOUSING AND MORTGAGE OUTLOOK – 2020
30 December 2019www.fitchratings.com
New Zealand
LTV Restrictions Limit Price Growth Fitch Ratings expects nominal home price growth of 3% in 2020 and 3.5% in 2021, which is slightly below the 3.6% growth in the year to September 2019, but still above CPI inflation. The strongest growth is expected in Christchurch and Auckland. The continued application of the Reserve Bank of New Zealand’s (RBNZ) LTV ratio restrictions and the continuation of the non-resident investment restrictions on existing properties are expected to partly offset the positive pressure from the favourable economic environment and low interest rates. Fitch Ratings forecasts a cut to the official cash rate to 0.5% in 2020 from 1% as at November 2019. High net migration of about 50,000 a year is likely to fill new housing resulting from the higher building approval consents over recent years. Demand should support further construction, subject to capacity constraints, and home prices in the short to medium term.
Low Arrears Hinge on Benign EconomyWe expect mortgage performance to increase from the current unsustainably low base with 90+ days’ arrears increasing to 0.4% by 2021, representing strong performance. Mortgage performance will be supported by a tight labour market, with unemployment projected to fall slightly to 4% in 2020-2021, as well as solid economic growth and the low interest rates. Short fixed-rate periods of one to three years are common in New Zealand, so borrowers will benefit from the lower rates on a delayed basis. About 65% of mortgages reprice within one year while 90% reprice within two years. Downside risks remain as real GDP growth for New Zealand’s main trading partners (Australia, China, Japan and the US) has deteriorated through 2019 and if continued in 2020 may apply downward pressure to GDP. This could result in an increase in unemployment, negatively affecting mortgage performance.
Stable Mortgage Lending GrowthFitch Ratings expects mortgage credit growth to remain stable at 5% for 2020 and 2021. The RBNZ continues to apply LTV restrictions on the banks’ new lending with regards to both investment loans and owner occupied loans. In the current low interest rate environment, we do not expect that the RBNZ will relax in 2020-2021 the LTV restrictions, which have tempered both home price and credit growth for the past two years.
6
8
10
12
14
100
125
150
175
200
225
250
2003 2006 2009 2012 2015 2018 2021f
Home price index (real, rebased) (LHS)Disposable income per capita (real, rebased) (LHS)Home price-to-income per capita ratio (RHS)
Home Prices and Affordability
Source: Fitch Ratings, Statistics New Zealand, RBNZ, OECD, Haver Analytics
0.0
0.4
0.8
1.2
1.6
2.0
02468
1012
2003 2006 2009 2012 2015 2018 2021f
Mortgage interest rate floating (LHS)Unemployment rate (LHS)Mortgage interest 2yr fixed rate (LHS)Fitch Ratings 3m+ arrears (%, RHS)
Mortgage Rates and Arrears
Source: Fitch Ratings, RBNZ, Haver Analytics
(%) (%)
0
10
20
30
0
4
8
12
16
20
24
2003 2006 2009 2012 2015 2018 2021f
Quarterly gross new mortgage lending (LHS)
Annualised prepayment rate (RHS)(NZDbn)
Mortgage Lending and Prepayments
Source: Fitch Ratings, RBNZ , Haver Analytics
(%)
Regulation restrictions continue to limit home price growth despite decreasing mortgage rates.
CHRISSTANKOVSKI
+61 2 8256 [email protected]

GLOBAL HOUSING AND MORTGAGE OUTLOOK – 2020
31 December 2019www.fitchratings.com
Modest Home Price Growth Fitch Ratings expects nominal home price growth to remain about 2% in both 2020 and 2021 (down from nearly 8% in 2018). We expect home price growth to reflect the recovering real GDP growth rates of 1.5% in both 2020 and 2021 after growth decelerated to 0.6% in 1H19. Fitch Ratings expects that improving borrower affordability, as household incomes grow faster than home prices, and lower interest rates will also contribute to rising home prices.
Home prices declined by 0.7% from 3Q18 to 1Q19, because of regulatory tightening and mortgage rate increases, which dampened market sentiment. Home prices rebounded slightly in 2Q19 and Fitch Ratings projects minor growth for the rest of 2019. If the government views home prices as rising more than is justified by economic fundamentals, we expect the government would again cool the market through macro-prudential measures.
Low Arrears Supported by Healthy Serviceability Fitch Ratings expects the housing NPL ratio to increase slightly but stay low at 0.4%-0.5% in 2020-2021, supported by the improving household debt to income ratio. Mortgage performance will also be supported by continued low unemployment of about 2% in 2020 and 2021.
Fitch Ratings does not expect an increase of mortgage rates in the near future, which would support borrowers’ ability to pay and stable loan performance. Mortgage rates rose rapidly to 2% at the end of 1H19 due to a sharp rise in the benchmark rates. However, Singapore’s benchmark rate has started to decline following the US’s rate cut in mid-2019.
Subdued Lending GrowthFitch Ratings forecasts mortgage lending growth to remain weak in the near term. After a projected small decline of 0.5% in 2019, we expect 2% annual growth in each of 2020 and 2021 in line with improving market sentiment. The lending growth slowdown in 2019 reflected the increase of the additional buyer’s stamp duty and tightening of LTV limits in July 2018. However, the growth is expected to remain limited, reflecting expectations for a slowing annual population growth of below 1% and the high likelihood that the government would apply cooling measures if home prices show signs of overheating.
60
80
100
120
140
160
180
2000 2003 2006 2009 2012 2015 2018 2021f
Home price index (real, rebased)
Household income (real, rebased)
Home Prices and Affordability
Source: Fitch Ratings, URA, Singapore Dept of Statistics, Haver Analytics
0.0
0.5
1.0
1.5
2.0
0
1
2
3
4
5
6
2000 2003 2006 2009 2012 2015 2018 2021f
3-Month SIBOR (LHS)Unemployment (LHS)Industry Housing NPLsª (RHS)
SIBOR, Unemployment & Arrears
Source: Fitch Ratings, MAS, Haver Analytics
(%)
SingaporeFitch Ratings expects modest increases in home prices due to macro-prudential measures, and stablemortgageperformanceanchoredbystronghouseholdfinances.
HITOSHIHIBINO
+81 3 3288 [email protected]
60
100
140
180
220
260
300
2000 2003 2006 2009 2012 2015 2018 2021f
Mortgages, indexed
Residential property assets, indexed
Mortgage Lending
Source: Fitch Ratings, SDS, Haver Analytics

GLOBAL HOUSING AND MORTGAGE OUTLOOK – 2020
32 December 2019www.fitchratings.com
Real Home Prices Still UnderperformingFitch Ratings expects real home price growth to fall by about 2.5% in 2020 and 1.7% in 2021, based on nominal increases of 1% and 2%, respectively. Pension, administrative and fiscal reforms are likely to sustain the improvement in the economy, which, along with rising, but still low interest rates (4.5% in 2020 and 6.5% in 2021), should support higher demand and a stabilisation of real home prices over the next few years.
In the shorter term, we expect small increases in nominal home prices based on demand being strengthened by the improving macroeconomic environment and stronger household credit growth, but we do not expect growth in real terms.
Affordability remains favourable as we forecast minor improvements in real disposable income per capita.
Stable Performance but New Concerns Lower mortgage rates support resilient performance. The policy rate SELIC dropped to a historical low of 5% in November after several rate reductions by the central bank. Falls in mortgage rates are expected after new rates from the main financial institutions have dropped to 7.5% from 8.5%. As a result, arrears for the outstanding mortgage portfolio, which are mostly indexed to TR (Taxa Referencial), which has been zero since 2017, plus a fixed interest rate, would not be affected. However, inflation increases could potentially impact performance of new inflation-indexed loans originated under the Sistema Financiero da Habitação.
Attempt to Boost Housing MarketNew mortgage financing rules introduced in August 2019 to allow inflation-indexed loans aim to increase liquidity for the housing market as the new type of loans would be more suitable for securitisation. However, we do not expect this product to boost origination volumes as the exposure to an inflation index is less attractive to borrowers despite its lower-than-expected growth of 2.5% yoy. Given historically volatile inflation, this could lead to worse performance for these loans.
We view the government support as a positive development, but we do not expect it to be sufficient to increase housing demand and real home prices. Sustainable improvements in the macroeconomic environment are more likely to increase consumer confidence and new lending over the coming years.
0
5
10
15
20
0
50
100
150
200
250
2009 2011 2013 2015 2017 2019 2021f
Home price index (real, rebased) (LHS)Disposable income per capita (real, rebased) (LHS)Home price-to-income per capita ratio (RHS)Gross rental yield p.a. rebased (RHS)
Home Prices and Affordability
Source: Fitch Ratings, FIPE, IBGE (Instituto Brasileiro de Geografia e Estatistica), Haver Analytics
0
3
6
9
12
15
2012 2013 2014 2016 2017 2018 2020f 2021f
Mortgage rates Market 90+ days arrears
Unemployment Selic rate
Mortgage Rates and Arrears
Source: Fitch Ratings, BCB (Banco Central do Brasil). Haver Analytics
0
2
4
6
8
10
0
10
20
30
40
2009 2011 2013 2015 2017 2019 2021f
Quarterly real new lending (LHS)Mortgages/GDP ratio (RHS)Savings deposit/GDP ratio (RHS)
Mortgage Lending and Funding
Source: Fitch Ratings, BCB (Banco Central Do Brasil), ABECIP (Association of Brazilian Real Estate Loans and Savings Companies), Haver Analytics
(BRLbn) (%)
BrazilWeexpectrisingGDPgrowthcoupledwithlowinflationandinterestratestosupportrealhomeprices stabilisation in the long run.
MARCELOLEITÃO
+55 11 4504 [email protected]

GLOBAL HOUSING AND MORTGAGE OUTLOOK – 2020
33 December 2019www.fitchratings.com
Supply Deficit Drives Home Price GrowthFitch Ratings expects nominal home prices to grow by 5% in both 2020 and 2021 (down from the 7.5% projected for 2019), which represents growth of about 1.5% in real terms. This year’s strong home price growth was due to higher construction costs being transferred to buyers, but construction costs should be stable over the next two years.
A 5% yoy contraction in housing supply as of June 2019 and abandoned housing projects have increased the housing deficit providing support for real price growth. The recently published National Housing Plan for 2019-2024 is focused on the housing deficit and targets the low income segment. We do not expect a near-term impact on home prices from the plan given the time needed for its implementation. Demand for housing is likely to be weak for low-income borrowers due to the 75% reduction in federal subsidies for home purchase that occurred in 2019.
Loan Performance Remains StableFitch Ratings expects 3m+ mortgage arrears for banks to be stable at 2.5% over the next two years due to the fixed-rate nature of the market and expectations of decreasing interest rates for new loans (10% for the next two years, compared with 10.7% at 1Q19). The reduction in interest rates could also result in more mortgage refinancing and prevent new defaults.
We do not expect increases in delinquency levels for loans (mainly to low-income borrowers) originated by Infonavit and Fovissste (government institutions), given that payment is by payroll deduction and because of recent debt relief programmes proposed by Infonavit that target performing borrowers.
Fitch Ratings forecasts stable unemployment at about 3.5%, which is well below crisis levels. This should not have any impact on performance.
Mortgages Origination IncreasingWe forecast stable growth of 4% for new mortgage originations in both 2020 and 2021. Infonavit and Fovissste will continue to be the most important mortgage providers for low-income borrowers. Originations from banks are likely to increase, mainly supported by government initiatives to reach more borrowers and from new mortgage products produced by alliances between banks, Infonavit and SHF (the Mexican housing fund).
0
2
4
6
50
75
100
125
150
2006 2008 2010 2012 2015 2017 2019f 2021f
Home price index (real, rebased) (LHS)Disposable income per capita (real, rebased) (LHS)Home price-to-income per capita ratio (RHS)
Home Prices and Affordability
Source: Fitch Ratings, SHF OECD, INEGI, Haver Analytics
0
2
4
6
0
5
10
15
20
25
2001 2005 2009 2013 2017 2021f
Banks mortgage rate new loans (LHS)Banks Index 3m+ arrears (LHS)Unemployment (RHS)
Mortgage Rates and Arrears
Source: Fitch Ratings, Banxico, INEGI, Haver Analytics
(%) (%)
0%
10%
20%
30%
40%
50%
0
1
2
3
4
5
6
1996 2000 2004 2008 2013 2017 2021f
Outstanding residential mortgage balance (LHS)Outstanding residential mortgage balance to GDP (RHS)
(MXNtn)
Mortgage LendingCommercial banks
Source: Fitch Ratings, Banxico, INEGI
(%)
MexicoWe expect real home price growth to slow due to stabilised construction costs. Mortgage performance will remain stable.
ELSA SEGURA
+52 81 8399 [email protected]

GLOBAL HOUSING AND MORTGAGE OUTLOOK – 2020
34 December 2019www.fitchratings.com
Home Prices Grow as the Economy Improves Fitch Ratings expects nominal home prices growth of 7% a year in 2020 and 2021 (from 6.5% projected for 2019), which is about 3.4% in real terms. The growth rate will be sustained by improving macroeconomic indicators, growing homeowner confidence and a new government housing scheme expected by the end of 2020. The government proposals aim to boost housing demand by allowing banks to offer higher LTVs, while directly providing new guarantees for non-social housing borrowers, subsidies for low-income housing, and flexible credit lines for home builders. Home prices should still increase but at a slower pace even if the government proposals are not approved in 2020 due to the 2.6% yoy contraction of the construction sector, which worsened the supply/demand imbalance.
Performance Sensitive to Unemployment LevelsThe percentage of mortgages in 4m+ arrears is expected to rise marginally over the next two years from 3.1% in 2019 to 3.4% in 2021, due to the sustained high unemployment level of around 9.7%. The 30bp increase will mean even more borrowers in arrears, following the above average growth of the country’s stock of residential loans by 18% over the past eighteen months. We expect lending rules to remain cautious. The average LTV was about 50% over the past three years, below the limit of 70%. We believe mortgage rates will increase slightly in line with the 50bp increases Fitch Ratings forecasts for the policy rate over the next two years. The fixed-rate nature of loans makes mortgage performance less sensitive to interest rate shifts.
Strong Credit Growth and Low PrepaymentsFitch Ratings expects new lending volumes to increase at 10% a year in 2020 and 2021, supported by the government’s goal to make housing more affordable and the expected decrease of capital requirements for mortgage originators. Looser bank capital requirements are likely to increase originators’ risk appetite for mortgage loans, which will increase the supply of mortgage debt but could negatively affect mortgage performance in the medium term. Prepayments are forecast to stabilise at about 15% a year in 2020 and 2021 in line with possible increases in the mortgage rates.
10
15
20
25
50
75
100
125
150
175
1998 2002 2007 2012 2017 2021f
Home price index (real, rebased) (LHS)Disposable income per capita (real, rebased) (LHS)Home price-to-income per capita ratio (RHS)
Home Prices and Affordability
Source: Fitch Ratings, Banrep, DANE, Asobancaria, Haver Analytics
6
8
10
12
14
16
18
0
5
10
15
20
25
2001 2005 2009 2013 2017 2021f
Banks mortgage rate new loans (LHS)Banks Index 4m+ arrears (LHS)Policy Interest Rate (LHS)Unemployment (RHS)
Mortgage Rates and Arrears
Source: Fitch Ratings, Banrep, Superintendencia Financiera, DANE, Haver Analytics
(%) (%)
10%
15%
20%
25%
30%
35%
40%
0
20
40
60
80
100
1998 2002 2007 2012 2017 2021f
Outstanding residential mortgage balance (LHS)Prepayments (RHS)(COPtn)
Mortgage Lending and PrepaymentsCommercial banks, Fondo Nacional del Abhorro and Leasing Co.
Source: Fitch Ratings, Superintendencia Financiera, Titularizadora Colombiana
(%)
ColombiaProposed government measures to spur the mortgage market could lead to an increase in lending and real home prices.
MARIANAZULUAGA
+57 (1) 484-6770 [email protected]

GLOBAL HOUSING AND MORTGAGE OUTLOOK – 2020
35 December 2019www.fitchratings.com
Country
SovereignEnvironment Unemployment(%) RealGDPGrowth(%) Short-termRates(%) OverallMacroEvaluation
IDRa BSIb
MPIc (lastyear) 2019f 2020f 2021f 2019f 2020f 2021f 2019f 2020f 2021f Outlookf
Changevs
2019e
Nor
th
Am
eric
a USA AAA a 1 (1) 3.7 3.6 3.7 2.3 1.7 1.7 1.8 1.8 2.0 Stable
CAN AAA aa 2 (1) 5.7 5.7 5.7 1.7 1.6 1.7 1.8 1.8 2.0 Stable
Euro
pe
UK AA a 1 (1) 3.9 4.1 4.3 1.3 1.3 1.8 0.8 0.8 1.3 Stable/Negative
GER AAA a 1 (1) 3.2 3.4 3.6 0.6 0.9 1.3 0.0 0.0 0.0 Stable
NLD AAA a 1 (1) 3.6 3.4 3.4 1.7 1.5 1.8 0.0 0.0 0.0 Stable
FRA AA a 1 (1) 8.7 8.5 8.5 1.4 1.4 1.5 0.0 0.0 0.0 Stable
BEL AA- a 2 (2) 5.5 5.5 5.5 1.1 1.0 1.2 0.0 0.0 0.0 Stable
DEN AAA a 1 (1) 5.0 4.7 4.7 1.9 1.6 1.6 0.0 0.0 0.0 Stable
SWE AAA aa 1 (1) 6.7 7.0 7.0 1.3 1.2 1.5 -0.3 0.0 0.0 Stable
NOR AAA a 2 (2) 3.3 3.1 3.1 2.5 2.1 1.8 1.3 1.7 1.7 Stable
IRL A+ bbb 1 (1) 5.1 4.8 4.8 5.1 3.1 2.5 0.0 0.0 0.0 Stable
ESP A- bbb 1 (1) 14.1 13.5 13.3 2.0 1.7 1.7 0.0 0.0 0.0 Stable
ITA BBB bbb 1 (1) 10.0 9.8 9.7 0.2 0.4 0.6 0.0 0.0 0.0 Stable/Negative
PRT BBB bb 1 (1) 6.3 6.0 5.8 1.9 1.7 1.9 0.0 0.0 0.0 Stable/Positive
GRC BB- ccc 1 (1) 18.2 16.8 16.0 1.9 2.2 2.0 0.0 0.0 0.0 Stable/Positive
Asia-Pacific
AUS AAA aa 1 (1) 5.2 5.2 5.0 1.8 2.3 2.4 0.8 0.3 0.3 Stable
CHN A+ bb 1 (1) 5.2 5.4 5.4 6.1 5.7 5.7 3.2 3.1 3.1 Stable
JPN A a 2 (2) 2.4 2.5 2.5 1.0 0.4 0.6 -0.1 -0.1 -0.1 Stable
KOR AA- a 1 (1) 4.0 3.8 3.6 1.9 2.2 2.5 1.3 1.0 1.0 Stable
NZL AA a 1 (1) 4.1 4.0 4.0 2.2 2.4 2.6 1.4 0.5 0.7 Stable
SG AAA aa 2 (2) 2.2 2.0 2.0 0.5 1.5 1.5 1.4 1.4 1.6 Stable
Latin
Am
eric
a BRA BB- bb 1 (1) 12.0 11.6 11.0 1.1 2.2 2.5 4.5 4.5 6.5 Stable
MEX BBB bbb 1 (1) 3.6 3.6 3.5 0.0 1.0 2.0 7.3 6.8 6.3 Stable
COL BBB bbb 1 (1) 9.9 9.8 9.6 3.2 3.3 3.5 4.5 4.5 5.0 Stable/Positive
Macro Indicators
Legenda IDR: Issuer Default Ratingb AsofOctober2019;theBankSystemIndicator(BSI)isasystemweightedaverageofbankstandalonestrengthasmeasuredbybanks’ViabilityRatings.c As of October 2019; with the Macro-Prudential Indicator (MPI) Fitch Ratings systematicallymonitorsmacro-prudentialrisksonascalefrom‘1’(low)to‘3’(high).
d Short-term rates shown are end-of-period policy rates in the US, Canada, the Eurozone, Australia, Japan, South Korea, Brazil and Mexico, the One-year Medium-Term Lending Facility rate in China and annual average policy rates for the others.
e Outlookonafive-notchscale(Positive,Stable/Positive,Stable,Stable/Negative,Negative).f Change of Outlook evaluation compared with evaluation a year ago. Changes are (positive), (unchanged), or (negative).
Source: Fitch Ratings

GLOBAL HOUSING AND MORTGAGE OUTLOOK – 2020
36 December 2019www.fitchratings.com
ContactsALLASIROTIC | US
+1 212 908 [email protected]
ALESSANDROPIGHI | Netherlands,Ireland
+44 20 3530 [email protected]
SUSANHOSTERMAN | Canada
+1 212 908 [email protected]
DUNCANPAXMAN | UK
+44 20 3530 [email protected]
THOMASKRUG,CFA | Germany
+49 69 768076 [email protected]
EBERHARDHACKEL | Germany
+49 69 768076 [email protected]
BERNHARDSTRAETER,CFA | Netherlands
+44 20 3530 [email protected]
RAULDOMINGO | France
+33 1 44 29 91 [email protected]
MATTHIEUCHEYLUS | France
+33 1 44 29 91 [email protected]
WILLIAMROSSITER | Belgium
+33 1 44 29 91 [email protected]
ALEXIAKOREAS | Belgium
+33 1 44 29 91 [email protected]
ROBERTODELRAGNO | Sweden,Greece
+39 02 879087 [email protected]
COSMEDEMONTPELLIER Sweden,Denmark,Norway
+44 20 3530 [email protected]
OLGAKASHKINA | Denmark
+49 69 768076 [email protected]
JULIENCARON | Norway
+33 1 44 29 91 [email protected]
HAIDERSARWAR,CFA | Ireland
+44 20 3530 [email protected]
RICARDOGARCIA | Spain,Portugal
+34 91 702 [email protected]
JUANDAVIDGARCIA | Spain,Portugal
+34 91 702 [email protected]
NICOLASELVAGGI | Italy
+39 02 879087 [email protected]
DOMENICOGRAZIANO | Italy
+39 02 879087 [email protected]

GLOBAL HOUSING AND MORTGAGE OUTLOOK – 2020
37 December 2019www.fitchratings.com
SARADENOVELLIS | Greece
+39 02 879087 [email protected]
CHRISSTANKOVSKI | Australia,NewZealand
+61 2 8256 [email protected]
HILARYTAN | China
+852 2263 [email protected]
TIANTIANZHANG | China
+86 21 6898 [email protected]
TRACYWAN,CFA | China
+86 10 8517 [email protected]
HITOSHIHIBINO | Japan,Singapore
+81 3 3288 [email protected]
ATSUSHIKURODA | Japan,Korea
+81 3 3288 [email protected]
KEUMHEEOH | Korea
+822 3278 [email protected]
ARVINDRANA | Singapore
+852 2263 [email protected]
JUANPABLOGIL | Brazil,Mexico,Colombia
+56 2 2499 [email protected]
MARCELOLEITÃO | Brazil
+55 11 4504 [email protected]
ELSA SEGURA | Mexico
+52 81 8399 [email protected]
MARIANAZULUAGA | Colombia
+57 (1) 484-6770 [email protected]

GLOBAL HOUSING AND MORTGAGE OUTLOOK – 2020
38 December 2019www.fitchratings.com
ALL FITCH CREDIT RATINGS ARE SUBJECT TO CERTAIN LIMITATIONS AND DISCLAIMERS. PLEASE READ THESE LIMITATIONS AND DISCLAIMERS BY FOLLOWING THIS LINK: HTTPS://WWW.FITCHRATINGS.COM/SITE/DEFINITIONS?RD_FILE=INTRO. IN ADDITION, RATINGDEFINITIONS AND THE TERMS OF USE OF SUCH RATINGS ARE AVAILABLE ON THEAGENCY’SPUBLICWEBSITEATWWW.FITCHRATINGS.COM.PUBLISHEDRATINGS,CRITERIA,ANDMETHODOLOGIESAREAVAILABLEFROMTHISSITEATALLTIMES.FITCH’SCODEOFCONDUCT,CONFIDENTIALITY,CONFLICTSOFINTEREST,AFFILIATEFIREWALL,COMPLIANCE,ANDOTHERRELEVANTPOLICIESANDPROCEDURESAREALSOAVAILABLEFROMTHECODEOFCONDUCTSECTIONOFTHISSITE.FITCHMAYHAVEPROVIDEDANOTHERPERMISSIBLESERVICETOTHERATEDENTITYORITSRELATEDTHIRDPARTIES.DETAILSOFTHISSERVICEFORRATINGSFORWHICH THE LEAD ANALYST IS BASED IN AN EU-REGISTERED ENTITY CAN BE FOUND ON THE ENTITY SUMMARY PAGE FOR THIS ISSUER ON THE FITCH WEBSITE. Copyright © 2019 by Fitch Ratings, Inc., Fitch Ratings Ltd. and its subsidiaries. 33 Whitehall Street, NY, NY 10004. Telephone: 1-800-753-4824, (212) 908-0500. Fax: (212) 480-4435. Reproduction or retransmission in whole or in part is prohibited except by permission. All rights reserved. In issuing and maintaining its ratings and in making other reports (including forecast information), Fitch relies on factual information it receives from issuers and underwriters and from other sources Fitch believes to be credible. Fitch conducts a reasonable investigation of the factual information relied upon by itinaccordancewithitsratingsmethodology,andobtainsreasonableverificationofthatinformationfromindependentsources,totheextentsuchsourcesareavailableforagivensecurityorinagivenjurisdiction.ThemannerofFitch’sfactualinvestigationandthescopeofthethird-partyverificationitobtainswillvarydependingonthenatureoftheratedsecurityanditsissuer,therequirementsandpracticesinthejurisdictioninwhichtheratedsecurityisofferedandsoldand/ortheissuerislocated,theavailabilityandnatureofrelevantpublicinformation,accesstothemanagementoftheissueranditsadvisers,theavailabilityofpre-existingthird-partyverificationssuchasauditreports,agreed-uponproceduresletters,appraisals,actuarialreports,engineeringreports,legalopinionsandotherreportsprovidedbythirdparties,theavailabilityofindependentandcompetentthird-partyverificationsourceswithrespecttotheparticularsecurityorintheparticularjurisdictionoftheissuer,andavarietyofotherfactors.UsersofFitch’sratingsandreportsshouldunderstandthatneitheranenhancedfactualinvestigationnoranythird-partyverificationcanensurethatalloftheinformationFitchreliesoninconnectionwitharatingorareportwillbeaccurateandcomplete.Ultimately,theissueranditsadvisersareresponsiblefortheaccuracyoftheinformationtheyprovidetoFitchandtothemarketinofferingdocumentsandotherreports.Inissuingitsratingsanditsreports,Fitchmustrelyontheworkofexperts,includingindependentauditorswithrespecttofinancialstatementsandattorneyswithrespecttolegalandtaxmatters.Further,ratingsandforecastsoffinancialandotherinformationareinherentlyforward-lookingandembodyassumptionsandpredictionsaboutfutureeventsthatbytheirnaturecannotbeverifiedasfacts.Asaresult,despiteanyverificationofcurrentfacts,ratingsandforecastscanbeaffectedbyfutureeventsorconditionsthatwerenotanticipatedatthetimearatingorforecastwasissuedoraffirmed.Theinformationinthisreport is provided “as is” without any representation or warranty of any kind, and Fitch does not represent or warrant that the report or any of its contents will meet any of the requirements of a recipient of the report. A Fitch rating is an opinion as to the creditworthiness of a security. This opinion and reports made by Fitch are based on established criteria and methodologies that Fitch is continuously evaluating and updating. Therefore, ratings and reports are the collective work product of Fitch and no individual, or group of individuals, is solely responsible for a rating orareport.Theratingdoesnotaddresstheriskoflossduetorisksotherthancreditrisk,unlesssuchriskisspecificallymentioned.Fitchisnotengagedintheofferorsaleofanysecurity.AllFitchreportshavesharedauthorship.IndividualsidentifiedinaFitchreportwereinvolvedin,butarenotsolelyresponsiblefor,theopinionsstatedtherein.Theindividualsarenamedforcontactpurposesonly.AreportprovidingaFitchratingisneitheraprospectusnorasubstitutefortheinformationassembled,verifiedandpresentedtoinvestorsbytheissueranditsagentsin connection with the sale of the securities. Ratings may be changed or withdrawn at any time for any reason in the sole discretion of Fitch. Fitch does not provide investment advice of any sort. Ratings are not a recommendation to buy, sell, or hold any security. Ratings do not comment on the adequacy of market price, the suitability of any security for a particular investor, or the tax-exempt nature or taxability of payments made in respect to any security. Fitch receives fees from issuers, insurers, guarantors, other obligors, and underwriters for rating securities. Such fees generally vary from US$1,000 to US$750,000 (or the applicable currency equivalent) per issue. In certain cases, Fitch will rate all or a number of issues issued by a particular issuer, or insured or guaranteed by a particular insurer or guarantor, for a single annual fee. Such fees are expected to vary from US$10,000 to US$1,500,000 (or the applicable currency equivalent). Theassignment,publication,ordisseminationofaratingbyFitchshallnotconstituteaconsentbyFitchtouseitsnameasanexpertinconnectionwithanyregistrationstatementfiledundertheUnitedStatessecuritieslaws,theFinancialServicesandMarketsActof2000oftheUnitedKingdom,orthesecuritieslawsofanyparticularjurisdiction.Duetotherelativeefficiencyofelectronic publishing and distribution, Fitch research may be available to electronic subscribers up to three days earlier than to print subscribers.For Australia, New Zealand, Taiwan and South Koreaonly:FitchAustraliaPtyLtdholdsanAustralianfinancialserviceslicense(AFSlicenseno.337123)whichauthorizesittoprovidecreditratingstowholesaleclientsonly.Creditratingsinformation published by Fitch is not intended to be used by persons who are retail clients within the meaning of the Corporations Act 2001. DC-2033
Disclaimer

NewYork33 Whitehall Street New York, NY 10004 +1 212 908 0500 +1 800 75 FITCH
London30 North Colonnade Canary Wharf London E14 5GN +44 20 3530 1000
FitchRatings FitchSolutions
Fitch Groupwww.fitchratings.com www.fitchsolutions.com
NewYork33 Whitehall Street New York, NY 10004 +1 212 908 0500 +1 800 75 FITCH
London30 North Colonnade Canary Wharf London E14 5GN +44 20 3530 1000
Fitch Group