Global Food Security Short and Long-Term Perspectives and Challenges · 2010-06-02 · Trends in...
44
© FAO September 2009 1 of 41 Resources for policy making Global Food Security Short and Long-Term Perspectives and Challenges
Transcript of Global Food Security Short and Long-Term Perspectives and Challenges · 2010-06-02 · Trends in...

© FAO September 2009
1 of 41
Resources for policy making
Global Food SecurityShort and Long-Term Perspectives
and Challenges
© FAO September 2009
By
of the
FOOD AND AGRICULTURE ORGANIZATION OF THE UNITED NATIONS
2 of 41
Resources for policy making
Kostas G. Stamoulis, Directorand Keith Wiebe, ChiefComparative Agricultural Development Service, Agricultural Development Economics Division
Global Food SecurityShort and Long-Term Perspectives and Challenges
About EASYPol The EASYPol home page is available at: www.fao.org/easypol
EASYPol is a multilingual repository of freely downloadable resources for policy making in agriculture, rural development and food security. The resources are the results of research and field work by policy experts at FAO. The site is maintained by FAO’s Policy Assistance Support Service, Policy and Programme Development Support Division, FAO.
Related resources:See the Training Path Policy Learning Programme 2009 for other related resources. Download theProgramme Summary for background information and the Overview of the Programme Modules and Sessions for a complete list of resources developed for the Policy Learning Programme 2009. FAO Policy Learning Website: http://www.fao.org/tc/tca/policy-learning/en/
© FAO September 2009
3 of 41
Resources for policy making
Hunger in the world is increasing
Crises exacerbate the situation dramatically
Important challenges to agriculture as a source of food and livelihoods
Need to take advantage of emerging consensus to reduce hunger and improve food security governance
Main messages
© FAO September 2009
4 of 41
Resources for policy making
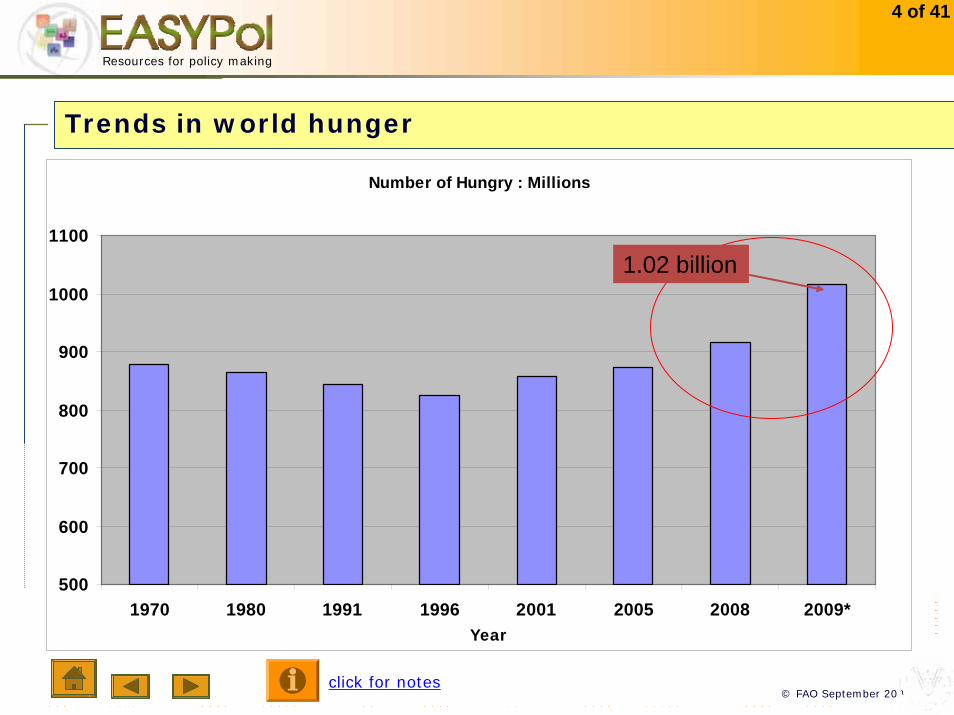
Number of Hungry : Millions
500
600
700
800
900
1000
1100
1970 1980 1991 1996 2001 2005 2008 2009*Year
1.02 billion
Trends in world hunger
click for notes
© FAO September 2009
5 of 41
Resources for policy making
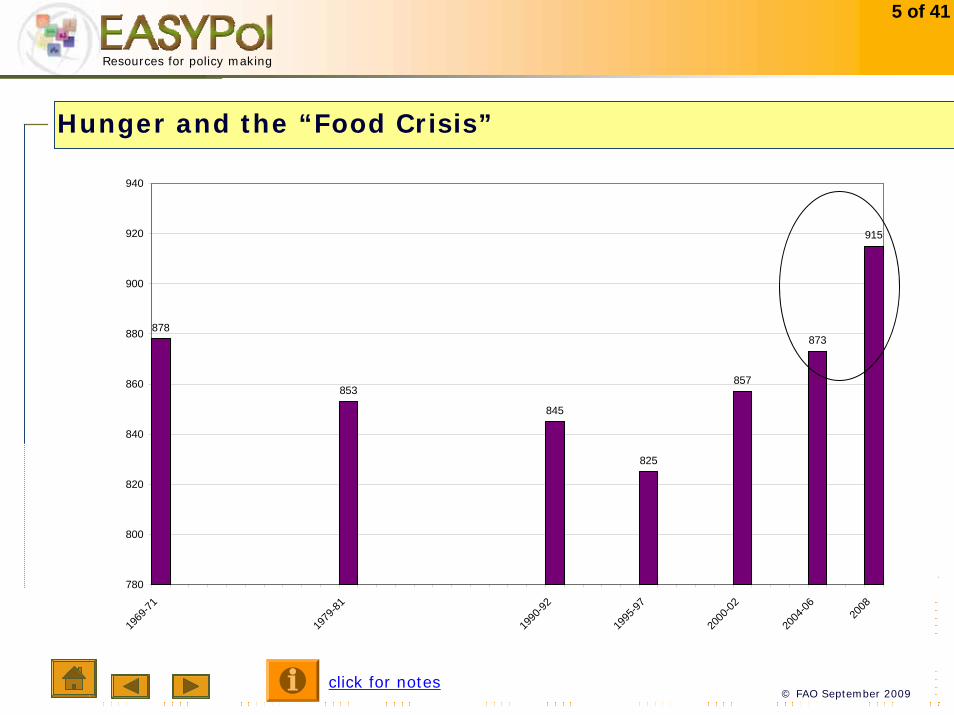
Hunger and the “Food Crisis”
878
853
845
825
857
873
915
780
800
820
840
860
880
900
920
940
1969
-71
1979
-81
1990
-92
1995
-97
2000
-02
2004
-06 2008
click for notes
© FAO September 2009
6 of 41
Resources for policy making
Several unique characteristics of the current crisisSeveral unique characteristics of the current crisisAt the heel of the previous price crisisAt the heel of the previous price crisisVulnerable households find themselves with depleted Vulnerable households find themselves with depleted coping mechanismscoping mechanismsGlobal rather than local or regionalGlobal rather than local or regionalGreater developing country integration in world Greater developing country integration in world economy / markets economy / markets
Economic crisis and hunger
© FAO September 2009
7 of 41
Resources for policy making
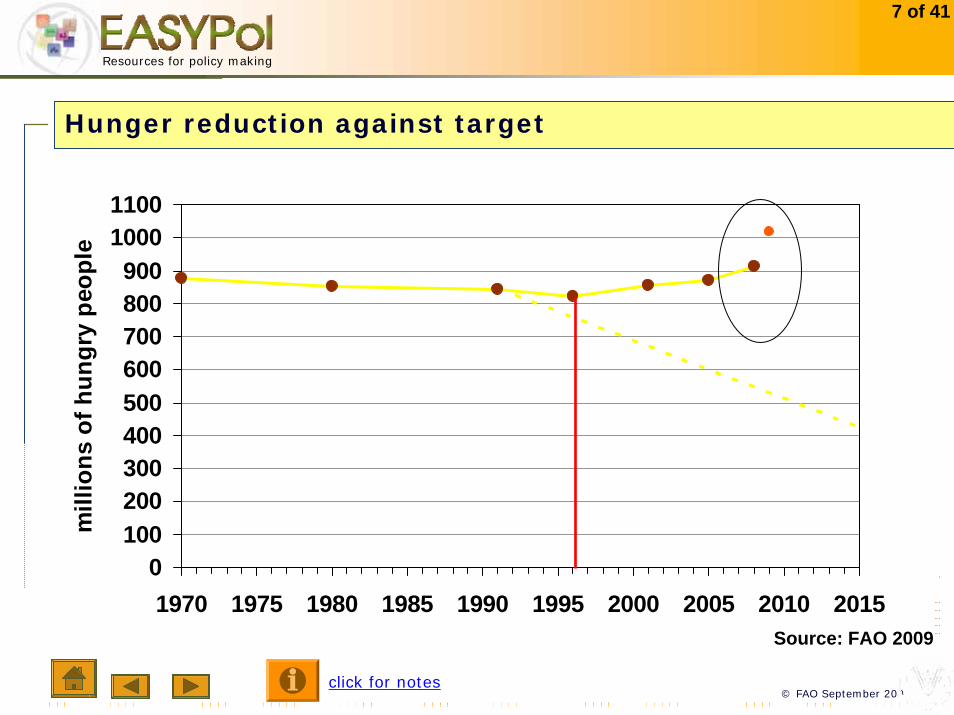
0100200300400500600700800900
10001100
1970 1975 1980 1985 1990 1995 2000 2005 2010 2015
mill
ions
of h
ungr
y pe
ople
Source: FAO 2009
Hunger reduction against target
click for notes

© FAO September 2009
8 of 41
Resources for policy making
Crises Exacerbate Longer term trends Crises Exacerbate Longer term trends
Hunger increasing in a context of high and low prices and weak oHunger increasing in a context of high and low prices and weak or r strong global economic growth strong global economic growth
Hunger on the rise despite commitmentsHunger on the rise despite commitments
Failure of global food Security GovernanceFailure of global food Security Governance
First set of conclusions

© FAO September 2009
9 of 41
Resources for policy making
Food and Agriculture in 2050
click for notes

© FAO September 2009
10 of 41
Resources for policy making
Main drivers of demand for food :Main drivers of demand for food :
Population to reach 9.1 bn. by 2050Majority of additional people in the urban areas of Majority of additional people in the urban areas of Developing CountriesDeveloping Countries
Global economic growth of 2.9% per annum between Global economic growth of 2.9% per annum between 2005 and 20502005 and 2050
Developing Countries to grow by 5.2%Poverty rate to fall to ( range 0.5% to 12% in 2050)Poverty rate to fall to ( range 0.5% to 12% in 2050)
Feeding the world in 2050... drivers and challenges
click for notes
© FAO September 2009
11 of 41
Resources for policy making
012345678910
1950
1955
1960
1965
1970
1975
1980
1985
1990
1995
2000
2005
2010
2015
2020
2025
2030
2035
2040
2045
2050
Billi
on
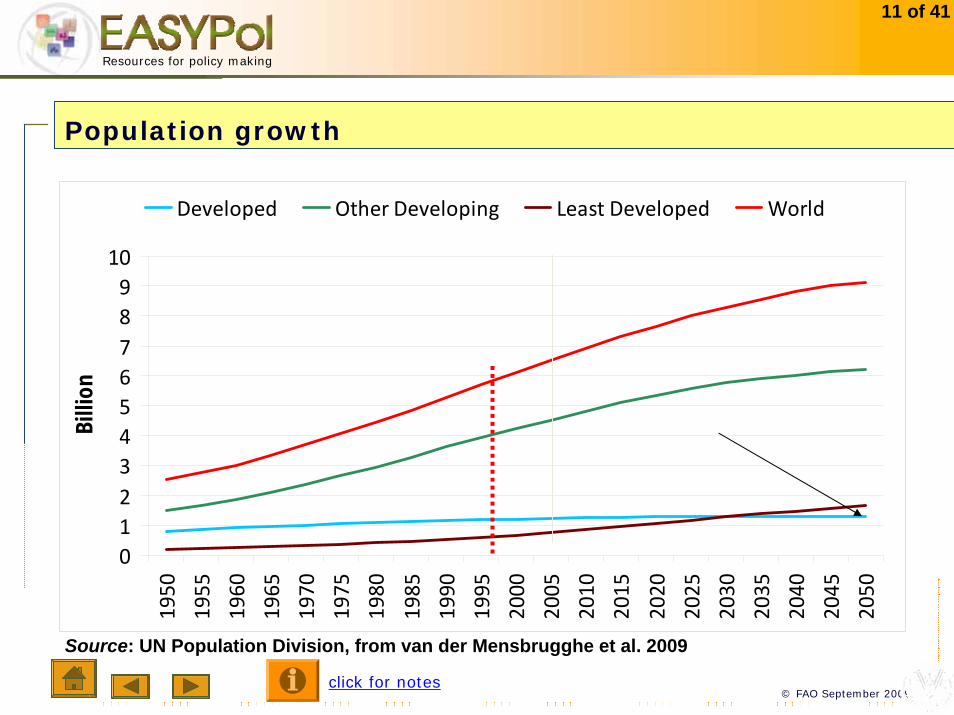
Developed Other Developing Least Developed World
Source: UN Population Division, from van der Mensbrugghe et al. 2009
Population growth
click for notes

© FAO September 2009
12 of 41
Resources for policy making
0
20
40
60
80
100
120
140
160
2005 2010 2015 2020 2025 2030 2035 2040 2045 2050
0
1
2
3
4
5
6
7
8
Developing country growth (right‐axis)
High‐income growth (right‐axis)
Developing country GDP (left-
Source: Simulation results with World Bank’s ENVISAGE model, from van der Mensbrugghe et al. 2009
$2004 trillion % per year
Income growth
click for notes
© FAO September 2009
13 of 41
Resources for policy making
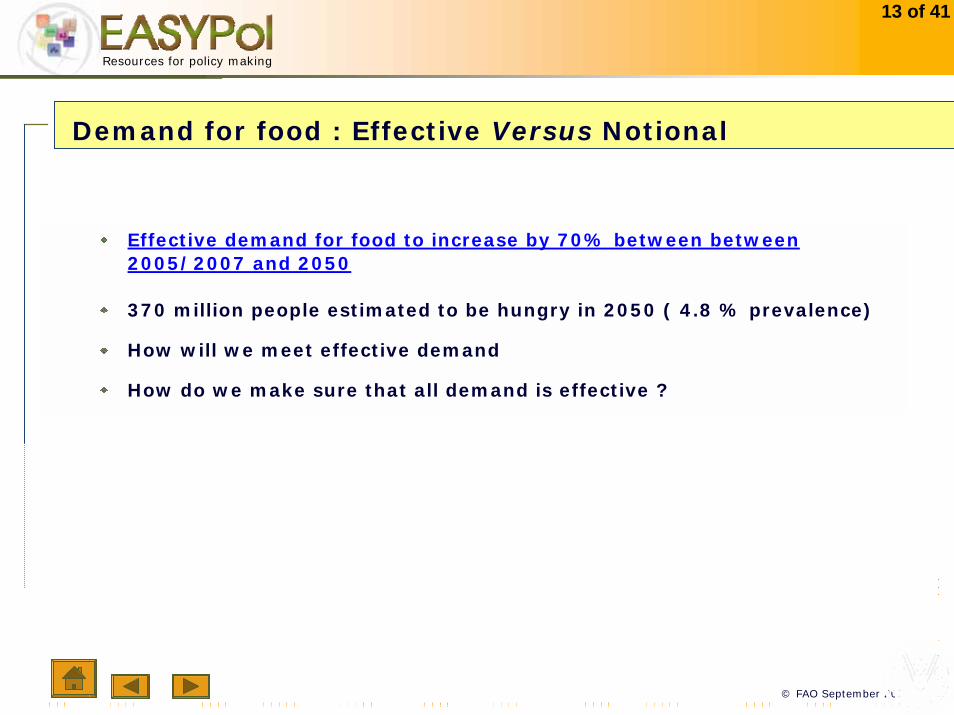
Effective demand for food to increase by 70% between between2005/2007 and 2050
370 million people estimated to be hungry in 2050 ( 4.8 % prevalence)
How will we meet effective demand
How do we make sure that all demand is effective ?
Demand for food : Effective Versus Notional

© FAO September 2009
14 of 41
Resources for policy making
Absolute increments in percent
past = 1961/63 to 2005/07; future = 2005/07 to 2050
255
97
63
23
148
70
0 50 100 150 200 250 300
past
future
past
future
past
futureD
evel
opin
gD
evel
oped
Wor
ld Agricultural production
How much more needs to be produced by 2050?
click for notes
© FAO September 2009
15 of 41
Resources for policy making
9
14
77
21
8
71
30
18
52
25
6
69
58
87
212
86
-7
17
90
-10%
0%
10%
20%
30%
40%
50%
60%
70%
80%
90%
100%
WorldDeveloping countries
Latin America
sub-Saharan Africa
South AsiaEast Asia
Near East / North Africa
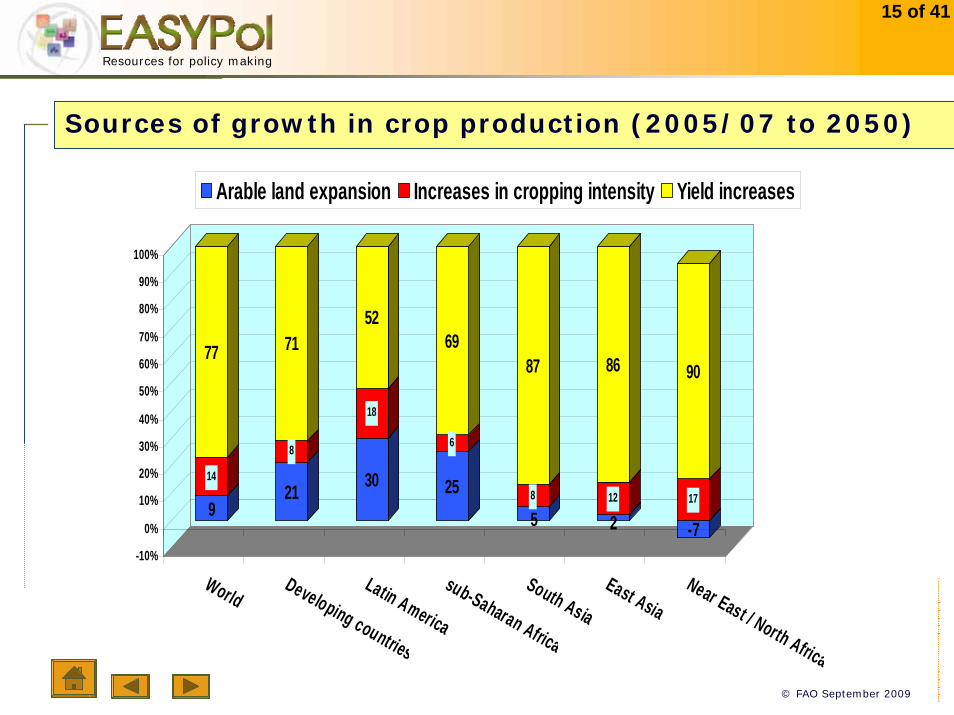
Arable land expansion Increases in cropping intensity Yield increases
Sources of growth in crop production (2005/07 to 2050)

© FAO September 2009
16 of 41
Resources for policy making
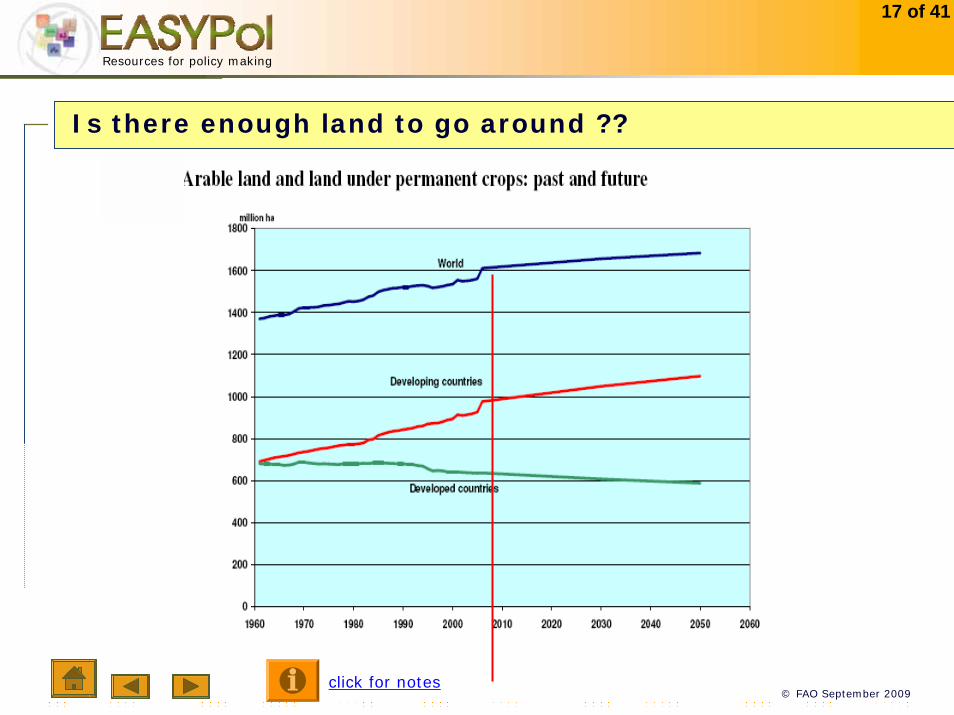
Area expansionArea expansion1.6 billion hectares currently used for crop production, 1.6 billion hectares currently used for crop production, 70 million more hectares to be brought to production (+ 70 million more hectares to be brought to production (+ 4.5%)4.5%)+120 million in +120 million in D.ingD.ing --50 million in Industrialized50 million in Industrialized2.7 billion with production potential, mostly in SSA and 2.7 billion with production potential, mostly in SSA and LACLACeconomic feasibility, but that is changing with priceseconomic feasibility, but that is changing with pricesbut concerns about biodiversity loss, carbon emissions, but concerns about biodiversity loss, carbon emissions, erosionerosion
Scope for land expansion
© FAO September 2009
17 of 41
Resources for policy making
Is there enough land to go around ??
click for notes
© FAO September 2009
18 of 41
Resources for policy making
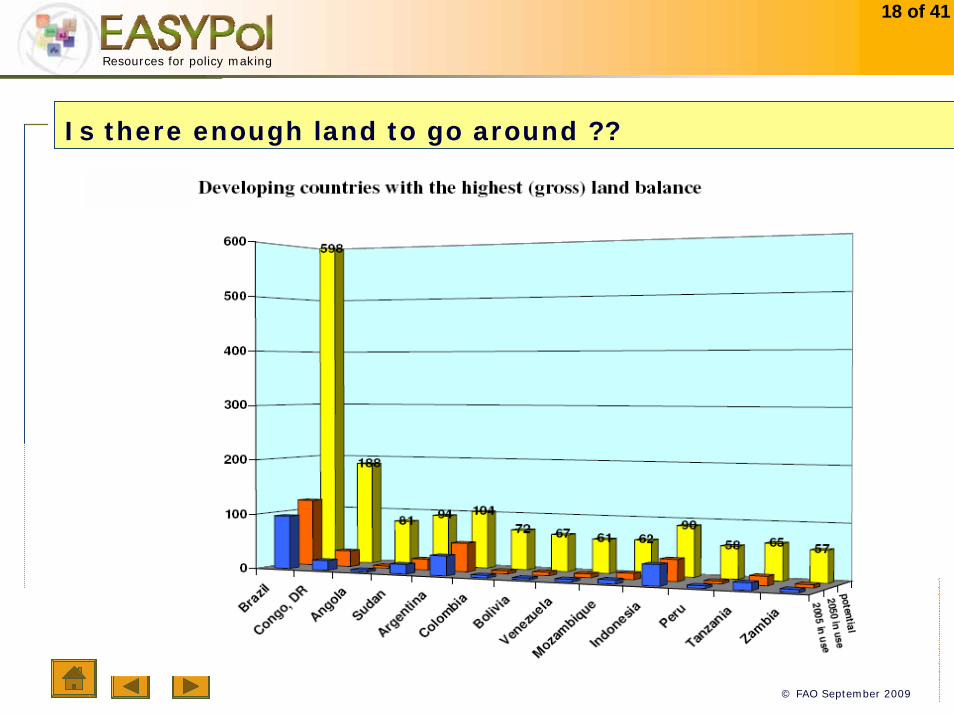
Is there enough land to go around ??
© FAO September 2009
19 of 41
Resources for policy making
Story Similar to Land SituationStory Similar to Land SituationGlobal abundance of waterGlobal abundance of waterCountry/local shortages reaching alarming ratesCountry/local shortages reaching alarming ratesRegions without potential for land and water expansion (NENA, Regions without potential for land and water expansion (NENA, S. Asia)S. Asia)Harvested irrigated land to expand by 17%, water Harvested irrigated land to expand by 17%, water withdrawals by 11%.withdrawals by 11%.
Water resources
© FAO September 2009
20 of 41
Resources for policy making
Global Baseline Scenario on Food Availability: Optimistic i.e. Effective demand can be met from some expansion and better exploitation of available resources
Scenario assumes long-standing forces will continue in the long run (e.g. population, diet shifts, urbanization)
Scenario assumes that yield gaps can be bridged and new varieties will further improve the ability of the world to feed itself.
IS IT ALL FINE THEN ???IS IT ALL FINE THEN ???
Feeding the world in 2050...

© FAO September 2009
21 of 41
Resources for policy making
Global scenario masks the plight of at least 27 countries with undernourishment above 5% even in 2050
370 million people in developing countries will be still hungry (4.7% of developing country situation)
Several countries seem to have reached the limits of agro-ecological potential to expand agriculture
THE ANSWER IS
© FAO September 2009
22 of 41
Resources for policy making
5 Challenges for food and agriculture
The yields/ technology challenge
The Climate Change Challenge
The BiofuelsChallenge
Hunger Reduction and Agricultural Transformation
Reforming the System of Global
Food Security Governance
click for notes
© FAO September 2009
23 of 41
Resources for policy making
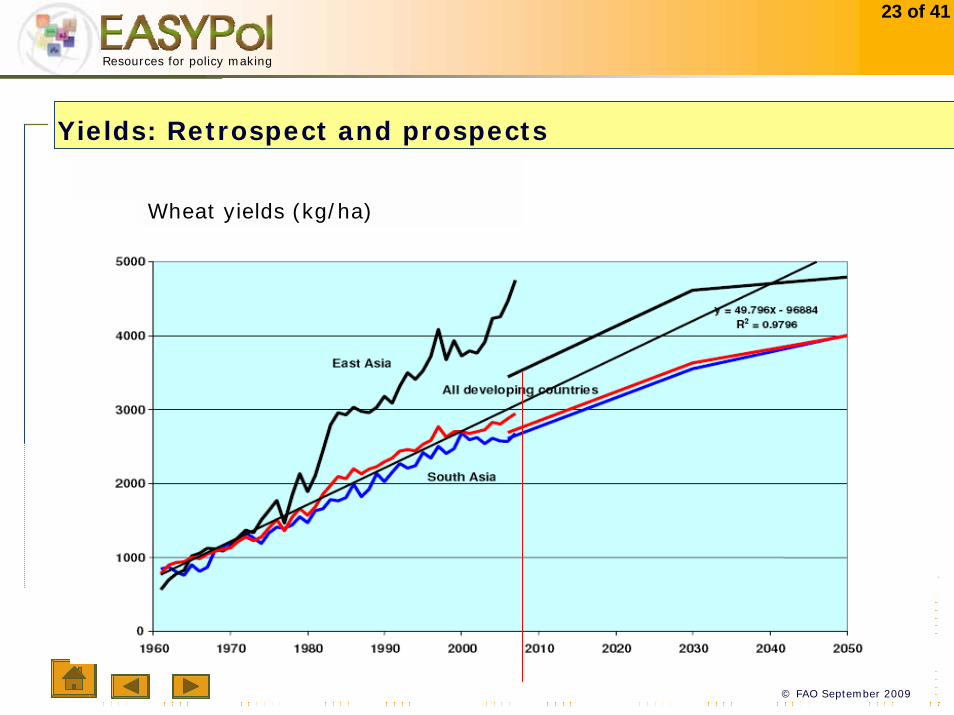
Yields: Retrospect and prospects
Wheat yields (kg/ha)
© FAO September 2009
24 of 41
Resources for policy making
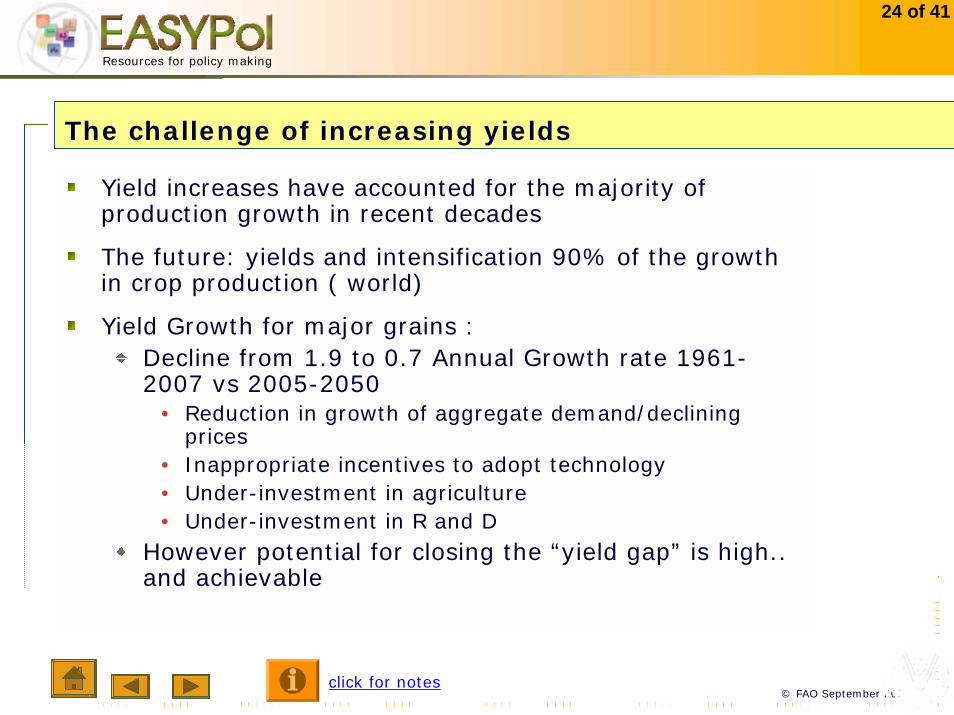
Yield increases have accounted for the majority of production growth in recent decades
The future: yields and intensification 90% of the growth in crop production ( world)
Yield Growth for major grains : Decline from 1.9 to 0.7 Annual Growth rate 1961-2007 vs 2005-2050
• Reduction in growth of aggregate demand/declining prices
• Inappropriate incentives to adopt technology• Under-investment in agriculture• Under-investment in R and D
However potential for closing the “yield gap” is high.. and achievable
The challenge of increasing yields
click for notes

© FAO September 2009
25 of 41
Resources for policy making
The technology challenge
Study after study: Enormous returns to R&D: 40-50%
Baseline projections assume a steady growth in yields...however
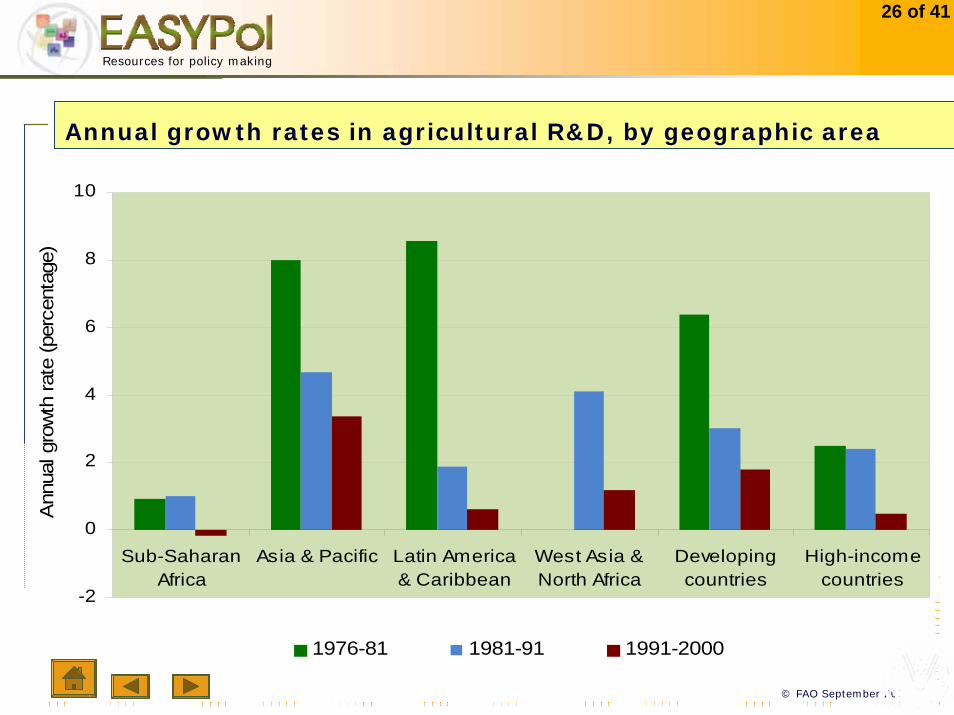
Global Public R & D spending1981-2000 : 2.1% 1991-2000 1.1 % ( Dev.ing 1.9%, Indust. 0.5% )Huge disparities : India ( 6.2%, China 3.9%)
© FAO September 2009
26 of 41
Resources for policy making
Annual growth rates in agricultural R&D, by geographic area
-2
0
2
4
6
8
10
Sub-SaharanAfrica
Asia & Pacific Latin America& Caribbean
West Asia &North Africa
Developingcountries
High-incomecountries
Ann
ual g
row
th ra
te (p
erce
ntag
e)
1976-81 1981-91 1991-2000
© FAO September 2009
27 of 41
Resources for policy making
The technology challenge
R and D adaptation for the needs of small farmers, marginal areas and orphan crops.
Incentive structure and resource mobilization for ensure the right technologies now for problems of the future.
Private-public partnerships for agricultural R&D.
Developing gender-balanced systems for spreading knowledge, skills and technology (dissemination).
© FAO September 2009
28 of 41
Resources for policy making
! Impacts of climate change on crop production are! vary significantly overtime ! geographically very unevenly distributed ! wide variability in estimates
! Aggregate impacts of projected climate change on the global food system are relatively small. The global balance of food demand and supply is not likely to be challenged until middle of the century.
! Autonomous adaptation (planting dates, cultivar changes, moisture conservation tillage, deploying irrigation where economical, switching crops) will offset some (gradual) warming (temperate climate +3-5°C, tropics +0-2°C).
Impacts of Climate Change 1

© FAO September 2009
29 of 41
Resources for policy making
Impacts of Climate Change 2Atmospheric changes (CO2 fertilization) may initially increase productivity of current agricultural land. CO2 fertilization assumptions make the difference between projected short-term and long term effects of CC
Climate change, with and without CO2 fertilization will have a clearly negative impact in the second half of this century
CC impacts on land vary: Land suitability down in Africa and Latin America but up (initially) elsewhere.
Changes in frequencies of extreme events (droughts, heat waves, severe storms) are more troublesome in the near term than gradual changes in average conditions.
Impacts of climate change on increasing net irrigation water demand could be as large as changes projected due to socio-economic development in 2000-2080
Sub-Saharan Africa will account for 40 to 50 percent of undernourished people globally by 2080, compared with about 24 percent today.
© FAO September 2009
30 of 41
Resources for policy making
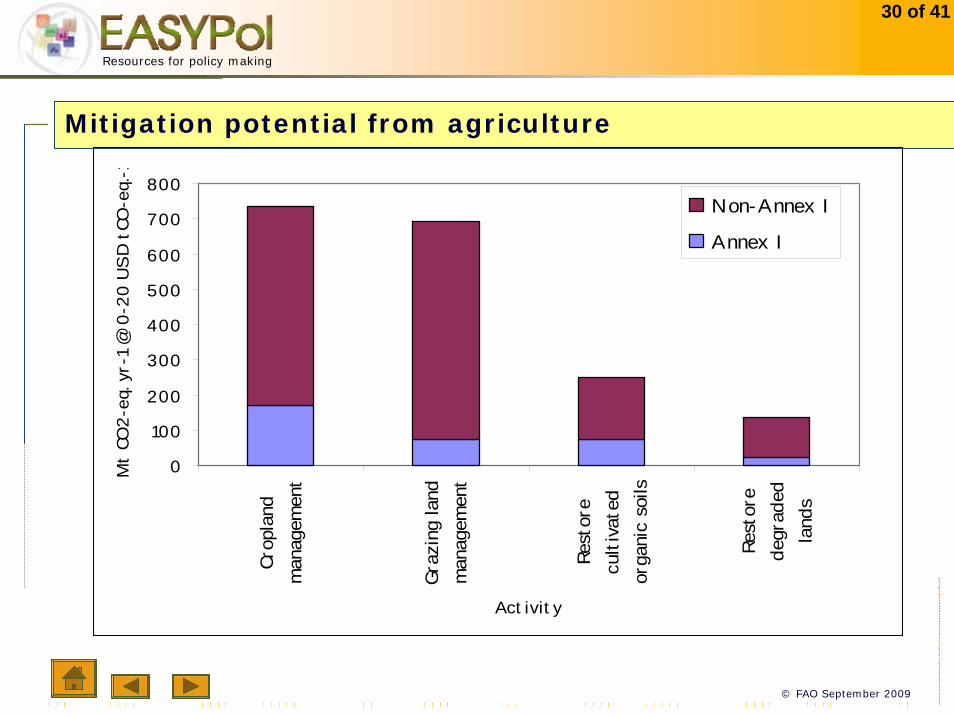
Mitigation potential from agriculture
0
100
200
300
400
500
600
700
800
Crop
land
man
agem
ent
Graz
ing
land
man
agem
ent
Rest
ore
cult
ivat
edor
gani
c so
ils
Rest
ore
degr
aded
land
s
Activity
Mt
CO2-
eq. y
r-1
@ 0
-20
US
D t
CO-e
q.-1
Non-Annex I
Annex I
© FAO September 2009
31 of 41
Resources for policy making
Climate change
Removing key constraints to adaptation
Exploring the key synergies between food security, adaptation and mitigation (technological, institutional, financing)
Finding coherence and mutual support between national and global agendas for adaptation, mitigation and food security
Using payments for carbon as an important source of funding for developing country agriculture
© FAO September 2009
32 of 41
Resources for policy making
Competition for commodities and also for resources
Higher cereal prices
Impacts of biofuels larger in the short and medium run as second generation is developed
Smaller progress in hunger reduction with increased biofuelproduction
Opportunities for producers, but uneven access to markets, and most small producers are net buyers of food
Increased biofuel use of cereals comes primarily (2/3) from increased production, ¼ from reduced feed use and the rest from reduced food consumption
The bioenergy challenge
© FAO September 2009
33 of 41
Resources for policy making
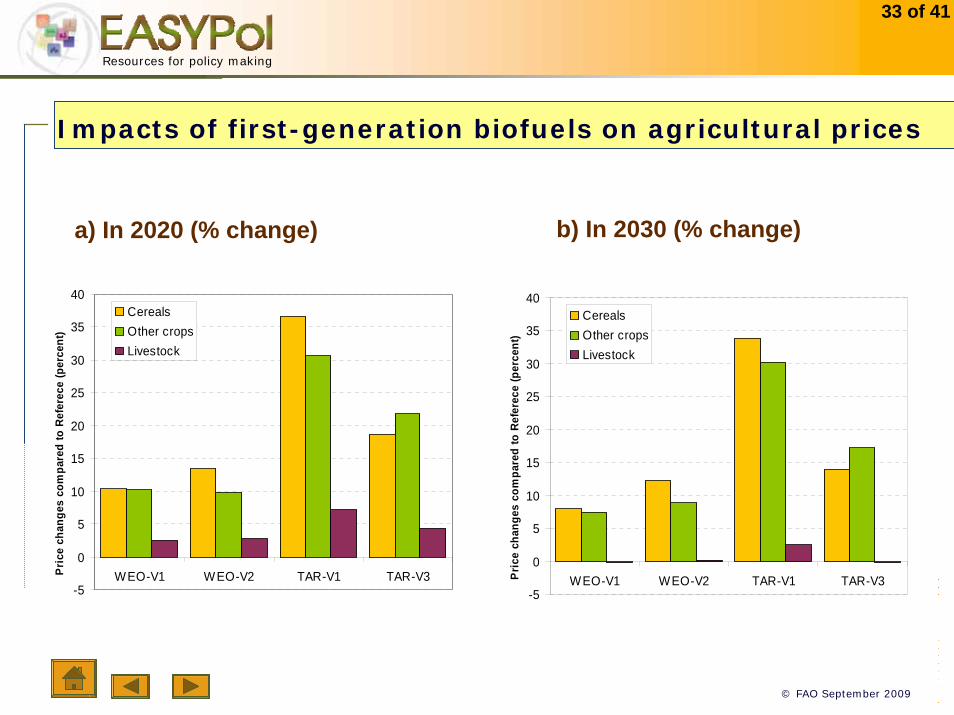
Impacts of first-generation biofuels on agricultural prices
a) In 2020 (% change) b) In 2030 (% change)
-5
0
5
10
15
20
25
30
35
40
WEO-V1 WEO-V2 TAR-V1 TAR-V3Pric
e ch
ange
s co
mpa
red
to R
efer
ece
(per
cent
)
CerealsOther cropsLivestock
-5
0
5
10
15
20
25
30
35
40
WEO-V1 WEO-V2 TAR-V1 TAR-V3Pri
ce c
hang
es c
ompa
red
to R
efer
ece
(per
cent
)
CerealsOther cropsLivestock

© FAO September 2009
34 of 41
Resources for policy making
Biofuels
Enabling developing countries to take advantage of opportunities offered by biofuels
Reconsidering (support) policies in developed countries (subsidies, mandates, trade barriers)
Achieving more coordinated policies among countries and sectors (agriculture, energy, trade, environment)
Guidelines for sustainable bio-fuels production
© FAO September 2009
35 of 41
Resources for policy making
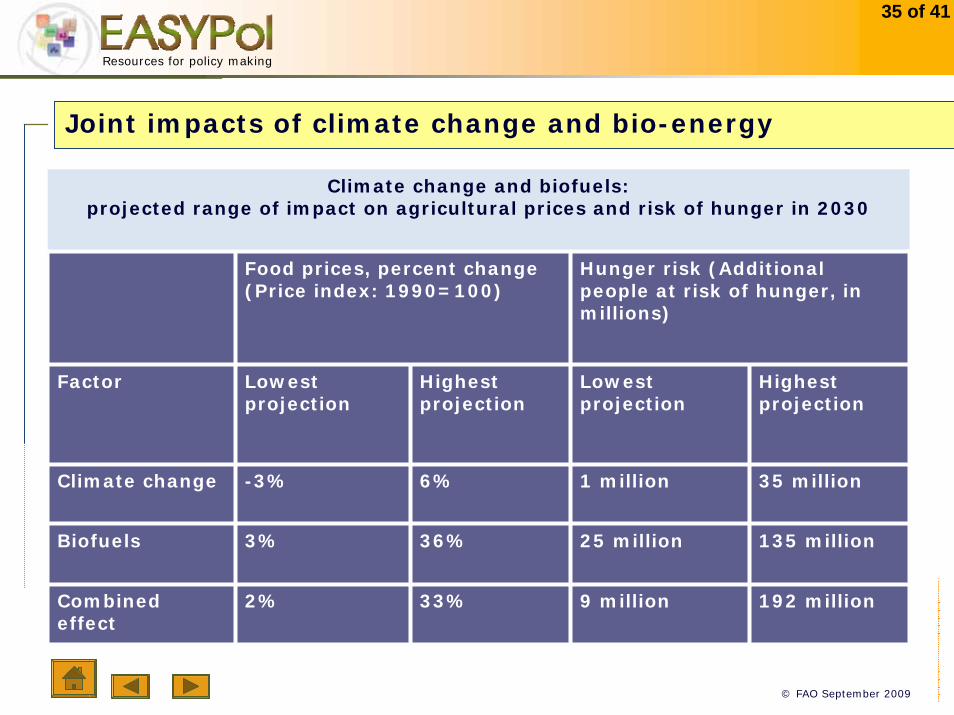
Joint impacts of climate change and bio-energy
Climate change and biofuels: projected range of impact on agricultural prices and risk of hunger in 2030
Food prices, percent change(Price index: 1990=100)
Hunger risk (Additional people at risk of hunger, in millions)
Factor Lowest projection
Highest projection
Lowest projection
Highest projection
Climate change -3% 6% 1 million 35 million
Biofuels 3% 36% 25 million 135 million
Combined effect
2% 33% 9 million 192 million

© FAO September 2009
36 of 41
Resources for policy making
Agricultural transformation and poverty reduction
Agriculture’s role beyond food productionAs an engine of economic growth for poverty reductionAs an engine of growth for the rural economyEven in “transforming” countries key role of agriculture in reducing poverty
The share of agriculture generally declines with development
Agro-industrialization Erosion of the comparative advantage of smallholdersPressure to commercialize or exit the sector
• Challenges for smallholders who remain in agriculture• Challenges for those who leave the sector

© FAO September 2009
37 of 41
Resources for policy making
Agriculture transformation and poverty reduction (2)
Protecting and improving livelihoods during the “Agricultural Transformation”
Investment in productivity, market access and risk management for those who remain in agriculture
Investment in human capital to expand options for those who leave the sector
Critical importance of broad-based economic growth to increase incomes and access to food for the poor, regardless of where they earn their livelihoods
Re-design safety nets on the basis of lessons learned and new sources of instability
Assist smallholders to take oadvantage of first and second generation biofuels

© FAO September 2009
38 of 41
Resources for policy making
Food security governance
The challenge is to create a system that effectively promotes, supports and sustains food security - especially for the poorest and most marginal.
Address structural causes of food insecurity and their institutional and governance dimensions.
Prevent crises and deal with emergencies.
Ensure that the world agricultural system and the resources it draws upon are managed in an unsustainable manner
Address the long and short-term challenges posed by climate change.
Reverse trends in investment in agriculture especially critical areas such as research, extension, infrastructure and biodiversity.
Promote a global trading system sensitive to the needs of the poor.

© FAO September 2009
39 of 41
Resources for policy making
Elements of global food security governance (cont..)
Provide science-based analysis and advocacy on the food security situations, its key determinants, its possible evolution.
Promote the coordination and strengthening of relevant international, regional and national strategies, policies, programmes for sustainable agriculture and security.
Promote actions that foster an enabling environment for investment in agriculture, while maintaining a focus on equitable, broad-based sharing of resources.
Pursue convergence/coherence of food security policies, in particular with related issues (climate change, environment sustainability and natural resource management).
Monitor progress and results, including on past and present policy measures and on resource mobilization’s effectiveness and efficiency.

© FAO September 2009
40 of 41
Resources for policy making
Elements of the reform of the CFS
Improved (vertical, horizontal) coordination and policy cohesion
Greater inclusiveness of all key stakeholders to better address such complex and interrelated issues more effectively.
Ensure that commitments to end hunger are converted to concrete actions
Ensure strong scientific support to decision-making institutions and bodies

© FAO September 2009
41 of 41
Resources for policy making
Heightened attention to agriculture and food security (G8 in Aquila)private interest when prices were highpublic interest continues
An emerging ConsensusRight to Food as an Organizing Framework for Global ActionRights to resources frameworks arising as a resultReform Global Governance Increase public and private investment
• Sound agricultural policies and strategiesSocial protection and safety netsStrengthen smallholder access to resourcesExplore options for coordinated risk management
Between challenges and hopeful signs

© FAO September 2009
42 of 41
Resources for policy making
End notes
[Slide 4]: From 870 million in 2004-2006 to 915 million in 2008 to 1020 million in 2009. Return to slide 4
[Slide 5]: Progress in Hunger reduction is marked by 2 events: i) High Food Prices; ii) The Financial/Economic Crisis. Return to slide 5
[Slide 7]: Recent increases mean we are farther off-track than ever from meeting the World Food Summit goal of halving the number of hungry people by 2015. (The picture is slightly better in terms of MDG1 to reduce the proportion of hungry people by 2015, but there too progress has recently been reversed.)The sharp increase in the number of hungry people as a result of the two consecutive crises : food prices and economic crisis. Return to slide 7
[Slide 9]: Note expert papers are currently being finalized, and various synthesis and proceedings documents are being prepared for the High-Level Expert Forum that will take place in Rome 12-13 October 2009, which will in turn help inform the World Summit on Food Security that will take place in Rome in mid-November 2009. Return to slide 9
[Slide 10]: World Bank: global economic growth averaging 2.9%/year between 2005-2050 (1.6 for HICs and 5.2 for developing). Per-capita incomes rising 2.2%/year to 2050; assuming income elasticity of demand for food is 0.5, per-capita food demand would increase 1.1%/year; + 0.8% population growth => 1.9%/year increase in total demand for food.(Note elasticity declines with income, and is already near 0 in most HICs, but rising demand for livestock products in developing countries, plus new competition from biofuels.)WB estimates developing-country absolute poverty ($1.25 PPP/day) down from 21.9% in 2005 to 0.4 in 2050 (even in SSA, from 51.7 to 2.8)Hillebrand estimates global absolute poverty down to 12% in 2050 if non-OECD countries match growth of last 25 years; down to 2.5% if they match growth of 2003-07. . Return to slide 9

© FAO September 2009
43 of 41
Resources for policy making
End notes
[Slide 11]: WB: population grew 2.5x over past 50 years, 50% over next 50, or 0.8% per year ( around 40%) (UN medium variant)—but still 3 billion more people, almost all in developing countries, most in urban areas. Return to slide 11
[Slide 12]: Progress in Hunger reduction is marked by 2 events: i) High Food Prices; ii) The Financial/Economic Crisis. Return to slide 12
[Slide 14]: FAO’s 2006 baseline projections (FAO, 2006a) show that by 2050 the world’s average daily calorieavailability could rise to 3130 kcal per person, an 11 percent increase over its level in 2003. This would by2050 still leave some 4 percent of the developing countries’ population chronically undernourished8.For these projections to materialize, world agricultural production would need to increase by some 70percent over the period from 2005/07 to 2050 (see Table 1). World population is projected to rise by some 40percent over this period, meaning that per caput production would rise by some 22 percent. The fact that thiswould translate into an only 11 percent increase of per caput calorie availability is mainly9 due to theexpected changes in diet, i.e. a shift to higher value foods of often lower calorie content (e.g. vegetables andfruits) and to livestock products which imply an inefficient conversion of calories of the crops used inlivestock feeds. Meat consumption per caput for example would rise from 37 kg at present to 52 kg in 2050. Return to slide 14
[Slide 17]: Ninety percent (80 percent in developing countries) of the growth in crop production would be a result of higher yields and increased cropping intensity, with the remainder coming from land expansion. Arable landwould expand by some 70 million ha (or less then 5 percent), the expansion of land in developing countriesby about 120 million ha (or 12 percent) being offset by a decline of some 50 million ha (or 8 percent) in thedeveloped countries. Almost all of the land expansion in developing countries would take place insub-Saharan Africa and Latin America. Return to slide 17

© FAO September 2009
44 of 41
Resources for policy making
End notes
[Slide 22]: Other challenges include: increased investment in infrastructure, dealing with crises and emergencies, dealing with biosecurity. Return to slide 22
[Slide 24]: The literature on yield gaps distinguishes two components of yield gaps, one due to agro-environmental and other non-transferable factors (these gaps cannot be narrowed), and another component due to differences in crop management practices such as sub-optimal use of inputs and other cultural practices. This second componentcan be narrowed provided that it makes economic sense to do so and therefore is termed the ‘exploitableyield gap’ or ‘bridgeable gap’.The potential to raise crop yields (even with existing technology) seems considerable. Provided theappropriate socio-economic incentives are in place, there are still ample ‘bridgeable’ gaps in yield (i.e. thedifference between agro-ecologically attainable and actual yields) that could be exploited. Fears that yields(e.g. for rice) are reaching a plateau do not seem warranted (except in a few very special instances). Return to slide 24