GLOBAL FINANCIAL MARKET AND NIGERIAN STOCK MARKET VOLATILITY
24
GLOBAL FINANCIAL CRISIS AND NIGERIAN STOCK MARKET VOLATILITY Abdul ADAMU 1 Department of Business Administration, Nasarawa State University, Keffi – Nasarawa State. [email protected] [email protected] Tel. +2348064851648, +2348029445391 Paper presented at the National Conference on “Managing the challenges of Global Financial Crisis in Developing Economies” organised by the Faculty of Administration, Nasarawa State University, Keffi, Nasarawa State – Nigeria held between March 9 – 11, 2010. 1 Adamu is a lecturer in the Department of Business Administration, Nasarawa State University, Keffi, Nasarawa State – Nigeria. 1 | Page
description
CONFERENCE PAPER
Transcript of GLOBAL FINANCIAL MARKET AND NIGERIAN STOCK MARKET VOLATILITY

GLOBAL FINANCIAL CRISIS AND NIGERIAN STOCK
MARKET VOLATILITY
Abdul ADAMU1
Department of Business Administration,Nasarawa State University, Keffi – Nasarawa State.
[email protected]@yahoo.com
Tel. +2348064851648, +2348029445391
Paper presented at the National Conference on “Managing the challenges of Global Financial Crisis in Developing Economies” organised by the
Faculty of Administration, Nasarawa State University, Keffi, Nasarawa State – Nigeria held between March 9 – 11, 2010.
GLOBAL FINANCIAL CRISIS AND NIGERIAN STOCK
MARKET VOLATILITY 1 Adamu is a lecturer in the Department of Business Administration, Nasarawa State University, Keffi, Nasarawa State – Nigeria.1 | P a g e

Abstract
The current global financial crisis is no longer news but a reality. Our policy makers in the country have been proven wrong based on their argument that the country was insulated. Some of the sectors that have felt the heat of the crisis are the banking sector and the stock market. In the stock market, investors lost trillions of naira due the downward fall in the prices of stock. Based on this, the study assesses the extent of the stock market volatility in the period preceding the crisis and the period of the crisis. Using the All Share Index, the returns for various months were computed, descriptive statistics of the returns was calculated and the volatility of the market was estimated using the standard deviation. It was found that the stock market is highly volatile in the period of the financial crisis than the period preceding it. The recommendation is that the depth of instruments in the stock market should be varied in terms of fixed securities than equity instruments.
Keywords: Global financial Crisis, Volatility, Returns, Standard Deviation
Introduction
The global economic crisis, which first emerged as a financial crisis in one country, has now
fully installed itself with no bottom yet in sight. The world economy is in a deep recession,
and the danger of falling into a deflationary trap cannot be dismissed for many countries
(UNCTAD, 2009). The recent global economic crisis was a result of economic and political
events in the United States. What started with amended federal policy and poor mortgage
lending practices, resulted in a world-wide economic meltdown that spread like a virus
(Beck, 2008). The US sub-prime mortgage market triggered the crisis as a result of credit
crunch within this market. Most countries around the world have approached this ‘tsunami’
pragmatically with emergency funding support for relevant sectors, so as to mitigate the
impact of the crisis on economies as well as avoiding the entire collapse of the international
financial system (Ajakaiye & Fakiyesi, 2009). Despite these supports by various governments
2 | P a g e

in the form of bailout, it does not stop some countries to go into recession, because of large
decline in their wealth, manifesting itself in falling productive capacity, growth, employment
and welfare.
At first, the direct impact of the financial crisis on the African economies was limited as
African countries has weak integration with the global economy and most commercial banks
in the region refrained from investing in the troubled assets from the US and other part of the
world (Adamu, 2008). This is why most commentators argue that Africa is so far insulated
from the direct effects of the financial crisis at least in the short-run. But now, this is not the
case as the rate of unemployment and liquidity squeeze are becoming unbearable.
In Nigeria, like other African developing countries, the initial response to the crisis was rather
meek, as if our policy makers do not understand the gravity of the crisis. While the developed
countries were busy trying to bailout their economies in order to mitigate the effects of the
crisis, our leaders were hiding under the shadow of insulation.
The most visible sector being hit by this crisis in the Nigerian economy is the capital market.
The Nigerian Stock Exchange, the flagship of Nigeria’s capital market has witnessed
unprecedented turbulence since April, 2008. First, the downward slide of the stocks on the
market dominated by the banking sector made experts restive and regulatory authorities
jittery. While accusing fingers were being pointed at different directions as the cause of this
volatility in the prices of stocks, the market began a free-fall never witnessed in the history of
capital market operations in Nigeria. Both local and foreign investors who had taken
advantage of the optimal return on investments on the stock exchange began to scamper
elsewhere in desperation.
Some of the questions that are critical to this trend in the capital market are; what is the extent
of the stock price volatility on the Nigerian Stock Exchange? What are the factors that
3 | P a g e
impacted the stock price volatility? To what extent has this volatility in stock price affected
investors? What can the regulatory authority do to contain this problem? This paper address
the questions raised above. This part is the introduction and the rest of the paper is arranged
as follows; section two discussed the concept of financial crisis, the Nigerian capital market
and the crisis, then stock market volatility. In section three, we discuss data and methodology,
then results and discussions in section four and finally, summary and conclusions in section
five.
The concept of financial crisis
The term financial crisis is applied broadly to a variety of situations in which some financial
institutions or assets suddenly lose a large part of their value. In the 19th and early 20th
centuries, many financial crises were associated with banking panics, and many recessions
coincided with these panics. Other situations that are often called financial crises include
stock market crashes and the bursting of other financial bubbles, currency crises, and
sovereign defaults (Kindleberger & Aliber, 2005, Laeven & Valencia, 2008).
Some economic theories that explained financial crises includes the World systems theory
which explained the dangers and perils, which leading industrial nations will be facing (and
are now facing) at the end of the long economic cycle, which began after the oil crisis of
1973. While Coordination games, a mathematical approach to modelling financial crises have
emphasized that there is often positive feedback between market participants and their
decisions (Krugman, 2008). Positive feedback implies that there may be dramatic changes in
asset values in response to small changes in economic fundamentals.
The Herding and Learning models explained that asset purchases by a few agents encourage
others to buy too, not because the true value of the asset increases when many buy (which is
4 | P a g e

called "strategic complementarity"), but because investors come to believe the true asset
value is high when they observe others buying (Avery & Zemsky, 1998, Chari and Kehoe,
2004, Cipriani & Guarino, 2008). The above theories explained the concept of financial crisis
and how market activities can trigger it.
The Nigerian Capital Market and the Crisis
The All Share Index and the market capitalisation of the 233 listed equities capture activities
and performance on the Nigerian Stock Exchange (NSE). Before the crisis, there has been a
consistent growth in these performance indicators over the year (see fig. 1). For instance, the
All Share Index according to data from www.cashcraft.com grow from a value of 12,137 in
2002 to 66,371.2 points on March 5, 2008, with a market capitalisation of about N12.640
trillion, after which values fell to 20,827.17 points on December 31, 2009, with a market
capitalisation of 4.989 trillion because of the meltdown. This shows that by the end of the
year 2009, the All Share Index had lost a total share of about 69%, while market
capitalisation had lost 61% of its value.
There are concerns regarding how rapidly the global financial crisis affected the Nigerian
Capital Market, especially given that there is virtually no cross-ownership of banks
(investment or otherwise) between Nigeria and foreign countries, and there is hardly any
domestic mortgage market for there to be a sub-prime problem as found particularly in the
UK and the USA (Aluko, 2008; Ajakaiye & Fakiyesi, 2009). The decline of indicators of
activities on the NSE before the escalation of the crisis on the global scene in July 2008
became a source of concern for many. It is difficult to attribute this decline to any particular
factor, but those factors that may have direct or indirect impact are as follows;
i. Foreign portfolio investments withdrawals and reduced foreign direct investment
affect investor confidence in Nigeria (Adamu, 2008; Aluko, 2008; and Ajakaiye &
5 | P a g e

Fakiyesi, 2009). This is the case because most foreigners withhold their investments
in order to service their financial problems at home. This exposed the country to
Foreign Direct Investment (FDI) uncertainties and vagaries, particularly in an era
where public-private partnership (PPP) of huge investment plans such as oil and gas –
Liquefied Natural Gas (LNG) projects, power plants, railways, housing and roads are
being encouraged.
ii. Another factor which according to Ajakaiye & Fakiyesi (2009) that had serious
impact on the stock market is what they called the ‘intensifiers’. These include policy
interpretations by the market, which may have been induced by the slow government
initial stand on the economy. This also includes interpretation of announcements,
proclamations and rumours by the market. Examples include the proposed
recapitalisation plan of the stock market players (stock broking firms), as well as
rumours on the termination of margin lending by banks.
iii. The phenomenon of marginal lending in Nigeria, whereby investors borrow money
from banks to invest in other financial instruments like IPOs of banks with the hope
of making quick returns. This may also be termed Nigeria's own version of the ‘sub-
prime problem’, as it resulted in an exploding domestic stock market and stock prices
and astounding returns to both the speculators and providers of the margin funds. This
make the banks to feel the heat of the crisis as most margin loans become difficult to
repay due to the downward trend in the market.
iv. With the currency overdependence on oil revenue, the downward trend in the price of
crude oil and prospects for economic recession in the developed world and Europe
which are the markets for the oil, also contributed for the fall in the stock market.
Because it look as if Nigeria's capital market bear cycle actually began with the
6 | P a g e

decline of oil prices in July, and accelerated with its further decline in September and
October (Aluko, 2008; Ajakaiye & Fakaiye, 2009).
Stock Market Volatility
Stock volatility refers to the potential for a given stock to experience a drastic decrease or
increase in value within a predetermined period of time. Investors evaluate the volatility of
stock before making a decision to purchase a new stock offering, buy additional shares of a
stock already in the portfolio, or sell stock currently in the possession of the investor. In
recent months, it has not been unusual to see the value of major stock indexes, such as the
S&P 500, NIKKEI, DOW JONES, KOSPI, FTSE, and our own NSE-ASI change by as much
as 3% in a single day. Unfortunately for many investors, the general direction of those
changes has been downward. To many, this volatility is driven by the recent global financial
crisis.
Stock market volatility tends to be persistent; that is, periods of high volatility as well as low
volatility tend to last for months. In particular, periods of high volatility tend to occur when
stock prices are falling and during recessions. Stock market volatility also is positively related
to volatility in economic variables, such as inflation, industrial production, and debt levels in
the corporate sector (Schwert, 1989).
The persistence in volatility is not surprising: stock market volatility should depend on the
overall health of the economy, and real economic variables themselves tend to display
persistence. The persistence of stock market return volatility has two interesting implications.
First, volatility is a proxy for investment risk. Persistence in volatility implies that the risk
and return trade-off changes in a predictable way over the business cycle. Second, the
persistence in volatility can be used to predict future economic variables. For example,
7 | P a g e

Campbell, Lettau, Malkiel, and Xu (2001) show that stock market volatility helps to predict
GDP growth.
Volatility may impair the smooth functioning of the financial system and adversely affect
economic performance (Mala & Reddy, 2007). Similarly, stock market volatility also has a
number of negative implications. One of the ways in which it affects the economy is through
its effect on consumer spending (Campbell, 1996; Starr-McCluer, 1998; Ludvigson &
Steindel, 1999; and Poterba, 2000). The impact of stock market volatility on consumer
spending is related via the wealth effect. Increased wealth will drive up consumer spending.
However, a fall in stock market will weaken consumer confidence and thus drive down
consumer spending. Stock market volatility may also affect business investment (Zuliu,
1995) and economic growth directly (Levine & Zervos, 1996; and Arestis, Demetriades, &
Luintel, 2001). A rise in stock market volatility can be interpreted as a rise in risk of equity
investment and thus a shift of funds to less risky assets. This move could lead to a rise in cost
of funds to firms and thus new firms might bear this effect as investors will turn to purchase
of stock in larger, well known firms.
While there is a general consensus on what constitutes stock market volatility and, to a lesser
extent, on how to measure it, there is far less agreement on the causes of changes in stock
market volatility. Some economists see the causes of volatility in the arrival of new,
unanticipated information that alters expected returns on a stock (Engle, 1982). Thus,
changes in market volatility would merely reflect changes in the local or global economic
environment. Others claim that volatility is caused mainly by changes in trading volume,
practices or patterns, which in turn are driven by factors such as modifications in
macroeconomic policies, shifts in investor tolerance of risk and increased uncertainty.
8 | P a g e

The degree of stock market volatility can help forecasters predict the path of an economy’s
growth and the structure of volatility can imply that “investors now need to hold more stocks
in their portfolio to achieve diversification”(Krainer, 2002:35).
Data and Methodology
This research relies on the daily All Share Index (ASI) of the Nigerian Stock Exchange as
reported by the exchange and on Cashcraft database. There are 233 listed companies on the
Nigerian Stock Exchange and the ASI is the major index that captures the performance of all
the shares of the listed companies. Using the ASI, the monthly returns (%) were calculated
using the formula below;
R=V F−¿ V I
V I
¿
Where Vf is the ASI at the end of the month, and Vi is the ASI at the beginning of the month.
These returns were calculated for all the 48 months used in this study.
We measure volatility using the standard deviation and/or variance. This is done by dividing
the period under study into two. The first period comprises of 24 months observation for
2006 and 2007, the period prior to the crisis and the second 24 observations were for 2008
and 2009, the period of the crisis. In examining volatility changes over time, we compare the
variances or standard deviations of the different periods and determine if they are statistically
significantly different from each other.
To estimate volatility, the expected returns or mean for these periods returns were computed
using the equation;
R=1n∑i=1
n
Ri
This implies that R is the average of the return values. Using this value for R and the
variance estimate results in a formula for the volatility is given as;
9 | P a g e

σ 2= 1( n−1 ) . dt
∑i=1
n
(Ri−R)2
It follows that the estimation of the volatility constant given by Wilmott, Howison and
Dewynne (1995) is:
σ=√σ2
Lastly, the expected returns and the standard deviations will be used in testing the hypothesis
whether there is a significant difference between the means of the two observation using t –
statistic for testing difference of two means.
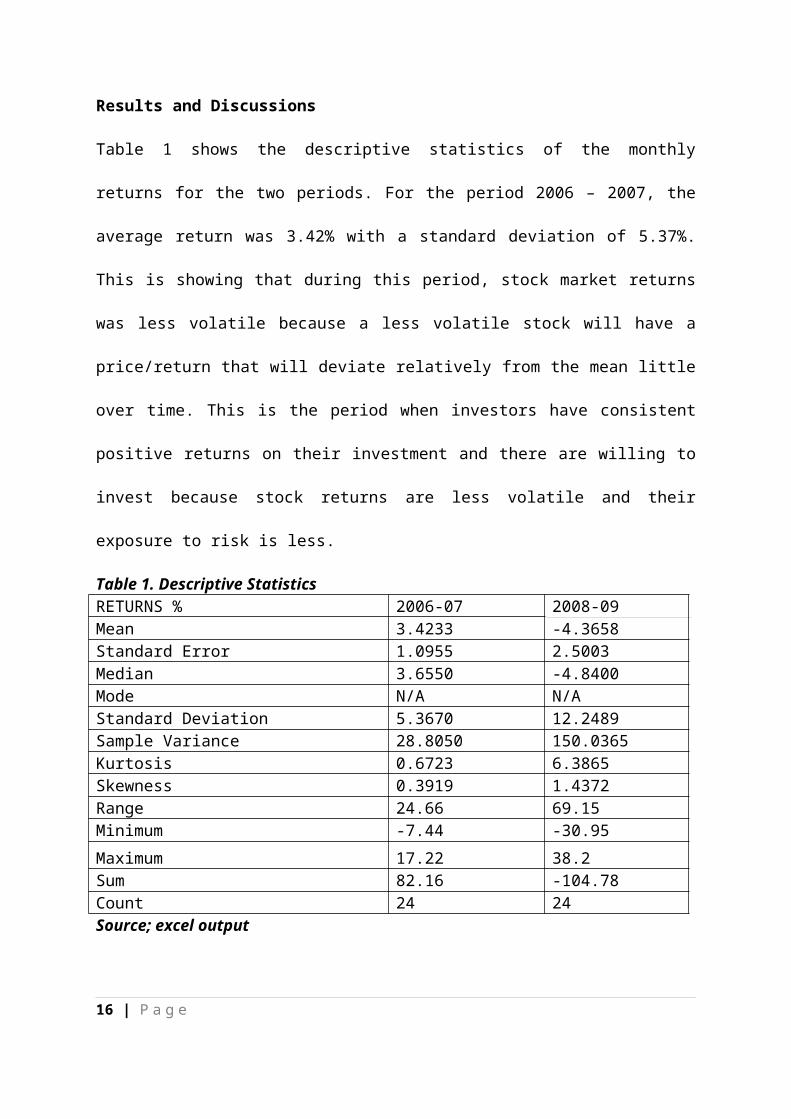
Results and Discussions
Table 1 shows the descriptive statistics of the monthly returns for the two periods. For the
period 2006 – 2007, the average return was 3.42% with a standard deviation of 5.37%. This is
showing that during this period, stock market returns was less volatile because a less volatile
stock will have a price/return that will deviate relatively from the mean little over time. This
is the period when investors have consistent positive returns on their investment and there are
willing to invest because stock returns are less volatile and their exposure to risk is less.
Table 1. Descriptive StatisticsRETURNS % 2006-07 2008-09Mean 3.4233 -4.3658Standard Error 1.0955 2.5003Median 3.6550 -4.8400Mode N/A N/AStandard Deviation 5.3670 12.2489Sample Variance 28.8050 150.0365Kurtosis 0.6723 6.3865Skewness 0.3919 1.4372Range 24.66 69.15Minimum -7.44 -30.95
Maximum 17.22 38.2Sum 82.16 -104.78Count 24 24
Source; excel output
10 | P a g e

On the other hand, during the period 2008 – 2009, there was a negative average return of –
4.37% with a standard deviation of 12.25% showing high volatility in returns. This is as a
result of the accelerated downward fall of the stock prices on the Nigerian Stock Exchange as
a result of loss of investors’ confidence due to the global financial crisis. This period is
characterised by negative returns which results to high volatility, and as we can see, the more
volatile that a stock is, the harder it is to isolate where it could be on a future date. Since
volatility is associated with risk, the more volatile that a stock is, the more risky it is.
Consequently, the more risky a stock is, the harder it is to say with any certainty what the
future price of the stock will be. When people invest, they would like to have no risk. The
least amount of risk that is involved, the better the investment is. Since almost every
investment has some risk, investors have looked for ways to minimize risk, so their best
reaction was to avoid the stock market and this affected the market.
The other descriptive statistics showed that both distributions are positive or right – skewed,
meaning that most of the returns are in the lower portion of the distribution and there are
some returns that has extremely large values and this pull the mean return upward to be
greater than the median, specifically for the second period. Both has a positive kurtosis value
of 0.6723 and 6.3865 indicates a distribution with a sharper peak than a bell – shaped curves.
The result of the test for the hypothesis to determine whether there is a significant difference
between the means of the two observations is presented in table 2 below. The hypothesis is;
Ho: µ1 = µ2 i.e. there is no difference in the means of the two observations
H1: µ1 ≠ µ2 i.e. there is difference in the means of the two observations.
From the result of the t- test, the null hypothesis is rejected at 5% level of significance. This
is because t = 2.85 > t = 2.01. the p – value computed is 0.0064 and it indicates that if the
means are equal, the probability of observing a difference this large in the sample means is
only 0.0064. Based on this, there is sufficient evidence to conclude that the mean returns are
11 | P a g e
different for the two periods, and that returns are lower in the period of the crisis than the
period before it. This confirms the reason why there is higher volatility in this period than the
other period.
Table 2. t – Test for differences in Two means(assumes equal population variances)
DataHypothesized Difference 0Level of Significance 0.05
Population 1 Sample Sample Size 24Sample Mean 3.4233Sample Standard Deviation 5.367
Population 2 Sample Sample Size 24Sample Mean -4.3658Sample Standard Deviation 12.2489
Intermediate CalculationsPopulation 1 Sample Degrees of Freedom 23Population 2 Sample Degrees of Freedom 23Total Degrees of Freedom 46Pooled Variance 89.42012Difference in Sample Means 7.7891t Test Statistic 2.853384
Two-Tail Test Lower Critical Value -2.012896Upper Critical Value 2.012896p-Value 0.006463
Reject the null hypothesis Source; Excel output
Conclusion and recommendations
The paper studied the extent of the stock market volatility in the period of 2006 – 2009. The
period is divided into 24 months each to study the volatility of market returns between 2006 –
2007, and between 2008 – 2009. On the basis of the results it was found that the period 2006
– 2007 is less volatile than the period of 2008 – 2009; and this is due to the global financial
that have affected investors’ confidence.
12 | P a g e

Since volatility is associated with risk, the more volatile that a stock is, the more risky it is.
Consequently, the more risky a stock is, the harder it is to say with any certainty what the
future price of the stock will be. When people invest, they would like to have no risk.
The least amount of risk that is involved, the better the investment is. Since almost every
investment has some risk, investors have looked for ways to minimize risk, so their best
reaction was to avoid the stock market and this affected the market. The recommendation is
that the stock market instruments need to be diversified away from equity instruments to
more of fixed security instruments. The authorities should encourage government and firms
to raise fund from the stock market using bonds to reduce the overdependence on stock by
investor. Investor should diversify their investment by accessing the bond market because at
least the face value of their bond remains till maturity and there will be any rush to sell if the
market is falling.
References
Adamu, A. (2008). The Effects of global financial crisis on Nigerian Economy. International Journal of Investment and Finance Vol. 1. #1&2.
Ajakaiye, O. & Fakiyesi, T. (2009). Global financial crisis Discussion paper 8: Nigeria. Oversea Development Institute, London.
Aluko, M. (2008). The global financial meltdown: Impact on Nigeria's capital market and foreign reserves. retrieved from www.google.com on 14 January, 2010.
Arestis, P., Demetriades, P.O. & Luintel, K.B. (2001). Financial development and economic growth: The role of stock markets. Journal of Money, Credit and Banking, 33(2):16-41.
Avery, C., & Zemsky, P. (1998). Multidimensional uncertainty and herd behavior in financial markets. American Economic Review 88, pp. 724-748.
Campbell, J. (1996). Consumption and the stock market: Interpreting international experience. NBER Working Paper, 5610.
Campbell, J., Lettau, M., Malkiel, B., & Xu, Y. (2001). Have individual stocks become more volatile? An empirical exploration of idiosyncratic risk. Journal of Finance 56, pp. 1–43.
13 | P a g e

Chari, V., & Kehoe, P. (2004). Financial crises as herds: overturning the critiques. Journal of Economic Theory 119, pp. 128-150.
Cipriani, M., & Guarino, A. (2008). Herd behavior and contagion in financial markets. The B.E. Journal of Theoretical Economics 8(1) (Contributions), Article 24, pp. 1-54.
Engle, R. F. (1982). Autoregressive conditional heteroscadasticity with estimates of the variance of the U.K. inflation. Econometrica, 50(3):987-1008.
Kinder, C. (2002). Estimating Stock Volatility. retrievd from www.google.com on 19 January, 2010.
Kindleberger, C.P., & Aliber, R. (2005). Manias, Panics, and Crashes: A History of Financial Crises (5th ed). Wiley, ISBN 0471467146.
Krainer, J. (2002). Stock market volatility. FRBSF Economic Letter, Western Banking, 2002-32, pp1-4.
Krugman, P. (2008, October, 27). The widening gyre. New York Times.
Laeven, L., & Valencia, F. (2008). Systemic banking crises: A new database. International Monetary Fund Working Paper 08/224.
Levine, R & S. Zervos (1996). Stock market development and long-run growth. World Bank Economic Review, 10(1):323-339.
Ludvigson, S & C. Steindel (1999). How important is the stock market effect on consumption. Federal Reserve Bank of New York Economic Policy Review, 5(1):29-51.
Mala, R, & Reddy, M. (2007). Measuring stock market volatility in an emerging economy. International Research Journal of Finance and Economics Issue 8 126-133.
Poterba, J.M. (2000). Stock market wealth and consumption”, Journal of Economic Perspectives, 14(2):99-118.
Schwert, W. (1989). Why does stock market volatility change over time? Journal of Finance 44, pp. 1,115–1,153.
Starr-McCluer, M. (1998). Stock market wealth and consumer spending. Board of Governors of the Federal Reserve System, Finance and Economics Discussion Paper Series, 8/20.
UNCTAD (2009). Global economic meltdown. Geneva: United Nation Conference on Trade and development
Wilmott, P., Howison, S., & Dewynne, J. (1995). The Mathematics of Financial Derivatives. New York: Cambridge University Press.
www.cashcraft.com
14 | P a g e

Zuliu, H (1995). Stock market volatility and corporate investment”, IMF Working Paper, 95/102.
Appendices
1. Monthly returns computed using the NSE-ASIMONTHS/
YEARS RETURNS %MONTHS/ YEARS RETURNS %
Jan-06 -1.69 Jan-08 -0.02Feb-06 0.30 Feb-08 -11.11Mar-06 -2.00 Mar-08 -4.01Apr-06 -0.75 Apr-08 -5.67May-06 5.45 May-08 -0.33Jun-06 5.66 Jun-08 0.00Jul-06 6.75 Jul-08 -6.90
Aug-06 17.22 Aug-08 -9.22Sep-06 0.67 Sep-08 -6.07Oct-06 0.35 Oct-08 -20.96Nov-06 -3.84 Nov-08 -9.08Dec-06 4.92 Dec-08 -2.37Jan-07 8.93 Jan-09 -30.95Feb-07 10.62 Feb-09 7.17Mar-07 4.87 Mar-09 -12.60Apr-07 8.44 Apr-09 8.15May-07 5.95 May-09 38.20Jun-07 2.44 Jun-09 -12.63Jul-07 0.94 Jul-09 -7.09
Aug-07 -7.44 Aug-09 -10.42Sep-07 -0.12 Sep-09 -2.2Oct-07 -0.16 Oct-09 -3.08Nov-07 7.82 Nov-09 -3.64Dec-07 6.83 Dec-09 0.05
Source: NSE Weekly report and Cashcraft Database, 2010.
Figure 1. Stock market performance, 2002-2009
15 | P a g e
Source: Extracted from Ajakaiye and Fakiyesi (2009)
16 | P a g e