Global financial flows, aid and development -...
46
Transcript of Global financial flows, aid and development -...


2
Global financial flows, aid and development
CONTENT
Summary .......................................................................................................... 5
A: Introduction: resources and the fight against poverty ............... 9
B: A summary of the various financial resources available ........ 12
B1 – Domestic resources ....................................................................................... 12 Public domestic resources .................................................................................................... 13 Private domestic resources .................................................................................................. 16
B2 – Private capital flows ..................................................................................... 17 Foreign Direct Investment – FDI ........................................................................................ 17 Portfolio equity flows (stocks and shares) ..................................................................... 19 Private sector borrowing ...................................................................................................... 20 Remittances ................................................................................................................................ 21
B3 - ODA, philanthropy and other official flows ......................................... 22 ODA ................................................................................................................................................ 22 Philanthropy ............................................................................................................................... 23 Other Official Flows ................................................................................................................. 24
B4 – Governments’ external lending and borrowing ................................ 24 External borrowing ................................................................................................................. 24 External lending ........................................................................................................................ 25
B5 – Illicit capital flight .......................................................................................... 28
B6 – New “innovative” financial resources ................................................... 30 Financial Transaction Taxes ................................................................................................ 30 Carbon and other Environmental Taxes ......................................................................... 31 New SDR creation ..................................................................................................................... 32
C: Impacts on poverty and sustainable development ................... 33
D: Implications for ODA ........................................................................... 35
Endnotes ...................................................................................................................... 40

3
FIGURES
Table: Summary of resource flows compared to domestic resources ....................................... 7 Figure 1: Poverty rates for the developing world 1981-2008 ..................................................... 10 Figure 2: Estimates of needs to meet global challenges ................................................................. 11 Figure 3: Tax revenues as a share of GDP ............................................................................................ 13 Figure 4: Government revenue GDP share, excluding grants ...................................................... 14 Figure 5: Ratio of domestic debt to total government debt, LICs ............................................... 15 Figure 6: Taxes per capita in Africa 1996-2009 ................................................................................ 15 Figure 7: Gross capital formation as a share of GDP ........................................................................ 16 Figure 8: global FDI inflows ....................................................................................................................... 18 Figure 9: Portfolio equity, net inflows, MICS ($) ............................................................................... 19 Figure 10: portfolio equity, net inflows, low-income countries ($) ........................................... 20 Figure 11: Global net borrowing flows by borrower type............................................................. 20 Figure 12: Remittance flows to developing countries compared to other flows ................. 21 Figure 13: ODA as a share of national income, by income group ............................................... 23 Figure 14: Net Debt Flows by creditor type 2001-10 ...................................................................... 24 Figure 15: Lending to developed countries by developing countries ...................................... 26 Figure 16: Net financial transfers 2001-11 by income category ................................................ 27 Figure 17: Illicit financial flows from developing countries, nominal terms ($bns) .......... 28 Figure 18: Illicit financial flows from LICs (%GDP) ......................................................................... 29
List of acronyms BNDES Banco nacional do desenvolvimento, Brazilian national development bank CAR Central African Republic DBS Direct budget support DAC Development Assistance Committee, of the OECD DBSA Development Bank of Southern Africa DFI Development Finance Institutions DFID Department for International Development (UK) ETS Emission Trading System FDI Foreign Direct Investment FTT Financial Transaction Tax GDP Gross Domestic Product Gongos Government-backed NGOs GFI Global Financial Integrity GNI Gross National Income IFC International Finance Corporation, World Bank Group IMF International Monetary Fund IFFm International Finance Facility for Immunisation LIC Low-income country MDG Millennium Development Goal MIGA Multilateral Investment Guarantees Agency, World Bank Group NDB National development banks NGO Non-governmental organisation ODA Official Development Assistance OECD Organisation for Economic Cooperation and Development OOF Other official flows SDRs Special Drawing Rights UNDESA United Nations Department of Social and Economic Affairs UNCTAD United Nations Conference on Trade and Development WESS World Economic and Social Survey VAT Value-added tax

4
A note on the data used in this report Wherever possible, we have used comprehensive analysis of the flows in questions by international institutions. Where several versions of the analysis exist, we have preferred that provided by the institution with the most robust methodology – for example, using UNCTAD for FDI statistics and the World Bank for debt statistics. Unfortunately this method introduces one major problem, which is that the analysis of data is not always comparable between institutions, and therefore there is likely to be double counting of some of the flows. This is a particular issue for private flows, where FDI, portfolio equity and private borrowing have considerable overlaps. The alternative to this would be to just use data from one institution, but this would mean the accuracy of the analysis of that data would be reduced. All the data used should be treated as a guide – mistakes and anomalies can be introduced at many stages of the collection and analysis stages, and the quality of the underlying data is highly variable and not always collected in comparable fashions. The figures used are intended to give an indication of the scale of flows, not exact figures, which is why they are also compared to equivalent percentages of GDP.
The paper was written by Jesse Griffiths, Eurodad for CONCORD AidWatch. CONCORD AidWatch Initiative
AidWatch is a pan-European advocacy and campaigning network of NGOs which, since 2005, has monitored and made recommendations on the quality and quantity of aid provided by EU member states and the European Commission. The network carries out ongoing advocacy, research, media activities and campaigns on a wide range of aid-related issues throughout the year. AidWatch is part of CONCORD Europe.
CONCORD is the European NGO Confederation for Relief and Development. Its 27 national associations, 18 international networks and two associate members represent 1,800 NGOs which are supported by millions of citizens across Europe. CONCORD leads reflection and political actions, and regularly engages in dialogue with the European institutions and other civil society organisations. At the global level, CONCORD is actively involved in the Open Forum for CSO Development Effectiveness, the Beyond 2015 campaign, BetterAid and the International Forum of NGO platforms. More at: www.concordeurope.org.
CONCORD AidWatch
March 2013

5
Summary This paper sets out all the financial resources potentially available for development, examines their key characteristics, and discusses their poverty and sustainable development impacts, and the implications for aid. This discussion could not come at a more important time. Aid is under severe pressure as donors seek to cut budgets and to reorient aid to more clearly attribute direct ‘results’ to it. Recent initiatives at European and donor level have sought to change the focus of the aid debate towards stimulating the private sector, including emphasizing the role of private flows, particularly foreign investment. At the same time, the development community is gearing up to decide what targets should replace the Millennium Development Goals. Incorporating financing into this framework will be vitally important. These changes in the aid debate take place against the backdrop of a greatly increased focus on other financial flows, including illicit capital flight, as governments seek to plug leaks in their revenues. They are also increasingly aware that the ongoing economic and financial crisis has demonstrated how fragile yet important finance flows, financial institutions and financial regulation are.
Resources and the fight against poverty
While most agree that mobilising additional resources will be crucial; there are a variety of estimates of the quantities needed. For example, the OECD estimates $60 billion will be needed annually to meet the health MDGs, while the UN estimates $1 trillion is needed to meet global poverty and environmental challenges. It is also vital to remember that, except in extreme cases, financial resources alone are not normally the most important issue for reducing poverty. The policies, governance, and stability of the country and region are crucial, as is the international economic and policy framework.
A summary of the various financial resources available
The main resources that are potentially available for development can be divided into the following categories:
• Domestic resources. These can be divided into (a) public revenues, which include taxes and social security contributions and (b) private investment.
• Private capital flows. These can be divided into (a) foreign direct investment, (b) portfolio equity, which is the buying and selling of stocks and shares, (c) remittances sent home by migrants, and (c) private sector borrowing. There is inevitably considerable double counting in this area, as the different flows overlap, including with domestic investment. This means that the flow totals given below should be considered over-estimates.
• ODA, philanthropy and other official flows. Philanthropy includes grants from NGOs and other organisations. Other official flows, which include export credits, are very small and are not included in the chart below.
• External government borrowing and lending. In addition to borrowing money from international financial institutions and private sources, developing country governments are also major lenders to rich countries, when they buy bonds and other securities to boost their reserves.

6
• Illicit capital flight. This “involves capital that is illegally earned, transferred, or utilized”, and is mainly caused by companies trying to dodge taxes. In addition to the loss of capital which could have been invested in the developing country from which it originated, capital flight deprives developing country governments of tax revenue, which Christian Aid estimates at $160 billion per year.
• New “innovative” financial resources. Here we examine the main proposals, including financial transaction taxes, carbon and other environmental taxes, and creation of new Special Drawing Rights (SDRs). SDRs are a reserve asset, held by countries at the IMF. Additional creation – global quantitative easing – would free up developing countries’ reserves for more productive use.
The following table summarises the scale of the above resources, and notes their trend, volatility and other important features.
• The figures are net flows: inflows minus outflows.
• They are grouped in order of magnitude and under ‘inflows’ if the inflows exceed the outflows and vice versa. However for individual countries, and sometimes for individual years, the overall direction of flow may be reversed.
• Figures are given in comparison to GDP as the best yardstick to measure scale.1
• Footnotes and sources are omitted in this summary, but are fully referenced throughout the full report. In some cases it was not possible to isolate figures for low-income countries.
1 It is important not to misread this data as suggesting that these figures represent actual totals of GDP, as some of
these flows will be included in GDP figures, and other will not. GDP measures the sum total value of all goods and services produced within a country, so flows from outside, such as remittances, are not included unless they are subsequently spent within the country.

7
Table: Summary of resource flows compared to domestic resources
Resource (year) % GDP2 %GDP
LICs
Trends, volatility and other features
DOMESTIC RESOURCES
Public revenues (2008)
30* 17 Rising over past decade. Predictable, not highly volatile.
Private investment (2010)
28 23 Increased over past decade, particularly in LICs. Not highly volatile.
RESOURCES WHICH ARE NET INFLOWS
Private borrowing (2010)
1.8 Volatile and pro-cyclical. Loans have to be repaid – costs vary.
Remittances (2009) 1.5 4.9 Steadily rising. In 22 developing countries equivalent to over 10% GDP. Concentrated in certain countries.
FDI (2011) 1.3 1.6 Rising until sharp drop in 2008-9; now rising again. Less volatile than other private flows, but pro-cyclical. Overestimate due to double counting with other flows.
Government borrowing (2010)
0.7 Until 2007 an outflow as governments paid off the IMF. Now a rising inflow as governments borrow, mainly from IFIs, but also from domestic markets.
ODA (2011) 0.6 10 Steadily rising until 2011. Not pro-cyclical overall, but unpredictable at country level. In 37 countries equivalent to over 10% of GDP. Aidwatch analysis suggests this figure is inflated
Portfolio equity (2010)
0.6 -11 Highly volatile and pro-cyclical.
Philanthropy (2010) 0.2 Increasing rapidly.
RESOURCES WHICH ARE NET OUTFLOWS
Illicit flows (2009) -4.3 -3 Increasing rapidly but dipped after 2008. Significant underestimate as hard to measure.
Government lending (2010)
-4.7 Mostly from middle-income countries. Sharp increase in recent years due to reserves increasing to protect against heightened risks.
*Figure for upper-middle income countries only: combined figure for all developing countries not available. 2 All developing countries

8
New ‘innovative’ financial resources provided by taxes are not included in the above table, because it is not clear what proportion of their revenues would be allocated to developing countries. The best estimates suggest:
• Financial transaction taxes could yield up to €400 billion per year in the EU alone.
• Carbon taxes could yield up to $450 billion per year in developed countries.
• Aviation and bunker fuels taxes in developed countries could yield up to $22 billion.
• Carbon trading permits could yield up to $20 billion in the EU per year. In addition, the global creation of new SDRs could provide up to $167 billion of new resources for developing countries, equivalent to 0.7% of their GDP in 2011.
Impacts on poverty reduction and sustainable development
The key findings of this analysis are: Scale and trends
• Domestic resources are far larger than other financial resources, and have been growing as a share of GDP over the last decade.
• Overall, outflows are significantly larger than inflows, largely caused by illicit capital flight and reserve-accumulation: both issues intimately linked to global policy failings.
• The picture varies across countries, and low-income and vulnerable countries tend to be far more affected by external resources than other countries.
Volatility and risk
• Volatility and predictability of external finance is a major issue, especially for low-income countries, where it is equivalent to a major share of GDP.
• Private flows, in particular portfolio equity and short-term finance are particularly volatile and can be incredibly destabilizing.
• Public sources of finance are much more predictable and stable, particularly domestic taxation. If aid could be made more predictable it would make a major difference to the value of aid as a financial resource for developing countries.
• The current structure of borrowing and lending imposes significant costs on developing countries.
Distribution
• The poorest countries have very low levels of financial resources per capita. This is true for all types of resources, including domestic resources.
• Public resources have the potential to target the poorest and most vulnerable in society in a way that private flows cannot. Aid is particularly important in low-income countries where it averages around one tenth of GDP.
Accountability and transparency
• All of the resources discussed would benefit from significant improvements in their accountability and transparency, but higher standards are expected of public resources.
Impacts on domestic politics

9
• Domestic political impacts of resource flows can be extremely important for poverty reduction and sustainable development. For example, the conditionalities attached to lending by IFIs have proved highly controversial.
• Other theories are also important, such as the resource curse (where the economy and governance are undermined by dependence on a primary commodity) and the social contract (where the act of having to depend on citizens for revenue forces governments to become more accountable.)
• The process of international economic liberalization over recent decades, and the growth in the offshore economy, have provided incentives for governments to engage in a ‘race to the bottom’ on taxation and on standards expected of companies.
Contributions to sustainable development
• The impacts of different resources on poverty reduction depend on the overall macroeconomic, political and environmental environment in each individual country.
• In the sphere of public goods – including basic services, the environment, natural resources and security - there is a greater demand for public sources of finance.
• In the sphere of productive development, the dominant neoliberal paradigm is giving way to a recognition that successful economies have used industrial strategies to move up the value chain, particularly through promoting manufacturing, which has required strong state intervention.
Implications for ODA
Six broad conclusions can be drawn:
1. CSOs have been right to focus campaigning energy on a broad set of development finance reforms and structural change.
2. A traditional focus on aid as a mechanism to provide public goods remains important. 3. Growing demands for public finance to protect international public goods suggest we
will need to mobilise other financing sources. 4. Aid should make sure it supports domestic resource mobilization. 5. The push to use aid to ‘leverage’ private finance is built on shaky assumptions. 6. We need to be particularly aware of aid’s potential macroeconomic impact in low-
income countries, including by improving predictability, and supporting local procurement.
A: Introduction: resources and the fight against poverty Though progress has been made, poverty still blights the lives of billions. According to the World Bank,i “1.29 billion people in 2008 lived below $1.25 a day” and “2.47 billion people in 2008 consumed less than $2 a day”.ii

10
Figure 1: Poverty rates for the developing world 1981-2008iii
Several countries have been extremely successful in reducing poverty rates, and global economic growth has become concentrated in the developing world, but the future poverty distribution is contested. Some have argued that, “by 2025, the locus of global poverty will overwhelmingly be in fragile, mainly low-income and African states”iv. Others claim that the current situation, where the majority of the world’s poor live in middle-income countries will continue so that “in the not-too-distant future, most of the world’s poor will live in countries that do have the domestic financial scope to end at least extreme poverty.”v While most agree that mobilising additional resources will be crucial; there are a variety of estimates of the quantities needed. When the requirements to protect our environment and prevent catastrophic climate change are included, these become extremely high. In 2011, the UN’s World Economic and Social Survey (WESS) “estimated additional investment needs of developing countries for sustainable development, including for climate change mitigation and adaptation, and for ensuring access to clean energy for all, sustainable food production and forest resource management, at about $1 trillion per year in the coming decades.”vi Far lower estimates have been given if the focus is only on meeting the limited targets of the MDGs, or of achieving sectoral progress. For example, a recent OECD study has estimated the costs of achieving the health MDGs at $60 billion annually.vii While poverty eradication remains an urgent and vital global priority, the scale of resources needed to meet current and future environmental challenges is likely to be far higher, as the graph below shows. It is also vital to remember that, except in extreme cases, financial resources alone are not normally most important issue for reducing poverty. The policies, governance, and stability of the country and region are vitally important, as is the international economic and policy framework.
0
10
20
30
40
50
60
70
80
1981 1984 1987 1990 1993 1996 1999 2002 2005 2008
Headcount index of poverty (% below poverty
line)
2$ per day 2$ per day (less China) 1.25$ per day 1.25$ per day (less China)

11
Figure 2: Estimates of needs to meet global challengesviii
There are a variety of perspectives about where additional resources should come from: this paper examines the various possible options and discusses the implications for the aid debate, in order to inform discussion among European civil society organisations. This discussion could not come at a more important time. Aid is under severe pressure as donors seek to cut budgets and to reorient aid to more clearly attribute direct ‘results’ to it.ix Recent initiatives at European and donor level have sought to change the focus of the aid debate towards stimulating the private sector, including emphasizing the role of private flows, particularly foreign investment.x At the same time, the development community is gearing up to decide what targets should replace the Millennium Development Goals. Incorporating financing into this framework will be vitally important. These changes in the aid debate take place against the backdrop of a greatly increased focus on other financial flows, including illicit capital flight, as governments seek to plug leaks in their revenues and aware that the ongoing economic and financial crisis has demonstrated how fragile yet important finance flows, finance institutions and financial regulation are.
Assessing the value of financial flows
Financial flows can have widely varying impacts, both positive and negative, depending on the circumstances. Ultimately we are interested in the impact of financial resources on poverty, but this is a complex, contested topic, as many impacts of different resources will depend on a host of other factors. In section B, we will examine some of the key characteristics of the resources studied, before moving on to discuss, in section C, the poverty and sustainable development implications. Finally, in section D, we will provide an summary of what this broad analysis means for aid.
0
500
1000
1500
Climate Change 2010-
2030
Low-carbon energy
2010-2035
Water and sanitation by
2015
High estimate of need
Low estimate of need
ODA

12
B: A summary of the various financial resources available In this section, we will define and analyse the main resources that are potentially available for development, splitting them into the following categories:
• Domestic resources – both public and private.
• Private capital flows – including foreign direct investment, portfolio equity, remittances, and private sector borrowing.
• ODA, philanthropy and other official flows.
• External government borrowing.
• Illicit capital flight – which is mainly caused by companies trying to dodge taxes.
• New “innovative” financial resources – including financial transaction taxes, carbon and other environmental taxes, and creation of new Special Drawing Rights (SDRs).
For each resource flow, we will examine in detail the following elements:
• Scale, trends and volatility. The size of the different flows, and whether they have been increasing or decreasing, provides a good guide to the overall scope the flows have for providing the resources to combat poverty. Volatility is important because it can have significant macro-economic impacts, and can cause major planning issues for governments, particularly when the flows are large.
• Geographical distribution: different countries are affected in different ways by different flows. We will highlight in particular the differential scale of flows between low-income and middle-income countries and note where flows are particularly important for certain countries.
B1 – Domestic resources We begin with an examination of domestic resources: in most developing countries they are the lion’s share of total resources potentially available for development. They also provide a useful yardstick against which to measure inflows and outflows. This is quite a complicated topic, and the development community has put considerably less effort into producing summary analysis of domestic resources than for other areas, though this is beginning to change. The approach we will adopt will be to examine three key measures:
• Total national income – in order to measure all resource flows in a comparable way, it makes sense to compare them to a measure of total national income. The most logical is Gross Domestic Product (GDP) as this is the sum total value of all goods and services produced within a country. It is important to note that this is used as a comparator: the figures do not suggest that each flow represents a certain percentage of GDP, as that flow would only be included in the GDP total if it leads to increased spending on goods and services. In cases where Gross National Income (GNI) is the figure used in the source material, we have used this. xi
• Government revenue and taxation rates – as the key indicator of the domestic resources available for governments. We will also briefly examine domestic borrowing, though we do not separate this as it is financed by private sector capital so overlaps with the next bullet.

13
• National gross capital formation rates (formerly known as gross domestic investment)– which indicates the amount of capital available for private investment in the economy.
Public domestic resources
Scale, trends, volatility
As the graph below shows, government tax revenues have been a sizeable share of national income in developing countries for a long time – over 15% of GDP for all categories, including, by 2009, low-income countries. As the graphs below show, the difference in tax and revenue collection rates between different categories of country is significant, with low-income countries achieving far lower tax and revenue collection rates than other developing countries.
Figure 3: Tax revenues as a share of GDPxii
If all revenues are examined – including in addition to taxes, social security contributions and other revenues such as fines and income from property – the figure for middle income countries moves significantly higher. In lower-middle-income countries it represented 25% of GDP in 2009.
0
5
10
15
20
25
30
35
40
1980 1982 1984 1986 1988 1990 1992 1994 1996 1998 2000 2002 2004 2006 2008
Source: IMF staff estimates
Note: Group medians and dynamic income groups.
Low income Low middle income Upper middle income High income

14
Figure 4: Government revenue GDP share, excluding grantsxiii
NB: see legend for figure 3 above
It is important to note that developing country governments’ revenues fell as a proportion of GDP in the 1980s and 1990s, but rose again over the past decade. This was particularly true for low-income countries. This recent rise has been due to a combination of economic growth, changes in the policy environment for the private sector, and improvements in government revenue mobilization. As ActionAid have noted, this has meant that “aid dependence has fallen sharply even though the absolute quantity of aid has been rising fast.”xiv Tax revenue is relatively straightforward to forecast, and hence is a predictable income source. As UNCTAD have noted, “domestic resources are considerably more stable than external capital inflows… In Africa, UNCTAD has estimated that ODA is up to four times more volatile than domestic tax revenue.”xv In addition to revenues, governments can borrow money. External borrowing is covered in section B4, but domestic borrowing is also becoming an increasingly important source, including for low-income countries, as the graph below shows. In reality, this is a worrying trend, as domestic borrowing is one of the most expensive types of funding, considerably more costly than external borrowing.xvi
0
5
10
15
20
25
30
35
40
45
1980 1982 1984 1986 1988 1990 1992 1994 1996 1998 2000 2002 2004 2006 2008
Low income Low middle income Upper middle income High income

15
Figure 5: Ratio of domestic debt to total government debt, LICsxvii
Distribution and other features
Perhaps the most important and striking fact is that resource availability per capita is extremely low for low-income and lower-middle income countries. While upper-middle income countries have massively increased the taxes available for capita over the past decade, low-income country gains have been far less impressive, and started from a far lower base.
Figure 6: Taxes per capita in Africa 1996-2009xviii
As the graph above shows, the gap between upper-middle-income countries and the rest is huge. In particular, low-income countries have a very small amount of public resources per capita available for development.
0
5
10
15
20
25
30
35
2000 2001 2002 2003 2004 2005 2006 2007 2008 2009 2010
Sources: IMF staff calculations.
0
500
1000
1500
2000
2500
1996 1997 1998 1999 2000 2001 2002 2003 2004 2005 2006 2007 2008 2009
U
S
D
Low income countries Lower middle income countries Upper middle income countries

16
Unlike external resources, the way in which taxes and revenues are collected has a direct poverty impact. Different taxation regimes can have widely varying impacts on different sections of the population. The term used for this is how ‘progressive’ the tax regime is - more progressive tax regimes force the wealthiest to pay a higher share, and reduce the burden on the poorest.
Private domestic resources
Private consumption and investment provide the majority of domestic resources in almost all countries. The World Bank provides data on ‘gross capital formation’, which used to be known as ‘gross domestic investment’,xix and is the best data for estimating domestic private sector investment. There is inevitably some double counting here, as this figure does not distinguish between domestic and external sources of funds. However, as we shall see in section B2, external sources are small compared to the overall total. Domestic private sector investment rates are high and increasing, as the graph below shows. In 2010, middle-income countries had domestic investment rates of over 28% of GDP, and low-income countries over 23%. This compares with a global average of under 20%, showing how developing countries have become world leaders in mobilizing domestic private sector investment.
Figure 7: Gross capital formation as a share of GDPxx
The recent track record of developing countries over the past decade is incredibly impressive. While the rest of the world has suffered significant declines as a result of the global economic crisis, domestic investment rates have remained resilient in developing countries, and have even risen in low-income countries. This suggests that developing countries are managing to provide an increasingly effective policy environment that promotes domestic private sector investment, despite the World Bank’s controversial Doing Business report consistently ranking developed countries as far better places for companies to invest.xxi
15
20
25
30
35
2003 2004 2005 2006 2007 2008 2009 2010 2011
World Low Income Middle Income Upper Middle Income

17
B2 – Private capital flows
Foreign Direct Investment – FDIxxii
Investment is classified as FDI when the investor acquires a “lasting management interest” in the company invested in, normally defined as “10 percent or more of voting stock.”xxiii This means the difference between these flows and portfolio equity (see below) may not always be so significant.
Scale, trends, volatility
In 2011 there was a net inflow of FDI to developing countries of $300 billion – equivalent to 1.3% of their GDP.xxiv FDI inflows into developing countriesxxv were $684 billion, 45% of the global total, while FDI outflows were $384 billion.xxvi xxviiHowever, a significant proportion of these flows represent reinvested earnings from existing investments – i.e. income earned from within the country, not new inflows. According to UNCTAD, this was over $200 billion of the inflows total in 2011.xxviii In addition, the real investment value of the figures will be over-estimated as takeovers of companies in developing countries are also counted as FDI, including those undertaken by private equity firms who “focus largely on services (finance and telecommunications) and mining.”xxix In other words, buying a company overseas is counted as FDI, regardless of whether you subsequently increase investment in or by that company. In 2011, globally, these ‘mergers and acquisitions’ were over a third of total FDI.xxx Finally, foreign companies also send profits home – in certain circumstances this may be more than the original investment. A recent in-depth study of FDI in low-income countries found that “profits repatriated on FDI were high in most countries, with several countries seeing income payments in excess of FDI inflows (Bolivia, Cote d’Ivoire, Mali, Senegal, Cameroon, and Gabon), to offset political and economic uncertainties or to ensure that projects repaid their investments rapidly.”xxxi As the chart below shows, globally, and for developing countries as a whole, FDI is pro-cyclical: it boomed during the early 2000s and fell dramatically during the recent global recession. Apart from this dip in 2008-9, FDI inflows to developing countries have been steadily increasing since 2002. However, a recent paper by intergovernmental think tank, the South Centre, argues that the benign circumstances of rising commodity prices and low interest rates in developed countries that have spurred FDI inflows to developing countries will not last.xxxii Though FDI is generally less volatile than portfolio equity flows (see below), xxxiii this is dependent on country circumstances. A study of FDI to low-income countries found that “it has been quite volatile in eight countries, reflecting peaks in oil investment in Cameroon, Chad, and Gabon, large individual projects in Gambia and Mali, and political instability in Bolivia, CAR [Central African Republic] and Togo.”xxxiv

18
Figure 8: global FDI inflows
Distribution and other features
According to UNCTAD, net FDI inflows were equivalent to 1.6% of low-income country GDP in 2011, slightly higher than the developing country average.xxxv The figures for certain kinds of country can be significantly higher. Most notably inflows were equivalent to 3.8% of GDP for “major exporters of primary commodities excluding fuels”. For individual countries, FDI can be very high. In 2011, not including offshore financial centres, ten developing countries had FDI inflows worth more than 10% of GDP; seven of these are low-income countries.xxxvi FDI is driven by commercial considerations, though governments have tried, with varying degrees of success to direct or incentivize FDI to different areas. UNCTAD have produced an ‘FDI contribution index’ which, “looks at the contribution of foreign affiliates to GDP (value added), employment, wages and salaries, exports, [research and development] expenditures, capital formation and tax payments, as a share of the host-country total (e.g. employment by foreign affiliates as a percentage of total employment).” xxxvii This is obviously only a partial measure – it says nothing about the social or environmental impacts of FDI for example – but it does highlight some important conclusions. Of the group of countries that do badly on the index – those with high FDI but low contribution - tax havens and primary resource producers are singled out by UNCTAD.xxxviii
0
500
1000
1500
2000
2500
1995 1996 1997 1998 1999 2000 2001 2002 2003 2004 2005 2006 2007 2008 2009 2010 2011
Source: UNCTAD, based on annex table I.1 and the FDI/TNC database
(www.unctad.org/fdistatistics).
FDI inflows, global and by groups of economies, 1995-
2011 (Billions of dollars)
World totalDeveloped economies
Developing economies
Transition economies

19
Portfolio equity flows (stocks and shares) Portfolio equity flows include “shares, stocks, depository receipts … and direct purchases of shares in local stock markets by foreign investors”.xxxix
Scale, trends, volatility
According to the World Bank, in 2010 net portfolio inflows to developing countries were $128.4 billion, equivalent to 0.6% of GDP. Net portfolio inflows are highly volatile, pro-cyclical flows, as the graphs below show. According to the World Bank, $129.69 billion of net portfolio equity flowed into middle-income countries in 2010 (0.66% of GDP), while net $53.34 billion had flowed out in 2008. In 2011, the net inflow dropped dramatically again to $6.2 billion (0.03 % of GDP). This volatility happens because foreign investors tend to sell overseas stocks and shares first during bad times. For this reason an increasing number of developing countries are re-imposing capital controls to prevent macroeconomic shocks caused by this ‘hot money’.xl
Figure 9: Portfolio equity, net inflows, MICS ($)
Distribution
Globally, portfolio equity inflows are concentrated in a small number of countries. The top ten middle-income country recipients accounted for $122.1 billion out of the $128.4 billion developing country total in 2010.xli However, the scale and volatility of portfolio equity flows can be far more significant for low-income countries. As the graph below shows, in 2007 $139billion of portfolio equity flowed into low-income countries, equivalent to an astonishing 44.76% of GDP, but in 2008, $25 billion flowed out – 6.74% of GDP.
-100
-50
0
50
100
150
2003 2004 2005 2006 2007 2008 2009 2010 2011
Bil
lio
ns
Middle Income

20
Figure 10: portfolio equity, net inflows, low-income countries ($)
Private sector borrowing Banks and companies borrow money from overseas, and make loans overseas. The figures in this section inevitably involve some double counting with other private flows figures, particularly FDI, where multinationals lending to their subsidiaries can be classified as borrowing or as investment. In addition, not all the data is divided clearly between private and public sector borrowers (only lenders), so this section is short, with additional analysis in section B4.
Figure 11: Global net borrowing flows by borrower type ($)
Scale, trends, volatility
In 2010, the net inflow to developing country private actors was $353 billion, equivalent to 1.8% of GDP. In other words, developing country private sector actors borrowed 1.8% of GDP.
-50
0
50
100
150
2002 2003 2004 2005 2006 2007 2008 2009 2010
Bil
lio
ns
Low Income
-100
0
100
200
300
400
500
2001 2002 2003 2004 2005 2006 2007 2008 2009 2010
Bil
lio
ns
Private sector nonguaranteed borrowers Public and publicly guaranteed borrowers

21
As the graph above shows, private sector borrowing is pro-cyclical, it rises during boom times, and collapses during crises. It is important to note that different types of private finance my have different costs in terms of the interest rates charged for developing countries. Research by Development Finance International has found that debt, including commercial debt may often be cheaper than other forms including FDI. Public-private partnerships (PPPs) are the most expensive.xlii
Remittances
Remittances are monies sent home by workers living abroad. xliii Owing to the difficulties of collecting data, it is likely that figures are under-estimates.xliv
Scale, trends, volatility
In 2009xlv inflows of remittances to developing countries were $307.1 billion, and outflows were $58.7 billion. This gives a total net inflow of $248.4 billion, equivalent to 1.5% of GDP. Remittances have proved less volatile than FDI over the past 20 years, steadily rising until plateauing after 2008xlvi. The World Bank argues this is because of certain inherent features of remittances.xlvii They have also grown in scale, in absolute terms, and in comparison with other private flows, as this chart shows.
Figure 12: Remittance flows to developing countries compared to other flowsxlviii
Distribution
In low-income countries, in 2009, net remittances (inflows-outflows) were equivalent to 4.9% of GDP. In 22 developing countries in 2009 remittances accounted for over 10% of GNI. These were mostly small countries, but also a few large ones, such as Nepal and Bangladesh.
-20
80
180
280
380
480
580
680
US
$ b
illi
on
s
FDI Remittances ODA Private debt and portfolio equity
22
In 2010 the total inflow (not the net inflow) of remittances to low-income countries reached $24.3 billion, continuing a rising trend – the total was $8.1 billion in 2008. However, the vast majority flows to a small number of countries. In 2010, the six LICs with inward remittance flows of over $1billion (Bangladesh, Nepal, Tajikistan, Kenya, Haiti, Kyrgyz Republic) accounted for 93% of the total, with Bangladesh alone receiving almost half ($11.1 billion). There is little evidence on the distributional impact of remittances within countries, but for one recent case study in Liberia “the research findings suggest that rich, rather than poor, households could be the main beneficiaries of remittances.”xlix
B3 - ODA, philanthropy and other official flows
ODA
Scale, trends, volatility
In 2011, official development assistance (ODA, or ‘aid’) to developing countries totaled $134 billion, equivalent to 0.6% of their GDP.l Until 2011, aid had been steadily increasing over the past decade.li This number needs to be treated with care. First it is not quite complete: OECD members Chile and Mexico do not report their aid to the Development Assistance Committee (DAC) of the OECD. In addition, it does not capture aid or other official flows from non-OECD members. Though these are much smaller in scale, this ‘South-South cooperation’ is rising in importance. As former DAC chair, Richard Manning has argued, “South-South co-operation, for example, now totals some $15 billion a year; the concessional part of these flows share many (indeed, in many cases, probably all) features of ODA.”lii Second, not all ODA represents a flow to developing countries: a significant proportion remains in the host country, or other wealthy countries for a variety of reasons. Eurodad research has shown that over half of ODA is spent on procuring goods and services and that two thirds of these procurement contracts are awarded to OCED countries.liii It is therefore difficult to estimate the real size of ODA flows to developing countries, but a number of efforts have been made. For example, CONCORD’s 2012 Aidwatch reportliv discounts five categories of ‘inflated aid’ (imputed student costs, debt relief, tied aid, interest on loans and refugee costs) which it calculates as 14% of total EU aid in 2011.lv For individual countries, aid can be a highly volatile and unpredictable flow. One recent evaluation found that: “ODA is much more volatile than major macro variables: five times as volatile as GDP and three times as volatile as exports for the average recipient. ODA typically magnifies real business cycles in recipient countries.”lvi However, aid overall has not been particularly volatile, as the graph above shows, and continued to rise even in the aftermath of the financial crisis. This suggests that if the problems that can lead to aid unpredictability can be overcome, aid could deliver more
23
predictable, counter-cyclical resources for developing countries. We shall explore this issue more in section C.
Distribution and other features
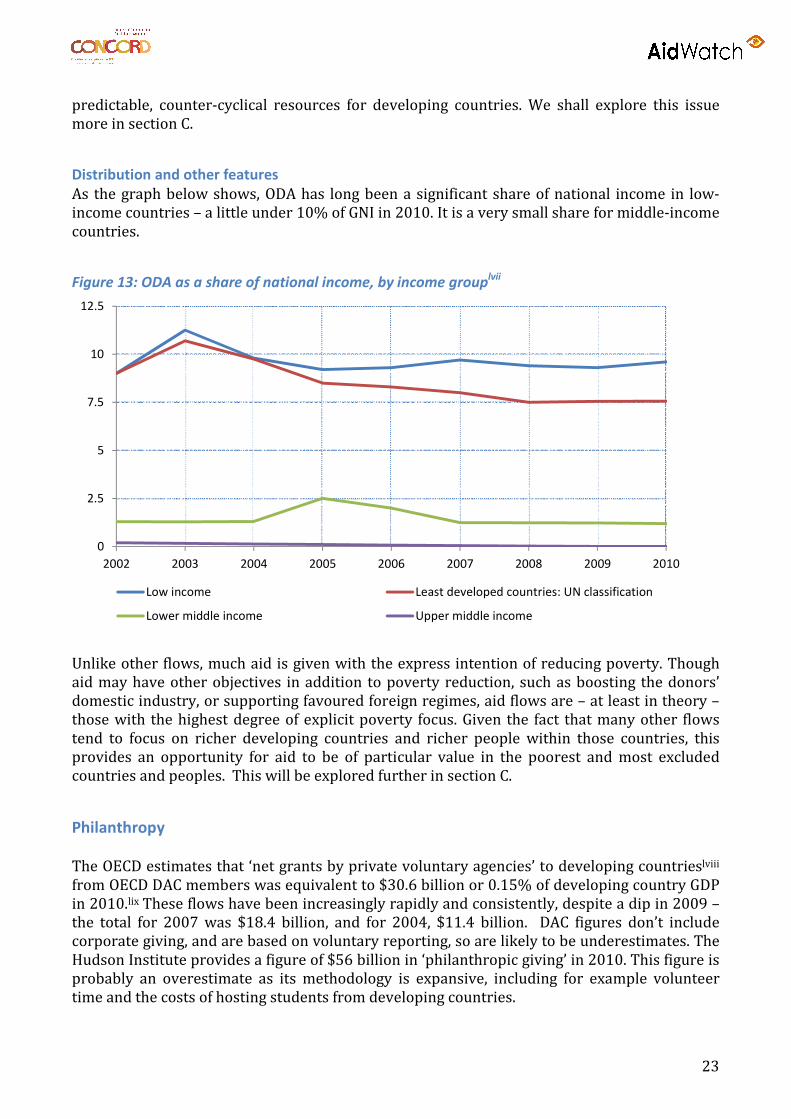
As the graph below shows, ODA has long been a significant share of national income in low-income countries – a little under 10% of GNI in 2010. It is a very small share for middle-income countries.
Figure 13: ODA as a share of national income, by income grouplvii
Unlike other flows, much aid is given with the express intention of reducing poverty. Though aid may have other objectives in addition to poverty reduction, such as boosting the donors’ domestic industry, or supporting favoured foreign regimes, aid flows are – at least in theory – those with the highest degree of explicit poverty focus. Given the fact that many other flows tend to focus on richer developing countries and richer people within those countries, this provides an opportunity for aid to be of particular value in the poorest and most excluded countries and peoples. This will be explored further in section C.
Philanthropy The OECD estimates that ‘net grants by private voluntary agencies’ to developing countrieslviii from OECD DAC members was equivalent to $30.6 billion or 0.15% of developing country GDP in 2010.lix These flows have been increasingly rapidly and consistently, despite a dip in 2009 – the total for 2007 was $18.4 billion, and for 2004, $11.4 billion. DAC figures don’t include corporate giving, and are based on voluntary reporting, so are likely to be underestimates. The Hudson Institute provides a figure of $56 billion in ‘philanthropic giving’ in 2010. This figure is probably an overestimate as its methodology is expansive, including for example volunteer time and the costs of hosting students from developing countries.
0
2.5
5
7.5
10
12.5
2002 2003 2004 2005 2006 2007 2008 2009 2010
Low income Least developed countries: UN classification
Lower middle income Upper middle income

24
Other Official Flows
There are other flows from governments to developing countries that are not counted as ODA because they “are not primarily aimed at development, or because they have a grant element of less than 25 per cent.”lx These are recorded by the OECD as ‘other official flows’ (OOF), and include export credits. However, these have not tended to be comparable in scale, and hence are not included in our summary table. For example, in 2010 the net value of OOF to developing countries was $4.49 billion, the majority from Japan. In some years, such as 2004 and 2007, the net total was negativelxi, again by relatively small amounts ($0.82 billion and $2.77 billion respectively.)lxii
B4 – Governments’ external lending and borrowing
External borrowinglxiii
Developing country governments borrow money from a variety of external sources (an inflow) and later make repayments (an outflow) unless the debt is cancelled.
Scale, trends, volatility
In 2010, the net inflow to developing country governments was $142 billion, equivalent to 0.71% of GDP.lxiv This means, of course, that developing country governments as a whole contracted an additional $142 billion of debt in 2010. The raw flow data needs to be examined in relation to other factors, including:
• Total debt stock – this has important implications for future flows, both in terms of the scale of future repayments and the ability of developing countries to continue to borrow in the future. In 2010, developing countries had $4,076 billion of public and private debt on their books, equivalent to 21% of their GNI, a level the World Bank considers “moderate”.lxv 54% of this debt was publically guaranteed.lxvi
• Maturity of debt – In 2010, $268.5 billion – or 24% - of the net borrowing of developing countries was short-term, mostly incurred by private actors to finance trade. As the name suggests, this debt is lent for a short period of time – so a large figure need not indicate a great deal more than a large number of trade transactions that will rapidly be repaid. However, this can entail significant macro-economic risks, particularly during shocks or crises.
In 2010 there was a total borrowing inflow (to both public and private actors) of $495 billion, equivalent to 2.5% of GDP. The lion’s share of this - $424 billion – was borrowed from private creditors.
Figure 14: Net Debt Flows by creditor type 2001-10lxvii

25
This is indicative of most of the past ten years as the graph above shows. The graph also shows that lending is inherently volatile: during times of crisis, private lending can drop dramatically, as happened 2008-2009. Conversely, public lending to governments tends to increase during bad times, as governments borrow more from the IMF and World Bank to plug fiscal gaps.
Distribution
In 2010, Having gone down as a result of debt cancellation, low-income country debt stocks have been rising since 2006, though they fell back slightly in 2010 to $95.5 billion. While this may appear low, the situation varies enormously from country to country. “As of March 2012, the IMF and World Bank have assessments of 68 low and middle income countries, of which: 5 are in default on at least some of their debt payments; [and] 15 are at high risk of not being able to pay their debts”.lxviii
External lending Developing countries lend to developed countrieslxix when they expand their reserves – they purchase bonds from hard currency countries, in particular the United States. Since the Asian Financial Crisis at the end of the last century, developing countries have pursued a policy of building enormous reserves to protect their economies and currencies.
Scale, trends, volatility
In 2011, developing countries increased their reserves by $1.1 trillion – equivalent to 4.7% of their GDP - the majority of this through lending to developed economies. The enormous scale of lending by developing countries to developed countries over the past decade is shown in the chart below.
-100
0
100
200
300
400
500
2001 2002 2003 2004 2005 2006 2007 2008 2009 2010
$ b
illi
on
s
Private creditors Official creditors

26
Figure 15: Lending to developed countries by developing countrieslxx
According to UNDESA, this means that “Developing countries, as a group, are expected to provide a net transfer of financial resources of approximately $826.6 billion to developed countries in 2011”.lxxi
Distribution
The reserves figures provided by UNDESA are not broken down by country income group, but the graph below shows their estimates of net financial transfers. This shows that this low-income countries have not been lending to developed countries: this is a middle-income country phenomenon.
0
200
400
600
800
1000
1200
1400
2000 2001 2002 2003 2004 2005 2006 2007 2008 2009 2010 2011
Change in reserves (billions of dollars)

27
Figure 16: Net financial transfers 2001-11 by income categorylxxii
-700
-600
-500
-400
-300
-200
-100
0
100
Low-income countries Lower middle income countries Upper middle income countries
Bil
lio
ns
of
do
lla
rs
Average 2001 - 2009 2010 2011

28
B5 – Illicit capital flight
What is illicit capital flight?
Global Financial Integrity (GFI), who produce the most widely used statistics in this area, provide this definition: “Illicit flows involve capital that is illegally earned, transferred, or utilized”.lxxiii This includes “transfer of the proceeds of bribery, theft, kickbacks, and tax evasion”lxxiv but the majority continues to be attempts by companies to dodge tax, including through trade mispricing. According to GFI:
“Much attention has been focused on corruption in recent years, that is, the proceeds of
bribery and theft by government officials. In the cross-border flow of illicit money, we find
that funds generated by this means are about 3 percent of the global total. Criminal
proceeds generated through drug trafficking, racketeering, counterfeiting and more are
about 30 to 35 percent of the total. The proceeds of commercial tax evasion, mainly
through trade mispricing, are by far the largest component, at some 60 to 65 percent of
the global total.”lxxv
Scale, trends, volatility
According to GFI’s most recent estimate, developing countries lost $775 billion – equivalent to 4.3% of their GDP - in illicit flows in 2009. By their very nature, illicit flows are difficult to measure, though it is likely existing figures are significant underestimates. International institutions have devoted remarkably little effort to estimating illicit capital flight; in fact the IMF and Bank of International Settlements (BIS) don’t publish or record much of the relevant data. The best estimates in this field come from specialist NGOs.lxxvi
Figure 17: Illicit financial flows from developing countries, nominal terms ($bns)lxxvii
As the chart above shows, illicit flows had been on a significant upward trajectory until the global financial crisis. In addition to the loss of capital which could have been invested in the developing country from which it originated, capital flight deprives developing country governments of tax
0
200
400
600
800
1000
1200
1400
1600
1800
2000 2001 2002 2003 2004 2005 2006 2007 2008 2009
Normalised IFFs Non-Normalised IFFs

29
revenue. Christian Aid provides the most recent estimate - $160 billion lost in tax revenues per year for developing countries.lxxviii
Distribution
Middle income countries dominate illicit outflows from the developing world: Bangladesh and Ethiopia are the only low-income countries in the top 60 illicit flow source countries, according to GFI. China alone accounted for 38 percent of illicit outflows in 2009.lxxix However, Eurodad analysis of GFI data shows that low-income countries also lose a substantial amount – equivalent to 3% of GDP in 2008, as the graph below shows. Some countries are particularly badly affected. For example, in 2008, illicit financial flows were equivalent to 33% of GDP in Guinea, 18% in Tajikistan, and 10% in Mali.lxxx In addition, like other flows, illicit financial flows can be particularly volatile for low-income countries.
Figure 18: Illicit financial flows from LICs (%GDP)
Illicit capital flight is likely to have a deeply regressive impact on distribution within countries, partly because of the loss of tax revenues that could have been spent on public services or productive investment, but also because it is a channel used by the wealthiest sections of society to hide their wealth overseas, including in tax havens. Recent research by the Tax Justice Network estimates that $7.3 - $9.3 trillion in untaxed financial assets originating from 139 (mostly developing) ‘source’ countries is currently sitting in offshore financial centres.lxxxi
0%
1%
2%
3%
4%
5%
6%
2000 2001 2002 2003 2004 2005 2006 2007 2008
IFFs

30
B6 – New “innovative” financial resourceslxxxii
Unlike other sections, here we examine potential rather than actual flows. The term ‘innovative finance’ has been used to capture a variety of ideas for increasing financing available to developing countries. In some cases, prototype or small versions of these flows exist, in others they are still on the drawing board. As there are a large number of proposals, and as, by their very nature their impacts cannot be examined, we will provide only brief assessments. Broadly speaking, there are two categories of proposals we will consider: raising new taxes or creating new resources.lxxxiii There are two other categories commonly included in discussions of innovative financing and examined in the WESS which we shall not examine here. They are:
• Methods to bring forward or ‘frontload’ existing aid resources such as the International Finance Facility for Immunisation (IFFm). This category is not included as it does not propose any change in the quantity of flows, just the date at which they are available.
• Risk management tools such as the Advanced Market Commitments, which guarantees markets for new vaccines developed by private companies. Though these may result in significant benefits, they don’t involve financial transfers to developing countries, so they are not included in this paper.
Financial Transaction Taxes
Summary of proposals
Financial Transaction Taxes (FTTs) are taxes on the trading of shares, bonds, derivatives and foreign exchange, levied principally on financial institutions such as banks and hedge funds, which carry out the majority of these trades. lxxxiv “FTTs are commonplace and have been introduced permanently or temporarily over many decades in over 40 countries.”lxxxv In a sample of just seven G20 countries, the IMF has estimated that FTTs are already raising $15 billion per year.lxxxvi A group of 11 European countries announced in October this year their intention to adopt new FTTs on trading of shares, bonds and derivatives.lxxxvii This regional initiative and the numerous unilateral FTTs that currently exist undermine the argument that FTTs need to be global to work.
Potential scale
• According to UNDESA, “A small tax of half a ‘basis point’ (0.005 per cent) on all trading in the four major currencies (the dollar, euro, yen and pound sterling) might yield an estimated $40 billion per year.”
• In 2011, the European Commission estimated that an EU implemented FTT could raise “between €16.4 billion and €400 billion depending on assumptions on decrease in volume, the scope of products covered and the tax rates (0.01% for the first estimate and 0.1% for the second).”lxxxviii
• According to the 2011 Gates report to the G20: “Some modeling suggests that even a small tax of 10 basis points on equities and two basis points on bonds would yield about $48 billion on a G20-wide basis … Other FTT proposals offer substantially larger estimates, in the $100 billion to $250 billion range, especially if derivatives are included.”lxxxix

31
The extent to which the revenues will be redistributed to developing countries depends on whether a portion of the revenues are allocated for this purpose. The Robin Hood Tax campaign, for example, calls for 25% of revenues to fight global poverty and 25% to fight climate change.xc In addition to the above, many proponents of FTTs argue that they can play a significant role in reducing speculation and stabilizing financial markets, with potentially significant benefits for developing countries in terms of decreased financial turbulence and shocks.
Carbon and other Environmental Taxes To simplify discussion, we have included here the three main tax proposals which, in addition to raising revenue, also aim to reduce greenhouse gas emissions. This distinction - between taxes on carbon or other environmental ‘bads’, and what the revenue raised is eventually is used for - is crucial. The discussion on allocation of any such revenues is often a hotly debated topic.
Summary of proposals
• Airline ticket levy: This is already in existence in nine countries,xci with the proceeds from most countries earmarked for UNITAID. It varies from country to country, but is essentially a one off extra payment per ticket.xcii
• Carbon taxes: There are various options, starting from a globally coordinated tax set per tonne of CO2 emissions to introducing a levy on the use of bunker fuels (the crude oil used for aviation and maritime transport).xciii Revenue from carbon taxes could be used for national and international climate purposes, including to fill the Green Climate Fund.
• Carbon trading revenues: Carbon trading schemes can yield revenues if permits are auctioned or sold rather than given away. From 2013, in Europe, home to the largest emissions trading scheme, the amount of emission allowances given away for free to industry will reduce substantially from January 2013, which will increase the resulting revenues. xciv
Potential scale
• Airline ticket levy: the existing tax has raised over $1 billion for UNITAID since 2006.xcv If expanded to more countries, or increased in scope, the potential raised could increase significantly.
• Carbon taxes: o Developed country tax per tonne: A 2011 joint report by the IMF, World Bank and
OECD estimated that a tax of $50 per tonne in developed countries would yield about $450 billion per year, or $250 billion ($25 per tonne) or $155 billion ($15 per tonne.)xcvi
o Aviation and bunker fuels: if a tax of $25 per tonne was levied and taxes paid by developing countries were rebated, the same report estimates that $22 billion per year could be raised, or $14 billion if the rate were $15 per tonne.
• Carbon trading: Global estimates do not exist, however the European Commission estimates that “auction revenues under the EU Emission Trading System (ETS) … could potentially deliver revenues of more than €20 billion per year by 2020, of which Member States should use at least half to tackle climate change in the EU and third countries.”xcvii

32
As with FTTs, it is not clear whether developed countries will redistribute a portion of the money raised from carbon taxes or emission permit sales to developed countries. Carbon taxes would also provide a significant source of domestic revenue. It is extremely important to note that carbon taxes would also have the important benefit of reducing greenhouse gas emissions in developed countries, benefitting developing countries, which stand to suffer the most from global warming. The same may be true of carbon trading schemes, though the current “global carbon market is small and prices are volatile, which can hinder long-term investments.”xcviii In addition the existence of the potential for companies to pay for emissions reductions in other countries rather than reducing their own emissions makes “the carbon market approach … somewhat complicated and open to abuse”.xcix
New SDR creation Special Drawing Rights (SDRs)c are an international reserve asset held at the IMF by all member governments. Though they cannot be used as direct expenditure – they are more like a low-interest overdraft facility than a cash deposit – “their additional availability … could reduce the need for individual developing countries to set aside foreign-exchange earnings in reserve holdings of their own as a form of self-insurance against global market shocks.”ci In other words, if additional SDRs were created for developing countries, they could sell a portion of their reserves, or reduce their need to buy new reserves, releasing extra domestic revenue for governments.
Summary of proposals
The main proposal is to agree regular additional allocations of SDRs – in effect to create new reserve assets. In 2009, a G20 agreement led to the issuance of $250 billion in extra SDRscii, showing that, in times of crisis at least, such ‘global quantitative’ easing is possible. There are two variants of this proposal. Under option 1, this would follow existing rules, meaning amounts allocated would correspond with quota shares at the IMF: the majority of allocations going to high-income countries. Option 2 is to amend the IMF’s constitution - its Articles of Agreement – to allow the majority of new allocation to go to developing countries.ciii The figures below are those proposed by UNDESA who suggest annual allocations of $100-250 billion per yearciv. An additional proposal made by UNDESA, not covered here, is to use existing ‘idle’ SDRs (those not needed by rich countries) to borrow money to lend cheaply to developing countries.
Potential scale
• Option 1 = $11 - 18 billion for low-income countries and $49 - 82 billion for middle-income countries, as their share of an annual $150- 250 billion allocation.
• Option 2 = $100-$167 billion annually for developing countries, representing 2/3 of the total allocation.
Many also argue that the gradual expansion of the role (and formulation) of the SDR could, over time, provide a realistic alternative to the US dollar as global reserve currency, providing potentially significant benefits for developing countries in terms of improved global economic stability and a reduction in the power of any one country.cv

33
C: Impacts on poverty and sustainable development We will briefly note some of the key implications for poverty and sustainable development of this overview of financial resources, under five key headings: scale and trends; volatility and risk; distribution; accountability and transparency; impacts on domestic politics; and contributions to sustainable development. First, however, we must stress again that financial resources are only one part of the answer: poverty reduction and development depend on a host of factors, many of which are likely to be more important in many countries than the nature or scale of available resources. Many of the great economic development success stories, such as South Korea, made the best use of the limited resources they had available, while other countries with access to far higher levels of financial resources have not been so successful. Conflict, governance, the international policy environment, domestic policy and other factors matter enormously.
Scale and trends
Overall, and in the majority of countries, domestic resources dominate. Both public and private domestic resources are far larger in scale than all inflows and outflows combined, and over the past ten years developing countries have managed to increase the share of GDP going to public spending and private investment. Low-income countries, though lagging behind other developing countries, have made the most impressive strides. Outflows are larger than inflows, and a large part of this is due to failings in the international system. The two major outflows are caused by: financial secrecy and the web of tax havens that facilitate illicit financial flows; and the failure to promote global macroeconomic stability or provide a credible international lender of last resort that forces developing countries to build huge stockpiles of reserves. In addition, it is important to note that developing countries are both sources of inflows and outflows, and that the level of outflows from developing countries has been increasing significantly. One particularly important trend has been the growth of south-south flows, particularly in private investment. The picture varies across countries, and low-income and vulnerable countries tend to be far more affected by external resources than other countries. Many of the poorest countries are still heavily aid dependent, and many primary resource dependent countries attract major external private investment, often with a low impact on poverty reduction or economic development.
Volatility and risk
Private financial flows are often highly volatile and can be extremely destabilizing, particularly portfolio equity and short term lending. Low-income countries are particularly vulnerable, as the scale of the flows can be far larger in relation to GDP, and their ability to take protective measures is limited. Though FDI tends to be less volatile than other flows, this is not always the case, and, as UNCTAD have set out, a strong domestic policy framework is required to ensure FDI makes a significant contribution to development. Developing countries’ efforts to protect themselves against this vulnerability have been hampered by the international policy environment. Until recently, the IMF was promoting the liberalization of capital flows, though it has now been forced to accept that countries may need to regulate inflows and outflows. The actions and influence of emerging market countries are the main cause of this change of heart.cvi

34
Public sources of finance are much more predictable and stable, particularly domestic taxation. Overall, aid has not proved volatile or pro-cyclical, though at a country level it has often been extremely unpredictable. If aid could be made more predictable it would make a major difference to the value of aid as a financial resource for developing countries. The current structure of borrowing and lending imposes significant costs on developing countries. The Asian financial crisis at the end of the last century taught many developing countries that they needed to amass large stockpiles of reserves to protect their currencies and their economies, and that they could not trust the IMF to help during times of crisis. While this reserve accumulation policy has proved, to a large extent, effective, it means that developing countries continue to lend vast sums to rich countries. At the same time, when developing countries have to borrow, they do so at higher interest rates.
Distribution
There are two extremely important points to note. First, the poorest countries have very low levels of financial resources per capita. This is true for all types of resources, including domestic resources. Some, such as Jeffrey Sachs, have argued that this means that some of the poorest countries are caught in a poverty trap – they simply do not have sufficient resources to invest enough to develop.cvii Hence, aid is needed for these countries to help them escape this trap. Whether or not this is true, it is clear that the low level of resources available to the poorest countries means they face severe constraints in investing in the basic services and infrastructure necessary for poverty reduction, promoting economic growth and protecting their environments. Second, public resources have the potential to target the poorest and most vulnerable in society in a way that private flows cannot. Private investment tends to flow where economic opportunities are greatest and, though this can prove an extraordinary driver of economic development, job creation and poverty reduction, it also means many people and regions do not benefit. Public resources, whether domestic or external, have the advantage of being able to consciously target such groups. This is particularly important in low-income countries where ODA is equivalent to a very significant proportion of GDP in low-income countries – 10% on average, with 37 countries higher than that total in 2010.cviii
Accountability and transparency
All of the resources discussed would benefit from significant improvements in their accountability and transparency. It is beyond the scope of this report to analyse how this could be done. Civil society organizations have often focused on public flows – aid and domestic public resources – precisely because some notion of accountability and transparency is expected of the actors involved, even though they may not live up to those expectations. Efforts made to make private resources more accountable and transparent, such as working on minimum social or environmental standards, largely depend on public actors to push this agenda.
Impacts on domestic politics
Domestic political impacts of resource flows can be extremely important for poverty reduction and sustainable development. For example, the conditionalities attached to lending by IFIs has proved highly controversial owing to its promotion, particularly during the 1980s and 1990s, of a blend of neoliberal economic policies that most now accept did little to promote sustainable or inclusive development. In addition, the strong influence of external actors on

35
domestic policy making undermines the space for developing countries to set their own policy agendas, and for citizens of those countries to hold their governments to account. Two other important theories may be worth noting. First, the concept of the ‘resource curse’ is well understood. When countries become dependent on a natural resource for income, this can undermine economic development through Dutch disease, and provide an incentive for ruling elites to focus on gaining a slice of these revenues, rather than expanding economic opportunities. A corollary concept is that of the ‘social contract’ –the act of having to depend on citizens for revenue forces governments to become more accountable. Finally, it is important to note that the process of international economic liberalization over recent decades, and the growth in the offshore economy, have provided incentives for governments to engage in a ‘race to the bottom’ on taxation and on standards expected of companies. cix
Contributions to sustainable development
Ultimately, the impacts of different resources on poverty reduction depend on the overall macroeconomic, political and environmental environment in each individual country. It may be worth distinguishing between two spheres where resources may be needed. In the first sphere of public goods – including basic services, the environment, natural resources and security - there is a greater demand for public sources of finance. However, in the area of productive development – the financing of infrastructure, business expansion and so on – the debate is highly contested. Ultimately, impacts on poverty reduction in this sphere depend both on how much real economic growth is created, how sustainable this is, and how the proceeds of that growth are distributed. The dominant paradigm of the 1980s and 1990s – that governments should focus on providing an enabling environment and reduce interference in the economy - is giving way to a recognition that successful economies have used industrial strategies to move up the value chain, particularly through promoting manufacturing, which has required strong state intervention.
D: Implications for ODA Before examining some of the key implications for ODA of this global analysis of finance and development, it’s worth recapping the key findings.
• Domestic resources are far larger than other financial resources, and have been growing as a share of GDP over the last decade.
• Volatility and predictability of external finance is a major issue, especially for low-income countries, where it is equivalent to a major share of GDP.
• Private flows, in particular portfolio equity and short-term finance are particularly volatile and can be incredibly destabilizing.
• Overall, outflows are significantly larger than inflows, largely caused by illicit capital flight and reserve-accumulation: both issues intimately linked to global policy failings.
• Aid is particularly important in low-income countries where it averages around one tenth of GDP.

36
Six broad conclusions can be drawn from this paper, which we shall examine in turn. First, CSOs have been right to focus campaigning energy on a broad set of development finance reforms and structural change. Second, a traditional focus on aid as a mechanism to provide public goods remains important. Third, growing demands for public finance to protect international public goods suggest we will need to mobilise other financing sources. Fourth, aid should make sure it supports domestic resource mobilization. Fifth, the push to use aid to ‘leverage’ private finance is built on shaky assumptions. Sixth, we need to be particularly aware of aid’s potential macroeconomic impact in low-income countries, including by improving predictability, and supporting local procurement. It is vitally important to note that these do not provide a blueprint for how ODA should be used in any particular country, which should be the subject of a domestic discussion about priorities in that country.
1. Importance of CSO campaigns on development finance
It is clear that aid is becoming an increasingly small share of finances potentially available for development. At the same time, developing countries face many financing issues related to the international policy framework. Hence, CSO campaigning on broader structural issues and other development finance priorities remains warranted as an essential complement to aid advocacy. Important campaigns include:
• Tax justice campaigns to: prevent tax dodging by companies, the main source of illicit capital flight; promote more progressive taxation and prevent the race to the bottom; and to crack down on tax havens.
• Financial system reform campaigns to: defend the right of countries to regulate capital flows; reduce damaging financial speculation on essential commodities; and reform banking and finance regulations.
• Debt campaigns to: promote fair and equitable debt workout mechanisms; cancel illegitimate debt; and reform international financial institutions.
• Innovative finance campaigns to: raise significant new funds for poverty reduction and environmental sustainability; provide incentives for changed behavior through new taxes.
• Private finance campaigns to: insist on social and environmental standards for companies investing overseas; and promote transparency and accountability.
It is rare for donors to directly fund campaigning efforts directed at them, but a number of donors provide core funding for CSOs, part of which will fund advocacy and campaigning activities. Major changes can be achieved for developing countries through campaigning efforts, as the Jubilee movement proved. Of course, dependency and cooption are always risks.cx Donors have also supported other efforts aimed at changing their own policies and practices. For example, DFID has funded other UK government agencies to track and repatriate assets stolen from developing countries.cxi However these kinds of interventions are not normally eligible to classify as ODA.cxii Another option has been for ODA to be used to support southern governments’ negotiating and policy capacity. This has been attempted in a number of ways, including by: directly funding the negotiating capacity of southern countries, particularly for trade negotiations;cxiii by supporting the permanent delegations to international institutions; and by funding the research and policy development undertaken to support southern government positions. If southern governments are better able to fight their corner in international negotiations, and to develop clear frameworks for how they will manage the various external flows, outcomes are likely to be more balanced in their favour.

37
2. Providing public goods remains relevant
It is clear that one of the biggest funding gaps is for public investment in lower-income countries; it is lack of investment in infrastructure, health and education that undermines private investment. This has been a traditional focus for aid, which remains extremely relevant, particularly in low-income countries. There are a number of ways aid can directly provide funding for public investment. In some circumstances, direct budget support (DBS) may be an option. DBS is designed to recognize that governments need stable, unearmarked funding to deliver public services and other public goods. Some versions, such as the European Commission’s MDG contracts also manage to reduce the conditionality and political interference that is often tied to DBS.cxiv According to ActionAid, “Evaluations from [the] OECD, the EU, think tanks such as the Overseas Development Institute, as well as NGOs like Oxfam, have concluded that budget support increased the quantity of service delivery in almost all countries, especially in basic education and health.”cxv However, DBS, by its nature, supports everything the government does, and provides political as well as financial backing to the government. In many countries, other aid modalities will be more suitable including sectoral approaches, or country-led projects.
3. Growing demands for global public goods financing
Aid has traditionally focused on domestic public goods – healthcare, education, clean water and a healthy local environment, for example. However, the world faces severe global challenges, particularly environmental challenges such as global warming and the destruction of ecosystems and biodiversity. Most of these will require a step change in the provision of resources – for example in Cancun in 2010, developed countries promised $100 billion annually by 2020 to support climate change mitigation efforts in developing countries.cxvi As already noted, the UN estimates that “additional investment needs of developing countries for sustainable development, including for climate change mitigation and adaptation, and for ensuring access to clean energy for all, sustainable food production and forest resource management, at about $1 trillion per year in the coming decades.”cxvii ODA cannot be expected to fill these gaps – hence the importance of finding new and additional resources for development, such as those described in section B6. Ongoing discussions about reopening the definition of ODA take place against this backdrop. It will be important to ensure that the ODA definition is improved, for example by removing “inflated aid” items identified by Aidwatchcxviii rather than using an expanded ODA definition to increase the scope of objectives ODA is expected to support, thereby reducing the amount of aid directed at fighting poverty.
4. Ensuring aid supports domestic resource mobilisation
Improving tax collection systems In recent years, donor agencies have devoted around 5% of their aid to improving public financial management systemscxix in developing countries, though only a small portion of that has gone to improving tax collection systemscxx – an estimated 0.1% of total aid allocations between 2002 and 2010.cxxi There have been some notable successes, though, according to a recent study of five African countries, “Overall donor support has had mixed results in supporting the improvement of tax administration capability on a sustainable basis.”cxxii

38
Aid agencies and governments can also have negative impacts on domestic resource mobilization. Developing country tax policies have been heavily influenced by IFI conditionalities and technical assistance for many years, and donors have tended to tie their aid to IFI programmes. According to Intermón Oxfam, this “has had a negative impact in many cases, with a focus on indirect regressive taxation like VAT, and extensive tax incentives for companies.”cxxiii Supporting national development banks There has been renewed attention since the global crisis to the potential for government backed development banks to increase the supply of credit to the private sector, with the UK, for example, launching a new green investment bank. Until the 1990s, IFIs gave considerable support to or through national development banks (NDBs).cxxiv Many countries have already have large NDBs, such as Brazil (BNDES) and South Africa (DBSA). Aid could be used to provide or augment the capital funding for such banks, which would then leverage several times the value to lend to prioritized sectors or businesses. These would have an explicit mandate to address both lack of access to capital, and help develop businesses in priority sectors to expand opportunities for investment. Several caveats are worth noting. First, debt-based instruments carry risks: for the governments who ultimately may have to guarantee the NDB’s lending, particularly if the institutional design of NDBs is poor. Second, there have been long campaigns at the World Bank and elsewhere to establish minimum social and environmental standards: should lending be expanded by NDBs without such standards, vulnerable communities and ecosystems may pay the price. Finally, accountability mechanisms may be lacking at NDBs and the governments who support them, though potentially they offer more direct lines of accountability in democratic polities. Supporting domestic accountability There has been much discussion in the aid industry about how donors can support domestic actors to hold their governments to account, to help improve all public expenditure. DFID, for example, has said it “will spend up to 5% of the [DBS] total on support to domestic accountability” cxxv which includes support to CSOs, parliaments, the media, and independent watchdog organisations. Supporting the capacity of such actors to hold governments to account, and demand transparency in resource use can potentially have a powerful impact. However, there is always the danger that support to CSOs and other actors is interpreted as an attempt to influence domestic politics, which can also have negative impacts for the CSOs funded. Donors are rarely best placed to assess the domestic politics of developing countries and may inadvertently undermine domestic accountability by supporting less legitimate CSOs or government-backed NGOs (Gongos) for example.
5. Leveraging private finance is problematic
The idea of using public funds or publically backed funds to ‘leverage’ multiples of investment from private financiers has become a hot topic in development circles. There are various ways of doing this through a variety of loan instruments, including by lending through financial intermediaries, or by co-investing through private equity funds.cxxvi There are also a huge variety of donor-backed schemes to reduce risk for international investors in developing

39
countries, including through the World Bank’s Multilateral Investment Guarantees Agency (MIGA), which has expanded significantly in recent years. Other ideas include: hedging products; catastrophe insurance; partial credit guarantees; political risk insurance; and risk sharing products.cxxvii The justification for focusing limited aid resources on this appears extremely weak. Developing countries have been increasingly successful in mobilizing private investment already. Many private flows are extremely volatile and FDI is more attracted by factors such as market size, rule of law and infrastructure than incentives from donors. There is also a significant opportunity cost : more ODA used to leverage private finance means less can be spent in other areas, such as public investment in basic services. Certain sectors are more attractive for private investment than others - for example, “over half of MIGA’s insurance in [financial year] 2011 was sold to clients in the infrastructure or extractives sectors.”cxxviii In addition, there are a number of problems with the way Development Finance Institutions (DFIs) such as the World Bank’s International Finance Corporation (IFC) currently do this, which have been highlighted by a number of CSO studies. First, there is often a lack of control or ‘additionality’: when the public component is a small proportion of the total funding, commercial considerations are paramount. Second, there has been a tendency to back developed country firms – Eurodad research found that over half of DFI investment in 2010 went to firms based in OECD countries and tax havens.cxxix Third, accountability and transparency are low, particularly for lending through financial intermediaries, and monitoring and evaluation mechanisms are currently poor.cxxx Finally, these proposals entail increased debt and risks – for both the firms and governments who may end up bailing them out.
6. Be aware of potential macroeconomic impacts
These can be both good and bad. Aid predictability is extremely important, particularly as other external flows tend to be volatile. Sudden stops or alterations of aid money can cause severe problems in countries in which aid is a major source of government revenue, or equivalent to a large share of GDP. There is also untapped potential for aid to support the domestic private sector through smart procurement. Eurodad research has shown that over half of ODA is spent on procuring goods and services. Unfortunately, owing to poor policies, restrictive practices and formal and informal tying, two thirds of these procurement contracts are awarded to OECD countries.cxxxi Setting bold targets to radically increase the proportion of aid spent in country could release a double dividend – providing aid, but also supporting the domestic private sector in developing countries. In addition, the scope for governments to use procurement – normally the largest share of government budgets after wages, and 14.5% of GNI in developing countriescxxxii – to promote domestic companies has been severely undermined by the influence of the World Bank on procurement policies. The current World Bank review of its procurement policy will be an important political opportunity to change this.cxxxiii

40
Endnotes i 2008 is the most recent year for which statistics can be reliably compared, though preliminary estimates are available for 2010 ii World Bank Group, “An Update to the World Bank’s Estimates of Consumption Poverty in the Developing World 2012”, 2012, http://siteresources.worldbank.org/INTPOVCALNET/Resources/Global_Poverty_Update_2012_02-29-12.pdf. iii Ibid. iv Homi Kharas and Andrew Rogerson, “Horizon 2025. Creative Destruction in the International Development Industry”, 2012, http://www.odi.org.uk/resources/docs/7723.pdf. v Andy Sumner, Where Will the World’s Poor Live? An Update on Global Poverty and the New
Bottom Billion, Working Paper (CGD, 2012), http://www.cgdev.org/content/publications/detail/1426481/?utm_&&&. vi UNDESA, “World Economic and Social Survey 2012. In Search of New Development Finance”, 2012, http://www.un.org/en/development/desa/policy/wess/wess_current/2012wess.pdf. vii Jean-Philippe Stijns et al., Can We Still Achieve the Millennium Development Goals? From Costs
to Policies (OECD, 2012). viii UNDP, “Human Development Report 2011 Sustainability and Equity: A Better Future for All”, 2012, http://hdr.undp.org/en/media/HDR_2011_EN_Complete.pdf. ix For a recent discussion of some of the pitfalls of this approach, see Javier Pereira and Carlos Villota, ‘Hitting the Target? Evaluating the Effectiveness of Results-based Approaches to Aid’, 2012, http://eurodad.org/wp-content/uploads/2012/10/Hitting_the_target1.pdf. x This was the focus of last year’s Eurodad/ CRBM international conference. See Eurodad and CRBM, ‘The Private Sector Turn in Development Finance: Effective for Development?’, 2011, http://eurodad.org/uploadedfiles/whats_new/news/background%20papers.pdf. xi Gross National Income, which is GDP plus net foreign financial transfers – i.e. including net remittances and investment income. Though this makes comparing flows less precise – because one major flow, remittances, is itself included in GNI – it is a necessity as many of the main databases, including the World Bank’s, use this measure. xii It is important to note that – surprisingly – the data on tax and revenues are not easy to find. The World Bank’s database – the best source for most data – produces strange figures that do not correspond with other estimates, such as those produced by the OECD. This data, from the IMF, appear to be the best comparable time series data, with figures that correlate with other sources. xiii IMF, “Revenue Mobilization in Developing Countries”, 2011, http://www.imf.org/external/np/pp/eng/2011/030811.pdf. P12 xiv ActionAid, “Real Aid 3. Ending Aid Dependency”, 2011, http://www.un.org/en/ecosoc/newfunct/pdf/luxembourg_real_aid_3.pdf. p19 xv Ibid. xvi Johnson, Alison, “Key Issues for Analysing Domestic Debt Sustainability”, 2001, http://www.dri.org.uk/pdfs/EngPub5_DomDebt.pdf. xvii http://www.imf.org/external/pubs/ft/survey/so/2012/POL032812A.htm [accessed 27/10/12 at 16:19] xviii et al Atisophon, REVISITING MDG COST ESTIMATES FROM A DOMESTIC RESOURCE
MOBILISATION PERSPECTIVE (OECD Developmetn Centre, 2011), http://www.cepal.org/ilpes/noticias/paginas/1/41751/angel_melguizo_documento.pdf. xix “Gross capital formation (formerly gross domestic investment) consists of outlays on additions
to the fixed assets of the economy plus net changes in the level of inventories. Fixed assets include

41
land improvements (fences, ditches, drains, and so on); plant, machinery, and equipment
purchases; and the construction of roads, railways, and the like, including schools, offices,
hospitals, private residential dwellings, and commercial and industrial buildings. Inventories are
stocks of goods held by firms to meet temporary or unexpected fluctuations in production or sales,
and "work in progress." According to the 1993 SNA, net acquisitions of valuables are also
considered capital formation.” http://data.worldbank.org/indicator/NE.GDI.TOTL.ZS xx Source: www.data.worldbank.org xxi World Bank & IFC, “Doing Business 2013”, 2012, http://www.doingbusiness.org/~/media/GIAWB/Doing%20Business/Documents/Annual-Reports/English/DB13-full-report.pdf. xxii The UNCTAD annual World Investment Report is the most reliable source of information and analysis on FDI, and provides the evidence in this section unless otherwise stated. xxiii http://data.worldbank.org/indicator/BX.KLT.DINV.CD.WD/countries/XM-XP?display=graph xxiv The figures come from UNCTAD’s online database: http://unctadstat.unctad.org . According to that, developing country FDI inflows were 2.87% of GDP, and outflows were 1.62%. xxv It is worth noting that UNCTAD uses an unusual definition of developing country – which includes South Korea. In addition it separates ‘transition economies’ from developing countries. These are the former communist states of South East Europe and the former Soviet Union, including Russia. xxvi I can expand more on why this figure is so high in the final version if necessary. xxvii In 2011, Sovereign Wealth Funds accounted for $35.9 billion of FDI inflows to developing countriesxxvii, continuing a rising trend. However, the majority of their investments remain in portfolio equity (see below) and most of their FDI goes to developed countries. xxviii UNCTAD, “World Investment Report 2012”, 2012, http://www.unctad-docs.org/files/UNCTAD-WIR2012-Full-en.pdf. xxix Ibid. p11 xxx Ibid. p6 xxxi Bhinda, Nils & Martin, M, “PRIVATE CAPITAL FLOWS TO LOW INCOME COUNTRIES: DEALING WITH BOOM AND BUST”, 2010, http://www.development-finance.org/en/component/docman/doc_download/757-fpc-cbp-series-2-chapter-4.html. p20 xxxii Yilmaz Akyuz, “Capital Flows to Developing Countries in a Historical Perspective: Will the Current Boom End With a Bust?” (South Centre, March 2011), http://www.southcentre.org/index.php?option=com_content&view=article&id=1529%3Acapital-flows-to-developing-countries-in-a-historical-perspective-will-the-current-boom-end-with-a-bust&lang=en. xxxiii Bhinda, Nils & Martin, M, ‘PRIVATE CAPITAL FLOWS TO LOW INCOME COUNTRIES: DEALING WITH BOOM AND BUST’. xxxiv Ibid. p20 xxxv http://unctadstat.unctad.org xxxvi DRC (10.6%); Guinea (24.3%); Kyrgyzstan (12.2%); Liberia (49.9%); Mongolia (55%); Mozambique (15.8%); Nicaragua (13.3%); Niger (16.4%); Turkmenistan (10.7%); and Zambia (10.3%). According to www.unctadstat.unctad.org xxxvii UNCTAD, ‘World Investment Report 2012’. xxxviii Ibid, p34 “…a number of economies that attract investment largely owing to their fiscal or corporate governance regimes [including tax havens.]… Such regimes obviously lead to investment that has little impact in terms of local value added or employment.” “…countries

42
with a high share of resource- seeking FDI, such as Chile and Saudi Arabia, confirming concerns about the relatively low impact of this type of investment in terms of, for example, local employment.” xxxix http://data.worldbank.org/indicator/BX.PEF.TOTL.CD.WD/countries/XM-XP?display=graph [accessed 26/10/12 1t 16:14] xl Chowla, Peter, “Time for a New Consensus. Regulating Financial Flows for Stability and Development”, 2011, http://brettonwoodsproject.org/doc/financedebt/newconsensus.pdf. xli List in final document. xlii Personal communication from Development Finance International (seeking reference.) xliii The best summary is the World Bank’s Migration and Remittances Factbook 2011, from which the data in this section come, unless otherwise stated. The data used includes both transfers of cash and transfers of other assets. xliv As the data is based on officially recorded remittances only, this caveat is worth noting “…the reader is advised to note the pitfalls of using currently available migration and remittance
data. Remittance flows and the stock of migrants may be underestimated due to the use of
informal remittance channels, irregular migration, and ambiguity in the definition of migrants”. xliv xlv The World Bank uses income classifications – any country not in the ‘high income’ category is included as a developing country. xlvi The World Bank, “MIGRATION AND REMITTANCES FACTBOOK 2011”, 2011, http://siteresources.worldbank.org/INTLAC/Resources/Factbook2011-Ebook.pdf. xlvii For example, even if migration ceases, existing migrants continue to send money home, and as this is typically a small percentage of their total income, they continue to do so even during hard times. xlviii The World Bank, ‘MIGRATION AND REMITTANCES FACTBOOK 2011’. P17 xlix Naohiko Omato, “Who Receives Remittances? A Case Study of the Distributional Impact on Liberian Refugees in Ghana”, 2011, http://www.soas.ac.uk/cdpr/publications/dv/file68489.pdf. l http://www.oecd.org/newsroom/developmentaidtodevelopingcountriesfallsbecauseofglobalrecession.htm [accessed 22/10/2011 at 09:59] li http://www.oecd.org/newsroom/developmentaidtodevelopingcountriesfallsbecauseofglobalrecession.htm lii OECD DAC, “Development Cooperation Report 2011”, 2011, http://www.oecd-ilibrary.org/docserver/download/fulltext/4311011e.pdf?expires=1346252256&id=id&accname=guest&checksum=883ADA2A387665EF670E96412A81754E.p 111 liii Elmers, Bodo, “How to Spend It. Smart Procurement for Effective Aid”, 2011, http://eurodad.org/uploadedfiles/whats_new/reports/eurodad%20-%20how%20to%20spend%20it.pdf. liv Concord, “Aidwatch 2012. Aid We CAn - Invest More in Global Development”, n.d., http://aidwatch.concordeurope.org/static/files/assets/3f200cc4/report.pdf. lv ActionAid’s Real Aid 3 reportlv discounts seven categories of ‘substandard aid’ (double counted debt relief, poorly targeted aid, donor driven technical assistance, costly tied aid, excessive administrative costs, aid not supporting country leadership, and aid spent in donor countries on refugee and student costs) and calculates that this represented 45% of OECD DAC aid in 2009. The DAC itself has created a category of ‘country programmable aid’ which discounts various ODA categories to try to exclude items of ODA that are: unpredictable; do not

43
flow to recipient countries; and flows over which the recipient has little influence.lv In 2010, non-country programmable aid was estimated as 45% of the total. lv lvi “The aid system generates massive negative income shocks to some developing countries (on rare occasions). These large negative shocks account for the high cost of volatility. The impact of aid shocks has been as large and as frequent as income shocks faced by developed countries during the two World Wars, the Great Depression and the Spanish Civil War.”Homi Kharas, “MEASURING THE COST OF AID VOLATILITY”, 2008, http://www.brookings.edu/~/media/research/files/papers/2008/7/aid%20volatility%20kharas/07_aid_volatility_kharas. lvii Source: www.data.worldbank.org lviii OECD DAC list of ODA recipients – based on World Bank income categories. lix http://www.oecd.org/dac/aidstatistics/statisticsonresourceflowstodevelopingcountries.htm [accessed 26/10/12 11:57] lx http://www.oecd.org/dac/aidstatistics/dacglossaryofkeytermsandconcepts.htm#OOF [accessed 22/10/12] lxi Owing to the repayment of loans. lxii OECD DAC, Development Aid: Other Official Flows (OOF) (OECD, 2012), http://books.google.com/books?hl=en&lr=&id=1aR54vBa2E4C&oi=fnd&pg=PR9&dq=%22Agencies,%22+&ots=kc5FxXGgCa&sig=vxtkXgsLDNEjDMPh17vwuV3rnns. lxiii The World Bank’s Global Development Finance (2012) report is the best summary in this area, and is the source of all the statistics in this section, unless otherwise stated. It covers 129 developing countries, and has been collecting debt statistics since the 1950s. lxiv The World Bank, “Global Development Finance. External Debt of Developing Countries”, 2012, http://data.worldbank.org/sites/default/files/gdf_2012.pdf.p 4 [NB: the figure is not calculated by the author based on the statistics given on page 4] lxv Ibid. p1 lxvi The public debt figures do not count liabilities for which the public sector may end up taking on responsibility such as public-private partnerships. lxvii Ibid. lxviii Jones, TIm, “The State of Debt Putting an End to 30 Years of Crisis”, 2012, http://www.jubileedebtcampaign.org.uk/download.php?id=1084. P24 The IMF’s September update has the same number of countries at high risk, with three “in debt distress”. lxix Lending by developing countries to other developing countries is included in the statistics for the previous section. lxx UNDESA, “World Economic Situation and Prospects 2012”, January 2012, http://www.un.org/en/development/desa/policy/wesp/wesp_current/2012chap3.pdf. lxxi Ibid. pxii lxxii Ibid. p75 lxxiii Dev Kar and Sarah Freitas, “Illicit Financial Flows from Developing Countries Over the Decade Ending 2009”, 2011, http://www.gfintegrity.org/storage/gfip/documents/reports/IFFDec2011/highres-illicit_financial_flows_from_developing_countries_over_the_decade_ending_2009.pdf. P 31 lxxiv Ibid. p21 lxxv Kar, Dev & Cartwright-Smith, Devon, “ILLICIT FINANCIAL FLOWS FROM AFRICA: HIDDEN RESOURCE FOR DEVELOPMENT”, 2010, http://www.gfintegrity.org/storage/gfip/documents/reports/gfi_africareport_web.pdf. p1

44
lxxvi GFI use the IMF’s World Economic Outlook definition of developing country that includes a number of high-income countries, including Saudi Arabia and UAE. lxxvii Kar and Freitas, ‘Illicit Financial Flows from Developing Countries Over the Decade Ending 2009’. lxxviii Christian Aid, “Death and Taxes. The True Toll of Tax Dodging”, 2008, http://www.christianaid.org.uk/images/deathandtaxes.pdf. lxxix Kar and Freitas, ‘Illicit Financial Flows from Developing Countries Over the Decade Ending 2009’. pvii lxxx Garda, A, forthcoming, Eurodad. lxxxi Henry, “The Price of Offshore Revisited”, 2012, http://www.taxjustice.net/cms/upload/pdf/Price_of_Offshore_Revisited_120722.pdf. lxxxii The 2012 World Economic and Social Survey (WESS) provides an excellent overview of this topic – and all the information in this section, unless otherwise noted. lxxxiii There are other proposals, such as UNDESA’s recent proposal for a “Billionaires tax” which we will not examine as they are yet to generate significant backing. lxxxiv As there are a whole variety of financial transactions, this is a complex field. However, in broad terms, it is sensible to distinguish between currency transaction taxes and other FTTs, because of the disproportionate size of the currency market. lxxxv The countries are: Argentina, Australia, Austria, Belgium, Brazil, Chile, China, Colombia, Denmark, Ecuador, Finland, France, Germany, Greece, Guatemala, Hong Kong, India, Indonesia, Ireland, Italy, Japan, Malaysia, Morocco, Netherlands, New Zealand, Pakistan, Panama, Peru, Philippines, Portugal, Russia, Singapore, South Korea, Sweden, Switzerland, Taiwan, UK, US, Venezuela, Zimbabwe. Beitler, D, “Raising Revenue, a Review of Financial Transaction Taxes Throughout the World”, 2010, http://www.stampoutpoverty.org/download.php?id=405. lxxxvi Bill Gates, “Innovation With Impact: Financing 21st Century Development” (2011), http://ukpmc.ac.uk/abstract/MED/16616230. P 13 lxxxvii http://robinhoodtax.org.uk/latest/breakthrough-11-european-countries-unite-behind-robin-hood-tax lxxxviii European Commission, “Commission Staff Working paper.Executive Summary of the Impact Assessment Accompanying the Document: ‘Proposal for a Council Directive on a Common System of Financial Transaction Tax and Amending Directive 2008/7/EC’”, September 2011, http://ec.europa.eu/taxation_customs/resources/documents/taxation/other_taxes/financial_sector/summ_impact_assesmt_en.pdf. lxxxix Gates, ‘Results of PREVENT III’. xc Some governments have already supported such earmarking – for example the French have said that a proportion of their new 0.2% tax on share trading will go towards fighting AIDS. xc xci “In 2011, the contributing countries were Cameroon, Chile, the Congo, France, Madagascar, Mali, Mauritius, the Niger and the Republic of Korea. In addition, Norway contributed part of the funds collected on a carbon-emissions tax on aviation fuel” UNDESA, “World Economic and Social Survey 2012. In Search of New Development Finance.” P44, footnote 23 xcii Varying according to length of flight and class of seat. xciii see also: http://cleantechnica.com/2012/11/15/carbon-tax-debate-is-now-back-in-the-limelight-as-fiscal-cliff-nears/ xciv Simultaneously, efforts to strengthen the environmental integrity of the scheme through temporary and structural measures to deal with the low carbon price as a result of oversupply of credits will have an impact on the price of ETS allowances. See http://ec.europa.eu/clima/policies/ets/auctioning/third/index_en.htm

45
Revenues from carbon trading schemes can be collected nationally, or through a common auctioning platform to nation states (as is the case for most of EU member states). However, auctioning allowances could also be distributed to other entities for auctioning, for example to the Green Climate Fund, which could constitute a steady and predictable flow for the Fund. xcv Unitaid has received more in total, but this is the figure garnered from the tax – as some governments, such as the UK provide funding from their aid budgets. UNDESA, “World Economic and Social Survey 2012. In Search of New Development Finance.” xcvi World Bank Group, “Mobilizing Climate Finance A Paper Prepared at the Request of G20 Finance Ministers”, October 2011, http://www.g20-g8.com/g8-g20/root/bank_objects/G20_Climate_Finance_report.pdf. xcvii European Commission, Staff Working Document, “Scaling up International Climate Finance After 2012”, April 2011, http://ec.europa.eu/economy_finance/articles/financial_operations/pdf/sec_2011_487_final_en.pdf. p4 xcviii UNDESA, “World Economic and Social Survey 2012. In Search of New Development Finance.” p 41 xcix Ibid. pp40-41 c For a useful summary of what SDRs are., see http://www.brettonwoodsproject.org/art-564135 ci UNDESA, “World Economic and Social Survey 2012. In Search of New Development Finance.” pxi cii http://www.brettonwoodsproject.org/art-564159 ciii Changing the Articles is a very difficult process, requiring am 85% super-majority, which effectively gives the US (with over 15% of the vote) a veto. civ UNDESA, “World Economic and Social Survey 2012. In Search of New Development Finance.” cv See, for example: Obstfeld,Maurice, “The SDR as an International Reserve Asset: What Future?”, 2011, http://emlab.berkeley.edu/~obstfeld/SDR_Obstfeld.pdf. cvi Chowla, Peter, ‘Time for a New Consensus. Regulating Financial Flows for Stability and Development’. cvii Sachs, Jeffrey. The end of poverty: How we can make it happen in our lifetime. Penguin, 2011. cviii www.data.worldbank.org cix Zambia is a case in point. See Mwambwa et al, “A Fool’s Paradise? Zambia’s Mining Tax Regime”, 2010, http://www.ctpd.org.zm/index.php?option=com_phocadownload&view=category&download=8:ctpd_fools-paradise_zambia-mining-tax-regime-briefing-paper&id=4:publications&Itemid=119. cx In many countries in recent years, including the Netherlands and Canada, government reductions in funding for NGOs have caused serious internal problems. cxi In 2006, DFID allocated £6million to support UK government efforts to trace and prosecute money-launderers, and by 2010 had frozen around £160 million in assets and repatriated £2million to developing countries. See Fontana, Alessandra, “Making Development Assistance Work at home.DFID’s Approach to Clamping down on International Bribery and Money Laundering in the UK”, 2011, http://www.cmi.no/publications/file/4072-making-development-assistance-work-at-home.pdf. cxii OECD DAC, “Is It ODA?”, 2008, http://www.oecd.org/investment/aidstatistics/34086975.pdf.

46
cxiii See the following for a discussion of the issues involved: South Centre, “Strengthening Developing Countries’ Capacity for Trade Negotiations: Matching Technical Assistance to Negotiating Capacity Constraints”, 2004, http://www.g77.org/doha/Doha-BP04%20-Strengthening_Southern_trade-related_negotiating_capacity.pdf. cxiv Molina, Nuria, “Outcome Based Conditionality: Too Good to Be True?”, 2008, http://eurodad.org/wp-content/uploads/2008/02/Outcome_based_conditionality_new-lay-out4.pdf. cxv ActionAid, ‘Real Aid 3. Ending Aid Dependency’. P35 cxvi http://cancun.unfccc.int/financial-technology-and-capacity-building-support/new-long-term-funding-arrangements/#c294 cxvii UNDESA, “World Economic and Social Survey 2012. In Search of New Development Finance.” cxviii Concord, “Aidwatch 2012. Aid We CAn - Invest More in Global Development.” cxix The figure was 4.1% in 2009, 4.8% in 2008 and 6% in 2007 according to Bryan Roberts, “Foreign Aid as a Catalyst to Improving Domestic Revenue Mobilisation”, 2012, http://www.un.org/en/ecosoc/newfunct/pdf/domestic_revenue_mobilisation_june_11(july3).pdf. P12 cxx In 2009, the OECD attempted to estimate the amount of additional tax revenues that could be raised by improving tax collection and found that “More than half are already collecting more taxes than expected”.Atisophon, Taxation and More Representation?. p38 cxxi Kagina, Allen, “Aid as a Catalyst to Increase Domestic Revenue Mobilisation in sub-Saharan Africa”, 2012, http://www.un.org/en/ecosoc/newfunct/pdf/aid_as_a_catalyst_for_drm(july3).pdf. pix cxxii Ibid. px cxxiii Intermon Oxfam, “Owning Development. Taxation to Fight Poverty”, 2011, http://www.oxfam.org/sites/www.oxfam.org/files/rr-owning-development-domestic-resources-tax-260911-en.pdf. cxxiv UNDESA, “Rethinking the Role of National Development Banks”, 2006, http://www.un.org/esa/ffd/msc/ndb/NDBs-DOCUMENT-REV-E-151106.pdf. cxxv http://www.dfid.gov.uk/What-we-do/How-UK-aid-is-spent/how-we-decide-where-aid-is-spent/ cxxvi For a useful summary see: Griffiths, Jesse, “‘Leveraging’ Private Sector Finance: How Does It Work and What Are the Risks?”, 2012, http://www.brettonwoodsproject.org/doc/private/leveraging.pdf. cxxvii Ibid. cxxviii Ibid. p8 cxxix Kwakkenbos, Jeroen, “Private Profit for Public Good? Can Investing in Private Companies Deliver for the Poor?”, 2012, http://eurodad.org/wp-content/uploads/2012/05/Private_profit_report_eng-VF5.pdf. cxxx Bretton Woods Project and ’Ulu Foundation, “Out of Sight, Out of Mind?” (Bretton Woods Project, November 2010), http://www.brettonwoodsproject.org/art-567190. cxxxi {Citation} cxxxii Elmers, Bodo, ‘How to Spend It. Smart Procurement for Effective Aid’. cxxxiii http://eurodad.org/1543678/