Global Financial Crisis, its Impact on India and the …...3 Global Financial Crisis, its Impact on...
13
Global Financial Crisis, its Impact on India and the Policy Response Nirupam Bajpai Working Paper No. 5 July 2011 WORKING PAPERS SERIES Columbia Global Centers | South Asia, Columbia University Express Towers 11 th Floor, Nariman Point, Mumbai 400021 globalcenters.columbia.edu/southasia/
Transcript of Global Financial Crisis, its Impact on India and the …...3 Global Financial Crisis, its Impact on...
1
Global Financial Crisis, its Impact on India and the
Policy Response
Nirupam Bajpai
Working Paper No. 5
July 2011
WORKING PAPERS SERIES Columbia Global Centers | South Asia, Columbia University Express Towers 11th Floor, Nariman Point, Mumbai 400021 globalcenters.columbia.edu/southasia/
2
Abstract
India could not insulate itself from the adverse developments in the international financial markets, despite having a
banking and financial system that had little to do with investments in structured financial instruments carved out of
subprime mortgages, whose failure had set off the chain of events culminating in a global crisis. Economic growth
decelerated in 2008-09 to 6.7 percent. This represented a decline of 2.1 percent from the average growth rate of 8.8
percent in the previous five years.
To counter the negative fallout of the global slowdown on the Indian economy, the federal Government responded by
providing three focused fiscal stimulus packages in the form of tax relief to boost demand and increased expenditure
on public projects to create employment and public assets. India’s central Bank – the Reserve Bank of India (RBI)
took a number of monetary easing and liquidity enhancing measures to facilitate flow of funds from the financial
system to meet the needs of productive sectors.
From all accounts, except for the agricultural sector initially as noted above, economic recovery seems to
be well underway. Economic growth stood at 8.6 percent during fiscal year 2010-11. GDP growth for
2009-10 was placed at 8 percent. When compared to countries across the world, India stands out as one of
the best performing economies. Although there was a clear moderation in growth from 9 percent levels to
7+ percent soon after the crisis hit, in 2010-11, at 8.6 percent, GDP growth in nearing the pre-crisis levels
and this pace makes India the fastest growing major economy after China.
Considering the current inflationary strains, the as yet excessive pre-emption of the community’s savings by the
government, the potential for crowding out the requirements of the enterprise sector, and rising interest payments on
government debt, it is extremely essential to reduce the fiscal deficit, and more aggressively, mainly by lowering the
revenue deficit. Correction of these deficits would, inter alia, require considerable refocusing and reduction of large
hidden subsidies associated with under-pricing in crucial areas, such as power, irrigation, and urban transport. Food
and fertilizer subsidies are other major areas of expenditure control. Be that as it may, the process of fiscal
consolidation needs to be accelerated through more qualitative adjustments to reduce government dissavings and
ameliorate price pressures.
The step-up in India's growth rate over much of the last two decades was primarily due to the structural changes in
industrial, trade and financial areas, among others, over the 1990s as the reforms in these sectors were wide and deep
and hence contributed significantly to higher productivity of the economy. Indeed, there is potential for still higher
growth on a sustained basis of 9+ percent in the years ahead, but among other things, this would require the
following: 1) revival and a vigorous pursuit of economic reforms at the center and in the states; 2) a major effort at
raising the rate of domestic savings, especially by reducing government dissavings at the central and state levels
through cuts in, and refocusing of, explicit and implicit subsidies, stricter control over non-developmental
expenditures, improvements in the tax ratio through stronger tax enforcement, and strengthening incentives for
savings; 3) larger investments in, and better performance of, infrastructural services, both in the public and private
sectors; and 4) greater attention to, and larger resources for, agriculture, social sectors and rural development
programs to increase employment, reduce poverty and for creating a mass base in support of economic reforms.
.
3
Global Financial Crisis, its Impact on India and the Policy Response
Nirupam Bajpai1
India could not insulate itself from the adverse developments in the international financial markets, despite
having a banking and financial system that had little to do with investments in structured financial
instruments carved out of subprime mortgages, whose failure had set off the chain of events culminating in
a global crisis. Economic growth decelerated in 2008-09 to 6.7 percent. This represented a decline of 2.1
percent from the average growth rate of 8.8 percent in the previous five years (2003-04 to 2007-08). Per
capita GDP growth grew by an estimated 4.6 percent in 2008-09. Though this represents a substantial
slowdown from the average growth of 7.3 percent per annum during the previous five years, it is still
significantly higher than the average 3.3 percent per annum income growth during 1998-99 to 2002-03.
The effect of the crisis on the Indian economy was not significant in the beginning. The initial effect of the
subprime crisis was, in fact, positive, as the country received accelerated Foreign Institutional Investment
(FII) flows during September 2007 to January 2008. There was a general belief at this time that the
emerging economies could remain largely insulated from the crisis and provide an alternative engine of
growth to the world economy. The argument soon proved unfounded as the global crisis intensified and
spread to the emerging economies through capital and current account of the balance of payments. The net
portfolio flows to India soon turned negative as Foreign Institutional Investors rushed to sell equity stakes
in a bid to replenish overseas cash balances. This had a knock-on effect on the stock market and the
exchange rates through creating the supply demand imbalance in the foreign exchange market. The current
account was affected mainly after September 2008 through slowdown in exports. Despite setbacks,
however, the BoP situation of the country continues to remain resilient.
The challenges that confronted the Indian economy in 2008-09 and continue to do so fall into two
categories - the short-term macroeconomic challenges of monetary and fiscal policy and the medium-term
challenge of attaining and sustaining high rates of economic growth. The former covers issues such as the
trade-off between inflation and growth, the use of monetary policy versus use of fiscal policy, their relative
effectiveness and coordination between the two. The latter includes the tension between short- and long-
term fiscal policy, the immediate longer term imperatives of monetary policy and the policy and
institutional reforms necessary for restoring high growth.
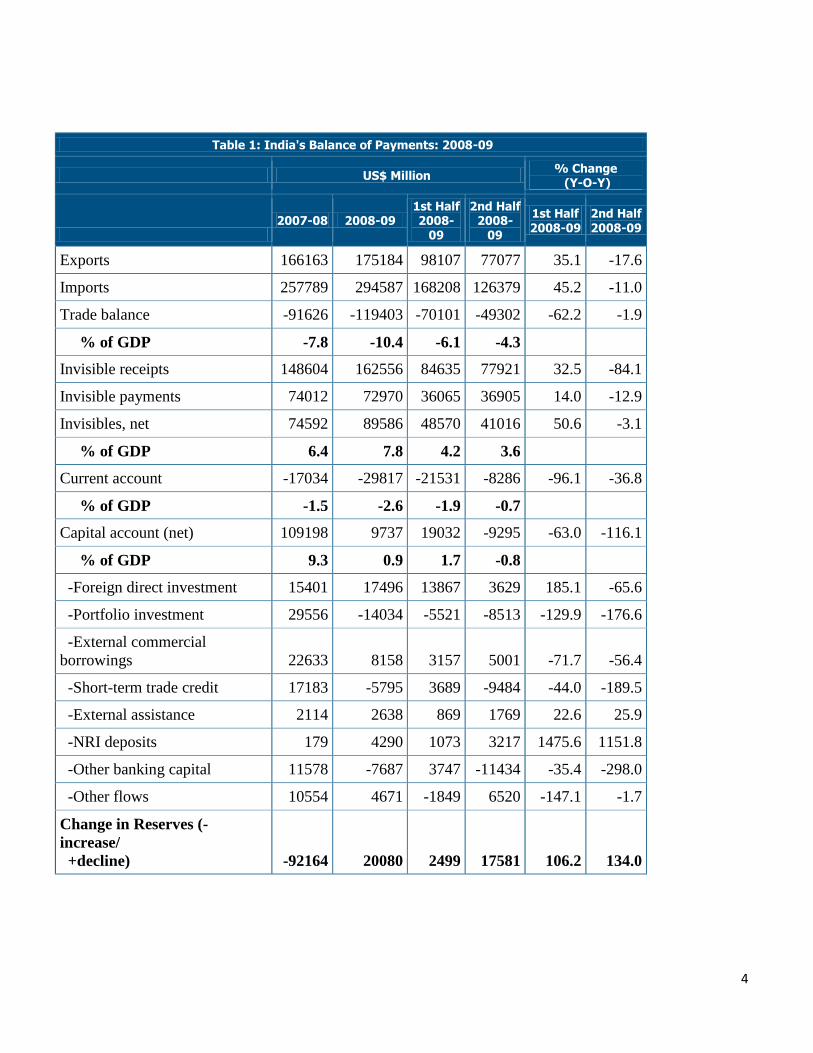
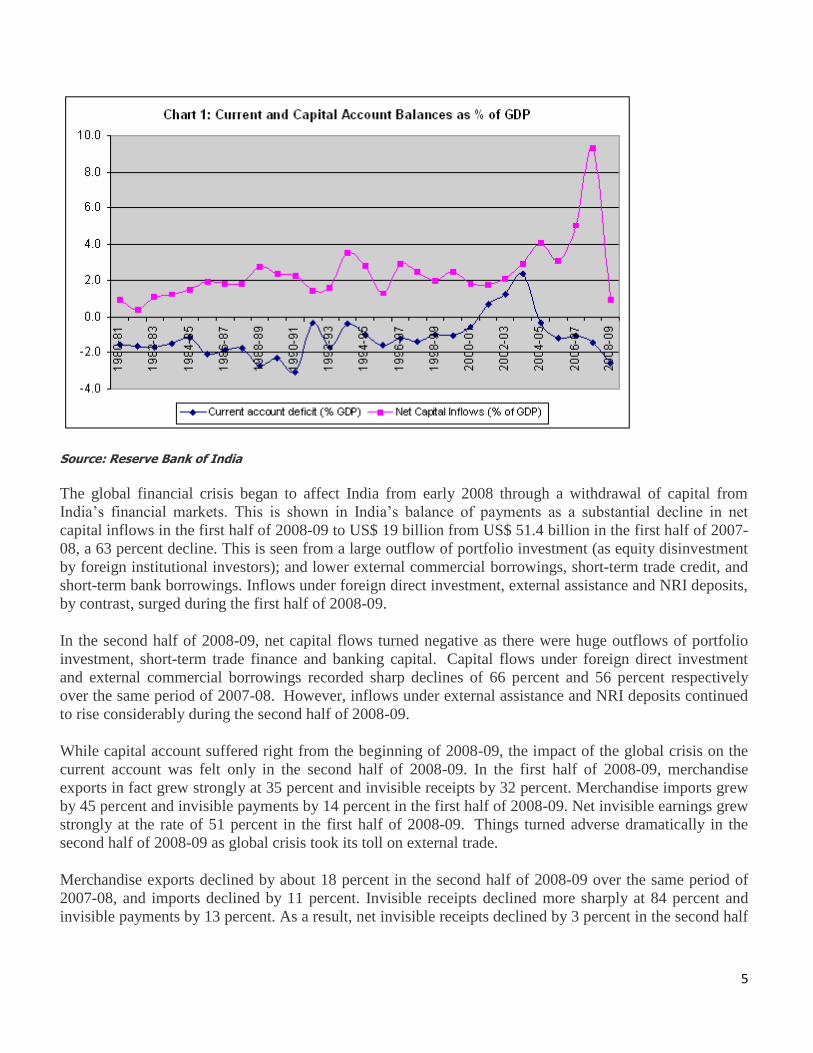
India’s balance of payments in 2008-09 captured the spread of the global crisis to India (see Table 1). The
current account deficit during 2008-09 shot up to 2.6 percent of GDP from 1.5 percent of GDP in 2007-08
(Table 1). And this is the highest level of current account deficit for India since 1990-91 (Chart 1). The
capital account surplus dropped from a record high of 9.3 percent of GDP in 2007-08 to 0.9 percent of
GDP. And this is lowest level of capital account surplus since 1981-82. The year ended with a decline in
reserves of US$ 20.1 billion (inclusive of valuation changes) against a record rise in reserves of US$ 92.2
billion for 2007-08.
1 Director, Columbia Global Centers | South Asia; Senior Development Adviser, the Earth Institute at Columbia University and
Member of the International Monetary Advisory Group. Revised version of the paper presented at the ADB’s Tokyo conference
on the Future Global Reserve System – An Asian Perspective.
4
Table 1: India's Balance of Payments: 2008-09
US$ Million % Change (Y-O-Y)
2007-08 2008-09
1st Half 2008-
09
2nd Half 2008-
09
1st Half 2008-09
2nd Half 2008-09
Exports 166163 175184 98107 77077 35.1 -17.6
Imports 257789 294587 168208 126379 45.2 -11.0
Trade balance -91626 -119403 -70101 -49302 -62.2 -1.9
% of GDP -7.8 -10.4 -6.1 -4.3
Invisible receipts 148604 162556 84635 77921 32.5 -84.1
Invisible payments 74012 72970 36065 36905 14.0 -12.9
Invisibles, net 74592 89586 48570 41016 50.6 -3.1
% of GDP 6.4 7.8 4.2 3.6
Current account -17034 -29817 -21531 -8286 -96.1 -36.8
% of GDP -1.5 -2.6 -1.9 -0.7
Capital account (net) 109198 9737 19032 -9295 -63.0 -116.1
% of GDP 9.3 0.9 1.7 -0.8
-Foreign direct investment 15401 17496 13867 3629 185.1 -65.6
-Portfolio investment 29556 -14034 -5521 -8513 -129.9 -176.6
-External commercial
borrowings 22633 8158 3157 5001 -71.7 -56.4
-Short-term trade credit 17183 -5795 3689 -9484 -44.0 -189.5
-External assistance 2114 2638 869 1769 22.6 25.9
-NRI deposits 179 4290 1073 3217 1475.6 1151.8
-Other banking capital 11578 -7687 3747 -11434 -35.4 -298.0
-Other flows 10554 4671 -1849 6520 -147.1 -1.7
Change in Reserves (-
increase/
+decline) -92164 20080 2499 17581 106.2 134.0
5
Source: Reserve Bank of India
The global financial crisis began to affect India from early 2008 through a withdrawal of capital from
India’s financial markets. This is shown in India’s balance of payments as a substantial decline in net
capital inflows in the first half of 2008-09 to US$ 19 billion from US$ 51.4 billion in the first half of 2007-
08, a 63 percent decline. This is seen from a large outflow of portfolio investment (as equity disinvestment
by foreign institutional investors); and lower external commercial borrowings, short-term trade credit, and
short-term bank borrowings. Inflows under foreign direct investment, external assistance and NRI deposits,
by contrast, surged during the first half of 2008-09.
In the second half of 2008-09, net capital flows turned negative as there were huge outflows of portfolio
investment, short-term trade finance and banking capital. Capital flows under foreign direct investment
and external commercial borrowings recorded sharp declines of 66 percent and 56 percent respectively
over the same period of 2007-08. However, inflows under external assistance and NRI deposits continued
to rise considerably during the second half of 2008-09.
While capital account suffered right from the beginning of 2008-09, the impact of the global crisis on the
current account was felt only in the second half of 2008-09. In the first half of 2008-09, merchandise
exports in fact grew strongly at 35 percent and invisible receipts by 32 percent. Merchandise imports grew
by 45 percent and invisible payments by 14 percent in the first half of 2008-09. Net invisible earnings grew
strongly at the rate of 51 percent in the first half of 2008-09. Things turned adverse dramatically in the
second half of 2008-09 as global crisis took its toll on external trade.
Merchandise exports declined by about 18 percent in the second half of 2008-09 over the same period of
2007-08, and imports declined by 11 percent. Invisible receipts declined more sharply at 84 percent and
invisible payments by 13 percent. As a result, net invisible receipts declined by 3 percent in the second half

6
of 2008-09 over the same period of 2007-08 in contrast a steep rise of 51 percent in the first half of 2008-
09.
The two major items of invisible receipts for India have been software exports and private transfers
(remittances). Net receipts from software exports rose by 19 percent in 2008-09 to US$ 44 billion from
US$ 37 billion in 2007-08. Remittances also amounted to US$ 44 billion in 2008-09, a rise of 5 percent
from US$ 42 billion in 2007-08.
Table 2 brings out the decline in various categories of invisible receipts in the second half of 2008-09. As
can be seen from Table 2, the growth in software exports slumped to 3.6 percent in the second half of
2008-09 over the same period. Remittances in fact recorded a decline of 19.6 percent in the second half of
2008-09. These have to be seen in the context of a sharp growth of about 38 percent in software exports
and 40 percent in remittances in the first half of 2008-09 over the same period in 2007-08.
Table 2: Net Invisible Earnings: 2008-09
US$ Million % Change (Y-O-Y)
1st Half 2nd Half 1st Half 2nd Half
Travel 422 1040 10.2 -39.3
Transport -1497 -214 -43.8 53.4
Insurance 183 95 -25.3 -72.9
Government not included elsewhere 6 -408 107.9 -1460.0
Miscellaneous 26561 23630 43.9 31.6
-Software 22595 21591 37.7 3.6
-Non-software 3966 2039 93.0 170.9
Transfers 24543 19736 40.3 -19.3
-Private 24548 19499 40.6 -19.6
-Official -5 237 -114.7 15.6
Income -1648 -2863 48.8 -68.5
-Invest Income -1431 -2586 50.9 -89.3
-Labor income -217 -277 28.4 16.8
Total 48570 41016 50.6 -3.1
Source: Reserve Bank of India
The above analysis of India’s balance of payments has brought out that the global financial crisis severely
hit the flow of capital into the country right from the beginning of 2008-09 and then subsequently the
current account transactions (both trade and invisibles) in the second half of the year. This has led to one of
the highest current account deficits and one of the lowest capital account surpluses for the country. The

7
impact of the crisis on both capital flows and current receipts has been much larger than what we initially
thought.
Due to the global crisis the economy experienced extreme volatility in terms of fluctuations in stock market
prices, exchange rates and inflation levels during a short duration necessitating reversal of policy to deal
with the emergent situations. Before the onset of the financial crisis, the main concern of the policymakers
was excessive capital inflows, which increased from 3.1 percent of GDP in 2005-06 to 9.3 percent in 2007-
08. While this led to increase in foreign exchange reserves from US$ 151.6 billion at end-March 2006 to
US$ 309.7 billion at end-March 2008, it also contributed to monetary expansion, which fuelled liquidity
growth. WPI inflation reached a trough of 3.1 percent in October 2007, a month before global commodity
price inflation zoomed to double digits from low single digits. The rising oil and commodity prices,
contributed to a significant rise in prices, with annual WPI peaking at 12.8 percent in August 2008. The
monetary policy stance during the first half of 2008-09 was therefore directed at containing the price rise.
To counter the negative fallout of the global slowdown on the Indian economy, the federal Government
responded by providing three focused fiscal stimulus packages in the form of tax relief to boost demand
and increased expenditure on public projects to create employment and public assets. India’s central Bank
– the Reserve Bank of India (RBI) took a number of monetary easing and liquidity enhancing measures to
facilitate flow of funds from the financial system to meet the needs of productive sectors.
This fiscal accommodation led to an increase in fiscal deficit from 2.7 percent in 2007-08 to 6.2 percent of
GDP in 2008-09. The difference between the actual figures of 2007-08 and 2008-09 constituted the total
fiscal stimulus. This stimulus at current market prices amounted to 3.5 percent of GDP for 2008-09. These
measures were effective in arresting the fall in the growth rate of GDP in 2008-09 and India achieved a
growth rate of 6.7 percent.
The policy stance of the RBI in the first half of the year was oriented towards controlling monetary
expansion, in view of the apparent link between monetary expansion and inflationary expectations partly
due to the perceived liquidity overhang. In the first six months of 2008-09, year-on-year growth of broad
money was lower than the growth of reserve money. The Government also took various fiscal and
administrative measures during the first half of 2008-09 to rein in inflation. The key policy rates of RBI
thus moved to signal a contractionary monetary stance. The repo rate (RR) was increased by 125 basis
points in three tranches from 7.75 percent at the beginning of April 2008 to 9.0 percent with effect from
August 30, 2008. The reverse-repo rate (R-RR) was however left unchanged at 6.0 percent. The cash
reserve ratio (CRR) was increased by 150 basis points in six tranches from 7.50 percent at the beginning of
April 2008 to 9.0 percent with effect from August 30, 2008.

8
Developments in the exchange rate arena:
The exchange rate policy in recent years has been guided by the broad principles of monitoring and
management of exchange rates with flexibility, without a fixed or a preannounced target or a band, while
allowing the underlying demand and supply conditions to determine the exchange rate movements of the
Indian rupee over a period in an orderly manner. Subject to this predominant objective, the RBI’s
intervention in the foreign exchange market has been driven by the objectives of reducing excess volatility,
maintaining adequate level of reserves, and developing an orderly foreign exchange market.
The surge in the supply of foreign currency in the domestic market led inevitably to a rise in the price of
the rupee. The rupee gradually appreciated from Rs. 46.54 per US dollar in August 2006 to Rs.39.37 in
January 2008, a movement that had begun to affect profitability and competitiveness of the export sector.
The global financial crisis however reversed the rupee appreciation and after the end of positive shock
around January 2008, rupee began a slow decline.
A major factor, which affected the emerging economies almost simultaneously, was the unwinding of stock
positions by the FIIs to replenish cash balances abroad. The decline in rupee became more pronounced
after the fall of Lehman Brothers in September 2008, requiring RBI intervention to reduce volatility. It is
pertinent to note that a substantial part of the movement in the rupee-US dollar rate during this period has
been a reflection of the movement of the dollar against a basket of currencies. The rupee stabilized after
October 2008, with some volatility. With signs of recovery and return of foreign institutional investment
(FII) flows after March 2009, the rupee has again been strengthening against the US dollar. For the year as
a whole, the nominal value of the rupee declined from Rs. 40.36 per US dollar in March 2008 to Rs. 51.23
per US dollar in March 2009, reflecting 21 percent depreciation during the fiscal 2008/09. In fiscal
2009/10, however, with the signs of recovery and return of FII flows after March 2009, the rupee has been
strengthening against the US dollar. The movement of the exchange rate in the year 2009/10 indicated that
the average monthly exchange rate of the rupee against the US dollar appreciated by 9.9 percent from Rs
51.23 per US dollar in March 2009 to Rs 46.63 per US dollar in December 2009, mainly on account of
weakening of the US dollar in the international market.
Developments in the monetary policy arena:
The outflow of foreign exchange, as a fall out of the crisis, also meant tightening of liquidity situation in
the economy. To deal with the liquidity crunch and the virtual freezing of international credit, the monetary
stance underwent an abrupt change in the second half of 2008/09. The RBI responded to the emergent
situation by facilitating monetary expansion through decreases in the CRR, RR and R-RR rates, and the
statutory liquidity ratio (SLR).
The RR was reduced by 400 basis points in five tranches from 9.0 in August 2008 to 5.0 percent beginning
March 5, 2009. The R-RR was lowered by 250 basis points in three tranches from 6.0 (as was prevalent in
November 2008) to 3.5 percent from March 5, 2009. The R-RR and RRs were again reduced by 25 basis
points each with effect from April, 2009. SLR was lowered by 100 basis points from 25 percent of net
demand and time liabilities (NDTL) to 24 percent with effect from the fortnight beginning November 2008.

9
The CRR was lowered by 400 basis points in four tranches from 9.0 to 5.0 percent with effect from January
2009.
The credit policy measures by the RBI broadly aimed at providing adequate liquidity to compensate for the
squeeze emanating from foreign financial markets and improving foreign exchange liquidity. At the same
time, it was necessary to ensure that the financial contagion arising from the global financial crisis did not
permeate the Indian banking system. These measures were therefore supplemented by sector- specific
credit measures for exports, housing, micro and small enterprises and infrastructure. The monetary
measures had a salutatory effect on the liquidity situation. The weighted average call money market rate,
which had crossed the LAF corridor at several instances during the first half of 2008-09, remained within
the LAF corridor after October 2008. Since mid-2008-09, the growth in reserve money decelerated after
September 2008. The deceleration in M0 was largely on account of the decline in net foreign exchange
assets of RBI (a major determinant of reserve money growth) due to reduced capital inflows. On the other
hand, the net domestic credit of the RBI expanded due to an increase in net RBI credit to the Central
Government in the second half of the year. Taking the year as whole, broad money (M3) recorded an
increase of 18.4 percent during 2008-09, as against 21.2 percent in 2007-08. The money multiplier, which
is the ratio of M3 to M0 was 4.3 in end-March 2008 and increased to 5.0 in December 2008.
The credit situation seems to be recovering. The credit off-take in the economy that collapsed due to the
financial crisis reached its lowest level during the month of December 2008 when the non-food credit
tanked to 0.7 percent on a seasonally adjusted m-o-m basis. But some signs of recovery can be seen in the
credit off take during June and July 2009 on the seasonally adjusted m-o-m basis when the non food credit
grew above 20 percent. However on a y-o-y basis, the non-food credit growth has come down to 17 percent
(2009) after the October freeze of the credit markets as compared to the 25 percent average growth seen in
the full year 2008.
In the first quarter review of monetary policy 2009-10, the RBI maintained a GDP growth forecast of 6
percent for 2009-10. It raised the WPI inflation forecast to 5 percent at the end of March 2010 from 4
percent it did in April 2009. The RBI kept all policy rates (repo rate, reverse repo rate and cash reserve
ratio) unchanged. The reason for a pause in monetary easing was that the central bank now considered
inflation to be a cause of worry.
In India, year-on-year change in wholesale price index is used as the measure of inflation. It has been
pointed out that month-on-month changes captures the recent trends whereas year-on-year changes capture
the cumulated changes over a longer period. But month-on-month changes suffer from seasonality and,
therefore, it is argued that a deseasonlized price series would better represent the recent inflation. The
wholesale price index has long been discarded by countries for measuring inflation. The Economic Survey
2008-09 notes that 157 countries out of 181 countries in the IMF statistics use consumer price index (CPI)
for tracking inflation. India does not have an aggregate CPI, but computes sectional CPIs for the four
different consumer categories (agricultural labor, rural labor, industrial worker and urban non-manual
employee).
The month-to-month annualized seasonally-adjusted CPI indicates that India had a double digit inflation
phase during February-September 2008 and inflation is remaining high at about 8 percent in recent months.
On a year-on-year basis, the CPI inflation remained at about 10 percent since August 2008. Another
consideration for monetary policy is the level of real interest rate. If the real interest rate is high then there
10
is a case for lowering policy rates by the central bank. The average prime lending rate (PLR) of banks
adjusted for year-on-year CPI inflation is a good measure of the emerging real interest rate in the economy.
Real interest rate has fallen from above 7.5 percent in December 2007 to 2-3 percent in recent months.
The WPI inflation which is the headline inflation for India has plummeted to the negative territory on the
basis of year-on-year (y-o-y) growth as of July 2009 (-1.6%). However, this negative rate is a high base
effect phenomenon mainly concentrated in items like iron & steel and fuel group which due to the upward
commodity price shock last year have been registering negative double digit growth this year. In the WPI
basket during April-July 2009, iron & steel prices contracted by 20 percent whereas the fuel group shrank
by 10 percent thus pushing the aggregate WPI inflation in the negative territory.
However, prices have been rising for items like fruits & vegetables (15.2%, July 2009) with prices of
primary articles in general growing around 5 percent (July 2009). The inflationary scenario becomes much
clearer once we take seasonally adjusted month on month WPI inflation rates. The seasonally adjusted
month on month WPI inflation had seen a sudden spurt in the month of July 2009 to 8.3 percent. This
compares with the CPI (IW) situation where m-o-m seasonally adjusted rate was around 11.4 percent (June
2009) and the y-o-y rate is also hovering around 9.3 percent.
High food inflation has been the main factor driving the overall inflation rate. Food constraint has not only
driven up prices, but also threatens to limit India’s overall growth potential. In the 2010/11 budget
presented to the parliament on February 26, the finance minister acknowledged this challenge and outlined
a four-pronged strategy to boost agricultural growth. However, most of the measures announced in the
budget are likely to help only in the medium to long run. Here are some of the measures announced:
Credit support to farmers: Banks have been consistently meeting the targets set for agriculture credit
flow in the past few years. For the year 2010-11, the target has been set at Rs.375, 000 crore (US$ 81
billion).
Rs. 200 crore (US$ 43 million) provided for sustaining the gains already made in the green revolution
areas through conservation farming, which involves concurrent attention to soil health, water
conservation and preservation of biodiversity.
Concessional customs duty of 5 percent to specified agricultural machinery not manufactured in India.
Government to address the issue of opening up of retail trade. It will help in bringing down the
considerable difference between farm gate, wholesale and retail prices.
In addition to the ten mega food park projects already being set up, the Government has decided to set
up five more such parks.
Besides, the measures announced do not make for an agricultural reforms agenda that tackle the problems
caused by government control over inputs, production and marketing – an agenda that is critical to ease the
food constraint. There is also little in the budget to indicate an effective short-term food inflation
management strategy. Reforms are needed in the agriculture sector to address structural constraints
inhibiting productivity and income gains. However, in the immediate future food prices can be controlled
only through large imports, especially in the case of rice where stocks are inadequate.
11
Economic Recovery:
From all accounts, except for the agricultural sector initially as noted above, economic recovery seems to
be well underway. Economic growth stood at 8.6 percent during fiscal year 2010-11 per the advance
estimates of CSO released on February 7, 2011. GDP growth for 2009-10 per quick estimates of January
31, 2011 was placed at 8 percent. The recovery in GDP growth for 2009-10, as indicated in the estimates,
was broad based. Seven out of eight sectors/sub-sectors show a growth rate of 6.5 percent or higher. The
exception, as anticipated, is agriculture and allied sectors where the growth rate needs to higher and
sustainable over time. Sectors including mining and quarrying; manufacturing; and electricity, gas and
water supply have significantly improved their growth rates at over 8 percent in comparison with 2008-09.
When compared to countries across the world, India stands out as one of the best performing economies.
Although there was a clear moderation in growth from 9 percent levels to 7+ percent soon after the crisis
hit, in 2010-11, at 8.6 percent, GDP growth in nearing the pre-crisis levels and this pace makes India the
fastest growing major economy after China.
In order for India’s growth to be much more inclusive than what it has been, much higher level of public
spending is needed in sectors, such as health and education along with the implementation of sectoral
reforms so as to ensure timely and efficient service delivery. Plan allocations for 2010-11 for the social
sectors have been stepped up, as can be seen from the figures below, this process however needs to be
strengthened and sustained over time.
Inclusive Development
The spending on social sector has been increased to Rs.137,674 crore (US$ 30 billion) in 2010-11,
which is 37 percent of the total plan outlay in 2010-11.
Another 25 percent of the plan allocations are devoted to the development of rural infrastructure.
Education
Plan allocation for school education increased by 16 percent from Rs.26,800 (US$ 6 billion) in 2009-10
to Rs.31,036 crore (US$ 7 billion) in 2010-11.
In addition, States will have access to Rs.3,675 crore (US$ 792 million) for elementary education under
the Thirteenth Finance Commission grants for 2010-11.
Health
Plan allocation to Ministry of Health & Family Welfare increased from Rs 19,534 crore (US$ 4 billion)
in 2009-10 to Rs 22,300 crore (US$ 5 billion) for 2010-11.
As expected, the measures undertaken by government of India to counter the effects of the global
meltdown on the Indian economy have resulted in shortfall in revenues and substantial increases in
government expenditures, leading to deviation from the fiscal consolidation path mandated under the Fiscal
Responsibility and Budget Management (FRBM) Act.
The gross tax to GDP ratio which increased to an all time high of 12 percent in 2007-08, thanks to the
economy riding on a high growth trajectory, has steadily declined to 10.9 percent in 2008-09 and 10.3 per
cent in 2009-10 due to moderation in growth and reduction in tax/duty rates. At the same time, total
expenditure as percentage of GDP has increased from 14.4 percent in 2007-08 to 15.9 percent in 2008-09
and 16.6 percent in 2009-10. The fiscal expansion in the last 2 years has resulted in higher fiscal deficit of
6 percent of GDP in 2008-09 and 6.7 percent in 2009-10. Moreover, the revenue deficit as percentage of

12
GDP has worsened to 4.5 percent and 5.3 percent in 2008-09 and 2009-10 respectively. The revenue deficit
and fiscal deficit in 2009-2010 are higher than the targets set under the FRBM Act and Rules. Of course,
the deviation from the mandate under FRBM Act and Rules was resorted to with the objective of keeping
the economy on a high growth trajectory amidst global slowdown by creating demand through increased
public expenditures in identified sectors.
While the intent of the government, it says is to bring the fiscal deficit under control with institutional
reform measures encompassing all aspects of fiscal management such as subsidies, taxes, disinvestment
and other expenditures as indicated in the Budget 2009-10, there is unfortunately no movement on any of
these fronts,
Considering the current inflationary strains, the as yet excessive pre-emption of the community’s savings
by the government, the potential for crowding out the requirements of the enterprise sector, and rising
interest payments on government debt, it is extremely essential to reduce the fiscal deficit, and more
aggressively, mainly by lowering the revenue deficit. Correction of these deficits would, inter alia, require
considerable refocusing and reduction of large hidden subsidies associated with under-pricing in crucial
areas, such as power, irrigation, and urban transport. Food and fertilizer subsidies are other major areas of
expenditure control. Be that as it may, the process of fiscal consolidation needs to be accelerated through
more qualitative adjustments to reduce government dissavings and ameliorate price pressures.
The step-up in India's growth rate over much of the last two decades was primarily due to the structural
changes in industrial, trade and financial areas, among others, over the 1990s as the reforms in these sectors
were wide and deep and hence contributed significantly to higher productivity of the economy. Indeed,
there is potential for still higher growth on a sustained basis of 9+ percent in the years ahead, but among
other things, this would require the following:
(I) Revival and a vigorous pursuit of economic reforms at the center and in the states;
(II) A major effort at raising the rate of domestic savings, especially by reducing government dissavings at
the central and state levels through cuts in, and refocusing of, explicit and implicit subsidies, stricter
control over non-developmental expenditures, improvements in the tax ratio through stronger tax
enforcement, and strengthening incentives for savings;
(III) Larger investments in, and better performance of, infrastructural services, both in the public and
private sectors; and
(IV) Greater attention to, and larger resources for, agriculture, social sectors and rural development
programs to increase employment, reduce poverty and for creating a mass base in support of economic
reforms.
In conclusion, if India does attain and sustain growth rates of 9+ percent that it had achieved prior to the
crisis, this itself is likely to push up its domestic savings in the next few years. Besides, stronger growth
should attract more foreign savings, especially foreign direct investment, and thus raise the investment rate.

13
References
Government of India, Ministry of Finance ‘Economic Survey 2009-10’ New Delhi.
Government of India, Ministry of Finance ‘Union Budget for 2010-11’ New Delhi.
Reserve Bank of India (2009) ‘Macroeconomic and Monetary Developments – First Quarter Review 2009-
10’, Mumbai, July 27, 2009.
Reserve Bank of India (2008) ‘Macroeconomic and Monetary Developments in 2008-09’, Mumbai, April
20, 2009.
Reserve Bank of India ‘Handbook of Monetary Statistics of India’, Mumbai
Reserve Bank of India (2008) ‘Handbook of Statistics on the Indian Economy’, Mumbai